Torrey, UT Map & Demographics
Torrey Map
Torrey Overview
$30,417
PER CAPITA INCOME
$62,083
AVG FAMILY INCOME
$48,750
AVG HOUSEHOLD INCOME
0.35
INEQUALITY / GINI INDEX
219
TOTAL POPULATION
126
MALE POPULATION
93
FEMALE POPULATION
135.48
MALES / 100 FEMALES
73.81
FEMALES / 100 MALES
66.2
MEDIAN AGE
2.3
AVG FAMILY SIZE
2.0
AVG HOUSEHOLD SIZE
86
LABOR FORCE [ PEOPLE ]
41.3%
PERCENT IN LABOR FORCE
Torrey Zip Codes
Torrey Area Codes
Income in Torrey
Income Overview in Torrey
Per Capita Income in Torrey is $30,417, while median incomes of families and households are $62,083 and $48,750 respectively.
| Characteristic | Number | Measure |
| Per Capita Income | 219 | $30,417 |
| Median Family Income | 69 | $62,083 |
| Mean Family Income | 69 | $66,543 |
| Median Household Income | 108 | $48,750 |
| Mean Household Income | 108 | $60,703 |
| Income Deficit | 69 | $0 |
| Wage / Income Gap (%) | 219 | 0.00% |
| Wage / Income Gap ($) | 219 | 100.00¢ per $1 |
| Gini / Inequality Index | 219 | 0.35 |
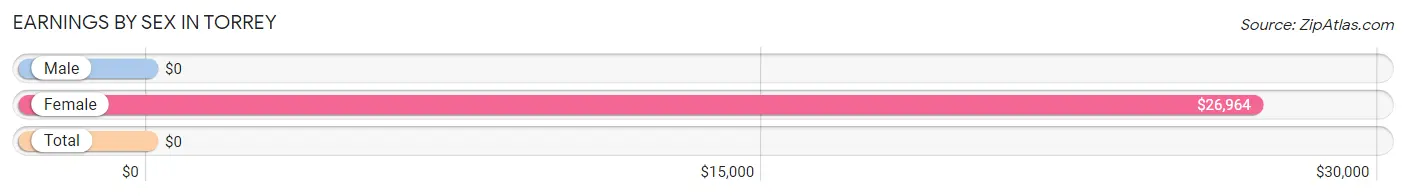
Earnings by Sex in Torrey
| Sex | Number | Average Earnings |
| Male | 42 (45.2%) | $0 |
| Female | 51 (54.8%) | $26,964 |
| Total | 93 (100.0%) | $0 |
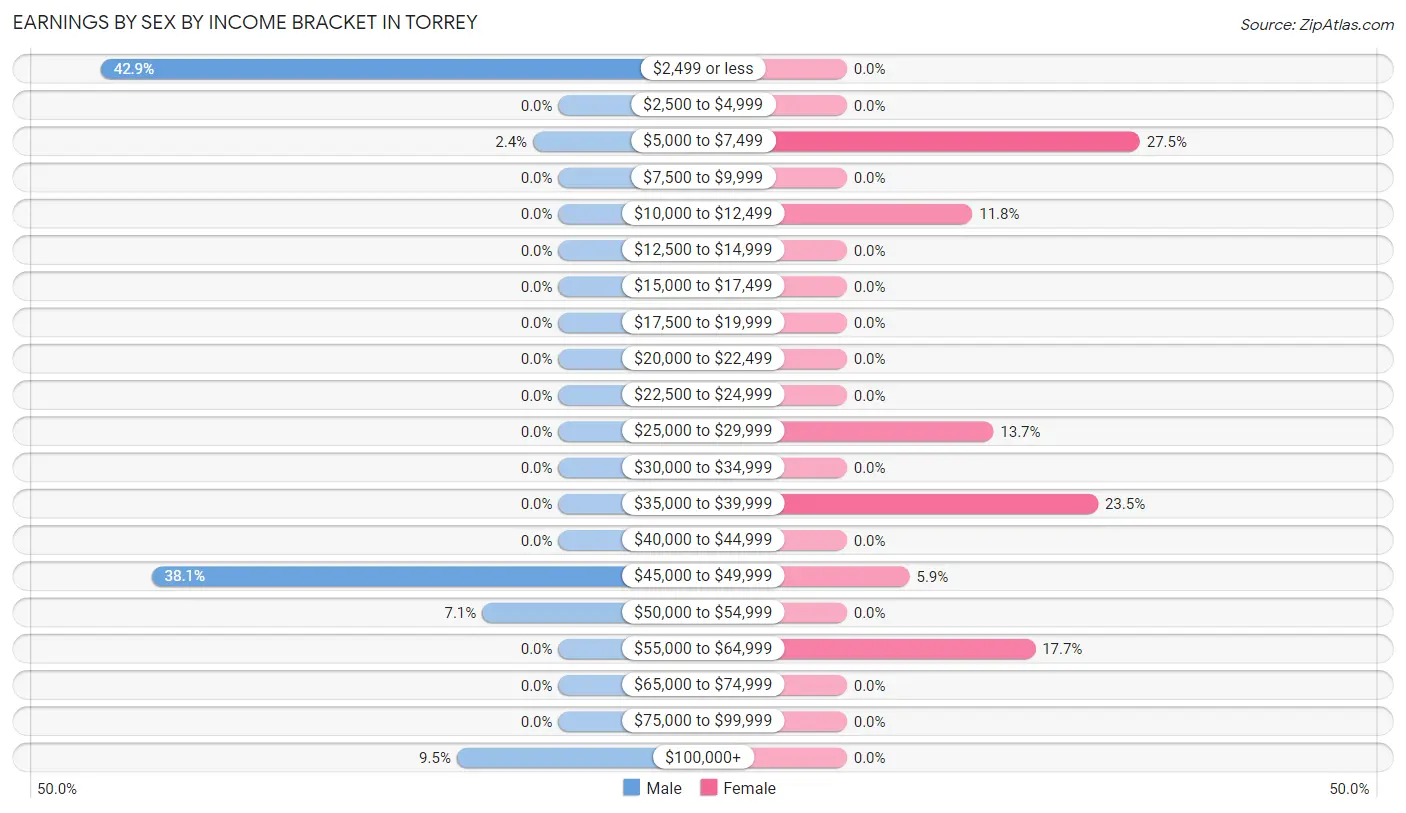
Earnings by Sex by Income Bracket in Torrey
The most common earnings brackets in Torrey are $2,499 or less for men (18 | 42.9%) and $5,000 to $7,499 for women (14 | 27.5%).
| Income | Male | Female |
| $2,499 or less | 18 (42.9%) | 0 (0.0%) |
| $2,500 to $4,999 | 0 (0.0%) | 0 (0.0%) |
| $5,000 to $7,499 | 1 (2.4%) | 14 (27.5%) |
| $7,500 to $9,999 | 0 (0.0%) | 0 (0.0%) |
| $10,000 to $12,499 | 0 (0.0%) | 6 (11.8%) |
| $12,500 to $14,999 | 0 (0.0%) | 0 (0.0%) |
| $15,000 to $17,499 | 0 (0.0%) | 0 (0.0%) |
| $17,500 to $19,999 | 0 (0.0%) | 0 (0.0%) |
| $20,000 to $22,499 | 0 (0.0%) | 0 (0.0%) |
| $22,500 to $24,999 | 0 (0.0%) | 0 (0.0%) |
| $25,000 to $29,999 | 0 (0.0%) | 7 (13.7%) |
| $30,000 to $34,999 | 0 (0.0%) | 0 (0.0%) |
| $35,000 to $39,999 | 0 (0.0%) | 12 (23.5%) |
| $40,000 to $44,999 | 0 (0.0%) | 0 (0.0%) |
| $45,000 to $49,999 | 16 (38.1%) | 3 (5.9%) |
| $50,000 to $54,999 | 3 (7.1%) | 0 (0.0%) |
| $55,000 to $64,999 | 0 (0.0%) | 9 (17.6%) |
| $65,000 to $74,999 | 0 (0.0%) | 0 (0.0%) |
| $75,000 to $99,999 | 0 (0.0%) | 0 (0.0%) |
| $100,000+ | 4 (9.5%) | 0 (0.0%) |
| Total | 42 (100.0%) | 51 (100.0%) |
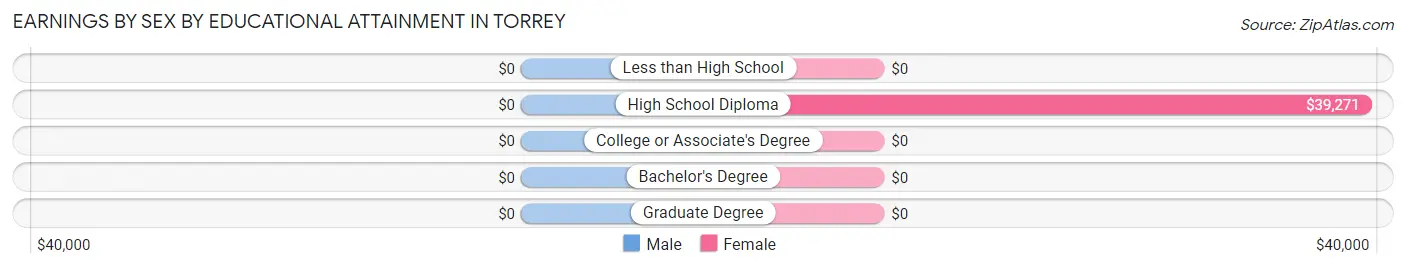
Earnings by Sex by Educational Attainment in Torrey
| Educational Attainment | Male Income | Female Income |
| Less than High School | - | - |
| High School Diploma | - | - |
| College or Associate's Degree | - | - |
| Bachelor's Degree | - | - |
| Graduate Degree | - | - |
| Total | - | - |
Family Income in Torrey
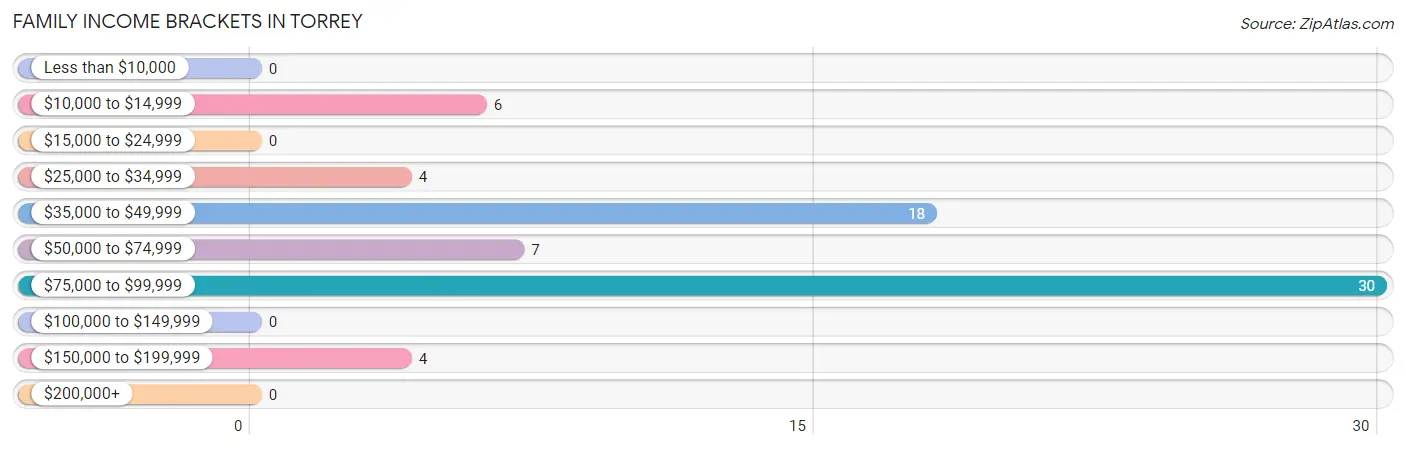
Family Income Brackets in Torrey
According to the Torrey family income data, there are 30 families falling into the $75,000 to $99,999 income range, which is the most common income bracket and makes up 43.5% of all families.
| Income Bracket | # Families | % Families |
| Less than $10,000 | 0 | 0.0% |
| $10,000 to $14,999 | 6 | 8.7% |
| $15,000 to $24,999 | 0 | 0.0% |
| $25,000 to $34,999 | 4 | 5.8% |
| $35,000 to $49,999 | 18 | 26.1% |
| $50,000 to $74,999 | 7 | 10.1% |
| $75,000 to $99,999 | 30 | 43.5% |
| $100,000 to $149,999 | 0 | 0.0% |
| $150,000 to $199,999 | 4 | 5.8% |
| $200,000+ | 0 | 0.0% |
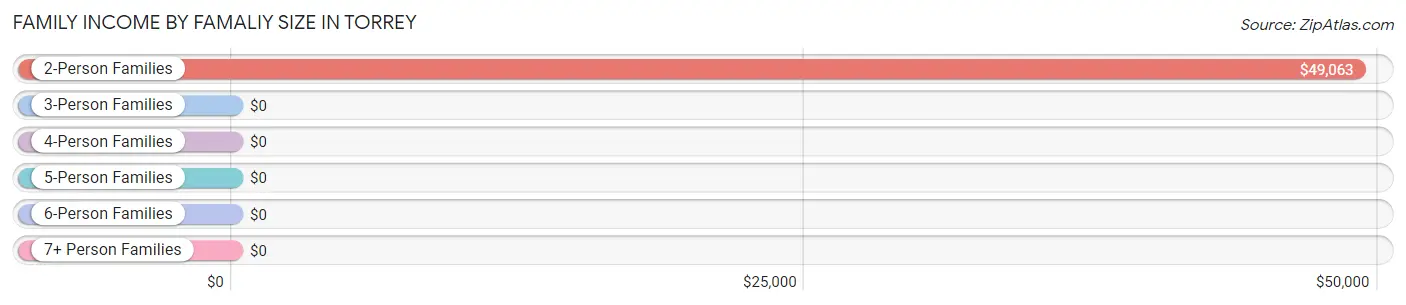
Family Income by Famaliy Size in Torrey
2-person families (53 | 76.8%) account for the highest median family income in Torrey with $49,063 per family, while 2-person families (53 | 76.8%) have the highest median income of $24,532 per family member.
| Income Bracket | # Families | Median Income |
| 2-Person Families | 53 (76.8%) | $49,063 |
| 3-Person Families | 16 (23.2%) | $0 |
| 4-Person Families | 0 (0.0%) | $0 |
| 5-Person Families | 0 (0.0%) | $0 |
| 6-Person Families | 0 (0.0%) | $0 |
| 7+ Person Families | 0 (0.0%) | $0 |
| Total | 69 (100.0%) | $62,083 |
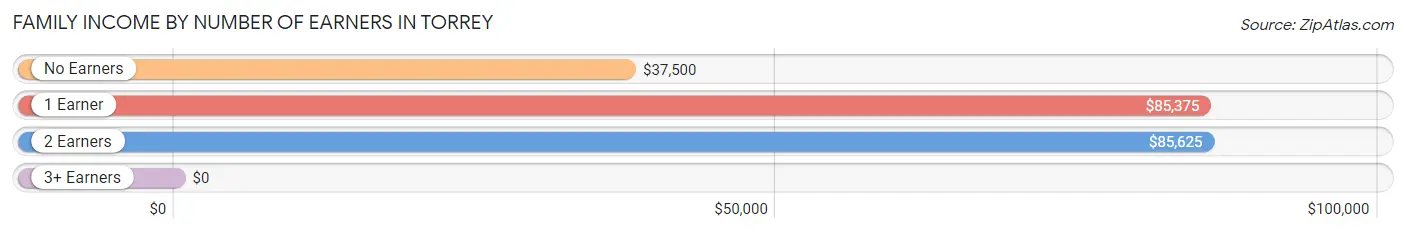
Family Income by Number of Earners in Torrey
| Number of Earners | # Families | Median Income |
| No Earners | 18 (26.1%) | $37,500 |
| 1 Earner | 25 (36.2%) | $85,375 |
| 2 Earners | 26 (37.7%) | $85,625 |
| 3+ Earners | 0 (0.0%) | $0 |
| Total | 69 (100.0%) | $62,083 |
Household Income in Torrey
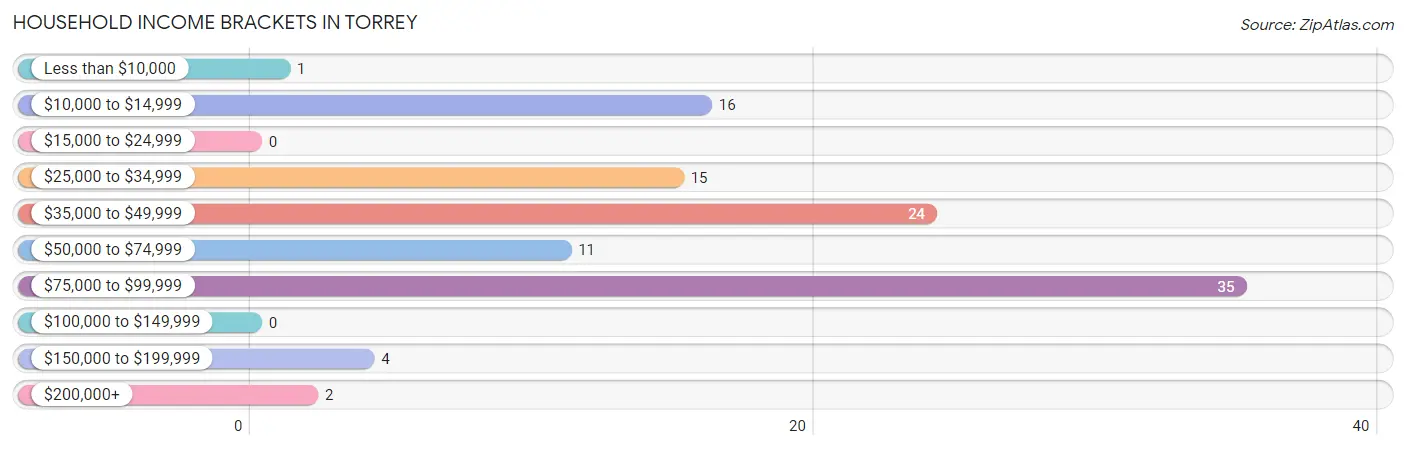
Household Income Brackets in Torrey
With 35 households falling in the category, the $75,000 to $99,999 income range is the most frequent in Torrey, accounting for 32.4% of all households.
| Income Bracket | # Households | % Households |
| Less than $10,000 | 1 | 0.9% |
| $10,000 to $14,999 | 16 | 14.8% |
| $15,000 to $24,999 | 0 | 0.0% |
| $25,000 to $34,999 | 15 | 13.9% |
| $35,000 to $49,999 | 24 | 22.2% |
| $50,000 to $74,999 | 11 | 10.2% |
| $75,000 to $99,999 | 35 | 32.4% |
| $100,000 to $149,999 | 0 | 0.0% |
| $150,000 to $199,999 | 4 | 3.7% |
| $200,000+ | 2 | 1.9% |
Household Income by Householder Age in Torrey
The median household income in Torrey is $48,750, with the highest median household income of $61,250 found in the 65+ years age bracket for the primary householder. A total of 61 households (56.5%) fall into this category.
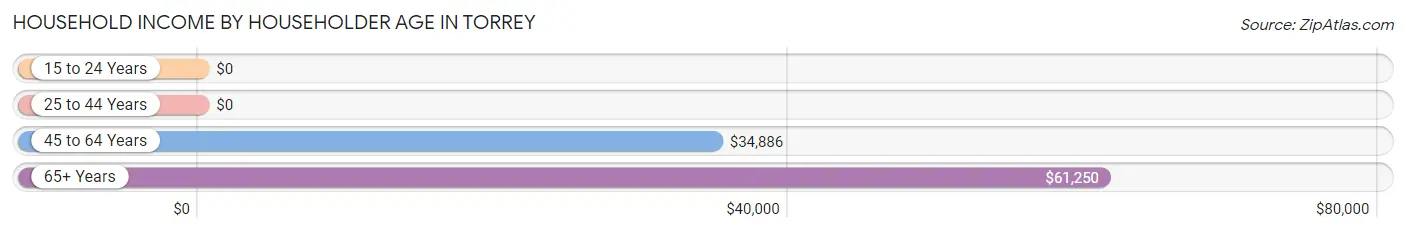
| Income Bracket | # Households | Median Income |
| 15 to 24 Years | 0 (0.0%) | $0 |
| 25 to 44 Years | 12 (11.1%) | $0 |
| 45 to 64 Years | 35 (32.4%) | $34,886 |
| 65+ Years | 61 (56.5%) | $61,250 |
| Total | 108 (100.0%) | $48,750 |
Poverty in Torrey
Income Below Poverty by Sex and Age in Torrey
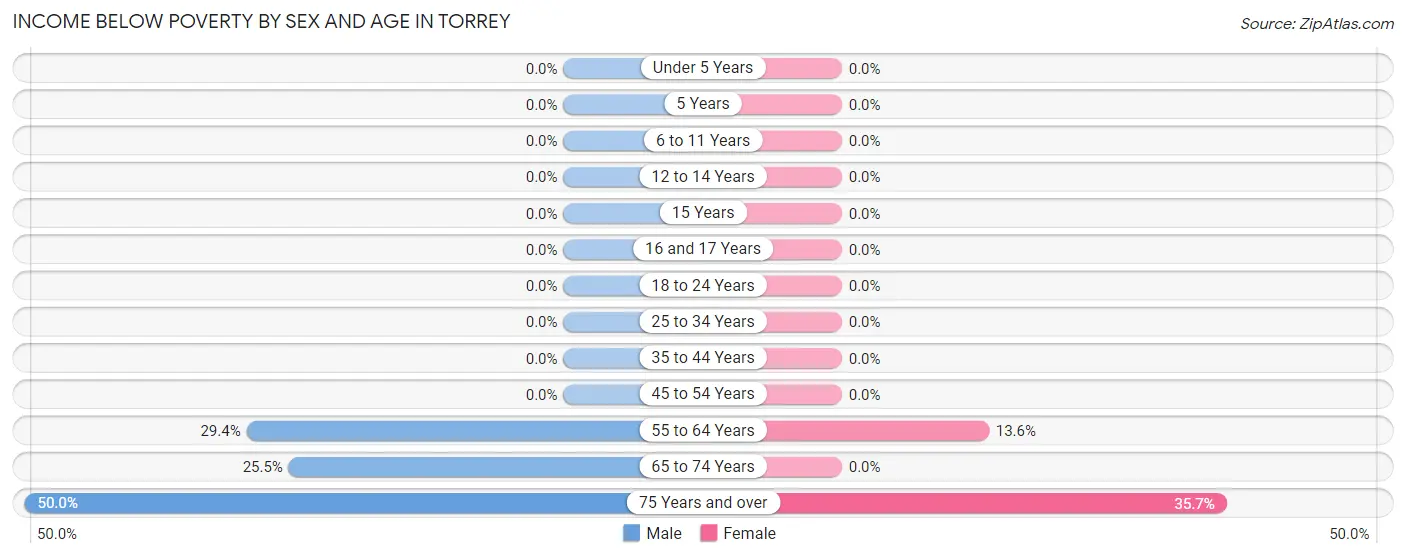
With 23.8% poverty level for males and 11.8% for females among the residents of Torrey, 75 year old and over males and 75 year old and over females are the most vulnerable to poverty, with 12 males (50.0%) and 5 females (35.7%) in their respective age groups living below the poverty level.
| Age Bracket | Male | Female |
| Under 5 Years | 0 (0.0%) | 0 (0.0%) |
| 5 Years | 0 (0.0%) | 0 (0.0%) |
| 6 to 11 Years | 0 (0.0%) | 0 (0.0%) |
| 12 to 14 Years | 0 (0.0%) | 0 (0.0%) |
| 15 Years | 0 (0.0%) | 0 (0.0%) |
| 16 and 17 Years | 0 (0.0%) | 0 (0.0%) |
| 18 to 24 Years | 0 (0.0%) | 0 (0.0%) |
| 25 to 34 Years | 0 (0.0%) | 0 (0.0%) |
| 35 to 44 Years | 0 (0.0%) | 0 (0.0%) |
| 45 to 54 Years | 0 (0.0%) | 0 (0.0%) |
| 55 to 64 Years | 5 (29.4%) | 6 (13.6%) |
| 65 to 74 Years | 13 (25.5%) | 0 (0.0%) |
| 75 Years and over | 12 (50.0%) | 5 (35.7%) |
| Total | 30 (23.8%) | 11 (11.8%) |
Income Above Poverty by Sex and Age in Torrey
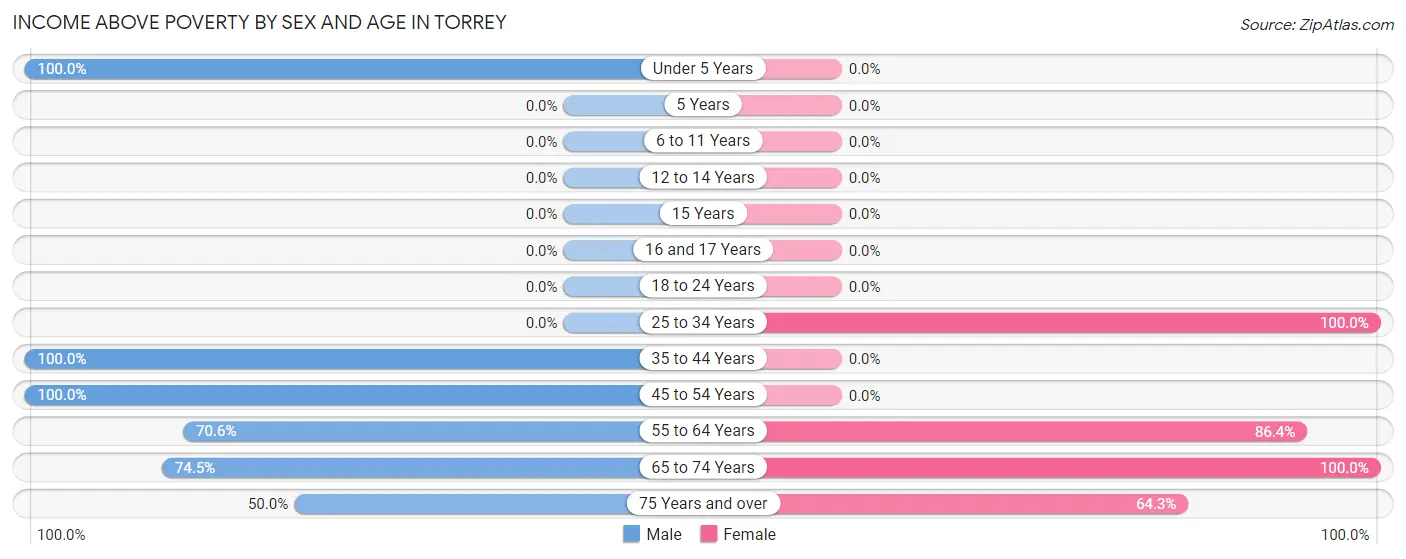
According to the poverty statistics in Torrey, males aged under 5 years and females aged 25 to 34 years are the age groups that are most secure financially, with 100.0% of males and 100.0% of females in these age groups living above the poverty line.
| Age Bracket | Male | Female |
| Under 5 Years | 11 (100.0%) | 0 (0.0%) |
| 5 Years | 0 (0.0%) | 0 (0.0%) |
| 6 to 11 Years | 0 (0.0%) | 0 (0.0%) |
| 12 to 14 Years | 0 (0.0%) | 0 (0.0%) |
| 15 Years | 0 (0.0%) | 0 (0.0%) |
| 16 and 17 Years | 0 (0.0%) | 0 (0.0%) |
| 18 to 24 Years | 0 (0.0%) | 0 (0.0%) |
| 25 to 34 Years | 0 (0.0%) | 12 (100.0%) |
| 35 to 44 Years | 20 (100.0%) | 0 (0.0%) |
| 45 to 54 Years | 3 (100.0%) | 0 (0.0%) |
| 55 to 64 Years | 12 (70.6%) | 38 (86.4%) |
| 65 to 74 Years | 38 (74.5%) | 23 (100.0%) |
| 75 Years and over | 12 (50.0%) | 9 (64.3%) |
| Total | 96 (76.2%) | 82 (88.2%) |
Income Below Poverty Among Married-Couple Families in Torrey
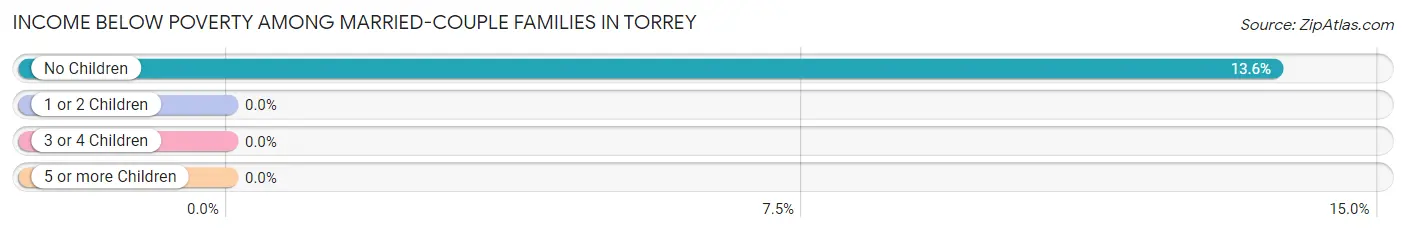
The poverty statistics for married-couple families in Torrey show that 10.7% or 6 of the total 56 families live below the poverty line. Families with no children have the highest poverty rate of 13.6%, comprising of 6 families. On the other hand, families with 1 or 2 children have the lowest poverty rate of 0.0%, which includes 0 families.
| Children | Above Poverty | Below Poverty |
| No Children | 38 (86.4%) | 6 (13.6%) |
| 1 or 2 Children | 12 (100.0%) | 0 (0.0%) |
| 3 or 4 Children | 0 (0.0%) | 0 (0.0%) |
| 5 or more Children | 0 (0.0%) | 0 (0.0%) |
| Total | 50 (89.3%) | 6 (10.7%) |
Income Below Poverty Among Single-Parent Households in Torrey
| Children | Single Father | Single Mother |
| No Children | 0 (0.0%) | 0 (0.0%) |
| 1 or 2 Children | 0 (0.0%) | 0 (0.0%) |
| 3 or 4 Children | 0 (0.0%) | 0 (0.0%) |
| 5 or more Children | 0 (0.0%) | 0 (0.0%) |
| Total | 0 (0.0%) | 0 (0.0%) |
Income Below Poverty Among Married-Couple vs Single-Parent Households in Torrey
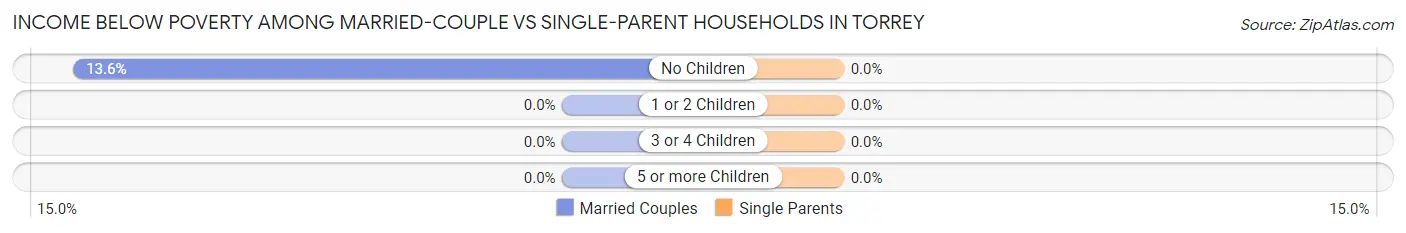
| Children | Married-Couple Families | Single-Parent Households |
| No Children | 6 (13.6%) | 0 (0.0%) |
| 1 or 2 Children | 0 (0.0%) | 0 (0.0%) |
| 3 or 4 Children | 0 (0.0%) | 0 (0.0%) |
| 5 or more Children | 0 (0.0%) | 0 (0.0%) |
| Total | 6 (10.7%) | 0 (0.0%) |
Race in Torrey
The most populous races in Torrey are White / Caucasian (219 | 100.0%), and Hispanic or Latino (36 | 16.4%).
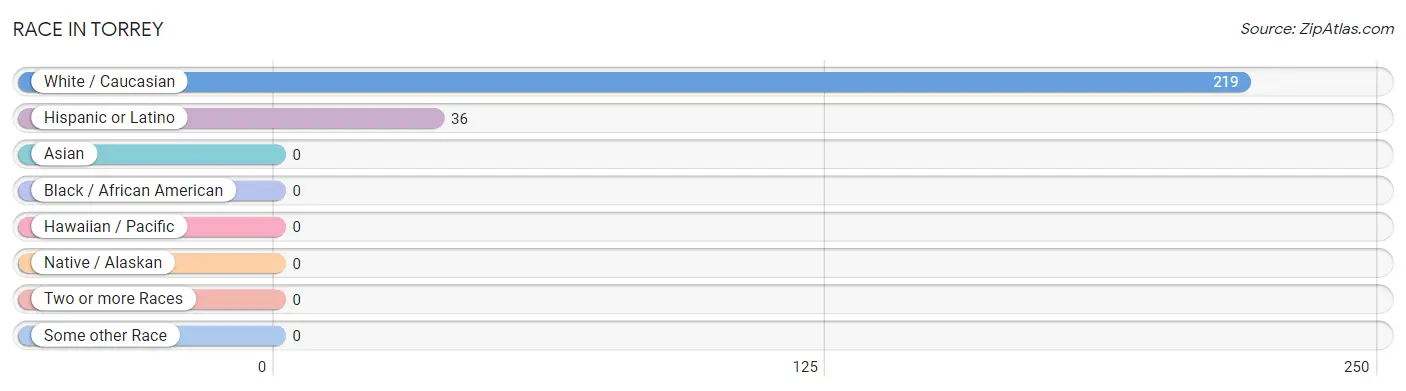
| Race | # Population | % Population |
| Asian | 0 | 0.0% |
| Black / African American | 0 | 0.0% |
| Hawaiian / Pacific | 0 | 0.0% |
| Hispanic or Latino | 36 | 16.4% |
| Native / Alaskan | 0 | 0.0% |
| White / Caucasian | 219 | 100.0% |
| Two or more Races | 0 | 0.0% |
| Some other Race | 0 | 0.0% |
| Total | 219 | 100.0% |
Ancestry in Torrey
The most populous ancestries reported in Torrey are English (85 | 38.8%), German (50 | 22.8%), Scottish (24 | 11.0%), Mexican (13 | 5.9%), and Swedish (12 | 5.5%), together accounting for 84.0% of all Torrey residents.
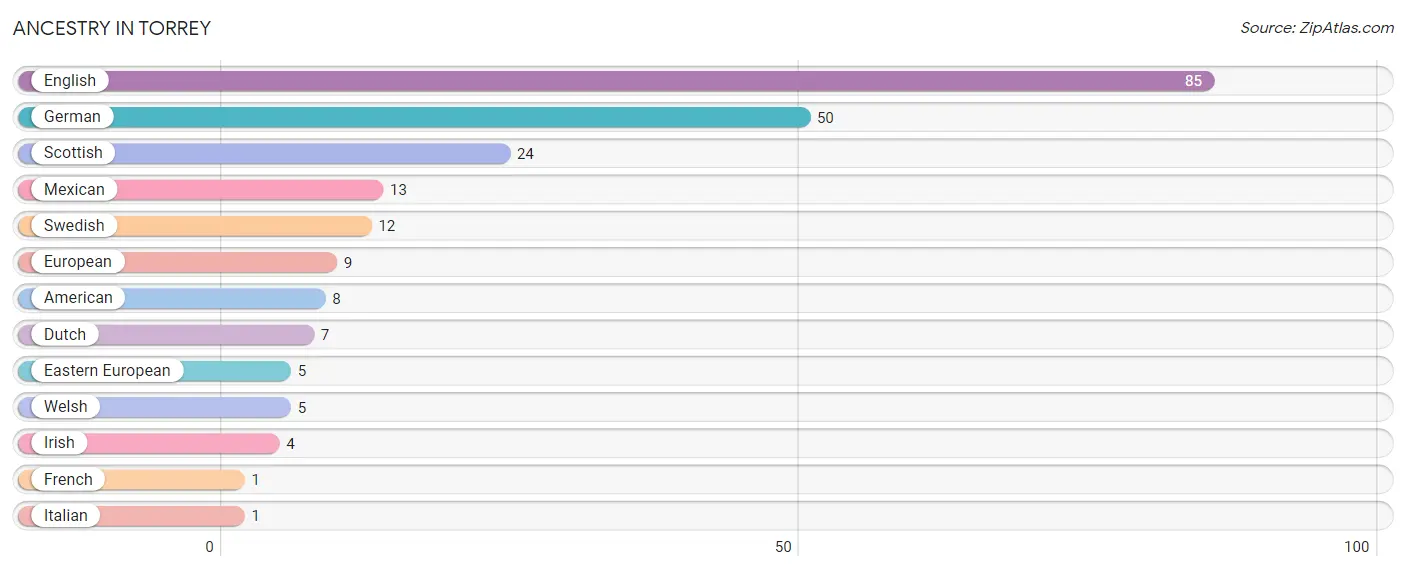
| Ancestry | # Population | % Population |
| American | 8 | 3.6% |
| Dutch | 7 | 3.2% |
| Eastern European | 5 | 2.3% |
| English | 85 | 38.8% |
| European | 9 | 4.1% |
| French | 1 | 0.5% |
| German | 50 | 22.8% |
| Irish | 4 | 1.8% |
| Italian | 1 | 0.5% |
| Mexican | 13 | 5.9% |
| Scottish | 24 | 11.0% |
| Swedish | 12 | 5.5% |
| Welsh | 5 | 2.3% | View All 13 Rows |
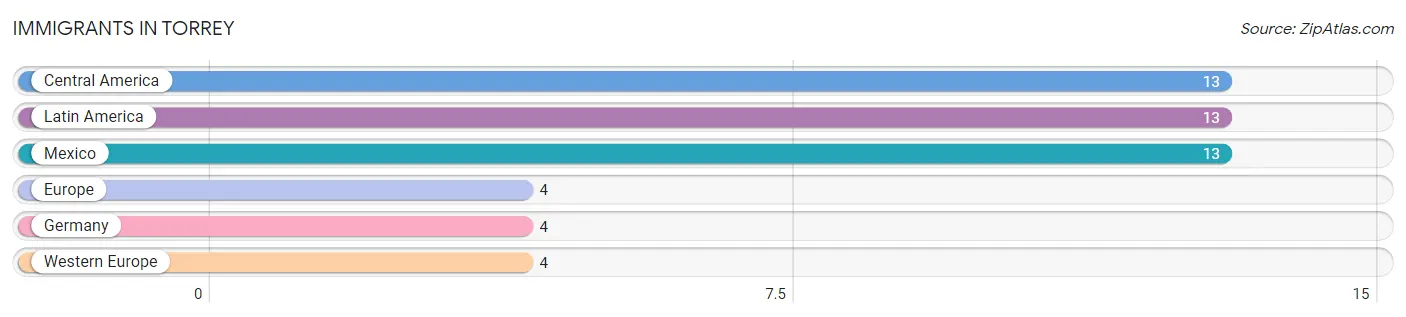
Immigrants in Torrey
The most numerous immigrant groups reported in Torrey came from Central America (13 | 5.9%), Latin America (13 | 5.9%), Mexico (13 | 5.9%), Europe (4 | 1.8%), and Germany (4 | 1.8%), together accounting for 21.5% of all Torrey residents.
| Immigration Origin | # Population | % Population |
| Central America | 13 | 5.9% |
| Europe | 4 | 1.8% |
| Germany | 4 | 1.8% |
| Latin America | 13 | 5.9% |
| Mexico | 13 | 5.9% |
| Western Europe | 4 | 1.8% | View All 6 Rows |
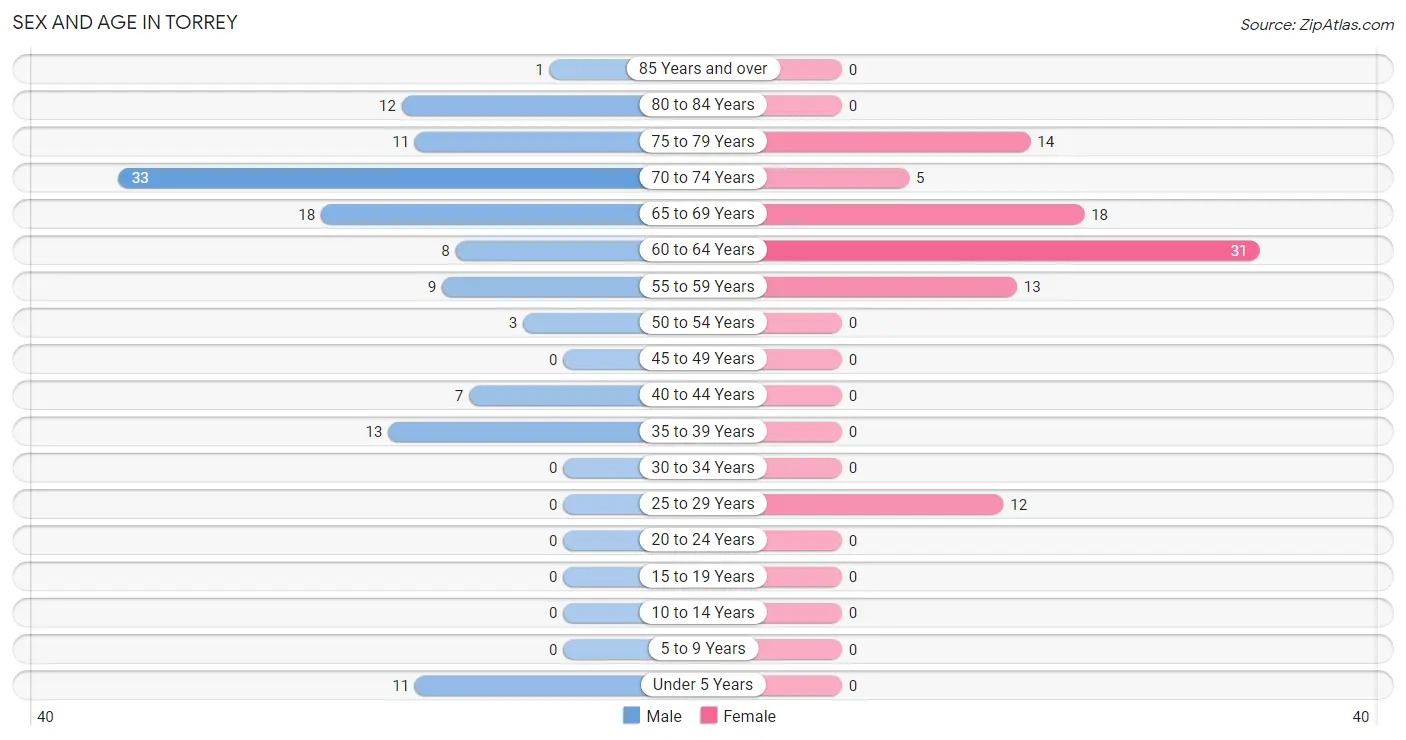
Sex and Age in Torrey
Sex and Age in Torrey
The most populous age groups in Torrey are 70 to 74 Years (33 | 26.2%) for men and 60 to 64 Years (31 | 33.3%) for women.
| Age Bracket | Male | Female |
| Under 5 Years | 11 (8.7%) | 0 (0.0%) |
| 5 to 9 Years | 0 (0.0%) | 0 (0.0%) |
| 10 to 14 Years | 0 (0.0%) | 0 (0.0%) |
| 15 to 19 Years | 0 (0.0%) | 0 (0.0%) |
| 20 to 24 Years | 0 (0.0%) | 0 (0.0%) |
| 25 to 29 Years | 0 (0.0%) | 12 (12.9%) |
| 30 to 34 Years | 0 (0.0%) | 0 (0.0%) |
| 35 to 39 Years | 13 (10.3%) | 0 (0.0%) |
| 40 to 44 Years | 7 (5.6%) | 0 (0.0%) |
| 45 to 49 Years | 0 (0.0%) | 0 (0.0%) |
| 50 to 54 Years | 3 (2.4%) | 0 (0.0%) |
| 55 to 59 Years | 9 (7.1%) | 13 (14.0%) |
| 60 to 64 Years | 8 (6.4%) | 31 (33.3%) |
| 65 to 69 Years | 18 (14.3%) | 18 (19.4%) |
| 70 to 74 Years | 33 (26.2%) | 5 (5.4%) |
| 75 to 79 Years | 11 (8.7%) | 14 (15.0%) |
| 80 to 84 Years | 12 (9.5%) | 0 (0.0%) |
| 85 Years and over | 1 (0.8%) | 0 (0.0%) |
| Total | 126 (100.0%) | 93 (100.0%) |
Families and Households in Torrey
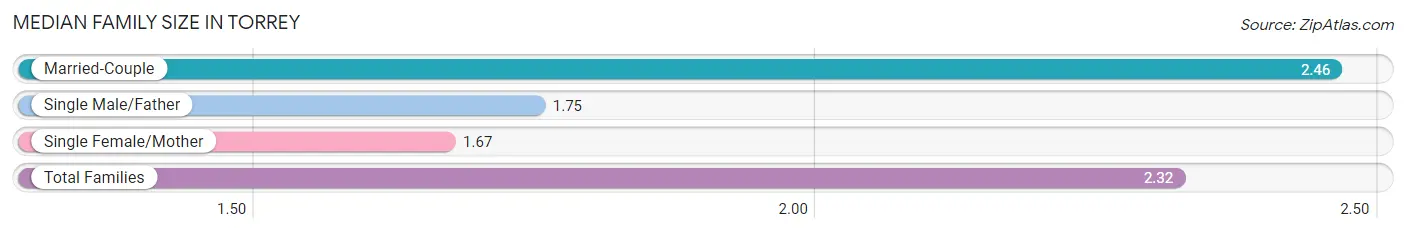
Median Family Size in Torrey
The median family size in Torrey is 2.32 persons per family, with married-couple families (56 | 81.2%) accounting for the largest median family size of 2.46 persons per family. On the other hand, single female/mother families (9 | 13.0%) represent the smallest median family size with 1.67 persons per family.
| Family Type | # Families | Family Size |
| Married-Couple | 56 (81.2%) | 2.46 |
| Single Male/Father | 4 (5.8%) | 1.75 |
| Single Female/Mother | 9 (13.0%) | 1.67 |
| Total Families | 69 (100.0%) | 2.32 |
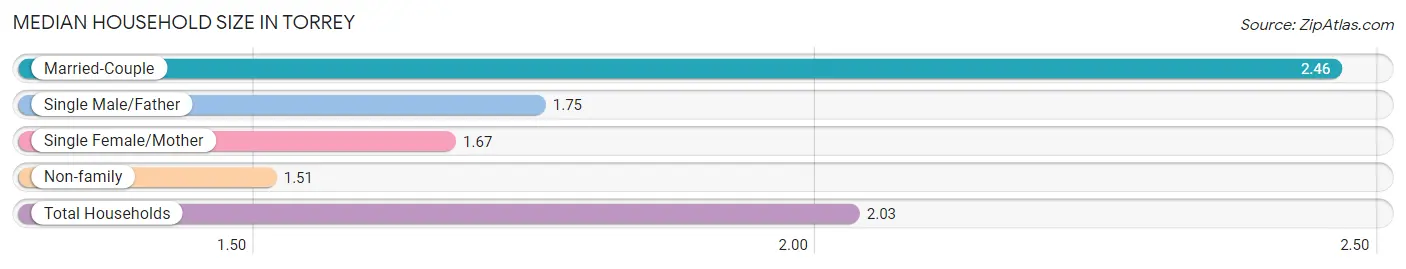
Median Household Size in Torrey
The median household size in Torrey is 2.03 persons per household, with married-couple households (56 | 51.8%) accounting for the largest median household size of 2.46 persons per household. non-family households (39 | 36.1%) represent the smallest median household size with 1.51 persons per household.
| Household Type | # Households | Household Size |
| Married-Couple | 56 (51.8%) | 2.46 |
| Single Male/Father | 4 (3.7%) | 1.75 |
| Single Female/Mother | 9 (8.3%) | 1.67 |
| Non-family | 39 (36.1%) | 1.51 |
| Total Households | 108 (100.0%) | 2.03 |
Household Size by Marriage Status in Torrey
Out of a total of 108 households in Torrey, 69 (63.9%) are family households, while 39 (36.1%) are nonfamily households. The most numerous type of family households are 2-person households, comprising 53, and the most common type of nonfamily households are 1-person households, comprising 23.
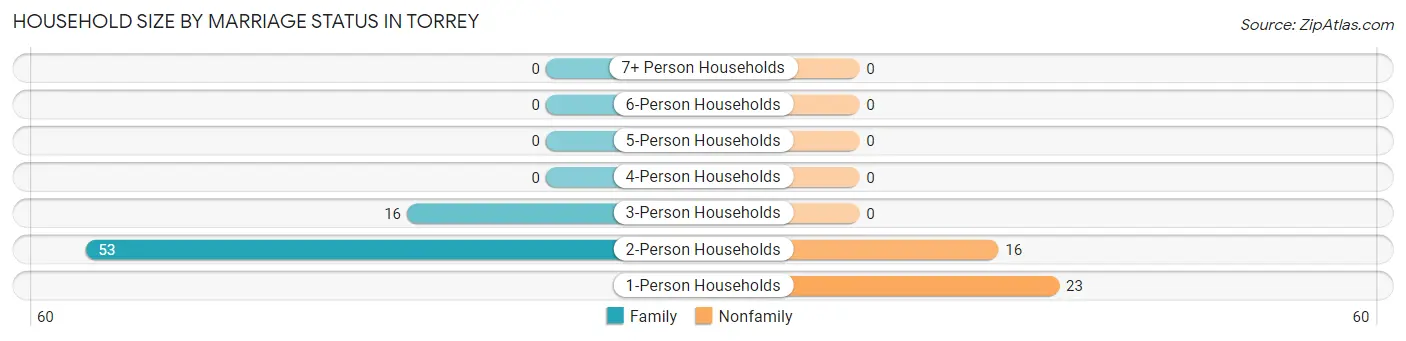
| Household Size | Family Households | Nonfamily Households |
| 1-Person Households | - | 23 (21.3%) |
| 2-Person Households | 53 (49.1%) | 16 (14.8%) |
| 3-Person Households | 16 (14.8%) | 0 (0.0%) |
| 4-Person Households | 0 (0.0%) | 0 (0.0%) |
| 5-Person Households | 0 (0.0%) | 0 (0.0%) |
| 6-Person Households | 0 (0.0%) | 0 (0.0%) |
| 7+ Person Households | 0 (0.0%) | 0 (0.0%) |
| Total | 69 (63.9%) | 39 (36.1%) |
Female Fertility in Torrey
Fertility by Age in Torrey
| Age Bracket | Women with Births | Births / 1,000 Women |
| 15 to 19 years | 0 (0.0%) | 0.0 |
| 20 to 34 years | 0 (0.0%) | 0.0 |
| 35 to 50 years | 0 (0.0%) | 0.0 |
| Total | 0 (0.0%) | 0.0 |
Fertility by Age by Marriage Status in Torrey
| Age Bracket | Married | Unmarried |
| 15 to 19 years | 0 (0.0%) | 0 (0.0%) |
| 20 to 34 years | 0 (0.0%) | 0 (0.0%) |
| 35 to 50 years | 0 (0.0%) | 0 (0.0%) |
| Total | 0 (0.0%) | 0 (0.0%) |
Fertility by Education in Torrey
| Educational Attainment | Women with Births | Births / 1,000 Women |
| Less than High School | 0 (0.0%) | 0.0 |
| High School Diploma | 0 (0.0%) | 0.0 |
| College or Associate's Degree | 0 (0.0%) | 0.0 |
| Bachelor's Degree | 0 (0.0%) | 0.0 |
| Graduate Degree | 0 (0.0%) | 0.0 |
| Total | 0 (0.0%) | 0.0 |
Fertility by Education by Marriage Status in Torrey
| Educational Attainment | Married | Unmarried |
| Less than High School | 0 (0.0%) | 0 (0.0%) |
| High School Diploma | 0 (0.0%) | 0 (0.0%) |
| College or Associate's Degree | 0 (0.0%) | 0 (0.0%) |
| Bachelor's Degree | 0 (0.0%) | 0 (0.0%) |
| Graduate Degree | 0 (0.0%) | 0 (0.0%) |
| Total | 0 (0.0%) | 0 (0.0%) |
Employment Characteristics in Torrey
Employment by Class of Employer in Torrey
Among the 86 employed individuals in Torrey, private company employees (39 | 45.4%), self-employed (not incorporated) (25 | 29.1%), and local government employees (12 | 14.0%) make up the most common classes of employment.
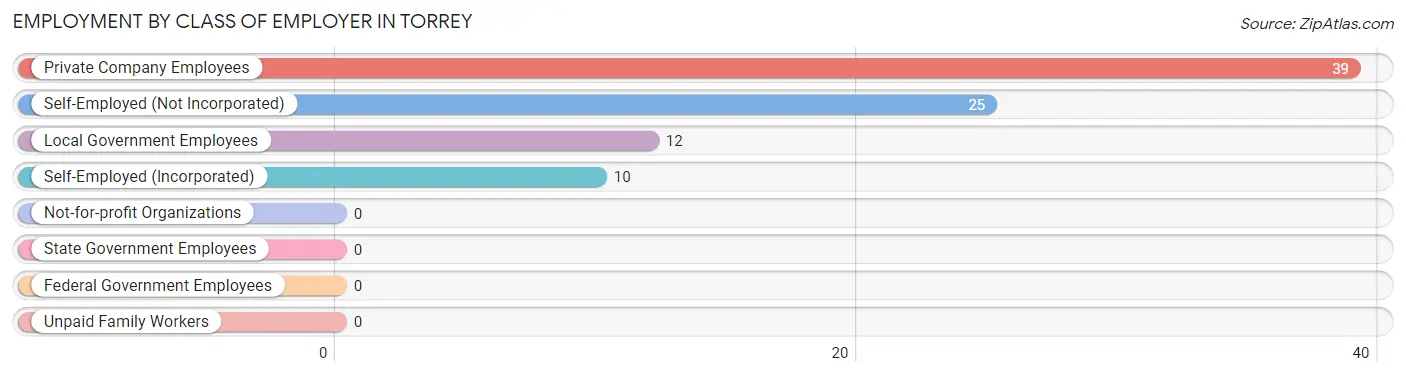
| Employer Class | # Employees | % Employees |
| Private Company Employees | 39 | 45.4% |
| Self-Employed (Incorporated) | 10 | 11.6% |
| Self-Employed (Not Incorporated) | 25 | 29.1% |
| Not-for-profit Organizations | 0 | 0.0% |
| Local Government Employees | 12 | 14.0% |
| State Government Employees | 0 | 0.0% |
| Federal Government Employees | 0 | 0.0% |
| Unpaid Family Workers | 0 | 0.0% |
| Total | 86 | 100.0% |
Employment Status by Age in Torrey
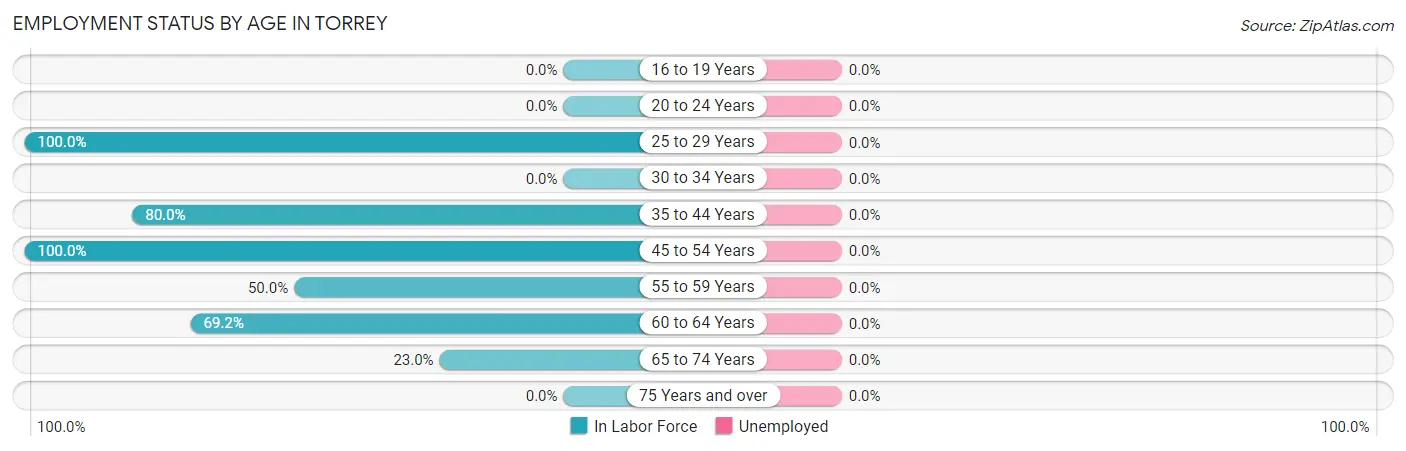
| Age Bracket | In Labor Force | Unemployed |
| 16 to 19 Years | 0 (0.0%) | 0 (0.0%) |
| 20 to 24 Years | 0 (0.0%) | 0 (0.0%) |
| 25 to 29 Years | 12 (100.0%) | 0 (0.0%) |
| 30 to 34 Years | 0 (0.0%) | 0 (0.0%) |
| 35 to 44 Years | 16 (80.0%) | 0 (0.0%) |
| 45 to 54 Years | 3 (100.0%) | 0 (0.0%) |
| 55 to 59 Years | 11 (50.0%) | 0 (0.0%) |
| 60 to 64 Years | 27 (69.2%) | 0 (0.0%) |
| 65 to 74 Years | 17 (23.0%) | 0 (0.0%) |
| 75 Years and over | 0 (0.0%) | 0 (0.0%) |
| Total | 86 (41.3%) | 0 (0.0%) |
Employment Status by Educational Attainment in Torrey
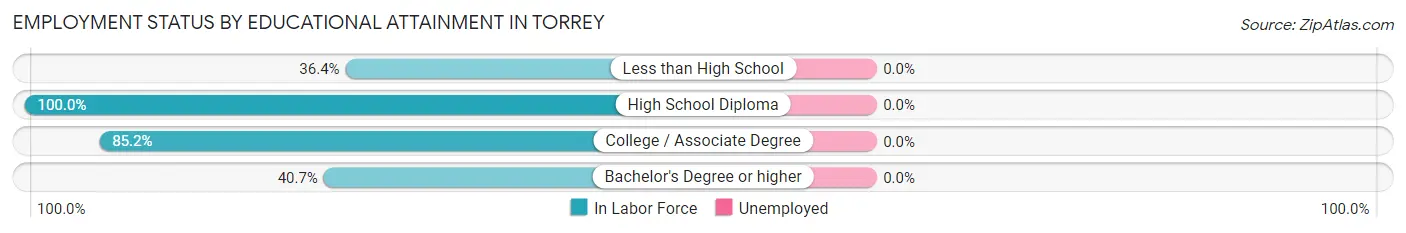
| Educational Attainment | In Labor Force | Unemployed |
| Less than High School | 4 (36.4%) | 0 (0.0%) |
| High School Diploma | 31 (100.0%) | 0 (0.0%) |
| College / Associate Degree | 23 (85.2%) | 0 (0.0%) |
| Bachelor's Degree or higher | 11 (40.7%) | 0 (0.0%) |
| Total | 69 (71.9%) | 0 (0.0%) |
Employment Occupations by Sex in Torrey
Management, Business, Science and Arts Occupations
The most common Management, Business, Science and Arts occupations in Torrey are Management (22 | 25.6%), Computers, Engineering & Science (11 | 12.8%), and Life, Physical & Social Science (11 | 12.8%).
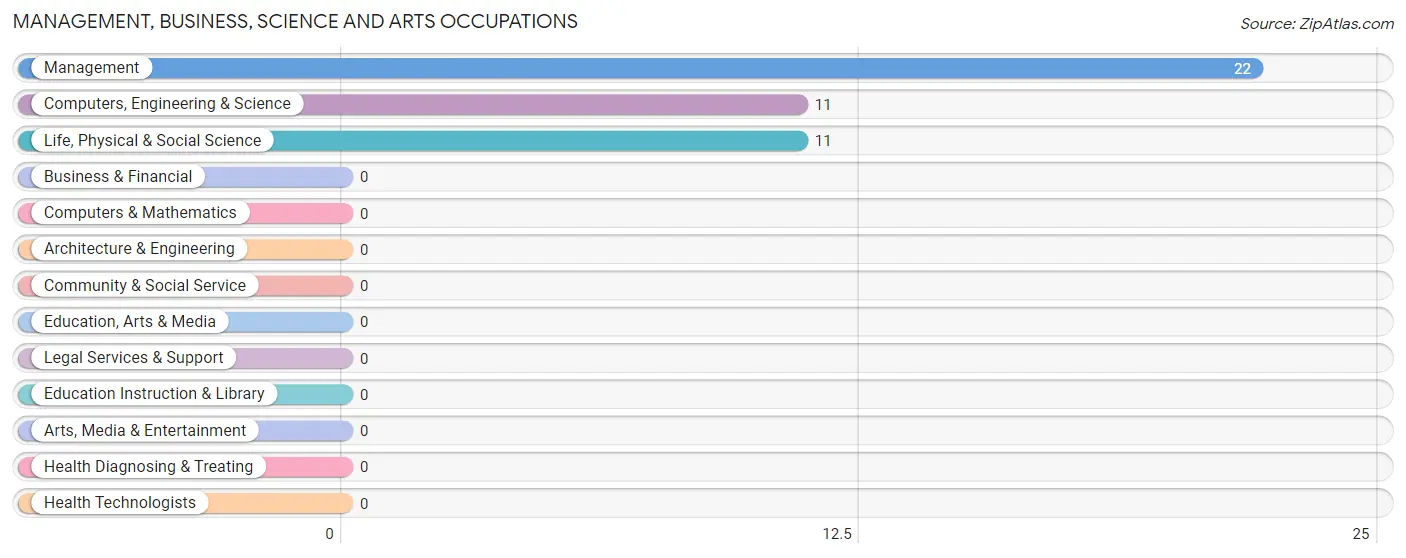
Management, Business, Science and Arts Occupations by Sex
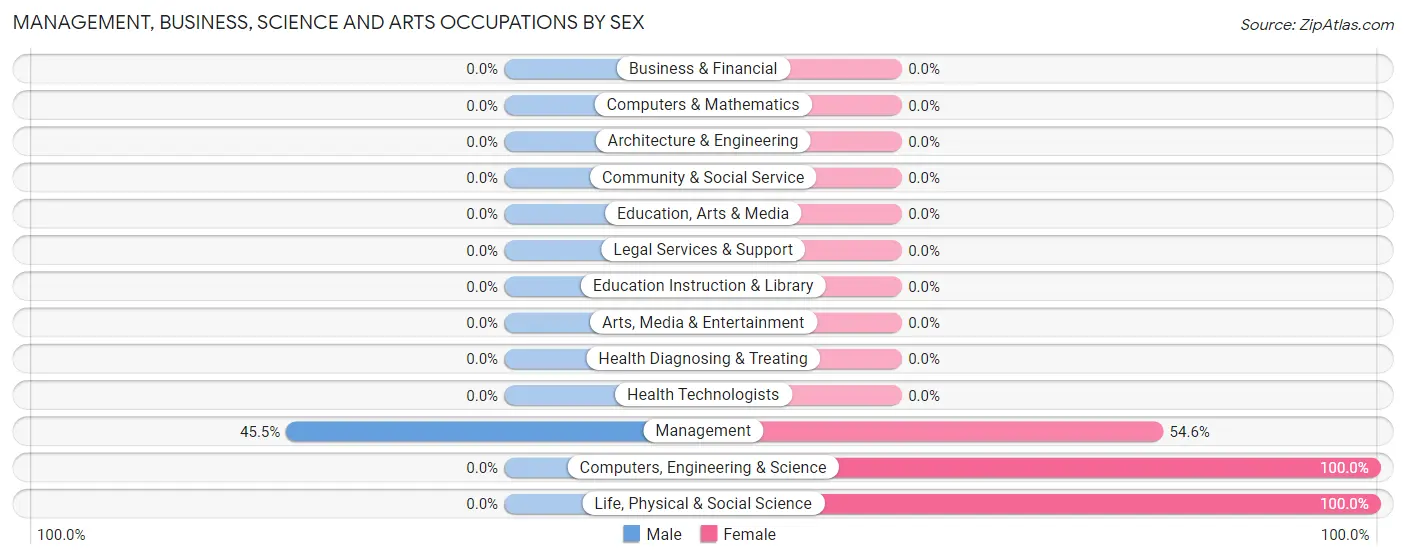
| Occupation | Male | Female |
| Management | 10 (45.5%) | 12 (54.5%) |
| Business & Financial | 0 (0.0%) | 0 (0.0%) |
| Computers, Engineering & Science | 0 (0.0%) | 11 (100.0%) |
| Computers & Mathematics | 0 (0.0%) | 0 (0.0%) |
| Architecture & Engineering | 0 (0.0%) | 0 (0.0%) |
| Life, Physical & Social Science | 0 (0.0%) | 11 (100.0%) |
| Community & Social Service | 0 (0.0%) | 0 (0.0%) |
| Education, Arts & Media | 0 (0.0%) | 0 (0.0%) |
| Legal Services & Support | 0 (0.0%) | 0 (0.0%) |
| Education Instruction & Library | 0 (0.0%) | 0 (0.0%) |
| Arts, Media & Entertainment | 0 (0.0%) | 0 (0.0%) |
| Health Diagnosing & Treating | 0 (0.0%) | 0 (0.0%) |
| Health Technologists | 0 (0.0%) | 0 (0.0%) |
| Total (Category) | 10 (30.3%) | 23 (69.7%) |
| Total (Overall) | 42 (48.8%) | 44 (51.2%) |
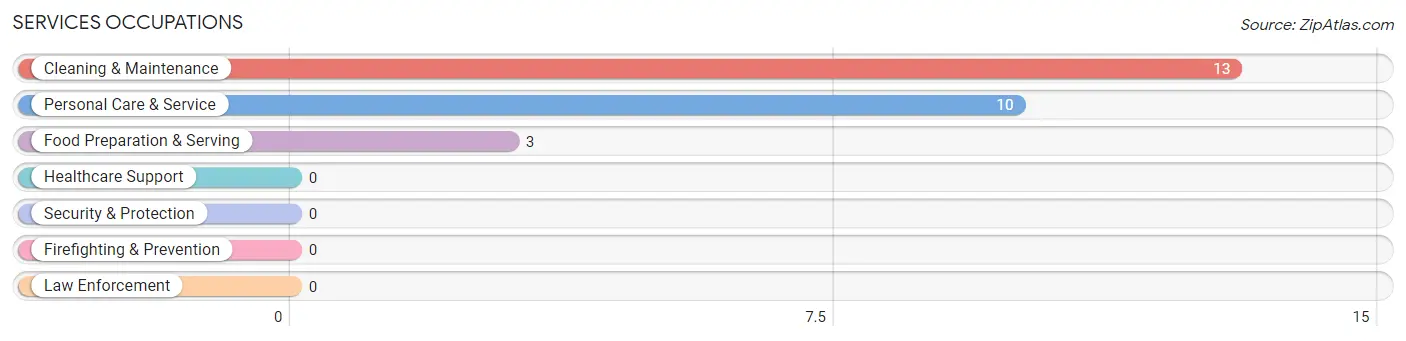
Services Occupations
The most common Services occupations in Torrey are Cleaning & Maintenance (13 | 15.1%), Personal Care & Service (10 | 11.6%), and Food Preparation & Serving (3 | 3.5%).
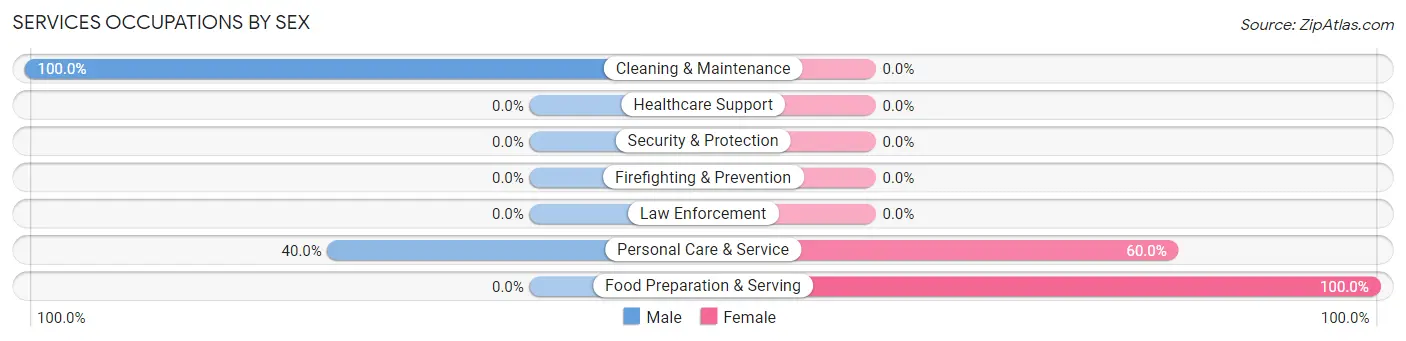
Services Occupations by Sex
Within the Services occupations in Torrey, the most male-oriented occupations are Cleaning & Maintenance (100.0%), and Personal Care & Service (40.0%), while the most female-oriented occupations are Food Preparation & Serving (100.0%), and Personal Care & Service (60.0%).
| Occupation | Male | Female |
| Healthcare Support | 0 (0.0%) | 0 (0.0%) |
| Security & Protection | 0 (0.0%) | 0 (0.0%) |
| Firefighting & Prevention | 0 (0.0%) | 0 (0.0%) |
| Law Enforcement | 0 (0.0%) | 0 (0.0%) |
| Food Preparation & Serving | 0 (0.0%) | 3 (100.0%) |
| Cleaning & Maintenance | 13 (100.0%) | 0 (0.0%) |
| Personal Care & Service | 4 (40.0%) | 6 (60.0%) |
| Total (Category) | 17 (65.4%) | 9 (34.6%) |
| Total (Overall) | 42 (48.8%) | 44 (51.2%) |
Sales and Office Occupations
Sales and Office Occupations by Sex
| Occupation | Male | Female |
| Sales & Related | 0 (0.0%) | 0 (0.0%) |
| Office & Administration | 0 (0.0%) | 0 (0.0%) |
| Total (Category) | 0 (0.0%) | 0 (0.0%) |
| Total (Overall) | 42 (48.8%) | 44 (51.2%) |
Natural Resources, Construction and Maintenance Occupations
The most common Natural Resources, Construction and Maintenance occupations in Torrey are , and Construction & Extraction (11 | 12.8%).
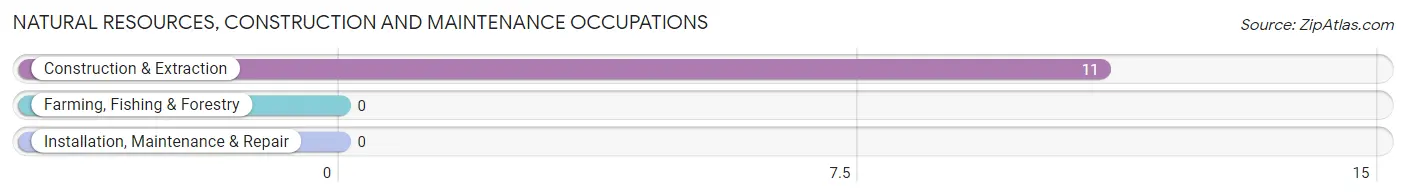
Natural Resources, Construction and Maintenance Occupations by Sex
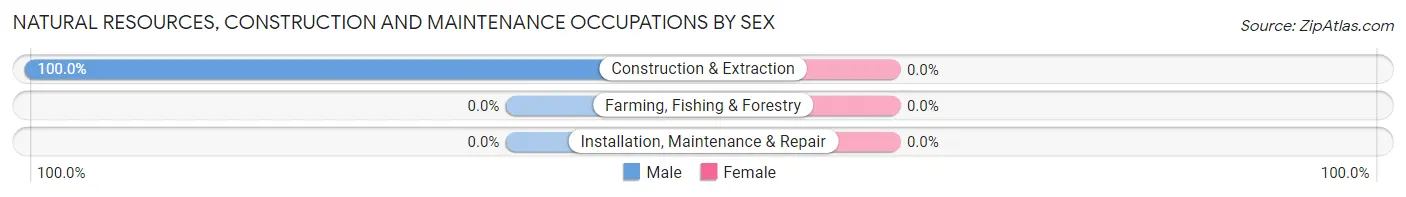
| Occupation | Male | Female |
| Farming, Fishing & Forestry | 0 (0.0%) | 0 (0.0%) |
| Construction & Extraction | 11 (100.0%) | 0 (0.0%) |
| Installation, Maintenance & Repair | 0 (0.0%) | 0 (0.0%) |
| Total (Category) | 11 (100.0%) | 0 (0.0%) |
| Total (Overall) | 42 (48.8%) | 44 (51.2%) |
Production, Transportation and Moving Occupations
The most common Production, Transportation and Moving occupations in Torrey are Production (12 | 14.0%), and Material Moving (4 | 4.6%).
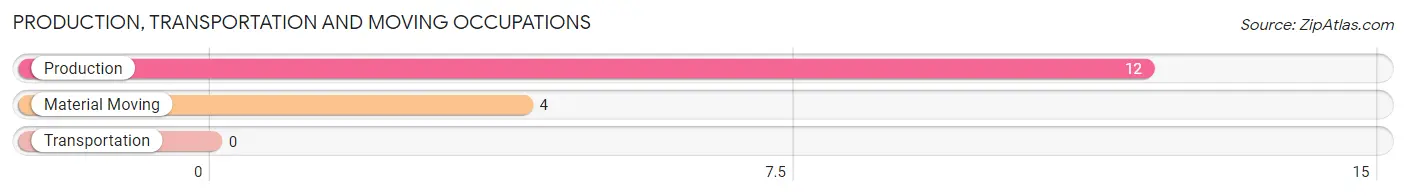
Production, Transportation and Moving Occupations by Sex
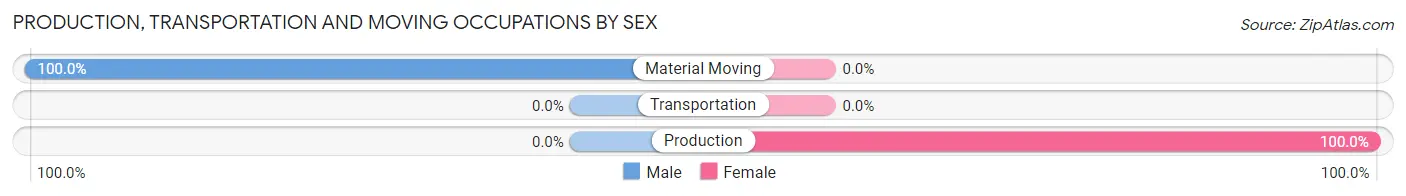
| Occupation | Male | Female |
| Production | 0 (0.0%) | 12 (100.0%) |
| Transportation | 0 (0.0%) | 0 (0.0%) |
| Material Moving | 4 (100.0%) | 0 (0.0%) |
| Total (Category) | 4 (25.0%) | 12 (75.0%) |
| Total (Overall) | 42 (48.8%) | 44 (51.2%) |
Employment Industries by Sex in Torrey
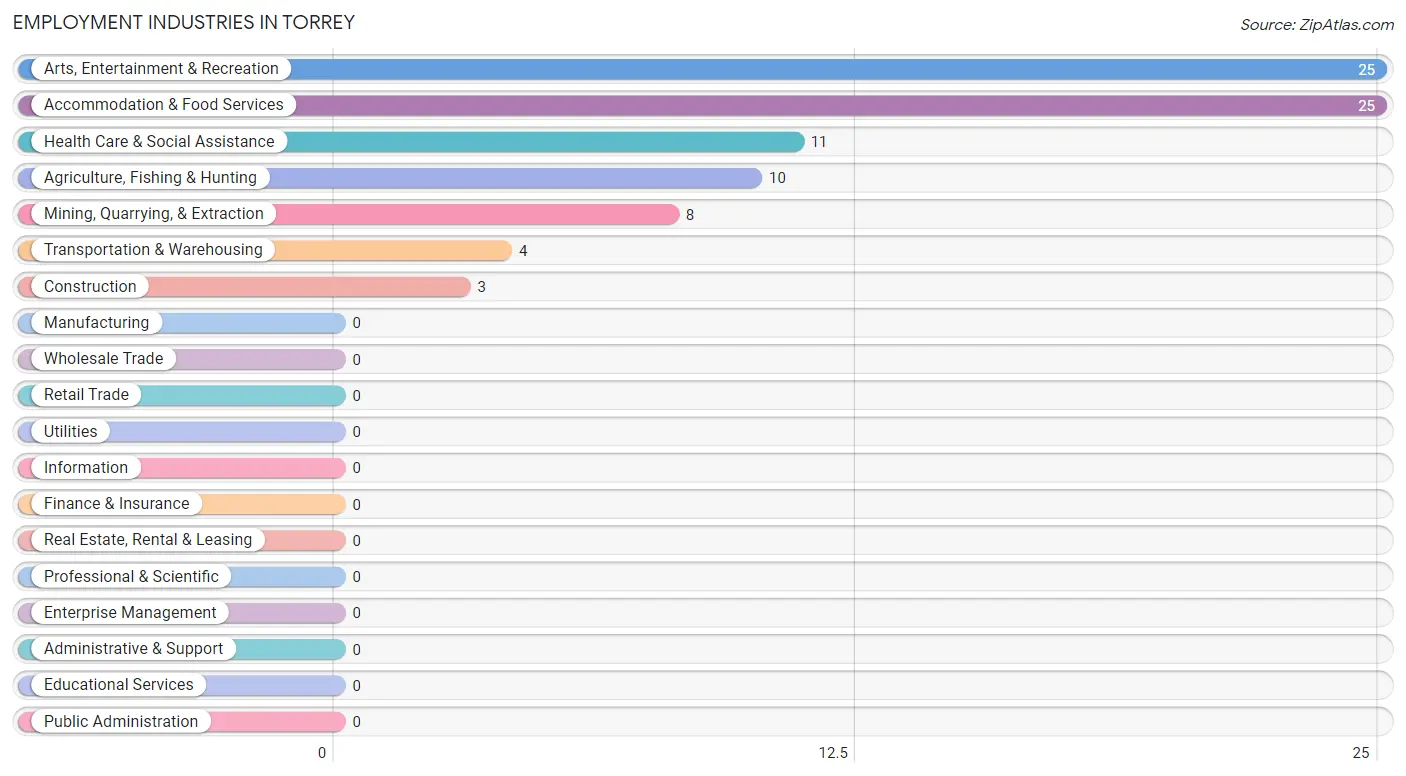
Employment Industries in Torrey
The major employment industries in Torrey include Arts, Entertainment & Recreation (25 | 29.1%), Accommodation & Food Services (25 | 29.1%), Health Care & Social Assistance (11 | 12.8%), Agriculture, Fishing & Hunting (10 | 11.6%), and Mining, Quarrying, & Extraction (8 | 9.3%).
Employment Industries by Sex in Torrey
The Torrey industries that see more men than women are Agriculture, Fishing & Hunting (100.0%), Mining, Quarrying, & Extraction (100.0%), and Construction (100.0%), whereas the industries that tend to have a higher number of women are Health Care & Social Assistance (100.0%), Arts, Entertainment & Recreation (84.0%), and Accommodation & Food Services (48.0%).
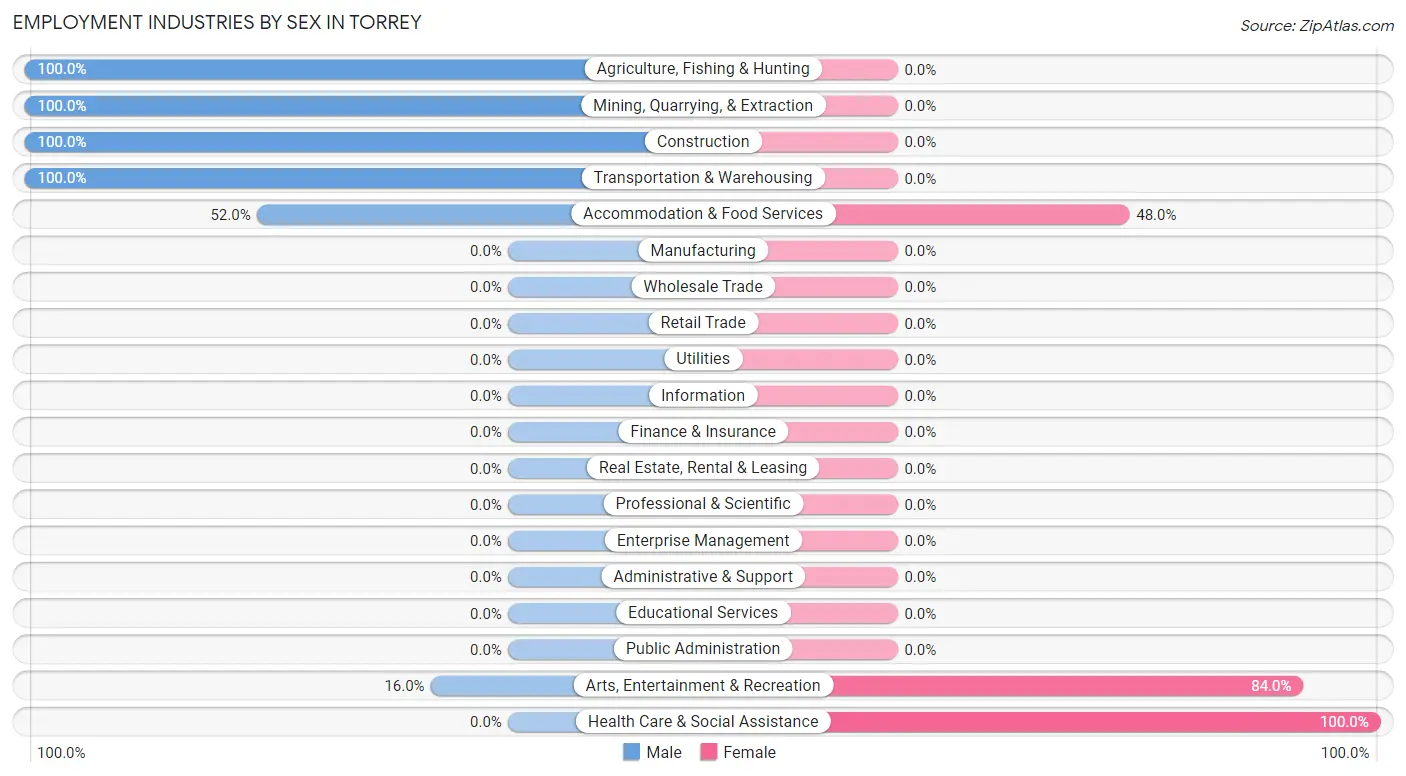
| Industry | Male | Female |
| Agriculture, Fishing & Hunting | 10 (100.0%) | 0 (0.0%) |
| Mining, Quarrying, & Extraction | 8 (100.0%) | 0 (0.0%) |
| Construction | 3 (100.0%) | 0 (0.0%) |
| Manufacturing | 0 (0.0%) | 0 (0.0%) |
| Wholesale Trade | 0 (0.0%) | 0 (0.0%) |
| Retail Trade | 0 (0.0%) | 0 (0.0%) |
| Transportation & Warehousing | 4 (100.0%) | 0 (0.0%) |
| Utilities | 0 (0.0%) | 0 (0.0%) |
| Information | 0 (0.0%) | 0 (0.0%) |
| Finance & Insurance | 0 (0.0%) | 0 (0.0%) |
| Real Estate, Rental & Leasing | 0 (0.0%) | 0 (0.0%) |
| Professional & Scientific | 0 (0.0%) | 0 (0.0%) |
| Enterprise Management | 0 (0.0%) | 0 (0.0%) |
| Administrative & Support | 0 (0.0%) | 0 (0.0%) |
| Educational Services | 0 (0.0%) | 0 (0.0%) |
| Health Care & Social Assistance | 0 (0.0%) | 11 (100.0%) |
| Arts, Entertainment & Recreation | 4 (16.0%) | 21 (84.0%) |
| Accommodation & Food Services | 13 (52.0%) | 12 (48.0%) |
| Public Administration | 0 (0.0%) | 0 (0.0%) |
| Total | 42 (48.8%) | 44 (51.2%) |
Education in Torrey
School Enrollment in Torrey
| School Level | # Students | % Students |
| Nursery / Preschool | 0 | 0.0% |
| Kindergarten | 0 | 0.0% |
| Elementary School | 0 | 0.0% |
| Middle School | 0 | 0.0% |
| High School | 0 | 0.0% |
| College / Undergraduate | 0 | 0.0% |
| Graduate / Professional | 0 | 0.0% |
| Total | 0 | 0.0% |
School Enrollment by Age by Funding Source in Torrey
| Age Bracket | Public School | Private School |
| 3 to 4 Year Olds | 0 (0.0%) | 0 (0.0%) |
| 5 to 9 Year Old | 0 (0.0%) | 0 (0.0%) |
| 10 to 14 Year Olds | 0 (0.0%) | 0 (0.0%) |
| 15 to 17 Year Olds | 0 (0.0%) | 0 (0.0%) |
| 18 to 19 Year Olds | 0 (0.0%) | 0 (0.0%) |
| 20 to 24 Year Olds | 0 (0.0%) | 0 (0.0%) |
| 25 to 34 Year Olds | 0 (0.0%) | 0 (0.0%) |
| 35 Years and over | 0 (0.0%) | 0 (0.0%) |
| Total | 0 (0.0%) | 0 (0.0%) |
Educational Attainment by Field of Study in Torrey
Education (14 | 17.9%), social sciences (12 | 15.4%), psychology (11 | 14.1%), science & technology (9 | 11.5%), and business (9 | 11.5%) are the most common fields of study among 78 individuals in Torrey who have obtained a bachelor's degree or higher.
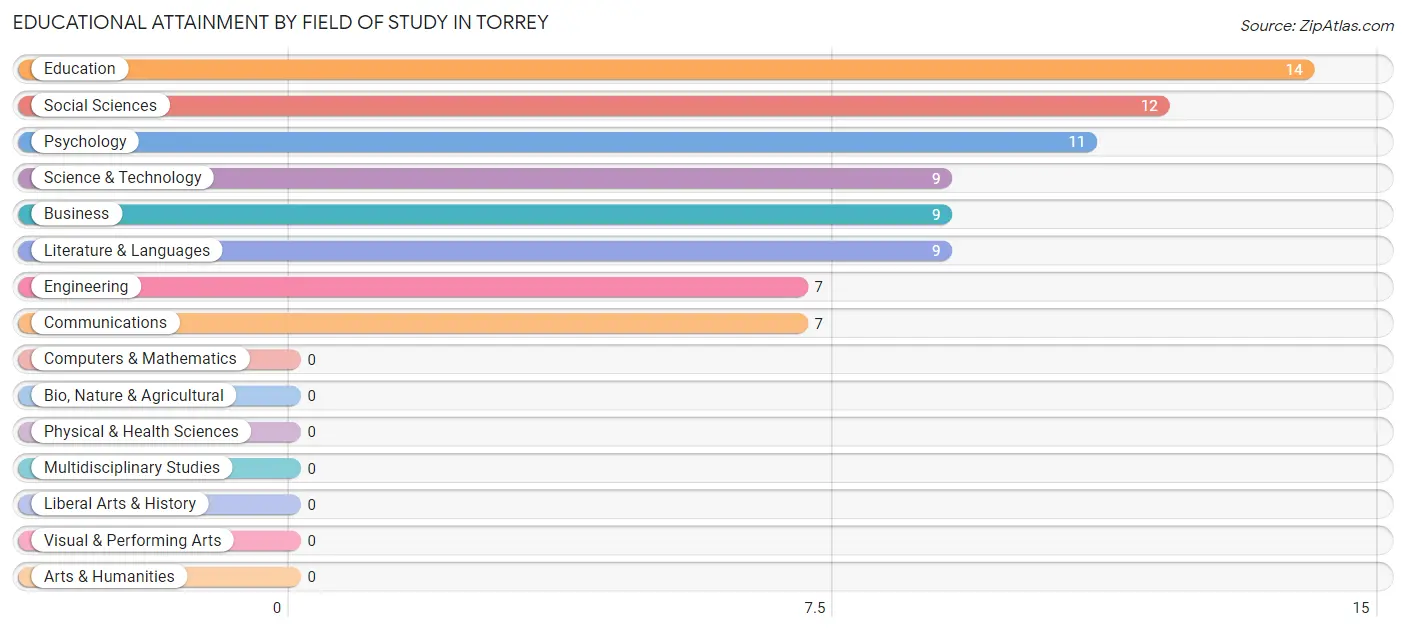
| Field of Study | # Graduates | % Graduates |
| Computers & Mathematics | 0 | 0.0% |
| Bio, Nature & Agricultural | 0 | 0.0% |
| Physical & Health Sciences | 0 | 0.0% |
| Psychology | 11 | 14.1% |
| Social Sciences | 12 | 15.4% |
| Engineering | 7 | 9.0% |
| Multidisciplinary Studies | 0 | 0.0% |
| Science & Technology | 9 | 11.5% |
| Business | 9 | 11.5% |
| Education | 14 | 17.9% |
| Literature & Languages | 9 | 11.5% |
| Liberal Arts & History | 0 | 0.0% |
| Visual & Performing Arts | 0 | 0.0% |
| Communications | 7 | 9.0% |
| Arts & Humanities | 0 | 0.0% |
| Total | 78 | 100.0% |
Transportation & Commute in Torrey
Vehicle Availability by Sex in Torrey
The most prevalent vehicle ownership categories in Torrey are males with 2 vehicles (23, accounting for 54.8%) and females with 2 vehicles (24, making up 52.3%).
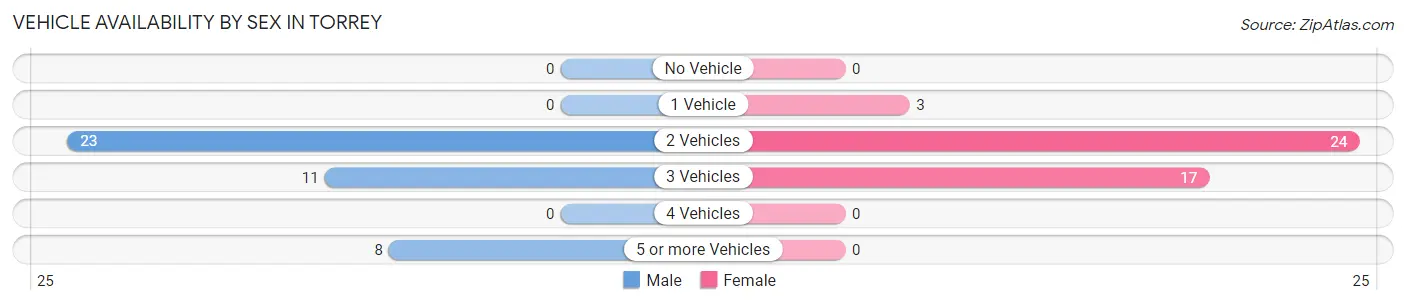
| Vehicles Available | Male | Female |
| No Vehicle | 0 (0.0%) | 0 (0.0%) |
| 1 Vehicle | 0 (0.0%) | 3 (6.8%) |
| 2 Vehicles | 23 (54.8%) | 24 (54.5%) |
| 3 Vehicles | 11 (26.2%) | 17 (38.6%) |
| 4 Vehicles | 0 (0.0%) | 0 (0.0%) |
| 5 or more Vehicles | 8 (19.1%) | 0 (0.0%) |
| Total | 42 (100.0%) | 44 (100.0%) |
Commute Time in Torrey
The most frequently occuring commute durations in Torrey are less than 5 minutes (24 commuters, 32.4%), 5 to 9 minutes (22 commuters, 29.7%), and 10 to 14 minutes (16 commuters, 21.6%).
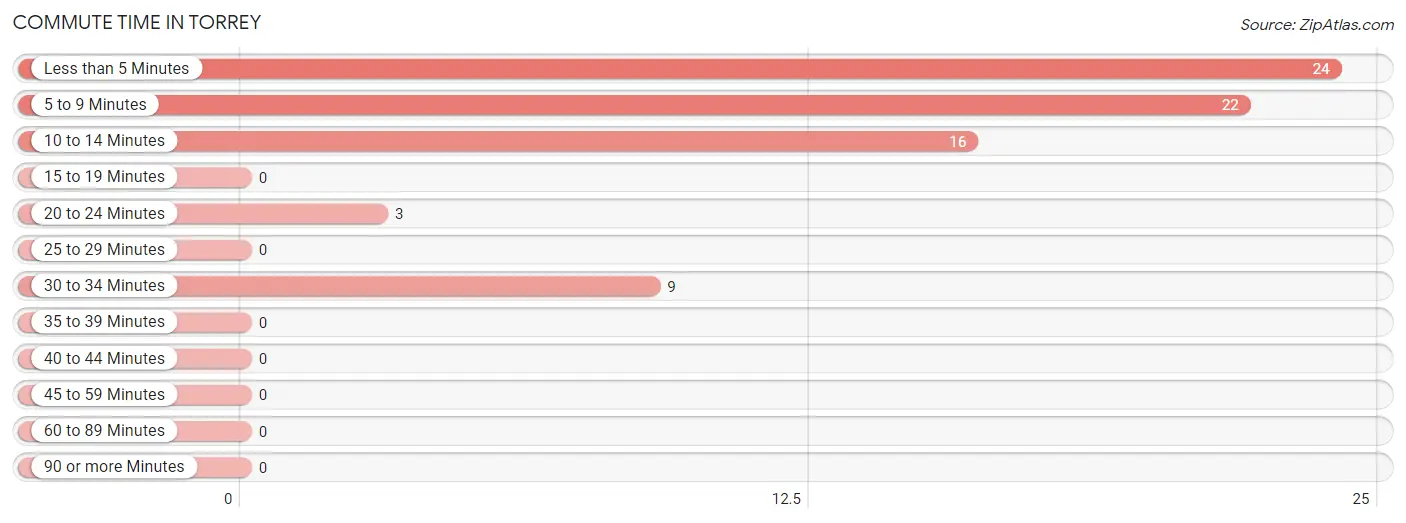
| Commute Time | # Commuters | % Commuters |
| Less than 5 Minutes | 24 | 32.4% |
| 5 to 9 Minutes | 22 | 29.7% |
| 10 to 14 Minutes | 16 | 21.6% |
| 15 to 19 Minutes | 0 | 0.0% |
| 20 to 24 Minutes | 3 | 4.1% |
| 25 to 29 Minutes | 0 | 0.0% |
| 30 to 34 Minutes | 9 | 12.2% |
| 35 to 39 Minutes | 0 | 0.0% |
| 40 to 44 Minutes | 0 | 0.0% |
| 45 to 59 Minutes | 0 | 0.0% |
| 60 to 89 Minutes | 0 | 0.0% |
| 90 or more Minutes | 0 | 0.0% |
Commute Time by Sex in Torrey
The most common commute times in Torrey are less than 5 minutes (20 commuters, 48.8%) for males and 10 to 14 minutes (12 commuters, 36.4%) for females.
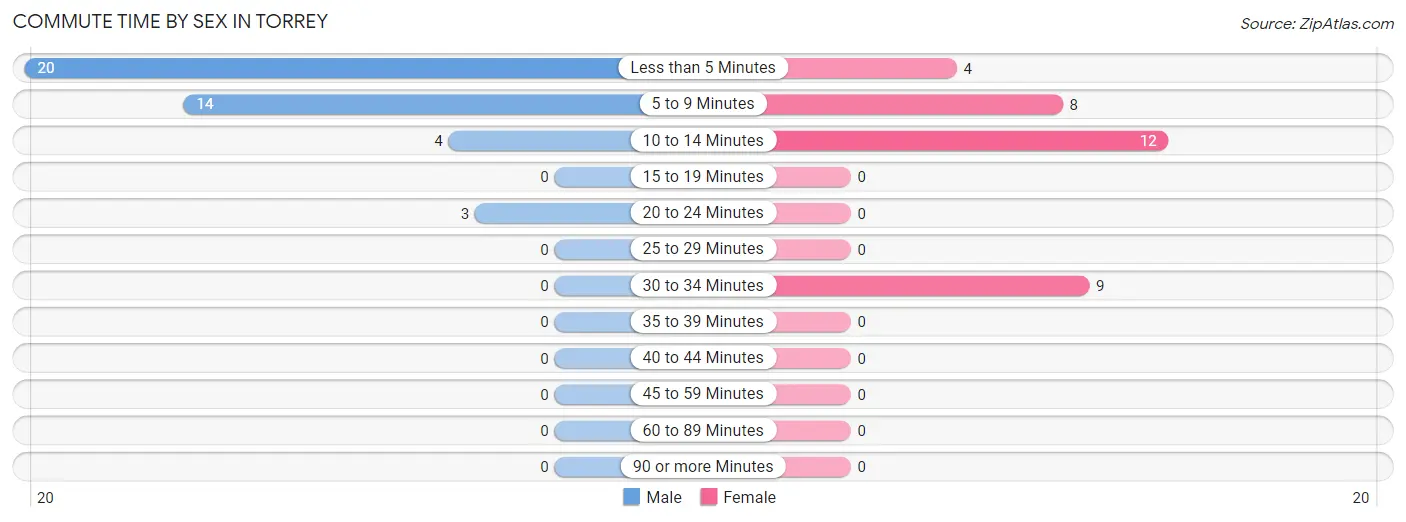
| Commute Time | Male | Female |
| Less than 5 Minutes | 20 (48.8%) | 4 (12.1%) |
| 5 to 9 Minutes | 14 (34.2%) | 8 (24.2%) |
| 10 to 14 Minutes | 4 (9.8%) | 12 (36.4%) |
| 15 to 19 Minutes | 0 (0.0%) | 0 (0.0%) |
| 20 to 24 Minutes | 3 (7.3%) | 0 (0.0%) |
| 25 to 29 Minutes | 0 (0.0%) | 0 (0.0%) |
| 30 to 34 Minutes | 0 (0.0%) | 9 (27.3%) |
| 35 to 39 Minutes | 0 (0.0%) | 0 (0.0%) |
| 40 to 44 Minutes | 0 (0.0%) | 0 (0.0%) |
| 45 to 59 Minutes | 0 (0.0%) | 0 (0.0%) |
| 60 to 89 Minutes | 0 (0.0%) | 0 (0.0%) |
| 90 or more Minutes | 0 (0.0%) | 0 (0.0%) |
Time of Departure to Work by Sex in Torrey
The most frequent times of departure to work in Torrey are 8:00 AM to 8:29 AM (27, 65.8%) for males and 8:00 AM to 8:29 AM (21, 63.6%) for females.
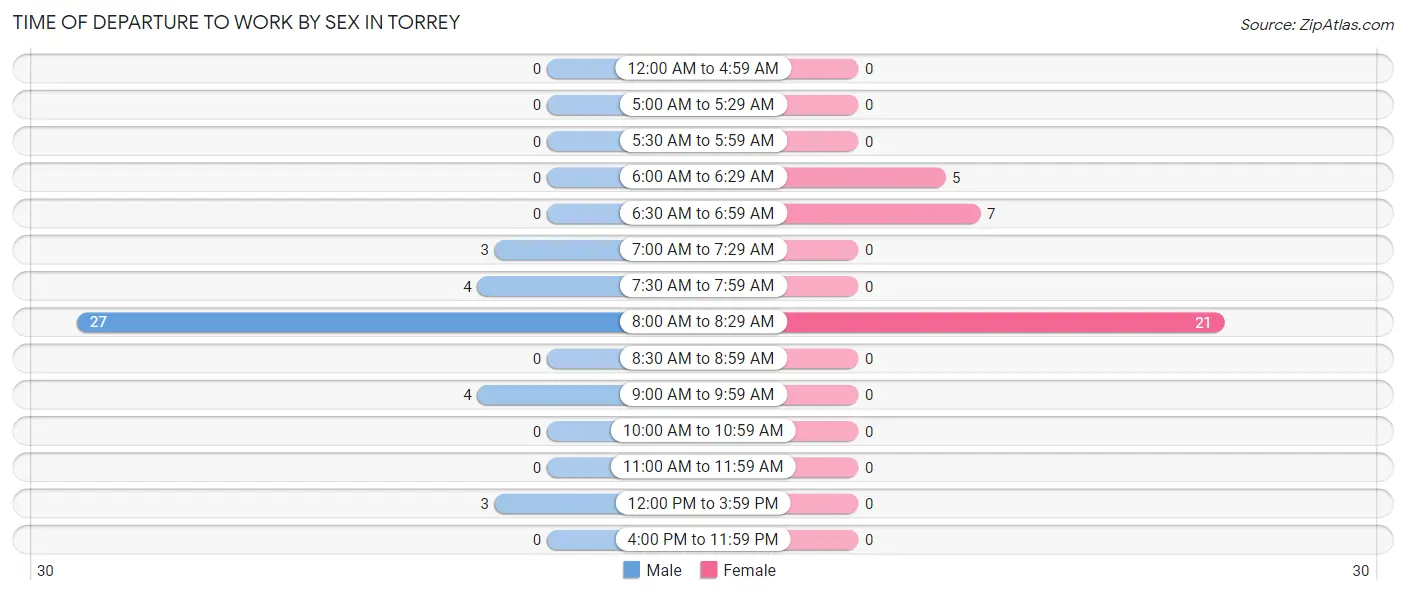
| Time of Departure | Male | Female |
| 12:00 AM to 4:59 AM | 0 (0.0%) | 0 (0.0%) |
| 5:00 AM to 5:29 AM | 0 (0.0%) | 0 (0.0%) |
| 5:30 AM to 5:59 AM | 0 (0.0%) | 0 (0.0%) |
| 6:00 AM to 6:29 AM | 0 (0.0%) | 5 (15.1%) |
| 6:30 AM to 6:59 AM | 0 (0.0%) | 7 (21.2%) |
| 7:00 AM to 7:29 AM | 3 (7.3%) | 0 (0.0%) |
| 7:30 AM to 7:59 AM | 4 (9.8%) | 0 (0.0%) |
| 8:00 AM to 8:29 AM | 27 (65.8%) | 21 (63.6%) |
| 8:30 AM to 8:59 AM | 0 (0.0%) | 0 (0.0%) |
| 9:00 AM to 9:59 AM | 4 (9.8%) | 0 (0.0%) |
| 10:00 AM to 10:59 AM | 0 (0.0%) | 0 (0.0%) |
| 11:00 AM to 11:59 AM | 0 (0.0%) | 0 (0.0%) |
| 12:00 PM to 3:59 PM | 3 (7.3%) | 0 (0.0%) |
| 4:00 PM to 11:59 PM | 0 (0.0%) | 0 (0.0%) |
| Total | 41 (100.0%) | 33 (100.0%) |
Housing Occupancy in Torrey
Occupancy by Ownership in Torrey
Of the total 108 dwellings in Torrey, owner-occupied units account for 96 (88.9%), while renter-occupied units make up 12 (11.1%).
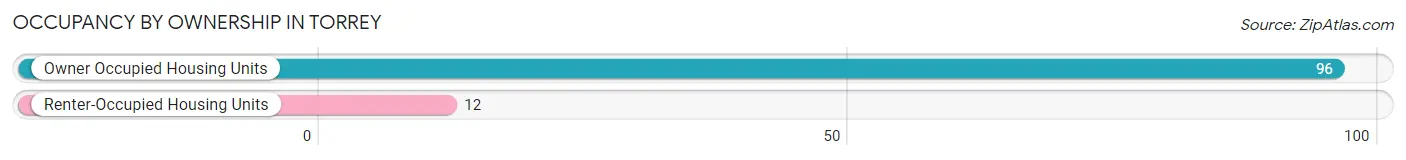
| Occupancy | # Housing Units | % Housing Units |
| Owner Occupied Housing Units | 96 | 88.9% |
| Renter-Occupied Housing Units | 12 | 11.1% |
| Total Occupied Housing Units | 108 | 100.0% |
Occupancy by Household Size in Torrey
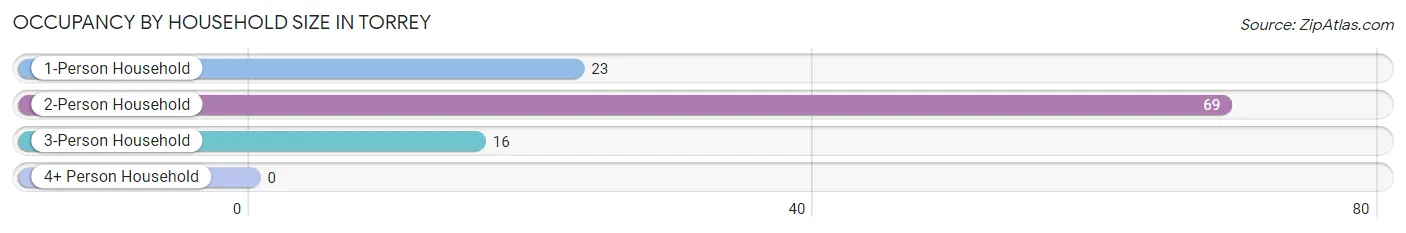
| Household Size | # Housing Units | % Housing Units |
| 1-Person Household | 23 | 21.3% |
| 2-Person Household | 69 | 63.9% |
| 3-Person Household | 16 | 14.8% |
| 4+ Person Household | 0 | 0.0% |
| Total Housing Units | 108 | 100.0% |
Occupancy by Ownership by Household Size in Torrey
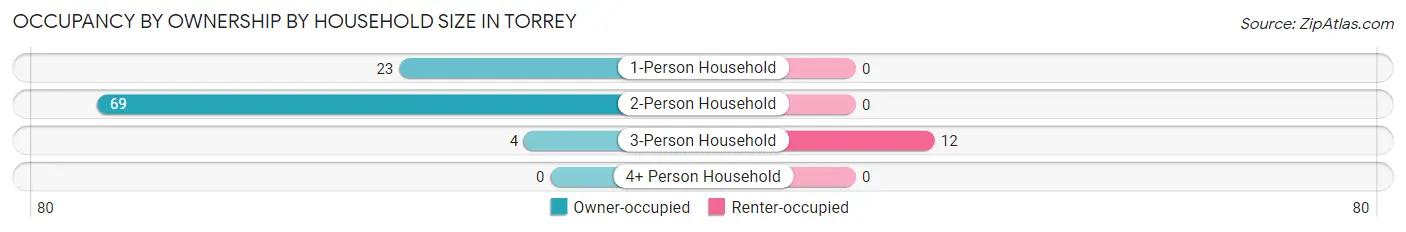
| Household Size | Owner-occupied | Renter-occupied |
| 1-Person Household | 23 (100.0%) | 0 (0.0%) |
| 2-Person Household | 69 (100.0%) | 0 (0.0%) |
| 3-Person Household | 4 (25.0%) | 12 (75.0%) |
| 4+ Person Household | 0 (0.0%) | 0 (0.0%) |
| Total Housing Units | 96 (88.9%) | 12 (11.1%) |
Occupancy by Educational Attainment in Torrey
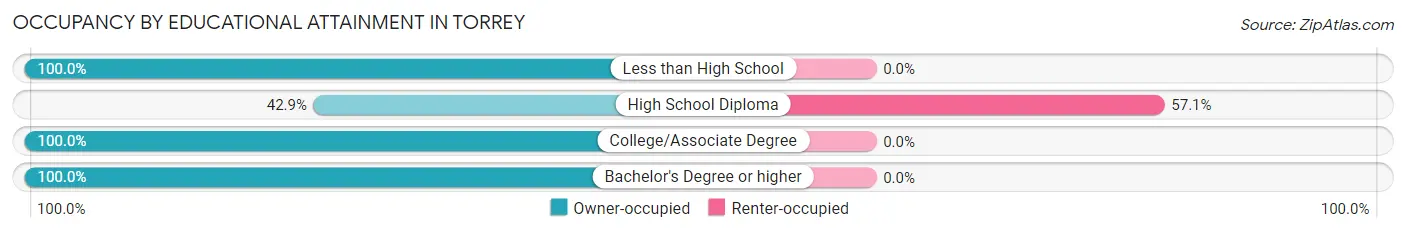
| Household Size | Owner-occupied | Renter-occupied |
| Less than High School | 4 (100.0%) | 0 (0.0%) |
| High School Diploma | 9 (42.9%) | 12 (57.1%) |
| College/Associate Degree | 31 (100.0%) | 0 (0.0%) |
| Bachelor's Degree or higher | 52 (100.0%) | 0 (0.0%) |
Occupancy by Age of Householder in Torrey
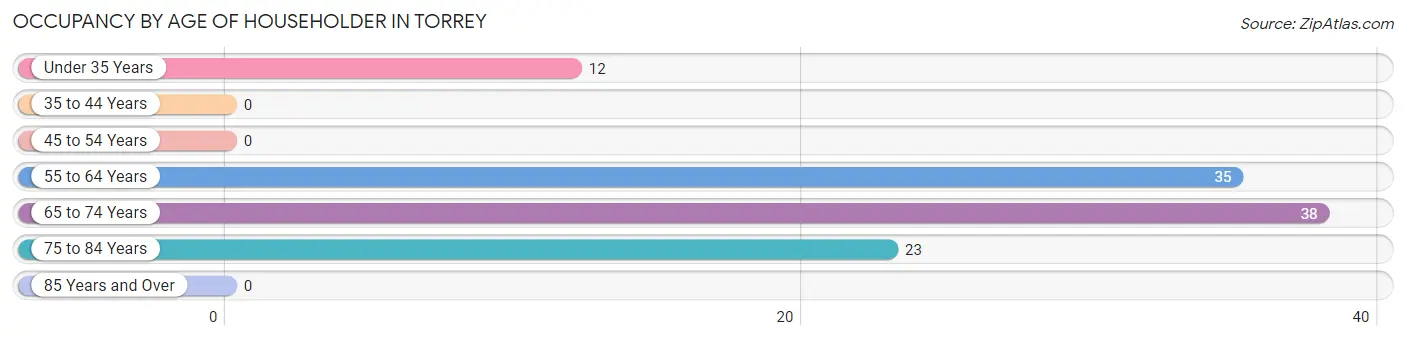
| Age Bracket | # Households | % Households |
| Under 35 Years | 12 | 11.1% |
| 35 to 44 Years | 0 | 0.0% |
| 45 to 54 Years | 0 | 0.0% |
| 55 to 64 Years | 35 | 32.4% |
| 65 to 74 Years | 38 | 35.2% |
| 75 to 84 Years | 23 | 21.3% |
| 85 Years and Over | 0 | 0.0% |
| Total | 108 | 100.0% |
Housing Finances in Torrey
Median Income by Occupancy in Torrey
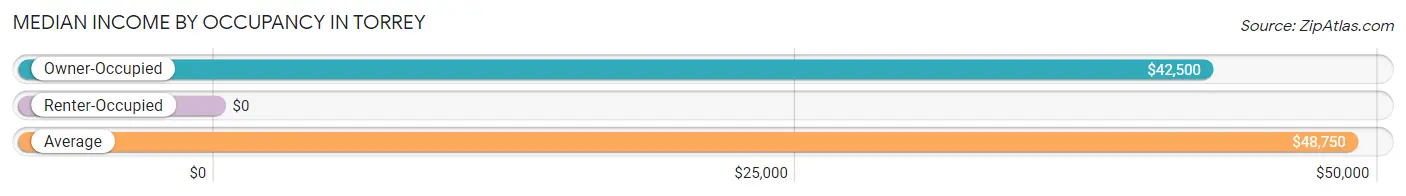
| Occupancy Type | # Households | Median Income |
| Owner-Occupied | 96 (88.9%) | $42,500 |
| Renter-Occupied | 12 (11.1%) | $0 |
| Average | 108 (100.0%) | $48,750 |
Occupancy by Householder Income Bracket in Torrey
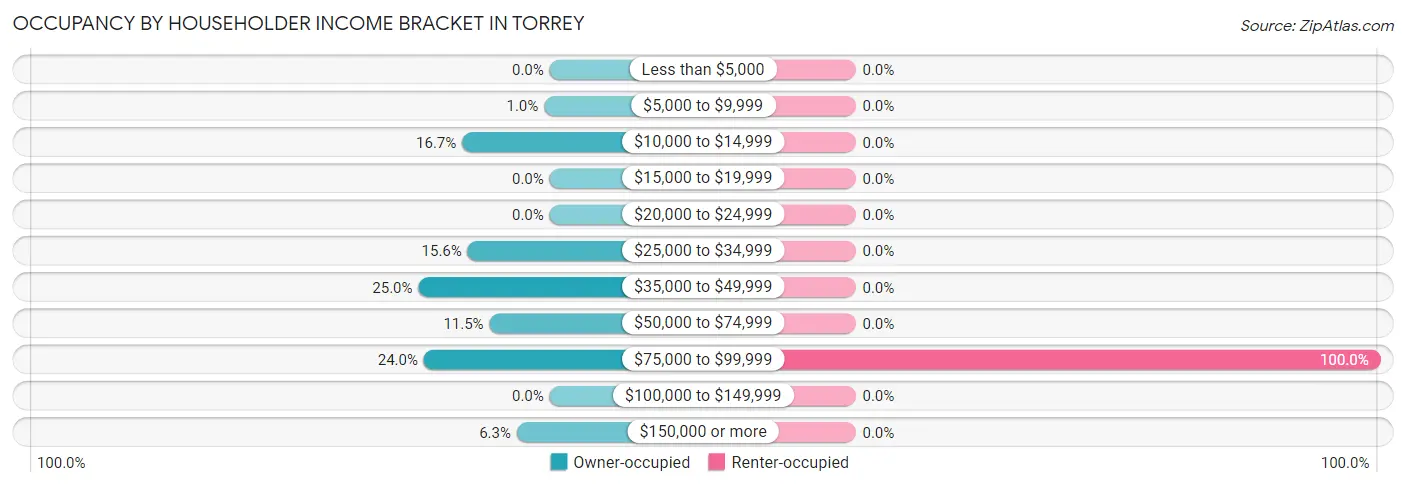
| Income Bracket | Owner-occupied | Renter-occupied |
| Less than $5,000 | 0 (0.0%) | 0 (0.0%) |
| $5,000 to $9,999 | 1 (1.0%) | 0 (0.0%) |
| $10,000 to $14,999 | 16 (16.7%) | 0 (0.0%) |
| $15,000 to $19,999 | 0 (0.0%) | 0 (0.0%) |
| $20,000 to $24,999 | 0 (0.0%) | 0 (0.0%) |
| $25,000 to $34,999 | 15 (15.6%) | 0 (0.0%) |
| $35,000 to $49,999 | 24 (25.0%) | 0 (0.0%) |
| $50,000 to $74,999 | 11 (11.5%) | 0 (0.0%) |
| $75,000 to $99,999 | 23 (24.0%) | 12 (100.0%) |
| $100,000 to $149,999 | 0 (0.0%) | 0 (0.0%) |
| $150,000 or more | 6 (6.2%) | 0 (0.0%) |
| Total | 96 (100.0%) | 12 (100.0%) |
Monthly Housing Cost Tiers in Torrey
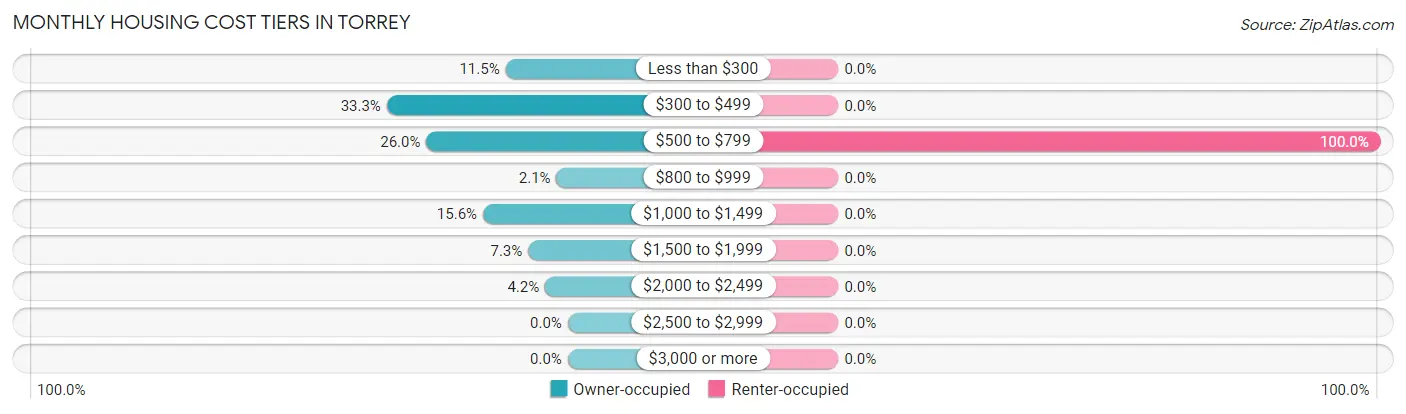
| Monthly Cost | Owner-occupied | Renter-occupied |
| Less than $300 | 11 (11.5%) | 0 (0.0%) |
| $300 to $499 | 32 (33.3%) | 0 (0.0%) |
| $500 to $799 | 25 (26.0%) | 12 (100.0%) |
| $800 to $999 | 2 (2.1%) | 0 (0.0%) |
| $1,000 to $1,499 | 15 (15.6%) | 0 (0.0%) |
| $1,500 to $1,999 | 7 (7.3%) | 0 (0.0%) |
| $2,000 to $2,499 | 4 (4.2%) | 0 (0.0%) |
| $2,500 to $2,999 | 0 (0.0%) | 0 (0.0%) |
| $3,000 or more | 0 (0.0%) | 0 (0.0%) |
| Total | 96 (100.0%) | 12 (100.0%) |
Physical Housing Characteristics in Torrey
Housing Structures in Torrey
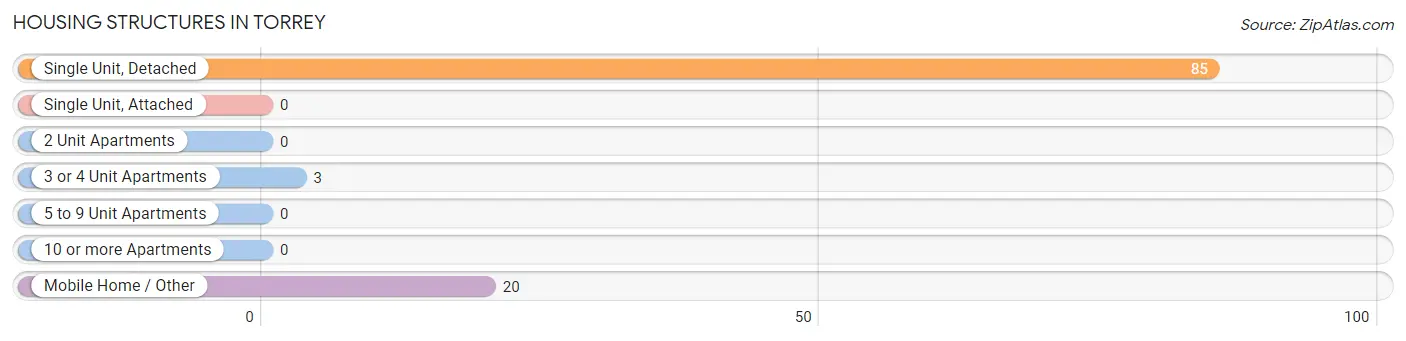
| Structure Type | # Housing Units | % Housing Units |
| Single Unit, Detached | 85 | 78.7% |
| Single Unit, Attached | 0 | 0.0% |
| 2 Unit Apartments | 0 | 0.0% |
| 3 or 4 Unit Apartments | 3 | 2.8% |
| 5 to 9 Unit Apartments | 0 | 0.0% |
| 10 or more Apartments | 0 | 0.0% |
| Mobile Home / Other | 20 | 18.5% |
| Total | 108 | 100.0% |
Housing Structures by Occupancy in Torrey
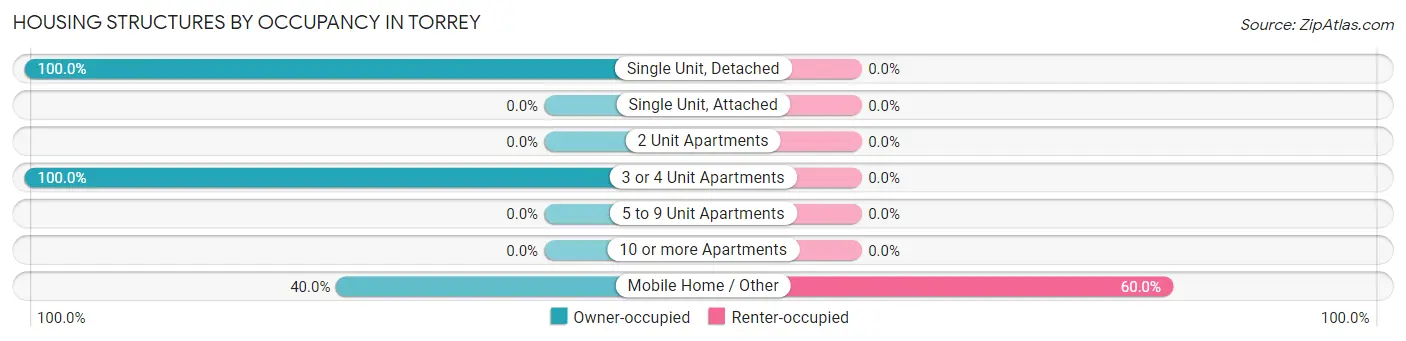
| Structure Type | Owner-occupied | Renter-occupied |
| Single Unit, Detached | 85 (100.0%) | 0 (0.0%) |
| Single Unit, Attached | 0 (0.0%) | 0 (0.0%) |
| 2 Unit Apartments | 0 (0.0%) | 0 (0.0%) |
| 3 or 4 Unit Apartments | 3 (100.0%) | 0 (0.0%) |
| 5 to 9 Unit Apartments | 0 (0.0%) | 0 (0.0%) |
| 10 or more Apartments | 0 (0.0%) | 0 (0.0%) |
| Mobile Home / Other | 8 (40.0%) | 12 (60.0%) |
| Total | 96 (88.9%) | 12 (11.1%) |
Housing Structures by Number of Rooms in Torrey
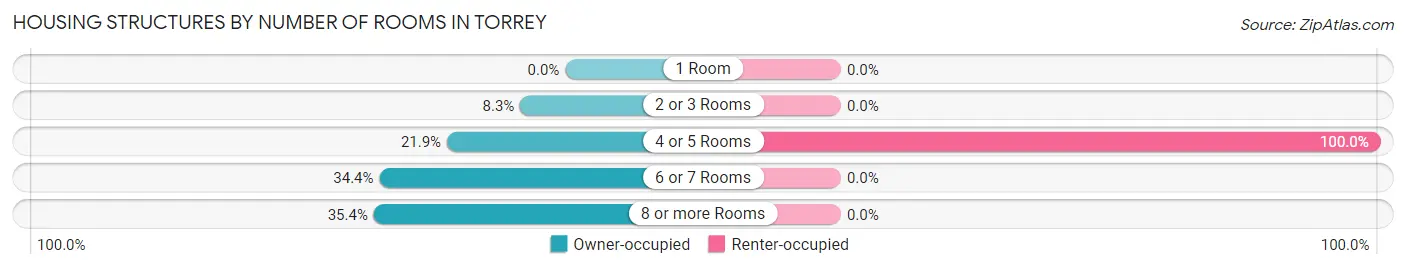
| Number of Rooms | Owner-occupied | Renter-occupied |
| 1 Room | 0 (0.0%) | 0 (0.0%) |
| 2 or 3 Rooms | 8 (8.3%) | 0 (0.0%) |
| 4 or 5 Rooms | 21 (21.9%) | 12 (100.0%) |
| 6 or 7 Rooms | 33 (34.4%) | 0 (0.0%) |
| 8 or more Rooms | 34 (35.4%) | 0 (0.0%) |
| Total | 96 (100.0%) | 12 (100.0%) |
Housing Structure by Heating Type in Torrey
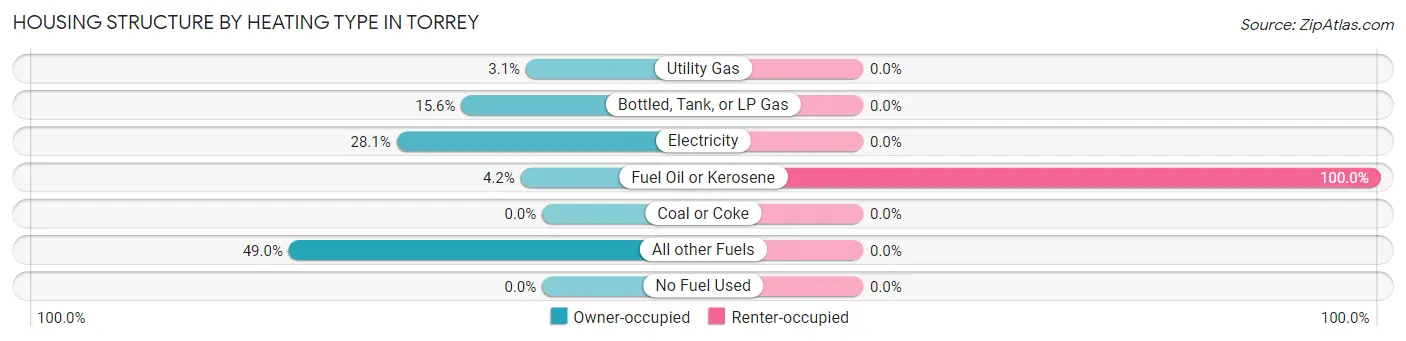
| Heating Type | Owner-occupied | Renter-occupied |
| Utility Gas | 3 (3.1%) | 0 (0.0%) |
| Bottled, Tank, or LP Gas | 15 (15.6%) | 0 (0.0%) |
| Electricity | 27 (28.1%) | 0 (0.0%) |
| Fuel Oil or Kerosene | 4 (4.2%) | 12 (100.0%) |
| Coal or Coke | 0 (0.0%) | 0 (0.0%) |
| All other Fuels | 47 (49.0%) | 0 (0.0%) |
| No Fuel Used | 0 (0.0%) | 0 (0.0%) |
| Total | 96 (100.0%) | 12 (100.0%) |
Household Vehicle Usage in Torrey
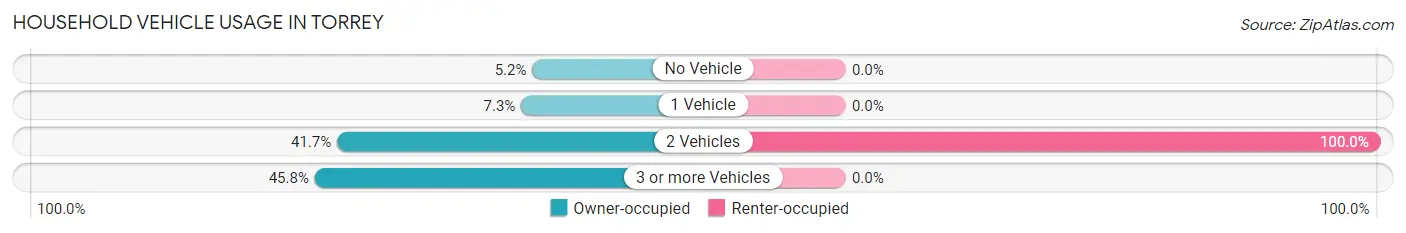
| Vehicles per Household | Owner-occupied | Renter-occupied |
| No Vehicle | 5 (5.2%) | 0 (0.0%) |
| 1 Vehicle | 7 (7.3%) | 0 (0.0%) |
| 2 Vehicles | 40 (41.7%) | 12 (100.0%) |
| 3 or more Vehicles | 44 (45.8%) | 0 (0.0%) |
| Total | 96 (100.0%) | 12 (100.0%) |
Real Estate & Mortgages in Torrey
Real Estate and Mortgage Overview in Torrey
| Characteristic | Without Mortgage | With Mortgage |
| Housing Units | 60 | 36 |
| Median Property Value | $480,000 | $247,200 |
| Median Household Income | - | - |
| Monthly Housing Costs | $350 | $0 |
| Real Estate Taxes | $1,321 | $0 |
Property Value by Mortgage Status in Torrey
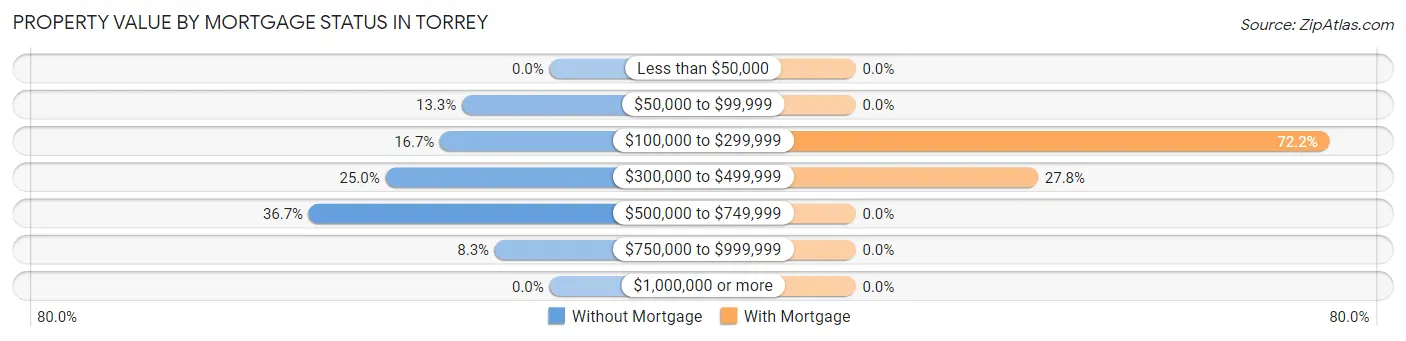
| Property Value | Without Mortgage | With Mortgage |
| Less than $50,000 | 0 (0.0%) | 0 (0.0%) |
| $50,000 to $99,999 | 8 (13.3%) | 0 (0.0%) |
| $100,000 to $299,999 | 10 (16.7%) | 26 (72.2%) |
| $300,000 to $499,999 | 15 (25.0%) | 10 (27.8%) |
| $500,000 to $749,999 | 22 (36.7%) | 0 (0.0%) |
| $750,000 to $999,999 | 5 (8.3%) | 0 (0.0%) |
| $1,000,000 or more | 0 (0.0%) | 0 (0.0%) |
| Total | 60 (100.0%) | 36 (100.0%) |
Household Income by Mortgage Status in Torrey
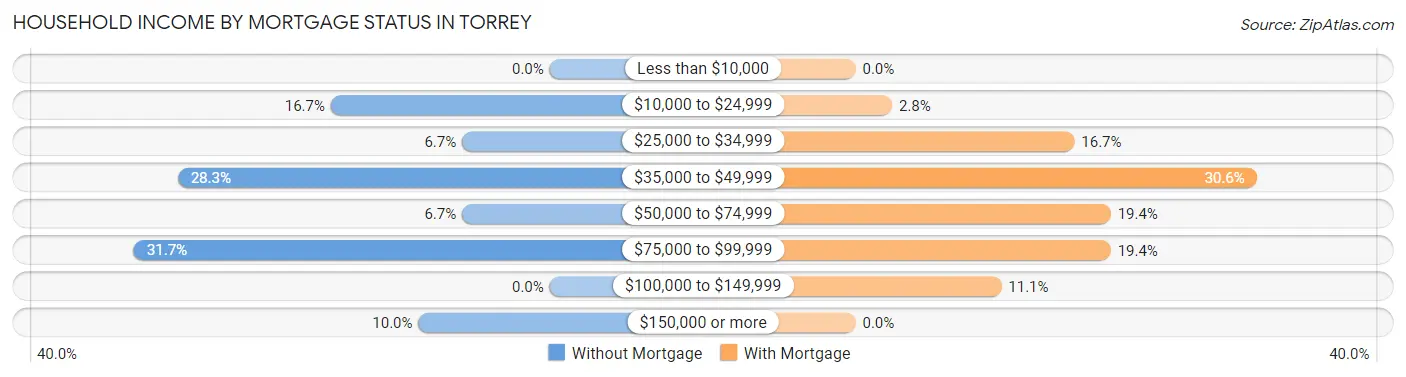
| Household Income | Without Mortgage | With Mortgage |
| Less than $10,000 | 0 (0.0%) | 0 (0.0%) |
| $10,000 to $24,999 | 10 (16.7%) | 1 (2.8%) |
| $25,000 to $34,999 | 4 (6.7%) | 6 (16.7%) |
| $35,000 to $49,999 | 17 (28.3%) | 11 (30.6%) |
| $50,000 to $74,999 | 4 (6.7%) | 7 (19.4%) |
| $75,000 to $99,999 | 19 (31.7%) | 7 (19.4%) |
| $100,000 to $149,999 | 0 (0.0%) | 4 (11.1%) |
| $150,000 or more | 6 (10.0%) | 0 (0.0%) |
| Total | 60 (100.0%) | 36 (100.0%) |
Property Value to Household Income Ratio in Torrey
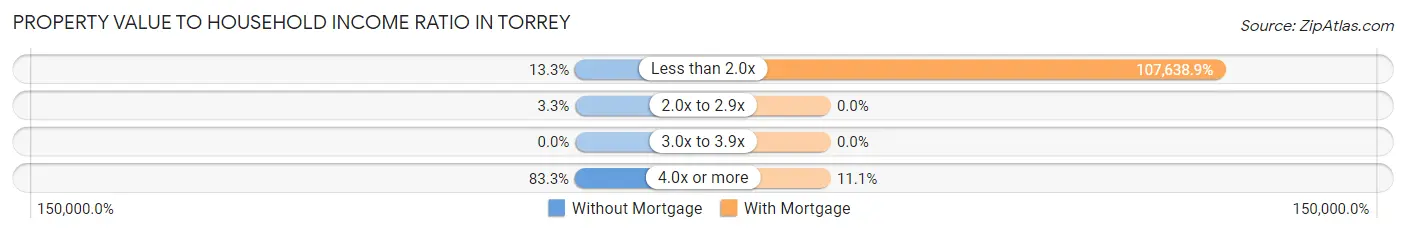
| Value-to-Income Ratio | Without Mortgage | With Mortgage |
| Less than 2.0x | 8 (13.3%) | 38,750 (107,638.9%) |
| 2.0x to 2.9x | 2 (3.3%) | 0 (0.0%) |
| 3.0x to 3.9x | 0 (0.0%) | 0 (0.0%) |
| 4.0x or more | 50 (83.3%) | 4 (11.1%) |
| Total | 60 (100.0%) | 36 (100.0%) |
Real Estate Taxes by Mortgage Status in Torrey
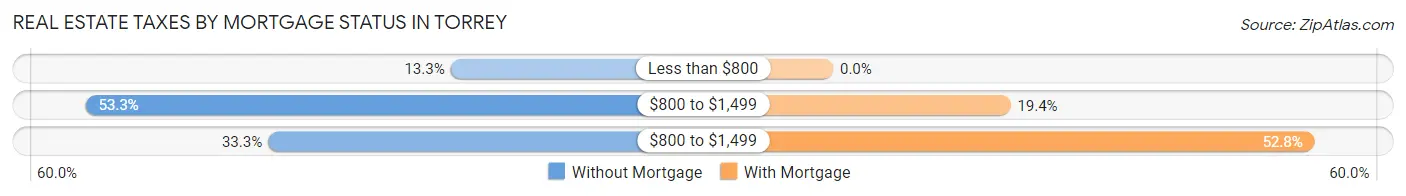
| Property Taxes | Without Mortgage | With Mortgage |
| Less than $800 | 8 (13.3%) | 0 (0.0%) |
| $800 to $1,499 | 32 (53.3%) | 7 (19.4%) |
| $800 to $1,499 | 20 (33.3%) | 19 (52.8%) |
| Total | 60 (100.0%) | 36 (100.0%) |
Health & Disability in Torrey
Health Insurance Coverage by Age in Torrey
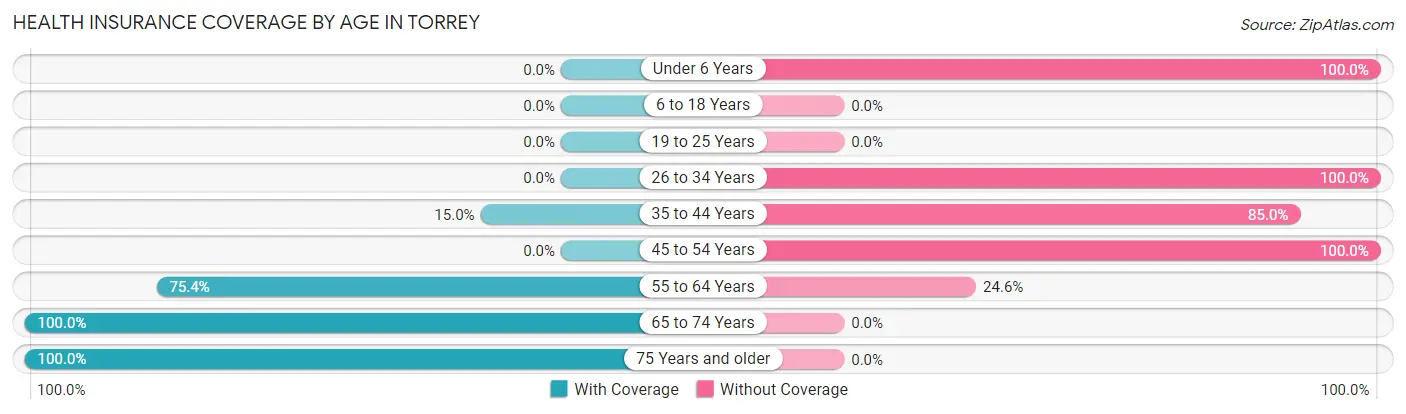
| Age Bracket | With Coverage | Without Coverage |
| Under 6 Years | 0 (0.0%) | 11 (100.0%) |
| 6 to 18 Years | 0 (0.0%) | 0 (0.0%) |
| 19 to 25 Years | 0 (0.0%) | 0 (0.0%) |
| 26 to 34 Years | 0 (0.0%) | 12 (100.0%) |
| 35 to 44 Years | 3 (15.0%) | 17 (85.0%) |
| 45 to 54 Years | 0 (0.0%) | 3 (100.0%) |
| 55 to 64 Years | 46 (75.4%) | 15 (24.6%) |
| 65 to 74 Years | 74 (100.0%) | 0 (0.0%) |
| 75 Years and older | 38 (100.0%) | 0 (0.0%) |
| Total | 161 (73.5%) | 58 (26.5%) |
Health Insurance Coverage by Citizenship Status in Torrey
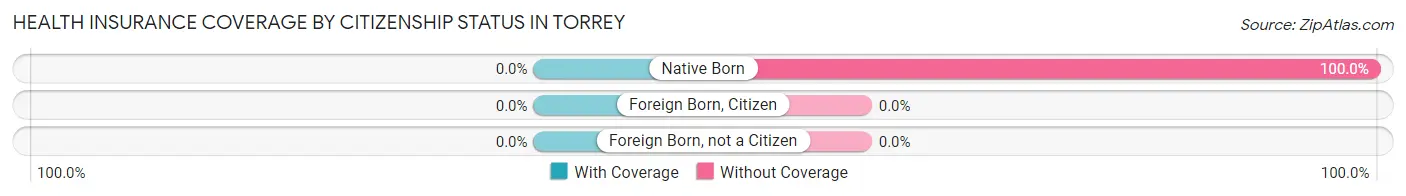
| Citizenship Status | With Coverage | Without Coverage |
| Native Born | 0 (0.0%) | 11 (100.0%) |
| Foreign Born, Citizen | 0 (0.0%) | 0 (0.0%) |
| Foreign Born, not a Citizen | 0 (0.0%) | 0 (0.0%) |
Health Insurance Coverage by Household Income in Torrey
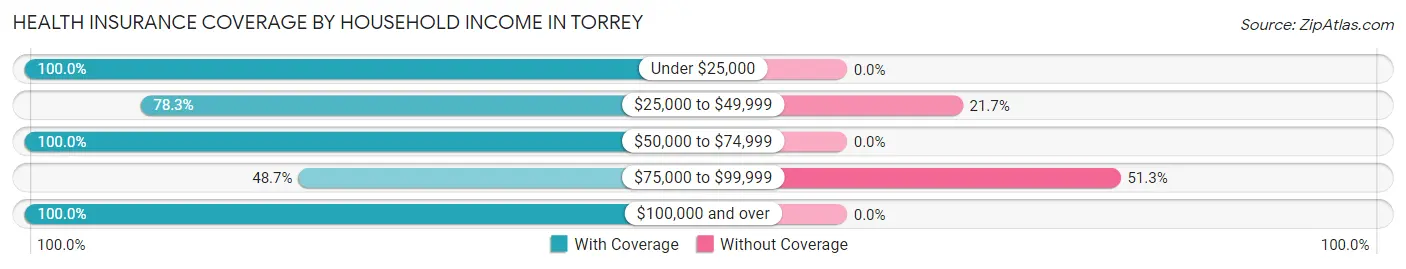
| Household Income | With Coverage | Without Coverage |
| Under $25,000 | 21 (100.0%) | 0 (0.0%) |
| $25,000 to $49,999 | 65 (78.3%) | 18 (21.7%) |
| $50,000 to $74,999 | 21 (100.0%) | 0 (0.0%) |
| $75,000 to $99,999 | 38 (48.7%) | 40 (51.3%) |
| $100,000 and over | 16 (100.0%) | 0 (0.0%) |
Public vs Private Health Insurance Coverage by Age in Torrey
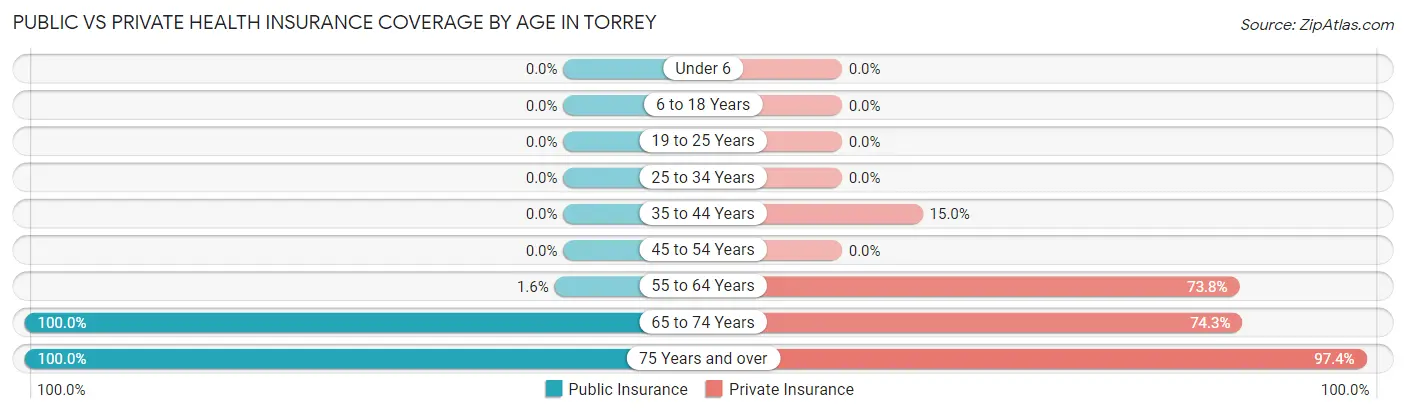
| Age Bracket | Public Insurance | Private Insurance |
| Under 6 | 0 (0.0%) | 0 (0.0%) |
| 6 to 18 Years | 0 (0.0%) | 0 (0.0%) |
| 19 to 25 Years | 0 (0.0%) | 0 (0.0%) |
| 25 to 34 Years | 0 (0.0%) | 0 (0.0%) |
| 35 to 44 Years | 0 (0.0%) | 3 (15.0%) |
| 45 to 54 Years | 0 (0.0%) | 0 (0.0%) |
| 55 to 64 Years | 1 (1.6%) | 45 (73.8%) |
| 65 to 74 Years | 74 (100.0%) | 55 (74.3%) |
| 75 Years and over | 38 (100.0%) | 37 (97.4%) |
| Total | 113 (51.6%) | 140 (63.9%) |
Disability Status by Sex by Age in Torrey
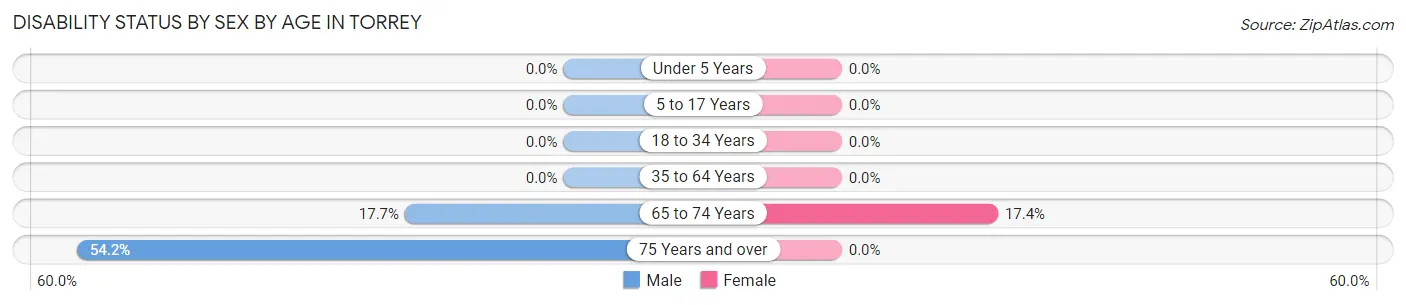
| Age Bracket | Male | Female |
| Under 5 Years | 0 (0.0%) | 0 (0.0%) |
| 5 to 17 Years | 0 (0.0%) | 0 (0.0%) |
| 18 to 34 Years | 0 (0.0%) | 0 (0.0%) |
| 35 to 64 Years | 0 (0.0%) | 0 (0.0%) |
| 65 to 74 Years | 9 (17.6%) | 4 (17.4%) |
| 75 Years and over | 13 (54.2%) | 0 (0.0%) |
Disability Class by Sex by Age in Torrey
Disability Class: Hearing Difficulty
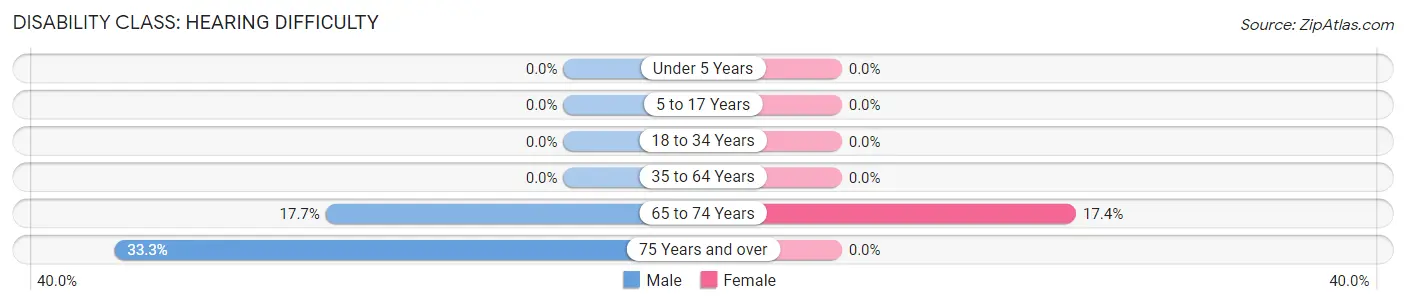
| Age Bracket | Male | Female |
| Under 5 Years | 0 (0.0%) | 0 (0.0%) |
| 5 to 17 Years | 0 (0.0%) | 0 (0.0%) |
| 18 to 34 Years | 0 (0.0%) | 0 (0.0%) |
| 35 to 64 Years | 0 (0.0%) | 0 (0.0%) |
| 65 to 74 Years | 9 (17.6%) | 4 (17.4%) |
| 75 Years and over | 8 (33.3%) | 0 (0.0%) |
Disability Class: Vision Difficulty
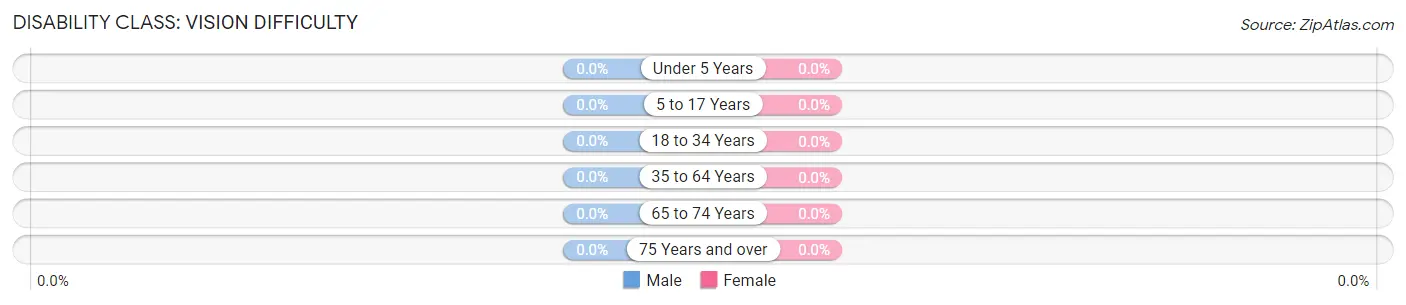
| Age Bracket | Male | Female |
| Under 5 Years | 0 (0.0%) | 0 (0.0%) |
| 5 to 17 Years | 0 (0.0%) | 0 (0.0%) |
| 18 to 34 Years | 0 (0.0%) | 0 (0.0%) |
| 35 to 64 Years | 0 (0.0%) | 0 (0.0%) |
| 65 to 74 Years | 0 (0.0%) | 0 (0.0%) |
| 75 Years and over | 0 (0.0%) | 0 (0.0%) |
Disability Class: Cognitive Difficulty
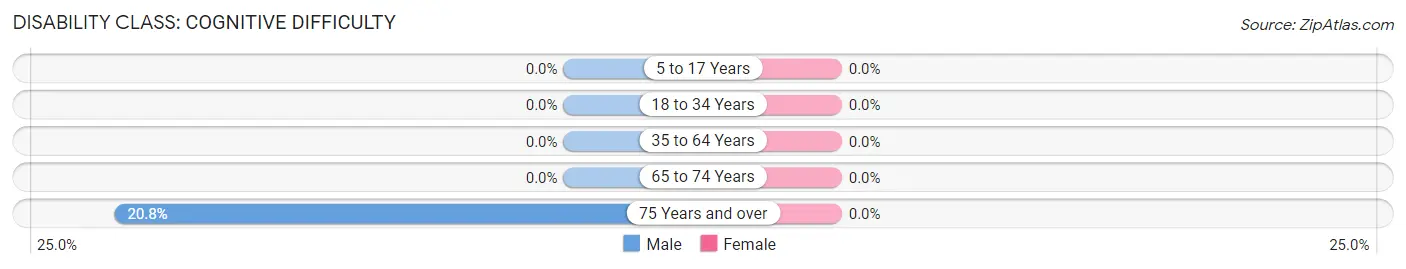
| Age Bracket | Male | Female |
| 5 to 17 Years | 0 (0.0%) | 0 (0.0%) |
| 18 to 34 Years | 0 (0.0%) | 0 (0.0%) |
| 35 to 64 Years | 0 (0.0%) | 0 (0.0%) |
| 65 to 74 Years | 0 (0.0%) | 0 (0.0%) |
| 75 Years and over | 5 (20.8%) | 0 (0.0%) |
Disability Class: Ambulatory Difficulty
| Age Bracket | Male | Female |
| 5 to 17 Years | 0 (0.0%) | 0 (0.0%) |
| 18 to 34 Years | 0 (0.0%) | 0 (0.0%) |
| 35 to 64 Years | 0 (0.0%) | 0 (0.0%) |
| 65 to 74 Years | 0 (0.0%) | 0 (0.0%) |
| 75 Years and over | 0 (0.0%) | 0 (0.0%) |
Disability Class: Self-Care Difficulty
| Age Bracket | Male | Female |
| 5 to 17 Years | 0 (0.0%) | 0 (0.0%) |
| 18 to 34 Years | 0 (0.0%) | 0 (0.0%) |
| 35 to 64 Years | 0 (0.0%) | 0 (0.0%) |
| 65 to 74 Years | 0 (0.0%) | 0 (0.0%) |
| 75 Years and over | 0 (0.0%) | 0 (0.0%) |
Technology Access in Torrey
Computing Device Access in Torrey
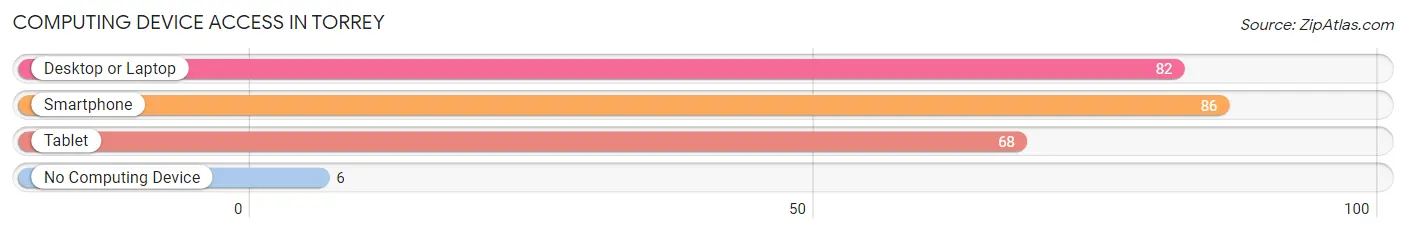
| Device Type | # Households | % Households |
| Desktop or Laptop | 82 | 75.9% |
| Smartphone | 86 | 79.6% |
| Tablet | 68 | 63.0% |
| No Computing Device | 6 | 5.6% |
| Total | 108 | 100.0% |
Internet Access in Torrey
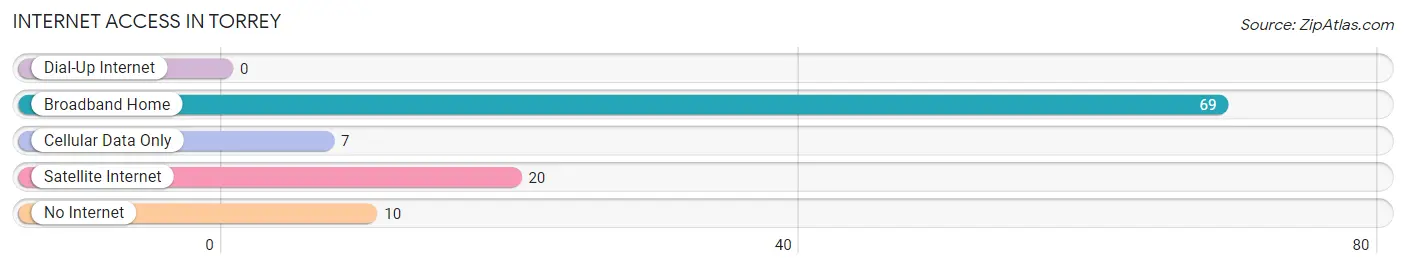
| Internet Type | # Households | % Households |
| Dial-Up Internet | 0 | 0.0% |
| Broadband Home | 69 | 63.9% |
| Cellular Data Only | 7 | 6.5% |
| Satellite Internet | 20 | 18.5% |
| No Internet | 10 | 9.3% |
| Total | 108 | 100.0% |
Torrey Summary
Torrey is a small town located in Wayne County, Utah, United States. It is situated in the south-central part of the state, near Capitol Reef National Park. The population of Torrey was estimated to be around 300 in 2020.
History
The area around Torrey was first settled in the late 1800s by Mormon pioneers. The town was originally known as "Fruita," named after the nearby orchards. In the early 1900s, the town was renamed Torrey after a local rancher, John Torrey.
The town was incorporated in 1911 and has remained a small, rural community ever since. Torrey is known for its scenic beauty and its proximity to Capitol Reef National Park. The town is also home to the historic Torrey School, which was built in 1912 and is still in use today.
Geography
Torrey is located in south-central Utah, near Capitol Reef National Park. The town is situated in a high desert valley, surrounded by red rock cliffs and canyons. The elevation of Torrey is 5,890 feet (1,795 m).
The climate in Torrey is semi-arid, with hot summers and cold winters. The average annual precipitation is 8.5 inches (216 mm).
Economy
The economy of Torrey is largely based on tourism. The town is a popular destination for visitors to Capitol Reef National Park, and there are several hotels, restaurants, and other businesses catering to tourists.
Agriculture is also an important part of the local economy. The area around Torrey is known for its orchards, which produce a variety of fruits and vegetables. Livestock production is also common in the area.
Demographics
As of the 2010 census, the population of Torrey was estimated to be around 300. The racial makeup of the town was 97.3% White, 0.7% Native American, 0.3% Asian, and 1.7% from other races.
The median household income in Torrey was $37,500, and the median family income was $41,250. The per capita income was $17,500. About 11.7% of the population was below the poverty line.
Torrey is a small, rural community with a strong sense of community and a commitment to preserving its history and culture. The town is a popular destination for visitors to Capitol Reef National Park, and its scenic beauty and proximity to the park make it an attractive place to live.
Common Questions
What is Per Capita Income in Torrey?
Per Capita income in Torrey is $30,417.
What is the Median Family Income in Torrey?
Median Family Income in Torrey is $62,083.
What is the Median Household income in Torrey?
Median Household Income in Torrey is $48,750.
What is Inequality or Gini Index in Torrey?
Inequality or Gini Index in Torrey is 0.35.
What is the Total Population of Torrey?
Total Population of Torrey is 219.
What is the Total Male Population of Torrey?
Total Male Population of Torrey is 126.
What is the Total Female Population of Torrey?
Total Female Population of Torrey is 93.
What is the Ratio of Males per 100 Females in Torrey?
There are 135.48 Males per 100 Females in Torrey.
What is the Ratio of Females per 100 Males in Torrey?
There are 73.81 Females per 100 Males in Torrey.
What is the Median Population Age in Torrey?
Median Population Age in Torrey is 66.2 Years.
What is the Average Family Size in Torrey
Average Family Size in Torrey is 2.3 People.
What is the Average Household Size in Torrey
Average Household Size in Torrey is 2.0 People.
How Large is the Labor Force in Torrey?
There are 86 People in the Labor Forcein in Torrey.
What is the Percentage of People in the Labor Force in Torrey?
41.3% of People are in the Labor Force in Torrey.