Rocky Ridge, UT Map & Demographics
Rocky Ridge Map
Rocky Ridge Overview
$13,268
PER CAPITA INCOME
$86,250
AVG FAMILY INCOME
$86,250
AVG HOUSEHOLD INCOME
54.4%
WAGE / INCOME GAP [ % ]
45.6¢/ $1
WAGE / INCOME GAP [ $ ]
$17,344
FAMILY INCOME DEFICIT
0.34
INEQUALITY / GINI INDEX
859
TOTAL POPULATION
401
MALE POPULATION
458
FEMALE POPULATION
87.55
MALES / 100 FEMALES
114.21
FEMALES / 100 MALES
14.6
MEDIAN AGE
7.5
AVG FAMILY SIZE
7.5
AVG HOUSEHOLD SIZE
332
LABOR FORCE [ PEOPLE ]
83.8%
PERCENT IN LABOR FORCE
2.1%
UNEMPLOYMENT RATE
Income in Rocky Ridge
Income Overview in Rocky Ridge
Per Capita Income in Rocky Ridge is $13,268, while median incomes of families and households are $86,250 and $86,250 respectively.
| Characteristic | Number | Measure |
| Per Capita Income | 859 | $13,268 |
| Median Family Income | 114 | $86,250 |
| Mean Family Income | 114 | $102,882 |
| Median Household Income | 114 | $86,250 |
| Mean Household Income | 114 | $104,132 |
| Income Deficit | 114 | $17,344 |
| Wage / Income Gap (%) | 859 | 54.38% |
| Wage / Income Gap ($) | 859 | 45.62¢ per $1 |
| Gini / Inequality Index | 859 | 0.34 |
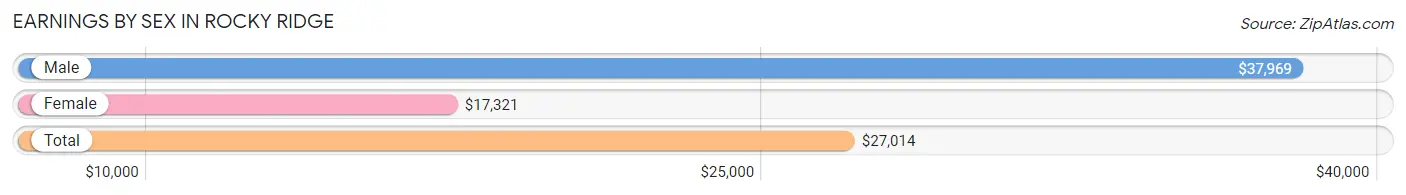
Earnings by Sex in Rocky Ridge
Average Earnings in Rocky Ridge are $27,014, $37,969 for men and $17,321 for women, a difference of 54.4%.
| Sex | Number | Average Earnings |
| Male | 172 (49.0%) | $37,969 |
| Female | 179 (51.0%) | $17,321 |
| Total | 351 (100.0%) | $27,014 |
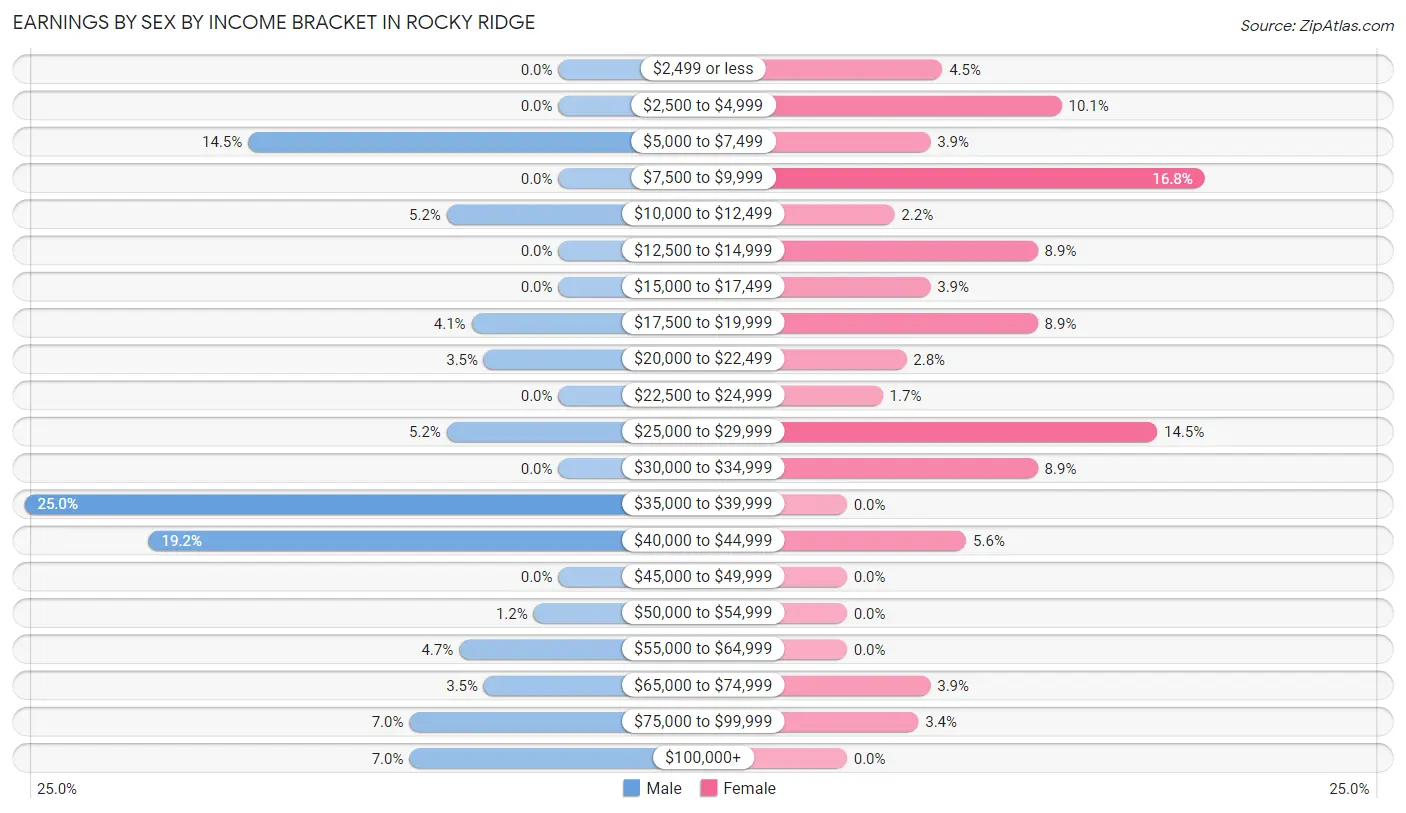
Earnings by Sex by Income Bracket in Rocky Ridge
The most common earnings brackets in Rocky Ridge are $35,000 to $39,999 for men (43 | 25.0%) and $7,500 to $9,999 for women (30 | 16.8%).
| Income | Male | Female |
| $2,499 or less | 0 (0.0%) | 8 (4.5%) |
| $2,500 to $4,999 | 0 (0.0%) | 18 (10.1%) |
| $5,000 to $7,499 | 25 (14.5%) | 7 (3.9%) |
| $7,500 to $9,999 | 0 (0.0%) | 30 (16.8%) |
| $10,000 to $12,499 | 9 (5.2%) | 4 (2.2%) |
| $12,500 to $14,999 | 0 (0.0%) | 16 (8.9%) |
| $15,000 to $17,499 | 0 (0.0%) | 7 (3.9%) |
| $17,500 to $19,999 | 7 (4.1%) | 16 (8.9%) |
| $20,000 to $22,499 | 6 (3.5%) | 5 (2.8%) |
| $22,500 to $24,999 | 0 (0.0%) | 3 (1.7%) |
| $25,000 to $29,999 | 9 (5.2%) | 26 (14.5%) |
| $30,000 to $34,999 | 0 (0.0%) | 16 (8.9%) |
| $35,000 to $39,999 | 43 (25.0%) | 0 (0.0%) |
| $40,000 to $44,999 | 33 (19.2%) | 10 (5.6%) |
| $45,000 to $49,999 | 0 (0.0%) | 0 (0.0%) |
| $50,000 to $54,999 | 2 (1.2%) | 0 (0.0%) |
| $55,000 to $64,999 | 8 (4.6%) | 0 (0.0%) |
| $65,000 to $74,999 | 6 (3.5%) | 7 (3.9%) |
| $75,000 to $99,999 | 12 (7.0%) | 6 (3.4%) |
| $100,000+ | 12 (7.0%) | 0 (0.0%) |
| Total | 172 (100.0%) | 179 (100.0%) |
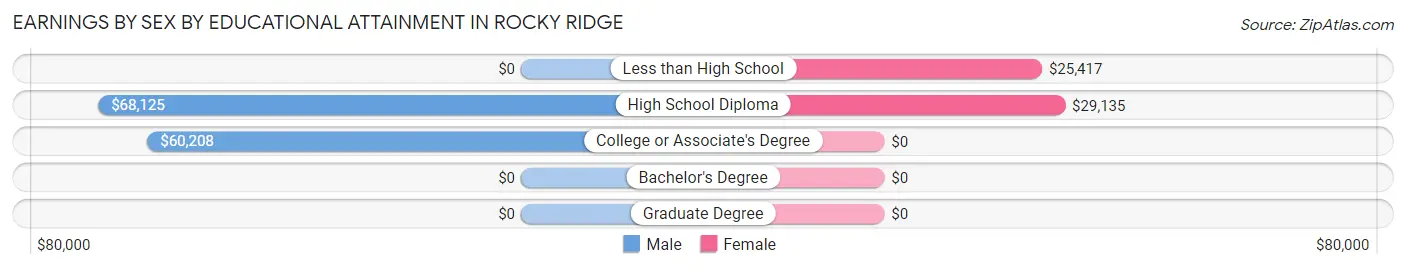
Earnings by Sex by Educational Attainment in Rocky Ridge
Average earnings in Rocky Ridge are $43,182 for men and $26,528 for women, a difference of 38.6%. Men with an educational attainment of high school diploma enjoy the highest average annual earnings of $68,125, while those with college or associate's degree education earn the least with $60,208. Women with an educational attainment of high school diploma earn the most with the average annual earnings of $29,135, while those with less than high school education have the smallest earnings of $25,417.
| Educational Attainment | Male Income | Female Income |
| Less than High School | - | - |
| High School Diploma | $68,125 | $29,135 |
| College or Associate's Degree | $60,208 | $0 |
| Bachelor's Degree | - | - |
| Graduate Degree | - | - |
| Total | $43,182 | $26,528 |
Family Income in Rocky Ridge
Family Income Brackets in Rocky Ridge
According to the Rocky Ridge family income data, there are 33 families falling into the $50,000 to $74,999 income range, which is the most common income bracket and makes up 28.9% of all families.
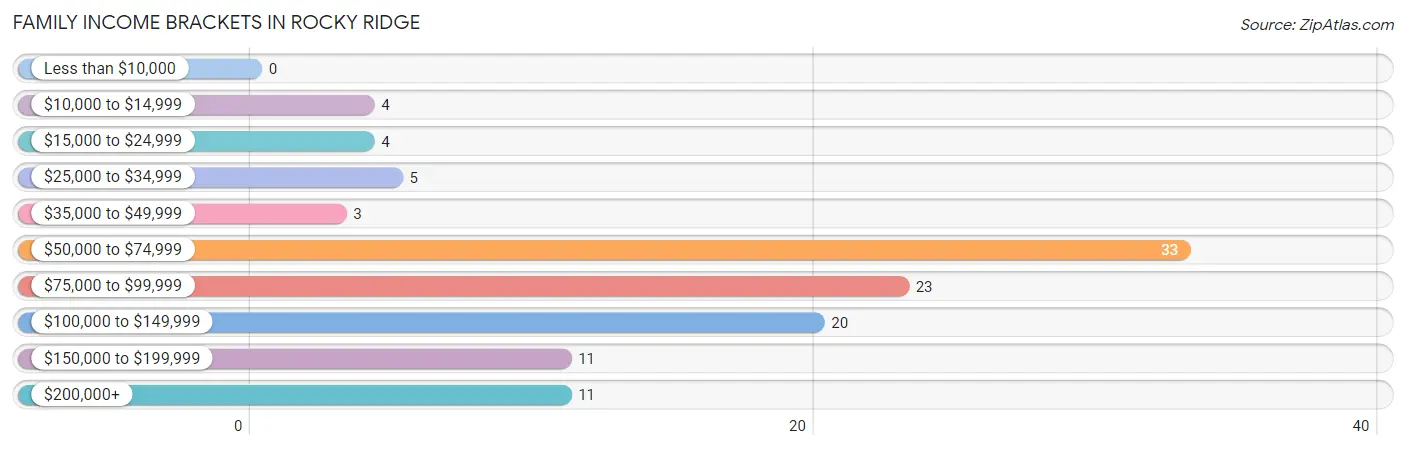
| Income Bracket | # Families | % Families |
| Less than $10,000 | 0 | 0.0% |
| $10,000 to $14,999 | 4 | 3.5% |
| $15,000 to $24,999 | 4 | 3.5% |
| $25,000 to $34,999 | 5 | 4.4% |
| $35,000 to $49,999 | 3 | 2.6% |
| $50,000 to $74,999 | 33 | 28.9% |
| $75,000 to $99,999 | 23 | 20.2% |
| $100,000 to $149,999 | 20 | 17.5% |
| $150,000 to $199,999 | 11 | 9.6% |
| $200,000+ | 11 | 9.6% |
Family Income by Famaliy Size in Rocky Ridge
7+ person families (57 | 50.0%) account for the highest median family income in Rocky Ridge with $86,875 per family, while 7+ person families (57 | 50.0%) have the highest median income of $12,411 per family member.
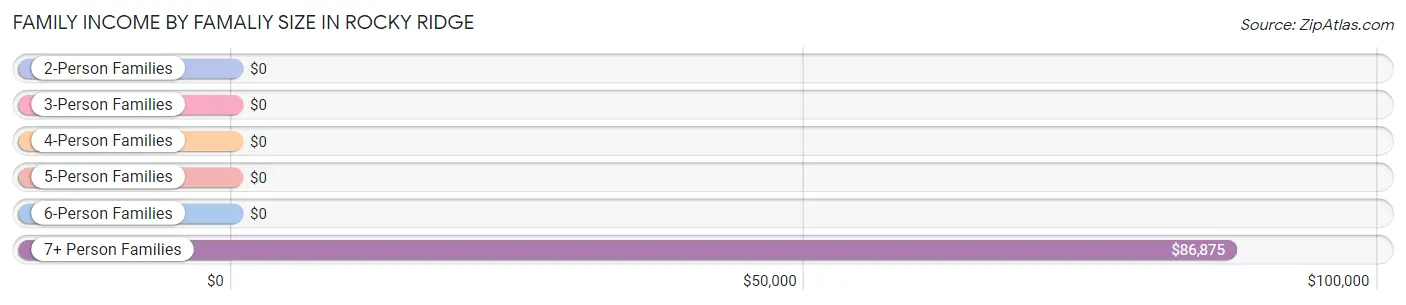
| Income Bracket | # Families | Median Income |
| 2-Person Families | 3 (2.6%) | $0 |
| 3-Person Families | 5 (4.4%) | $0 |
| 4-Person Families | 33 (28.9%) | $0 |
| 5-Person Families | 13 (11.4%) | $0 |
| 6-Person Families | 3 (2.6%) | $0 |
| 7+ Person Families | 57 (50.0%) | $86,875 |
| Total | 114 (100.0%) | $86,250 |
Family Income by Number of Earners in Rocky Ridge
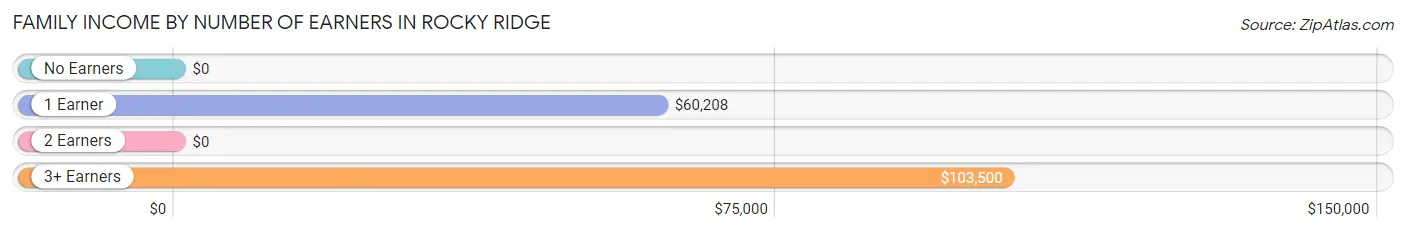
| Number of Earners | # Families | Median Income |
| No Earners | 0 (0.0%) | $0 |
| 1 Earner | 32 (28.1%) | $60,208 |
| 2 Earners | 14 (12.3%) | $0 |
| 3+ Earners | 68 (59.7%) | $103,500 |
| Total | 114 (100.0%) | $86,250 |
Household Income in Rocky Ridge
Household Income Brackets in Rocky Ridge
With 37 households falling in the category, the $50,000 to $74,999 income range is the most frequent in Rocky Ridge, accounting for 32.5% of all households.
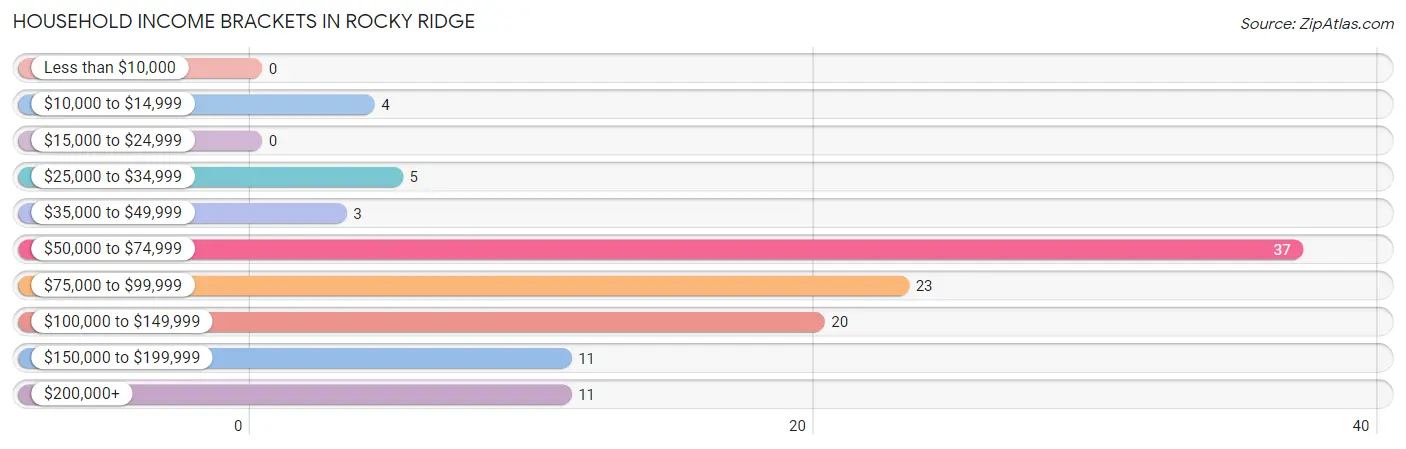
| Income Bracket | # Households | % Households |
| Less than $10,000 | 0 | 0.0% |
| $10,000 to $14,999 | 4 | 3.5% |
| $15,000 to $24,999 | 0 | 0.0% |
| $25,000 to $34,999 | 5 | 4.4% |
| $35,000 to $49,999 | 3 | 2.6% |
| $50,000 to $74,999 | 37 | 32.5% |
| $75,000 to $99,999 | 23 | 20.2% |
| $100,000 to $149,999 | 20 | 17.5% |
| $150,000 to $199,999 | 11 | 9.6% |
| $200,000+ | 11 | 9.6% |
Household Income by Householder Age in Rocky Ridge
The median household income in Rocky Ridge is $86,250, with the highest median household income of $89,250 found in the 45 to 64 years age bracket for the primary householder. A total of 35 households (30.7%) fall into this category. Meanwhile, the 15 to 24 years age bracket for the primary householder has the lowest median household income of $0, with 12 households (10.5%) in this group.
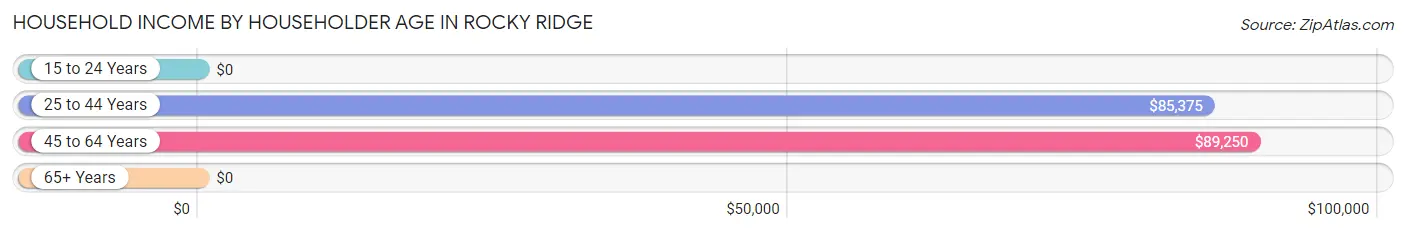
| Income Bracket | # Households | Median Income |
| 15 to 24 Years | 12 (10.5%) | $0 |
| 25 to 44 Years | 55 (48.2%) | $85,375 |
| 45 to 64 Years | 35 (30.7%) | $89,250 |
| 65+ Years | 12 (10.5%) | $0 |
| Total | 114 (100.0%) | $86,250 |
Poverty in Rocky Ridge
Income Below Poverty by Sex and Age in Rocky Ridge
With 13.2% poverty level for males and 19.9% for females among the residents of Rocky Ridge, 5 year old males and 15 year old females are the most vulnerable to poverty, with 3 males (100.0%) and 9 females (47.4%) in their respective age groups living below the poverty level.
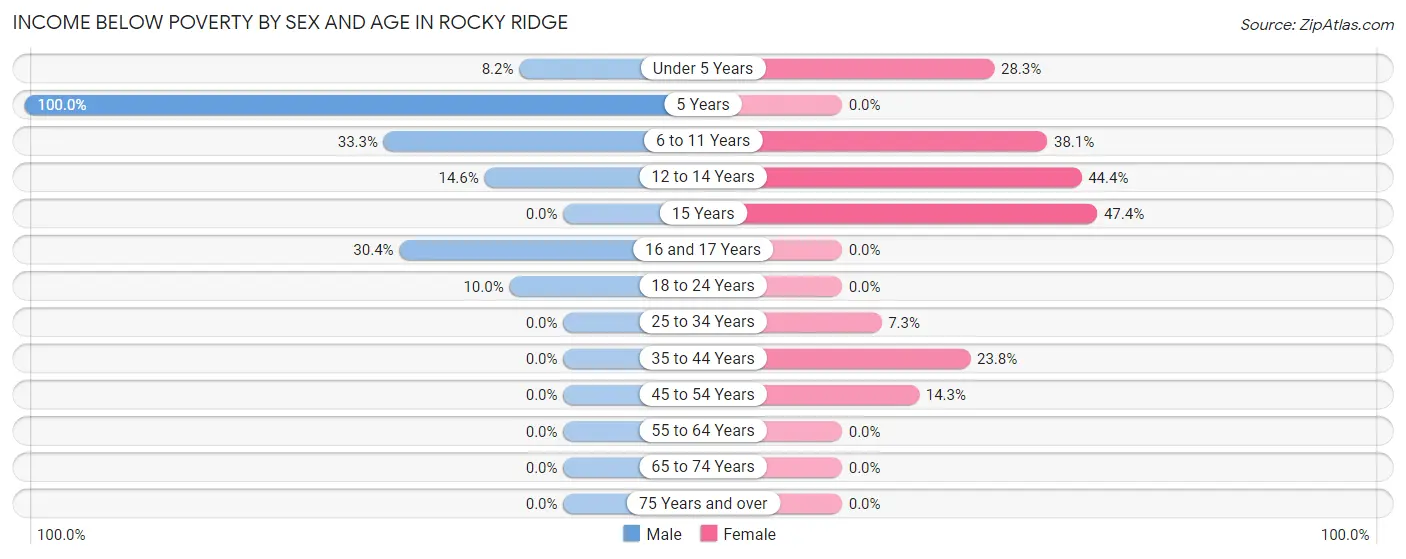
| Age Bracket | Male | Female |
| Under 5 Years | 9 (8.2%) | 26 (28.3%) |
| 5 Years | 3 (100.0%) | 0 (0.0%) |
| 6 to 11 Years | 22 (33.3%) | 24 (38.1%) |
| 12 to 14 Years | 6 (14.6%) | 16 (44.4%) |
| 15 Years | 0 (0.0%) | 9 (47.4%) |
| 16 and 17 Years | 7 (30.4%) | 0 (0.0%) |
| 18 to 24 Years | 6 (10.0%) | 0 (0.0%) |
| 25 to 34 Years | 0 (0.0%) | 3 (7.3%) |
| 35 to 44 Years | 0 (0.0%) | 10 (23.8%) |
| 45 to 54 Years | 0 (0.0%) | 3 (14.3%) |
| 55 to 64 Years | 0 (0.0%) | 0 (0.0%) |
| 65 to 74 Years | 0 (0.0%) | 0 (0.0%) |
| 75 Years and over | 0 (0.0%) | 0 (0.0%) |
| Total | 53 (13.2%) | 91 (19.9%) |
Income Above Poverty by Sex and Age in Rocky Ridge
According to the poverty statistics in Rocky Ridge, males aged 15 years and females aged 5 years are the age groups that are most secure financially, with 100.0% of males and 100.0% of females in these age groups living above the poverty line.
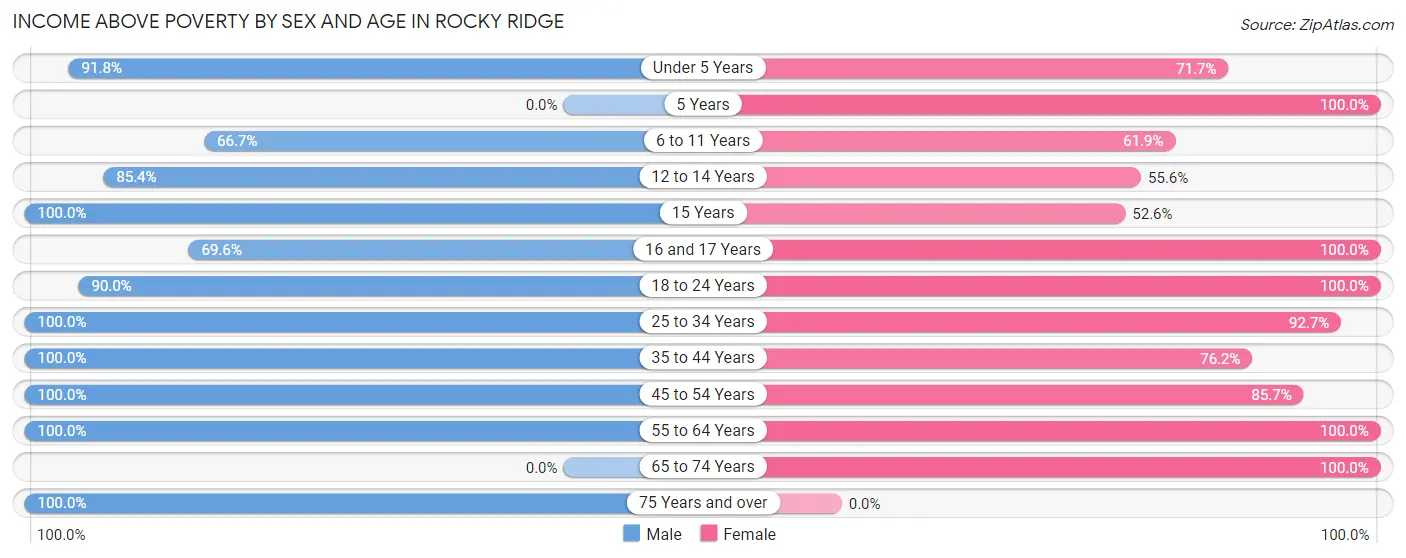
| Age Bracket | Male | Female |
| Under 5 Years | 101 (91.8%) | 66 (71.7%) |
| 5 Years | 0 (0.0%) | 31 (100.0%) |
| 6 to 11 Years | 44 (66.7%) | 39 (61.9%) |
| 12 to 14 Years | 35 (85.4%) | 20 (55.6%) |
| 15 Years | 2 (100.0%) | 10 (52.6%) |
| 16 and 17 Years | 16 (69.6%) | 9 (100.0%) |
| 18 to 24 Years | 54 (90.0%) | 81 (100.0%) |
| 25 to 34 Years | 53 (100.0%) | 38 (92.7%) |
| 35 to 44 Years | 24 (100.0%) | 32 (76.2%) |
| 45 to 54 Years | 7 (100.0%) | 18 (85.7%) |
| 55 to 64 Years | 5 (100.0%) | 11 (100.0%) |
| 65 to 74 Years | 0 (0.0%) | 12 (100.0%) |
| 75 Years and over | 7 (100.0%) | 0 (0.0%) |
| Total | 348 (86.8%) | 367 (80.1%) |
Income Below Poverty Among Married-Couple Families in Rocky Ridge
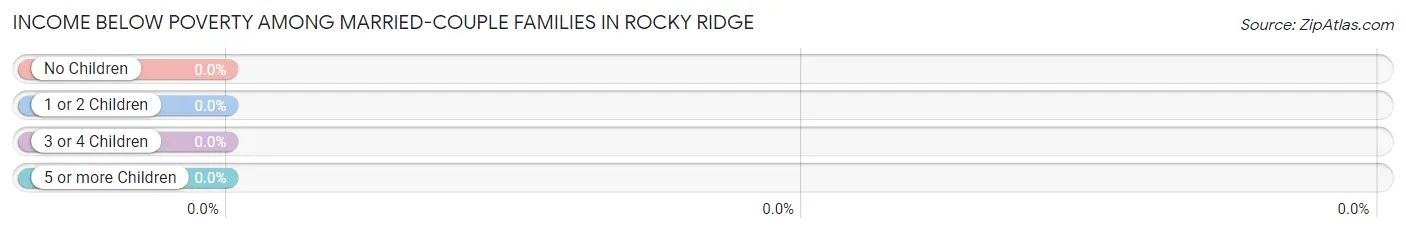
| Children | Above Poverty | Below Poverty |
| No Children | 12 (100.0%) | 0 (0.0%) |
| 1 or 2 Children | 12 (100.0%) | 0 (0.0%) |
| 3 or 4 Children | 8 (100.0%) | 0 (0.0%) |
| 5 or more Children | 33 (100.0%) | 0 (0.0%) |
| Total | 65 (100.0%) | 0 (0.0%) |
Income Below Poverty Among Single-Parent Households in Rocky Ridge
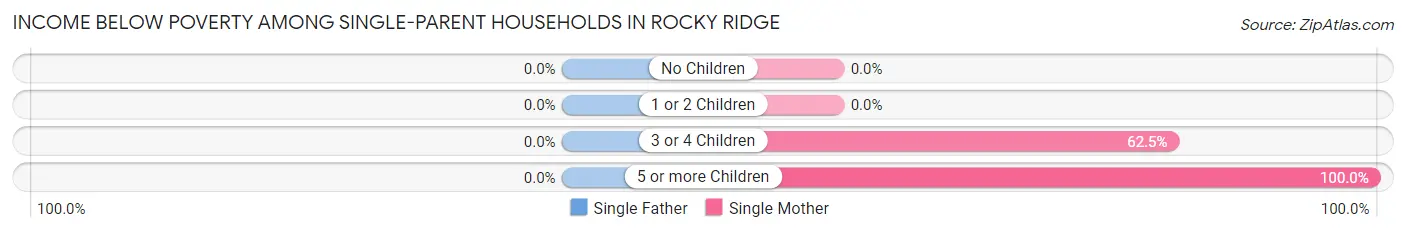
| Children | Single Father | Single Mother |
| No Children | 0 (0.0%) | 0 (0.0%) |
| 1 or 2 Children | 0 (0.0%) | 0 (0.0%) |
| 3 or 4 Children | 0 (0.0%) | 5 (62.5%) |
| 5 or more Children | 0 (0.0%) | 11 (100.0%) |
| Total | 0 (0.0%) | 16 (36.4%) |
Income Below Poverty Among Married-Couple vs Single-Parent Households in Rocky Ridge
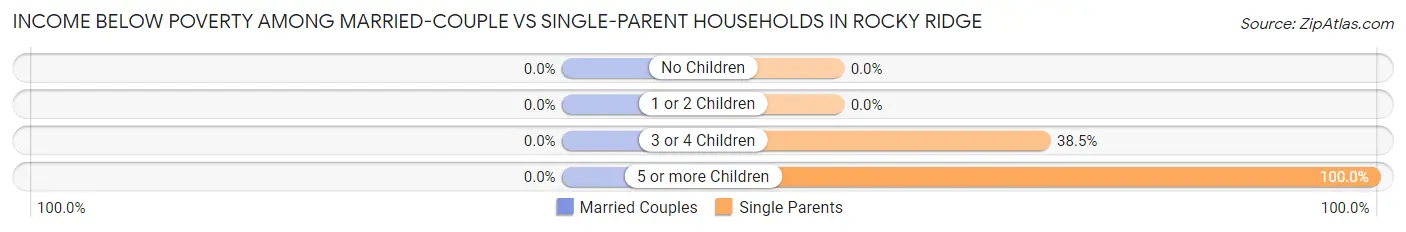
| Children | Married-Couple Families | Single-Parent Households |
| No Children | 0 (0.0%) | 0 (0.0%) |
| 1 or 2 Children | 0 (0.0%) | 0 (0.0%) |
| 3 or 4 Children | 0 (0.0%) | 5 (38.5%) |
| 5 or more Children | 0 (0.0%) | 11 (100.0%) |
| Total | 0 (0.0%) | 16 (32.7%) |
Race in Rocky Ridge
The most populous races in Rocky Ridge are White / Caucasian (859 | 100.0%), and Hispanic or Latino (25 | 2.9%).
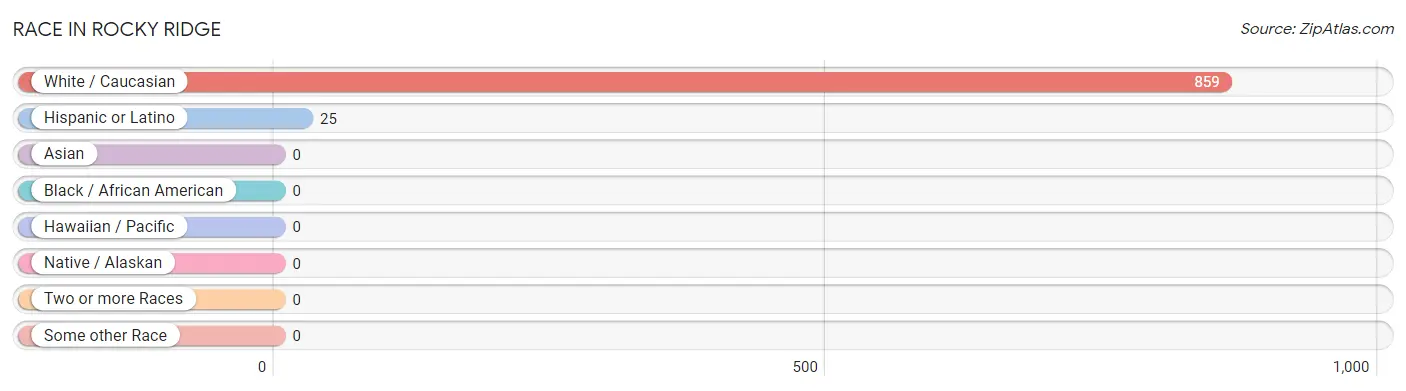
| Race | # Population | % Population |
| Asian | 0 | 0.0% |
| Black / African American | 0 | 0.0% |
| Hawaiian / Pacific | 0 | 0.0% |
| Hispanic or Latino | 25 | 2.9% |
| Native / Alaskan | 0 | 0.0% |
| White / Caucasian | 859 | 100.0% |
| Two or more Races | 0 | 0.0% |
| Some other Race | 0 | 0.0% |
| Total | 859 | 100.0% |
Ancestry in Rocky Ridge
The most populous ancestries reported in Rocky Ridge are English (532 | 61.9%), German (187 | 21.8%), Norwegian (48 | 5.6%), Dutch (43 | 5.0%), and Scandinavian (41 | 4.8%), together accounting for 99.1% of all Rocky Ridge residents.
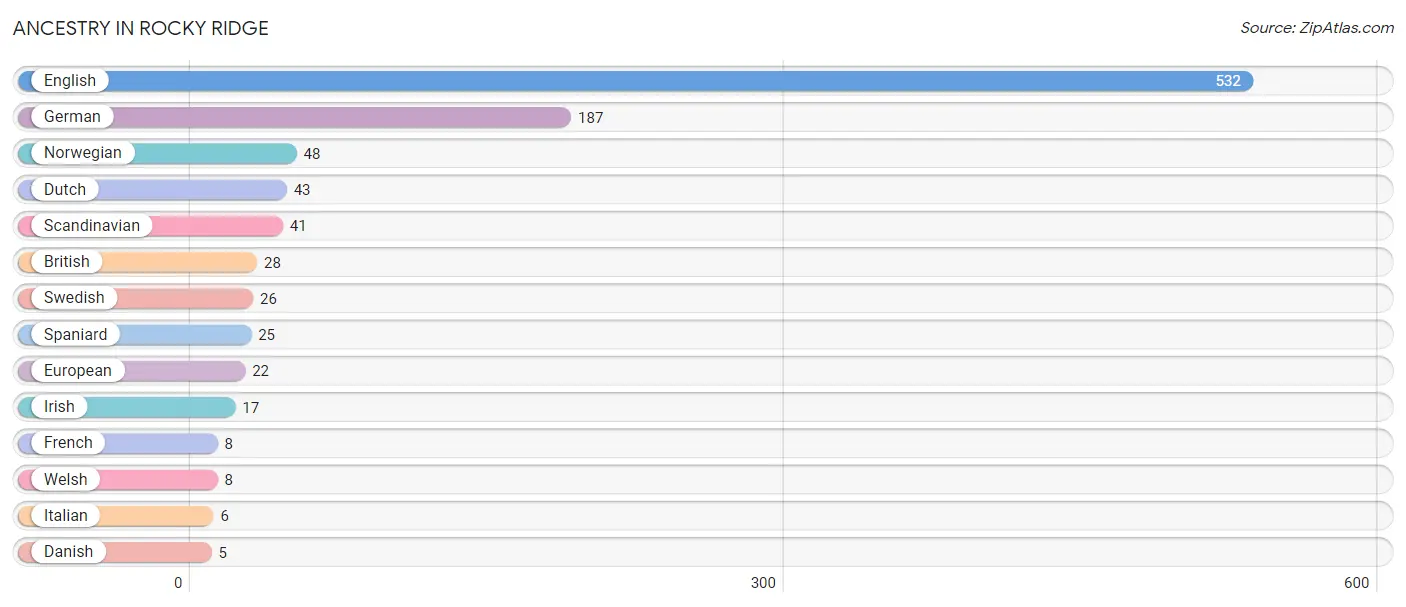
| Ancestry | # Population | % Population |
| British | 28 | 3.3% |
| Danish | 5 | 0.6% |
| Dutch | 43 | 5.0% |
| English | 532 | 61.9% |
| European | 22 | 2.6% |
| French | 8 | 0.9% |
| German | 187 | 21.8% |
| Irish | 17 | 2.0% |
| Italian | 6 | 0.7% |
| Norwegian | 48 | 5.6% |
| Scandinavian | 41 | 4.8% |
| Spaniard | 25 | 2.9% |
| Swedish | 26 | 3.0% |
| Welsh | 8 | 0.9% | View All 14 Rows |
Immigrants in Rocky Ridge
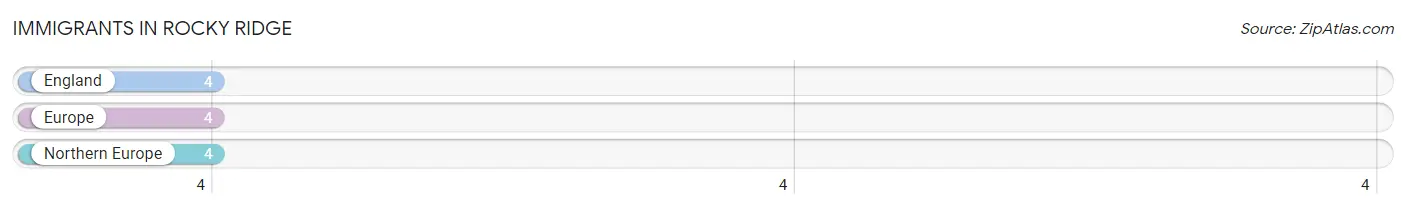
The most numerous immigrant groups reported in Rocky Ridge came from England (4 | 0.5%), Europe (4 | 0.5%), and Northern Europe (4 | 0.5%), together accounting for 1.4% of all Rocky Ridge residents.
| Immigration Origin | # Population | % Population |
| England | 4 | 0.5% |
| Europe | 4 | 0.5% |
| Northern Europe | 4 | 0.5% | View All 3 Rows |
Sex and Age in Rocky Ridge
Sex and Age in Rocky Ridge
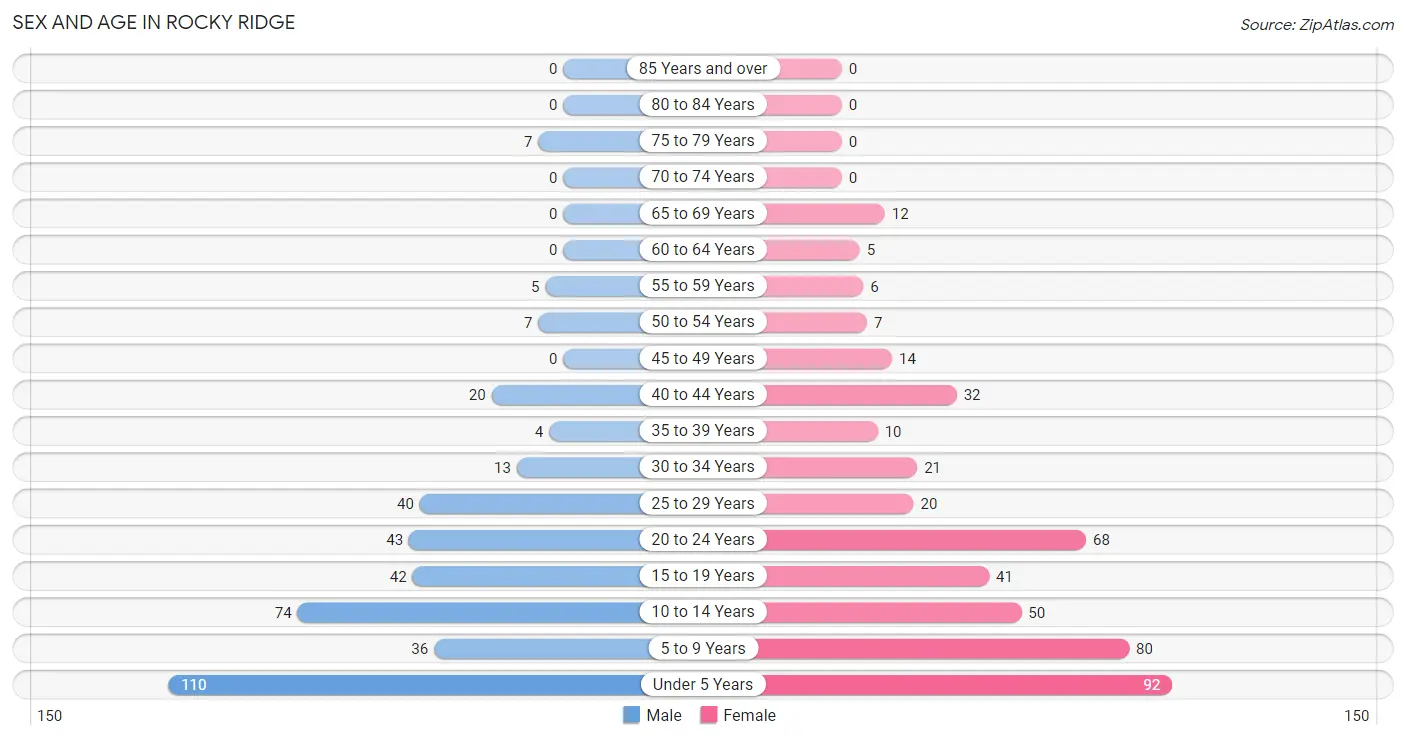
The most populous age groups in Rocky Ridge are Under 5 Years (110 | 27.4%) for men and Under 5 Years (92 | 20.1%) for women.
| Age Bracket | Male | Female |
| Under 5 Years | 110 (27.4%) | 92 (20.1%) |
| 5 to 9 Years | 36 (9.0%) | 80 (17.5%) |
| 10 to 14 Years | 74 (18.4%) | 50 (10.9%) |
| 15 to 19 Years | 42 (10.5%) | 41 (8.9%) |
| 20 to 24 Years | 43 (10.7%) | 68 (14.8%) |
| 25 to 29 Years | 40 (10.0%) | 20 (4.4%) |
| 30 to 34 Years | 13 (3.2%) | 21 (4.6%) |
| 35 to 39 Years | 4 (1.0%) | 10 (2.2%) |
| 40 to 44 Years | 20 (5.0%) | 32 (7.0%) |
| 45 to 49 Years | 0 (0.0%) | 14 (3.1%) |
| 50 to 54 Years | 7 (1.8%) | 7 (1.5%) |
| 55 to 59 Years | 5 (1.3%) | 6 (1.3%) |
| 60 to 64 Years | 0 (0.0%) | 5 (1.1%) |
| 65 to 69 Years | 0 (0.0%) | 12 (2.6%) |
| 70 to 74 Years | 0 (0.0%) | 0 (0.0%) |
| 75 to 79 Years | 7 (1.8%) | 0 (0.0%) |
| 80 to 84 Years | 0 (0.0%) | 0 (0.0%) |
| 85 Years and over | 0 (0.0%) | 0 (0.0%) |
| Total | 401 (100.0%) | 458 (100.0%) |
Families and Households in Rocky Ridge
Median Family Size in Rocky Ridge
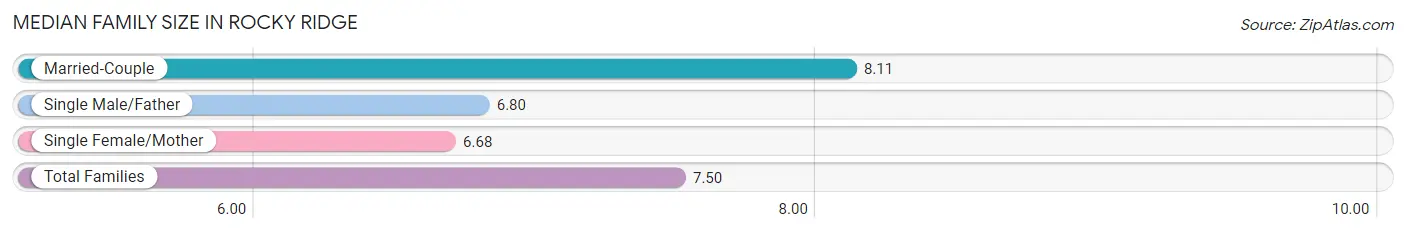
The median family size in Rocky Ridge is 7.50 persons per family, with married-couple families (65 | 57.0%) accounting for the largest median family size of 8.11 persons per family. On the other hand, single female/mother families (44 | 38.6%) represent the smallest median family size with 6.68 persons per family.
| Family Type | # Families | Family Size |
| Married-Couple | 65 (57.0%) | 8.11 |
| Single Male/Father | 5 (4.4%) | 6.80 |
| Single Female/Mother | 44 (38.6%) | 6.68 |
| Total Families | 114 (100.0%) | 7.50 |
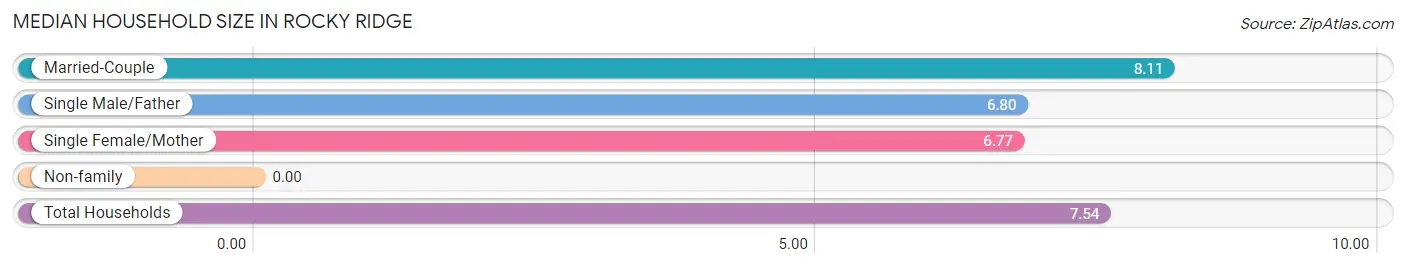
Median Household Size in Rocky Ridge
| Household Type | # Households | Household Size |
| Married-Couple | 65 (57.0%) | 8.11 |
| Single Male/Father | 5 (4.4%) | 6.80 |
| Single Female/Mother | 44 (38.6%) | 6.77 |
| Non-family | 0 (0.0%) | - |
| Total Households | 114 (100.0%) | 7.54 |
Household Size by Marriage Status in Rocky Ridge
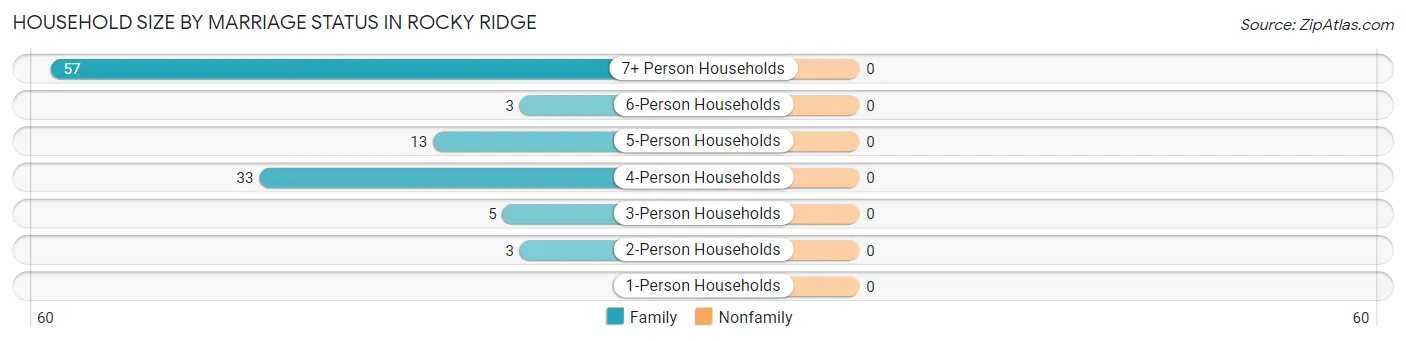
| Household Size | Family Households | Nonfamily Households |
| 1-Person Households | - | 0 (0.0%) |
| 2-Person Households | 3 (2.6%) | 0 (0.0%) |
| 3-Person Households | 5 (4.4%) | 0 (0.0%) |
| 4-Person Households | 33 (28.9%) | 0 (0.0%) |
| 5-Person Households | 13 (11.4%) | 0 (0.0%) |
| 6-Person Households | 3 (2.6%) | 0 (0.0%) |
| 7+ Person Households | 57 (50.0%) | 0 (0.0%) |
| Total | 114 (100.0%) | 0 (0.0%) |
Female Fertility in Rocky Ridge
Fertility by Age in Rocky Ridge
Average fertility rate in Rocky Ridge is 49.0 births per 1,000 women. Women in the age bracket of 20 to 34 years have the highest fertility rate with 92.0 births per 1,000 women. Women in the age bracket of 20 to 34 years acount for 100.0% of all women with births.
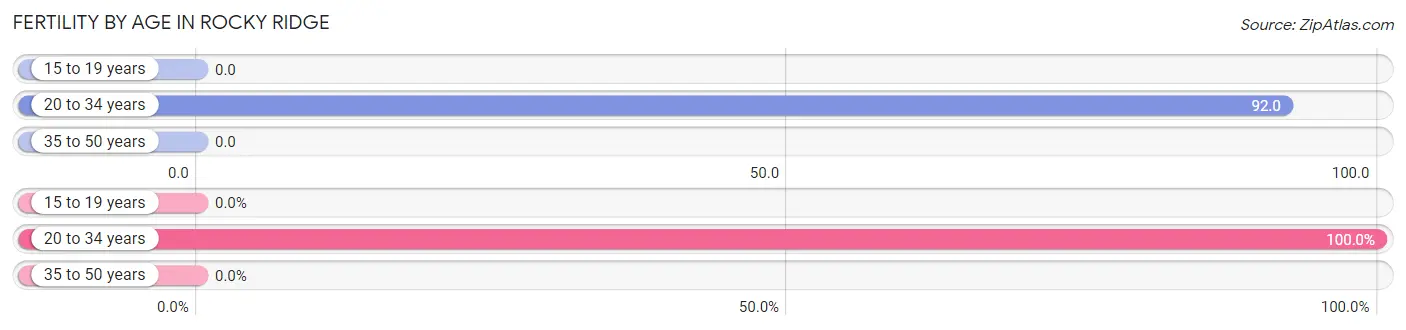
| Age Bracket | Women with Births | Births / 1,000 Women |
| 15 to 19 years | 0 (0.0%) | 0.0 |
| 20 to 34 years | 10 (100.0%) | 92.0 |
| 35 to 50 years | 0 (0.0%) | 0.0 |
| Total | 10 (100.0%) | 49.0 |
Fertility by Age by Marriage Status in Rocky Ridge
60.0% of women with births (10) in Rocky Ridge are married. The highest percentage of unmarried women with births falls into 20 to 34 years age bracket with 40.0% of them unmarried at the time of birth, while the lowest percentage of unmarried women with births belong to 20 to 34 years age bracket with 40.0% of them unmarried.
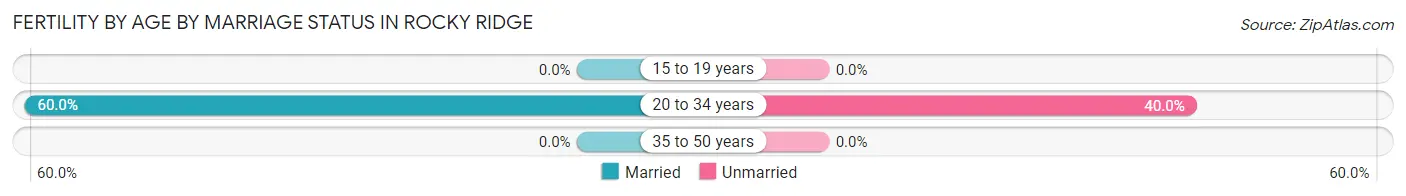
| Age Bracket | Married | Unmarried |
| 15 to 19 years | 0 (0.0%) | 0 (0.0%) |
| 20 to 34 years | 6 (60.0%) | 4 (40.0%) |
| 35 to 50 years | 0 (0.0%) | 0 (0.0%) |
| Total | 6 (60.0%) | 4 (40.0%) |
Fertility by Education in Rocky Ridge
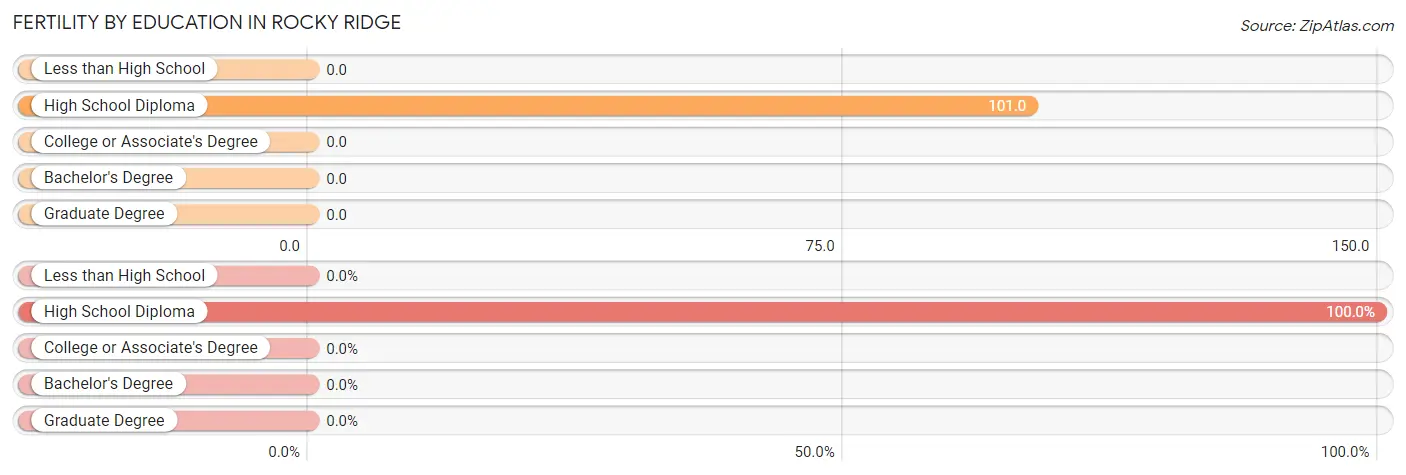
| Educational Attainment | Women with Births | Births / 1,000 Women |
| Less than High School | 0 (0.0%) | 0.0 |
| High School Diploma | 10 (100.0%) | 101.0 |
| College or Associate's Degree | 0 (0.0%) | 0.0 |
| Bachelor's Degree | 0 (0.0%) | 0.0 |
| Graduate Degree | 0 (0.0%) | 0.0 |
| Total | 10 (100.0%) | 49.0 |
Fertility by Education by Marriage Status in Rocky Ridge
40.0% of women with births in Rocky Ridge are unmarried. Women with the educational attainment of high school diploma are most likely to be married with 60.0% of them married at childbirth, while women with the educational attainment of high school diploma are least likely to be married with 40.0% of them unmarried at childbirth.
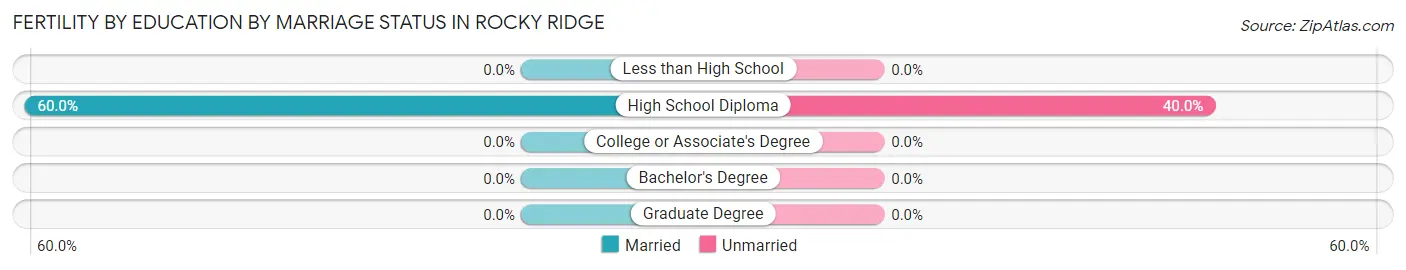
| Educational Attainment | Married | Unmarried |
| Less than High School | 0 (0.0%) | 0 (0.0%) |
| High School Diploma | 6 (60.0%) | 4 (40.0%) |
| College or Associate's Degree | 0 (0.0%) | 0 (0.0%) |
| Bachelor's Degree | 0 (0.0%) | 0 (0.0%) |
| Graduate Degree | 0 (0.0%) | 0 (0.0%) |
| Total | 6 (60.0%) | 4 (40.0%) |
Employment Characteristics in Rocky Ridge
Employment by Class of Employer in Rocky Ridge
Among the 325 employed individuals in Rocky Ridge, private company employees (289 | 88.9%), self-employed (not incorporated) (22 | 6.8%), and state government employees (8 | 2.5%) make up the most common classes of employment.
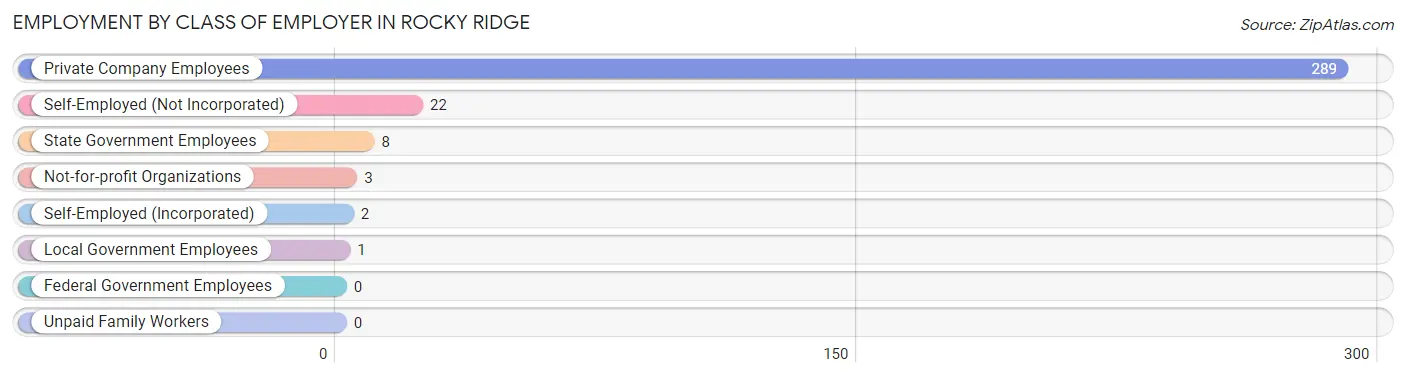
| Employer Class | # Employees | % Employees |
| Private Company Employees | 289 | 88.9% |
| Self-Employed (Incorporated) | 2 | 0.6% |
| Self-Employed (Not Incorporated) | 22 | 6.8% |
| Not-for-profit Organizations | 3 | 0.9% |
| Local Government Employees | 1 | 0.3% |
| State Government Employees | 8 | 2.5% |
| Federal Government Employees | 0 | 0.0% |
| Unpaid Family Workers | 0 | 0.0% |
| Total | 325 | 100.0% |
Employment Status by Age in Rocky Ridge
According to the labor force statistics for Rocky Ridge, out of the total population over 16 years of age (396), 83.8% or 332 individuals are in the labor force, with 2.1% or 7 of them unemployed. The age group with the highest labor force participation rate is 30 to 34 years, with 100.0% or 34 individuals in the labor force. Within the labor force, the 30 to 34 years age range has the highest percentage of unemployed individuals, with 11.8% or 4 of them being unemployed.
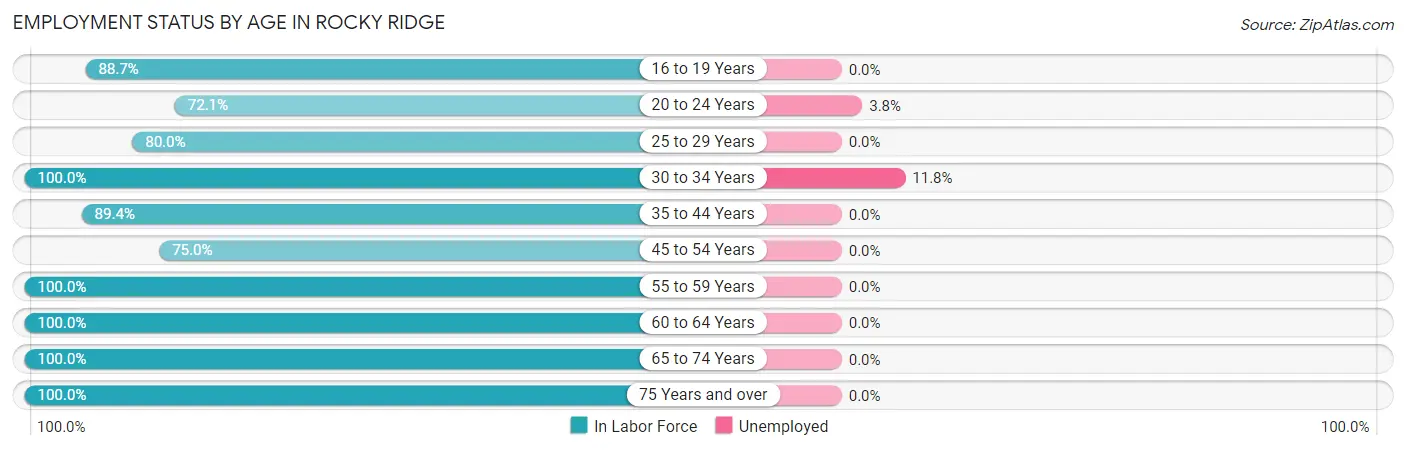
| Age Bracket | In Labor Force | Unemployed |
| 16 to 19 Years | 55 (88.7%) | 0 (0.0%) |
| 20 to 24 Years | 80 (72.1%) | 3 (3.8%) |
| 25 to 29 Years | 48 (80.0%) | 0 (0.0%) |
| 30 to 34 Years | 34 (100.0%) | 4 (11.8%) |
| 35 to 44 Years | 59 (89.4%) | 0 (0.0%) |
| 45 to 54 Years | 21 (75.0%) | 0 (0.0%) |
| 55 to 59 Years | 11 (100.0%) | 0 (0.0%) |
| 60 to 64 Years | 5 (100.0%) | 0 (0.0%) |
| 65 to 74 Years | 12 (100.0%) | 0 (0.0%) |
| 75 Years and over | 7 (100.0%) | 0 (0.0%) |
| Total | 332 (83.8%) | 7 (2.1%) |
Employment Status by Educational Attainment in Rocky Ridge
According to labor force statistics for Rocky Ridge, 87.3% of individuals (178) out of the total population between 25 and 64 years of age (204) are in the labor force, with 2.2% or 4 of them being unemployed. The group with the highest labor force participation rate are those with the educational attainment of less than high school, with 100.0% or 28 individuals in the labor force. Within the labor force, individuals with college / associate degree education have the highest percentage of unemployment, with 7.1% or 4 of them being unemployed.
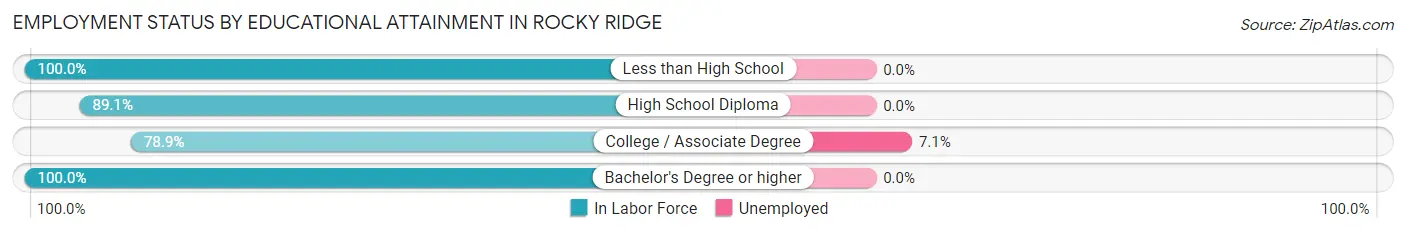
| Educational Attainment | In Labor Force | Unemployed |
| Less than High School | 28 (100.0%) | 0 (0.0%) |
| High School Diploma | 90 (89.1%) | 0 (0.0%) |
| College / Associate Degree | 56 (78.9%) | 5 (7.1%) |
| Bachelor's Degree or higher | 4 (100.0%) | 0 (0.0%) |
| Total | 178 (87.3%) | 4 (2.2%) |
Employment Occupations by Sex in Rocky Ridge
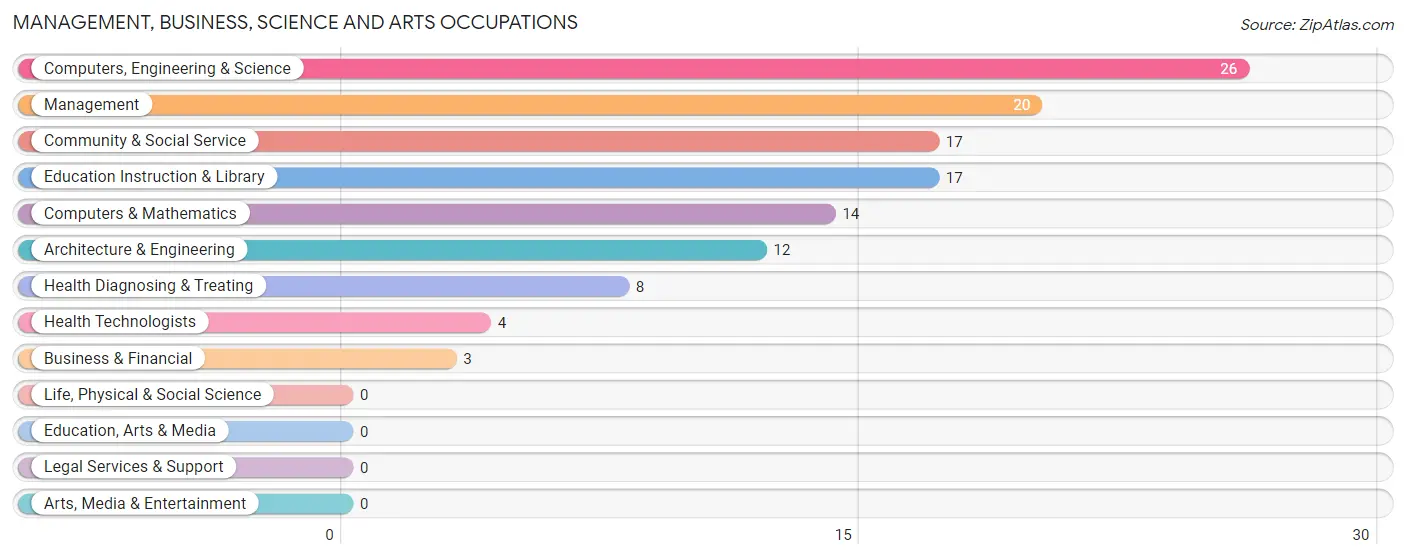
Management, Business, Science and Arts Occupations
The most common Management, Business, Science and Arts occupations in Rocky Ridge are Computers, Engineering & Science (26 | 8.0%), Management (20 | 6.1%), Community & Social Service (17 | 5.2%), Education Instruction & Library (17 | 5.2%), and Computers & Mathematics (14 | 4.3%).
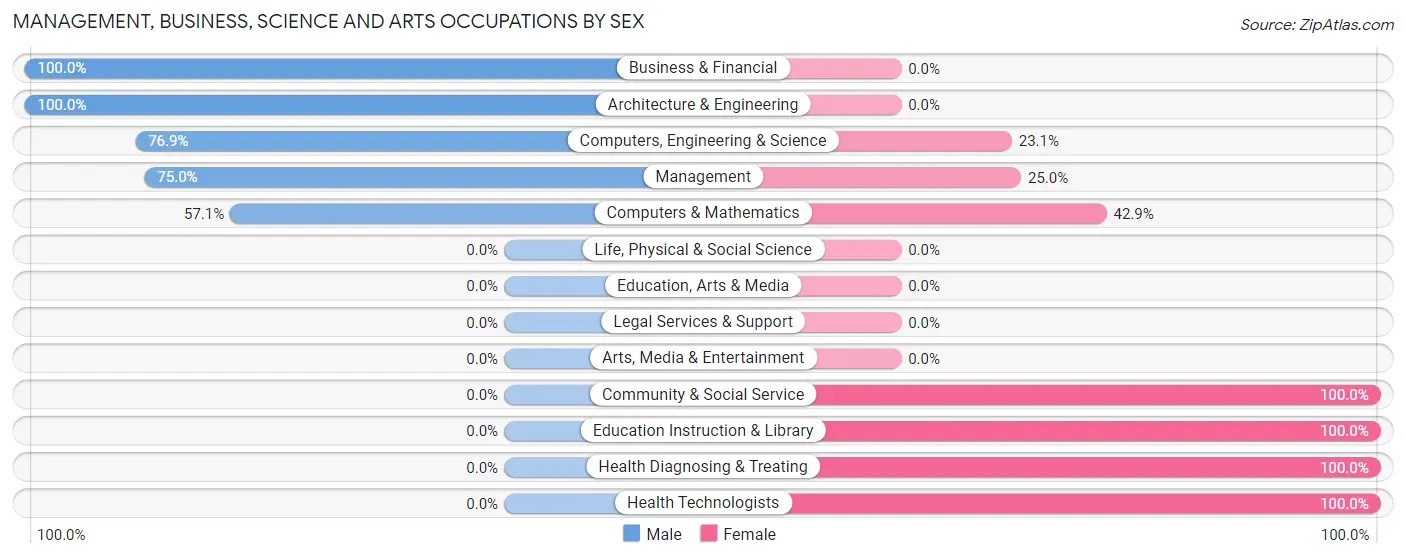
Management, Business, Science and Arts Occupations by Sex
Within the Management, Business, Science and Arts occupations in Rocky Ridge, the most male-oriented occupations are Business & Financial (100.0%), Architecture & Engineering (100.0%), and Computers, Engineering & Science (76.9%), while the most female-oriented occupations are Community & Social Service (100.0%), Education Instruction & Library (100.0%), and Health Diagnosing & Treating (100.0%).
| Occupation | Male | Female |
| Management | 15 (75.0%) | 5 (25.0%) |
| Business & Financial | 3 (100.0%) | 0 (0.0%) |
| Computers, Engineering & Science | 20 (76.9%) | 6 (23.1%) |
| Computers & Mathematics | 8 (57.1%) | 6 (42.9%) |
| Architecture & Engineering | 12 (100.0%) | 0 (0.0%) |
| Life, Physical & Social Science | 0 (0.0%) | 0 (0.0%) |
| Community & Social Service | 0 (0.0%) | 17 (100.0%) |
| Education, Arts & Media | 0 (0.0%) | 0 (0.0%) |
| Legal Services & Support | 0 (0.0%) | 0 (0.0%) |
| Education Instruction & Library | 0 (0.0%) | 17 (100.0%) |
| Arts, Media & Entertainment | 0 (0.0%) | 0 (0.0%) |
| Health Diagnosing & Treating | 0 (0.0%) | 8 (100.0%) |
| Health Technologists | 0 (0.0%) | 4 (100.0%) |
| Total (Category) | 38 (51.3%) | 36 (48.6%) |
| Total (Overall) | 169 (52.0%) | 156 (48.0%) |
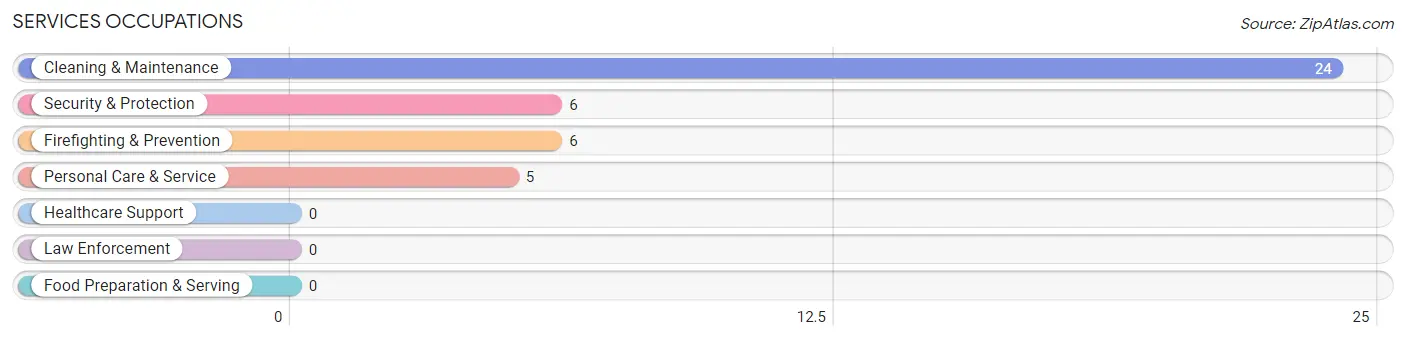
Services Occupations
The most common Services occupations in Rocky Ridge are Cleaning & Maintenance (24 | 7.4%), Security & Protection (6 | 1.8%), Firefighting & Prevention (6 | 1.8%), and Personal Care & Service (5 | 1.5%).
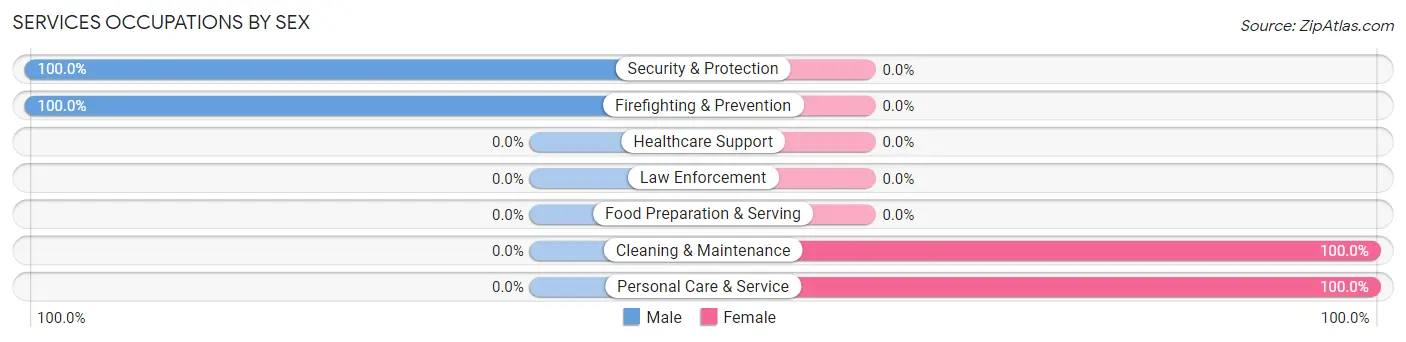
Services Occupations by Sex
Within the Services occupations in Rocky Ridge, the most male-oriented occupations are Security & Protection (100.0%), and Firefighting & Prevention (100.0%), while the most female-oriented occupations are Cleaning & Maintenance (100.0%), and Personal Care & Service (100.0%).
| Occupation | Male | Female |
| Healthcare Support | 0 (0.0%) | 0 (0.0%) |
| Security & Protection | 6 (100.0%) | 0 (0.0%) |
| Firefighting & Prevention | 6 (100.0%) | 0 (0.0%) |
| Law Enforcement | 0 (0.0%) | 0 (0.0%) |
| Food Preparation & Serving | 0 (0.0%) | 0 (0.0%) |
| Cleaning & Maintenance | 0 (0.0%) | 24 (100.0%) |
| Personal Care & Service | 0 (0.0%) | 5 (100.0%) |
| Total (Category) | 6 (17.1%) | 29 (82.9%) |
| Total (Overall) | 169 (52.0%) | 156 (48.0%) |
Sales and Office Occupations
The most common Sales and Office occupations in Rocky Ridge are Office & Administration (20 | 6.1%), and Sales & Related (10 | 3.1%).
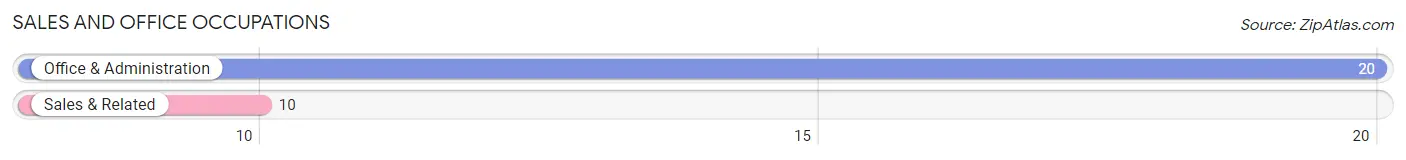
Sales and Office Occupations by Sex
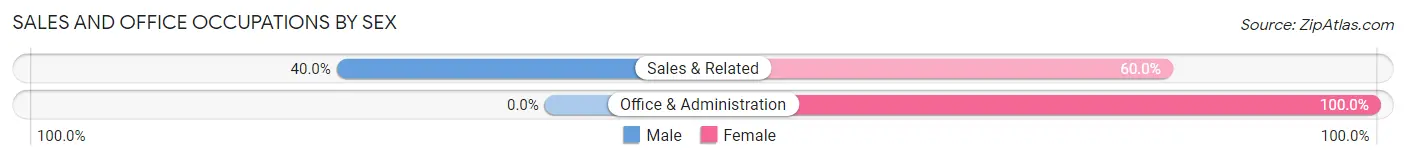
| Occupation | Male | Female |
| Sales & Related | 4 (40.0%) | 6 (60.0%) |
| Office & Administration | 0 (0.0%) | 20 (100.0%) |
| Total (Category) | 4 (13.3%) | 26 (86.7%) |
| Total (Overall) | 169 (52.0%) | 156 (48.0%) |
Natural Resources, Construction and Maintenance Occupations
The most common Natural Resources, Construction and Maintenance occupations in Rocky Ridge are , and Construction & Extraction (34 | 10.5%).
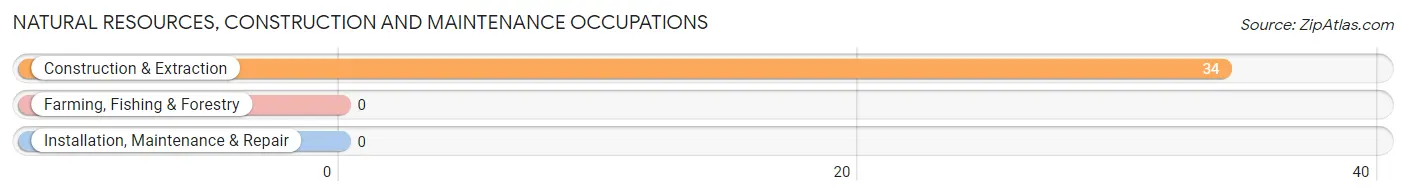
Natural Resources, Construction and Maintenance Occupations by Sex
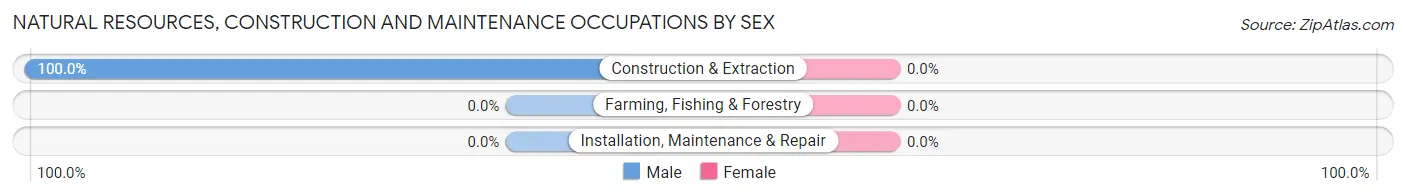
| Occupation | Male | Female |
| Farming, Fishing & Forestry | 0 (0.0%) | 0 (0.0%) |
| Construction & Extraction | 34 (100.0%) | 0 (0.0%) |
| Installation, Maintenance & Repair | 0 (0.0%) | 0 (0.0%) |
| Total (Category) | 34 (100.0%) | 0 (0.0%) |
| Total (Overall) | 169 (52.0%) | 156 (48.0%) |
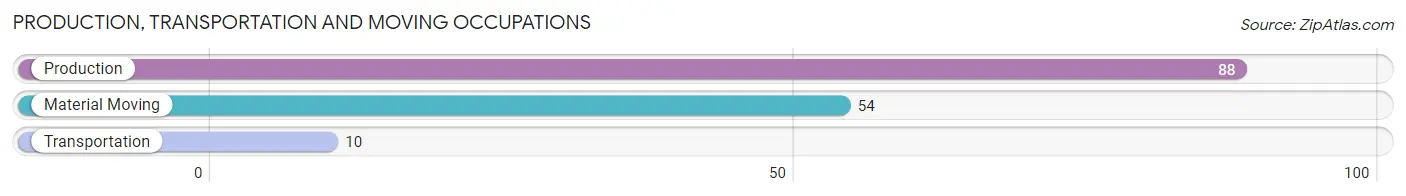
Production, Transportation and Moving Occupations
The most common Production, Transportation and Moving occupations in Rocky Ridge are Production (88 | 27.1%), Material Moving (54 | 16.6%), and Transportation (10 | 3.1%).
Production, Transportation and Moving Occupations by Sex
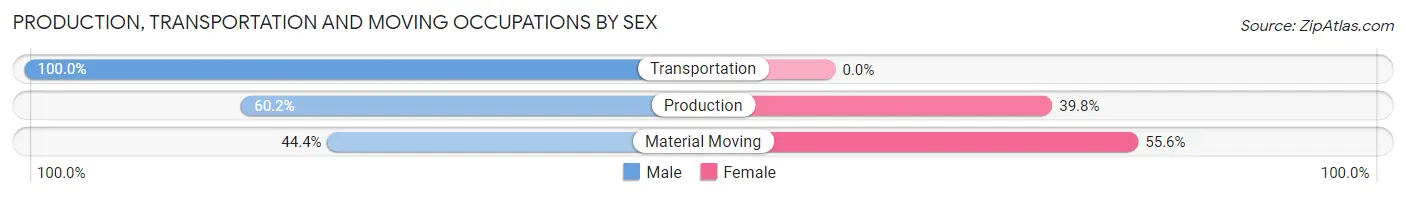
| Occupation | Male | Female |
| Production | 53 (60.2%) | 35 (39.8%) |
| Transportation | 10 (100.0%) | 0 (0.0%) |
| Material Moving | 24 (44.4%) | 30 (55.6%) |
| Total (Category) | 87 (57.2%) | 65 (42.8%) |
| Total (Overall) | 169 (52.0%) | 156 (48.0%) |
Employment Industries by Sex in Rocky Ridge
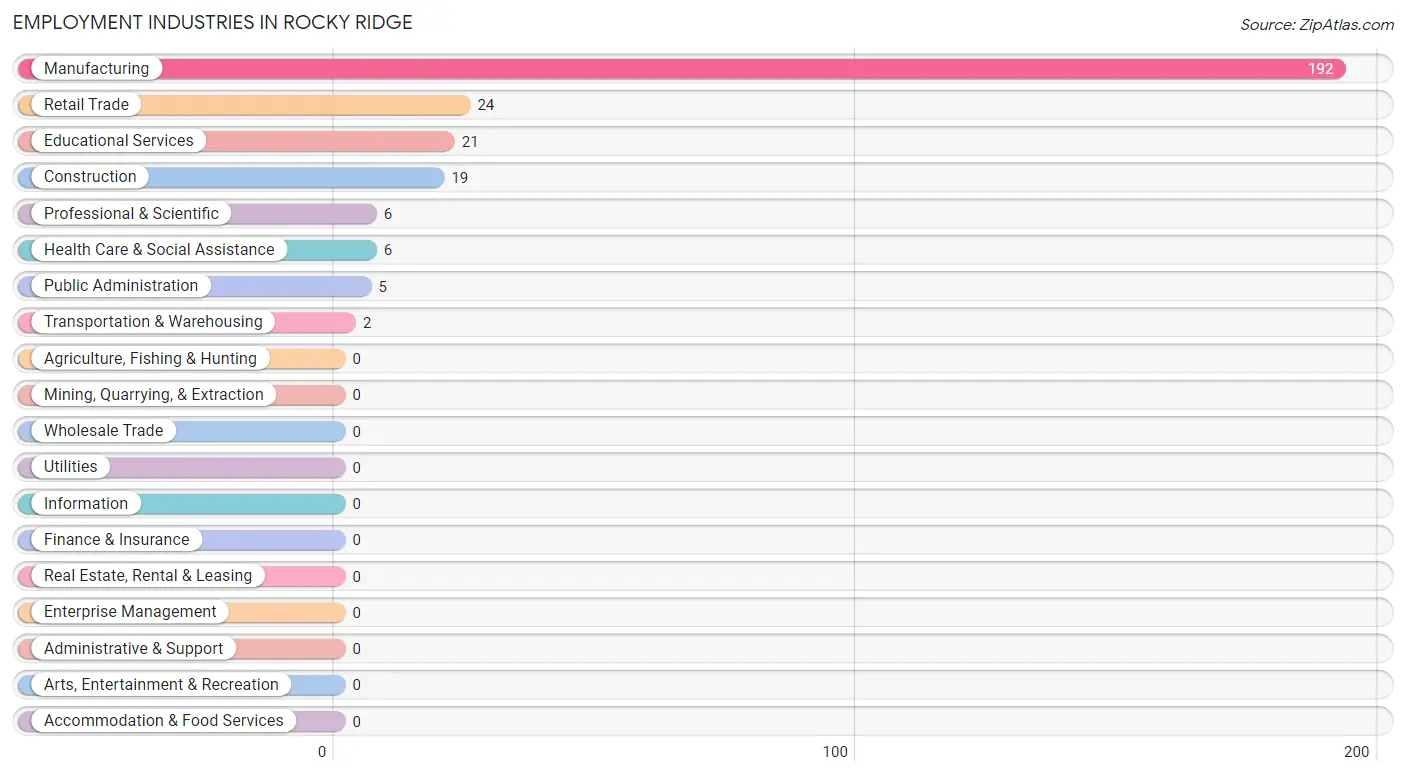
Employment Industries in Rocky Ridge
The major employment industries in Rocky Ridge include Manufacturing (192 | 59.1%), Retail Trade (24 | 7.4%), Educational Services (21 | 6.5%), Construction (19 | 5.9%), and Professional & Scientific (6 | 1.8%).
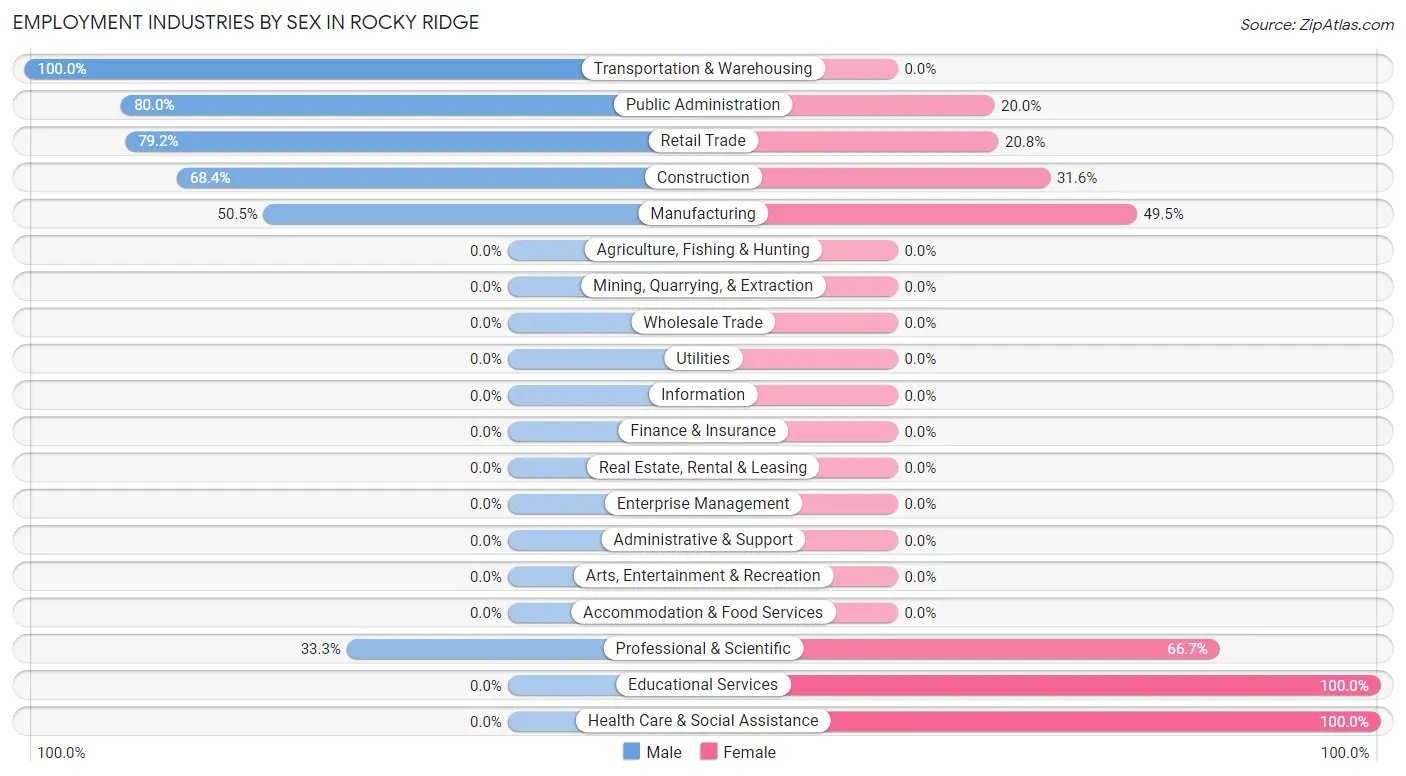
Employment Industries by Sex in Rocky Ridge
The Rocky Ridge industries that see more men than women are Transportation & Warehousing (100.0%), Public Administration (80.0%), and Retail Trade (79.2%), whereas the industries that tend to have a higher number of women are Educational Services (100.0%), Health Care & Social Assistance (100.0%), and Professional & Scientific (66.7%).
| Industry | Male | Female |
| Agriculture, Fishing & Hunting | 0 (0.0%) | 0 (0.0%) |
| Mining, Quarrying, & Extraction | 0 (0.0%) | 0 (0.0%) |
| Construction | 13 (68.4%) | 6 (31.6%) |
| Manufacturing | 97 (50.5%) | 95 (49.5%) |
| Wholesale Trade | 0 (0.0%) | 0 (0.0%) |
| Retail Trade | 19 (79.2%) | 5 (20.8%) |
| Transportation & Warehousing | 2 (100.0%) | 0 (0.0%) |
| Utilities | 0 (0.0%) | 0 (0.0%) |
| Information | 0 (0.0%) | 0 (0.0%) |
| Finance & Insurance | 0 (0.0%) | 0 (0.0%) |
| Real Estate, Rental & Leasing | 0 (0.0%) | 0 (0.0%) |
| Professional & Scientific | 2 (33.3%) | 4 (66.7%) |
| Enterprise Management | 0 (0.0%) | 0 (0.0%) |
| Administrative & Support | 0 (0.0%) | 0 (0.0%) |
| Educational Services | 0 (0.0%) | 21 (100.0%) |
| Health Care & Social Assistance | 0 (0.0%) | 6 (100.0%) |
| Arts, Entertainment & Recreation | 0 (0.0%) | 0 (0.0%) |
| Accommodation & Food Services | 0 (0.0%) | 0 (0.0%) |
| Public Administration | 4 (80.0%) | 1 (20.0%) |
| Total | 169 (52.0%) | 156 (48.0%) |
Education in Rocky Ridge
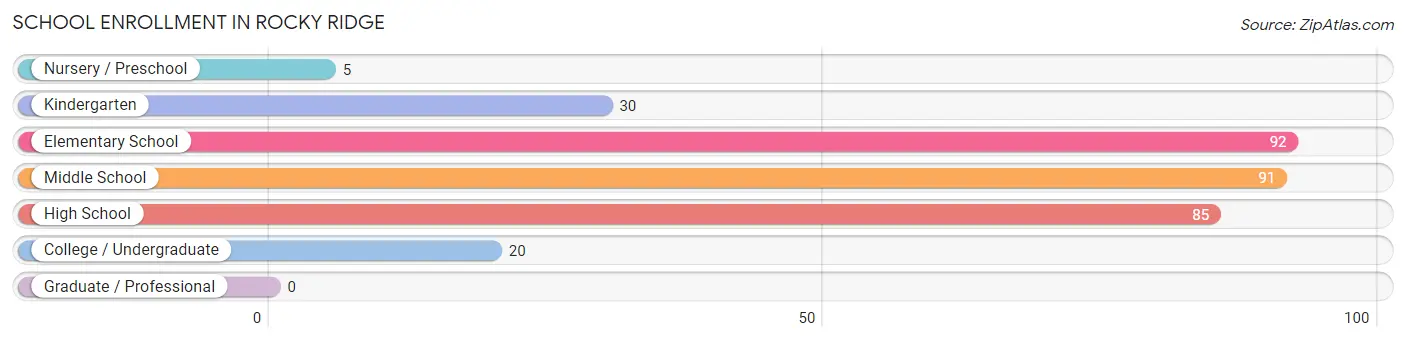
School Enrollment in Rocky Ridge
The most common levels of schooling among the 323 students in Rocky Ridge are elementary school (92 | 28.5%), middle school (91 | 28.2%), and high school (85 | 26.3%).
| School Level | # Students | % Students |
| Nursery / Preschool | 5 | 1.5% |
| Kindergarten | 30 | 9.3% |
| Elementary School | 92 | 28.5% |
| Middle School | 91 | 28.2% |
| High School | 85 | 26.3% |
| College / Undergraduate | 20 | 6.2% |
| Graduate / Professional | 0 | 0.0% |
| Total | 323 | 100.0% |
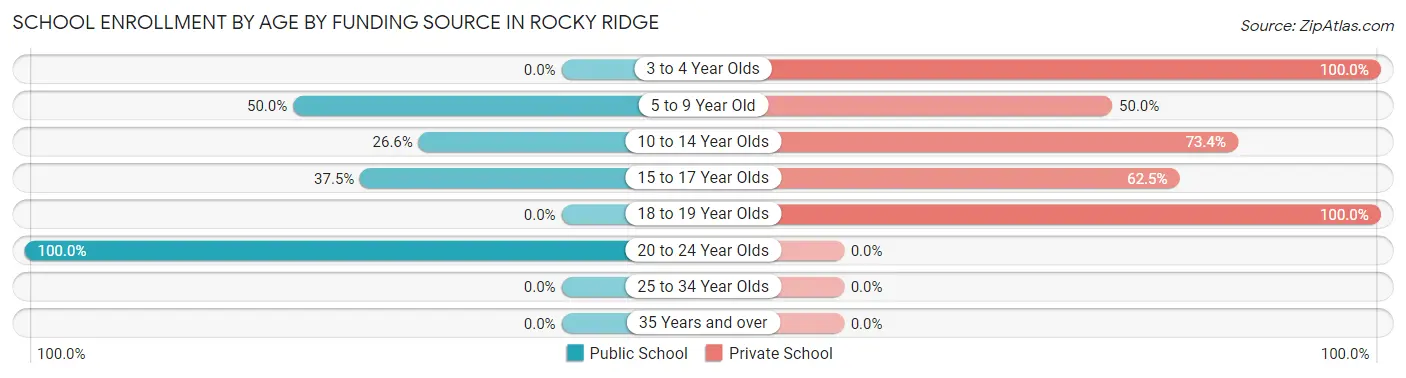
School Enrollment by Age by Funding Source in Rocky Ridge
Out of a total of 323 students who are enrolled in schools in Rocky Ridge, 197 (61.0%) attend a private institution, while the remaining 126 (39.0%) are enrolled in public schools. The age group of 3 to 4 year olds has the highest likelihood of being enrolled in private schools, with 5 (100.0% in the age bracket) enrolled. Conversely, the age group of 20 to 24 year olds has the lowest likelihood of being enrolled in a private school, with 19 (100.0% in the age bracket) attending a public institution.
| Age Bracket | Public School | Private School |
| 3 to 4 Year Olds | 0 (0.0%) | 5 (100.0%) |
| 5 to 9 Year Old | 56 (50.0%) | 56 (50.0%) |
| 10 to 14 Year Olds | 33 (26.6%) | 91 (73.4%) |
| 15 to 17 Year Olds | 18 (37.5%) | 30 (62.5%) |
| 18 to 19 Year Olds | 0 (0.0%) | 15 (100.0%) |
| 20 to 24 Year Olds | 19 (100.0%) | 0 (0.0%) |
| 25 to 34 Year Olds | 0 (0.0%) | 0 (0.0%) |
| 35 Years and over | 0 (0.0%) | 0 (0.0%) |
| Total | 126 (39.0%) | 197 (61.0%) |
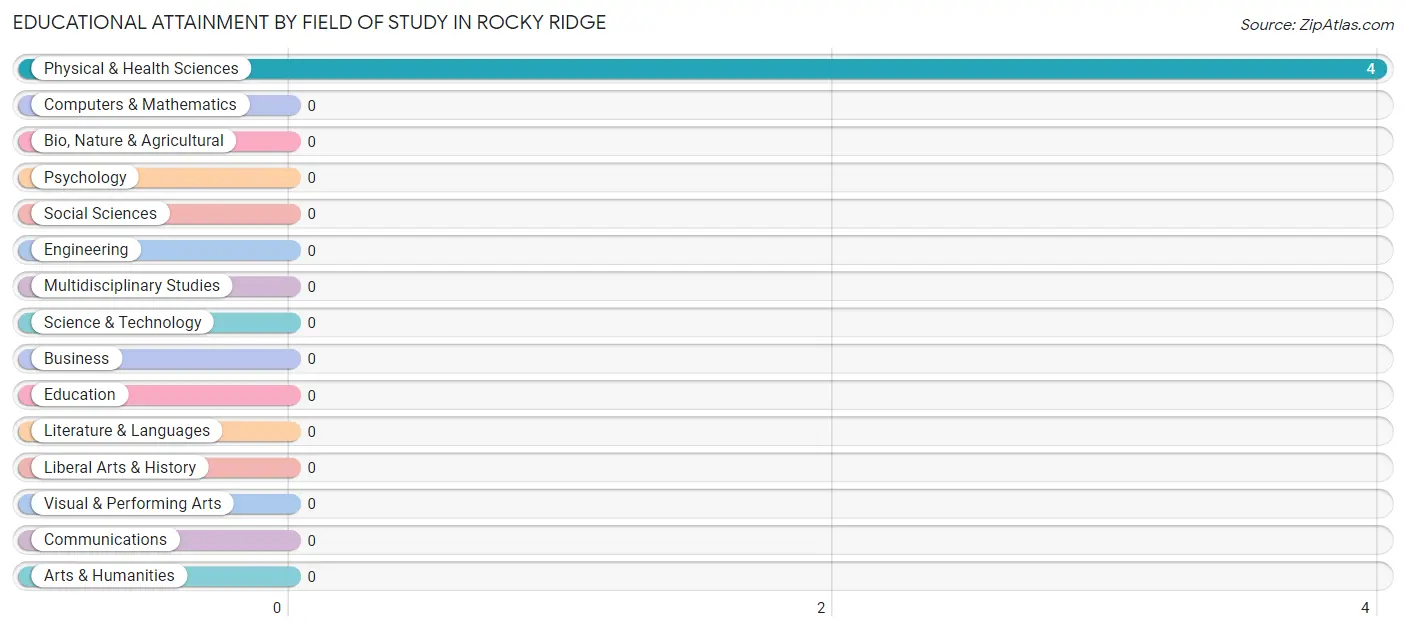
Educational Attainment by Field of Study in Rocky Ridge
, and physical & health sciences (4 | 100.0%) are the most common fields of study among 4 individuals in Rocky Ridge who have obtained a bachelor's degree or higher.
| Field of Study | # Graduates | % Graduates |
| Computers & Mathematics | 0 | 0.0% |
| Bio, Nature & Agricultural | 0 | 0.0% |
| Physical & Health Sciences | 4 | 100.0% |
| Psychology | 0 | 0.0% |
| Social Sciences | 0 | 0.0% |
| Engineering | 0 | 0.0% |
| Multidisciplinary Studies | 0 | 0.0% |
| Science & Technology | 0 | 0.0% |
| Business | 0 | 0.0% |
| Education | 0 | 0.0% |
| Literature & Languages | 0 | 0.0% |
| Liberal Arts & History | 0 | 0.0% |
| Visual & Performing Arts | 0 | 0.0% |
| Communications | 0 | 0.0% |
| Arts & Humanities | 0 | 0.0% |
| Total | 4 | 100.0% |
Transportation & Commute in Rocky Ridge
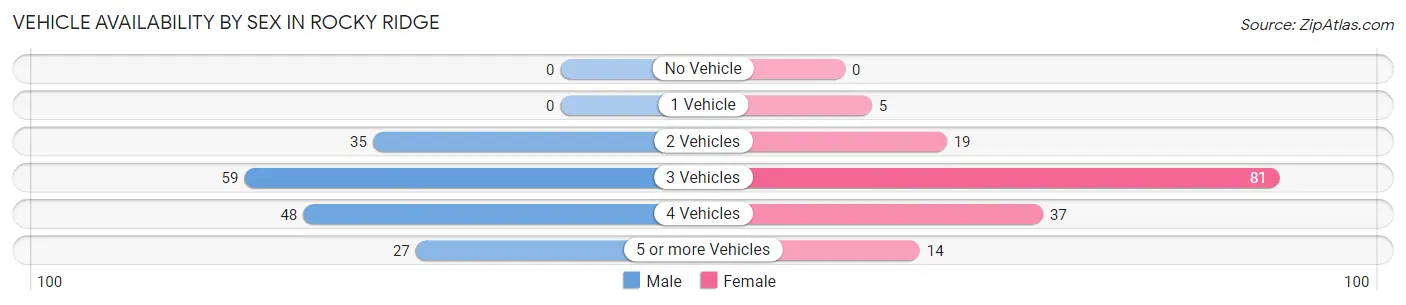
Vehicle Availability by Sex in Rocky Ridge
The most prevalent vehicle ownership categories in Rocky Ridge are males with 3 vehicles (59, accounting for 34.9%) and females with 3 vehicles (81, making up 37.8%).
| Vehicles Available | Male | Female |
| No Vehicle | 0 (0.0%) | 0 (0.0%) |
| 1 Vehicle | 0 (0.0%) | 5 (3.2%) |
| 2 Vehicles | 35 (20.7%) | 19 (12.2%) |
| 3 Vehicles | 59 (34.9%) | 81 (51.9%) |
| 4 Vehicles | 48 (28.4%) | 37 (23.7%) |
| 5 or more Vehicles | 27 (16.0%) | 14 (9.0%) |
| Total | 169 (100.0%) | 156 (100.0%) |
Commute Time in Rocky Ridge
The most frequently occuring commute durations in Rocky Ridge are less than 5 minutes (152 commuters, 49.2%), 5 to 9 minutes (106 commuters, 34.3%), and 10 to 14 minutes (11 commuters, 3.6%).
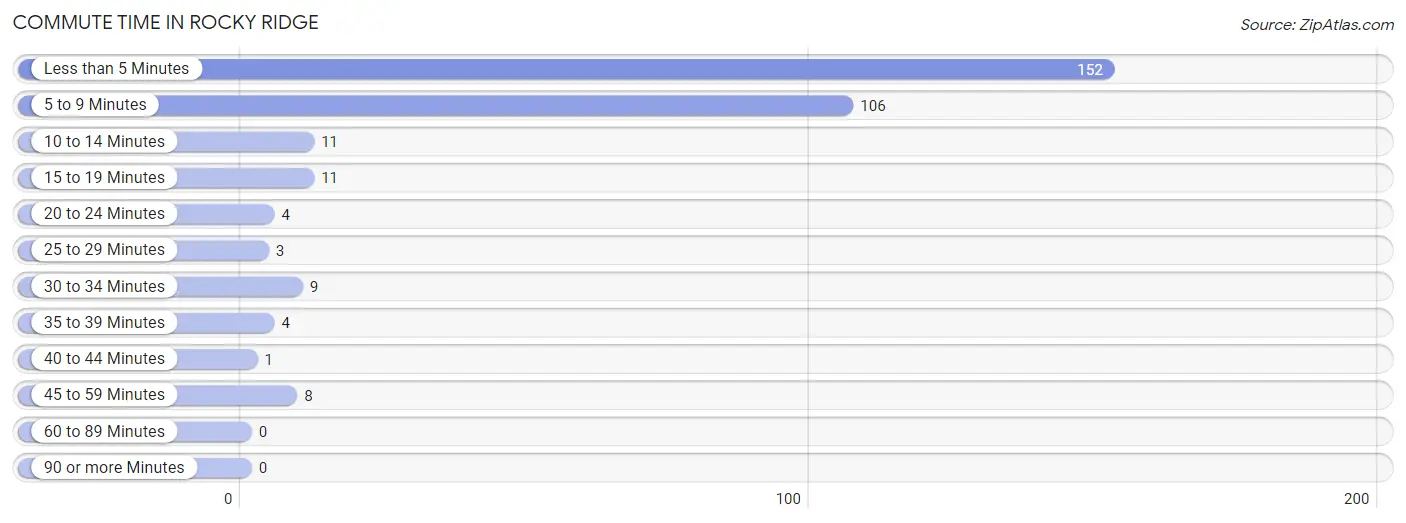
| Commute Time | # Commuters | % Commuters |
| Less than 5 Minutes | 152 | 49.2% |
| 5 to 9 Minutes | 106 | 34.3% |
| 10 to 14 Minutes | 11 | 3.6% |
| 15 to 19 Minutes | 11 | 3.6% |
| 20 to 24 Minutes | 4 | 1.3% |
| 25 to 29 Minutes | 3 | 1.0% |
| 30 to 34 Minutes | 9 | 2.9% |
| 35 to 39 Minutes | 4 | 1.3% |
| 40 to 44 Minutes | 1 | 0.3% |
| 45 to 59 Minutes | 8 | 2.6% |
| 60 to 89 Minutes | 0 | 0.0% |
| 90 or more Minutes | 0 | 0.0% |
Commute Time by Sex in Rocky Ridge
The most common commute times in Rocky Ridge are less than 5 minutes (82 commuters, 49.7%) for males and less than 5 minutes (70 commuters, 48.6%) for females.
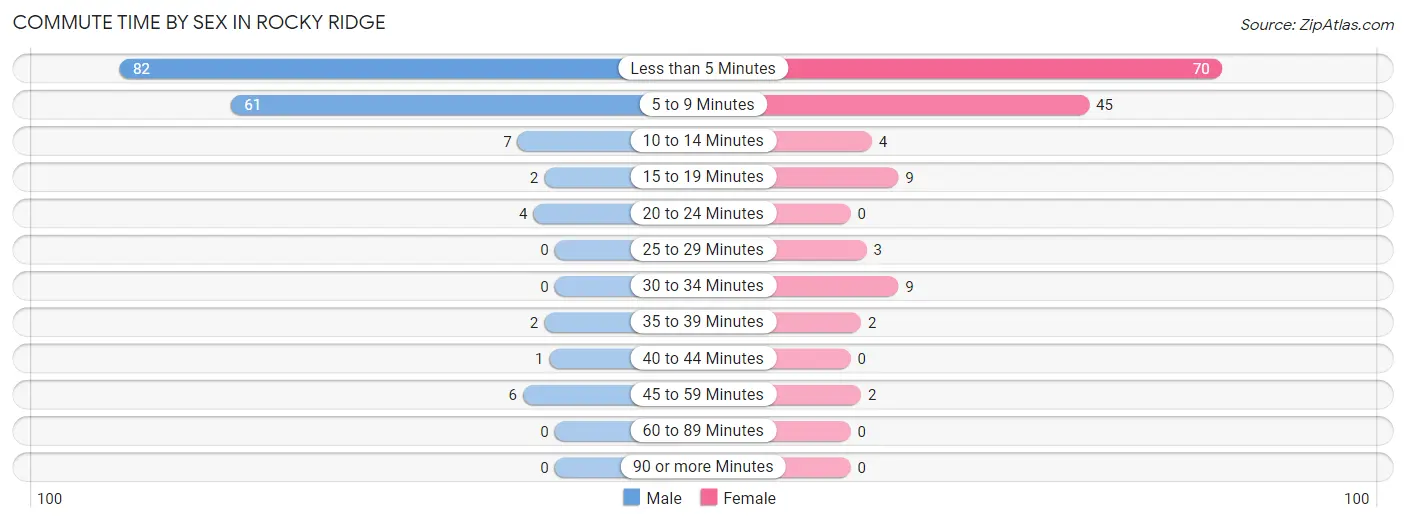
| Commute Time | Male | Female |
| Less than 5 Minutes | 82 (49.7%) | 70 (48.6%) |
| 5 to 9 Minutes | 61 (37.0%) | 45 (31.2%) |
| 10 to 14 Minutes | 7 (4.2%) | 4 (2.8%) |
| 15 to 19 Minutes | 2 (1.2%) | 9 (6.2%) |
| 20 to 24 Minutes | 4 (2.4%) | 0 (0.0%) |
| 25 to 29 Minutes | 0 (0.0%) | 3 (2.1%) |
| 30 to 34 Minutes | 0 (0.0%) | 9 (6.2%) |
| 35 to 39 Minutes | 2 (1.2%) | 2 (1.4%) |
| 40 to 44 Minutes | 1 (0.6%) | 0 (0.0%) |
| 45 to 59 Minutes | 6 (3.6%) | 2 (1.4%) |
| 60 to 89 Minutes | 0 (0.0%) | 0 (0.0%) |
| 90 or more Minutes | 0 (0.0%) | 0 (0.0%) |
Time of Departure to Work by Sex in Rocky Ridge
The most frequent times of departure to work in Rocky Ridge are 6:30 AM to 6:59 AM (41, 24.8%) for males and 7:30 AM to 7:59 AM (31, 21.5%) for females.
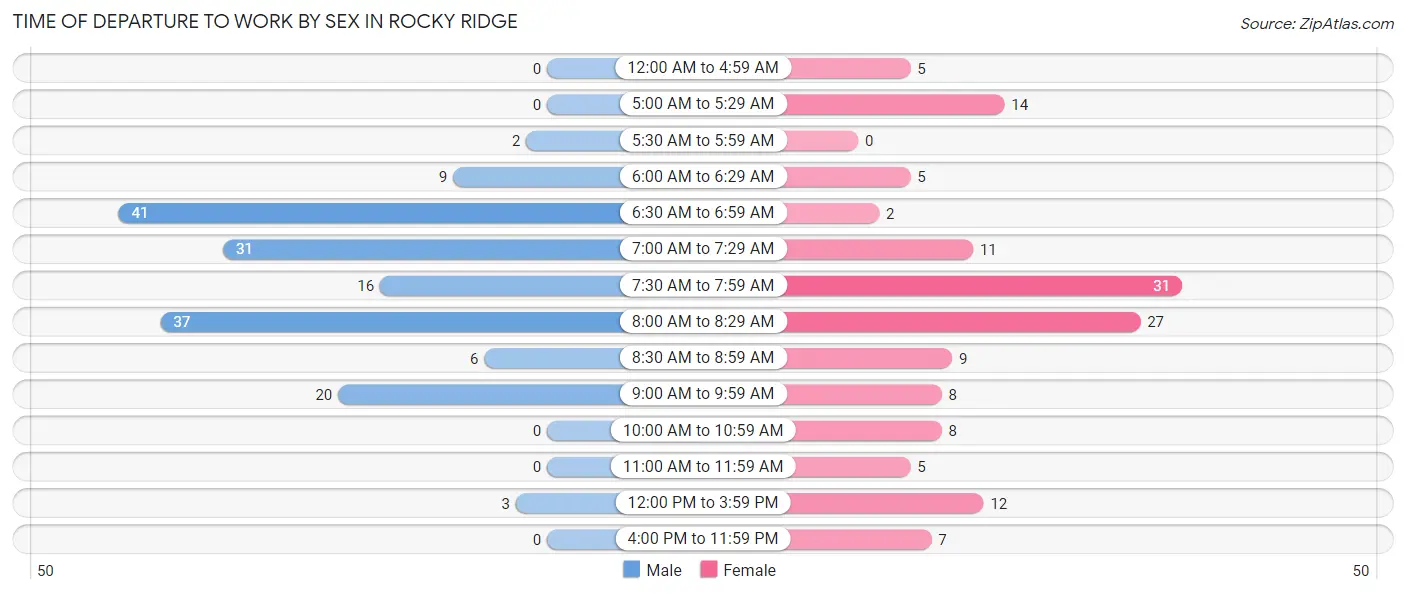
| Time of Departure | Male | Female |
| 12:00 AM to 4:59 AM | 0 (0.0%) | 5 (3.5%) |
| 5:00 AM to 5:29 AM | 0 (0.0%) | 14 (9.7%) |
| 5:30 AM to 5:59 AM | 2 (1.2%) | 0 (0.0%) |
| 6:00 AM to 6:29 AM | 9 (5.4%) | 5 (3.5%) |
| 6:30 AM to 6:59 AM | 41 (24.8%) | 2 (1.4%) |
| 7:00 AM to 7:29 AM | 31 (18.8%) | 11 (7.6%) |
| 7:30 AM to 7:59 AM | 16 (9.7%) | 31 (21.5%) |
| 8:00 AM to 8:29 AM | 37 (22.4%) | 27 (18.8%) |
| 8:30 AM to 8:59 AM | 6 (3.6%) | 9 (6.2%) |
| 9:00 AM to 9:59 AM | 20 (12.1%) | 8 (5.6%) |
| 10:00 AM to 10:59 AM | 0 (0.0%) | 8 (5.6%) |
| 11:00 AM to 11:59 AM | 0 (0.0%) | 5 (3.5%) |
| 12:00 PM to 3:59 PM | 3 (1.8%) | 12 (8.3%) |
| 4:00 PM to 11:59 PM | 0 (0.0%) | 7 (4.9%) |
| Total | 165 (100.0%) | 144 (100.0%) |
Housing Occupancy in Rocky Ridge
Occupancy by Ownership in Rocky Ridge
Of the total 114 dwellings in Rocky Ridge, owner-occupied units account for 65 (57.0%), while renter-occupied units make up 49 (43.0%).
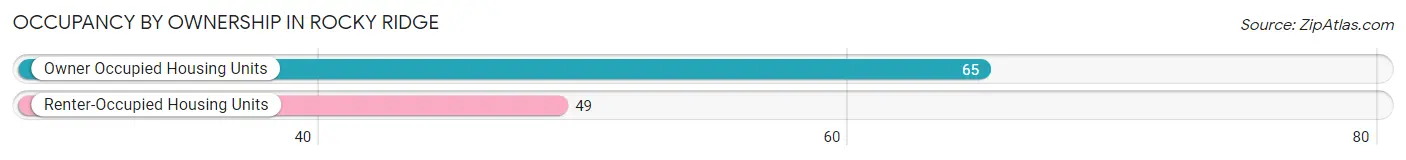
| Occupancy | # Housing Units | % Housing Units |
| Owner Occupied Housing Units | 65 | 57.0% |
| Renter-Occupied Housing Units | 49 | 43.0% |
| Total Occupied Housing Units | 114 | 100.0% |
Occupancy by Household Size in Rocky Ridge
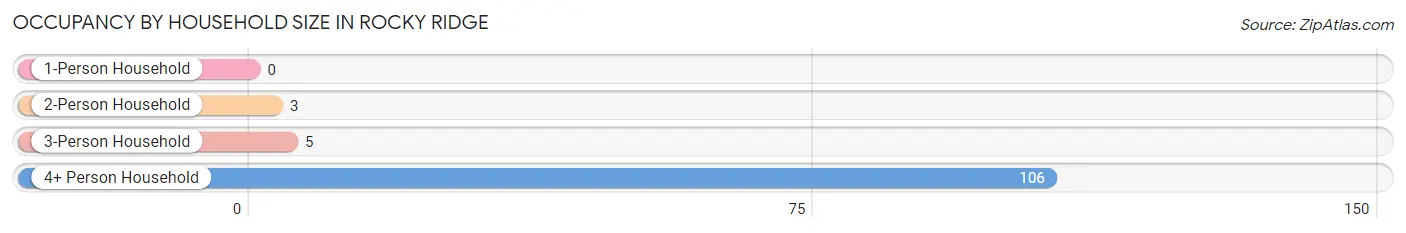
| Household Size | # Housing Units | % Housing Units |
| 1-Person Household | 0 | 0.0% |
| 2-Person Household | 3 | 2.6% |
| 3-Person Household | 5 | 4.4% |
| 4+ Person Household | 106 | 93.0% |
| Total Housing Units | 114 | 100.0% |
Occupancy by Ownership by Household Size in Rocky Ridge
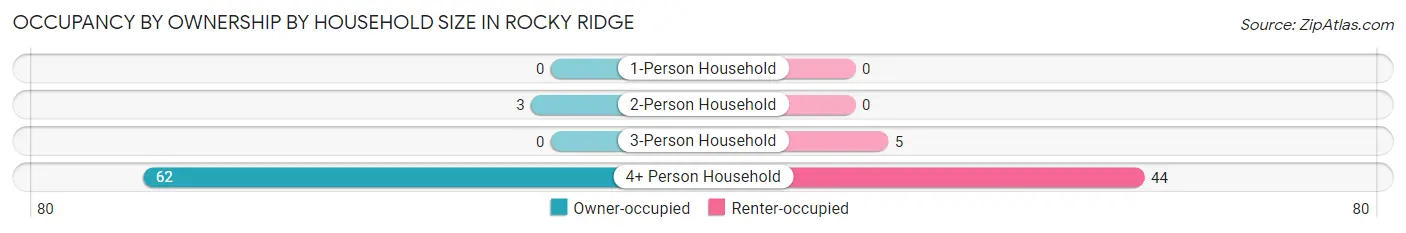
| Household Size | Owner-occupied | Renter-occupied |
| 1-Person Household | 0 (0.0%) | 0 (0.0%) |
| 2-Person Household | 3 (100.0%) | 0 (0.0%) |
| 3-Person Household | 0 (0.0%) | 5 (100.0%) |
| 4+ Person Household | 62 (58.5%) | 44 (41.5%) |
| Total Housing Units | 65 (57.0%) | 49 (43.0%) |
Occupancy by Educational Attainment in Rocky Ridge
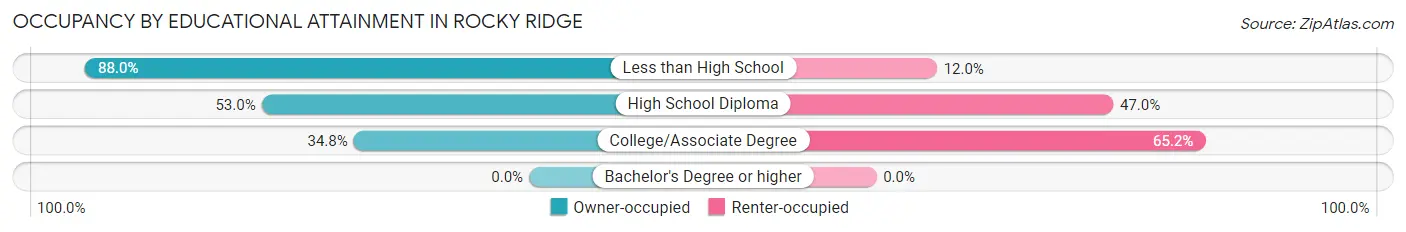
| Household Size | Owner-occupied | Renter-occupied |
| Less than High School | 22 (88.0%) | 3 (12.0%) |
| High School Diploma | 35 (53.0%) | 31 (47.0%) |
| College/Associate Degree | 8 (34.8%) | 15 (65.2%) |
| Bachelor's Degree or higher | 0 (0.0%) | 0 (0.0%) |
Occupancy by Age of Householder in Rocky Ridge
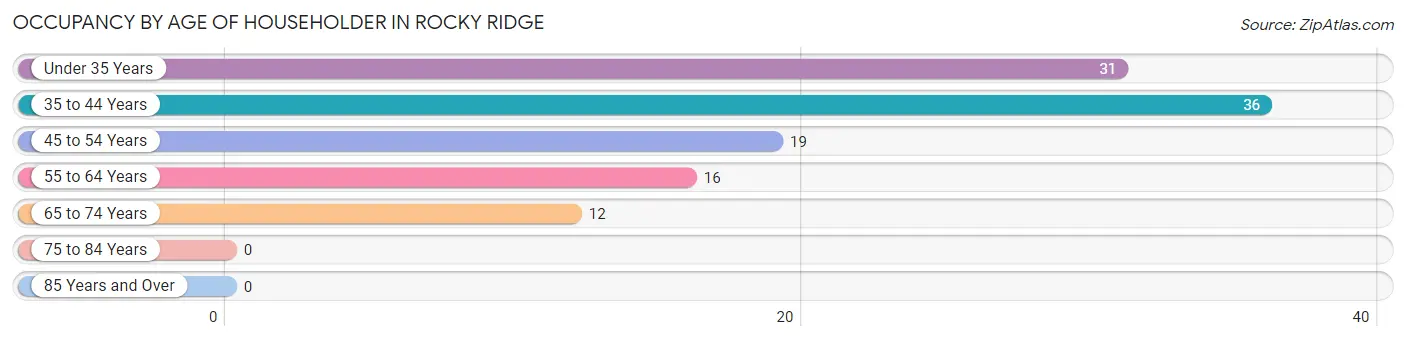
| Age Bracket | # Households | % Households |
| Under 35 Years | 31 | 27.2% |
| 35 to 44 Years | 36 | 31.6% |
| 45 to 54 Years | 19 | 16.7% |
| 55 to 64 Years | 16 | 14.0% |
| 65 to 74 Years | 12 | 10.5% |
| 75 to 84 Years | 0 | 0.0% |
| 85 Years and Over | 0 | 0.0% |
| Total | 114 | 100.0% |
Housing Finances in Rocky Ridge
Median Income by Occupancy in Rocky Ridge
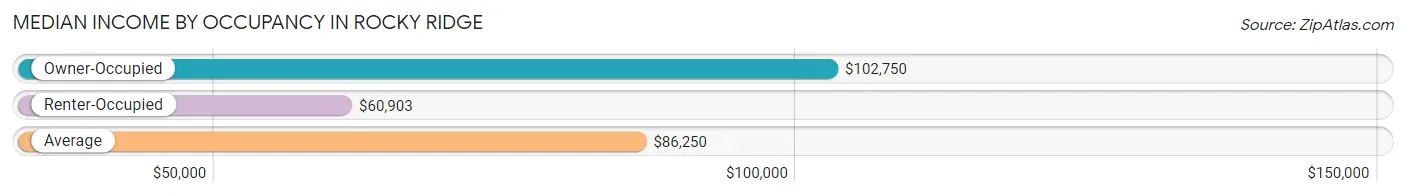
| Occupancy Type | # Households | Median Income |
| Owner-Occupied | 65 (57.0%) | $102,750 |
| Renter-Occupied | 49 (43.0%) | $60,903 |
| Average | 114 (100.0%) | $86,250 |
Occupancy by Householder Income Bracket in Rocky Ridge
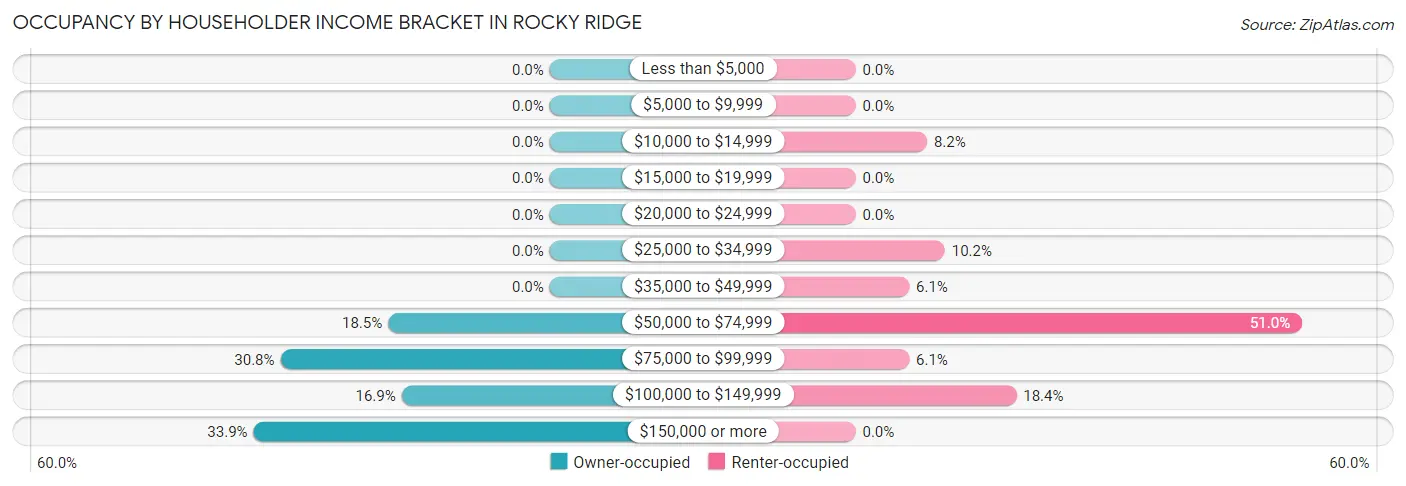
| Income Bracket | Owner-occupied | Renter-occupied |
| Less than $5,000 | 0 (0.0%) | 0 (0.0%) |
| $5,000 to $9,999 | 0 (0.0%) | 0 (0.0%) |
| $10,000 to $14,999 | 0 (0.0%) | 4 (8.2%) |
| $15,000 to $19,999 | 0 (0.0%) | 0 (0.0%) |
| $20,000 to $24,999 | 0 (0.0%) | 0 (0.0%) |
| $25,000 to $34,999 | 0 (0.0%) | 5 (10.2%) |
| $35,000 to $49,999 | 0 (0.0%) | 3 (6.1%) |
| $50,000 to $74,999 | 12 (18.5%) | 25 (51.0%) |
| $75,000 to $99,999 | 20 (30.8%) | 3 (6.1%) |
| $100,000 to $149,999 | 11 (16.9%) | 9 (18.4%) |
| $150,000 or more | 22 (33.9%) | 0 (0.0%) |
| Total | 65 (100.0%) | 49 (100.0%) |
Monthly Housing Cost Tiers in Rocky Ridge
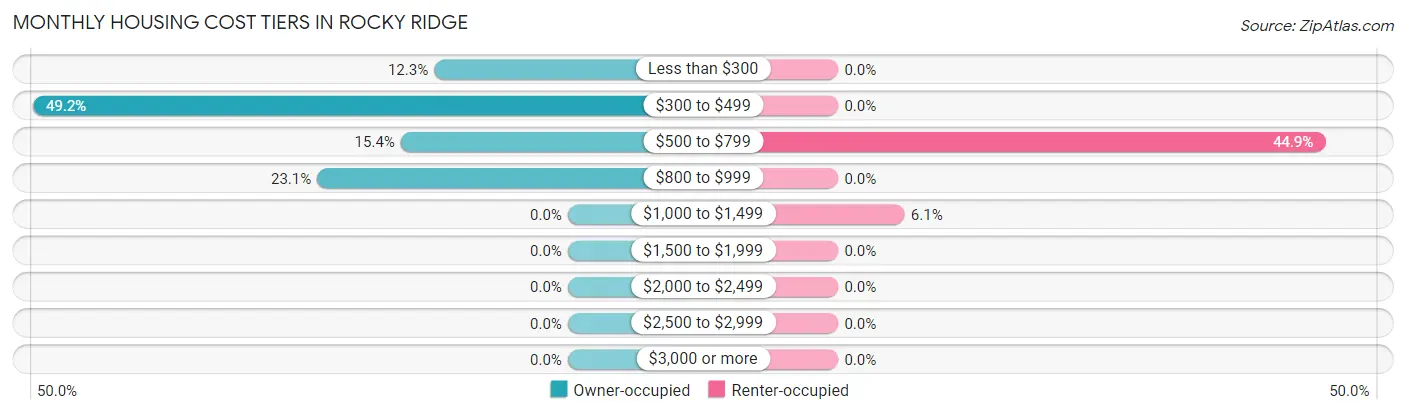
| Monthly Cost | Owner-occupied | Renter-occupied |
| Less than $300 | 8 (12.3%) | 0 (0.0%) |
| $300 to $499 | 32 (49.2%) | 0 (0.0%) |
| $500 to $799 | 10 (15.4%) | 22 (44.9%) |
| $800 to $999 | 15 (23.1%) | 0 (0.0%) |
| $1,000 to $1,499 | 0 (0.0%) | 3 (6.1%) |
| $1,500 to $1,999 | 0 (0.0%) | 0 (0.0%) |
| $2,000 to $2,499 | 0 (0.0%) | 0 (0.0%) |
| $2,500 to $2,999 | 0 (0.0%) | 0 (0.0%) |
| $3,000 or more | 0 (0.0%) | 0 (0.0%) |
| Total | 65 (100.0%) | 49 (100.0%) |
Physical Housing Characteristics in Rocky Ridge
Housing Structures in Rocky Ridge
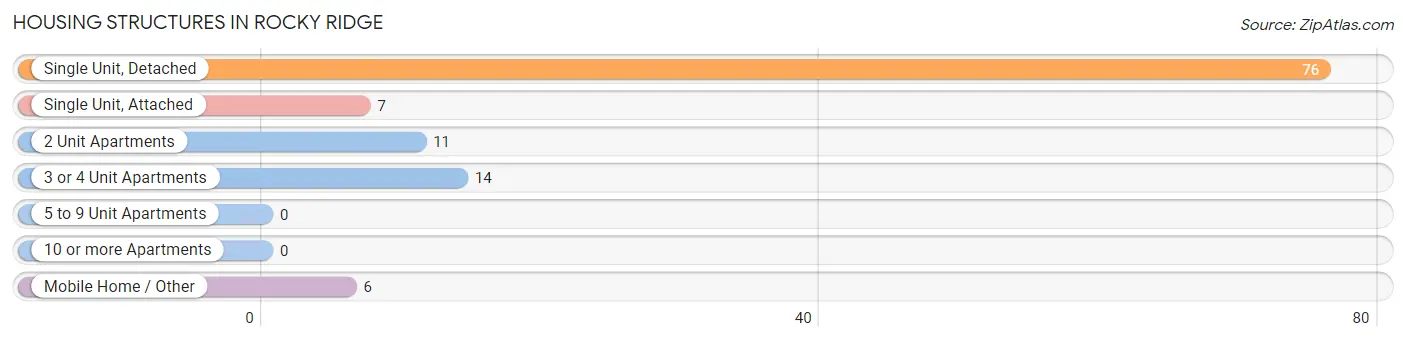
| Structure Type | # Housing Units | % Housing Units |
| Single Unit, Detached | 76 | 66.7% |
| Single Unit, Attached | 7 | 6.1% |
| 2 Unit Apartments | 11 | 9.7% |
| 3 or 4 Unit Apartments | 14 | 12.3% |
| 5 to 9 Unit Apartments | 0 | 0.0% |
| 10 or more Apartments | 0 | 0.0% |
| Mobile Home / Other | 6 | 5.3% |
| Total | 114 | 100.0% |
Housing Structures by Occupancy in Rocky Ridge
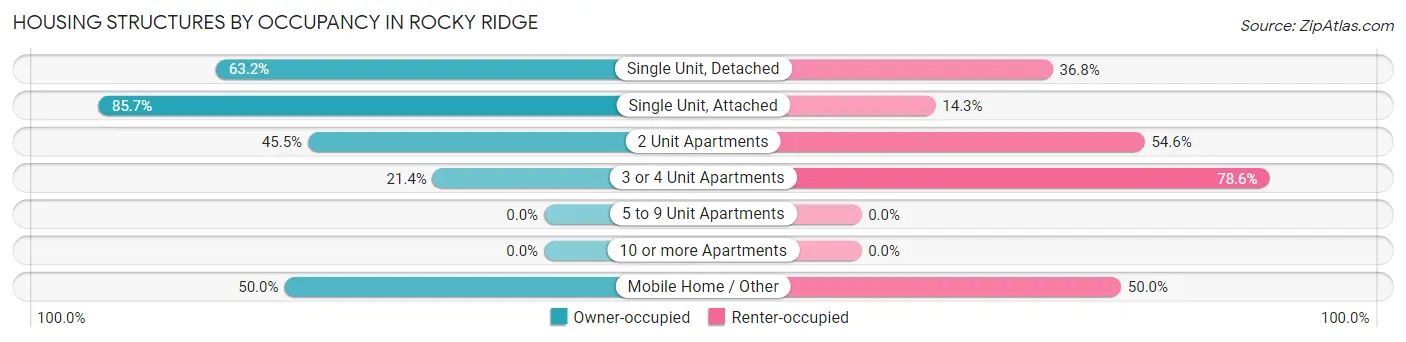
| Structure Type | Owner-occupied | Renter-occupied |
| Single Unit, Detached | 48 (63.2%) | 28 (36.8%) |
| Single Unit, Attached | 6 (85.7%) | 1 (14.3%) |
| 2 Unit Apartments | 5 (45.5%) | 6 (54.5%) |
| 3 or 4 Unit Apartments | 3 (21.4%) | 11 (78.6%) |
| 5 to 9 Unit Apartments | 0 (0.0%) | 0 (0.0%) |
| 10 or more Apartments | 0 (0.0%) | 0 (0.0%) |
| Mobile Home / Other | 3 (50.0%) | 3 (50.0%) |
| Total | 65 (57.0%) | 49 (43.0%) |
Housing Structures by Number of Rooms in Rocky Ridge
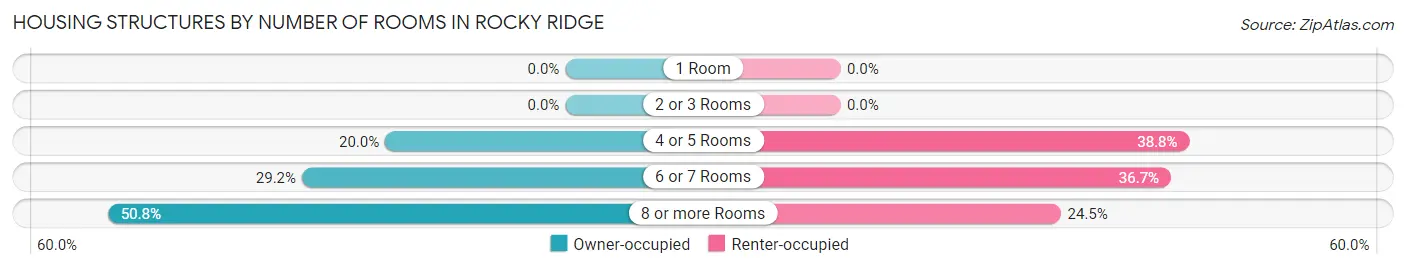
| Number of Rooms | Owner-occupied | Renter-occupied |
| 1 Room | 0 (0.0%) | 0 (0.0%) |
| 2 or 3 Rooms | 0 (0.0%) | 0 (0.0%) |
| 4 or 5 Rooms | 13 (20.0%) | 19 (38.8%) |
| 6 or 7 Rooms | 19 (29.2%) | 18 (36.7%) |
| 8 or more Rooms | 33 (50.8%) | 12 (24.5%) |
| Total | 65 (100.0%) | 49 (100.0%) |
Housing Structure by Heating Type in Rocky Ridge
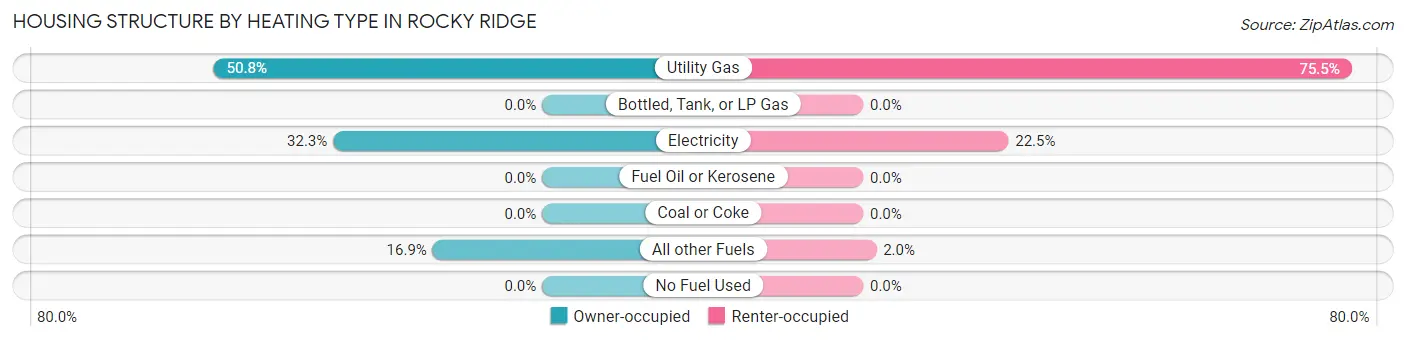
| Heating Type | Owner-occupied | Renter-occupied |
| Utility Gas | 33 (50.8%) | 37 (75.5%) |
| Bottled, Tank, or LP Gas | 0 (0.0%) | 0 (0.0%) |
| Electricity | 21 (32.3%) | 11 (22.5%) |
| Fuel Oil or Kerosene | 0 (0.0%) | 0 (0.0%) |
| Coal or Coke | 0 (0.0%) | 0 (0.0%) |
| All other Fuels | 11 (16.9%) | 1 (2.0%) |
| No Fuel Used | 0 (0.0%) | 0 (0.0%) |
| Total | 65 (100.0%) | 49 (100.0%) |
Household Vehicle Usage in Rocky Ridge
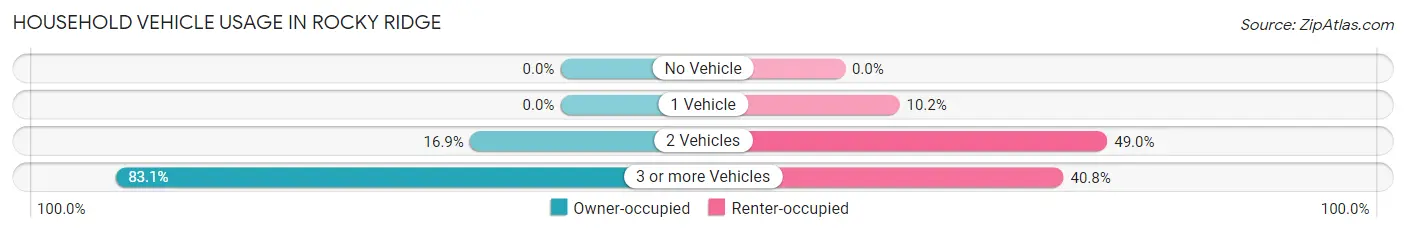
| Vehicles per Household | Owner-occupied | Renter-occupied |
| No Vehicle | 0 (0.0%) | 0 (0.0%) |
| 1 Vehicle | 0 (0.0%) | 5 (10.2%) |
| 2 Vehicles | 11 (16.9%) | 24 (49.0%) |
| 3 or more Vehicles | 54 (83.1%) | 20 (40.8%) |
| Total | 65 (100.0%) | 49 (100.0%) |
Real Estate & Mortgages in Rocky Ridge
Real Estate and Mortgage Overview in Rocky Ridge
| Characteristic | Without Mortgage | With Mortgage |
| Housing Units | 65 | 0 |
| Median Property Value | $294,200 | $0 |
| Median Household Income | $102,750 | $0 |
| Monthly Housing Costs | $461 | $0 |
| Real Estate Taxes | $1,575 | $0 |
Property Value by Mortgage Status in Rocky Ridge
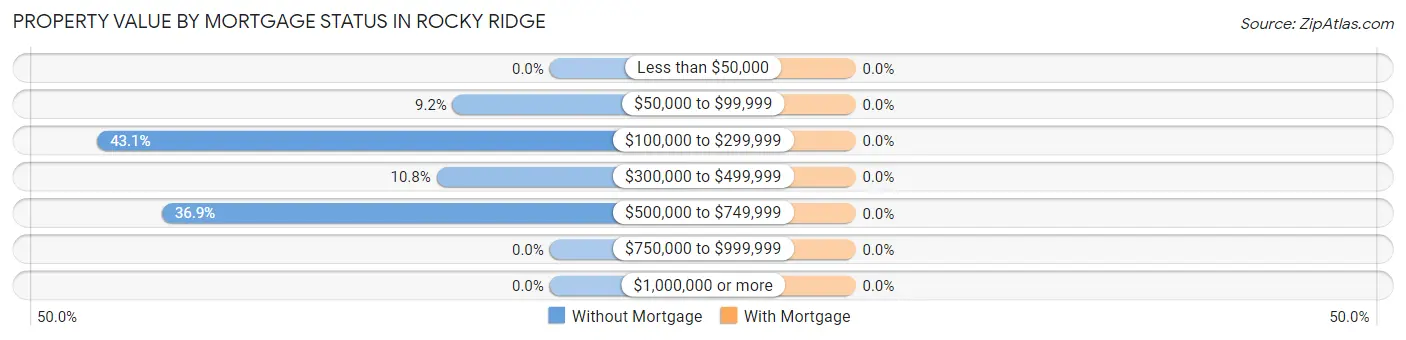
| Property Value | Without Mortgage | With Mortgage |
| Less than $50,000 | 0 (0.0%) | 0 (0.0%) |
| $50,000 to $99,999 | 6 (9.2%) | 0 (0.0%) |
| $100,000 to $299,999 | 28 (43.1%) | 0 (0.0%) |
| $300,000 to $499,999 | 7 (10.8%) | 0 (0.0%) |
| $500,000 to $749,999 | 24 (36.9%) | 0 (0.0%) |
| $750,000 to $999,999 | 0 (0.0%) | 0 (0.0%) |
| $1,000,000 or more | 0 (0.0%) | 0 (0.0%) |
| Total | 65 (100.0%) | 0 (0.0%) |
Household Income by Mortgage Status in Rocky Ridge
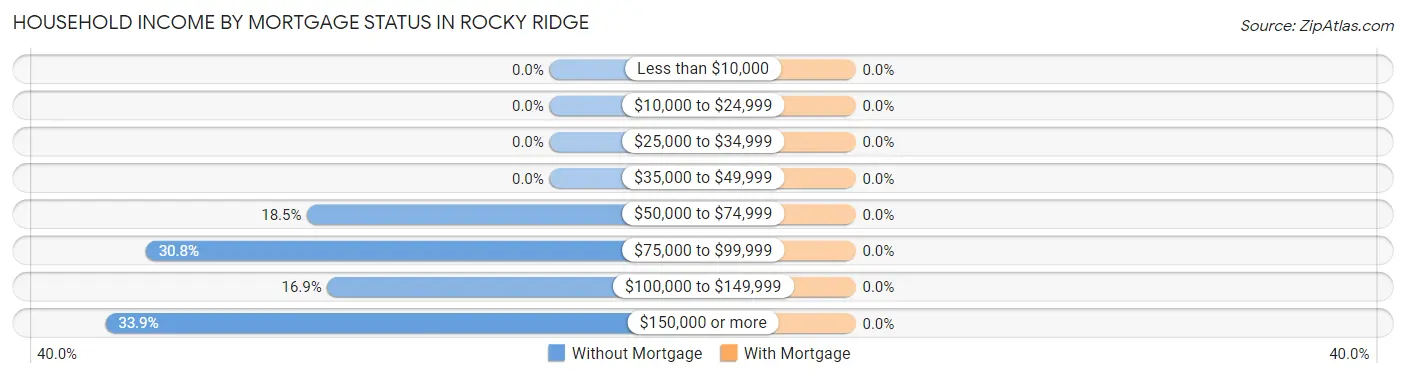
| Household Income | Without Mortgage | With Mortgage |
| Less than $10,000 | 0 (0.0%) | 0 (0.0%) |
| $10,000 to $24,999 | 0 (0.0%) | 0 (0.0%) |
| $25,000 to $34,999 | 0 (0.0%) | 0 (0.0%) |
| $35,000 to $49,999 | 0 (0.0%) | 0 (0.0%) |
| $50,000 to $74,999 | 12 (18.5%) | 0 (0.0%) |
| $75,000 to $99,999 | 20 (30.8%) | 0 (0.0%) |
| $100,000 to $149,999 | 11 (16.9%) | 0 (0.0%) |
| $150,000 or more | 22 (33.9%) | 0 (0.0%) |
| Total | 65 (100.0%) | 0 (0.0%) |
Property Value to Household Income Ratio in Rocky Ridge
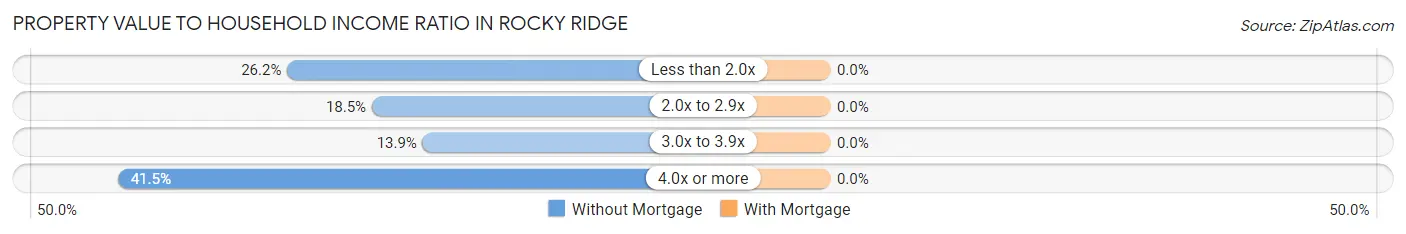
| Value-to-Income Ratio | Without Mortgage | With Mortgage |
| Less than 2.0x | 17 (26.2%) | 0 (0.0%) |
| 2.0x to 2.9x | 12 (18.5%) | 0 (0.0%) |
| 3.0x to 3.9x | 9 (13.9%) | 0 (0.0%) |
| 4.0x or more | 27 (41.5%) | 0 (0.0%) |
| Total | 65 (100.0%) | 0 (0.0%) |
Real Estate Taxes by Mortgage Status in Rocky Ridge
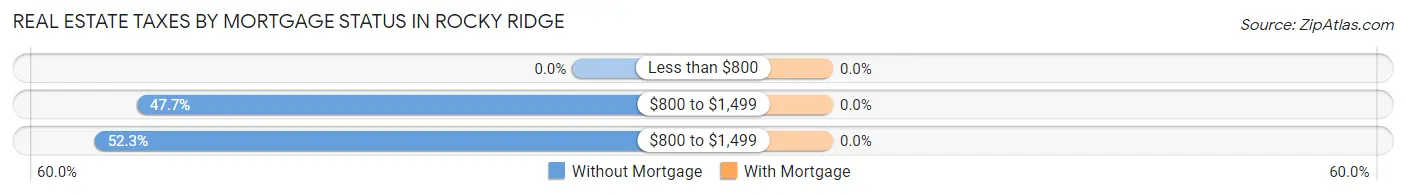
| Property Taxes | Without Mortgage | With Mortgage |
| Less than $800 | 0 (0.0%) | 0 (0.0%) |
| $800 to $1,499 | 31 (47.7%) | 0 (0.0%) |
| $800 to $1,499 | 34 (52.3%) | 0 (0.0%) |
| Total | 65 (100.0%) | 0 (0.0%) |
Health & Disability in Rocky Ridge
Health Insurance Coverage by Age in Rocky Ridge
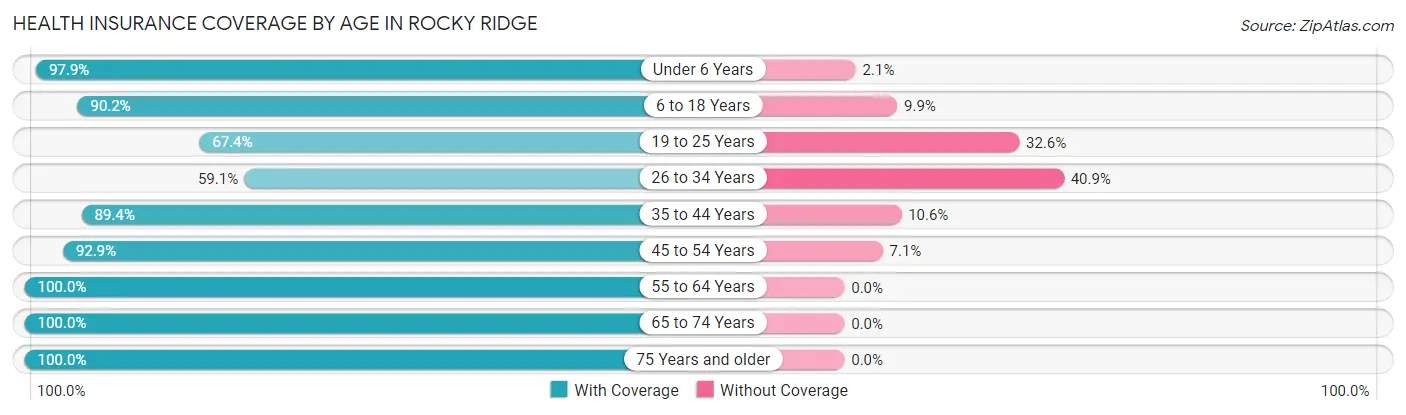
| Age Bracket | With Coverage | Without Coverage |
| Under 6 Years | 231 (97.9%) | 5 (2.1%) |
| 6 to 18 Years | 247 (90.1%) | 27 (9.9%) |
| 19 to 25 Years | 89 (67.4%) | 43 (32.6%) |
| 26 to 34 Years | 52 (59.1%) | 36 (40.9%) |
| 35 to 44 Years | 59 (89.4%) | 7 (10.6%) |
| 45 to 54 Years | 26 (92.9%) | 2 (7.1%) |
| 55 to 64 Years | 16 (100.0%) | 0 (0.0%) |
| 65 to 74 Years | 12 (100.0%) | 0 (0.0%) |
| 75 Years and older | 7 (100.0%) | 0 (0.0%) |
| Total | 739 (86.0%) | 120 (14.0%) |
Health Insurance Coverage by Citizenship Status in Rocky Ridge
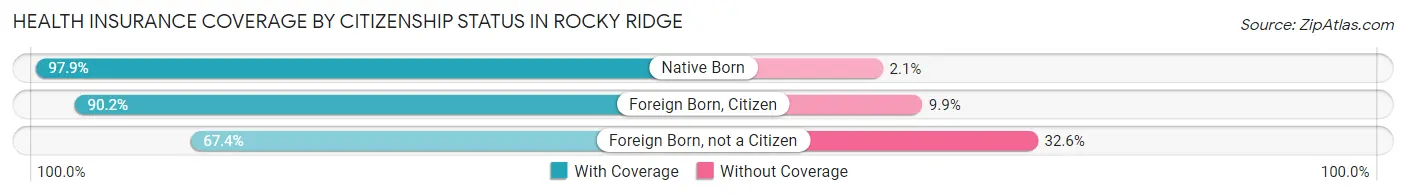
| Citizenship Status | With Coverage | Without Coverage |
| Native Born | 231 (97.9%) | 5 (2.1%) |
| Foreign Born, Citizen | 247 (90.1%) | 27 (9.9%) |
| Foreign Born, not a Citizen | 89 (67.4%) | 43 (32.6%) |
Health Insurance Coverage by Household Income in Rocky Ridge
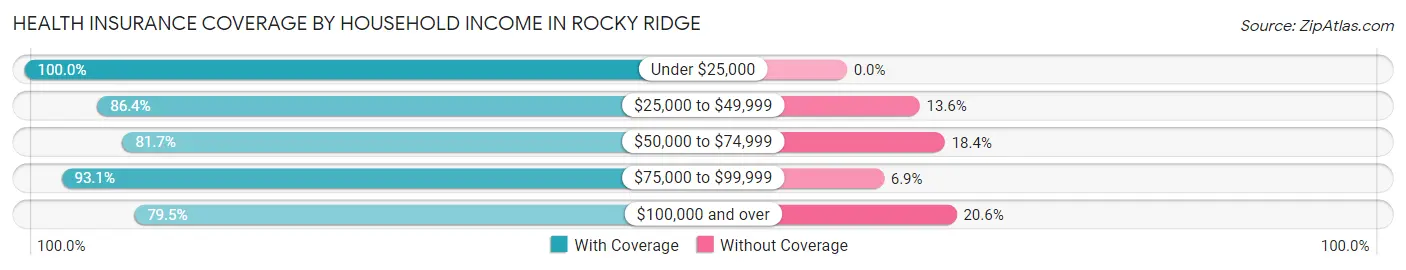
| Household Income | With Coverage | Without Coverage |
| Under $25,000 | 48 (100.0%) | 0 (0.0%) |
| $25,000 to $49,999 | 57 (86.4%) | 9 (13.6%) |
| $50,000 to $74,999 | 178 (81.7%) | 40 (18.3%) |
| $75,000 to $99,999 | 255 (93.1%) | 19 (6.9%) |
| $100,000 and over | 201 (79.4%) | 52 (20.5%) |
Public vs Private Health Insurance Coverage by Age in Rocky Ridge
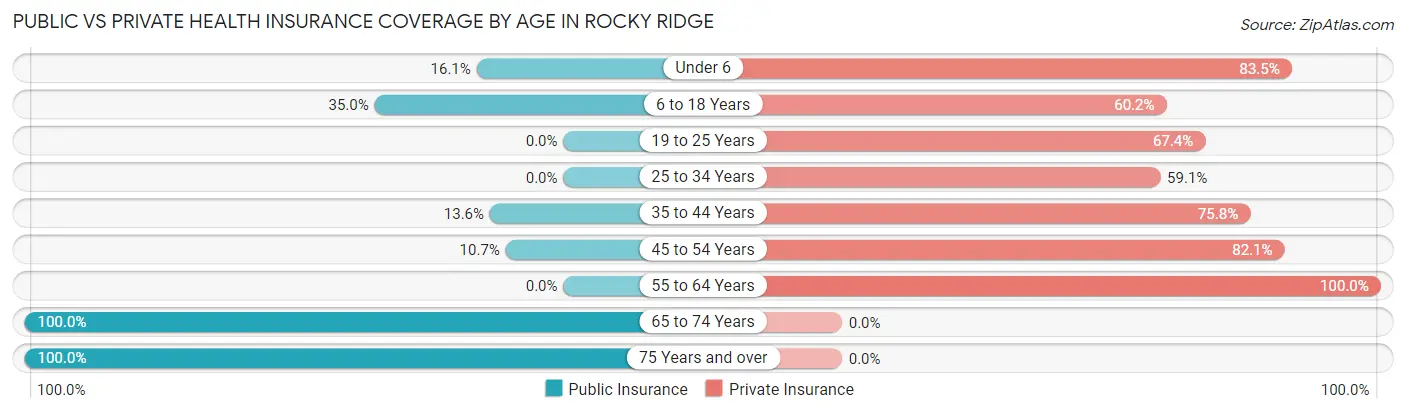
| Age Bracket | Public Insurance | Private Insurance |
| Under 6 | 38 (16.1%) | 197 (83.5%) |
| 6 to 18 Years | 96 (35.0%) | 165 (60.2%) |
| 19 to 25 Years | 0 (0.0%) | 89 (67.4%) |
| 25 to 34 Years | 0 (0.0%) | 52 (59.1%) |
| 35 to 44 Years | 9 (13.6%) | 50 (75.8%) |
| 45 to 54 Years | 3 (10.7%) | 23 (82.1%) |
| 55 to 64 Years | 0 (0.0%) | 16 (100.0%) |
| 65 to 74 Years | 12 (100.0%) | 0 (0.0%) |
| 75 Years and over | 7 (100.0%) | 0 (0.0%) |
| Total | 165 (19.2%) | 592 (68.9%) |
Disability Status by Sex by Age in Rocky Ridge
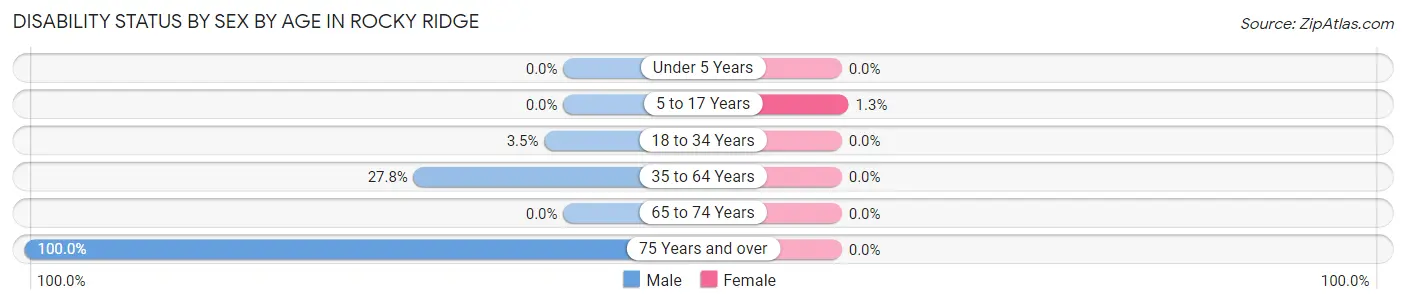
| Age Bracket | Male | Female |
| Under 5 Years | 0 (0.0%) | 0 (0.0%) |
| 5 to 17 Years | 0 (0.0%) | 2 (1.3%) |
| 18 to 34 Years | 4 (3.5%) | 0 (0.0%) |
| 35 to 64 Years | 10 (27.8%) | 0 (0.0%) |
| 65 to 74 Years | 0 (0.0%) | 0 (0.0%) |
| 75 Years and over | 7 (100.0%) | 0 (0.0%) |
Disability Class by Sex by Age in Rocky Ridge
Disability Class: Hearing Difficulty
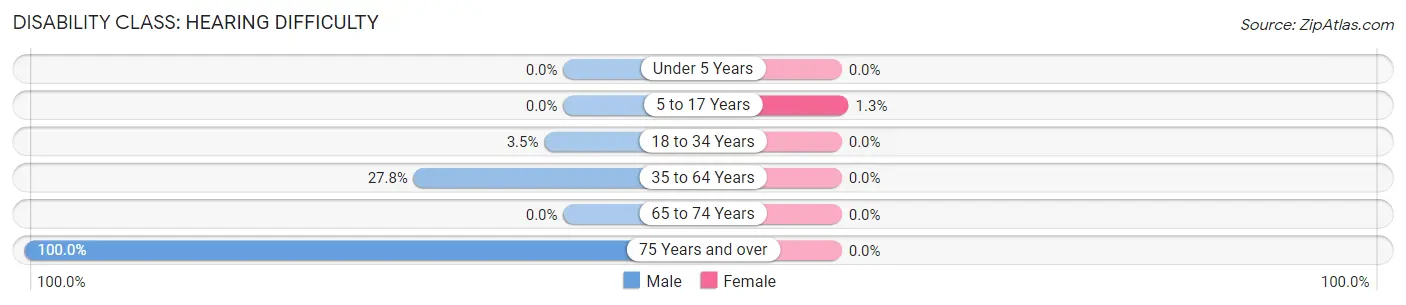
| Age Bracket | Male | Female |
| Under 5 Years | 0 (0.0%) | 0 (0.0%) |
| 5 to 17 Years | 0 (0.0%) | 2 (1.3%) |
| 18 to 34 Years | 4 (3.5%) | 0 (0.0%) |
| 35 to 64 Years | 10 (27.8%) | 0 (0.0%) |
| 65 to 74 Years | 0 (0.0%) | 0 (0.0%) |
| 75 Years and over | 7 (100.0%) | 0 (0.0%) |
Disability Class: Vision Difficulty
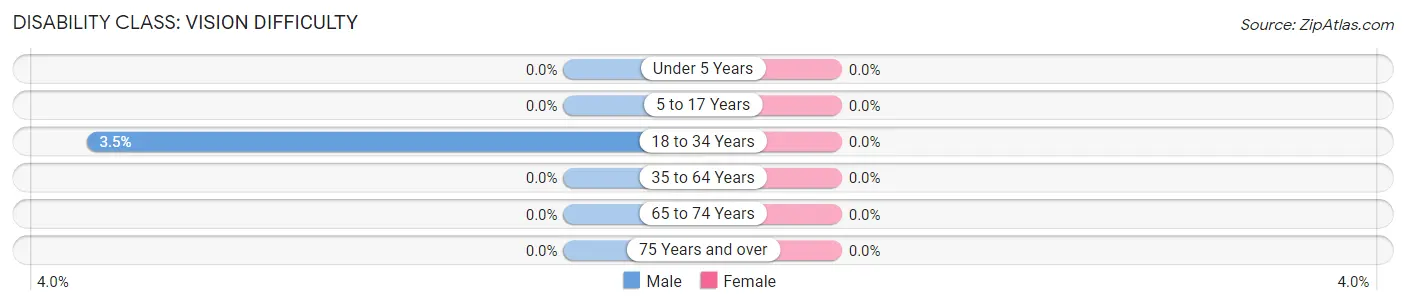
| Age Bracket | Male | Female |
| Under 5 Years | 0 (0.0%) | 0 (0.0%) |
| 5 to 17 Years | 0 (0.0%) | 0 (0.0%) |
| 18 to 34 Years | 4 (3.5%) | 0 (0.0%) |
| 35 to 64 Years | 0 (0.0%) | 0 (0.0%) |
| 65 to 74 Years | 0 (0.0%) | 0 (0.0%) |
| 75 Years and over | 0 (0.0%) | 0 (0.0%) |
Disability Class: Cognitive Difficulty

| Age Bracket | Male | Female |
| 5 to 17 Years | 0 (0.0%) | 0 (0.0%) |
| 18 to 34 Years | 4 (3.5%) | 0 (0.0%) |
| 35 to 64 Years | 0 (0.0%) | 0 (0.0%) |
| 65 to 74 Years | 0 (0.0%) | 0 (0.0%) |
| 75 Years and over | 0 (0.0%) | 0 (0.0%) |
Disability Class: Ambulatory Difficulty
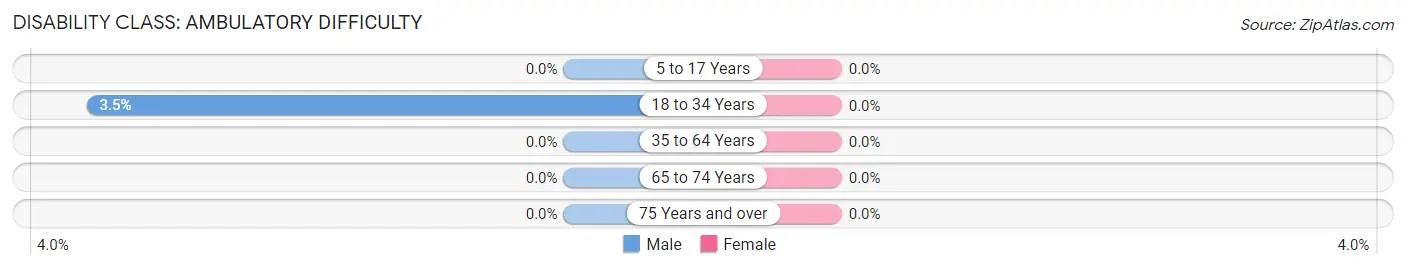
| Age Bracket | Male | Female |
| 5 to 17 Years | 0 (0.0%) | 0 (0.0%) |
| 18 to 34 Years | 4 (3.5%) | 0 (0.0%) |
| 35 to 64 Years | 0 (0.0%) | 0 (0.0%) |
| 65 to 74 Years | 0 (0.0%) | 0 (0.0%) |
| 75 Years and over | 0 (0.0%) | 0 (0.0%) |
Disability Class: Self-Care Difficulty
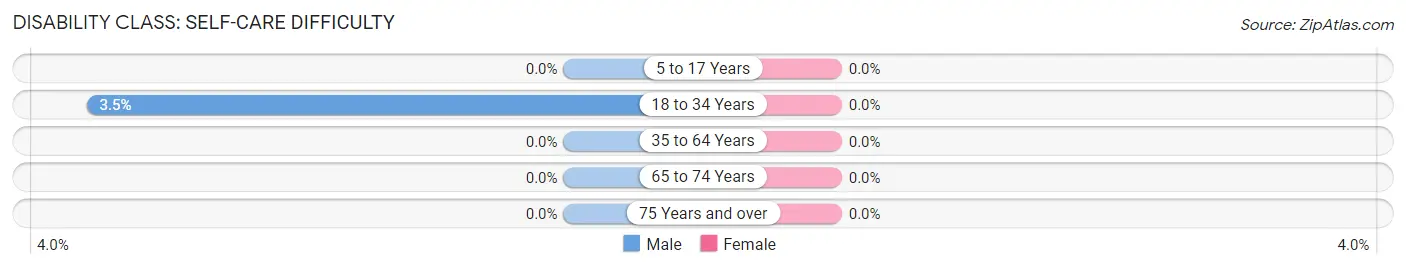
| Age Bracket | Male | Female |
| 5 to 17 Years | 0 (0.0%) | 0 (0.0%) |
| 18 to 34 Years | 4 (3.5%) | 0 (0.0%) |
| 35 to 64 Years | 0 (0.0%) | 0 (0.0%) |
| 65 to 74 Years | 0 (0.0%) | 0 (0.0%) |
| 75 Years and over | 0 (0.0%) | 0 (0.0%) |
Technology Access in Rocky Ridge
Computing Device Access in Rocky Ridge
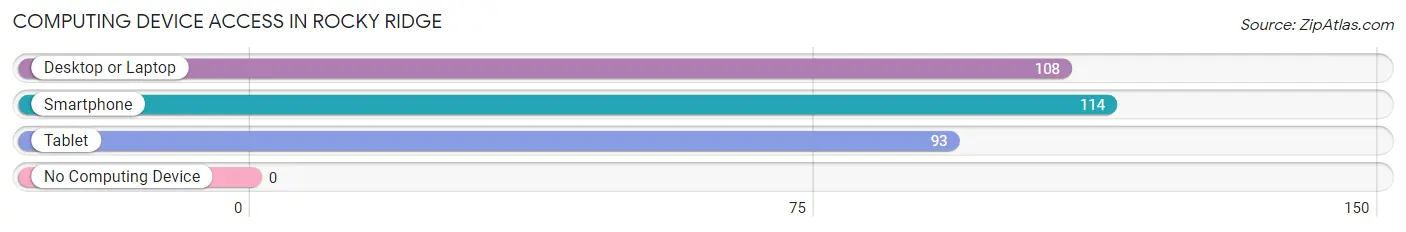
| Device Type | # Households | % Households |
| Desktop or Laptop | 108 | 94.7% |
| Smartphone | 114 | 100.0% |
| Tablet | 93 | 81.6% |
| No Computing Device | 0 | 0.0% |
| Total | 114 | 100.0% |
Internet Access in Rocky Ridge
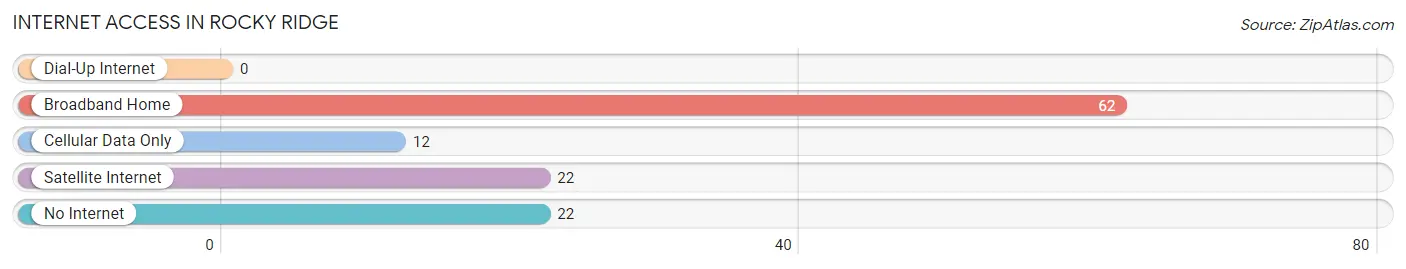
| Internet Type | # Households | % Households |
| Dial-Up Internet | 0 | 0.0% |
| Broadband Home | 62 | 54.4% |
| Cellular Data Only | 12 | 10.5% |
| Satellite Internet | 22 | 19.3% |
| No Internet | 22 | 19.3% |
| Total | 114 | 100.0% |
Rocky Ridge Summary
Rocky Ridge is a small unincorporated community located in the southeastern corner of Utah, United States. It is situated in the San Rafael Swell, a large geological formation in the Colorado Plateau. The community is located in Emery County, approximately 20 miles (32 km) south of the city of Green River.
History
The area around Rocky Ridge has been inhabited for thousands of years by Native American tribes, including the Ute, Paiute, and Navajo. The first European settlers arrived in the area in the late 1800s, and the town of Rocky Ridge was established in the early 1900s. The town was named after the rocky ridge that runs through the area.
The town was originally a farming and ranching community, but in the 1950s, the area began to be developed for oil and gas production. This development brought an influx of people to the area, and the population of Rocky Ridge grew rapidly.
Geography
Rocky Ridge is located in the San Rafael Swell, a large geological formation in the Colorado Plateau. The area is characterized by rugged terrain, with steep canyons, mesas, and buttes. The area is also home to a variety of wildlife, including mule deer, elk, and bighorn sheep.
The climate in Rocky Ridge is semi-arid, with hot summers and cold winters. The average annual precipitation is approximately 8 inches (20 cm).
Economy
The economy of Rocky Ridge is largely based on oil and gas production. The area is home to several oil and gas fields, and the town is home to several oil and gas companies.
In addition to oil and gas production, the town is also home to several small businesses, including a grocery store, a hardware store, and a restaurant.
Demographics
As of the 2010 census, the population of Rocky Ridge was 545. The racial makeup of the town was 97.3% White, 0.2% African American, 0.4% Native American, 0.2% Asian, 0.2% Pacific Islander, 0.7% from other races, and 1.2% from two or more races. Hispanic or Latino of any race were 2.2% of the population.
The median household income in Rocky Ridge was $45,000, and the median family income was $50,000. The per capita income was $20,000. About 10.3% of families and 12.2% of the population were below the poverty line, including 16.7% of those under age 18 and none of those age 65 or over.
Common Questions
What is Per Capita Income in Rocky Ridge?
Per Capita income in Rocky Ridge is $13,268.
What is the Median Family Income in Rocky Ridge?
Median Family Income in Rocky Ridge is $86,250.
What is the Median Household income in Rocky Ridge?
Median Household Income in Rocky Ridge is $86,250.
What is Income or Wage Gap in Rocky Ridge?
Income or Wage Gap in Rocky Ridge is 54.4%.
Women in Rocky Ridge earn 45.6 cents for every dollar earned by a man.
What is Family Income Deficit in Rocky Ridge?
Family Income Deficit in Rocky Ridge is $17,344.
Families that are below poverty line in Rocky Ridge earn $17,344 less on average than the poverty threshold level.
What is Inequality or Gini Index in Rocky Ridge?
Inequality or Gini Index in Rocky Ridge is 0.34.
What is the Total Population of Rocky Ridge?
Total Population of Rocky Ridge is 859.
What is the Total Male Population of Rocky Ridge?
Total Male Population of Rocky Ridge is 401.
What is the Total Female Population of Rocky Ridge?
Total Female Population of Rocky Ridge is 458.
What is the Ratio of Males per 100 Females in Rocky Ridge?
There are 87.55 Males per 100 Females in Rocky Ridge.
What is the Ratio of Females per 100 Males in Rocky Ridge?
There are 114.21 Females per 100 Males in Rocky Ridge.
What is the Median Population Age in Rocky Ridge?
Median Population Age in Rocky Ridge is 14.6 Years.
What is the Average Family Size in Rocky Ridge
Average Family Size in Rocky Ridge is 7.5 People.
What is the Average Household Size in Rocky Ridge
Average Household Size in Rocky Ridge is 7.5 People.
How Large is the Labor Force in Rocky Ridge?
There are 332 People in the Labor Forcein in Rocky Ridge.
What is the Percentage of People in the Labor Force in Rocky Ridge?
83.8% of People are in the Labor Force in Rocky Ridge.
What is the Unemployment Rate in Rocky Ridge?
Unemployment Rate in Rocky Ridge is 2.1%.