Castle Valley, UT Map & Demographics
Castle Valley Map
Castle Valley Overview
$43,022
PER CAPITA INCOME
$43,438
AVG HOUSEHOLD INCOME
0.46
INEQUALITY / GINI INDEX
409
TOTAL POPULATION
238
MALE POPULATION
171
FEMALE POPULATION
139.18
MALES / 100 FEMALES
71.85
FEMALES / 100 MALES
63.5
MEDIAN AGE
2.6
AVG FAMILY SIZE
2.0
AVG HOUSEHOLD SIZE
187
LABOR FORCE [ PEOPLE ]
53.9%
PERCENT IN LABOR FORCE
Castle Valley Area Codes
Income in Castle Valley
Income Overview in Castle Valley
| Characteristic | Number | Measure |
| Per Capita Income | 409 | $43,022 |
| Median Family Income | 120 | $0 |
| Mean Family Income | 120 | $113,171 |
| Median Household Income | 209 | $43,438 |
| Mean Household Income | 209 | $82,484 |
| Income Deficit | 120 | $0 |
| Wage / Income Gap (%) | 409 | 0.00% |
| Wage / Income Gap ($) | 409 | 100.00¢ per $1 |
| Gini / Inequality Index | 409 | 0.46 |
Earnings by Sex in Castle Valley
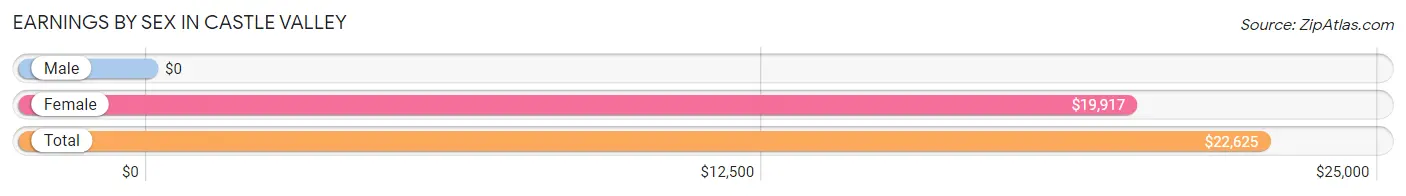
| Sex | Number | Average Earnings |
| Male | 114 (54.8%) | $0 |
| Female | 94 (45.2%) | $19,917 |
| Total | 208 (100.0%) | $22,625 |
Earnings by Sex by Income Bracket in Castle Valley
The most common earnings brackets in Castle Valley are $22,500 to $24,999 for men (19 | 16.7%) and $17,500 to $19,999 for women (30 | 31.9%).
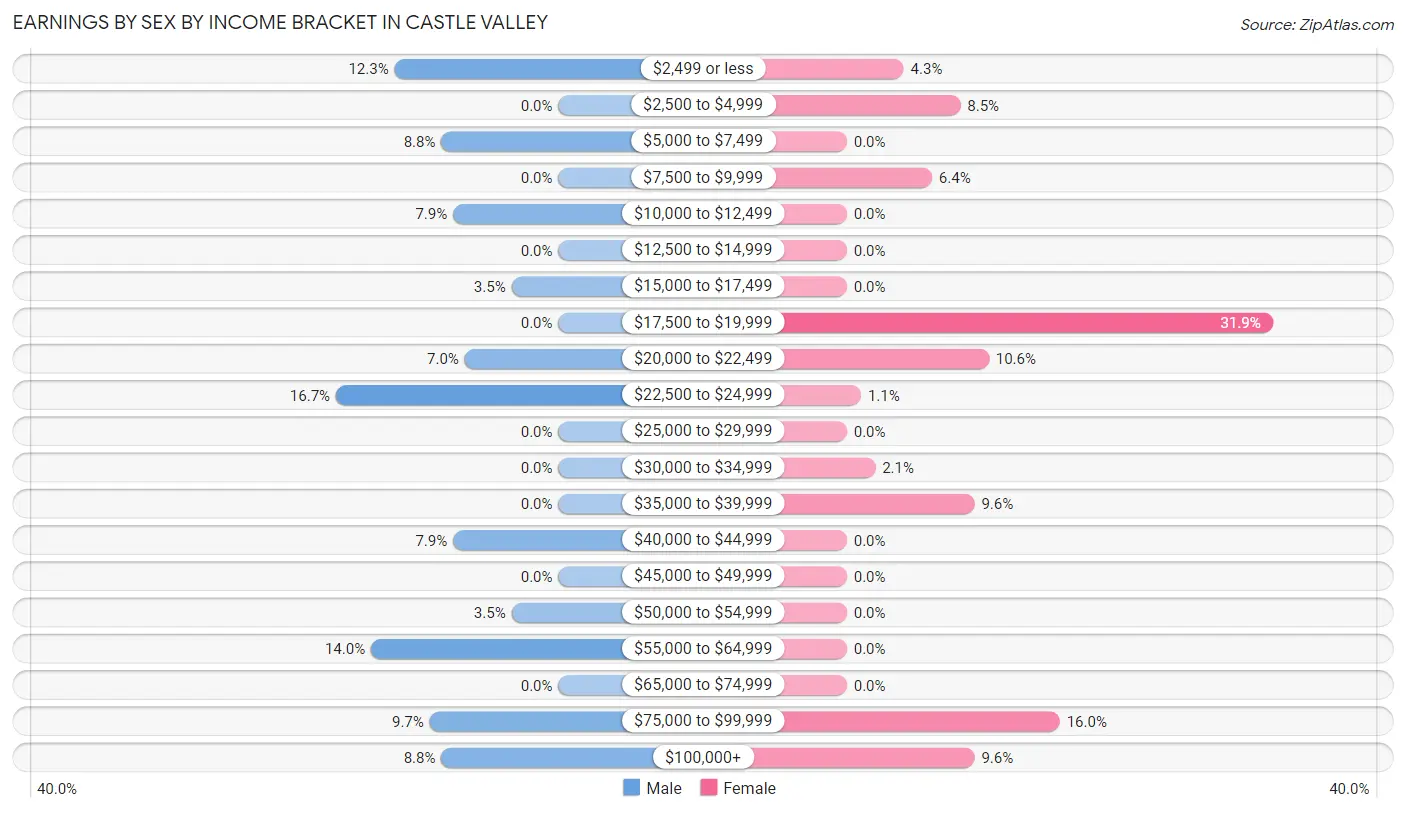
| Income | Male | Female |
| $2,499 or less | 14 (12.3%) | 4 (4.3%) |
| $2,500 to $4,999 | 0 (0.0%) | 8 (8.5%) |
| $5,000 to $7,499 | 10 (8.8%) | 0 (0.0%) |
| $7,500 to $9,999 | 0 (0.0%) | 6 (6.4%) |
| $10,000 to $12,499 | 9 (7.9%) | 0 (0.0%) |
| $12,500 to $14,999 | 0 (0.0%) | 0 (0.0%) |
| $15,000 to $17,499 | 4 (3.5%) | 0 (0.0%) |
| $17,500 to $19,999 | 0 (0.0%) | 30 (31.9%) |
| $20,000 to $22,499 | 8 (7.0%) | 10 (10.6%) |
| $22,500 to $24,999 | 19 (16.7%) | 1 (1.1%) |
| $25,000 to $29,999 | 0 (0.0%) | 0 (0.0%) |
| $30,000 to $34,999 | 0 (0.0%) | 2 (2.1%) |
| $35,000 to $39,999 | 0 (0.0%) | 9 (9.6%) |
| $40,000 to $44,999 | 9 (7.9%) | 0 (0.0%) |
| $45,000 to $49,999 | 0 (0.0%) | 0 (0.0%) |
| $50,000 to $54,999 | 4 (3.5%) | 0 (0.0%) |
| $55,000 to $64,999 | 16 (14.0%) | 0 (0.0%) |
| $65,000 to $74,999 | 0 (0.0%) | 0 (0.0%) |
| $75,000 to $99,999 | 11 (9.7%) | 15 (16.0%) |
| $100,000+ | 10 (8.8%) | 9 (9.6%) |
| Total | 114 (100.0%) | 94 (100.0%) |
Earnings by Sex by Educational Attainment in Castle Valley
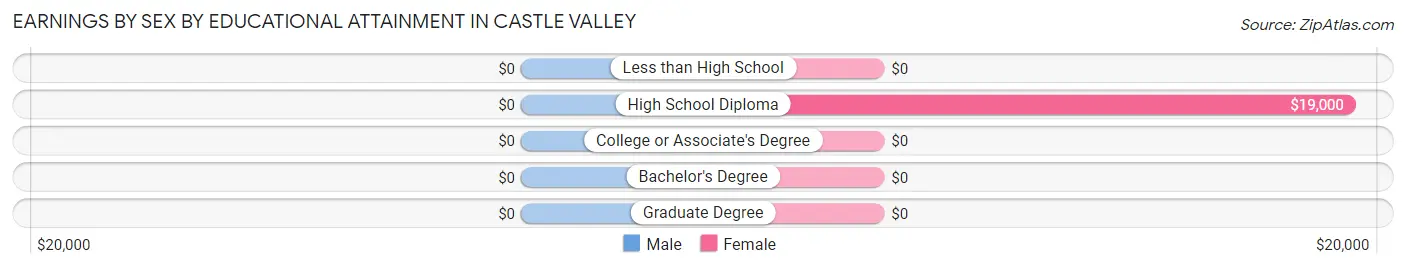
| Educational Attainment | Male Income | Female Income |
| Less than High School | - | - |
| High School Diploma | - | - |
| College or Associate's Degree | - | - |
| Bachelor's Degree | - | - |
| Graduate Degree | - | - |
| Total | - | - |
Family Income in Castle Valley
Family Income Brackets in Castle Valley
According to the Castle Valley family income data, there are 26 families falling into the $150,000 to $199,999 income range, which is the most common income bracket and makes up 21.7% of all families.
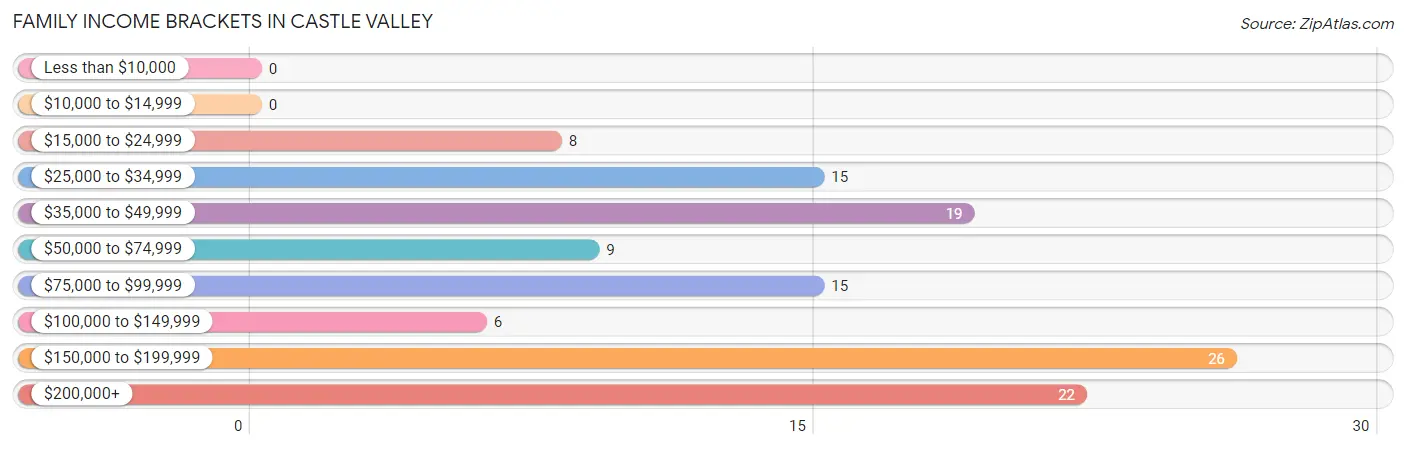
| Income Bracket | # Families | % Families |
| Less than $10,000 | 0 | 0.0% |
| $10,000 to $14,999 | 0 | 0.0% |
| $15,000 to $24,999 | 8 | 6.7% |
| $25,000 to $34,999 | 15 | 12.5% |
| $35,000 to $49,999 | 19 | 15.8% |
| $50,000 to $74,999 | 9 | 7.5% |
| $75,000 to $99,999 | 15 | 12.5% |
| $100,000 to $149,999 | 6 | 5.0% |
| $150,000 to $199,999 | 26 | 21.7% |
| $200,000+ | 22 | 18.3% |
Family Income by Famaliy Size in Castle Valley
| Income Bracket | # Families | Median Income |
| 2-Person Families | 92 (76.7%) | $0 |
| 3-Person Families | 0 (0.0%) | $0 |
| 4-Person Families | 28 (23.3%) | $0 |
| 5-Person Families | 0 (0.0%) | $0 |
| 6-Person Families | 0 (0.0%) | $0 |
| 7+ Person Families | 0 (0.0%) | $0 |
| Total | 120 (100.0%) | $0 |
Family Income by Number of Earners in Castle Valley
| Number of Earners | # Families | Median Income |
| No Earners | 28 (23.3%) | $0 |
| 1 Earner | 36 (30.0%) | $0 |
| 2 Earners | 56 (46.7%) | $0 |
| 3+ Earners | 0 (0.0%) | $0 |
| Total | 120 (100.0%) | $0 |
Household Income in Castle Valley
Household Income Brackets in Castle Valley
With 49 households falling in the category, the $25,000 to $34,999 income range is the most frequent in Castle Valley, accounting for 23.4% of all households.
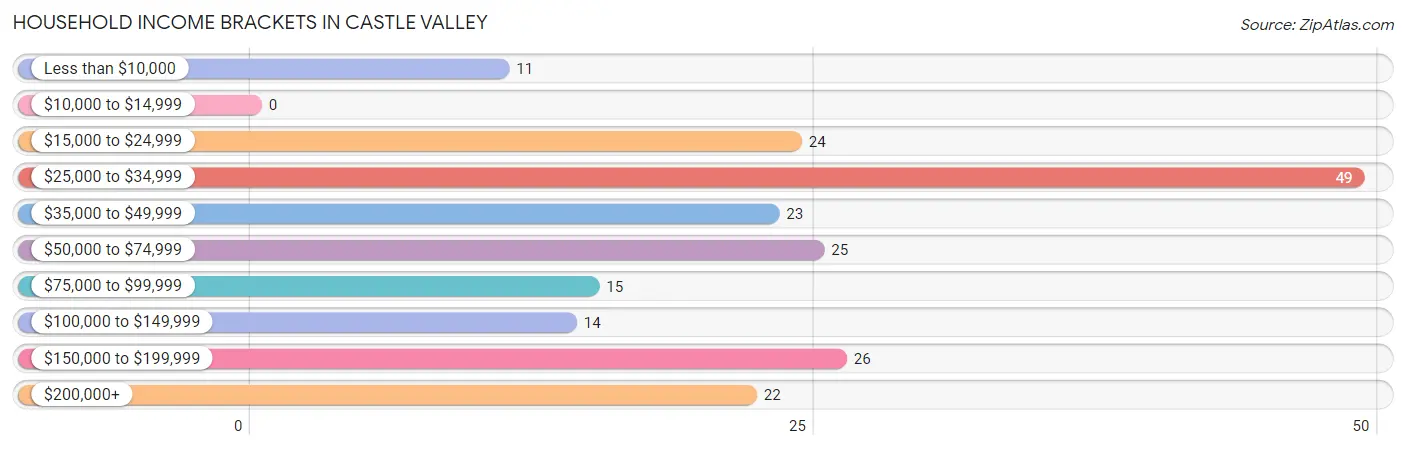
| Income Bracket | # Households | % Households |
| Less than $10,000 | 11 | 5.3% |
| $10,000 to $14,999 | 0 | 0.0% |
| $15,000 to $24,999 | 24 | 11.5% |
| $25,000 to $34,999 | 49 | 23.4% |
| $35,000 to $49,999 | 23 | 11.0% |
| $50,000 to $74,999 | 25 | 12.0% |
| $75,000 to $99,999 | 15 | 7.2% |
| $100,000 to $149,999 | 14 | 6.7% |
| $150,000 to $199,999 | 26 | 12.4% |
| $200,000+ | 22 | 10.5% |
Household Income by Householder Age in Castle Valley
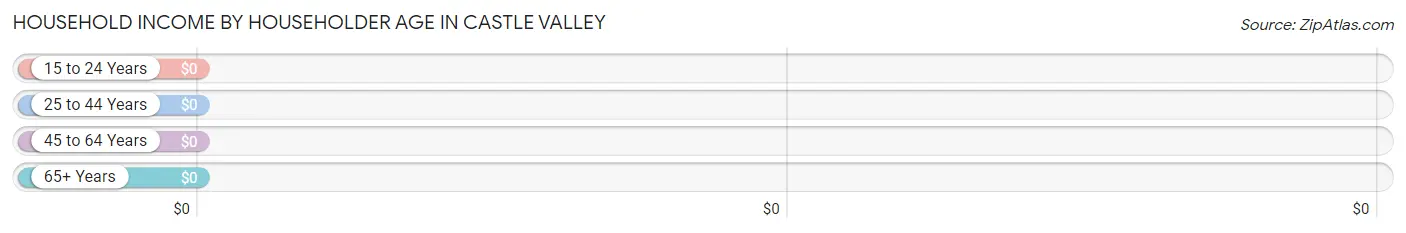
| Income Bracket | # Households | Median Income |
| 15 to 24 Years | 2 (1.0%) | $0 |
| 25 to 44 Years | 14 (6.7%) | $0 |
| 45 to 64 Years | 69 (33.0%) | $0 |
| 65+ Years | 124 (59.3%) | $0 |
| Total | 209 (100.0%) | $43,438 |
Poverty in Castle Valley
Income Below Poverty by Sex and Age in Castle Valley

| Age Bracket | Male | Female |
| Under 5 Years | 0 (0.0%) | 0 (0.0%) |
| 5 Years | 0 (0.0%) | 0 (0.0%) |
| 6 to 11 Years | 0 (0.0%) | 0 (0.0%) |
| 12 to 14 Years | 0 (0.0%) | 0 (0.0%) |
| 15 Years | 0 (0.0%) | 0 (0.0%) |
| 16 and 17 Years | 0 (0.0%) | 0 (0.0%) |
| 18 to 24 Years | 0 (0.0%) | 0 (0.0%) |
| 25 to 34 Years | 0 (0.0%) | 0 (0.0%) |
| 35 to 44 Years | 0 (0.0%) | 0 (0.0%) |
| 45 to 54 Years | 0 (0.0%) | 0 (0.0%) |
| 55 to 64 Years | 10 (29.4%) | 0 (0.0%) |
| 65 to 74 Years | 0 (0.0%) | 0 (0.0%) |
| 75 Years and over | 11 (19.0%) | 0 (0.0%) |
| Total | 21 (8.8%) | 0 (0.0%) |
Income Above Poverty by Sex and Age in Castle Valley
According to the poverty statistics in Castle Valley, males aged under 5 years and females aged under 5 years are the age groups that are most secure financially, with 100.0% of males and 100.0% of females in these age groups living above the poverty line.
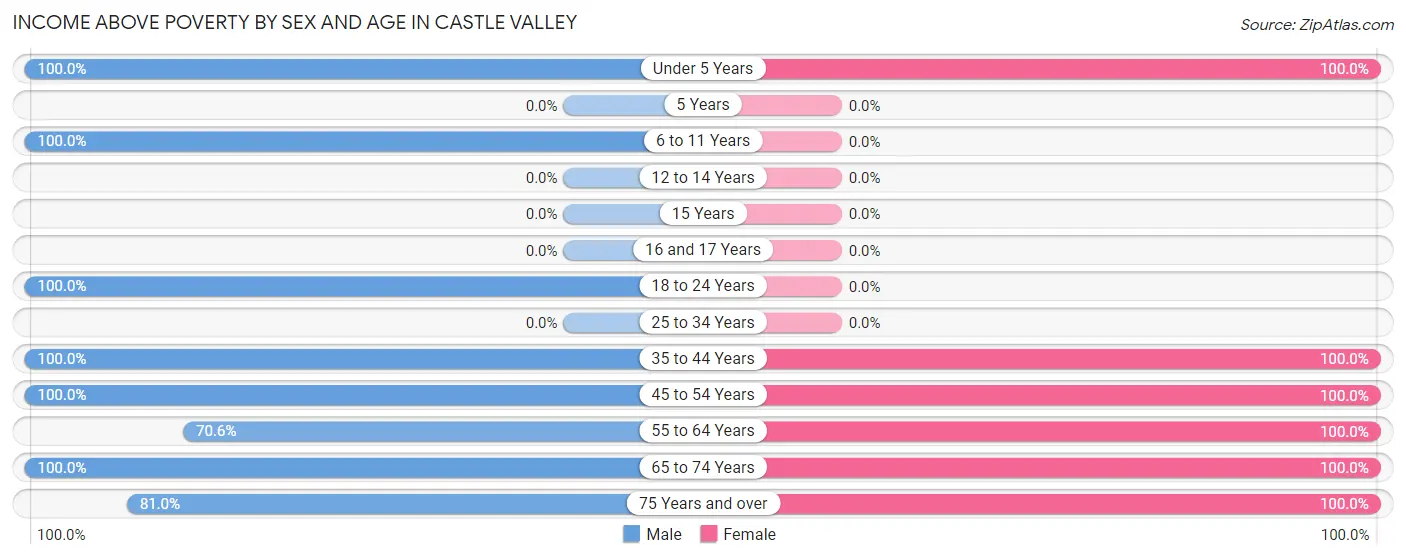
| Age Bracket | Male | Female |
| Under 5 Years | 9 (100.0%) | 9 (100.0%) |
| 5 Years | 0 (0.0%) | 0 (0.0%) |
| 6 to 11 Years | 44 (100.0%) | 0 (0.0%) |
| 12 to 14 Years | 0 (0.0%) | 0 (0.0%) |
| 15 Years | 0 (0.0%) | 0 (0.0%) |
| 16 and 17 Years | 0 (0.0%) | 0 (0.0%) |
| 18 to 24 Years | 2 (100.0%) | 0 (0.0%) |
| 25 to 34 Years | 0 (0.0%) | 0 (0.0%) |
| 35 to 44 Years | 23 (100.0%) | 40 (100.0%) |
| 45 to 54 Years | 27 (100.0%) | 19 (100.0%) |
| 55 to 64 Years | 24 (70.6%) | 19 (100.0%) |
| 65 to 74 Years | 41 (100.0%) | 53 (100.0%) |
| 75 Years and over | 47 (81.0%) | 31 (100.0%) |
| Total | 217 (91.2%) | 171 (100.0%) |
Income Below Poverty Among Married-Couple Families in Castle Valley
| Children | Above Poverty | Below Poverty |
| No Children | 90 (100.0%) | 0 (0.0%) |
| 1 or 2 Children | 28 (100.0%) | 0 (0.0%) |
| 3 or 4 Children | 0 (0.0%) | 0 (0.0%) |
| 5 or more Children | 0 (0.0%) | 0 (0.0%) |
| Total | 118 (100.0%) | 0 (0.0%) |
Income Below Poverty Among Single-Parent Households in Castle Valley
| Children | Single Father | Single Mother |
| No Children | 0 (0.0%) | 0 (0.0%) |
| 1 or 2 Children | 0 (0.0%) | 0 (0.0%) |
| 3 or 4 Children | 0 (0.0%) | 0 (0.0%) |
| 5 or more Children | 0 (0.0%) | 0 (0.0%) |
| Total | 0 (0.0%) | 0 (0.0%) |
Income Below Poverty Among Married-Couple vs Single-Parent Households in Castle Valley
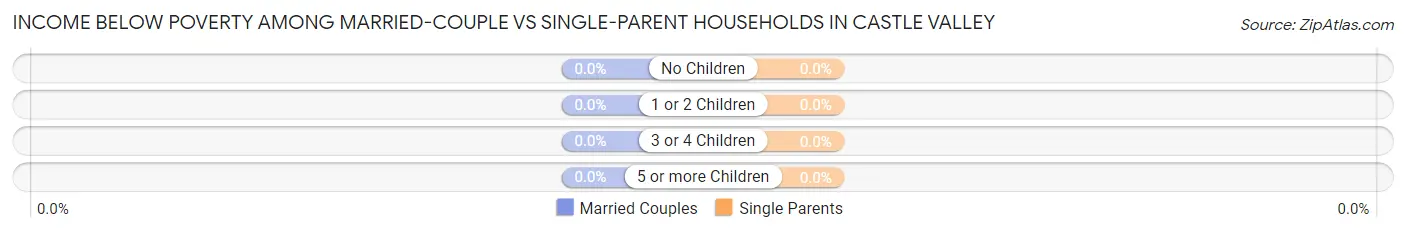
| Children | Married-Couple Families | Single-Parent Households |
| No Children | 0 (0.0%) | 0 (0.0%) |
| 1 or 2 Children | 0 (0.0%) | 0 (0.0%) |
| 3 or 4 Children | 0 (0.0%) | 0 (0.0%) |
| 5 or more Children | 0 (0.0%) | 0 (0.0%) |
| Total | 0 (0.0%) | 0 (0.0%) |
Race in Castle Valley
The most populous races in Castle Valley are , and White / Caucasian (409 | 100.0%).
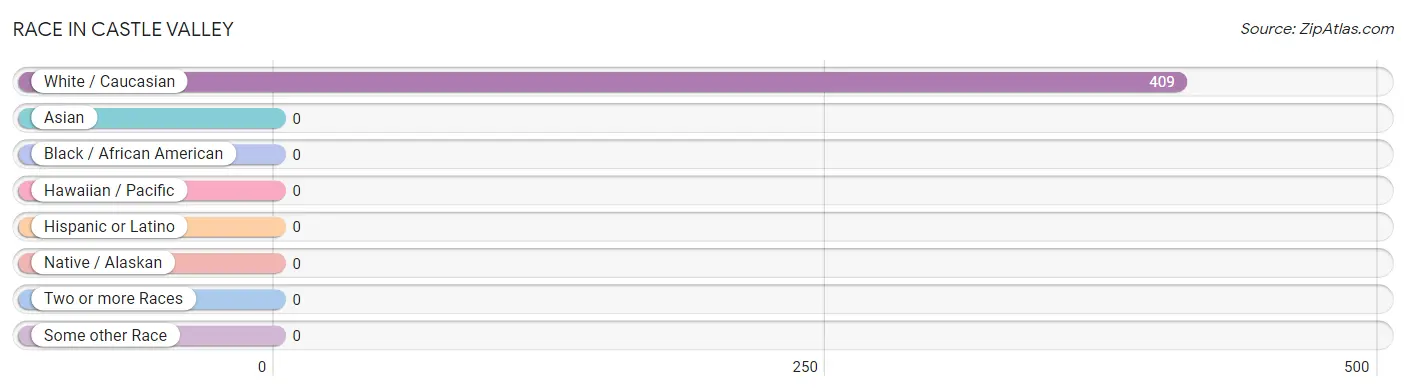
| Race | # Population | % Population |
| Asian | 0 | 0.0% |
| Black / African American | 0 | 0.0% |
| Hawaiian / Pacific | 0 | 0.0% |
| Hispanic or Latino | 0 | 0.0% |
| Native / Alaskan | 0 | 0.0% |
| White / Caucasian | 409 | 100.0% |
| Two or more Races | 0 | 0.0% |
| Some other Race | 0 | 0.0% |
| Total | 409 | 100.0% |
Ancestry in Castle Valley
The most populous ancestries reported in Castle Valley are German (195 | 47.7%), Irish (129 | 31.5%), English (114 | 27.9%), Norwegian (20 | 4.9%), and Polish (20 | 4.9%), together accounting for 116.9% of all Castle Valley residents.
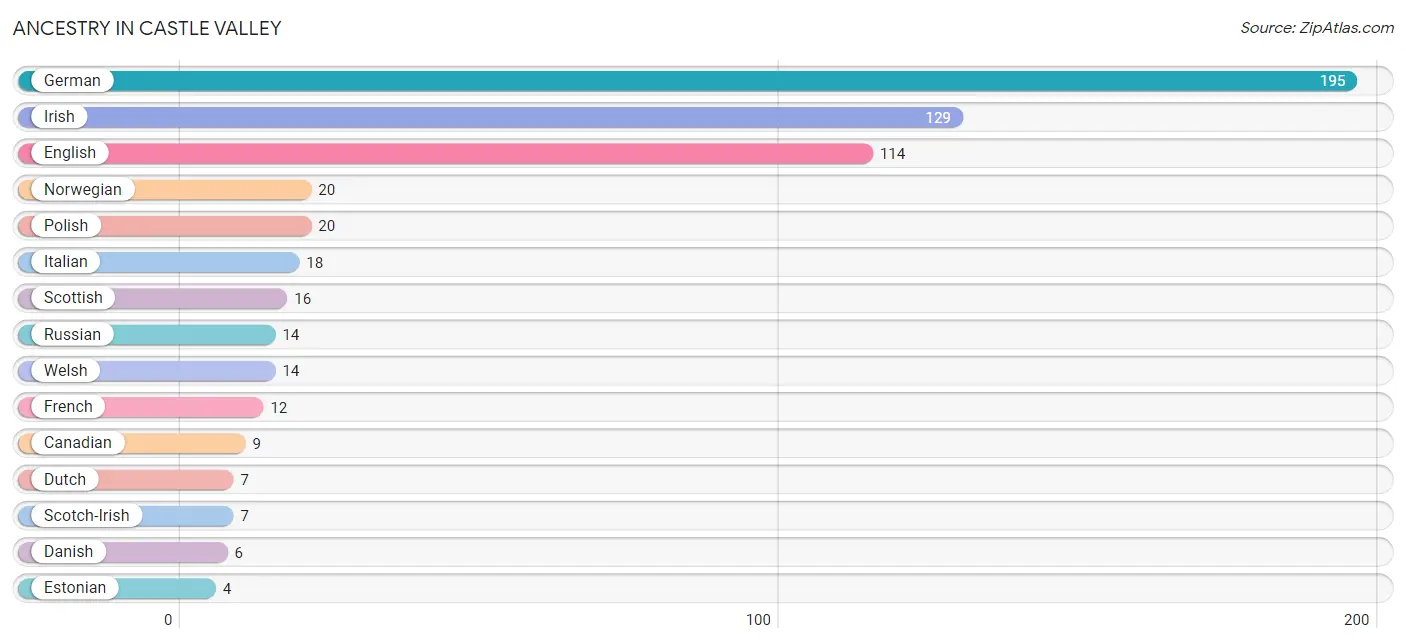
| Ancestry | # Population | % Population |
| Canadian | 9 | 2.2% |
| Danish | 6 | 1.5% |
| Dutch | 7 | 1.7% |
| English | 114 | 27.9% |
| Estonian | 4 | 1.0% |
| French | 12 | 2.9% |
| French Canadian | 4 | 1.0% |
| German | 195 | 47.7% |
| Hungarian | 4 | 1.0% |
| Irish | 129 | 31.5% |
| Italian | 18 | 4.4% |
| Norwegian | 20 | 4.9% |
| Polish | 20 | 4.9% |
| Russian | 14 | 3.4% |
| Scotch-Irish | 7 | 1.7% |
| Scottish | 16 | 3.9% |
| Swedish | 4 | 1.0% |
| Welsh | 14 | 3.4% | View All 18 Rows |
Immigrants in Castle Valley
The most numerous immigrant groups reported in Castle Valley came from Europe (32 | 7.8%), Germany (28 | 6.9%), Western Europe (28 | 6.9%), and Eastern Europe (4 | 1.0%), together accounting for 22.5% of all Castle Valley residents.
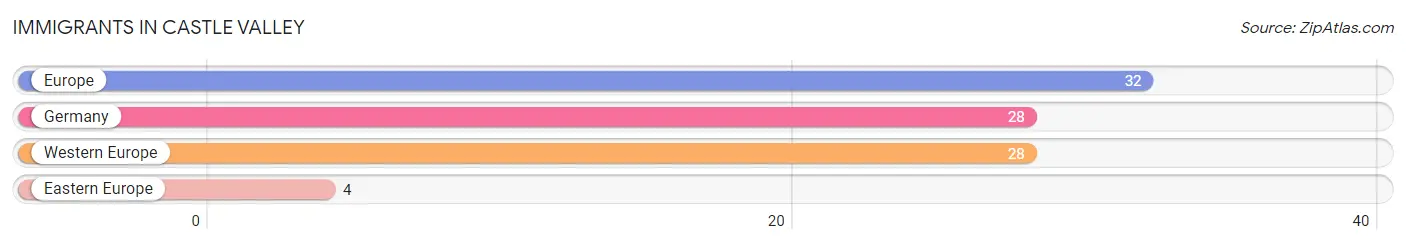
| Immigration Origin | # Population | % Population |
| Eastern Europe | 4 | 1.0% |
| Europe | 32 | 7.8% |
| Germany | 28 | 6.9% |
| Western Europe | 28 | 6.9% | View All 4 Rows |
Sex and Age in Castle Valley
Sex and Age in Castle Valley
The most populous age groups in Castle Valley are 75 to 79 Years (58 | 24.4%) for men and 35 to 39 Years (40 | 23.4%) for women.
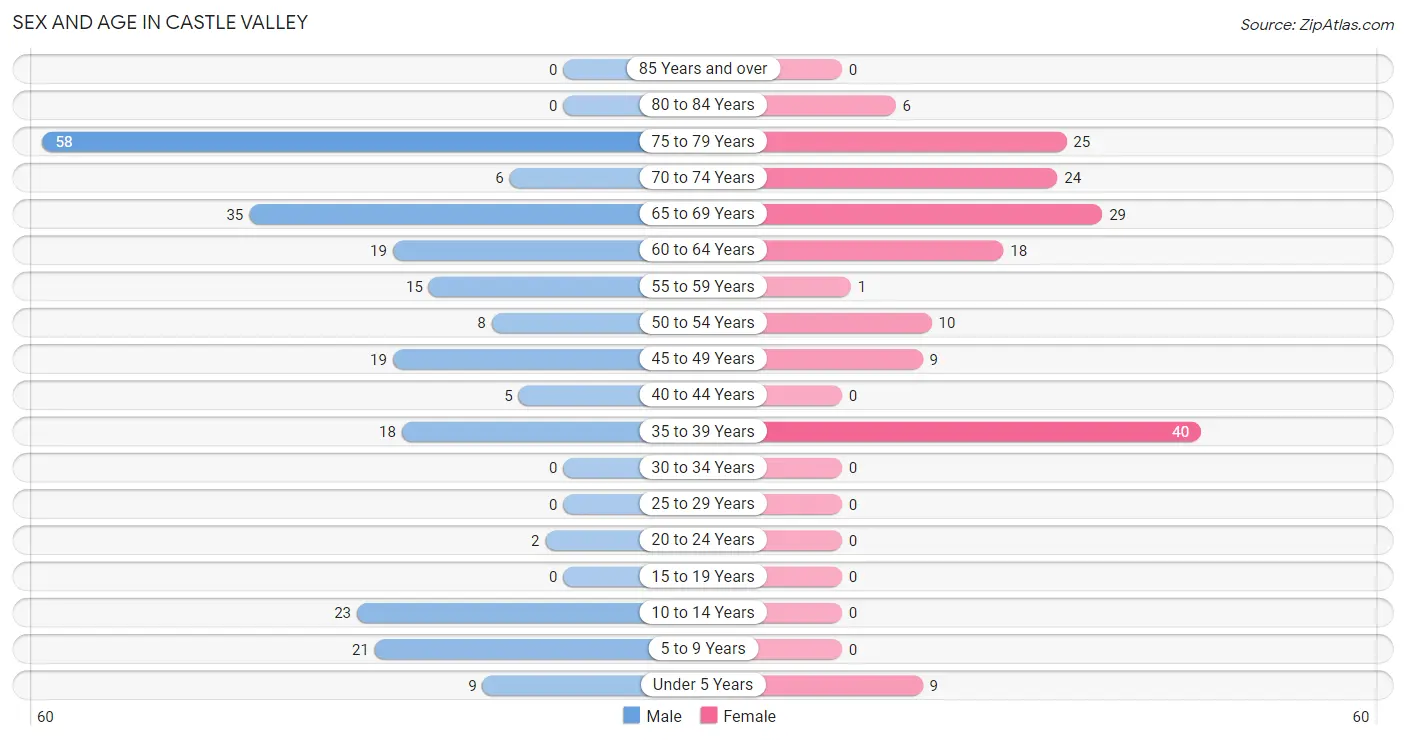
| Age Bracket | Male | Female |
| Under 5 Years | 9 (3.8%) | 9 (5.3%) |
| 5 to 9 Years | 21 (8.8%) | 0 (0.0%) |
| 10 to 14 Years | 23 (9.7%) | 0 (0.0%) |
| 15 to 19 Years | 0 (0.0%) | 0 (0.0%) |
| 20 to 24 Years | 2 (0.8%) | 0 (0.0%) |
| 25 to 29 Years | 0 (0.0%) | 0 (0.0%) |
| 30 to 34 Years | 0 (0.0%) | 0 (0.0%) |
| 35 to 39 Years | 18 (7.6%) | 40 (23.4%) |
| 40 to 44 Years | 5 (2.1%) | 0 (0.0%) |
| 45 to 49 Years | 19 (8.0%) | 9 (5.3%) |
| 50 to 54 Years | 8 (3.4%) | 10 (5.9%) |
| 55 to 59 Years | 15 (6.3%) | 1 (0.6%) |
| 60 to 64 Years | 19 (8.0%) | 18 (10.5%) |
| 65 to 69 Years | 35 (14.7%) | 29 (17.0%) |
| 70 to 74 Years | 6 (2.5%) | 24 (14.0%) |
| 75 to 79 Years | 58 (24.4%) | 25 (14.6%) |
| 80 to 84 Years | 0 (0.0%) | 6 (3.5%) |
| 85 Years and over | 0 (0.0%) | 0 (0.0%) |
| Total | 238 (100.0%) | 171 (100.0%) |
Families and Households in Castle Valley
Median Family Size in Castle Valley
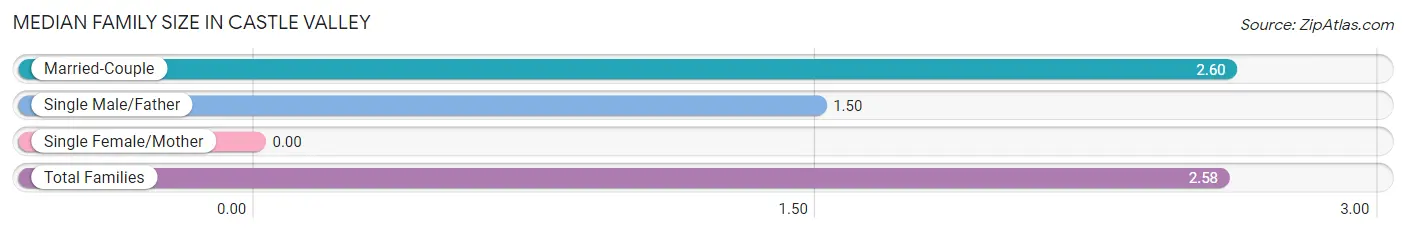
| Family Type | # Families | Family Size |
| Married-Couple | 118 (98.3%) | 2.60 |
| Single Male/Father | 2 (1.7%) | 1.50 |
| Single Female/Mother | 0 (0.0%) | - |
| Total Families | 120 (100.0%) | 2.58 |
Median Household Size in Castle Valley
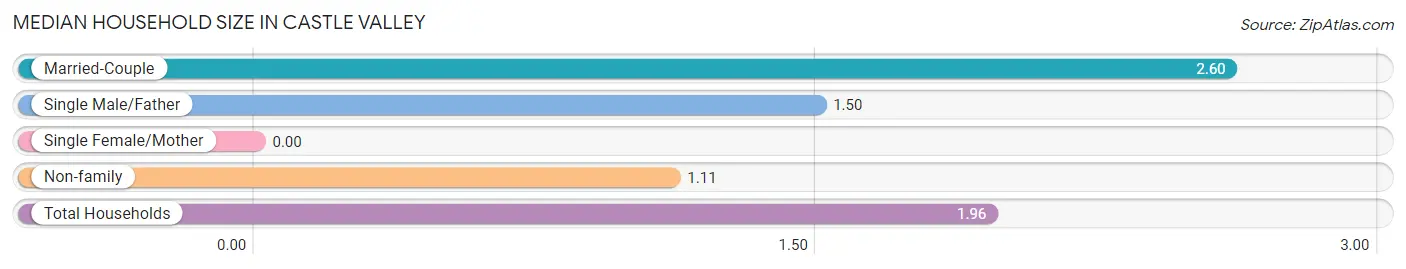
| Household Type | # Households | Household Size |
| Married-Couple | 118 (56.5%) | 2.60 |
| Single Male/Father | 2 (1.0%) | 1.50 |
| Single Female/Mother | 0 (0.0%) | - |
| Non-family | 89 (42.6%) | 1.11 |
| Total Households | 209 (100.0%) | 1.96 |
Household Size by Marriage Status in Castle Valley
Out of a total of 209 households in Castle Valley, 120 (57.4%) are family households, while 89 (42.6%) are nonfamily households. The most numerous type of family households are 2-person households, comprising 92, and the most common type of nonfamily households are 1-person households, comprising 79.
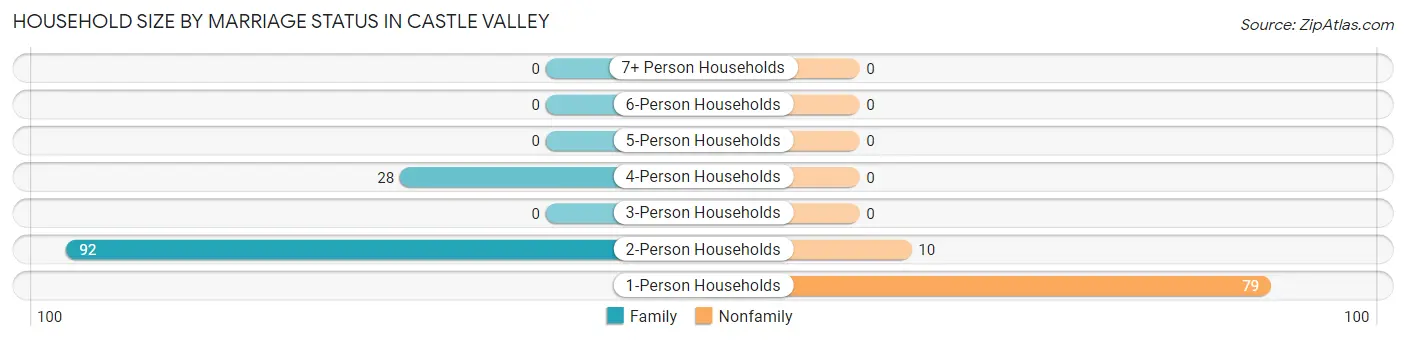
| Household Size | Family Households | Nonfamily Households |
| 1-Person Households | - | 79 (37.8%) |
| 2-Person Households | 92 (44.0%) | 10 (4.8%) |
| 3-Person Households | 0 (0.0%) | 0 (0.0%) |
| 4-Person Households | 28 (13.4%) | 0 (0.0%) |
| 5-Person Households | 0 (0.0%) | 0 (0.0%) |
| 6-Person Households | 0 (0.0%) | 0 (0.0%) |
| 7+ Person Households | 0 (0.0%) | 0 (0.0%) |
| Total | 120 (57.4%) | 89 (42.6%) |
Female Fertility in Castle Valley
Fertility by Age in Castle Valley
| Age Bracket | Women with Births | Births / 1,000 Women |
| 15 to 19 years | 0 (0.0%) | 0.0 |
| 20 to 34 years | 0 (0.0%) | 0.0 |
| 35 to 50 years | 0 (0.0%) | 0.0 |
| Total | 0 (0.0%) | 0.0 |
Fertility by Age by Marriage Status in Castle Valley
| Age Bracket | Married | Unmarried |
| 15 to 19 years | 0 (0.0%) | 0 (0.0%) |
| 20 to 34 years | 0 (0.0%) | 0 (0.0%) |
| 35 to 50 years | 0 (0.0%) | 0 (0.0%) |
| Total | 0 (0.0%) | 0 (0.0%) |
Fertility by Education in Castle Valley
| Educational Attainment | Women with Births | Births / 1,000 Women |
| Less than High School | 0 (0.0%) | 0.0 |
| High School Diploma | 0 (0.0%) | 0.0 |
| College or Associate's Degree | 0 (0.0%) | 0.0 |
| Bachelor's Degree | 0 (0.0%) | 0.0 |
| Graduate Degree | 0 (0.0%) | 0.0 |
| Total | 0 (0.0%) | 0.0 |
Fertility by Education by Marriage Status in Castle Valley
| Educational Attainment | Married | Unmarried |
| Less than High School | 0 (0.0%) | 0 (0.0%) |
| High School Diploma | 0 (0.0%) | 0 (0.0%) |
| College or Associate's Degree | 0 (0.0%) | 0 (0.0%) |
| Bachelor's Degree | 0 (0.0%) | 0 (0.0%) |
| Graduate Degree | 0 (0.0%) | 0 (0.0%) |
| Total | 0 (0.0%) | 0 (0.0%) |
Employment Characteristics in Castle Valley
Employment by Class of Employer in Castle Valley
Among the 185 employed individuals in Castle Valley, self-employed (incorporated) (77 | 41.6%), self-employed (not incorporated) (40 | 21.6%), and not-for-profit organizations (26 | 14.1%) make up the most common classes of employment.
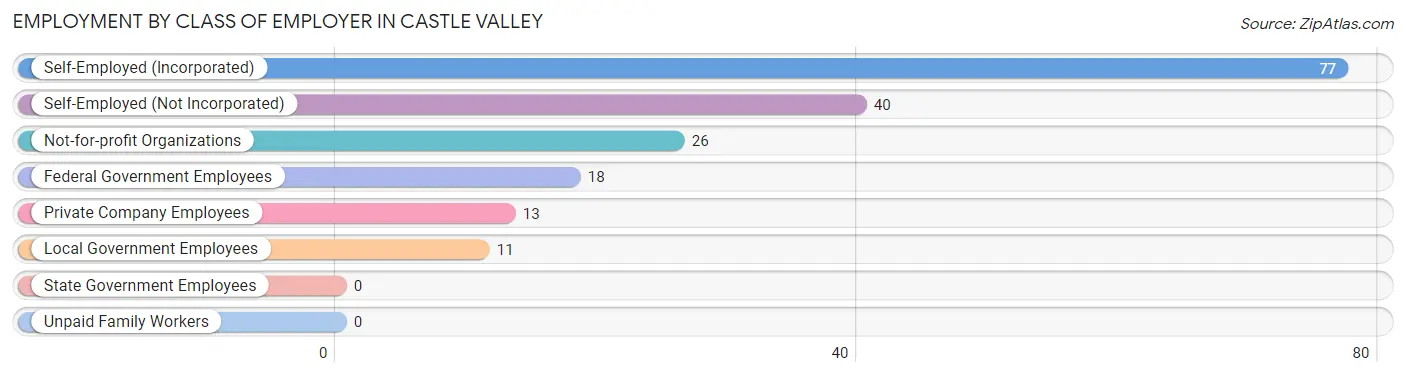
| Employer Class | # Employees | % Employees |
| Private Company Employees | 13 | 7.0% |
| Self-Employed (Incorporated) | 77 | 41.6% |
| Self-Employed (Not Incorporated) | 40 | 21.6% |
| Not-for-profit Organizations | 26 | 14.1% |
| Local Government Employees | 11 | 5.9% |
| State Government Employees | 0 | 0.0% |
| Federal Government Employees | 18 | 9.7% |
| Unpaid Family Workers | 0 | 0.0% |
| Total | 185 | 100.0% |
Employment Status by Age in Castle Valley
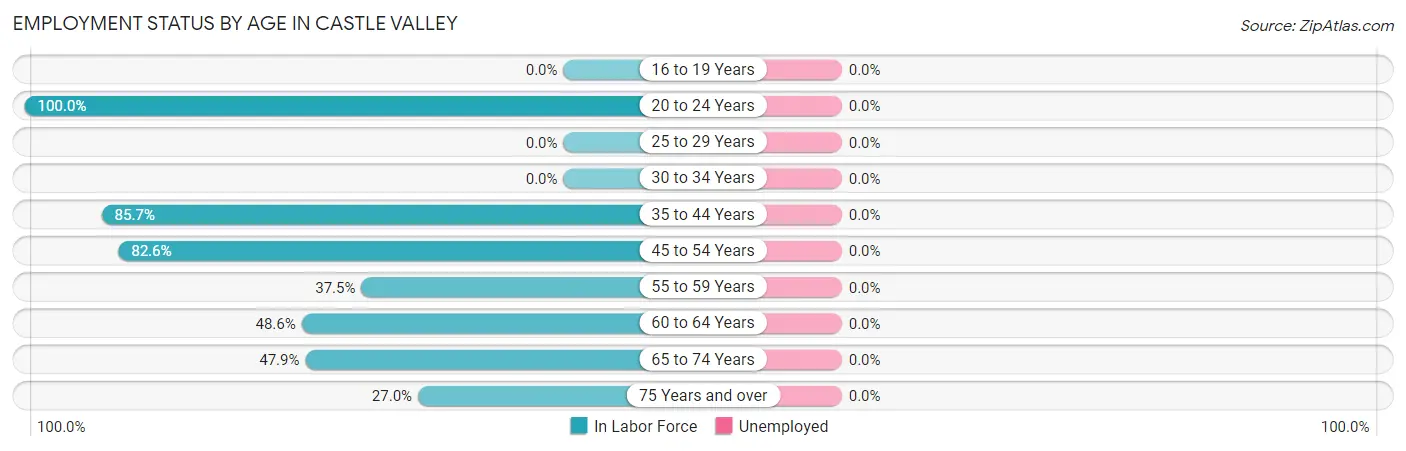
| Age Bracket | In Labor Force | Unemployed |
| 16 to 19 Years | 0 (0.0%) | 0 (0.0%) |
| 20 to 24 Years | 2 (100.0%) | 0 (0.0%) |
| 25 to 29 Years | 0 (0.0%) | 0 (0.0%) |
| 30 to 34 Years | 0 (0.0%) | 0 (0.0%) |
| 35 to 44 Years | 54 (85.7%) | 0 (0.0%) |
| 45 to 54 Years | 38 (82.6%) | 0 (0.0%) |
| 55 to 59 Years | 6 (37.5%) | 0 (0.0%) |
| 60 to 64 Years | 18 (48.6%) | 0 (0.0%) |
| 65 to 74 Years | 45 (47.9%) | 0 (0.0%) |
| 75 Years and over | 24 (27.0%) | 0 (0.0%) |
| Total | 187 (53.9%) | 0 (0.0%) |
Employment Status by Educational Attainment in Castle Valley
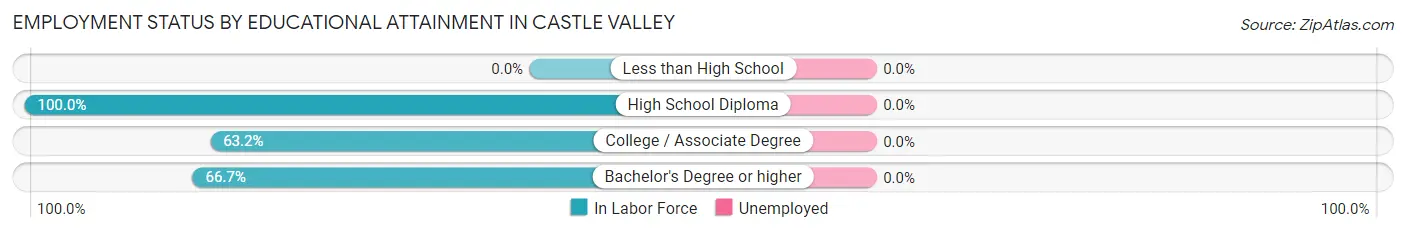
| Educational Attainment | In Labor Force | Unemployed |
| Less than High School | 0 (0.0%) | 0 (0.0%) |
| High School Diploma | 44 (100.0%) | 0 (0.0%) |
| College / Associate Degree | 24 (63.2%) | 0 (0.0%) |
| Bachelor's Degree or higher | 48 (66.7%) | 0 (0.0%) |
| Total | 116 (71.6%) | 0 (0.0%) |
Employment Occupations by Sex in Castle Valley
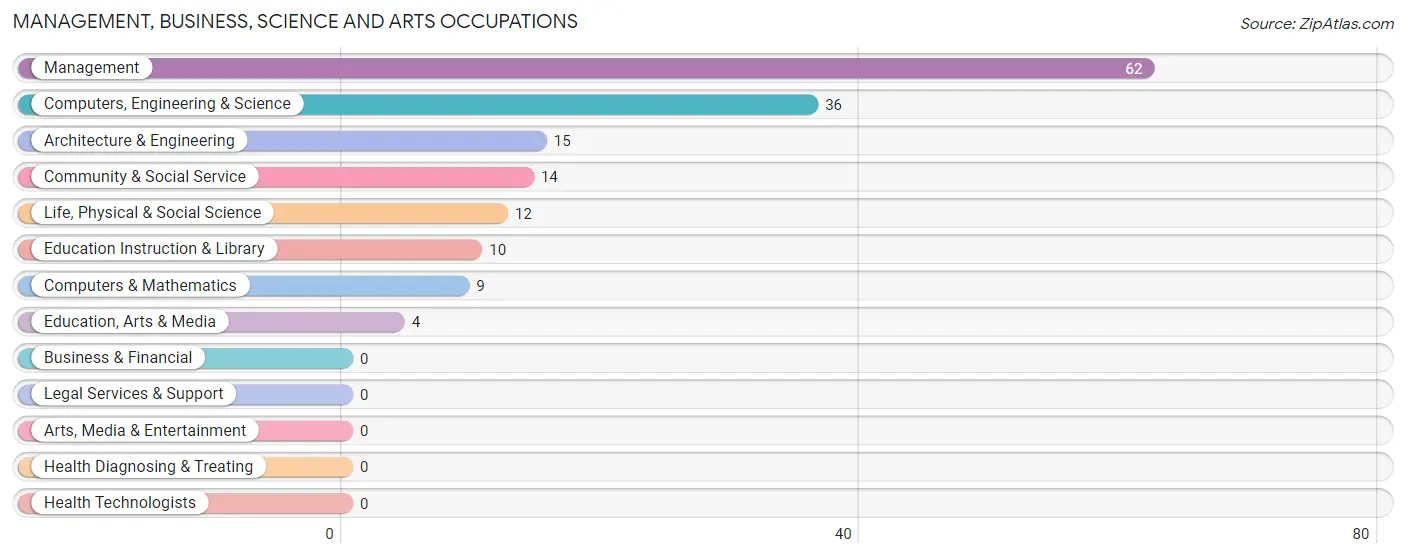
Management, Business, Science and Arts Occupations
The most common Management, Business, Science and Arts occupations in Castle Valley are Management (62 | 33.2%), Computers, Engineering & Science (36 | 19.3%), Architecture & Engineering (15 | 8.0%), Community & Social Service (14 | 7.5%), and Life, Physical & Social Science (12 | 6.4%).
Management, Business, Science and Arts Occupations by Sex
Within the Management, Business, Science and Arts occupations in Castle Valley, the most male-oriented occupations are Architecture & Engineering (100.0%), Education, Arts & Media (100.0%), and Management (93.5%), while the most female-oriented occupations are Computers & Mathematics (100.0%), Education Instruction & Library (100.0%), and Community & Social Service (71.4%).
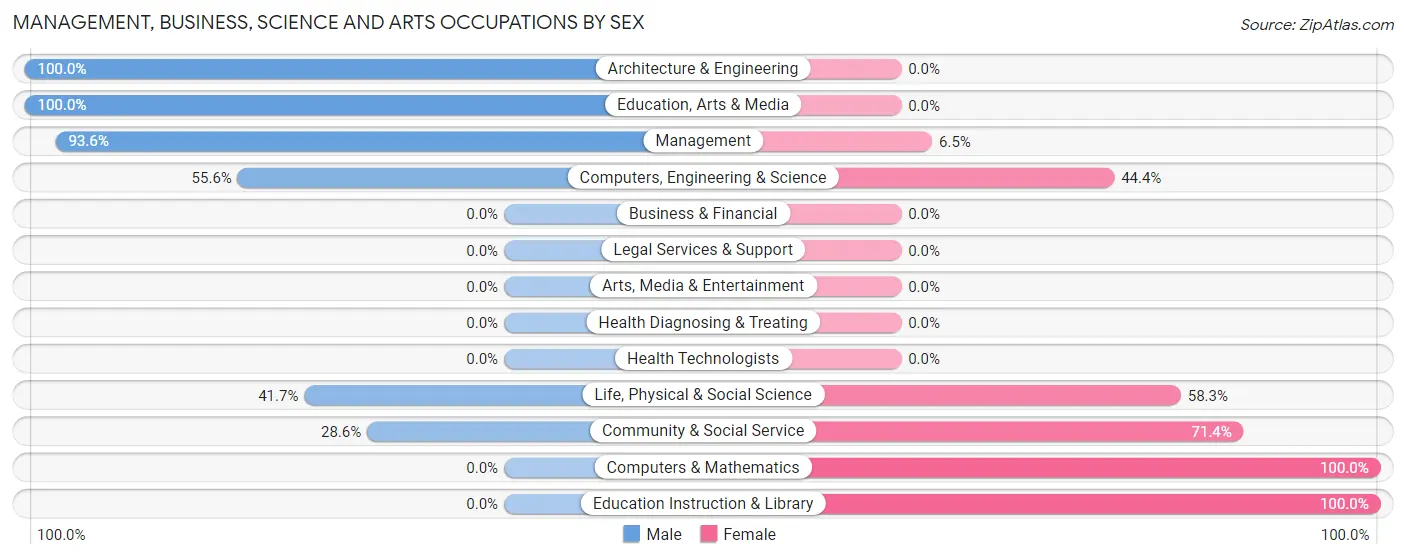
| Occupation | Male | Female |
| Management | 58 (93.5%) | 4 (6.5%) |
| Business & Financial | 0 (0.0%) | 0 (0.0%) |
| Computers, Engineering & Science | 20 (55.6%) | 16 (44.4%) |
| Computers & Mathematics | 0 (0.0%) | 9 (100.0%) |
| Architecture & Engineering | 15 (100.0%) | 0 (0.0%) |
| Life, Physical & Social Science | 5 (41.7%) | 7 (58.3%) |
| Community & Social Service | 4 (28.6%) | 10 (71.4%) |
| Education, Arts & Media | 4 (100.0%) | 0 (0.0%) |
| Legal Services & Support | 0 (0.0%) | 0 (0.0%) |
| Education Instruction & Library | 0 (0.0%) | 10 (100.0%) |
| Arts, Media & Entertainment | 0 (0.0%) | 0 (0.0%) |
| Health Diagnosing & Treating | 0 (0.0%) | 0 (0.0%) |
| Health Technologists | 0 (0.0%) | 0 (0.0%) |
| Total (Category) | 82 (73.2%) | 30 (26.8%) |
| Total (Overall) | 104 (55.6%) | 83 (44.4%) |
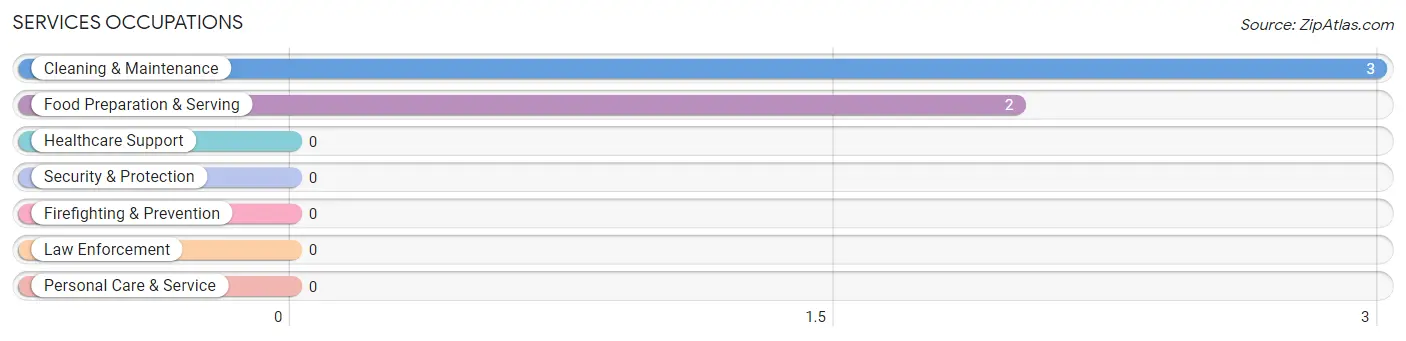
Services Occupations
The most common Services occupations in Castle Valley are Cleaning & Maintenance (3 | 1.6%), and Food Preparation & Serving (2 | 1.1%).
Services Occupations by Sex
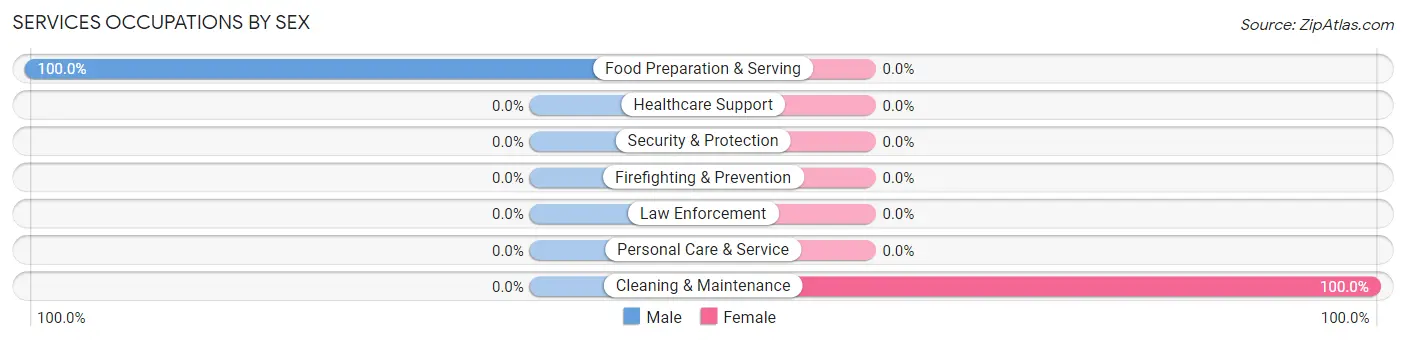
| Occupation | Male | Female |
| Healthcare Support | 0 (0.0%) | 0 (0.0%) |
| Security & Protection | 0 (0.0%) | 0 (0.0%) |
| Firefighting & Prevention | 0 (0.0%) | 0 (0.0%) |
| Law Enforcement | 0 (0.0%) | 0 (0.0%) |
| Food Preparation & Serving | 2 (100.0%) | 0 (0.0%) |
| Cleaning & Maintenance | 0 (0.0%) | 3 (100.0%) |
| Personal Care & Service | 0 (0.0%) | 0 (0.0%) |
| Total (Category) | 2 (40.0%) | 3 (60.0%) |
| Total (Overall) | 104 (55.6%) | 83 (44.4%) |
Sales and Office Occupations
The most common Sales and Office occupations in Castle Valley are Office & Administration (34 | 18.2%), and Sales & Related (7 | 3.7%).
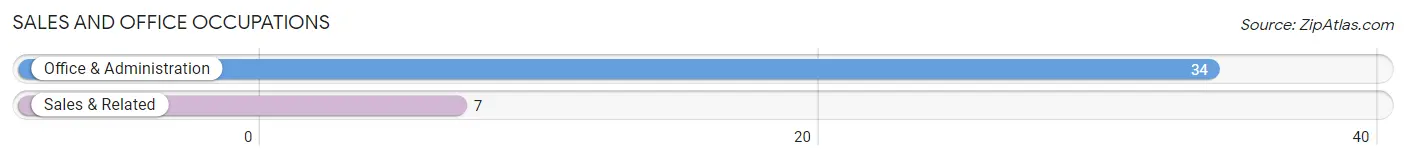
Sales and Office Occupations by Sex
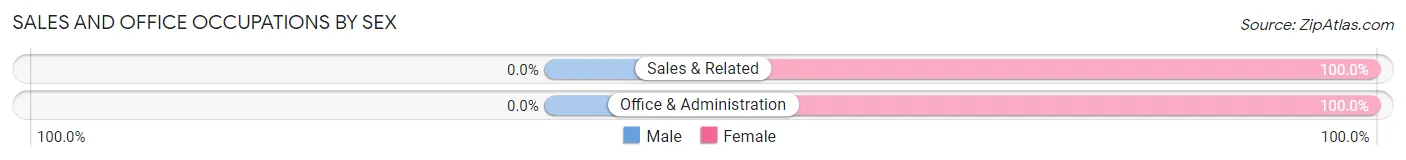
| Occupation | Male | Female |
| Sales & Related | 0 (0.0%) | 7 (100.0%) |
| Office & Administration | 0 (0.0%) | 34 (100.0%) |
| Total (Category) | 0 (0.0%) | 41 (100.0%) |
| Total (Overall) | 104 (55.6%) | 83 (44.4%) |
Natural Resources, Construction and Maintenance Occupations
The most common Natural Resources, Construction and Maintenance occupations in Castle Valley are , and Construction & Extraction (11 | 5.9%).
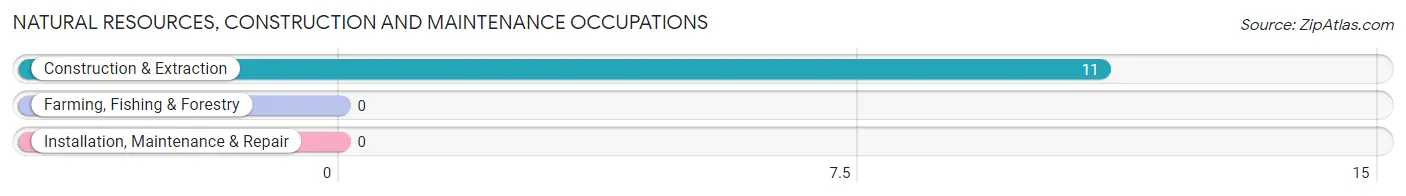
Natural Resources, Construction and Maintenance Occupations by Sex
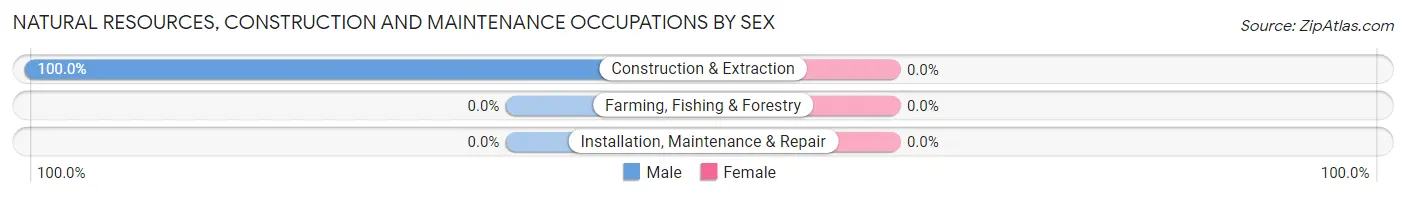
| Occupation | Male | Female |
| Farming, Fishing & Forestry | 0 (0.0%) | 0 (0.0%) |
| Construction & Extraction | 11 (100.0%) | 0 (0.0%) |
| Installation, Maintenance & Repair | 0 (0.0%) | 0 (0.0%) |
| Total (Category) | 11 (100.0%) | 0 (0.0%) |
| Total (Overall) | 104 (55.6%) | 83 (44.4%) |
Production, Transportation and Moving Occupations
The most common Production, Transportation and Moving occupations in Castle Valley are , and Production (18 | 9.6%).
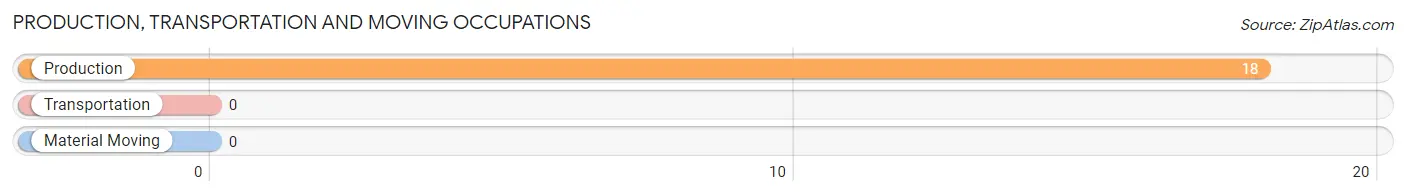
Production, Transportation and Moving Occupations by Sex
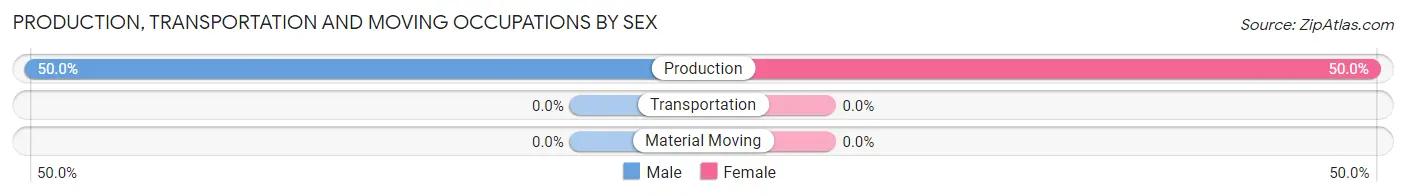
| Occupation | Male | Female |
| Production | 9 (50.0%) | 9 (50.0%) |
| Transportation | 0 (0.0%) | 0 (0.0%) |
| Material Moving | 0 (0.0%) | 0 (0.0%) |
| Total (Category) | 9 (50.0%) | 9 (50.0%) |
| Total (Overall) | 104 (55.6%) | 83 (44.4%) |
Employment Industries by Sex in Castle Valley
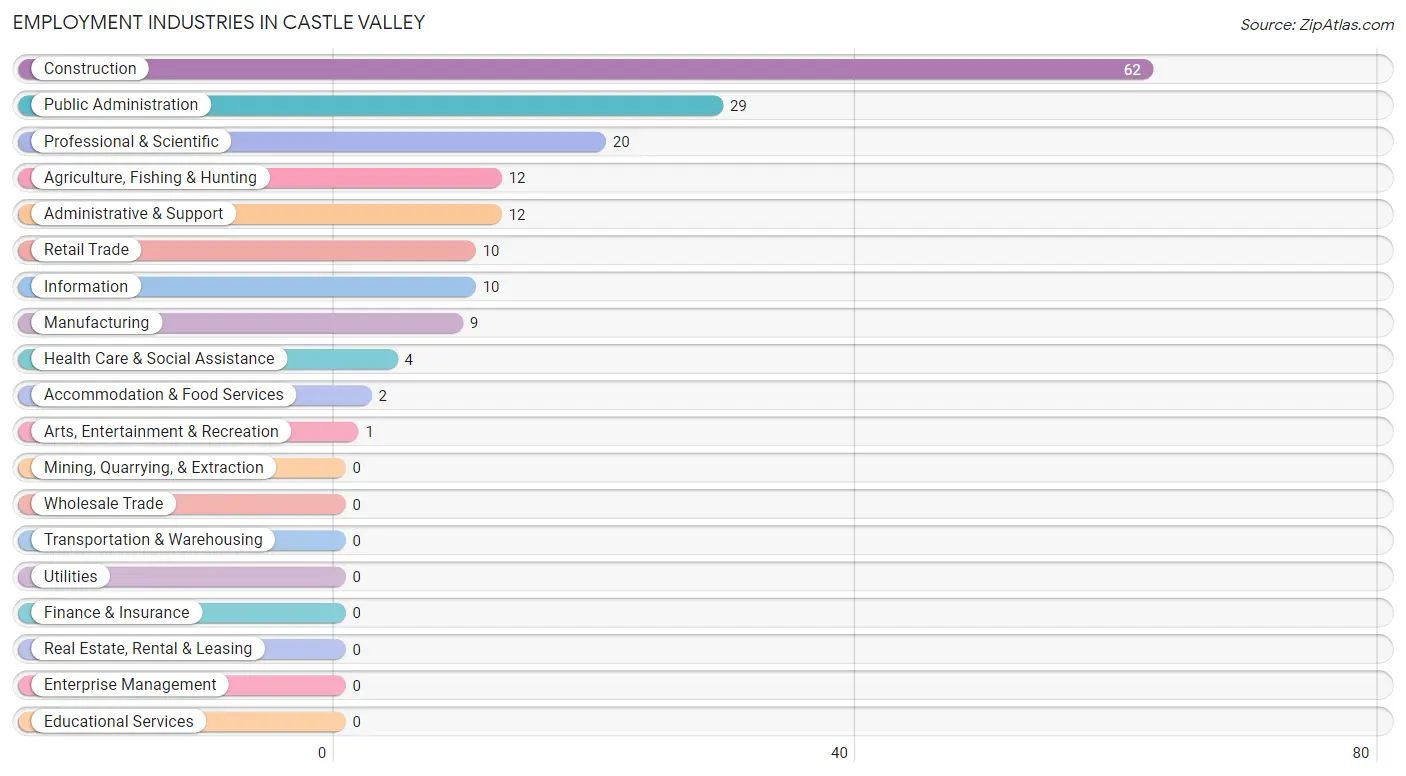
Employment Industries in Castle Valley
The major employment industries in Castle Valley include Construction (62 | 33.2%), Public Administration (29 | 15.5%), Professional & Scientific (20 | 10.7%), Agriculture, Fishing & Hunting (12 | 6.4%), and Administrative & Support (12 | 6.4%).
Employment Industries by Sex in Castle Valley
The Castle Valley industries that see more men than women are Manufacturing (100.0%), Professional & Scientific (100.0%), and Health Care & Social Assistance (100.0%), whereas the industries that tend to have a higher number of women are Retail Trade (100.0%), Information (100.0%), and Administrative & Support (100.0%).
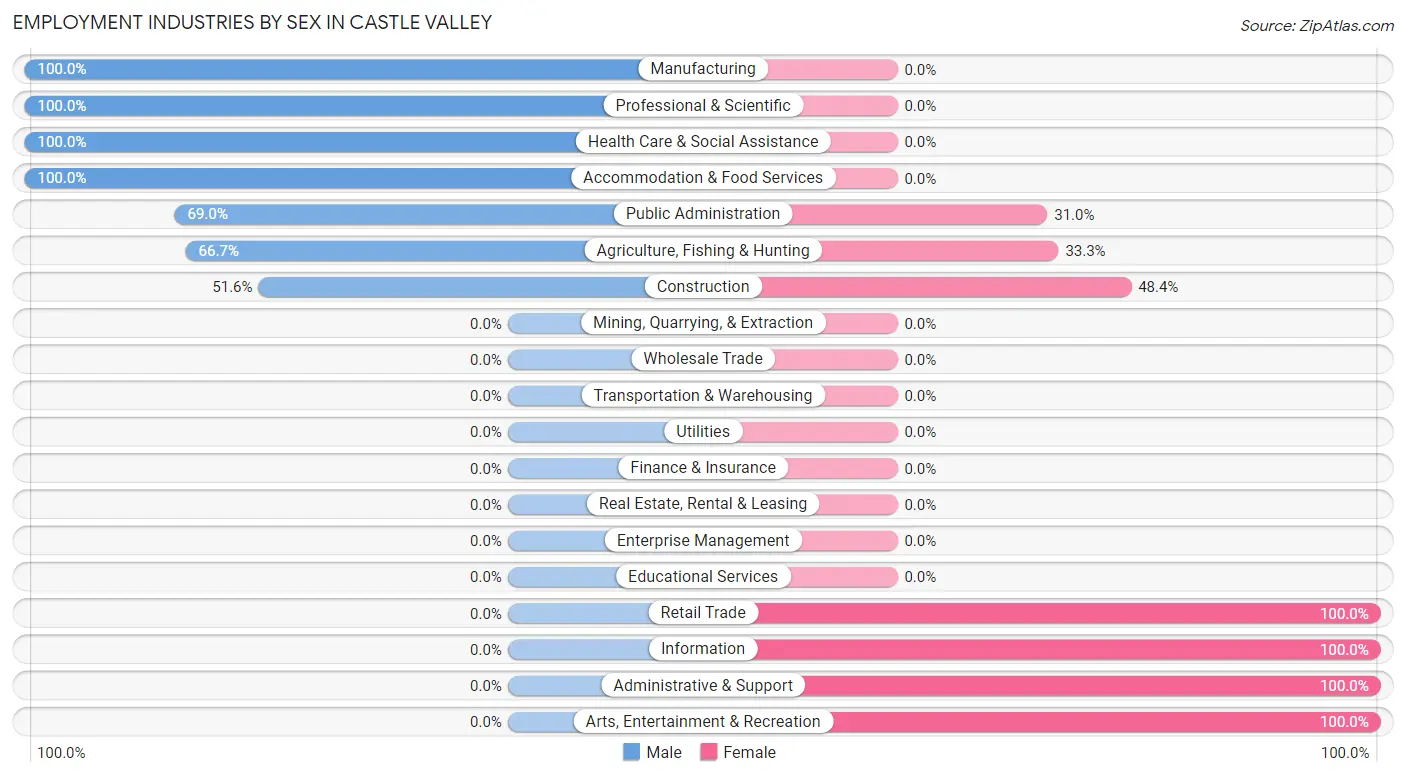
| Industry | Male | Female |
| Agriculture, Fishing & Hunting | 8 (66.7%) | 4 (33.3%) |
| Mining, Quarrying, & Extraction | 0 (0.0%) | 0 (0.0%) |
| Construction | 32 (51.6%) | 30 (48.4%) |
| Manufacturing | 9 (100.0%) | 0 (0.0%) |
| Wholesale Trade | 0 (0.0%) | 0 (0.0%) |
| Retail Trade | 0 (0.0%) | 10 (100.0%) |
| Transportation & Warehousing | 0 (0.0%) | 0 (0.0%) |
| Utilities | 0 (0.0%) | 0 (0.0%) |
| Information | 0 (0.0%) | 10 (100.0%) |
| Finance & Insurance | 0 (0.0%) | 0 (0.0%) |
| Real Estate, Rental & Leasing | 0 (0.0%) | 0 (0.0%) |
| Professional & Scientific | 20 (100.0%) | 0 (0.0%) |
| Enterprise Management | 0 (0.0%) | 0 (0.0%) |
| Administrative & Support | 0 (0.0%) | 12 (100.0%) |
| Educational Services | 0 (0.0%) | 0 (0.0%) |
| Health Care & Social Assistance | 4 (100.0%) | 0 (0.0%) |
| Arts, Entertainment & Recreation | 0 (0.0%) | 1 (100.0%) |
| Accommodation & Food Services | 2 (100.0%) | 0 (0.0%) |
| Public Administration | 20 (69.0%) | 9 (31.0%) |
| Total | 104 (55.6%) | 83 (44.4%) |
Education in Castle Valley
School Enrollment in Castle Valley
The most common levels of schooling among the 63 students in Castle Valley are elementary school (44 | 69.8%), graduate / professional (10 | 15.9%), and nursery / preschool (9 | 14.3%).
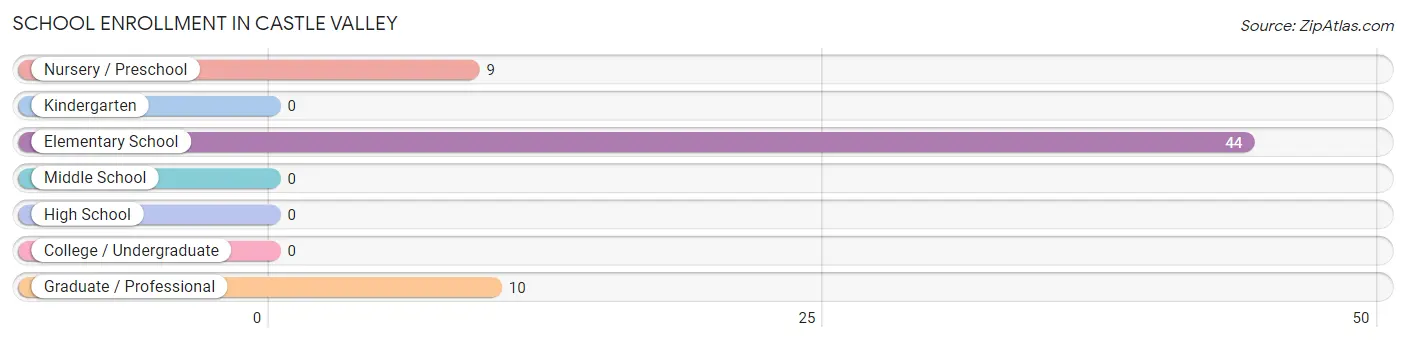
| School Level | # Students | % Students |
| Nursery / Preschool | 9 | 14.3% |
| Kindergarten | 0 | 0.0% |
| Elementary School | 44 | 69.8% |
| Middle School | 0 | 0.0% |
| High School | 0 | 0.0% |
| College / Undergraduate | 0 | 0.0% |
| Graduate / Professional | 10 | 15.9% |
| Total | 63 | 100.0% |
School Enrollment by Age by Funding Source in Castle Valley
Out of a total of 63 students who are enrolled in schools in Castle Valley, 14 (22.2%) attend a private institution, while the remaining 49 (77.8%) are enrolled in public schools. The age group of 3 to 4 year olds has the highest likelihood of being enrolled in private schools, with 9 (100.0% in the age bracket) enrolled. Conversely, the age group of 5 to 9 year old has the lowest likelihood of being enrolled in a private school, with 21 (100.0% in the age bracket) attending a public institution.
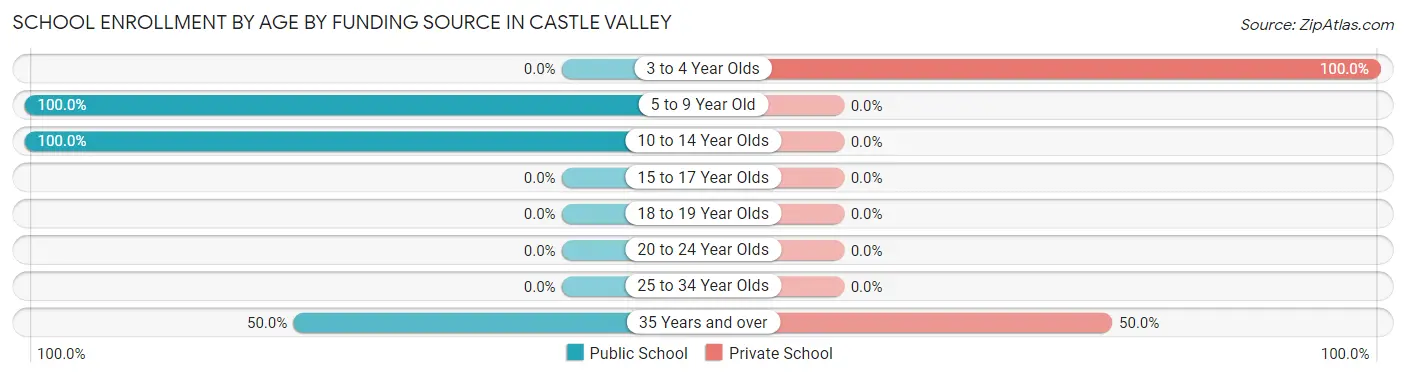
| Age Bracket | Public School | Private School |
| 3 to 4 Year Olds | 0 (0.0%) | 9 (100.0%) |
| 5 to 9 Year Old | 21 (100.0%) | 0 (0.0%) |
| 10 to 14 Year Olds | 23 (100.0%) | 0 (0.0%) |
| 15 to 17 Year Olds | 0 (0.0%) | 0 (0.0%) |
| 18 to 19 Year Olds | 0 (0.0%) | 0 (0.0%) |
| 20 to 24 Year Olds | 0 (0.0%) | 0 (0.0%) |
| 25 to 34 Year Olds | 0 (0.0%) | 0 (0.0%) |
| 35 Years and over | 5 (50.0%) | 5 (50.0%) |
| Total | 49 (77.8%) | 14 (22.2%) |
Educational Attainment by Field of Study in Castle Valley
Bio, nature & agricultural (33 | 23.6%), liberal arts & history (24 | 17.1%), social sciences (22 | 15.7%), physical & health sciences (13 | 9.3%), and psychology (11 | 7.9%) are the most common fields of study among 140 individuals in Castle Valley who have obtained a bachelor's degree or higher.
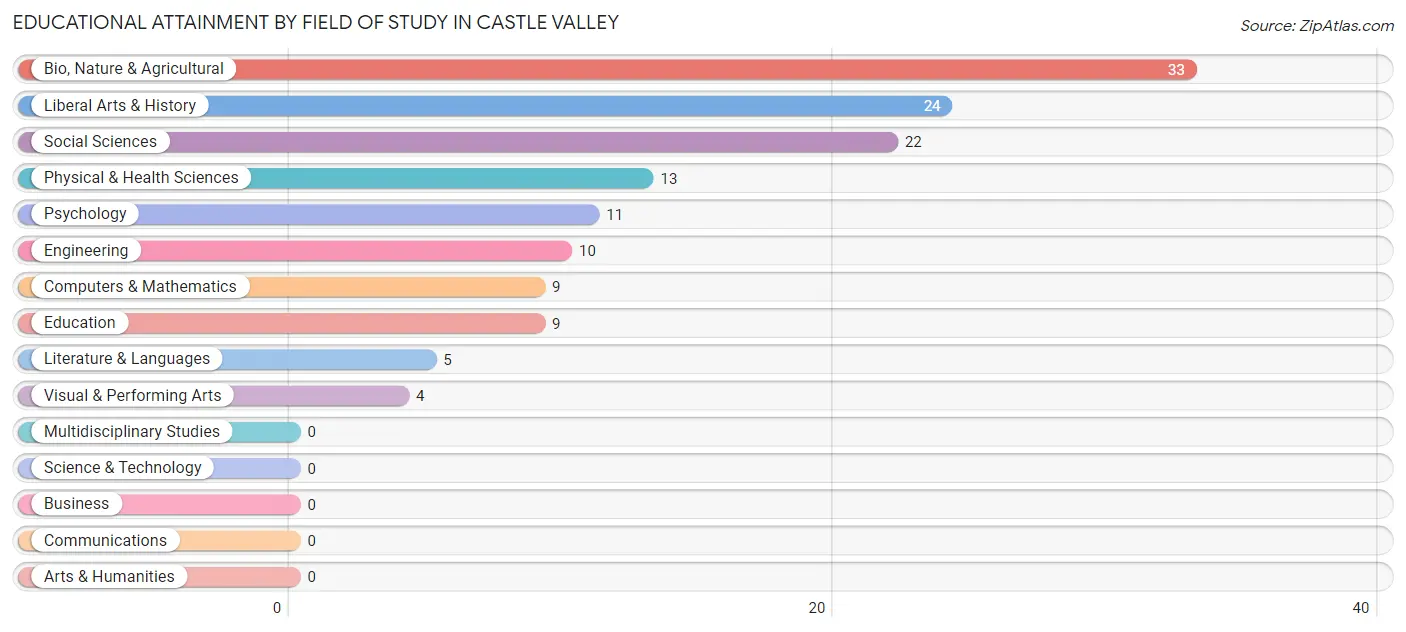
| Field of Study | # Graduates | % Graduates |
| Computers & Mathematics | 9 | 6.4% |
| Bio, Nature & Agricultural | 33 | 23.6% |
| Physical & Health Sciences | 13 | 9.3% |
| Psychology | 11 | 7.9% |
| Social Sciences | 22 | 15.7% |
| Engineering | 10 | 7.1% |
| Multidisciplinary Studies | 0 | 0.0% |
| Science & Technology | 0 | 0.0% |
| Business | 0 | 0.0% |
| Education | 9 | 6.4% |
| Literature & Languages | 5 | 3.6% |
| Liberal Arts & History | 24 | 17.1% |
| Visual & Performing Arts | 4 | 2.9% |
| Communications | 0 | 0.0% |
| Arts & Humanities | 0 | 0.0% |
| Total | 140 | 100.0% |
Transportation & Commute in Castle Valley
Vehicle Availability by Sex in Castle Valley
The most prevalent vehicle ownership categories in Castle Valley are males with 2 vehicles (36, accounting for 35.3%) and females with 2 vehicles (7, making up 43.4%).
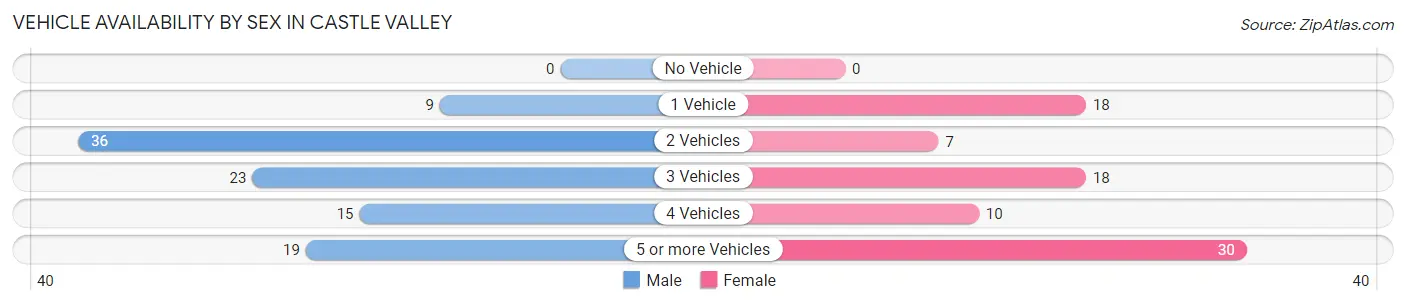
| Vehicles Available | Male | Female |
| No Vehicle | 0 (0.0%) | 0 (0.0%) |
| 1 Vehicle | 9 (8.8%) | 18 (21.7%) |
| 2 Vehicles | 36 (35.3%) | 7 (8.4%) |
| 3 Vehicles | 23 (22.6%) | 18 (21.7%) |
| 4 Vehicles | 15 (14.7%) | 10 (12.0%) |
| 5 or more Vehicles | 19 (18.6%) | 30 (36.1%) |
| Total | 102 (100.0%) | 83 (100.0%) |
Commute Time in Castle Valley
The most frequently occuring commute durations in Castle Valley are 35 to 39 minutes (36 commuters, 39.1%), less than 5 minutes (19 commuters, 20.6%), and 60 to 89 minutes (12 commuters, 13.0%).
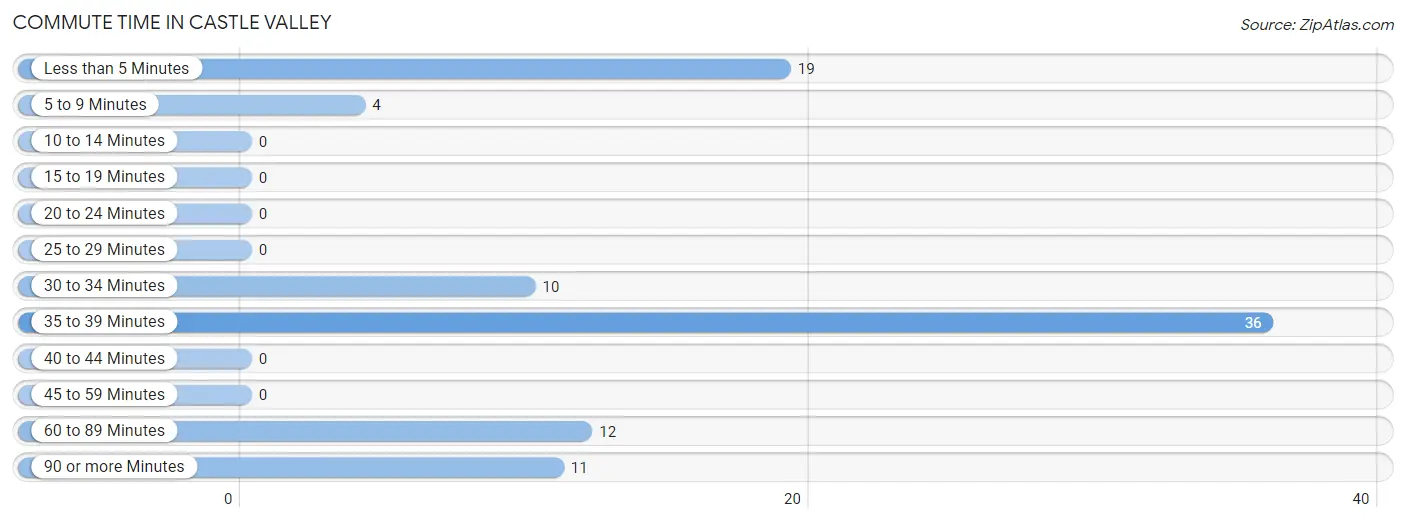
| Commute Time | # Commuters | % Commuters |
| Less than 5 Minutes | 19 | 20.6% |
| 5 to 9 Minutes | 4 | 4.3% |
| 10 to 14 Minutes | 0 | 0.0% |
| 15 to 19 Minutes | 0 | 0.0% |
| 20 to 24 Minutes | 0 | 0.0% |
| 25 to 29 Minutes | 0 | 0.0% |
| 30 to 34 Minutes | 10 | 10.9% |
| 35 to 39 Minutes | 36 | 39.1% |
| 40 to 44 Minutes | 0 | 0.0% |
| 45 to 59 Minutes | 0 | 0.0% |
| 60 to 89 Minutes | 12 | 13.0% |
| 90 or more Minutes | 11 | 12.0% |
Commute Time by Sex in Castle Valley
The most common commute times in Castle Valley are 35 to 39 minutes (20 commuters, 27.8%) for males and 35 to 39 minutes (16 commuters, 80.0%) for females.
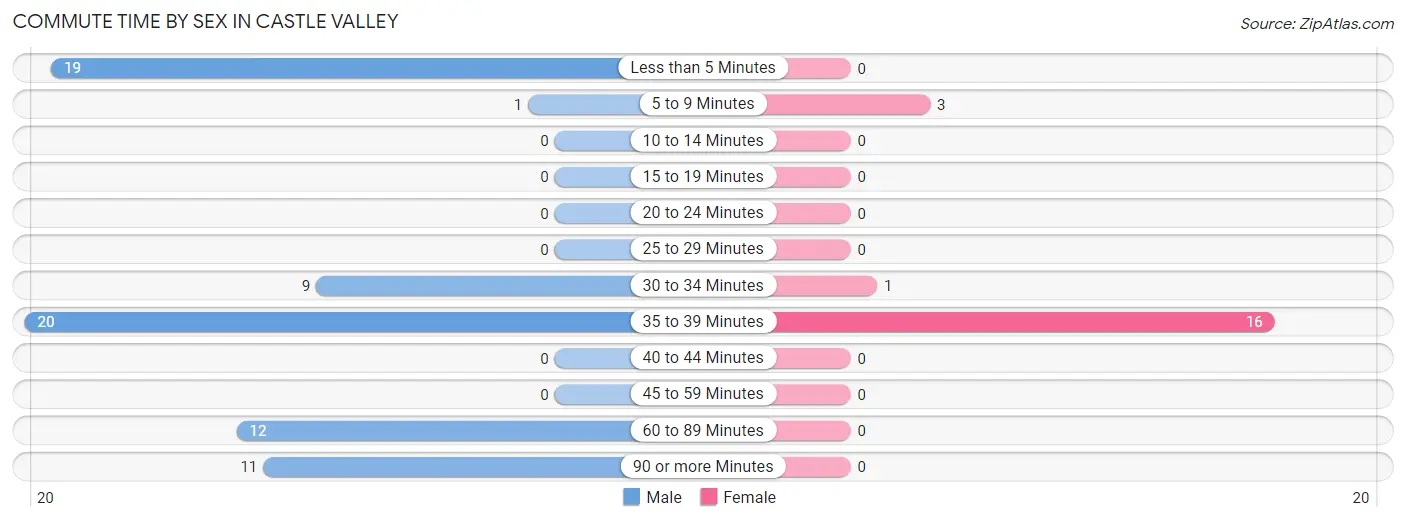
| Commute Time | Male | Female |
| Less than 5 Minutes | 19 (26.4%) | 0 (0.0%) |
| 5 to 9 Minutes | 1 (1.4%) | 3 (15.0%) |
| 10 to 14 Minutes | 0 (0.0%) | 0 (0.0%) |
| 15 to 19 Minutes | 0 (0.0%) | 0 (0.0%) |
| 20 to 24 Minutes | 0 (0.0%) | 0 (0.0%) |
| 25 to 29 Minutes | 0 (0.0%) | 0 (0.0%) |
| 30 to 34 Minutes | 9 (12.5%) | 1 (5.0%) |
| 35 to 39 Minutes | 20 (27.8%) | 16 (80.0%) |
| 40 to 44 Minutes | 0 (0.0%) | 0 (0.0%) |
| 45 to 59 Minutes | 0 (0.0%) | 0 (0.0%) |
| 60 to 89 Minutes | 12 (16.7%) | 0 (0.0%) |
| 90 or more Minutes | 11 (15.3%) | 0 (0.0%) |
Time of Departure to Work by Sex in Castle Valley
The most frequent times of departure to work in Castle Valley are 6:30 AM to 6:59 AM (20, 27.8%) for males and 6:30 AM to 6:59 AM (9, 45.0%) for females.
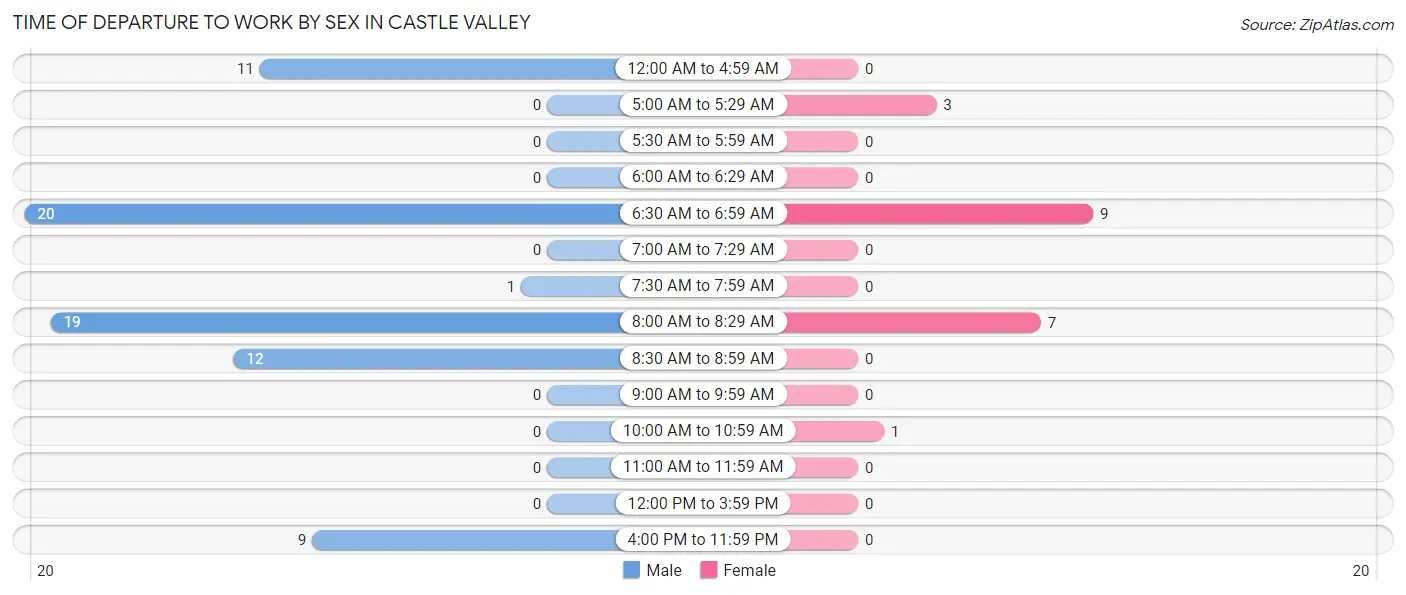
| Time of Departure | Male | Female |
| 12:00 AM to 4:59 AM | 11 (15.3%) | 0 (0.0%) |
| 5:00 AM to 5:29 AM | 0 (0.0%) | 3 (15.0%) |
| 5:30 AM to 5:59 AM | 0 (0.0%) | 0 (0.0%) |
| 6:00 AM to 6:29 AM | 0 (0.0%) | 0 (0.0%) |
| 6:30 AM to 6:59 AM | 20 (27.8%) | 9 (45.0%) |
| 7:00 AM to 7:29 AM | 0 (0.0%) | 0 (0.0%) |
| 7:30 AM to 7:59 AM | 1 (1.4%) | 0 (0.0%) |
| 8:00 AM to 8:29 AM | 19 (26.4%) | 7 (35.0%) |
| 8:30 AM to 8:59 AM | 12 (16.7%) | 0 (0.0%) |
| 9:00 AM to 9:59 AM | 0 (0.0%) | 0 (0.0%) |
| 10:00 AM to 10:59 AM | 0 (0.0%) | 1 (5.0%) |
| 11:00 AM to 11:59 AM | 0 (0.0%) | 0 (0.0%) |
| 12:00 PM to 3:59 PM | 0 (0.0%) | 0 (0.0%) |
| 4:00 PM to 11:59 PM | 9 (12.5%) | 0 (0.0%) |
| Total | 72 (100.0%) | 20 (100.0%) |
Housing Occupancy in Castle Valley
Occupancy by Ownership in Castle Valley
Of the total 209 dwellings in Castle Valley, owner-occupied units account for 200 (95.7%), while renter-occupied units make up 9 (4.3%).
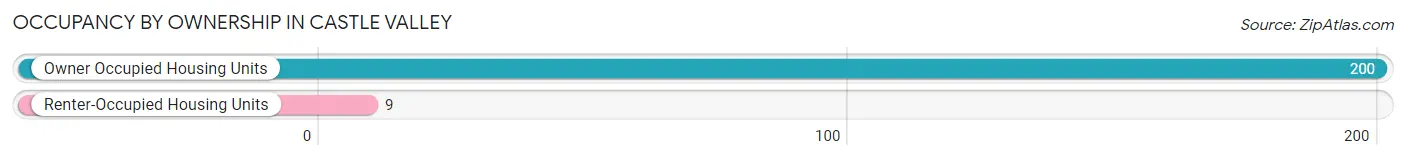
| Occupancy | # Housing Units | % Housing Units |
| Owner Occupied Housing Units | 200 | 95.7% |
| Renter-Occupied Housing Units | 9 | 4.3% |
| Total Occupied Housing Units | 209 | 100.0% |
Occupancy by Household Size in Castle Valley
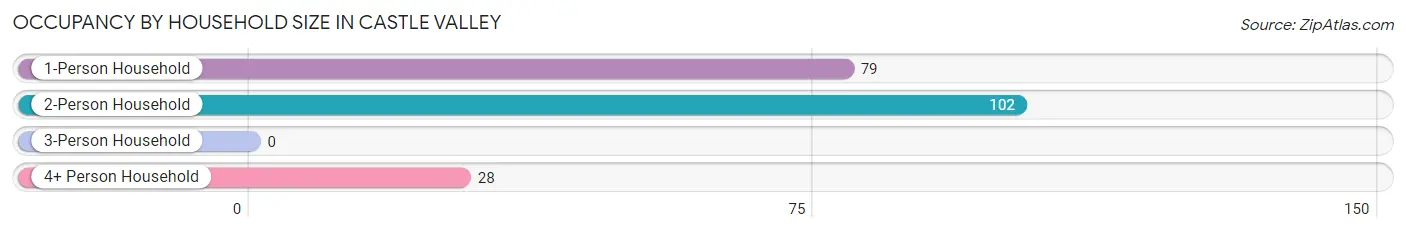
| Household Size | # Housing Units | % Housing Units |
| 1-Person Household | 79 | 37.8% |
| 2-Person Household | 102 | 48.8% |
| 3-Person Household | 0 | 0.0% |
| 4+ Person Household | 28 | 13.4% |
| Total Housing Units | 209 | 100.0% |
Occupancy by Ownership by Household Size in Castle Valley
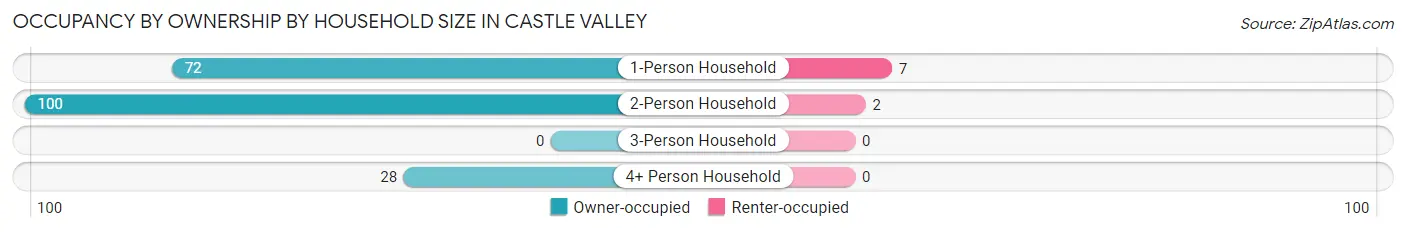
| Household Size | Owner-occupied | Renter-occupied |
| 1-Person Household | 72 (91.1%) | 7 (8.9%) |
| 2-Person Household | 100 (98.0%) | 2 (2.0%) |
| 3-Person Household | 0 (0.0%) | 0 (0.0%) |
| 4+ Person Household | 28 (100.0%) | 0 (0.0%) |
| Total Housing Units | 200 (95.7%) | 9 (4.3%) |
Occupancy by Educational Attainment in Castle Valley
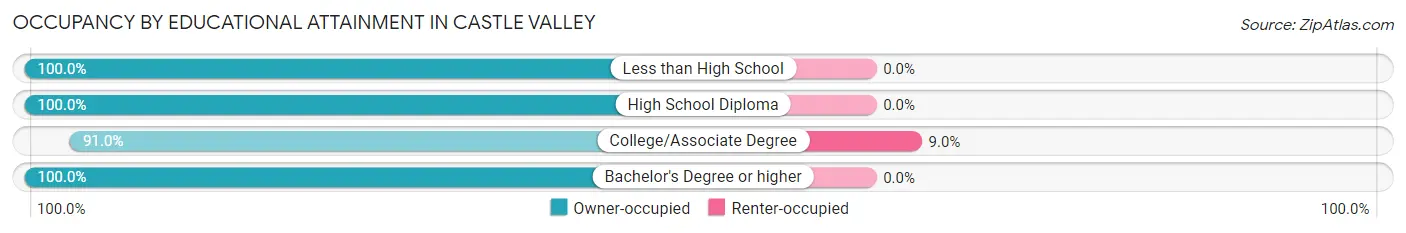
| Household Size | Owner-occupied | Renter-occupied |
| Less than High School | 8 (100.0%) | 0 (0.0%) |
| High School Diploma | 9 (100.0%) | 0 (0.0%) |
| College/Associate Degree | 91 (91.0%) | 9 (9.0%) |
| Bachelor's Degree or higher | 92 (100.0%) | 0 (0.0%) |
Occupancy by Age of Householder in Castle Valley
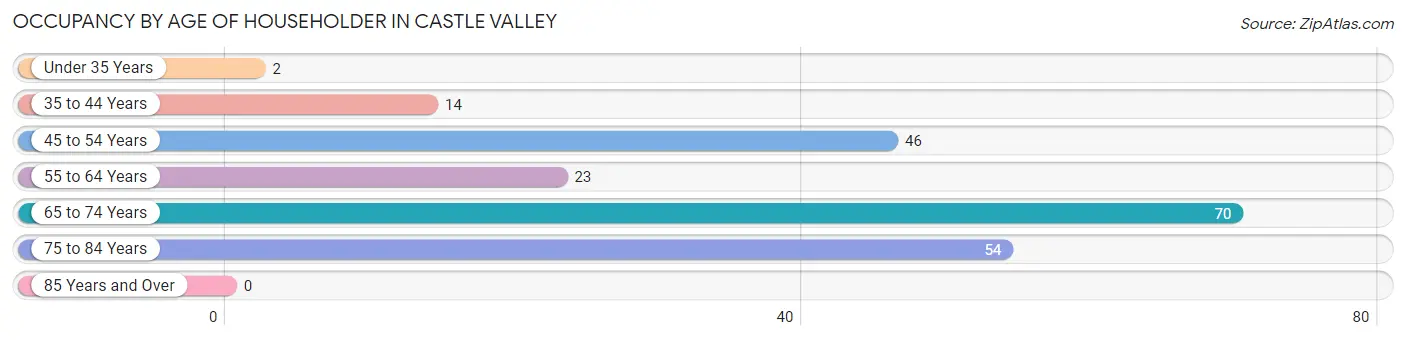
| Age Bracket | # Households | % Households |
| Under 35 Years | 2 | 1.0% |
| 35 to 44 Years | 14 | 6.7% |
| 45 to 54 Years | 46 | 22.0% |
| 55 to 64 Years | 23 | 11.0% |
| 65 to 74 Years | 70 | 33.5% |
| 75 to 84 Years | 54 | 25.8% |
| 85 Years and Over | 0 | 0.0% |
| Total | 209 | 100.0% |
Housing Finances in Castle Valley
Median Income by Occupancy in Castle Valley
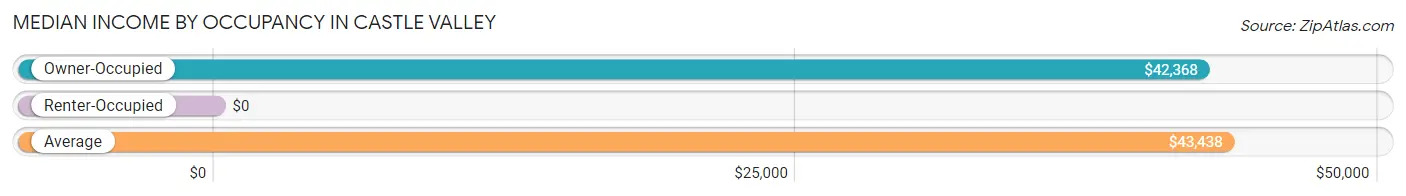
| Occupancy Type | # Households | Median Income |
| Owner-Occupied | 200 (95.7%) | $42,368 |
| Renter-Occupied | 9 (4.3%) | $0 |
| Average | 209 (100.0%) | $43,438 |
Occupancy by Householder Income Bracket in Castle Valley
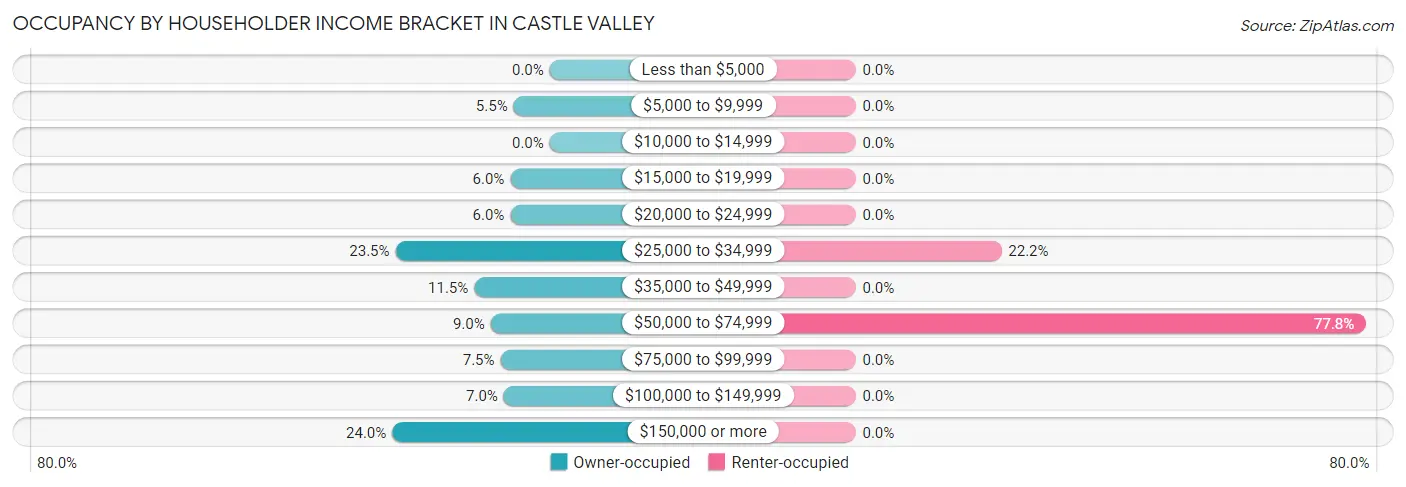
| Income Bracket | Owner-occupied | Renter-occupied |
| Less than $5,000 | 0 (0.0%) | 0 (0.0%) |
| $5,000 to $9,999 | 11 (5.5%) | 0 (0.0%) |
| $10,000 to $14,999 | 0 (0.0%) | 0 (0.0%) |
| $15,000 to $19,999 | 12 (6.0%) | 0 (0.0%) |
| $20,000 to $24,999 | 12 (6.0%) | 0 (0.0%) |
| $25,000 to $34,999 | 47 (23.5%) | 2 (22.2%) |
| $35,000 to $49,999 | 23 (11.5%) | 0 (0.0%) |
| $50,000 to $74,999 | 18 (9.0%) | 7 (77.8%) |
| $75,000 to $99,999 | 15 (7.5%) | 0 (0.0%) |
| $100,000 to $149,999 | 14 (7.0%) | 0 (0.0%) |
| $150,000 or more | 48 (24.0%) | 0 (0.0%) |
| Total | 200 (100.0%) | 9 (100.0%) |
Monthly Housing Cost Tiers in Castle Valley
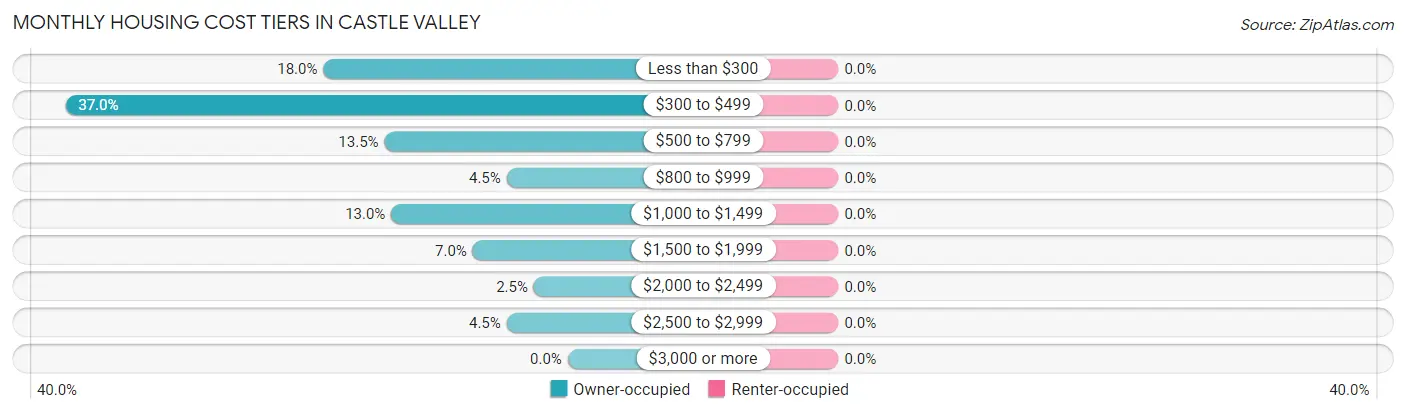
| Monthly Cost | Owner-occupied | Renter-occupied |
| Less than $300 | 36 (18.0%) | 0 (0.0%) |
| $300 to $499 | 74 (37.0%) | 0 (0.0%) |
| $500 to $799 | 27 (13.5%) | 0 (0.0%) |
| $800 to $999 | 9 (4.5%) | 0 (0.0%) |
| $1,000 to $1,499 | 26 (13.0%) | 0 (0.0%) |
| $1,500 to $1,999 | 14 (7.0%) | 0 (0.0%) |
| $2,000 to $2,499 | 5 (2.5%) | 0 (0.0%) |
| $2,500 to $2,999 | 9 (4.5%) | 0 (0.0%) |
| $3,000 or more | 0 (0.0%) | 0 (0.0%) |
| Total | 200 (100.0%) | 9 (100.0%) |
Physical Housing Characteristics in Castle Valley
Housing Structures in Castle Valley
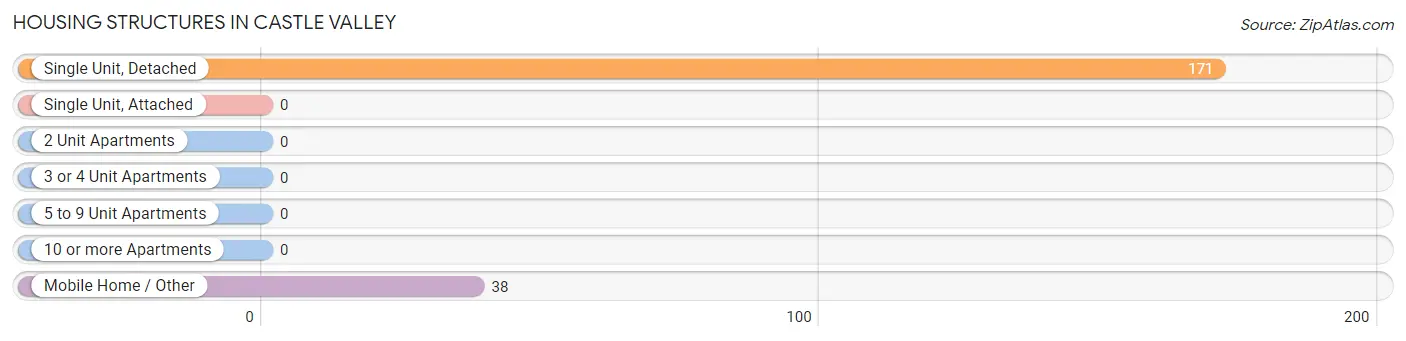
| Structure Type | # Housing Units | % Housing Units |
| Single Unit, Detached | 171 | 81.8% |
| Single Unit, Attached | 0 | 0.0% |
| 2 Unit Apartments | 0 | 0.0% |
| 3 or 4 Unit Apartments | 0 | 0.0% |
| 5 to 9 Unit Apartments | 0 | 0.0% |
| 10 or more Apartments | 0 | 0.0% |
| Mobile Home / Other | 38 | 18.2% |
| Total | 209 | 100.0% |
Housing Structures by Occupancy in Castle Valley
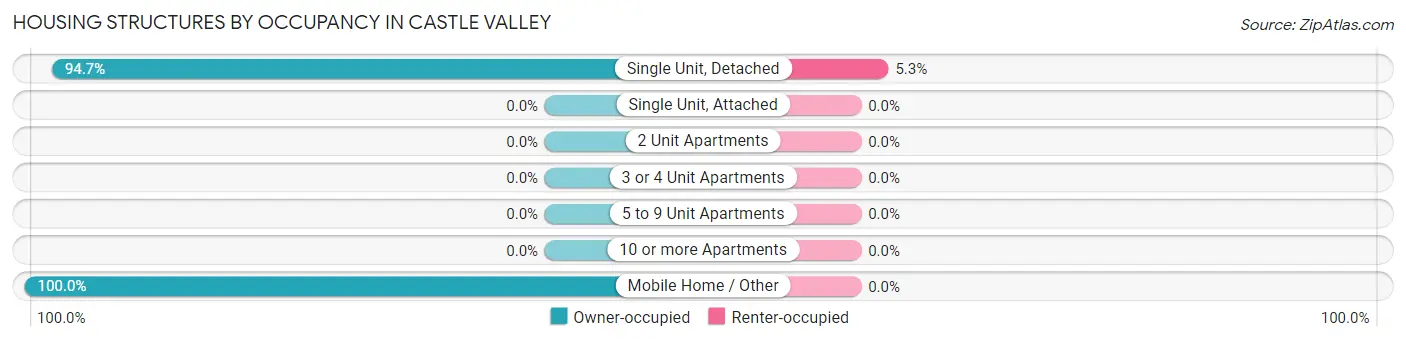
| Structure Type | Owner-occupied | Renter-occupied |
| Single Unit, Detached | 162 (94.7%) | 9 (5.3%) |
| Single Unit, Attached | 0 (0.0%) | 0 (0.0%) |
| 2 Unit Apartments | 0 (0.0%) | 0 (0.0%) |
| 3 or 4 Unit Apartments | 0 (0.0%) | 0 (0.0%) |
| 5 to 9 Unit Apartments | 0 (0.0%) | 0 (0.0%) |
| 10 or more Apartments | 0 (0.0%) | 0 (0.0%) |
| Mobile Home / Other | 38 (100.0%) | 0 (0.0%) |
| Total | 200 (95.7%) | 9 (4.3%) |
Housing Structures by Number of Rooms in Castle Valley
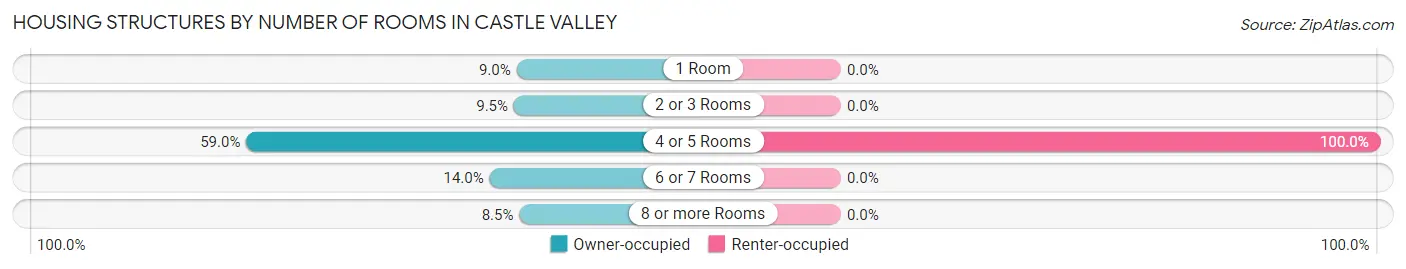
| Number of Rooms | Owner-occupied | Renter-occupied |
| 1 Room | 18 (9.0%) | 0 (0.0%) |
| 2 or 3 Rooms | 19 (9.5%) | 0 (0.0%) |
| 4 or 5 Rooms | 118 (59.0%) | 9 (100.0%) |
| 6 or 7 Rooms | 28 (14.0%) | 0 (0.0%) |
| 8 or more Rooms | 17 (8.5%) | 0 (0.0%) |
| Total | 200 (100.0%) | 9 (100.0%) |
Housing Structure by Heating Type in Castle Valley
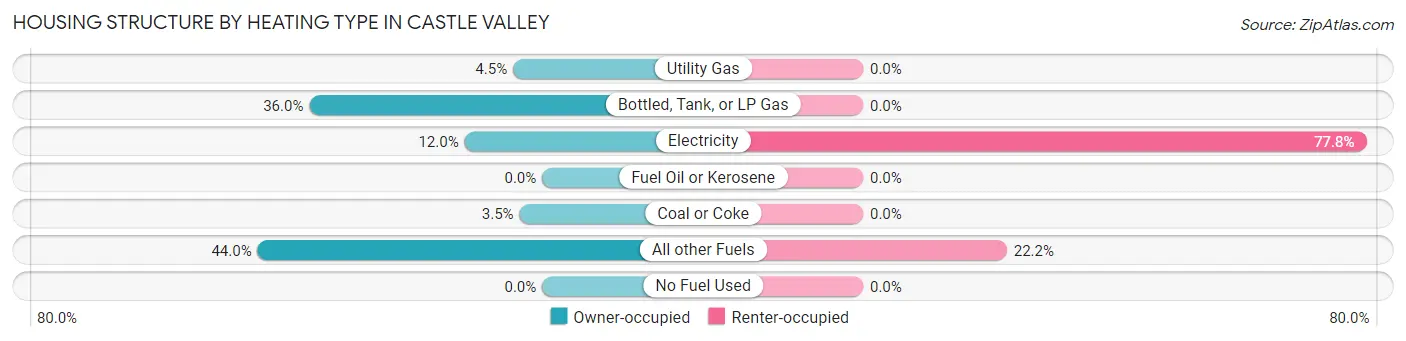
| Heating Type | Owner-occupied | Renter-occupied |
| Utility Gas | 9 (4.5%) | 0 (0.0%) |
| Bottled, Tank, or LP Gas | 72 (36.0%) | 0 (0.0%) |
| Electricity | 24 (12.0%) | 7 (77.8%) |
| Fuel Oil or Kerosene | 0 (0.0%) | 0 (0.0%) |
| Coal or Coke | 7 (3.5%) | 0 (0.0%) |
| All other Fuels | 88 (44.0%) | 2 (22.2%) |
| No Fuel Used | 0 (0.0%) | 0 (0.0%) |
| Total | 200 (100.0%) | 9 (100.0%) |
Household Vehicle Usage in Castle Valley
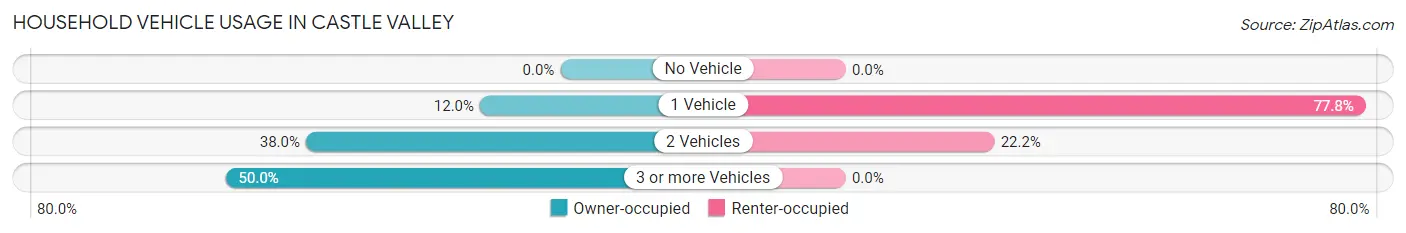
| Vehicles per Household | Owner-occupied | Renter-occupied |
| No Vehicle | 0 (0.0%) | 0 (0.0%) |
| 1 Vehicle | 24 (12.0%) | 7 (77.8%) |
| 2 Vehicles | 76 (38.0%) | 2 (22.2%) |
| 3 or more Vehicles | 100 (50.0%) | 0 (0.0%) |
| Total | 200 (100.0%) | 9 (100.0%) |
Real Estate & Mortgages in Castle Valley
Real Estate and Mortgage Overview in Castle Valley
| Characteristic | Without Mortgage | With Mortgage |
| Housing Units | 155 | 45 |
| Median Property Value | $320,700 | $427,400 |
| Median Household Income | $40,592 | $23 |
| Monthly Housing Costs | $373 | $0 |
| Real Estate Taxes | $1,606 | $0 |
Property Value by Mortgage Status in Castle Valley
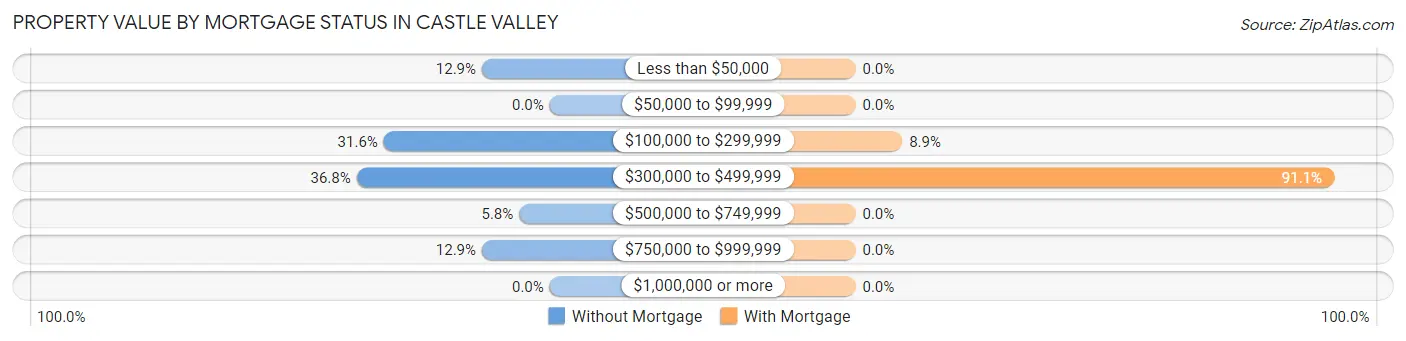
| Property Value | Without Mortgage | With Mortgage |
| Less than $50,000 | 20 (12.9%) | 0 (0.0%) |
| $50,000 to $99,999 | 0 (0.0%) | 0 (0.0%) |
| $100,000 to $299,999 | 49 (31.6%) | 4 (8.9%) |
| $300,000 to $499,999 | 57 (36.8%) | 41 (91.1%) |
| $500,000 to $749,999 | 9 (5.8%) | 0 (0.0%) |
| $750,000 to $999,999 | 20 (12.9%) | 0 (0.0%) |
| $1,000,000 or more | 0 (0.0%) | 0 (0.0%) |
| Total | 155 (100.0%) | 45 (100.0%) |
Household Income by Mortgage Status in Castle Valley
| Household Income | Without Mortgage | With Mortgage |
| Less than $10,000 | 11 (7.1%) | 6 (13.3%) |
| $10,000 to $24,999 | 24 (15.5%) | 0 (0.0%) |
| $25,000 to $34,999 | 38 (24.5%) | 0 (0.0%) |
| $35,000 to $49,999 | 19 (12.3%) | 9 (20.0%) |
| $50,000 to $74,999 | 18 (11.6%) | 4 (8.9%) |
| $75,000 to $99,999 | 11 (7.1%) | 0 (0.0%) |
| $100,000 to $149,999 | 9 (5.8%) | 4 (8.9%) |
| $150,000 or more | 25 (16.1%) | 5 (11.1%) |
| Total | 155 (100.0%) | 45 (100.0%) |
Property Value to Household Income Ratio in Castle Valley
| Value-to-Income Ratio | Without Mortgage | With Mortgage |
| Less than 2.0x | 24 (15.5%) | 152,639 (339,197.8%) |
| 2.0x to 2.9x | 20 (12.9%) | 6 (13.3%) |
| 3.0x to 3.9x | 10 (6.5%) | 17 (37.8%) |
| 4.0x or more | 101 (65.2%) | 9 (20.0%) |
| Total | 155 (100.0%) | 45 (100.0%) |
Real Estate Taxes by Mortgage Status in Castle Valley
| Property Taxes | Without Mortgage | With Mortgage |
| Less than $800 | 24 (15.5%) | 0 (0.0%) |
| $800 to $1,499 | 42 (27.1%) | 0 (0.0%) |
| $800 to $1,499 | 89 (57.4%) | 9 (20.0%) |
| Total | 155 (100.0%) | 45 (100.0%) |
Health & Disability in Castle Valley
Health Insurance Coverage by Age in Castle Valley
| Age Bracket | With Coverage | Without Coverage |
| Under 6 Years | 18 (100.0%) | 0 (0.0%) |
| 6 to 18 Years | 44 (100.0%) | 0 (0.0%) |
| 19 to 25 Years | 2 (100.0%) | 0 (0.0%) |
| 26 to 34 Years | 0 (0.0%) | 0 (0.0%) |
| 35 to 44 Years | 63 (100.0%) | 0 (0.0%) |
| 45 to 54 Years | 38 (82.6%) | 8 (17.4%) |
| 55 to 64 Years | 53 (100.0%) | 0 (0.0%) |
| 65 to 74 Years | 94 (100.0%) | 0 (0.0%) |
| 75 Years and older | 89 (100.0%) | 0 (0.0%) |
| Total | 401 (98.0%) | 8 (2.0%) |
Health Insurance Coverage by Citizenship Status in Castle Valley
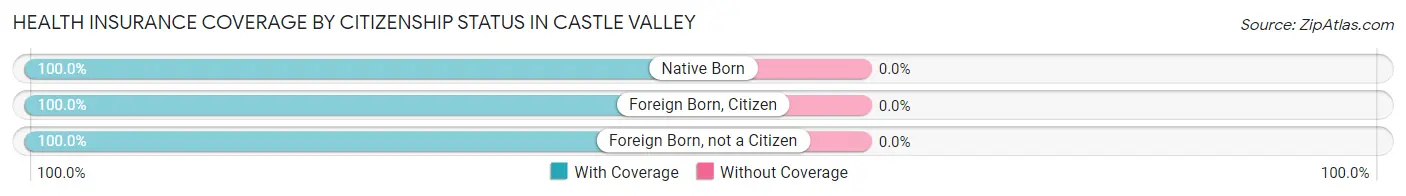
| Citizenship Status | With Coverage | Without Coverage |
| Native Born | 18 (100.0%) | 0 (0.0%) |
| Foreign Born, Citizen | 44 (100.0%) | 0 (0.0%) |
| Foreign Born, not a Citizen | 2 (100.0%) | 0 (0.0%) |
Health Insurance Coverage by Household Income in Castle Valley
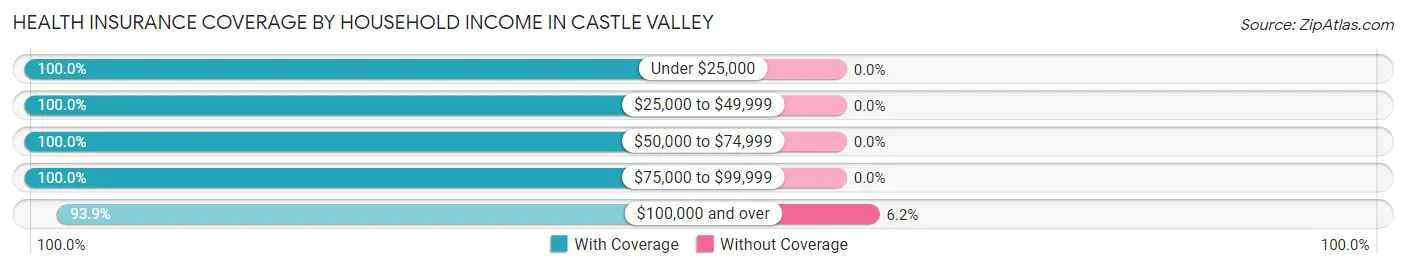
| Household Income | With Coverage | Without Coverage |
| Under $25,000 | 46 (100.0%) | 0 (0.0%) |
| $25,000 to $49,999 | 167 (100.0%) | 0 (0.0%) |
| $50,000 to $74,999 | 34 (100.0%) | 0 (0.0%) |
| $75,000 to $99,999 | 32 (100.0%) | 0 (0.0%) |
| $100,000 and over | 122 (93.9%) | 8 (6.1%) |
Public vs Private Health Insurance Coverage by Age in Castle Valley
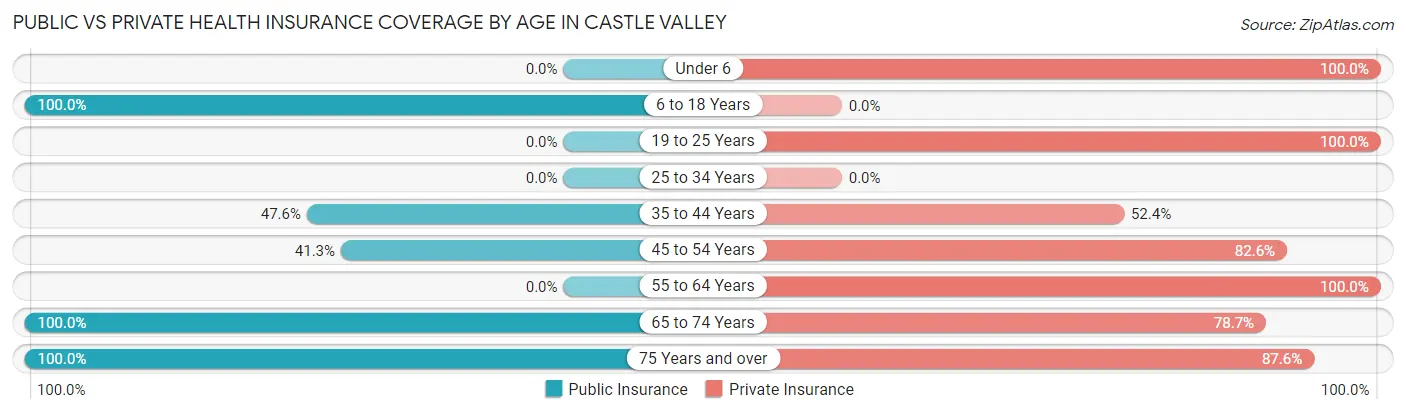
| Age Bracket | Public Insurance | Private Insurance |
| Under 6 | 0 (0.0%) | 18 (100.0%) |
| 6 to 18 Years | 44 (100.0%) | 0 (0.0%) |
| 19 to 25 Years | 0 (0.0%) | 2 (100.0%) |
| 25 to 34 Years | 0 (0.0%) | 0 (0.0%) |
| 35 to 44 Years | 30 (47.6%) | 33 (52.4%) |
| 45 to 54 Years | 19 (41.3%) | 38 (82.6%) |
| 55 to 64 Years | 0 (0.0%) | 53 (100.0%) |
| 65 to 74 Years | 94 (100.0%) | 74 (78.7%) |
| 75 Years and over | 89 (100.0%) | 78 (87.6%) |
| Total | 276 (67.5%) | 296 (72.4%) |
Disability Status by Sex by Age in Castle Valley
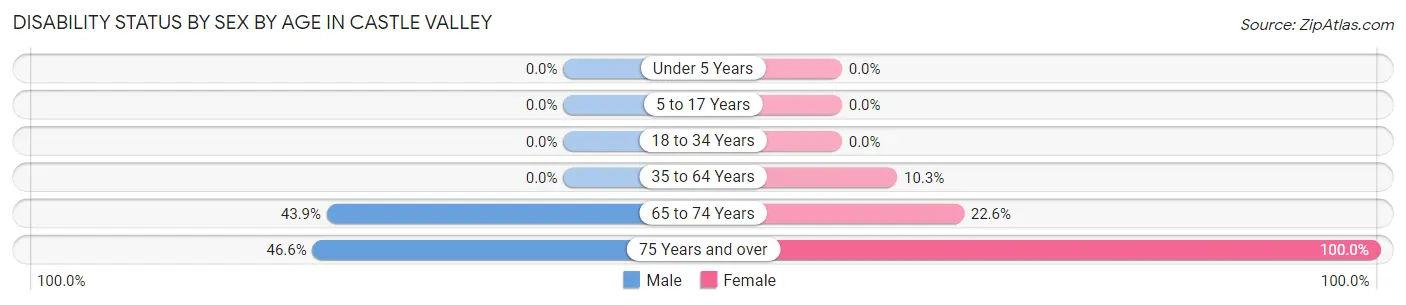
| Age Bracket | Male | Female |
| Under 5 Years | 0 (0.0%) | 0 (0.0%) |
| 5 to 17 Years | 0 (0.0%) | 0 (0.0%) |
| 18 to 34 Years | 0 (0.0%) | 0 (0.0%) |
| 35 to 64 Years | 0 (0.0%) | 8 (10.3%) |
| 65 to 74 Years | 18 (43.9%) | 12 (22.6%) |
| 75 Years and over | 27 (46.6%) | 31 (100.0%) |
Disability Class by Sex by Age in Castle Valley
Disability Class: Hearing Difficulty
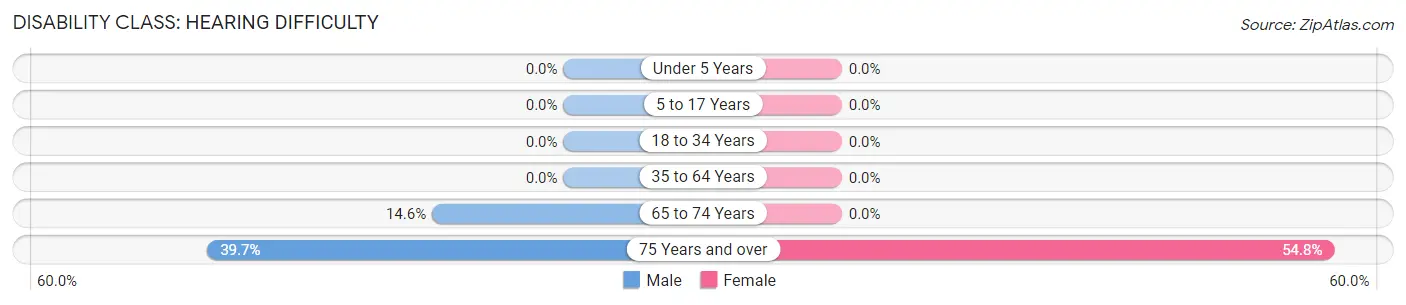
| Age Bracket | Male | Female |
| Under 5 Years | 0 (0.0%) | 0 (0.0%) |
| 5 to 17 Years | 0 (0.0%) | 0 (0.0%) |
| 18 to 34 Years | 0 (0.0%) | 0 (0.0%) |
| 35 to 64 Years | 0 (0.0%) | 0 (0.0%) |
| 65 to 74 Years | 6 (14.6%) | 0 (0.0%) |
| 75 Years and over | 23 (39.7%) | 17 (54.8%) |
Disability Class: Vision Difficulty
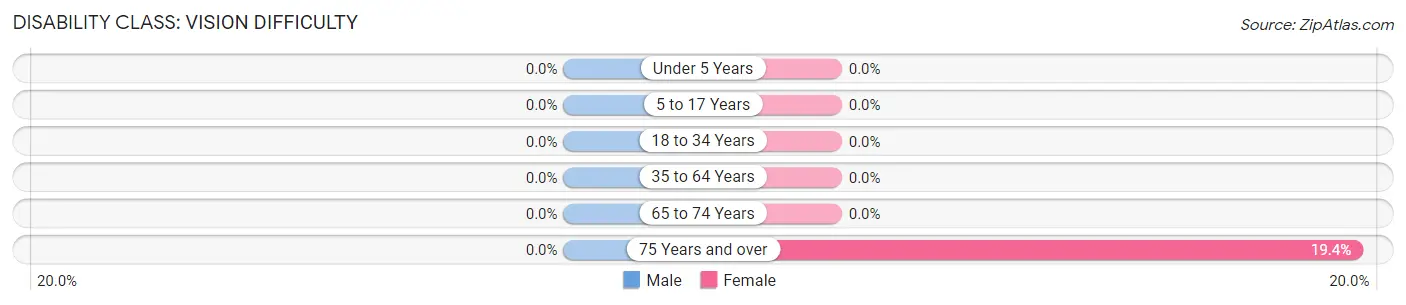
| Age Bracket | Male | Female |
| Under 5 Years | 0 (0.0%) | 0 (0.0%) |
| 5 to 17 Years | 0 (0.0%) | 0 (0.0%) |
| 18 to 34 Years | 0 (0.0%) | 0 (0.0%) |
| 35 to 64 Years | 0 (0.0%) | 0 (0.0%) |
| 65 to 74 Years | 0 (0.0%) | 0 (0.0%) |
| 75 Years and over | 0 (0.0%) | 6 (19.4%) |
Disability Class: Cognitive Difficulty
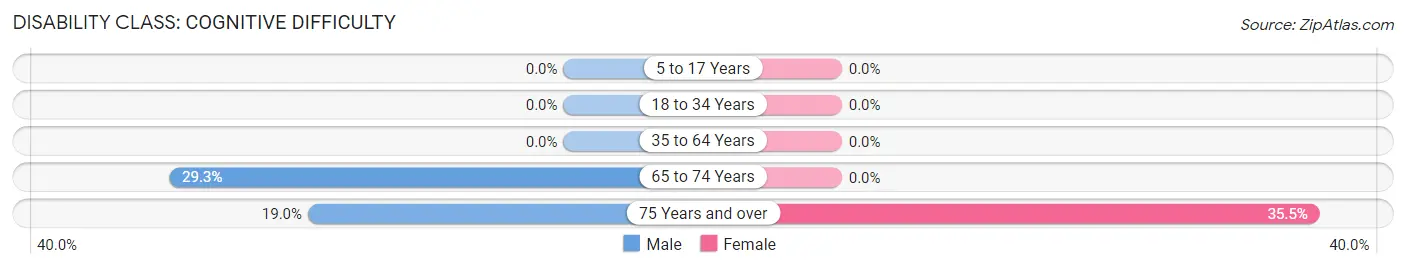
| Age Bracket | Male | Female |
| 5 to 17 Years | 0 (0.0%) | 0 (0.0%) |
| 18 to 34 Years | 0 (0.0%) | 0 (0.0%) |
| 35 to 64 Years | 0 (0.0%) | 0 (0.0%) |
| 65 to 74 Years | 12 (29.3%) | 0 (0.0%) |
| 75 Years and over | 11 (19.0%) | 11 (35.5%) |
Disability Class: Ambulatory Difficulty
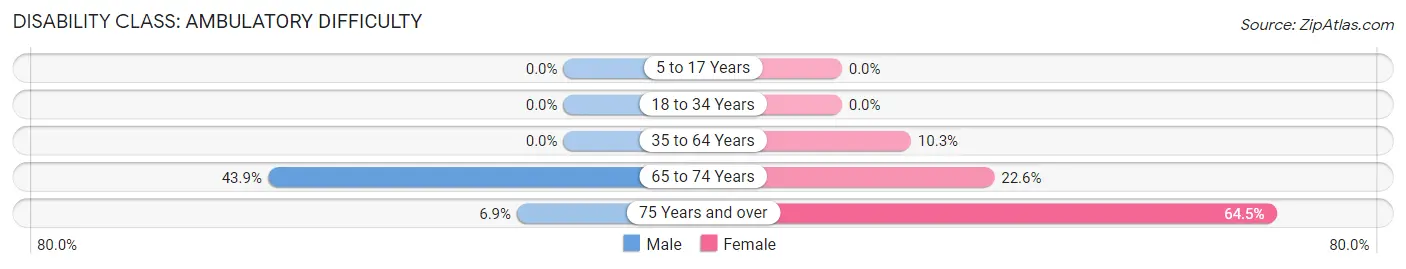
| Age Bracket | Male | Female |
| 5 to 17 Years | 0 (0.0%) | 0 (0.0%) |
| 18 to 34 Years | 0 (0.0%) | 0 (0.0%) |
| 35 to 64 Years | 0 (0.0%) | 8 (10.3%) |
| 65 to 74 Years | 18 (43.9%) | 12 (22.6%) |
| 75 Years and over | 4 (6.9%) | 20 (64.5%) |
Disability Class: Self-Care Difficulty
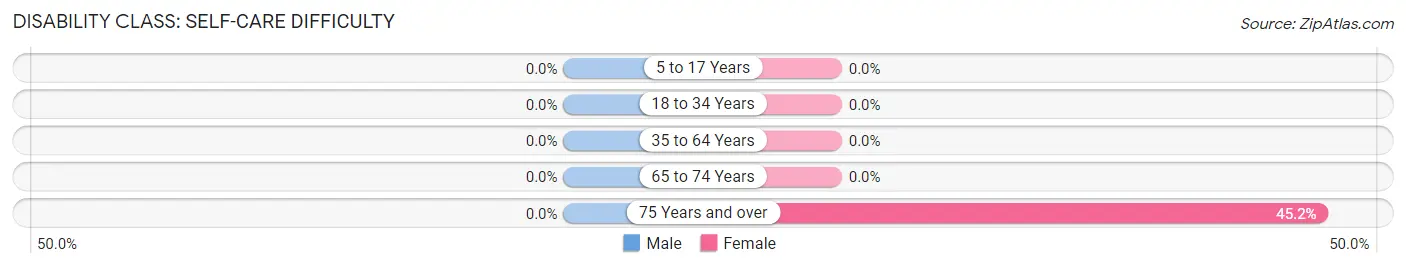
| Age Bracket | Male | Female |
| 5 to 17 Years | 0 (0.0%) | 0 (0.0%) |
| 18 to 34 Years | 0 (0.0%) | 0 (0.0%) |
| 35 to 64 Years | 0 (0.0%) | 0 (0.0%) |
| 65 to 74 Years | 0 (0.0%) | 0 (0.0%) |
| 75 Years and over | 0 (0.0%) | 14 (45.2%) |
Technology Access in Castle Valley
Computing Device Access in Castle Valley
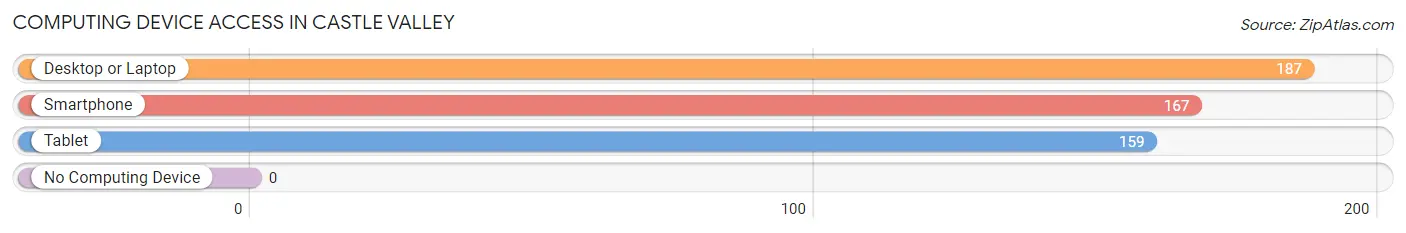
| Device Type | # Households | % Households |
| Desktop or Laptop | 187 | 89.5% |
| Smartphone | 167 | 79.9% |
| Tablet | 159 | 76.1% |
| No Computing Device | 0 | 0.0% |
| Total | 209 | 100.0% |
Internet Access in Castle Valley
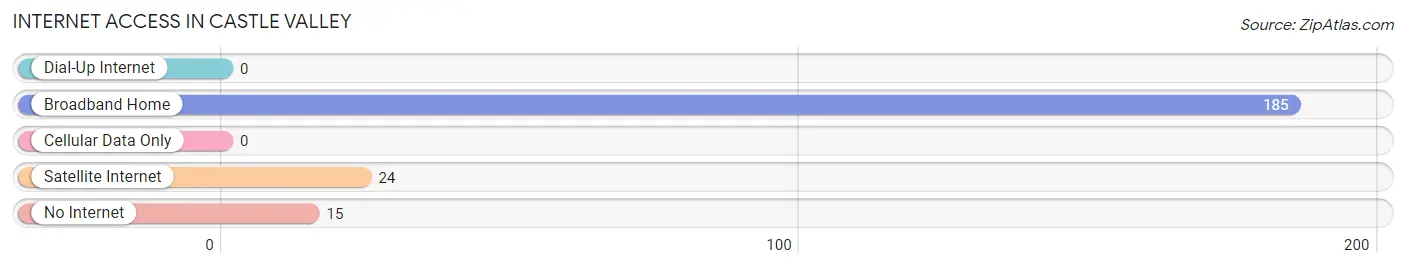
| Internet Type | # Households | % Households |
| Dial-Up Internet | 0 | 0.0% |
| Broadband Home | 185 | 88.5% |
| Cellular Data Only | 0 | 0.0% |
| Satellite Internet | 24 | 11.5% |
| No Internet | 15 | 7.2% |
| Total | 209 | 100.0% |
Castle Valley Summary
Castle Valley is a small, rural community located in the southeastern corner of Utah, near the border of Colorado and Arizona. It is situated in the heart of the Colorado Plateau, a region of the United States known for its stunning red rock formations and vast expanses of desert. The area is home to a variety of wildlife, including mule deer, elk, and bighorn sheep. Castle Valley is also known for its rich cultural heritage, with many Native American tribes having lived in the area for centuries.
Geography
Castle Valley is located in the southeastern corner of Utah, near the border of Colorado and Arizona. It is situated in the heart of the Colorado Plateau, a region of the United States known for its stunning red rock formations and vast expanses of desert. The area is home to a variety of wildlife, including mule deer, elk, and bighorn sheep. Castle Valley is also known for its rich cultural heritage, with many Native American tribes having lived in the area for centuries.
The landscape of Castle Valley is characterized by its rugged terrain and stunning red rock formations. The area is home to several national parks and monuments, including Arches National Park, Canyonlands National Park, and Natural Bridges National Monument. The area is also home to several rivers, including the Colorado River, the Green River, and the San Juan River.
Economy
The economy of Castle Valley is largely based on agriculture and tourism. The area is home to several farms and ranches, which produce a variety of crops, including alfalfa, hay, and wheat. The area is also home to several tourist attractions, including Arches National Park, Canyonlands National Park, and Natural Bridges National Monument.
The area is also home to several businesses, including restaurants, hotels, and retail stores. The area is also home to several oil and gas companies, which are involved in the exploration and production of oil and gas in the region.
Demographics
As of the 2010 census, the population of Castle Valley was 1,845. The population is largely composed of white (90.2%) and Native American (7.2%) individuals. The median household income in the area is $45,000, and the median age is 37.
Conclusion
Castle Valley is a small, rural community located in the southeastern corner of Utah, near the border of Colorado and Arizona. It is situated in the heart of the Colorado Plateau, a region of the United States known for its stunning red rock formations and vast expanses of desert. The area is home to a variety of wildlife, including mule deer, elk, and bighorn sheep. Castle Valley is also known for its rich cultural heritage, with many Native American tribes having lived in the area for centuries. The economy of Castle Valley is largely based on agriculture and tourism, and the population is largely composed of white and Native American individuals.
Common Questions
What is Per Capita Income in Castle Valley?
Per Capita income in Castle Valley is $43,022.
What is the Median Household income in Castle Valley?
Median Household Income in Castle Valley is $43,438.
What is Inequality or Gini Index in Castle Valley?
Inequality or Gini Index in Castle Valley is 0.46.
What is the Total Population of Castle Valley?
Total Population of Castle Valley is 409.
What is the Total Male Population of Castle Valley?
Total Male Population of Castle Valley is 238.
What is the Total Female Population of Castle Valley?
Total Female Population of Castle Valley is 171.
What is the Ratio of Males per 100 Females in Castle Valley?
There are 139.18 Males per 100 Females in Castle Valley.
What is the Ratio of Females per 100 Males in Castle Valley?
There are 71.85 Females per 100 Males in Castle Valley.
What is the Median Population Age in Castle Valley?
Median Population Age in Castle Valley is 63.5 Years.
What is the Average Family Size in Castle Valley
Average Family Size in Castle Valley is 2.6 People.
What is the Average Household Size in Castle Valley
Average Household Size in Castle Valley is 2.0 People.
How Large is the Labor Force in Castle Valley?
There are 187 People in the Labor Forcein in Castle Valley.
What is the Percentage of People in the Labor Force in Castle Valley?
53.9% of People are in the Labor Force in Castle Valley.