South Ogden, UT Map & Demographics
South Ogden Map
South Ogden Overview
$40,539
PER CAPITA INCOME
$93,776
AVG FAMILY INCOME
$80,762
AVG HOUSEHOLD INCOME
27.7%
WAGE / INCOME GAP [ % ]
72.3¢/ $1
WAGE / INCOME GAP [ $ ]
0.45
INEQUALITY / GINI INDEX
17,476
TOTAL POPULATION
8,788
MALE POPULATION
8,688
FEMALE POPULATION
101.15
MALES / 100 FEMALES
98.86
FEMALES / 100 MALES
33.5
MEDIAN AGE
3.2
AVG FAMILY SIZE
2.7
AVG HOUSEHOLD SIZE
9,205
LABOR FORCE [ PEOPLE ]
67.8%
PERCENT IN LABOR FORCE
2.1%
UNEMPLOYMENT RATE
Income in South Ogden
Income Overview in South Ogden
Per Capita Income in South Ogden is $40,539, while median incomes of families and households are $93,776 and $80,762 respectively.
| Characteristic | Number | Measure |
| Per Capita Income | 17,476 | $40,539 |
| Median Family Income | 4,590 | $93,776 |
| Mean Family Income | 4,590 | $121,180 |
| Median Household Income | 6,487 | $80,762 |
| Mean Household Income | 6,487 | $107,241 |
| Income Deficit | 4,590 | $0 |
| Wage / Income Gap (%) | 17,476 | 27.74% |
| Wage / Income Gap ($) | 17,476 | 72.26¢ per $1 |
| Gini / Inequality Index | 17,476 | 0.45 |
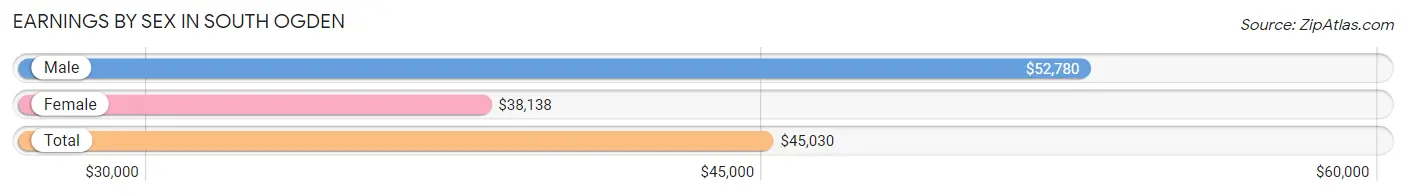
Earnings by Sex in South Ogden
Average Earnings in South Ogden are $45,030, $52,780 for men and $38,138 for women, a difference of 27.7%.
| Sex | Number | Average Earnings |
| Male | 5,181 (53.5%) | $52,780 |
| Female | 4,505 (46.5%) | $38,138 |
| Total | 9,686 (100.0%) | $45,030 |
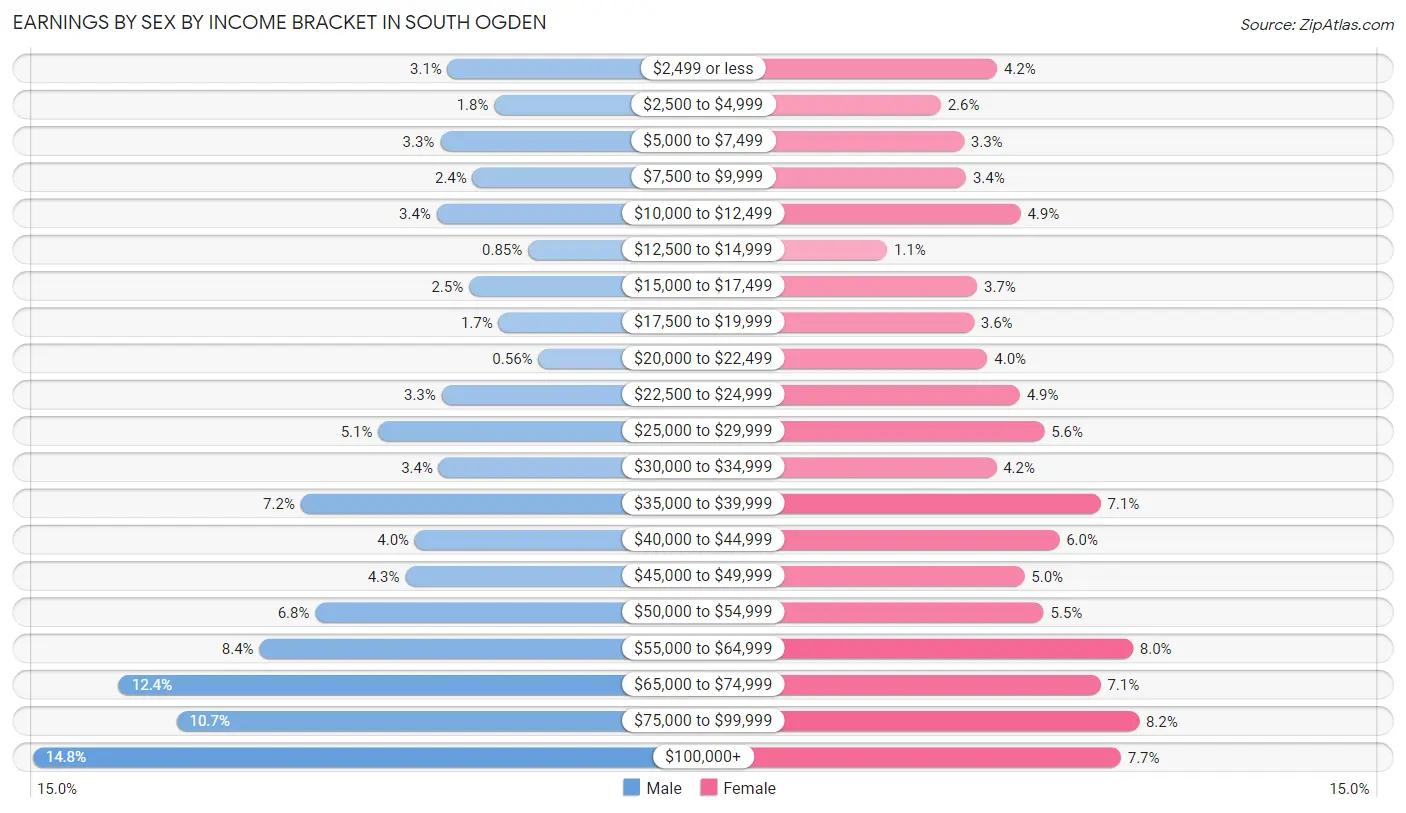
Earnings by Sex by Income Bracket in South Ogden
The most common earnings brackets in South Ogden are $100,000+ for men (765 | 14.8%) and $75,000 to $99,999 for women (370 | 8.2%).
| Income | Male | Female |
| $2,499 or less | 161 (3.1%) | 190 (4.2%) |
| $2,500 to $4,999 | 93 (1.8%) | 119 (2.6%) |
| $5,000 to $7,499 | 172 (3.3%) | 148 (3.3%) |
| $7,500 to $9,999 | 125 (2.4%) | 151 (3.4%) |
| $10,000 to $12,499 | 177 (3.4%) | 220 (4.9%) |
| $12,500 to $14,999 | 44 (0.9%) | 51 (1.1%) |
| $15,000 to $17,499 | 130 (2.5%) | 165 (3.7%) |
| $17,500 to $19,999 | 87 (1.7%) | 161 (3.6%) |
| $20,000 to $22,499 | 29 (0.6%) | 178 (4.0%) |
| $22,500 to $24,999 | 170 (3.3%) | 219 (4.9%) |
| $25,000 to $29,999 | 262 (5.1%) | 250 (5.6%) |
| $30,000 to $34,999 | 174 (3.4%) | 189 (4.2%) |
| $35,000 to $39,999 | 375 (7.2%) | 321 (7.1%) |
| $40,000 to $44,999 | 209 (4.0%) | 269 (6.0%) |
| $45,000 to $49,999 | 223 (4.3%) | 225 (5.0%) |
| $50,000 to $54,999 | 354 (6.8%) | 249 (5.5%) |
| $55,000 to $64,999 | 435 (8.4%) | 362 (8.0%) |
| $65,000 to $74,999 | 640 (12.3%) | 321 (7.1%) |
| $75,000 to $99,999 | 556 (10.7%) | 370 (8.2%) |
| $100,000+ | 765 (14.8%) | 347 (7.7%) |
| Total | 5,181 (100.0%) | 4,505 (100.0%) |
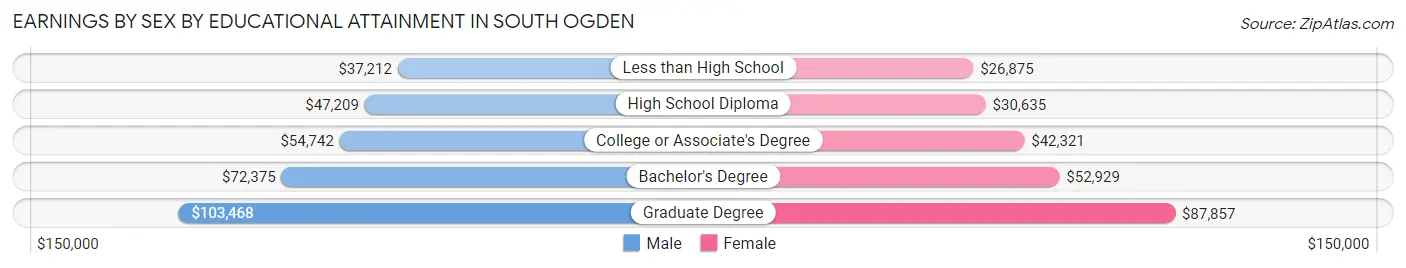
Earnings by Sex by Educational Attainment in South Ogden
Average earnings in South Ogden are $58,848 for men and $44,368 for women, a difference of 24.6%. Men with an educational attainment of graduate degree enjoy the highest average annual earnings of $103,468, while those with less than high school education earn the least with $37,212. Women with an educational attainment of graduate degree earn the most with the average annual earnings of $87,857, while those with less than high school education have the smallest earnings of $26,875.
| Educational Attainment | Male Income | Female Income |
| Less than High School | $37,212 | $26,875 |
| High School Diploma | $47,209 | $30,635 |
| College or Associate's Degree | $54,742 | $42,321 |
| Bachelor's Degree | $72,375 | $52,929 |
| Graduate Degree | $103,468 | $87,857 |
| Total | $58,848 | $44,368 |
Family Income in South Ogden
Family Income Brackets in South Ogden
According to the South Ogden family income data, there are 1,069 families falling into the $100,000 to $149,999 income range, which is the most common income bracket and makes up 23.3% of all families. Conversely, the $10,000 to $14,999 income bracket is the least frequent group with only 50 families (1.1%) belonging to this category.
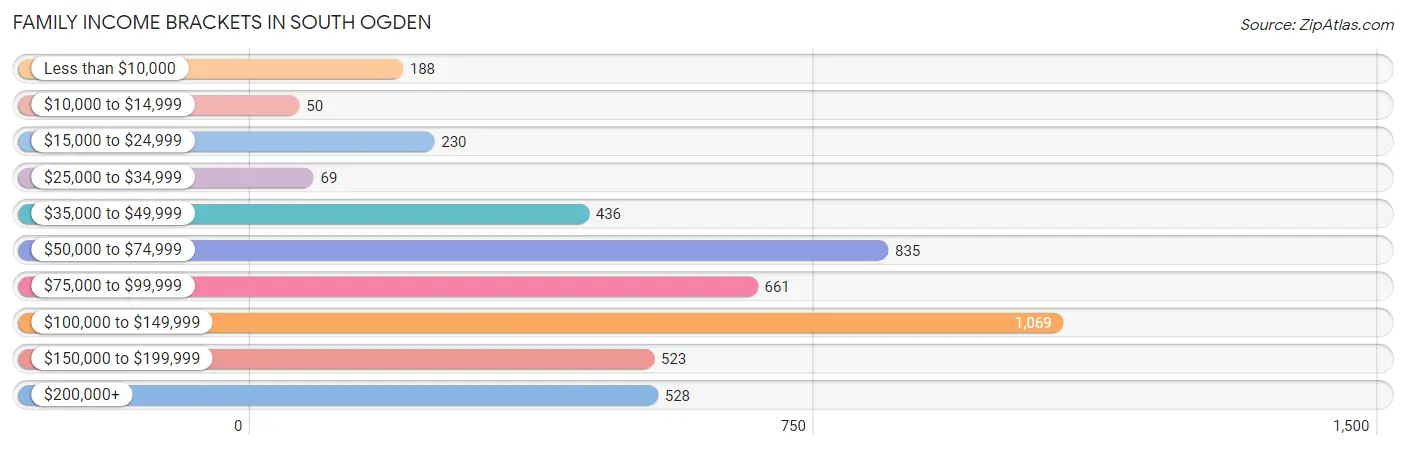
| Income Bracket | # Families | % Families |
| Less than $10,000 | 188 | 4.1% |
| $10,000 to $14,999 | 50 | 1.1% |
| $15,000 to $24,999 | 230 | 5.0% |
| $25,000 to $34,999 | 69 | 1.5% |
| $35,000 to $49,999 | 436 | 9.5% |
| $50,000 to $74,999 | 835 | 18.2% |
| $75,000 to $99,999 | 661 | 14.4% |
| $100,000 to $149,999 | 1,069 | 23.3% |
| $150,000 to $199,999 | 523 | 11.4% |
| $200,000+ | 528 | 11.5% |
Family Income by Famaliy Size in South Ogden
6-person families (216 | 4.7%) account for the highest median family income in South Ogden with $118,274 per family, while 2-person families (1,931 | 42.1%) have the highest median income of $40,140 per family member.
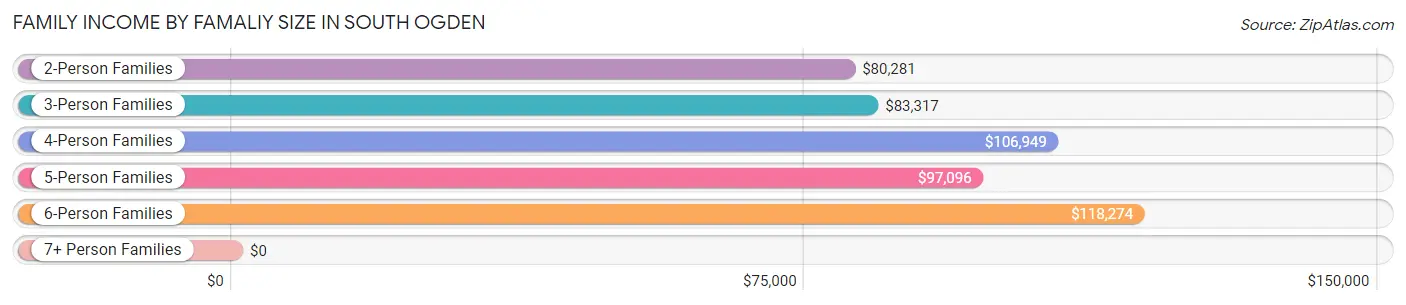
| Income Bracket | # Families | Median Income |
| 2-Person Families | 1,931 (42.1%) | $80,281 |
| 3-Person Families | 1,157 (25.2%) | $83,317 |
| 4-Person Families | 721 (15.7%) | $106,949 |
| 5-Person Families | 487 (10.6%) | $97,096 |
| 6-Person Families | 216 (4.7%) | $118,274 |
| 7+ Person Families | 78 (1.7%) | $0 |
| Total | 4,590 (100.0%) | $93,776 |
Family Income by Number of Earners in South Ogden
The median family income in South Ogden is $93,776, with families comprising 3+ earners (607) having the highest median family income of $160,972, while families with no earners (689) have the lowest median family income of $48,472, accounting for 13.2% and 15.0% of families, respectively.
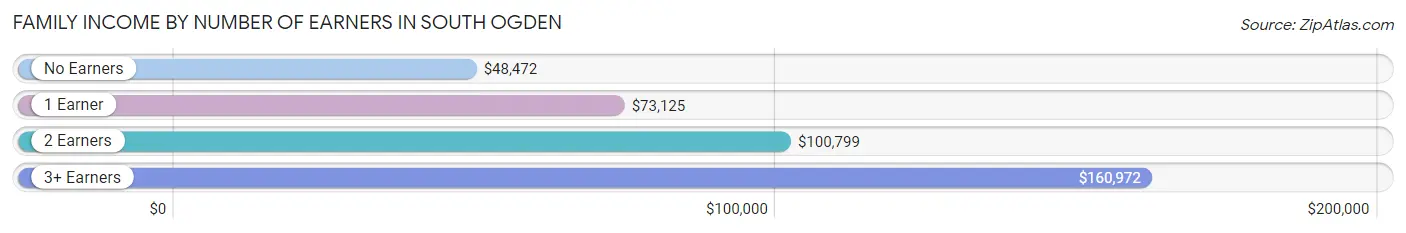
| Number of Earners | # Families | Median Income |
| No Earners | 689 (15.0%) | $48,472 |
| 1 Earner | 1,266 (27.6%) | $73,125 |
| 2 Earners | 2,028 (44.2%) | $100,799 |
| 3+ Earners | 607 (13.2%) | $160,972 |
| Total | 4,590 (100.0%) | $93,776 |
Household Income in South Ogden
Household Income Brackets in South Ogden
With 1,317 households falling in the category, the $100,000 to $149,999 income range is the most frequent in South Ogden, accounting for 20.3% of all households. In contrast, only 169 households (2.6%) fall into the $10,000 to $14,999 income bracket, making it the least populous group.
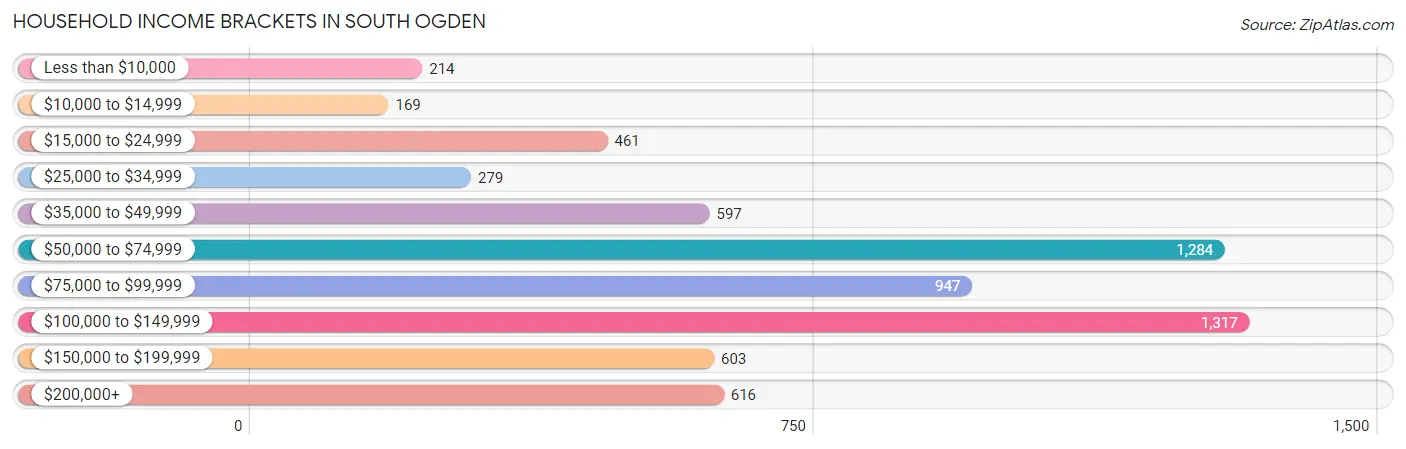
| Income Bracket | # Households | % Households |
| Less than $10,000 | 214 | 3.3% |
| $10,000 to $14,999 | 169 | 2.6% |
| $15,000 to $24,999 | 461 | 7.1% |
| $25,000 to $34,999 | 279 | 4.3% |
| $35,000 to $49,999 | 597 | 9.2% |
| $50,000 to $74,999 | 1,284 | 19.8% |
| $75,000 to $99,999 | 947 | 14.6% |
| $100,000 to $149,999 | 1,317 | 20.3% |
| $150,000 to $199,999 | 603 | 9.3% |
| $200,000+ | 616 | 9.5% |
Household Income by Householder Age in South Ogden
The median household income in South Ogden is $80,762, with the highest median household income of $102,679 found in the 45 to 64 years age bracket for the primary householder. A total of 2,017 households (31.1%) fall into this category. Meanwhile, the 15 to 24 years age bracket for the primary householder has the lowest median household income of $39,481, with 388 households (6.0%) in this group.
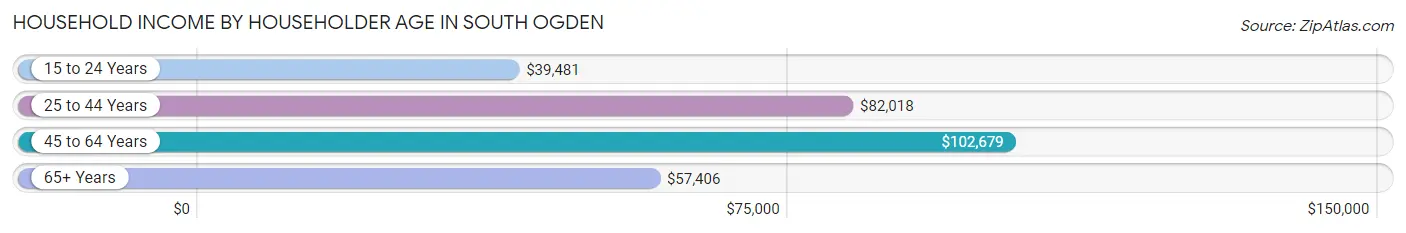
| Income Bracket | # Households | Median Income |
| 15 to 24 Years | 388 (6.0%) | $39,481 |
| 25 to 44 Years | 2,675 (41.2%) | $82,018 |
| 45 to 64 Years | 2,017 (31.1%) | $102,679 |
| 65+ Years | 1,407 (21.7%) | $57,406 |
| Total | 6,487 (100.0%) | $80,762 |
Poverty in South Ogden
Income Below Poverty by Sex and Age in South Ogden
With 7.0% poverty level for males and 8.3% for females among the residents of South Ogden, 5 year old males and 75 year old and over females are the most vulnerable to poverty, with 38 males (21.1%) and 99 females (20.1%) in their respective age groups living below the poverty level.
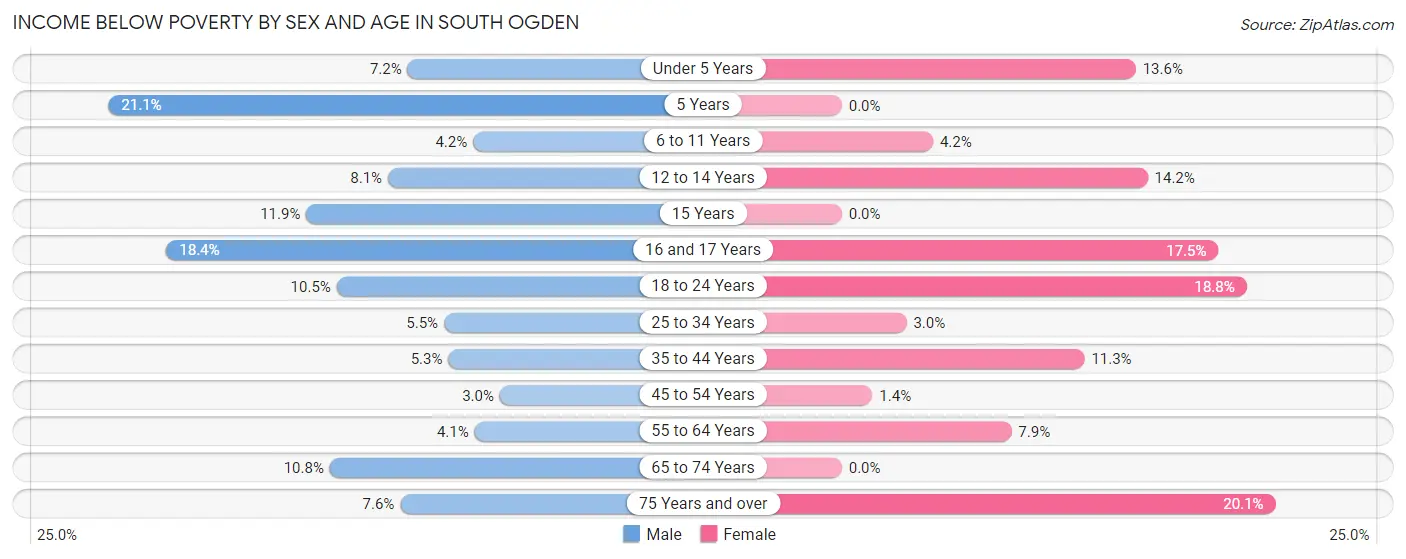
| Age Bracket | Male | Female |
| Under 5 Years | 46 (7.2%) | 81 (13.6%) |
| 5 Years | 38 (21.1%) | 0 (0.0%) |
| 6 to 11 Years | 38 (4.2%) | 28 (4.2%) |
| 12 to 14 Years | 24 (8.1%) | 42 (14.2%) |
| 15 Years | 13 (11.9%) | 0 (0.0%) |
| 16 and 17 Years | 42 (18.4%) | 40 (17.5%) |
| 18 to 24 Years | 85 (10.5%) | 163 (18.8%) |
| 25 to 34 Years | 87 (5.5%) | 47 (3.0%) |
| 35 to 44 Years | 65 (5.3%) | 123 (11.3%) |
| 45 to 54 Years | 21 (2.9%) | 14 (1.4%) |
| 55 to 64 Years | 35 (4.1%) | 72 (7.9%) |
| 65 to 74 Years | 90 (10.8%) | 0 (0.0%) |
| 75 Years and over | 29 (7.6%) | 99 (20.1%) |
| Total | 613 (7.0%) | 709 (8.3%) |
Income Above Poverty by Sex and Age in South Ogden
According to the poverty statistics in South Ogden, males aged 45 to 54 years and females aged 5 years are the age groups that are most secure financially, with 97.1% of males and 100.0% of females in these age groups living above the poverty line.
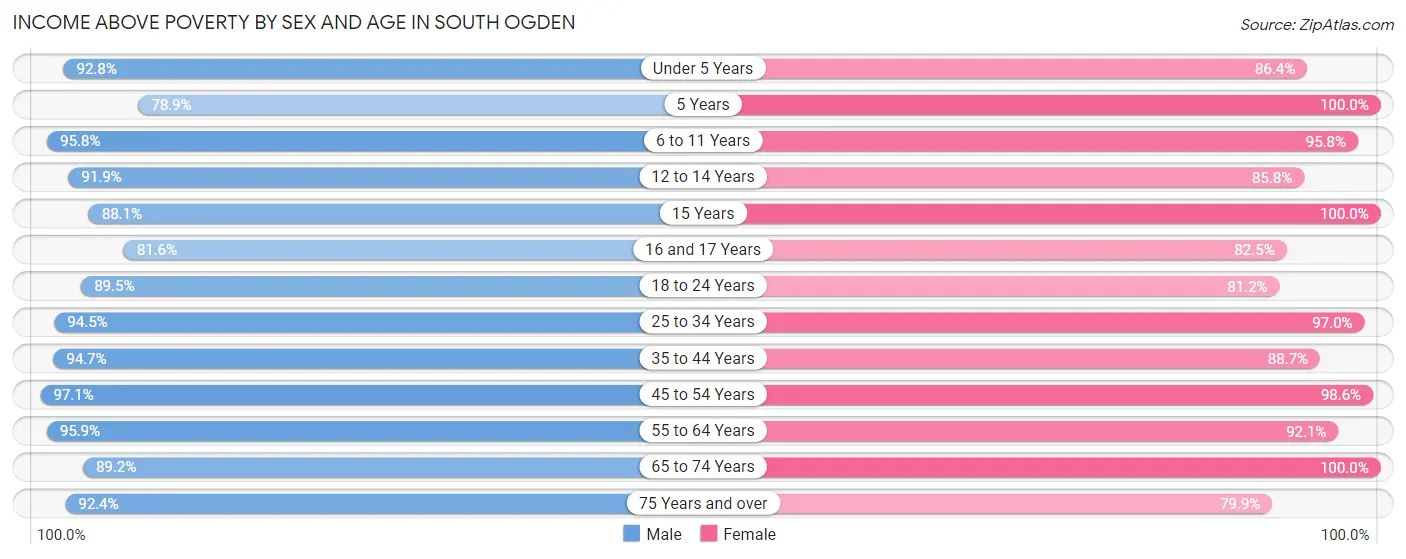
| Age Bracket | Male | Female |
| Under 5 Years | 590 (92.8%) | 513 (86.4%) |
| 5 Years | 142 (78.9%) | 87 (100.0%) |
| 6 to 11 Years | 869 (95.8%) | 634 (95.8%) |
| 12 to 14 Years | 271 (91.9%) | 254 (85.8%) |
| 15 Years | 96 (88.1%) | 83 (100.0%) |
| 16 and 17 Years | 186 (81.6%) | 189 (82.5%) |
| 18 to 24 Years | 723 (89.5%) | 705 (81.2%) |
| 25 to 34 Years | 1,482 (94.5%) | 1,520 (97.0%) |
| 35 to 44 Years | 1,153 (94.7%) | 969 (88.7%) |
| 45 to 54 Years | 690 (97.1%) | 969 (98.6%) |
| 55 to 64 Years | 815 (95.9%) | 843 (92.1%) |
| 65 to 74 Years | 740 (89.2%) | 698 (100.0%) |
| 75 Years and over | 354 (92.4%) | 393 (79.9%) |
| Total | 8,111 (93.0%) | 7,857 (91.7%) |
Income Below Poverty Among Married-Couple Families in South Ogden
The poverty statistics for married-couple families in South Ogden show that 7.2% or 262 of the total 3,624 families live below the poverty line. Families with 1 or 2 children have the highest poverty rate of 9.0%, comprising of 127 families. On the other hand, families with 5 or more children have the lowest poverty rate of 0.0%, which includes 0 families.
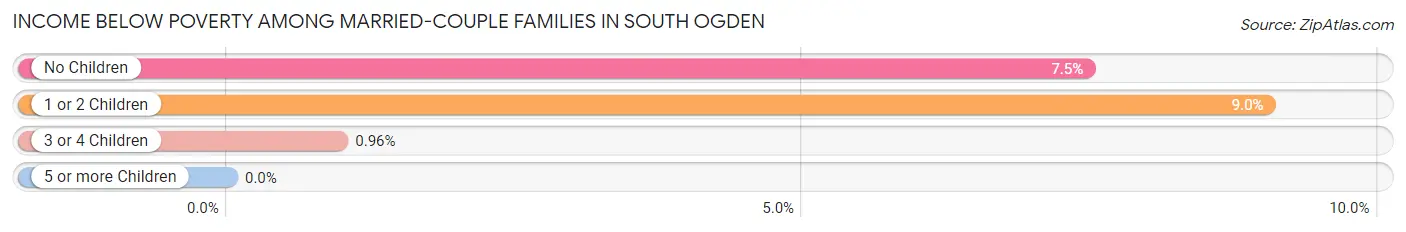
| Children | Above Poverty | Below Poverty |
| No Children | 1,625 (92.5%) | 131 (7.5%) |
| 1 or 2 Children | 1,280 (91.0%) | 127 (9.0%) |
| 3 or 4 Children | 414 (99.0%) | 4 (1.0%) |
| 5 or more Children | 43 (100.0%) | 0 (0.0%) |
| Total | 3,362 (92.8%) | 262 (7.2%) |
Income Below Poverty Among Single-Parent Households in South Ogden
According to the poverty data in South Ogden, 6.8% or 23 single-father households and 10.4% or 65 single-mother households are living below the poverty line. Among single-father households, those with 1 or 2 children have the highest poverty rate, with 17 households (11.8%) experiencing poverty. Likewise, among single-mother households, those with 3 or 4 children have the highest poverty rate, with 42 households (76.4%) falling below the poverty line.
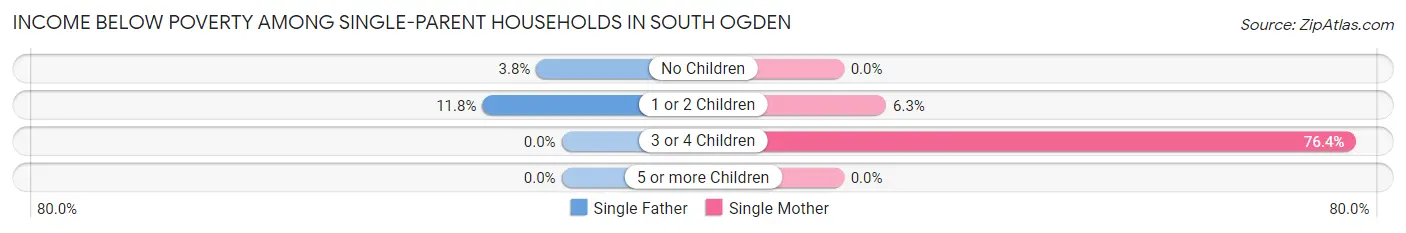
| Children | Single Father | Single Mother |
| No Children | 6 (3.8%) | 0 (0.0%) |
| 1 or 2 Children | 17 (11.8%) | 23 (6.3%) |
| 3 or 4 Children | 0 (0.0%) | 42 (76.4%) |
| 5 or more Children | 0 (0.0%) | 0 (0.0%) |
| Total | 23 (6.8%) | 65 (10.4%) |
Income Below Poverty Among Married-Couple vs Single-Parent Households in South Ogden
The poverty data for South Ogden shows that 262 of the married-couple family households (7.2%) and 88 of the single-parent households (9.1%) are living below the poverty level. Within the married-couple family households, those with 1 or 2 children have the highest poverty rate, with 127 households (9.0%) falling below the poverty line. Among the single-parent households, those with 3 or 4 children have the highest poverty rate, with 42 household (45.7%) living below poverty.
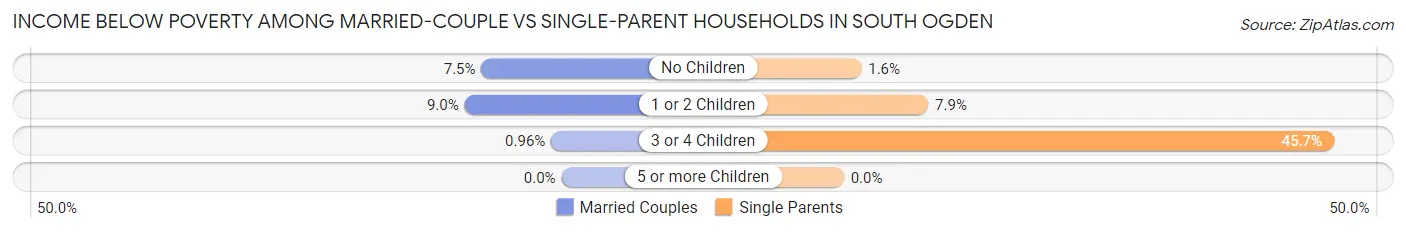
| Children | Married-Couple Families | Single-Parent Households |
| No Children | 131 (7.5%) | 6 (1.6%) |
| 1 or 2 Children | 127 (9.0%) | 40 (7.9%) |
| 3 or 4 Children | 4 (1.0%) | 42 (45.7%) |
| 5 or more Children | 0 (0.0%) | 0 (0.0%) |
| Total | 262 (7.2%) | 88 (9.1%) |
Race in South Ogden
The most populous races in South Ogden are White / Caucasian (15,568 | 89.1%), Hispanic or Latino (2,461 | 14.1%), and Two or more Races (902 | 5.2%).
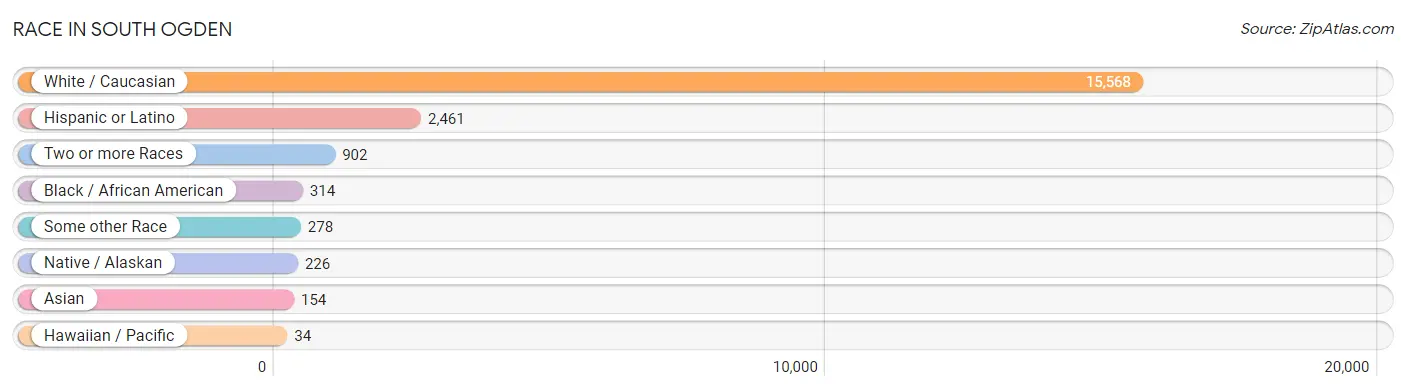
| Race | # Population | % Population |
| Asian | 154 | 0.9% |
| Black / African American | 314 | 1.8% |
| Hawaiian / Pacific | 34 | 0.2% |
| Hispanic or Latino | 2,461 | 14.1% |
| Native / Alaskan | 226 | 1.3% |
| White / Caucasian | 15,568 | 89.1% |
| Two or more Races | 902 | 5.2% |
| Some other Race | 278 | 1.6% |
| Total | 17,476 | 100.0% |
Ancestry in South Ogden
The most populous ancestries reported in South Ogden are English (3,903 | 22.3%), Mexican (1,395 | 8.0%), German (1,325 | 7.6%), Irish (1,280 | 7.3%), and American (1,022 | 5.9%), together accounting for 51.1% of all South Ogden residents.
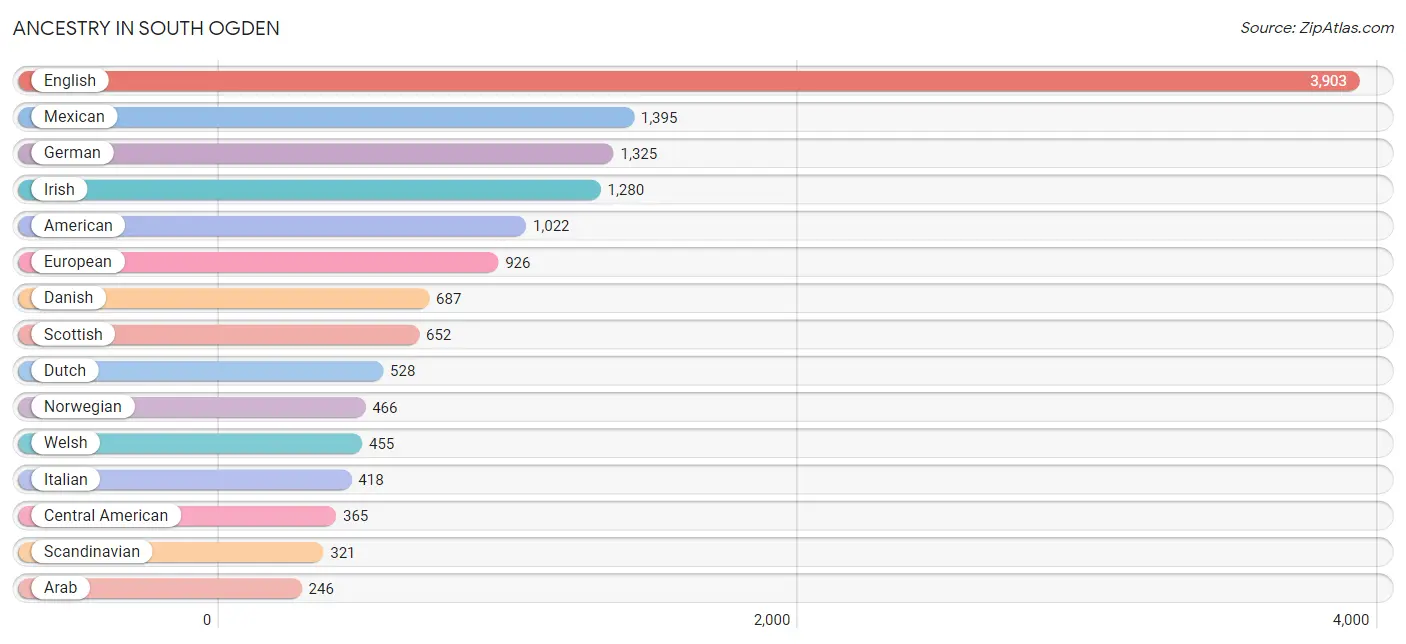
| Ancestry | # Population | % Population |
| American | 1,022 | 5.9% |
| Arab | 246 | 1.4% |
| Armenian | 17 | 0.1% |
| Austrian | 29 | 0.2% |
| Basque | 5 | 0.0% |
| Belgian | 35 | 0.2% |
| Bhutanese | 23 | 0.1% |
| British | 125 | 0.7% |
| Burmese | 92 | 0.5% |
| Canadian | 79 | 0.4% |
| Celtic | 107 | 0.6% |
| Central American | 365 | 2.1% |
| Central American Indian | 168 | 1.0% |
| Colombian | 22 | 0.1% |
| Croatian | 8 | 0.1% |
| Cuban | 49 | 0.3% |
| Czech | 48 | 0.3% |
| Danish | 687 | 3.9% |
| Delaware | 19 | 0.1% |
| Dominican | 21 | 0.1% |
| Dutch | 528 | 3.0% |
| Eastern European | 41 | 0.2% |
| Ecuadorian | 2 | 0.0% |
| English | 3,903 | 22.3% |
| European | 926 | 5.3% |
| Finnish | 46 | 0.3% |
| French | 243 | 1.4% |
| French Canadian | 41 | 0.2% |
| German | 1,325 | 7.6% |
| Greek | 226 | 1.3% |
| Guatemalan | 196 | 1.1% |
| Haitian | 49 | 0.3% |
| Hungarian | 9 | 0.1% |
| Icelander | 25 | 0.1% |
| Indian (Asian) | 7 | 0.0% |
| Iranian | 8 | 0.1% |
| Irish | 1,280 | 7.3% |
| Italian | 418 | 2.4% |
| Japanese | 30 | 0.2% |
| Korean | 166 | 0.9% |
| Lithuanian | 19 | 0.1% |
| Mexican | 1,395 | 8.0% |
| Native Hawaiian | 8 | 0.1% |
| Navajo | 73 | 0.4% |
| Nigerian | 8 | 0.1% |
| Northern European | 25 | 0.1% |
| Norwegian | 466 | 2.7% |
| Peruvian | 39 | 0.2% |
| Polish | 177 | 1.0% |
| Portuguese | 37 | 0.2% |
| Puerto Rican | 58 | 0.3% |
| Romanian | 50 | 0.3% |
| Salvadoran | 169 | 1.0% |
| Samoan | 27 | 0.2% |
| Scandinavian | 321 | 1.8% |
| Scotch-Irish | 191 | 1.1% |
| Scottish | 652 | 3.7% |
| Sioux | 38 | 0.2% |
| South American | 74 | 0.4% |
| Spaniard | 237 | 1.4% |
| Spanish | 93 | 0.5% |
| Sri Lankan | 22 | 0.1% |
| Subsaharan African | 20 | 0.1% |
| Swedish | 208 | 1.2% |
| Swiss | 133 | 0.8% |
| Thai | 48 | 0.3% |
| Ukrainian | 13 | 0.1% |
| Uruguayan | 11 | 0.1% |
| Ute | 26 | 0.2% |
| Welsh | 455 | 2.6% |
| Yugoslavian | 20 | 0.1% | View All 71 Rows |
Immigrants in South Ogden
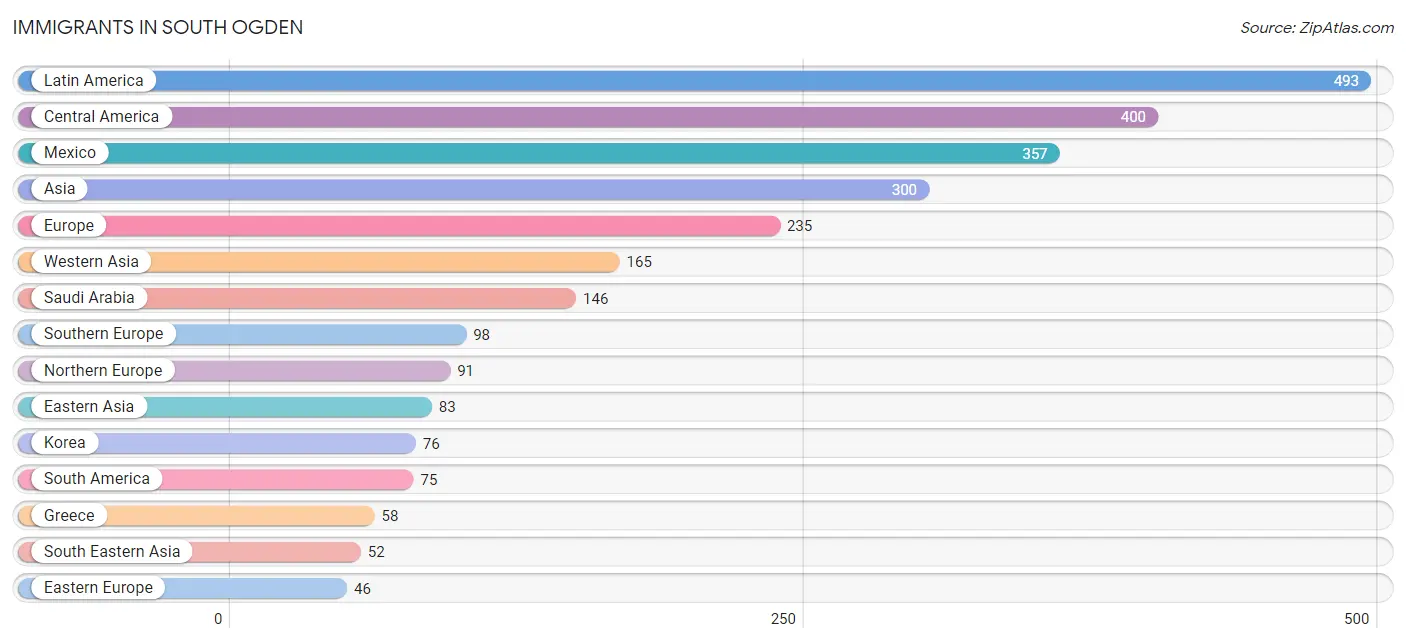
The most numerous immigrant groups reported in South Ogden came from Latin America (493 | 2.8%), Central America (400 | 2.3%), Mexico (357 | 2.0%), Asia (300 | 1.7%), and Europe (235 | 1.3%), together accounting for 10.2% of all South Ogden residents.
| Immigration Origin | # Population | % Population |
| Africa | 12 | 0.1% |
| Asia | 300 | 1.7% |
| Brazil | 37 | 0.2% |
| Bulgaria | 19 | 0.1% |
| Cambodia | 11 | 0.1% |
| Canada | 15 | 0.1% |
| Caribbean | 18 | 0.1% |
| Central America | 400 | 2.3% |
| China | 7 | 0.0% |
| Colombia | 27 | 0.2% |
| Cuba | 18 | 0.1% |
| Eastern Asia | 83 | 0.5% |
| Eastern Europe | 46 | 0.3% |
| El Salvador | 43 | 0.3% |
| England | 7 | 0.0% |
| Europe | 235 | 1.3% |
| Greece | 58 | 0.3% |
| Italy | 16 | 0.1% |
| Jordan | 19 | 0.1% |
| Korea | 76 | 0.4% |
| Latin America | 493 | 2.8% |
| Mexico | 357 | 2.0% |
| Middle Africa | 12 | 0.1% |
| Northern Europe | 91 | 0.5% |
| Oceania | 18 | 0.1% |
| Philippines | 41 | 0.2% |
| Romania | 27 | 0.2% |
| Saudi Arabia | 146 | 0.8% |
| South America | 75 | 0.4% |
| South Eastern Asia | 52 | 0.3% |
| Southern Europe | 98 | 0.6% |
| Spain | 24 | 0.1% |
| Taiwan | 7 | 0.0% |
| Uruguay | 11 | 0.1% |
| Western Asia | 165 | 0.9% |
| Zaire | 12 | 0.1% | View All 36 Rows |
Sex and Age in South Ogden
Sex and Age in South Ogden
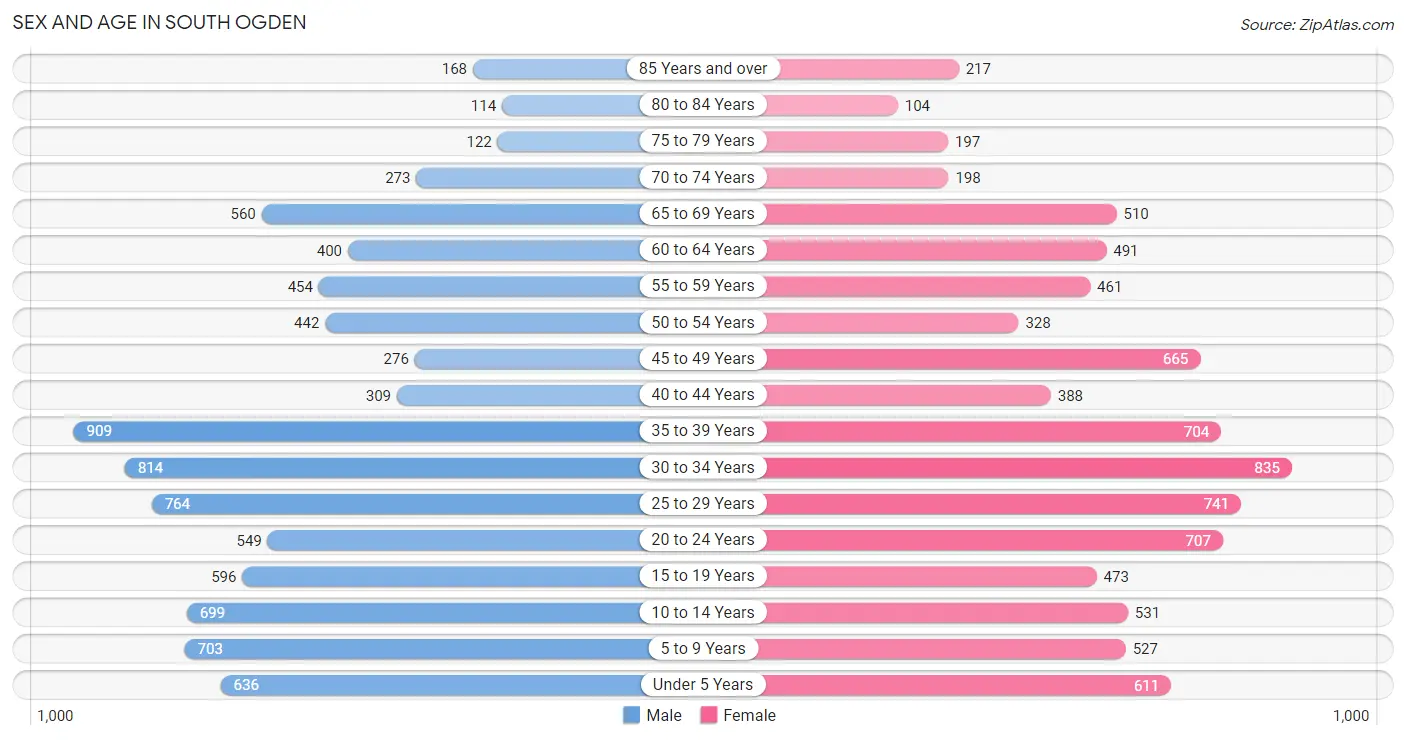
The most populous age groups in South Ogden are 35 to 39 Years (909 | 10.3%) for men and 30 to 34 Years (835 | 9.6%) for women.
| Age Bracket | Male | Female |
| Under 5 Years | 636 (7.2%) | 611 (7.0%) |
| 5 to 9 Years | 703 (8.0%) | 527 (6.1%) |
| 10 to 14 Years | 699 (8.0%) | 531 (6.1%) |
| 15 to 19 Years | 596 (6.8%) | 473 (5.4%) |
| 20 to 24 Years | 549 (6.2%) | 707 (8.1%) |
| 25 to 29 Years | 764 (8.7%) | 741 (8.5%) |
| 30 to 34 Years | 814 (9.3%) | 835 (9.6%) |
| 35 to 39 Years | 909 (10.3%) | 704 (8.1%) |
| 40 to 44 Years | 309 (3.5%) | 388 (4.5%) |
| 45 to 49 Years | 276 (3.1%) | 665 (7.6%) |
| 50 to 54 Years | 442 (5.0%) | 328 (3.8%) |
| 55 to 59 Years | 454 (5.2%) | 461 (5.3%) |
| 60 to 64 Years | 400 (4.5%) | 491 (5.7%) |
| 65 to 69 Years | 560 (6.4%) | 510 (5.9%) |
| 70 to 74 Years | 273 (3.1%) | 198 (2.3%) |
| 75 to 79 Years | 122 (1.4%) | 197 (2.3%) |
| 80 to 84 Years | 114 (1.3%) | 104 (1.2%) |
| 85 Years and over | 168 (1.9%) | 217 (2.5%) |
| Total | 8,788 (100.0%) | 8,688 (100.0%) |
Families and Households in South Ogden
Median Family Size in South Ogden
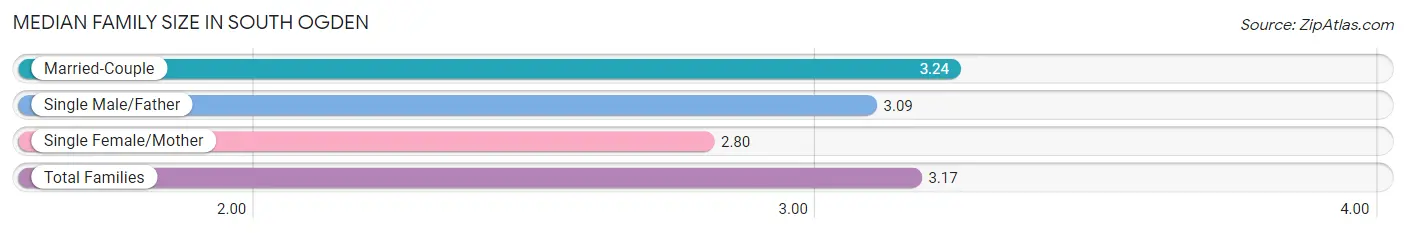
The median family size in South Ogden is 3.17 persons per family, with married-couple families (3,624 | 78.9%) accounting for the largest median family size of 3.24 persons per family. On the other hand, single female/mother families (626 | 13.6%) represent the smallest median family size with 2.80 persons per family.
| Family Type | # Families | Family Size |
| Married-Couple | 3,624 (78.9%) | 3.24 |
| Single Male/Father | 340 (7.4%) | 3.09 |
| Single Female/Mother | 626 (13.6%) | 2.80 |
| Total Families | 4,590 (100.0%) | 3.17 |
Median Household Size in South Ogden
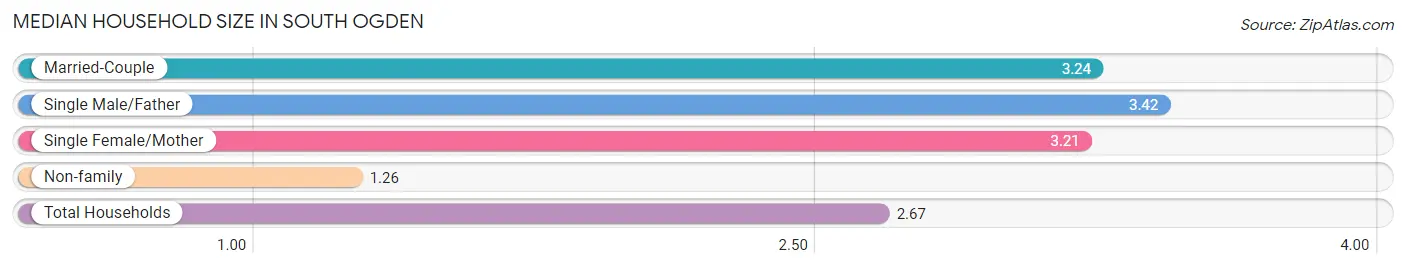
The median household size in South Ogden is 2.67 persons per household, with single male/father households (340 | 5.2%) accounting for the largest median household size of 3.42 persons per household. non-family households (1,897 | 29.2%) represent the smallest median household size with 1.26 persons per household.
| Household Type | # Households | Household Size |
| Married-Couple | 3,624 (55.9%) | 3.24 |
| Single Male/Father | 340 (5.2%) | 3.42 |
| Single Female/Mother | 626 (9.7%) | 3.21 |
| Non-family | 1,897 (29.2%) | 1.26 |
| Total Households | 6,487 (100.0%) | 2.67 |
Household Size by Marriage Status in South Ogden
Out of a total of 6,487 households in South Ogden, 4,590 (70.8%) are family households, while 1,897 (29.2%) are nonfamily households. The most numerous type of family households are 2-person households, comprising 1,786, and the most common type of nonfamily households are 1-person households, comprising 1,508.
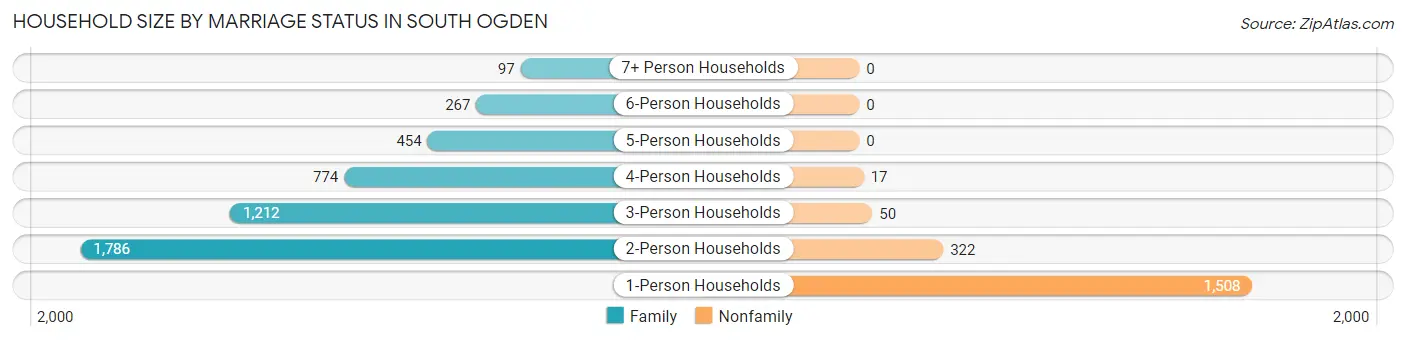
| Household Size | Family Households | Nonfamily Households |
| 1-Person Households | - | 1,508 (23.3%) |
| 2-Person Households | 1,786 (27.5%) | 322 (5.0%) |
| 3-Person Households | 1,212 (18.7%) | 50 (0.8%) |
| 4-Person Households | 774 (11.9%) | 17 (0.3%) |
| 5-Person Households | 454 (7.0%) | 0 (0.0%) |
| 6-Person Households | 267 (4.1%) | 0 (0.0%) |
| 7+ Person Households | 97 (1.5%) | 0 (0.0%) |
| Total | 4,590 (70.8%) | 1,897 (29.2%) |
Female Fertility in South Ogden
Fertility by Age in South Ogden
Average fertility rate in South Ogden is 60.0 births per 1,000 women. Women in the age bracket of 20 to 34 years have the highest fertility rate with 86.0 births per 1,000 women. Women in the age bracket of 20 to 34 years acount for 71.5% of all women with births.
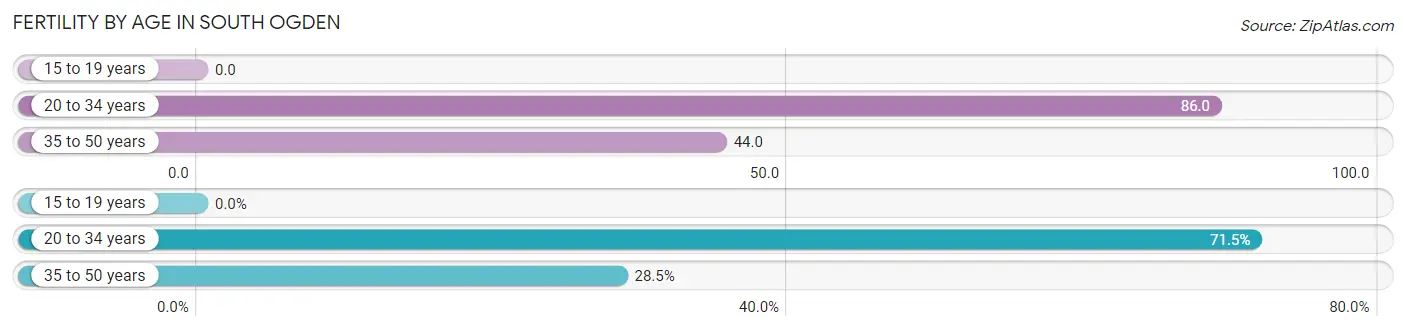
| Age Bracket | Women with Births | Births / 1,000 Women |
| 15 to 19 years | 0 (0.0%) | 0.0 |
| 20 to 34 years | 196 (71.5%) | 86.0 |
| 35 to 50 years | 78 (28.5%) | 44.0 |
| Total | 274 (100.0%) | 60.0 |
Fertility by Age by Marriage Status in South Ogden
83.9% of women with births (274) in South Ogden are married. The highest percentage of unmarried women with births falls into 20 to 34 years age bracket with 18.9% of them unmarried at the time of birth, while the lowest percentage of unmarried women with births belong to 35 to 50 years age bracket with 9.0% of them unmarried.
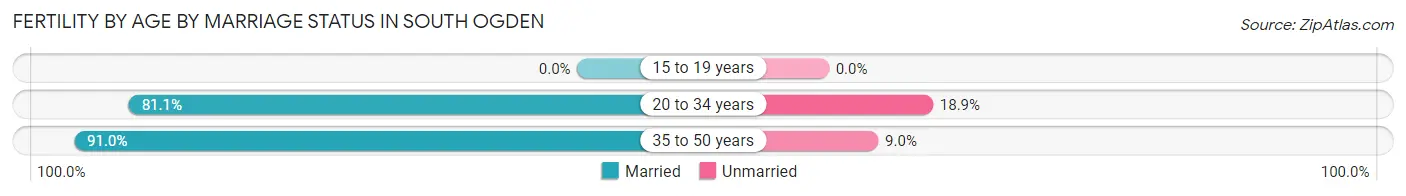
| Age Bracket | Married | Unmarried |
| 15 to 19 years | 0 (0.0%) | 0 (0.0%) |
| 20 to 34 years | 159 (81.1%) | 37 (18.9%) |
| 35 to 50 years | 71 (91.0%) | 7 (9.0%) |
| Total | 230 (83.9%) | 44 (16.1%) |
Fertility by Education in South Ogden
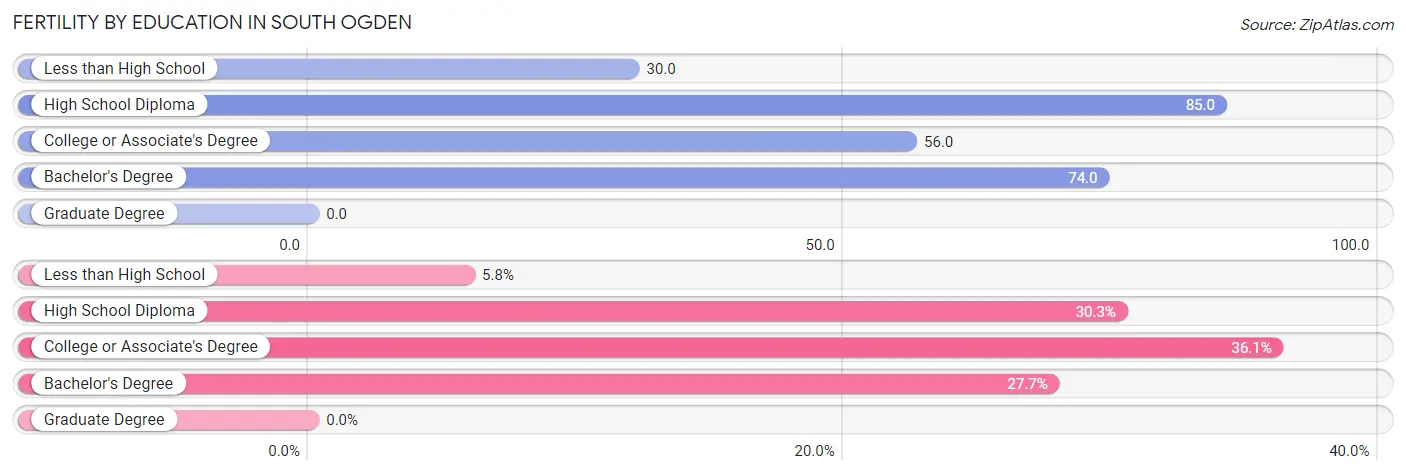
| Educational Attainment | Women with Births | Births / 1,000 Women |
| Less than High School | 16 (5.8%) | 30.0 |
| High School Diploma | 83 (30.3%) | 85.0 |
| College or Associate's Degree | 99 (36.1%) | 56.0 |
| Bachelor's Degree | 76 (27.7%) | 74.0 |
| Graduate Degree | 0 (0.0%) | 0.0 |
| Total | 274 (100.0%) | 60.0 |
Fertility by Education by Marriage Status in South Ogden
16.1% of women with births in South Ogden are unmarried. Women with the educational attainment of college or associate's degree are most likely to be married with 100.0% of them married at childbirth, while women with the educational attainment of less than high school are least likely to be married with 100.0% of them unmarried at childbirth.
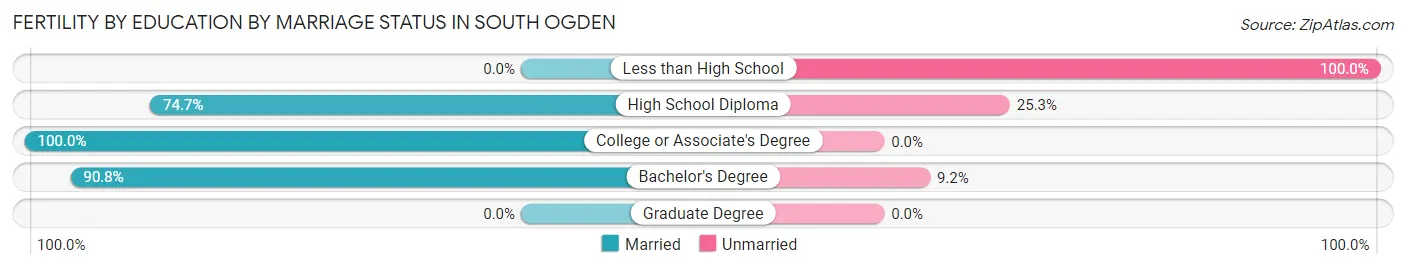
| Educational Attainment | Married | Unmarried |
| Less than High School | 0 (0.0%) | 16 (100.0%) |
| High School Diploma | 62 (74.7%) | 21 (25.3%) |
| College or Associate's Degree | 99 (100.0%) | 0 (0.0%) |
| Bachelor's Degree | 69 (90.8%) | 7 (9.2%) |
| Graduate Degree | 0 (0.0%) | 0 (0.0%) |
| Total | 230 (83.9%) | 44 (16.1%) |
Employment Characteristics in South Ogden
Employment by Class of Employer in South Ogden
Among the 8,851 employed individuals in South Ogden, private company employees (5,774 | 65.2%), federal government employees (1,070 | 12.1%), and not-for-profit organizations (619 | 7.0%) make up the most common classes of employment.
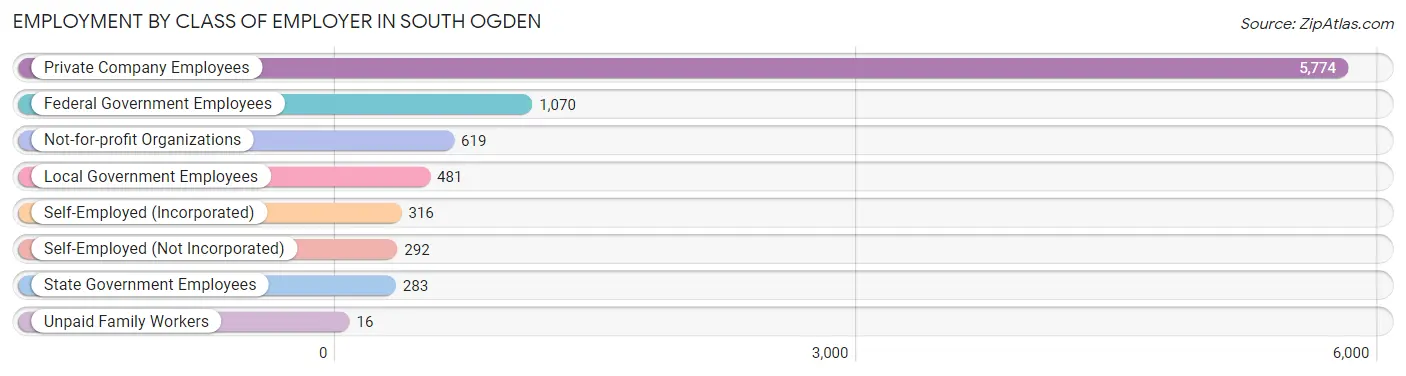
| Employer Class | # Employees | % Employees |
| Private Company Employees | 5,774 | 65.2% |
| Self-Employed (Incorporated) | 316 | 3.6% |
| Self-Employed (Not Incorporated) | 292 | 3.3% |
| Not-for-profit Organizations | 619 | 7.0% |
| Local Government Employees | 481 | 5.4% |
| State Government Employees | 283 | 3.2% |
| Federal Government Employees | 1,070 | 12.1% |
| Unpaid Family Workers | 16 | 0.2% |
| Total | 8,851 | 100.0% |
Employment Status by Age in South Ogden
According to the labor force statistics for South Ogden, out of the total population over 16 years of age (13,577), 67.8% or 9,205 individuals are in the labor force, with 2.1% or 193 of them unemployed. The age group with the highest labor force participation rate is 25 to 29 years, with 87.4% or 1,315 individuals in the labor force. Within the labor force, the 16 to 19 years age range has the highest percentage of unemployed individuals, with 10.9% or 40 of them being unemployed.
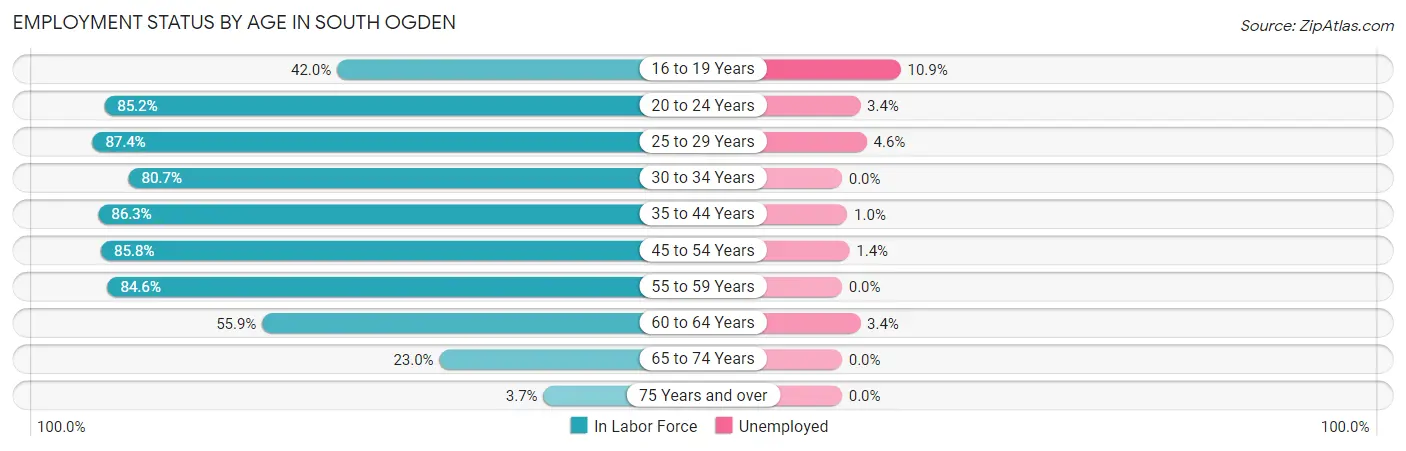
| Age Bracket | In Labor Force | Unemployed |
| 16 to 19 Years | 368 (42.0%) | 40 (10.9%) |
| 20 to 24 Years | 1,070 (85.2%) | 36 (3.4%) |
| 25 to 29 Years | 1,315 (87.4%) | 60 (4.6%) |
| 30 to 34 Years | 1,331 (80.7%) | 0 (0.0%) |
| 35 to 44 Years | 1,994 (86.3%) | 20 (1.0%) |
| 45 to 54 Years | 1,468 (85.8%) | 21 (1.4%) |
| 55 to 59 Years | 774 (84.6%) | 0 (0.0%) |
| 60 to 64 Years | 498 (55.9%) | 17 (3.4%) |
| 65 to 74 Years | 354 (23.0%) | 0 (0.0%) |
| 75 Years and over | 34 (3.7%) | 0 (0.0%) |
| Total | 9,205 (67.8%) | 193 (2.1%) |
Employment Status by Educational Attainment in South Ogden
According to labor force statistics for South Ogden, 82.2% of individuals (7,382) out of the total population between 25 and 64 years of age (8,981) are in the labor force, with 1.5% or 111 of them being unemployed. The group with the highest labor force participation rate are those with the educational attainment of high school diploma, with 83.2% or 1,768 individuals in the labor force. Within the labor force, individuals with less than high school education have the highest percentage of unemployment, with 2.2% or 8 of them being unemployed.
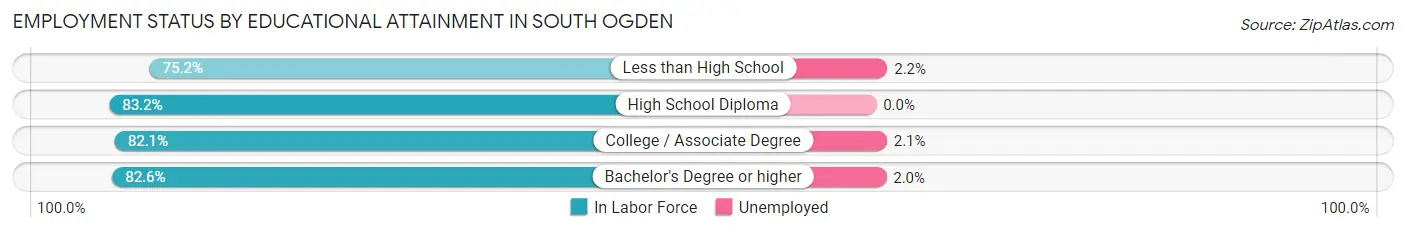
| Educational Attainment | In Labor Force | Unemployed |
| Less than High School | 361 (75.2%) | 11 (2.2%) |
| High School Diploma | 1,768 (83.2%) | 0 (0.0%) |
| College / Associate Degree | 2,896 (82.1%) | 74 (2.1%) |
| Bachelor's Degree or higher | 2,353 (82.6%) | 57 (2.0%) |
| Total | 7,382 (82.2%) | 135 (1.5%) |
Employment Occupations by Sex in South Ogden
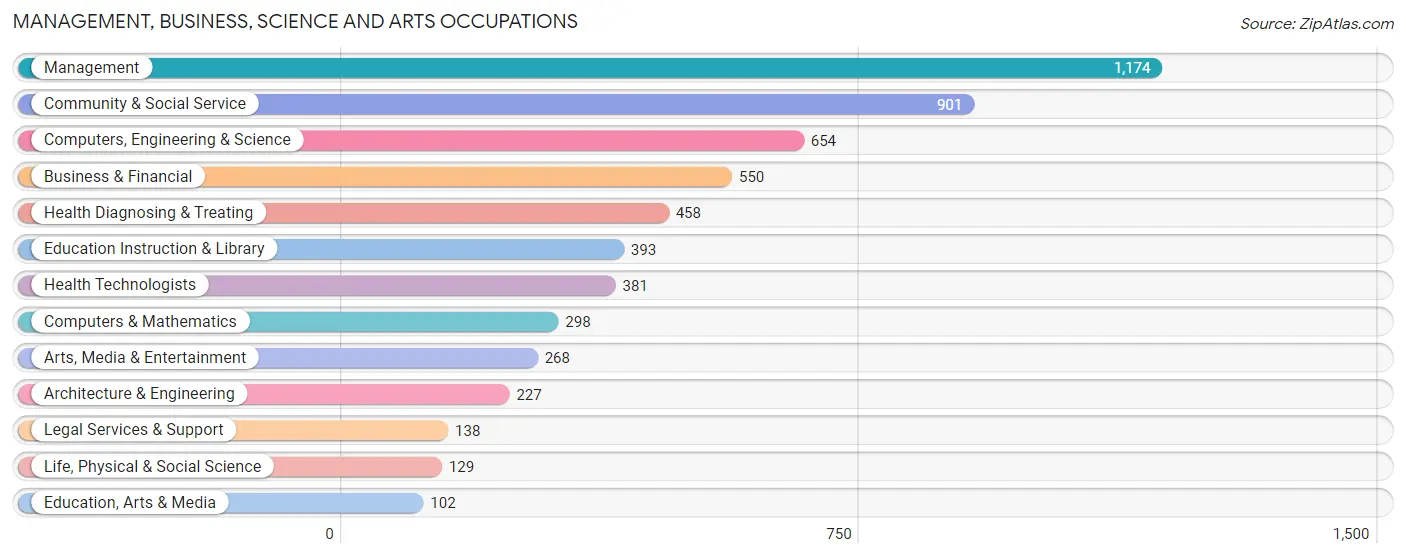
Management, Business, Science and Arts Occupations
The most common Management, Business, Science and Arts occupations in South Ogden are Management (1,174 | 13.3%), Community & Social Service (901 | 10.2%), Computers, Engineering & Science (654 | 7.4%), Business & Financial (550 | 6.2%), and Health Diagnosing & Treating (458 | 5.2%).
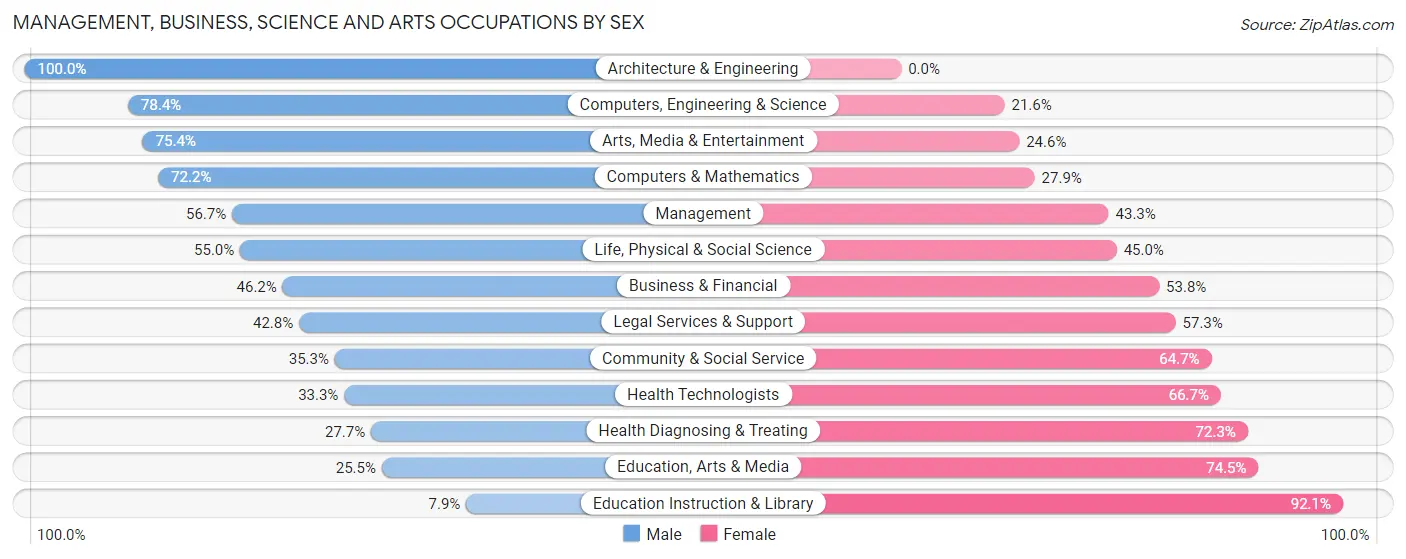
Management, Business, Science and Arts Occupations by Sex
Within the Management, Business, Science and Arts occupations in South Ogden, the most male-oriented occupations are Architecture & Engineering (100.0%), Computers, Engineering & Science (78.4%), and Arts, Media & Entertainment (75.4%), while the most female-oriented occupations are Education Instruction & Library (92.1%), Education, Arts & Media (74.5%), and Health Diagnosing & Treating (72.3%).
| Occupation | Male | Female |
| Management | 666 (56.7%) | 508 (43.3%) |
| Business & Financial | 254 (46.2%) | 296 (53.8%) |
| Computers, Engineering & Science | 513 (78.4%) | 141 (21.6%) |
| Computers & Mathematics | 215 (72.2%) | 83 (27.9%) |
| Architecture & Engineering | 227 (100.0%) | 0 (0.0%) |
| Life, Physical & Social Science | 71 (55.0%) | 58 (45.0%) |
| Community & Social Service | 318 (35.3%) | 583 (64.7%) |
| Education, Arts & Media | 26 (25.5%) | 76 (74.5%) |
| Legal Services & Support | 59 (42.7%) | 79 (57.3%) |
| Education Instruction & Library | 31 (7.9%) | 362 (92.1%) |
| Arts, Media & Entertainment | 202 (75.4%) | 66 (24.6%) |
| Health Diagnosing & Treating | 127 (27.7%) | 331 (72.3%) |
| Health Technologists | 127 (33.3%) | 254 (66.7%) |
| Total (Category) | 1,878 (50.2%) | 1,859 (49.7%) |
| Total (Overall) | 4,921 (55.9%) | 3,881 (44.1%) |
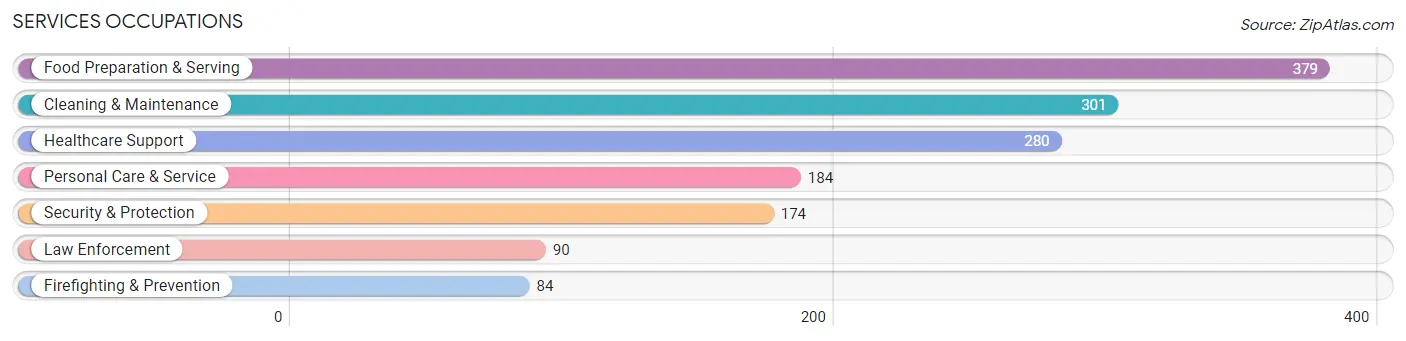
Services Occupations
The most common Services occupations in South Ogden are Food Preparation & Serving (379 | 4.3%), Cleaning & Maintenance (301 | 3.4%), Healthcare Support (280 | 3.2%), Personal Care & Service (184 | 2.1%), and Security & Protection (174 | 2.0%).
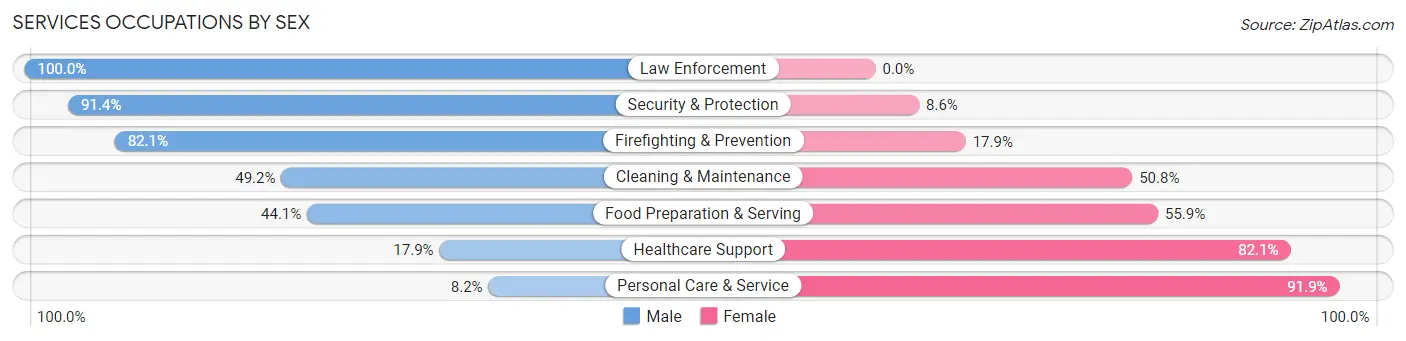
Services Occupations by Sex
Within the Services occupations in South Ogden, the most male-oriented occupations are Law Enforcement (100.0%), Security & Protection (91.4%), and Firefighting & Prevention (82.1%), while the most female-oriented occupations are Personal Care & Service (91.8%), Healthcare Support (82.1%), and Food Preparation & Serving (55.9%).
| Occupation | Male | Female |
| Healthcare Support | 50 (17.9%) | 230 (82.1%) |
| Security & Protection | 159 (91.4%) | 15 (8.6%) |
| Firefighting & Prevention | 69 (82.1%) | 15 (17.9%) |
| Law Enforcement | 90 (100.0%) | 0 (0.0%) |
| Food Preparation & Serving | 167 (44.1%) | 212 (55.9%) |
| Cleaning & Maintenance | 148 (49.2%) | 153 (50.8%) |
| Personal Care & Service | 15 (8.2%) | 169 (91.8%) |
| Total (Category) | 539 (40.9%) | 779 (59.1%) |
| Total (Overall) | 4,921 (55.9%) | 3,881 (44.1%) |
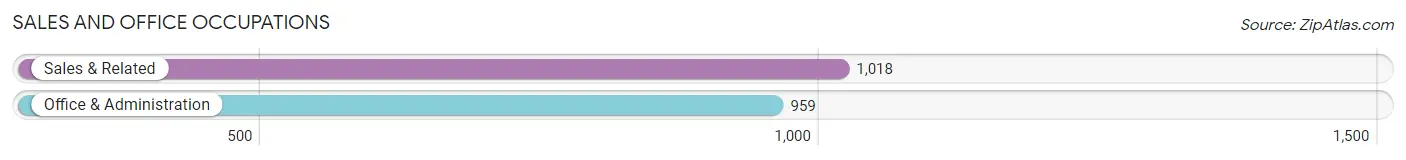
Sales and Office Occupations
The most common Sales and Office occupations in South Ogden are Sales & Related (1,018 | 11.6%), and Office & Administration (959 | 10.9%).
Sales and Office Occupations by Sex
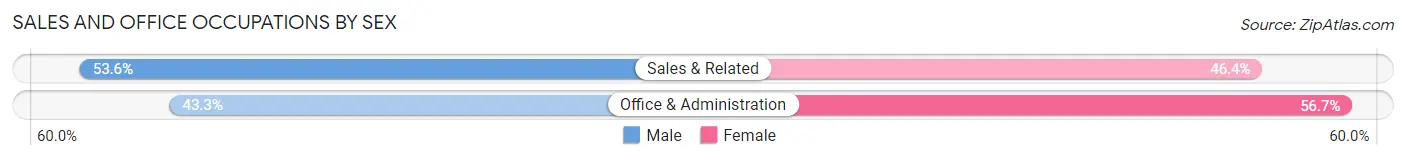
| Occupation | Male | Female |
| Sales & Related | 546 (53.6%) | 472 (46.4%) |
| Office & Administration | 415 (43.3%) | 544 (56.7%) |
| Total (Category) | 961 (48.6%) | 1,016 (51.4%) |
| Total (Overall) | 4,921 (55.9%) | 3,881 (44.1%) |
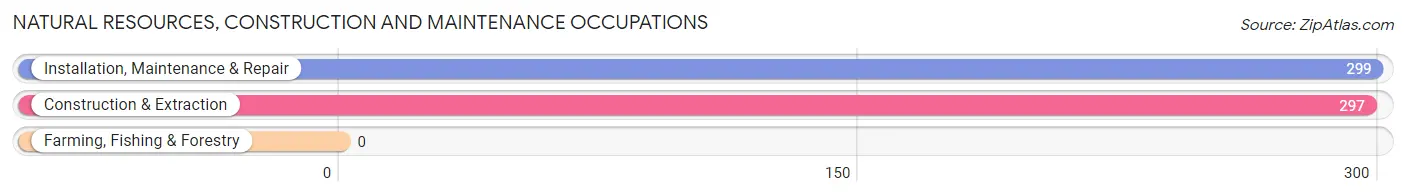
Natural Resources, Construction and Maintenance Occupations
The most common Natural Resources, Construction and Maintenance occupations in South Ogden are Installation, Maintenance & Repair (299 | 3.4%), and Construction & Extraction (297 | 3.4%).
Natural Resources, Construction and Maintenance Occupations by Sex
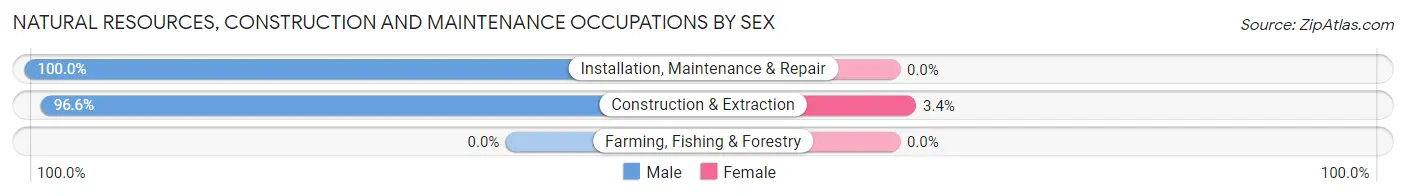
| Occupation | Male | Female |
| Farming, Fishing & Forestry | 0 (0.0%) | 0 (0.0%) |
| Construction & Extraction | 287 (96.6%) | 10 (3.4%) |
| Installation, Maintenance & Repair | 299 (100.0%) | 0 (0.0%) |
| Total (Category) | 586 (98.3%) | 10 (1.7%) |
| Total (Overall) | 4,921 (55.9%) | 3,881 (44.1%) |
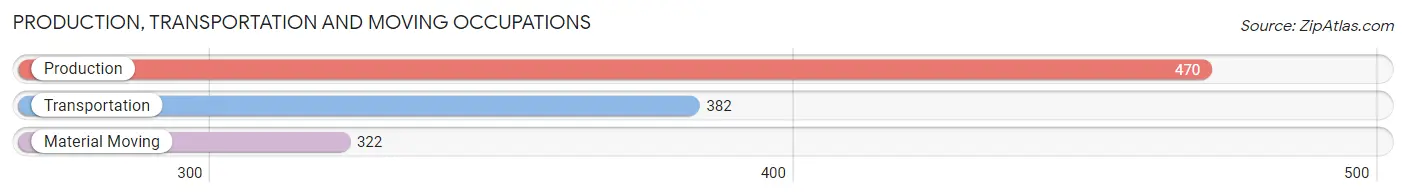
Production, Transportation and Moving Occupations
The most common Production, Transportation and Moving occupations in South Ogden are Production (470 | 5.3%), Transportation (382 | 4.3%), and Material Moving (322 | 3.7%).
Production, Transportation and Moving Occupations by Sex
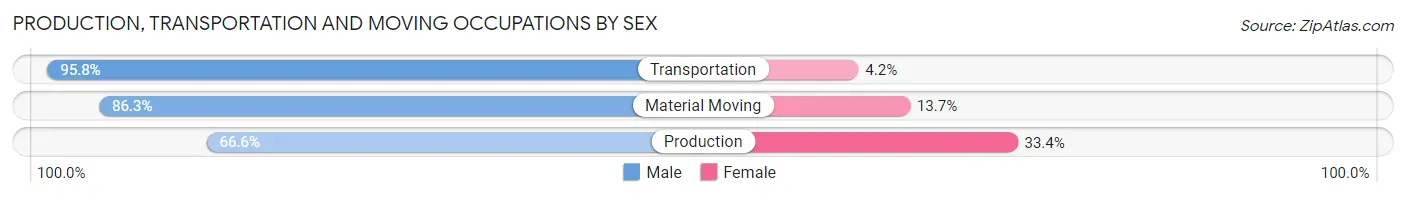
| Occupation | Male | Female |
| Production | 313 (66.6%) | 157 (33.4%) |
| Transportation | 366 (95.8%) | 16 (4.2%) |
| Material Moving | 278 (86.3%) | 44 (13.7%) |
| Total (Category) | 957 (81.5%) | 217 (18.5%) |
| Total (Overall) | 4,921 (55.9%) | 3,881 (44.1%) |
Employment Industries by Sex in South Ogden
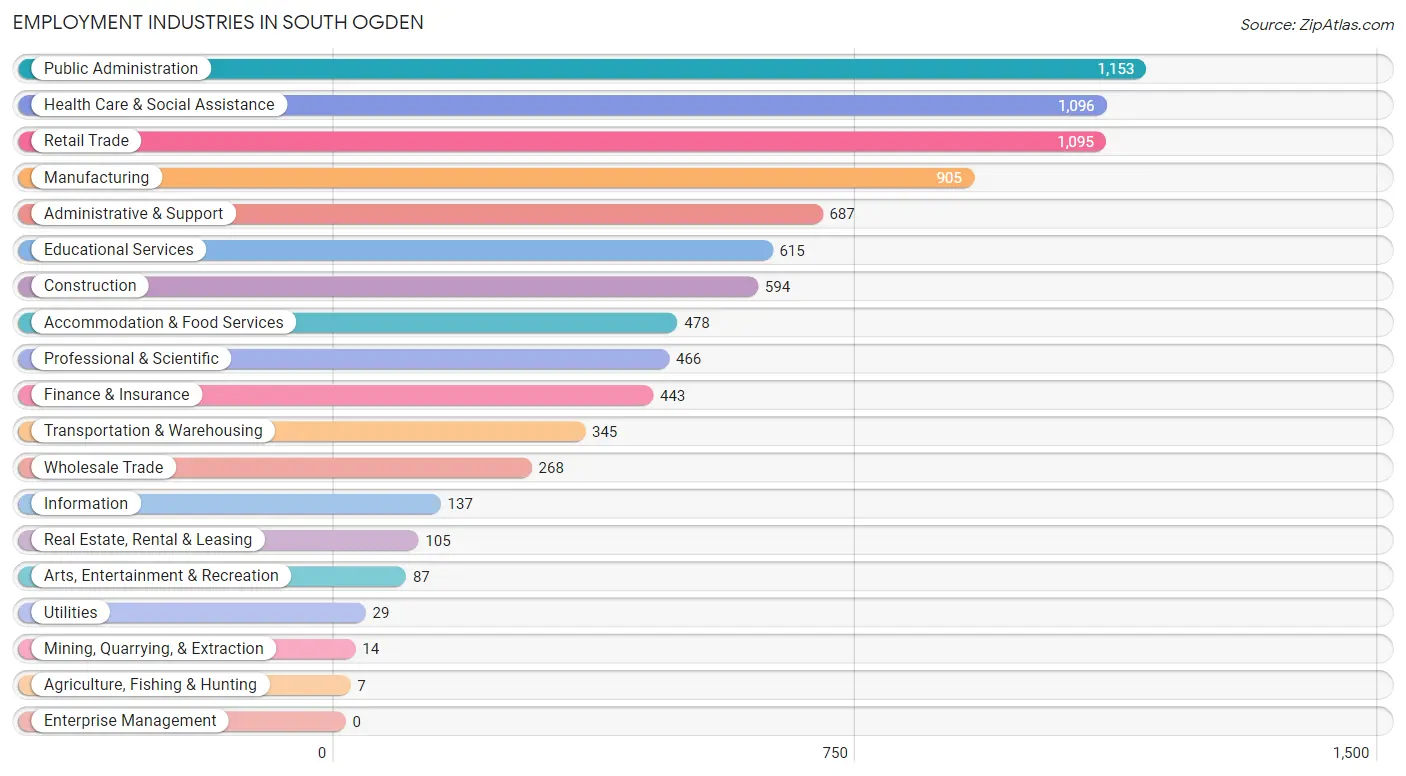
Employment Industries in South Ogden
The major employment industries in South Ogden include Public Administration (1,153 | 13.1%), Health Care & Social Assistance (1,096 | 12.4%), Retail Trade (1,095 | 12.4%), Manufacturing (905 | 10.3%), and Administrative & Support (687 | 7.8%).
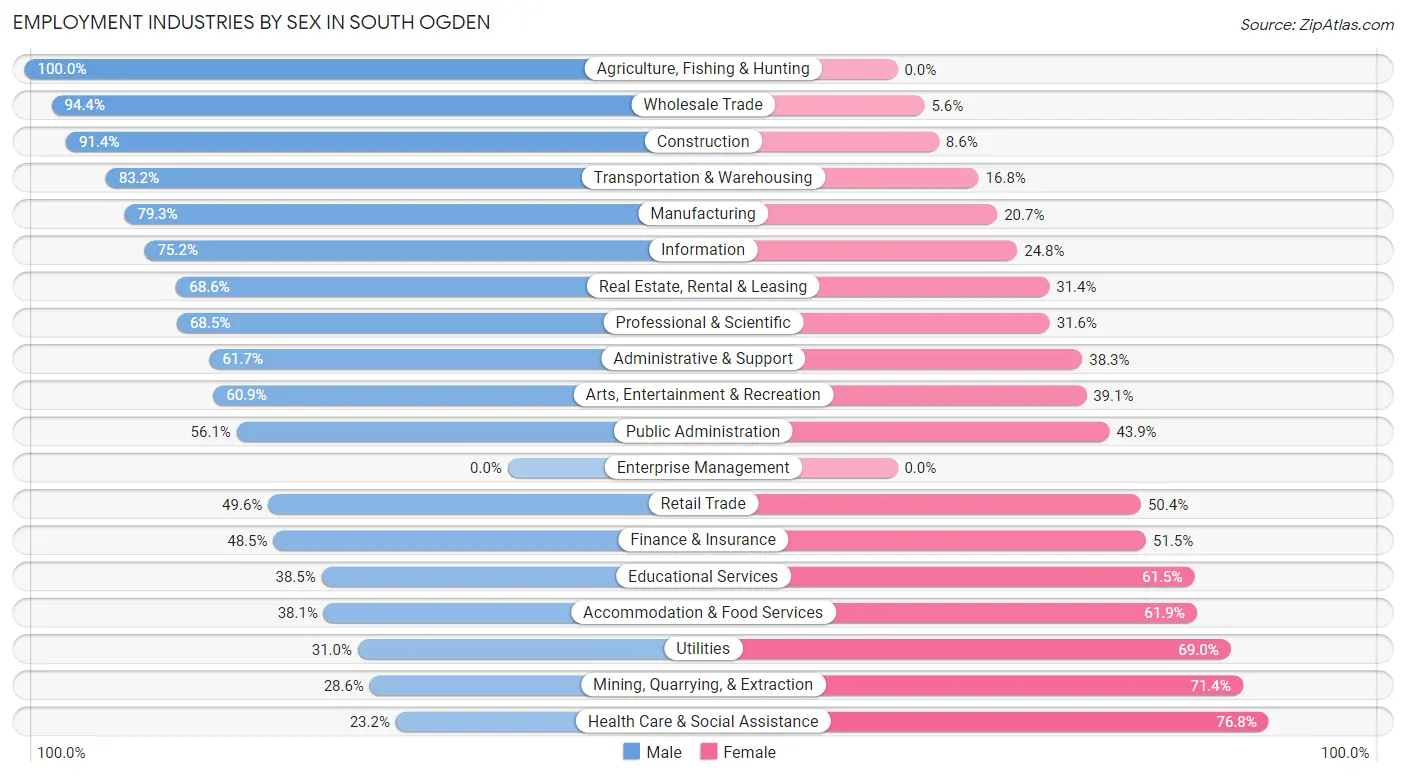
Employment Industries by Sex in South Ogden
The South Ogden industries that see more men than women are Agriculture, Fishing & Hunting (100.0%), Wholesale Trade (94.4%), and Construction (91.4%), whereas the industries that tend to have a higher number of women are Health Care & Social Assistance (76.8%), Mining, Quarrying, & Extraction (71.4%), and Utilities (69.0%).
| Industry | Male | Female |
| Agriculture, Fishing & Hunting | 7 (100.0%) | 0 (0.0%) |
| Mining, Quarrying, & Extraction | 4 (28.6%) | 10 (71.4%) |
| Construction | 543 (91.4%) | 51 (8.6%) |
| Manufacturing | 718 (79.3%) | 187 (20.7%) |
| Wholesale Trade | 253 (94.4%) | 15 (5.6%) |
| Retail Trade | 543 (49.6%) | 552 (50.4%) |
| Transportation & Warehousing | 287 (83.2%) | 58 (16.8%) |
| Utilities | 9 (31.0%) | 20 (69.0%) |
| Information | 103 (75.2%) | 34 (24.8%) |
| Finance & Insurance | 215 (48.5%) | 228 (51.5%) |
| Real Estate, Rental & Leasing | 72 (68.6%) | 33 (31.4%) |
| Professional & Scientific | 319 (68.4%) | 147 (31.6%) |
| Enterprise Management | 0 (0.0%) | 0 (0.0%) |
| Administrative & Support | 424 (61.7%) | 263 (38.3%) |
| Educational Services | 237 (38.5%) | 378 (61.5%) |
| Health Care & Social Assistance | 254 (23.2%) | 842 (76.8%) |
| Arts, Entertainment & Recreation | 53 (60.9%) | 34 (39.1%) |
| Accommodation & Food Services | 182 (38.1%) | 296 (61.9%) |
| Public Administration | 647 (56.1%) | 506 (43.9%) |
| Total | 4,921 (55.9%) | 3,881 (44.1%) |
Education in South Ogden
School Enrollment in South Ogden
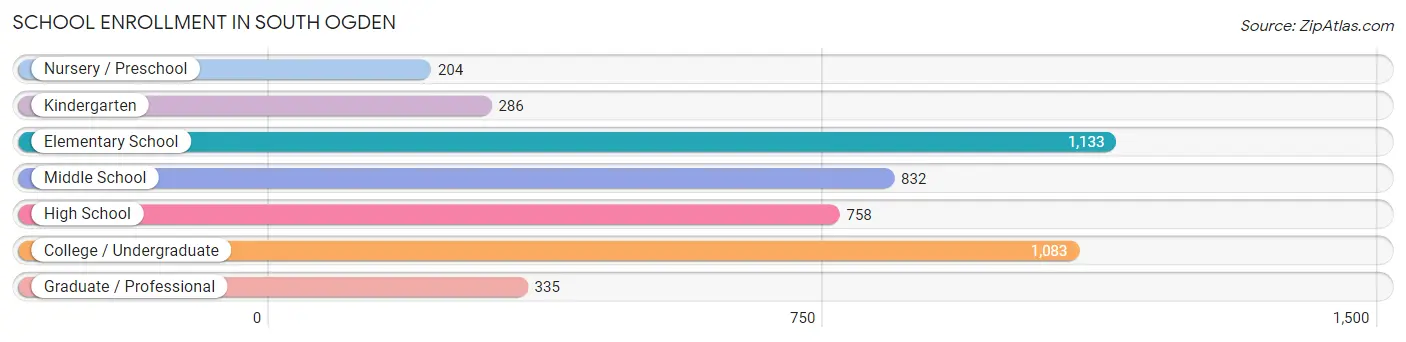
The most common levels of schooling among the 4,631 students in South Ogden are elementary school (1,133 | 24.5%), college / undergraduate (1,083 | 23.4%), and middle school (832 | 18.0%).
| School Level | # Students | % Students |
| Nursery / Preschool | 204 | 4.4% |
| Kindergarten | 286 | 6.2% |
| Elementary School | 1,133 | 24.5% |
| Middle School | 832 | 18.0% |
| High School | 758 | 16.4% |
| College / Undergraduate | 1,083 | 23.4% |
| Graduate / Professional | 335 | 7.2% |
| Total | 4,631 | 100.0% |
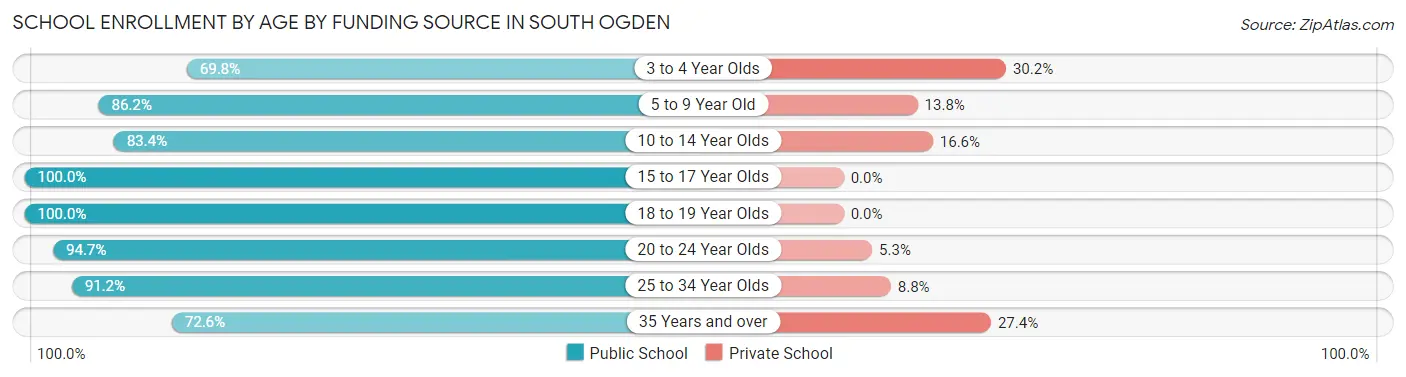
School Enrollment by Age by Funding Source in South Ogden
Out of a total of 4,631 students who are enrolled in schools in South Ogden, 574 (12.4%) attend a private institution, while the remaining 4,057 (87.6%) are enrolled in public schools. The age group of 3 to 4 year olds has the highest likelihood of being enrolled in private schools, with 52 (30.2% in the age bracket) enrolled. Conversely, the age group of 15 to 17 year olds has the lowest likelihood of being enrolled in a private school, with 554 (100.0% in the age bracket) attending a public institution.
| Age Bracket | Public School | Private School |
| 3 to 4 Year Olds | 120 (69.8%) | 52 (30.2%) |
| 5 to 9 Year Old | 1,007 (86.2%) | 161 (13.8%) |
| 10 to 14 Year Olds | 974 (83.4%) | 194 (16.6%) |
| 15 to 17 Year Olds | 554 (100.0%) | 0 (0.0%) |
| 18 to 19 Year Olds | 283 (100.0%) | 0 (0.0%) |
| 20 to 24 Year Olds | 428 (94.7%) | 24 (5.3%) |
| 25 to 34 Year Olds | 415 (91.2%) | 40 (8.8%) |
| 35 Years and over | 275 (72.6%) | 104 (27.4%) |
| Total | 4,057 (87.6%) | 574 (12.4%) |
Educational Attainment by Field of Study in South Ogden
Business (933 | 23.8%), science & technology (545 | 13.9%), education (470 | 12.0%), arts & humanities (425 | 10.8%), and social sciences (271 | 6.9%) are the most common fields of study among 3,921 individuals in South Ogden who have obtained a bachelor's degree or higher.
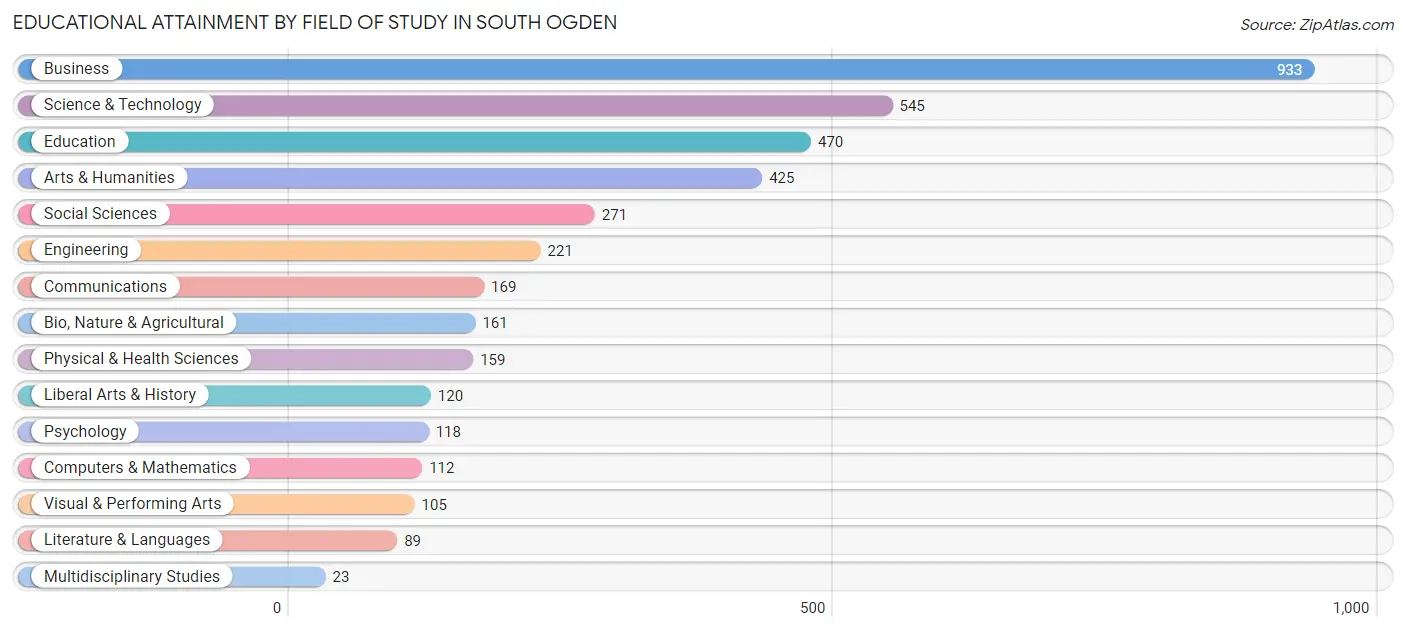
| Field of Study | # Graduates | % Graduates |
| Computers & Mathematics | 112 | 2.9% |
| Bio, Nature & Agricultural | 161 | 4.1% |
| Physical & Health Sciences | 159 | 4.1% |
| Psychology | 118 | 3.0% |
| Social Sciences | 271 | 6.9% |
| Engineering | 221 | 5.6% |
| Multidisciplinary Studies | 23 | 0.6% |
| Science & Technology | 545 | 13.9% |
| Business | 933 | 23.8% |
| Education | 470 | 12.0% |
| Literature & Languages | 89 | 2.3% |
| Liberal Arts & History | 120 | 3.1% |
| Visual & Performing Arts | 105 | 2.7% |
| Communications | 169 | 4.3% |
| Arts & Humanities | 425 | 10.8% |
| Total | 3,921 | 100.0% |
Transportation & Commute in South Ogden
Vehicle Availability by Sex in South Ogden
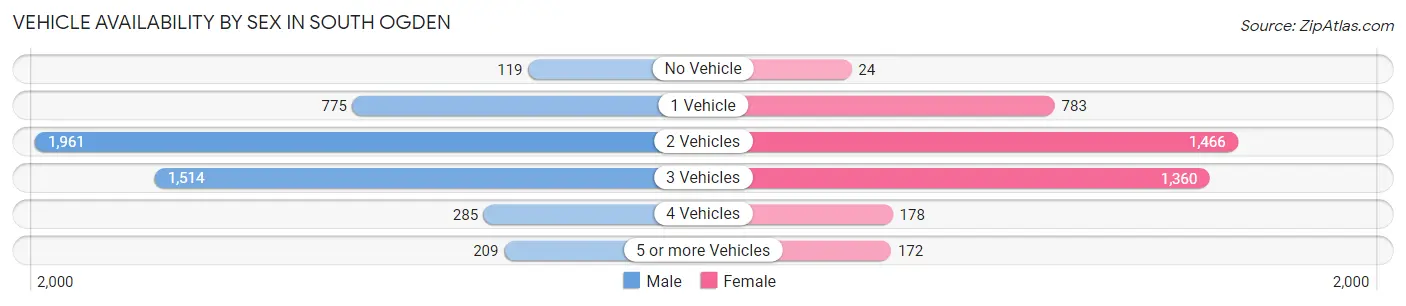
The most prevalent vehicle ownership categories in South Ogden are males with 2 vehicles (1,961, accounting for 40.3%) and females with 2 vehicles (1,466, making up 49.2%).
| Vehicles Available | Male | Female |
| No Vehicle | 119 (2.5%) | 24 (0.6%) |
| 1 Vehicle | 775 (15.9%) | 783 (19.7%) |
| 2 Vehicles | 1,961 (40.3%) | 1,466 (36.8%) |
| 3 Vehicles | 1,514 (31.1%) | 1,360 (34.2%) |
| 4 Vehicles | 285 (5.9%) | 178 (4.5%) |
| 5 or more Vehicles | 209 (4.3%) | 172 (4.3%) |
| Total | 4,863 (100.0%) | 3,983 (100.0%) |
Commute Time in South Ogden
The most frequently occuring commute durations in South Ogden are 15 to 19 minutes (1,942 commuters, 24.7%), 20 to 24 minutes (1,379 commuters, 17.5%), and 5 to 9 minutes (946 commuters, 12.0%).
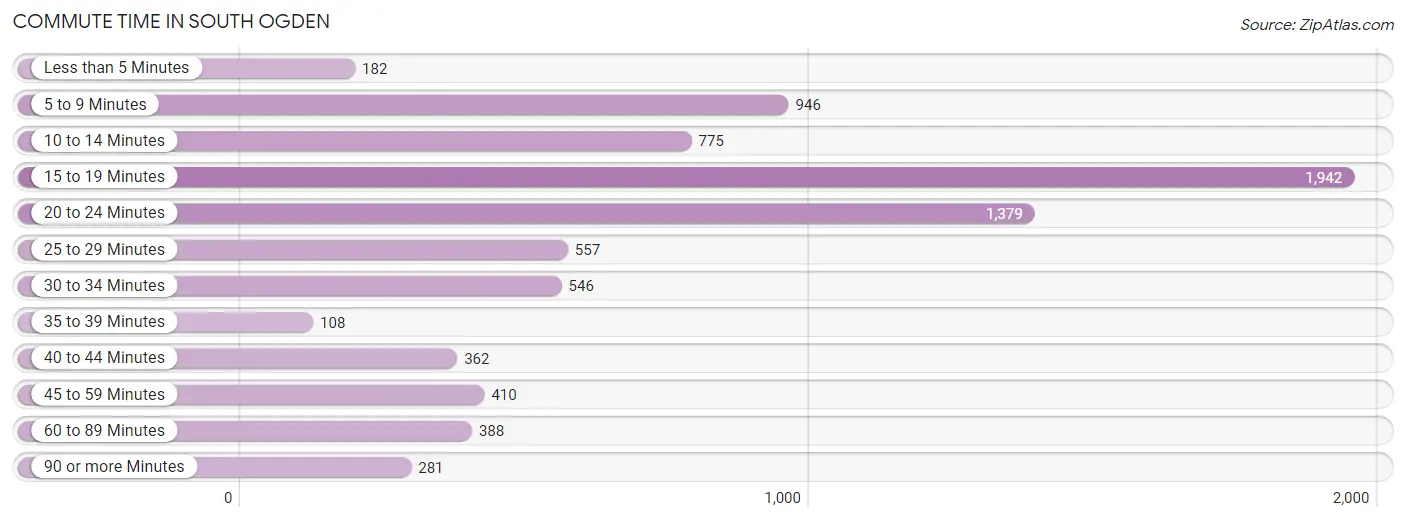
| Commute Time | # Commuters | % Commuters |
| Less than 5 Minutes | 182 | 2.3% |
| 5 to 9 Minutes | 946 | 12.0% |
| 10 to 14 Minutes | 775 | 9.8% |
| 15 to 19 Minutes | 1,942 | 24.7% |
| 20 to 24 Minutes | 1,379 | 17.5% |
| 25 to 29 Minutes | 557 | 7.1% |
| 30 to 34 Minutes | 546 | 6.9% |
| 35 to 39 Minutes | 108 | 1.4% |
| 40 to 44 Minutes | 362 | 4.6% |
| 45 to 59 Minutes | 410 | 5.2% |
| 60 to 89 Minutes | 388 | 4.9% |
| 90 or more Minutes | 281 | 3.6% |
Commute Time by Sex in South Ogden
The most common commute times in South Ogden are 15 to 19 minutes (1,047 commuters, 24.4%) for males and 15 to 19 minutes (895 commuters, 25.0%) for females.
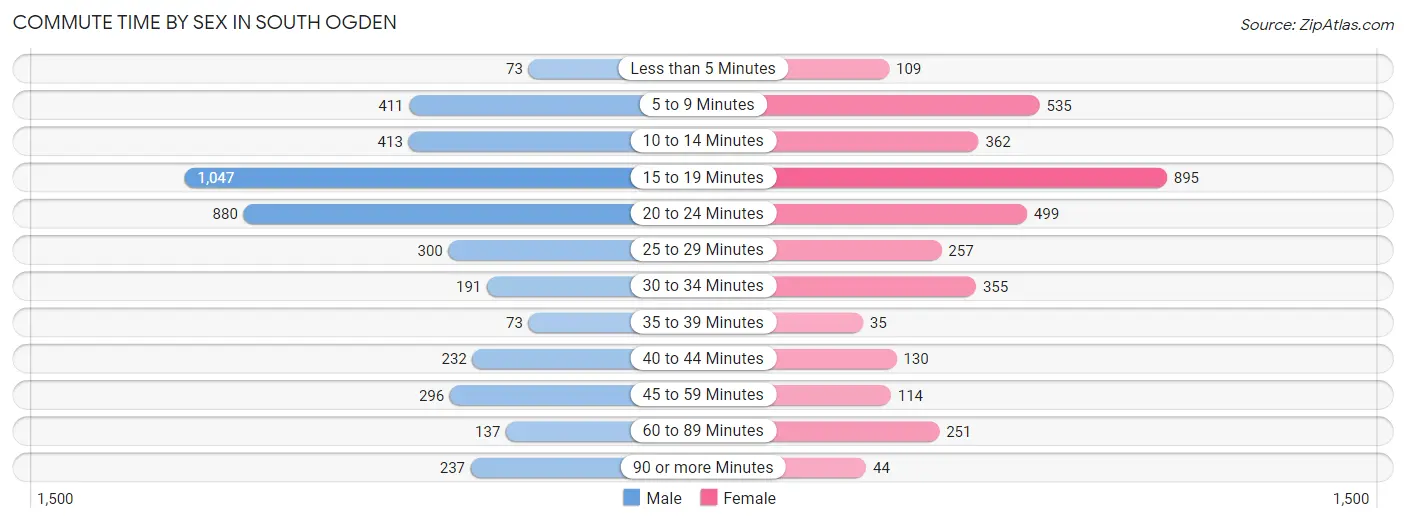
| Commute Time | Male | Female |
| Less than 5 Minutes | 73 (1.7%) | 109 (3.0%) |
| 5 to 9 Minutes | 411 (9.6%) | 535 (14.9%) |
| 10 to 14 Minutes | 413 (9.6%) | 362 (10.1%) |
| 15 to 19 Minutes | 1,047 (24.4%) | 895 (25.0%) |
| 20 to 24 Minutes | 880 (20.5%) | 499 (13.9%) |
| 25 to 29 Minutes | 300 (7.0%) | 257 (7.2%) |
| 30 to 34 Minutes | 191 (4.4%) | 355 (9.9%) |
| 35 to 39 Minutes | 73 (1.7%) | 35 (1.0%) |
| 40 to 44 Minutes | 232 (5.4%) | 130 (3.6%) |
| 45 to 59 Minutes | 296 (6.9%) | 114 (3.2%) |
| 60 to 89 Minutes | 137 (3.2%) | 251 (7.0%) |
| 90 or more Minutes | 237 (5.5%) | 44 (1.2%) |
Time of Departure to Work by Sex in South Ogden
The most frequent times of departure to work in South Ogden are 6:30 AM to 6:59 AM (509, 11.9%) for males and 7:30 AM to 7:59 AM (486, 13.6%) for females.
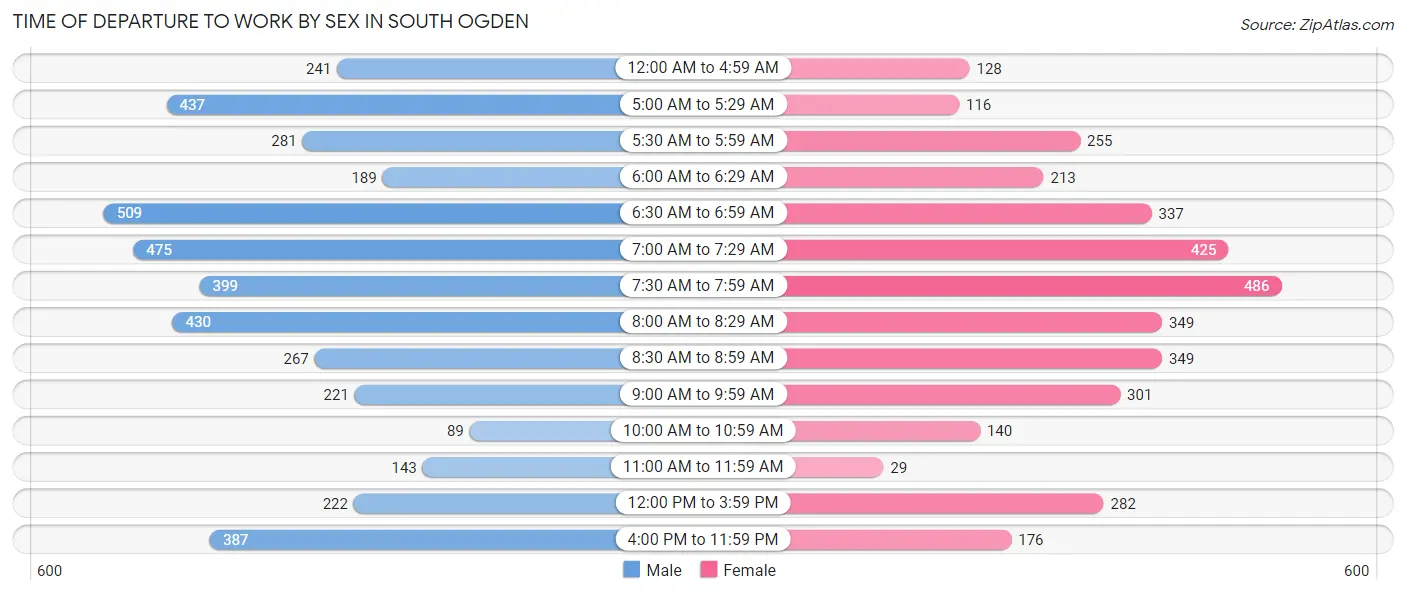
| Time of Departure | Male | Female |
| 12:00 AM to 4:59 AM | 241 (5.6%) | 128 (3.6%) |
| 5:00 AM to 5:29 AM | 437 (10.2%) | 116 (3.2%) |
| 5:30 AM to 5:59 AM | 281 (6.6%) | 255 (7.1%) |
| 6:00 AM to 6:29 AM | 189 (4.4%) | 213 (5.9%) |
| 6:30 AM to 6:59 AM | 509 (11.9%) | 337 (9.4%) |
| 7:00 AM to 7:29 AM | 475 (11.1%) | 425 (11.8%) |
| 7:30 AM to 7:59 AM | 399 (9.3%) | 486 (13.6%) |
| 8:00 AM to 8:29 AM | 430 (10.0%) | 349 (9.7%) |
| 8:30 AM to 8:59 AM | 267 (6.2%) | 349 (9.7%) |
| 9:00 AM to 9:59 AM | 221 (5.1%) | 301 (8.4%) |
| 10:00 AM to 10:59 AM | 89 (2.1%) | 140 (3.9%) |
| 11:00 AM to 11:59 AM | 143 (3.3%) | 29 (0.8%) |
| 12:00 PM to 3:59 PM | 222 (5.2%) | 282 (7.9%) |
| 4:00 PM to 11:59 PM | 387 (9.0%) | 176 (4.9%) |
| Total | 4,290 (100.0%) | 3,586 (100.0%) |
Housing Occupancy in South Ogden
Occupancy by Ownership in South Ogden
Of the total 6,487 dwellings in South Ogden, owner-occupied units account for 4,559 (70.3%), while renter-occupied units make up 1,928 (29.7%).
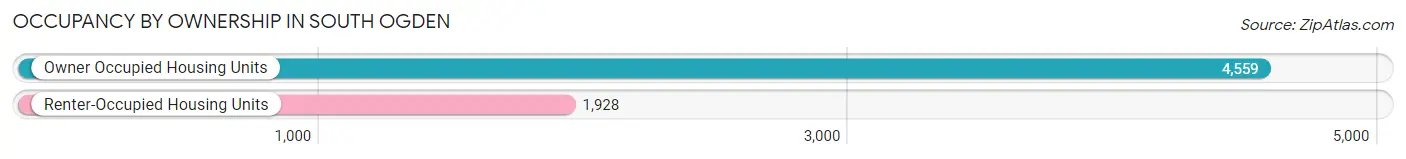
| Occupancy | # Housing Units | % Housing Units |
| Owner Occupied Housing Units | 4,559 | 70.3% |
| Renter-Occupied Housing Units | 1,928 | 29.7% |
| Total Occupied Housing Units | 6,487 | 100.0% |
Occupancy by Household Size in South Ogden
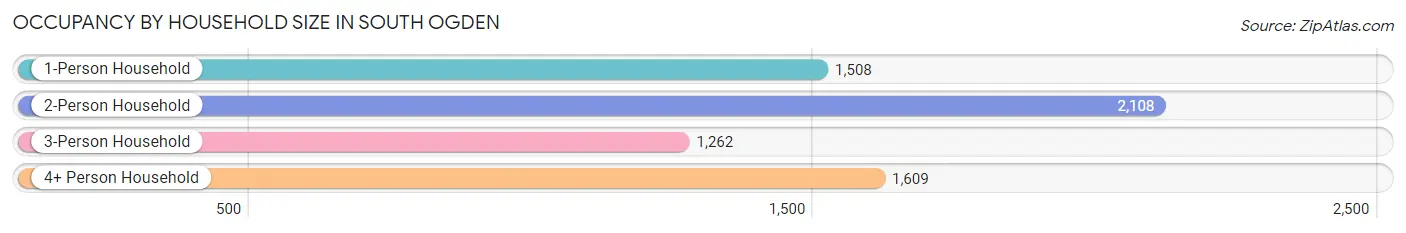
| Household Size | # Housing Units | % Housing Units |
| 1-Person Household | 1,508 | 23.3% |
| 2-Person Household | 2,108 | 32.5% |
| 3-Person Household | 1,262 | 19.5% |
| 4+ Person Household | 1,609 | 24.8% |
| Total Housing Units | 6,487 | 100.0% |
Occupancy by Ownership by Household Size in South Ogden
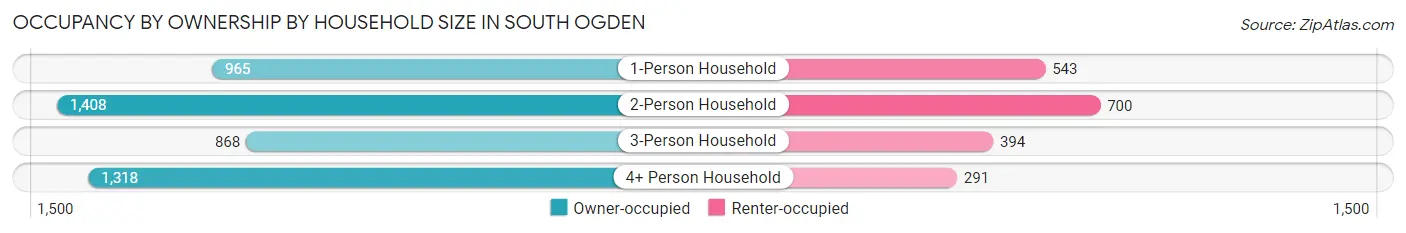
| Household Size | Owner-occupied | Renter-occupied |
| 1-Person Household | 965 (64.0%) | 543 (36.0%) |
| 2-Person Household | 1,408 (66.8%) | 700 (33.2%) |
| 3-Person Household | 868 (68.8%) | 394 (31.2%) |
| 4+ Person Household | 1,318 (81.9%) | 291 (18.1%) |
| Total Housing Units | 4,559 (70.3%) | 1,928 (29.7%) |
Occupancy by Educational Attainment in South Ogden
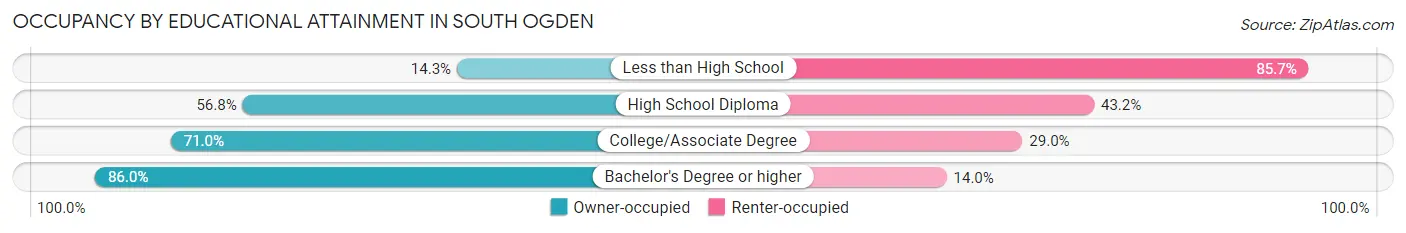
| Household Size | Owner-occupied | Renter-occupied |
| Less than High School | 45 (14.3%) | 270 (85.7%) |
| High School Diploma | 827 (56.8%) | 629 (43.2%) |
| College/Associate Degree | 1,751 (71.0%) | 715 (29.0%) |
| Bachelor's Degree or higher | 1,936 (86.0%) | 314 (14.0%) |
Occupancy by Age of Householder in South Ogden
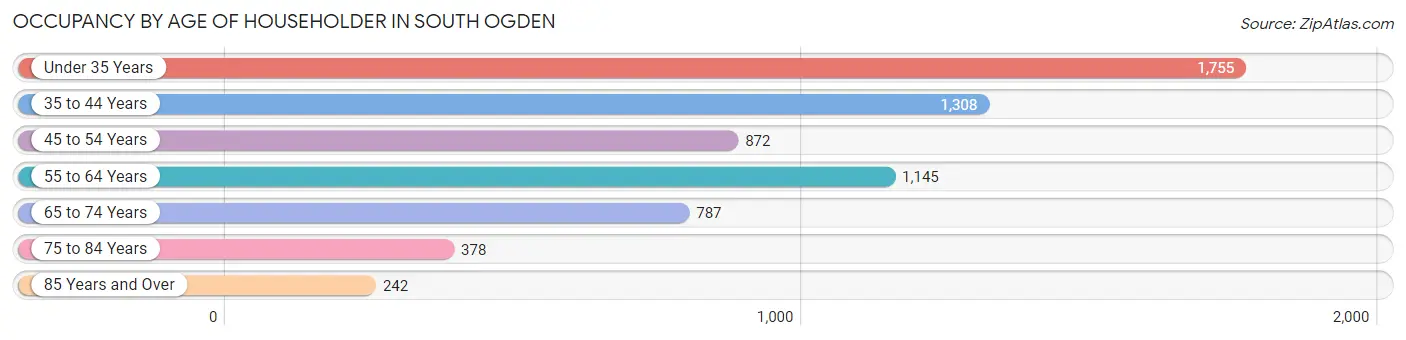
| Age Bracket | # Households | % Households |
| Under 35 Years | 1,755 | 27.1% |
| 35 to 44 Years | 1,308 | 20.2% |
| 45 to 54 Years | 872 | 13.4% |
| 55 to 64 Years | 1,145 | 17.6% |
| 65 to 74 Years | 787 | 12.1% |
| 75 to 84 Years | 378 | 5.8% |
| 85 Years and Over | 242 | 3.7% |
| Total | 6,487 | 100.0% |
Housing Finances in South Ogden
Median Income by Occupancy in South Ogden
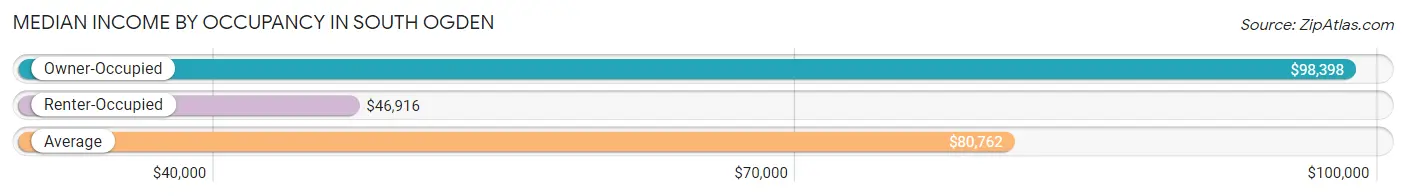
| Occupancy Type | # Households | Median Income |
| Owner-Occupied | 4,559 (70.3%) | $98,398 |
| Renter-Occupied | 1,928 (29.7%) | $46,916 |
| Average | 6,487 (100.0%) | $80,762 |
Occupancy by Householder Income Bracket in South Ogden
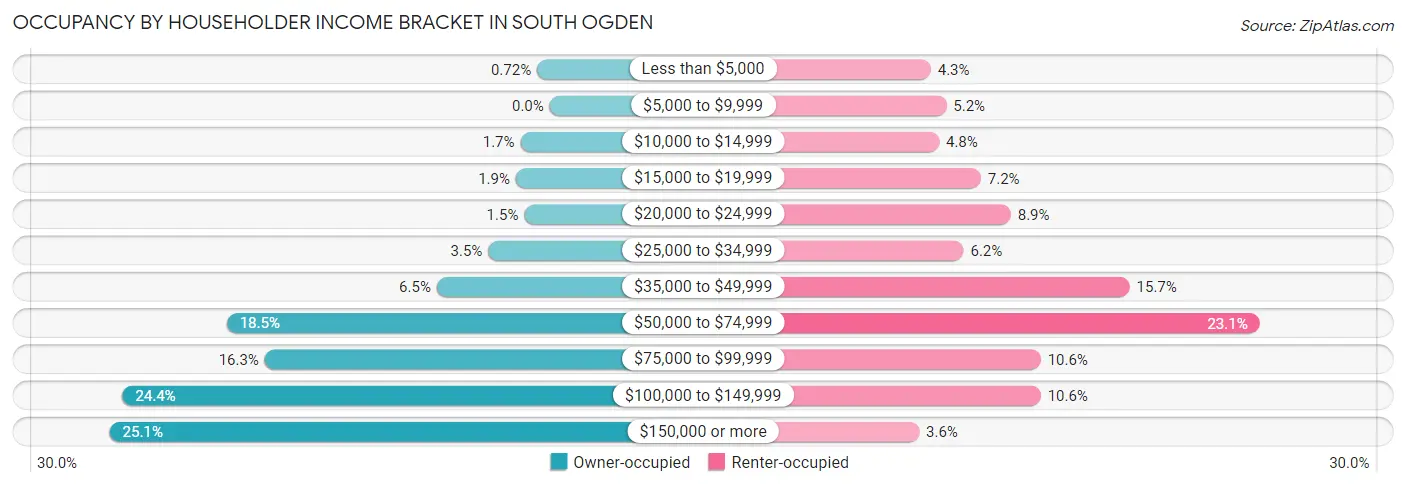
| Income Bracket | Owner-occupied | Renter-occupied |
| Less than $5,000 | 33 (0.7%) | 83 (4.3%) |
| $5,000 to $9,999 | 0 (0.0%) | 100 (5.2%) |
| $10,000 to $14,999 | 76 (1.7%) | 92 (4.8%) |
| $15,000 to $19,999 | 88 (1.9%) | 138 (7.2%) |
| $20,000 to $24,999 | 66 (1.5%) | 171 (8.9%) |
| $25,000 to $34,999 | 160 (3.5%) | 119 (6.2%) |
| $35,000 to $49,999 | 294 (6.5%) | 302 (15.7%) |
| $50,000 to $74,999 | 841 (18.4%) | 445 (23.1%) |
| $75,000 to $99,999 | 742 (16.3%) | 204 (10.6%) |
| $100,000 to $149,999 | 1,113 (24.4%) | 204 (10.6%) |
| $150,000 or more | 1,146 (25.1%) | 70 (3.6%) |
| Total | 4,559 (100.0%) | 1,928 (100.0%) |
Monthly Housing Cost Tiers in South Ogden
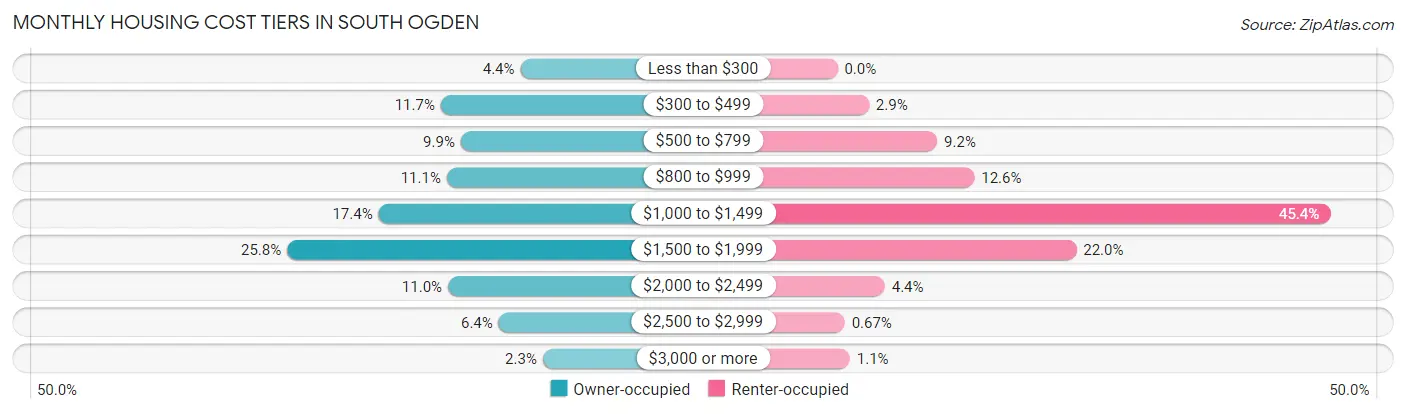
| Monthly Cost | Owner-occupied | Renter-occupied |
| Less than $300 | 199 (4.4%) | 0 (0.0%) |
| $300 to $499 | 533 (11.7%) | 56 (2.9%) |
| $500 to $799 | 449 (9.9%) | 177 (9.2%) |
| $800 to $999 | 508 (11.1%) | 243 (12.6%) |
| $1,000 to $1,499 | 794 (17.4%) | 876 (45.4%) |
| $1,500 to $1,999 | 1,178 (25.8%) | 424 (22.0%) |
| $2,000 to $2,499 | 503 (11.0%) | 84 (4.4%) |
| $2,500 to $2,999 | 290 (6.4%) | 13 (0.7%) |
| $3,000 or more | 105 (2.3%) | 22 (1.1%) |
| Total | 4,559 (100.0%) | 1,928 (100.0%) |
Physical Housing Characteristics in South Ogden
Housing Structures in South Ogden
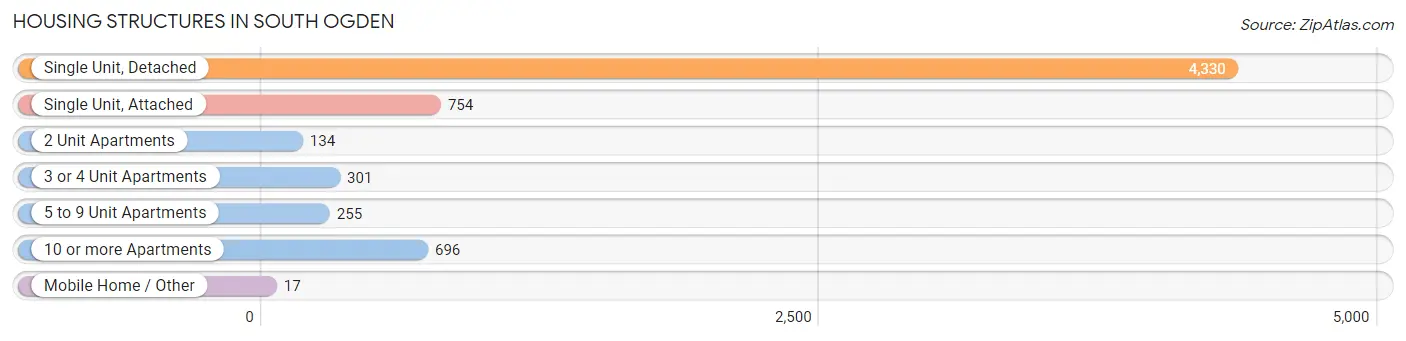
| Structure Type | # Housing Units | % Housing Units |
| Single Unit, Detached | 4,330 | 66.7% |
| Single Unit, Attached | 754 | 11.6% |
| 2 Unit Apartments | 134 | 2.1% |
| 3 or 4 Unit Apartments | 301 | 4.6% |
| 5 to 9 Unit Apartments | 255 | 3.9% |
| 10 or more Apartments | 696 | 10.7% |
| Mobile Home / Other | 17 | 0.3% |
| Total | 6,487 | 100.0% |
Housing Structures by Occupancy in South Ogden
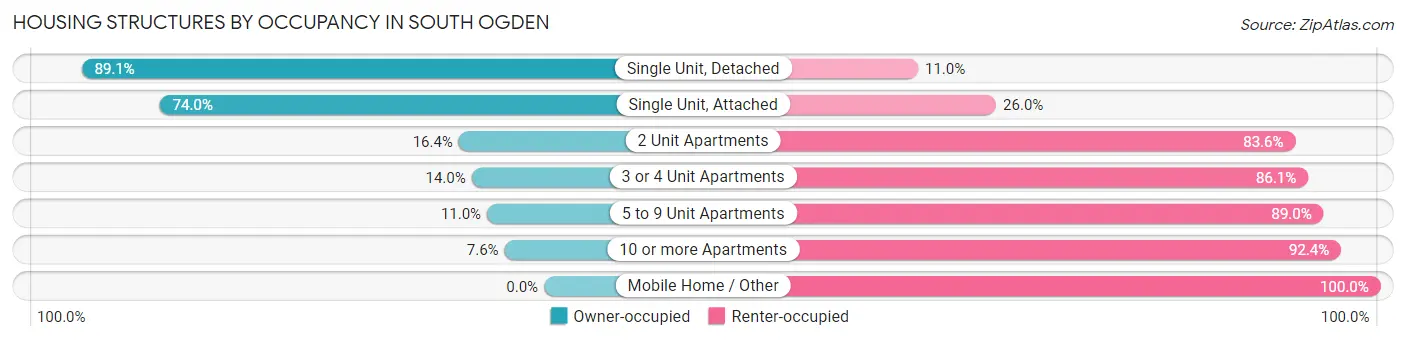
| Structure Type | Owner-occupied | Renter-occupied |
| Single Unit, Detached | 3,856 (89.0%) | 474 (11.0%) |
| Single Unit, Attached | 558 (74.0%) | 196 (26.0%) |
| 2 Unit Apartments | 22 (16.4%) | 112 (83.6%) |
| 3 or 4 Unit Apartments | 42 (14.0%) | 259 (86.1%) |
| 5 to 9 Unit Apartments | 28 (11.0%) | 227 (89.0%) |
| 10 or more Apartments | 53 (7.6%) | 643 (92.4%) |
| Mobile Home / Other | 0 (0.0%) | 17 (100.0%) |
| Total | 4,559 (70.3%) | 1,928 (29.7%) |
Housing Structures by Number of Rooms in South Ogden
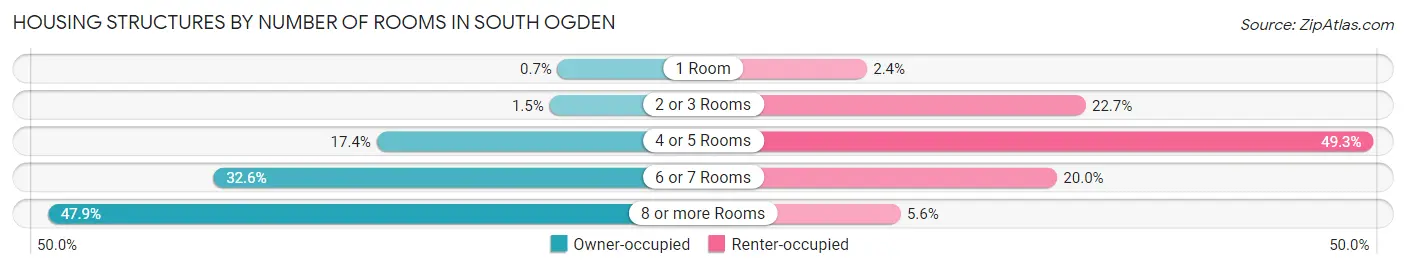
| Number of Rooms | Owner-occupied | Renter-occupied |
| 1 Room | 32 (0.7%) | 47 (2.4%) |
| 2 or 3 Rooms | 66 (1.5%) | 437 (22.7%) |
| 4 or 5 Rooms | 795 (17.4%) | 951 (49.3%) |
| 6 or 7 Rooms | 1,484 (32.6%) | 386 (20.0%) |
| 8 or more Rooms | 2,182 (47.9%) | 107 (5.6%) |
| Total | 4,559 (100.0%) | 1,928 (100.0%) |
Housing Structure by Heating Type in South Ogden
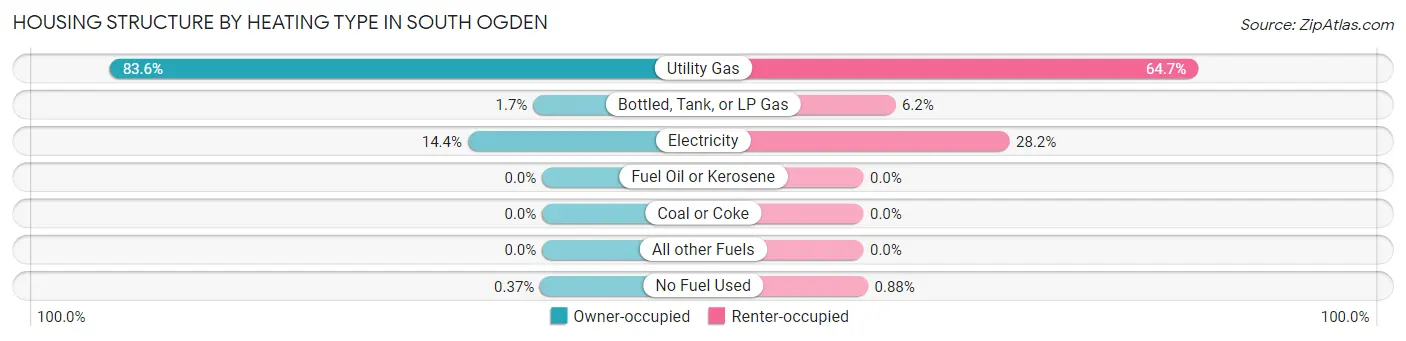
| Heating Type | Owner-occupied | Renter-occupied |
| Utility Gas | 3,809 (83.6%) | 1,248 (64.7%) |
| Bottled, Tank, or LP Gas | 79 (1.7%) | 119 (6.2%) |
| Electricity | 654 (14.3%) | 544 (28.2%) |
| Fuel Oil or Kerosene | 0 (0.0%) | 0 (0.0%) |
| Coal or Coke | 0 (0.0%) | 0 (0.0%) |
| All other Fuels | 0 (0.0%) | 0 (0.0%) |
| No Fuel Used | 17 (0.4%) | 17 (0.9%) |
| Total | 4,559 (100.0%) | 1,928 (100.0%) |
Household Vehicle Usage in South Ogden
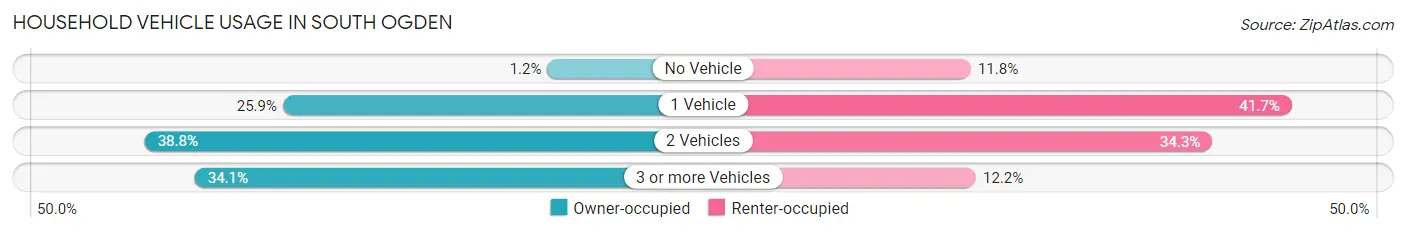
| Vehicles per Household | Owner-occupied | Renter-occupied |
| No Vehicle | 55 (1.2%) | 227 (11.8%) |
| 1 Vehicle | 1,181 (25.9%) | 804 (41.7%) |
| 2 Vehicles | 1,768 (38.8%) | 661 (34.3%) |
| 3 or more Vehicles | 1,555 (34.1%) | 236 (12.2%) |
| Total | 4,559 (100.0%) | 1,928 (100.0%) |
Real Estate & Mortgages in South Ogden
Real Estate and Mortgage Overview in South Ogden
| Characteristic | Without Mortgage | With Mortgage |
| Housing Units | 1,297 | 3,262 |
| Median Property Value | $312,900 | $323,900 |
| Median Household Income | $67,614 | $754 |
| Monthly Housing Costs | $481 | $105 |
| Real Estate Taxes | $2,394 | $60 |
Property Value by Mortgage Status in South Ogden
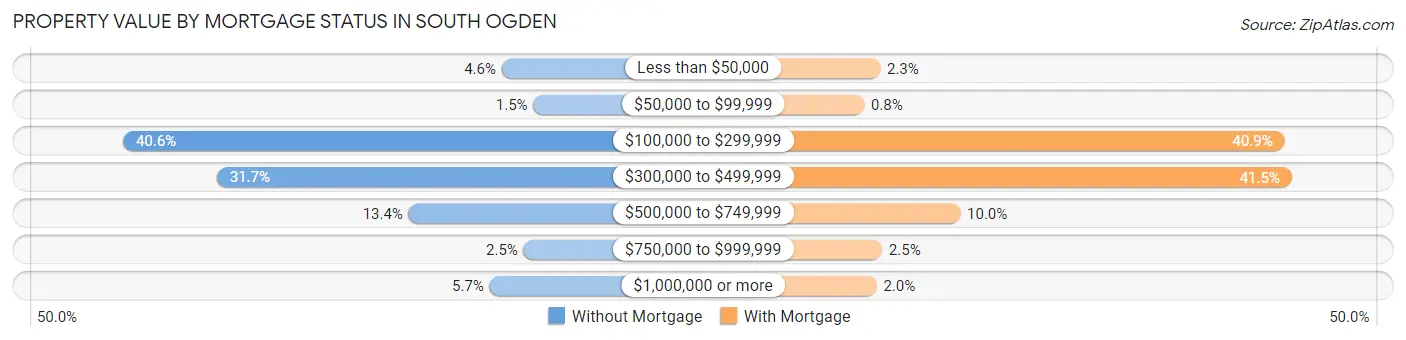
| Property Value | Without Mortgage | With Mortgage |
| Less than $50,000 | 59 (4.5%) | 76 (2.3%) |
| $50,000 to $99,999 | 20 (1.5%) | 26 (0.8%) |
| $100,000 to $299,999 | 527 (40.6%) | 1,333 (40.9%) |
| $300,000 to $499,999 | 411 (31.7%) | 1,355 (41.5%) |
| $500,000 to $749,999 | 174 (13.4%) | 325 (10.0%) |
| $750,000 to $999,999 | 32 (2.5%) | 82 (2.5%) |
| $1,000,000 or more | 74 (5.7%) | 65 (2.0%) |
| Total | 1,297 (100.0%) | 3,262 (100.0%) |
Household Income by Mortgage Status in South Ogden
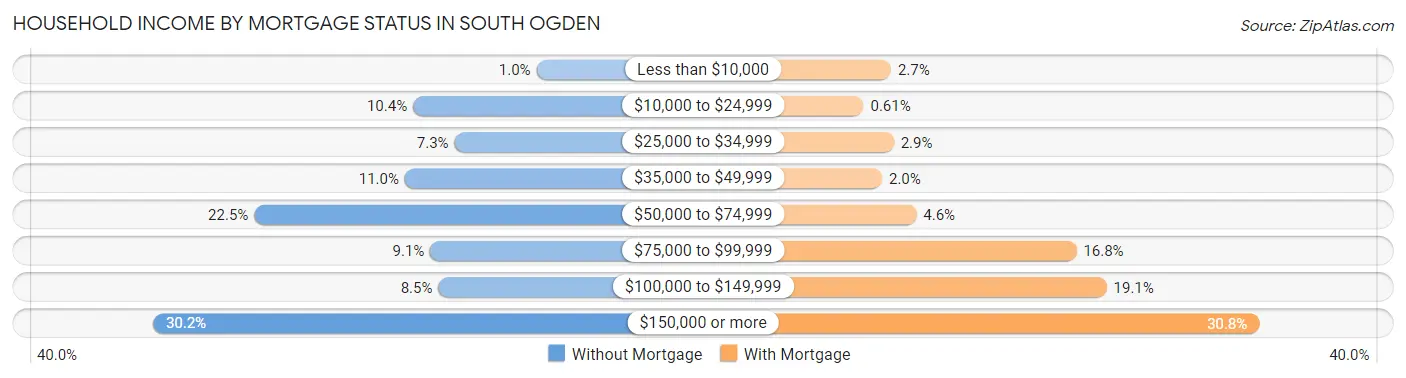
| Household Income | Without Mortgage | With Mortgage |
| Less than $10,000 | 13 (1.0%) | 88 (2.7%) |
| $10,000 to $24,999 | 135 (10.4%) | 20 (0.6%) |
| $25,000 to $34,999 | 94 (7.2%) | 95 (2.9%) |
| $35,000 to $49,999 | 143 (11.0%) | 66 (2.0%) |
| $50,000 to $74,999 | 292 (22.5%) | 151 (4.6%) |
| $75,000 to $99,999 | 118 (9.1%) | 549 (16.8%) |
| $100,000 to $149,999 | 110 (8.5%) | 624 (19.1%) |
| $150,000 or more | 392 (30.2%) | 1,003 (30.7%) |
| Total | 1,297 (100.0%) | 3,262 (100.0%) |
Property Value to Household Income Ratio in South Ogden
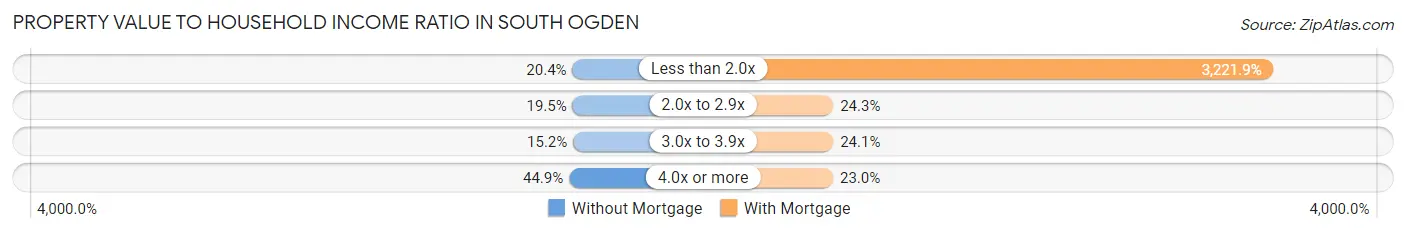
| Value-to-Income Ratio | Without Mortgage | With Mortgage |
| Less than 2.0x | 265 (20.4%) | 105,099 (3,221.9%) |
| 2.0x to 2.9x | 253 (19.5%) | 791 (24.2%) |
| 3.0x to 3.9x | 197 (15.2%) | 787 (24.1%) |
| 4.0x or more | 582 (44.9%) | 749 (23.0%) |
| Total | 1,297 (100.0%) | 3,262 (100.0%) |
Real Estate Taxes by Mortgage Status in South Ogden
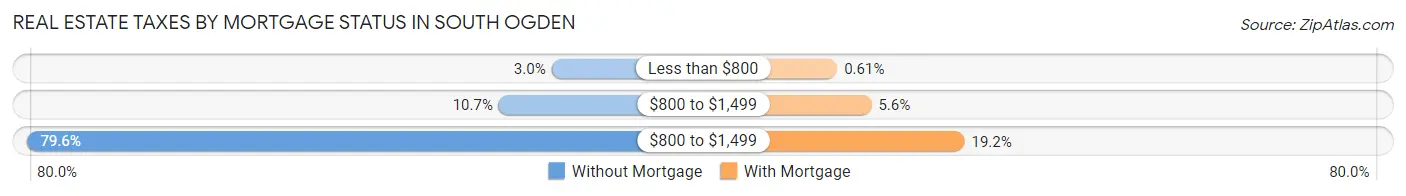
| Property Taxes | Without Mortgage | With Mortgage |
| Less than $800 | 39 (3.0%) | 20 (0.6%) |
| $800 to $1,499 | 139 (10.7%) | 183 (5.6%) |
| $800 to $1,499 | 1,032 (79.6%) | 627 (19.2%) |
| Total | 1,297 (100.0%) | 3,262 (100.0%) |
Health & Disability in South Ogden
Health Insurance Coverage by Age in South Ogden
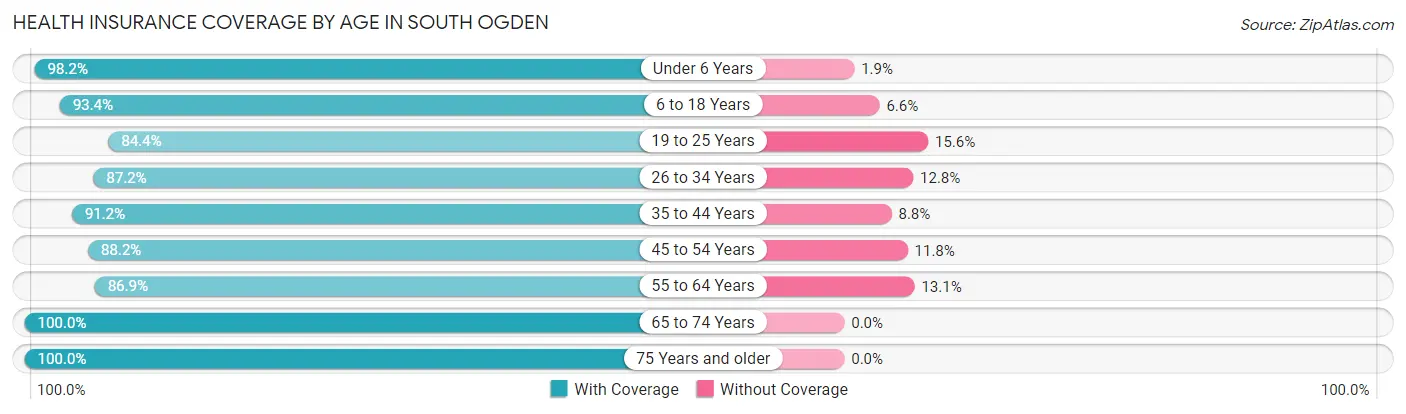
| Age Bracket | With Coverage | Without Coverage |
| Under 6 Years | 1,486 (98.2%) | 28 (1.8%) |
| 6 to 18 Years | 2,862 (93.4%) | 201 (6.6%) |
| 19 to 25 Years | 1,502 (84.4%) | 278 (15.6%) |
| 26 to 34 Years | 2,297 (87.2%) | 338 (12.8%) |
| 35 to 44 Years | 2,069 (91.2%) | 200 (8.8%) |
| 45 to 54 Years | 1,494 (88.2%) | 200 (11.8%) |
| 55 to 64 Years | 1,534 (86.9%) | 231 (13.1%) |
| 65 to 74 Years | 1,528 (100.0%) | 0 (0.0%) |
| 75 Years and older | 875 (100.0%) | 0 (0.0%) |
| Total | 15,647 (91.4%) | 1,476 (8.6%) |
Health Insurance Coverage by Citizenship Status in South Ogden
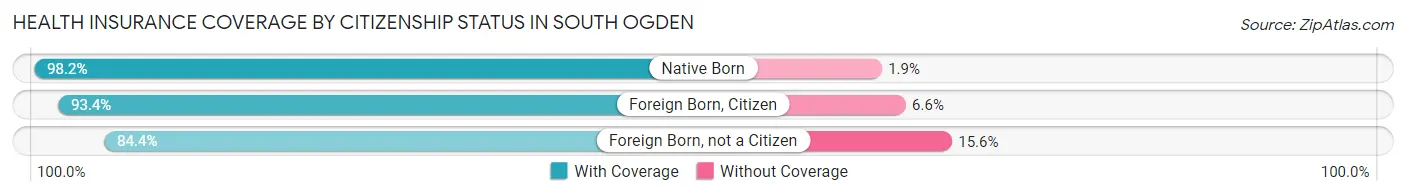
| Citizenship Status | With Coverage | Without Coverage |
| Native Born | 1,486 (98.2%) | 28 (1.8%) |
| Foreign Born, Citizen | 2,862 (93.4%) | 201 (6.6%) |
| Foreign Born, not a Citizen | 1,502 (84.4%) | 278 (15.6%) |
Health Insurance Coverage by Household Income in South Ogden
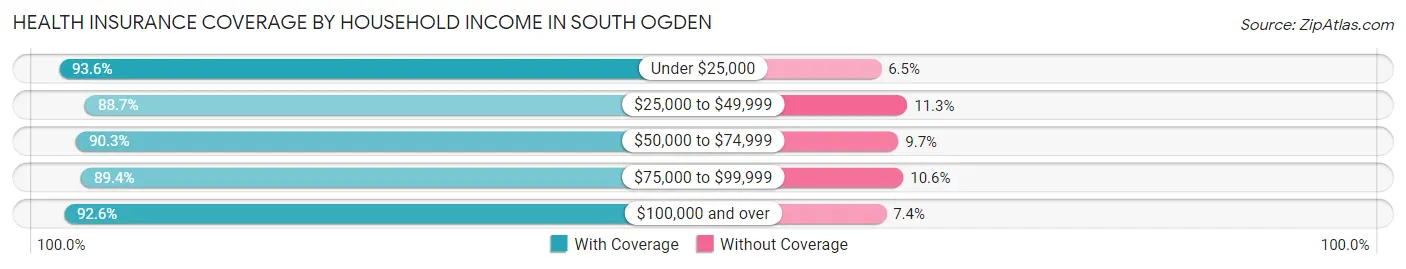
| Household Income | With Coverage | Without Coverage |
| Under $25,000 | 1,392 (93.5%) | 96 (6.5%) |
| $25,000 to $49,999 | 1,556 (88.7%) | 199 (11.3%) |
| $50,000 to $74,999 | 2,992 (90.3%) | 320 (9.7%) |
| $75,000 to $99,999 | 2,220 (89.4%) | 263 (10.6%) |
| $100,000 and over | 7,470 (92.6%) | 595 (7.4%) |
Public vs Private Health Insurance Coverage by Age in South Ogden
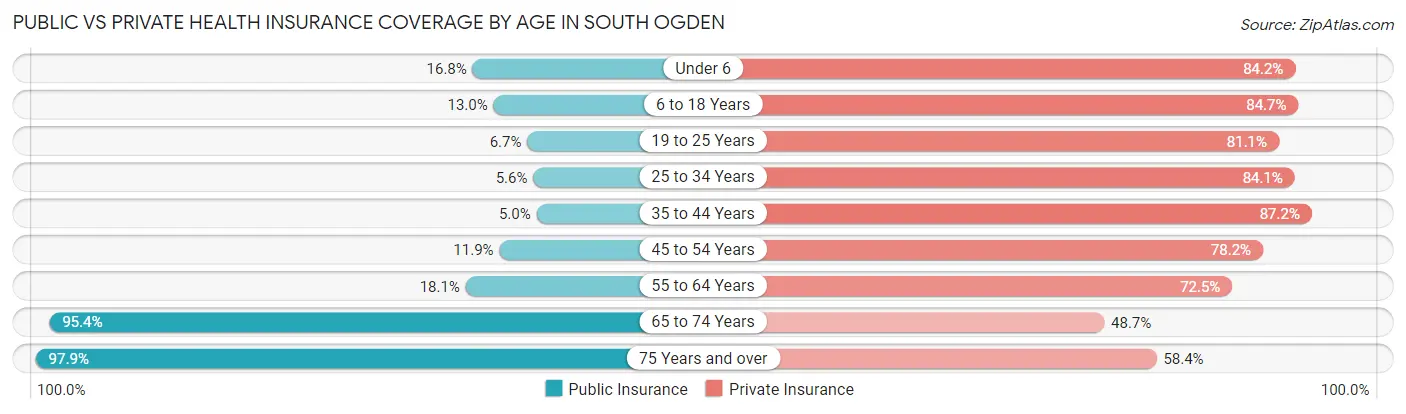
| Age Bracket | Public Insurance | Private Insurance |
| Under 6 | 255 (16.8%) | 1,274 (84.2%) |
| 6 to 18 Years | 397 (13.0%) | 2,595 (84.7%) |
| 19 to 25 Years | 119 (6.7%) | 1,444 (81.1%) |
| 25 to 34 Years | 147 (5.6%) | 2,215 (84.1%) |
| 35 to 44 Years | 113 (5.0%) | 1,979 (87.2%) |
| 45 to 54 Years | 201 (11.9%) | 1,324 (78.2%) |
| 55 to 64 Years | 320 (18.1%) | 1,279 (72.5%) |
| 65 to 74 Years | 1,458 (95.4%) | 744 (48.7%) |
| 75 Years and over | 857 (97.9%) | 511 (58.4%) |
| Total | 3,867 (22.6%) | 13,365 (78.0%) |
Disability Status by Sex by Age in South Ogden
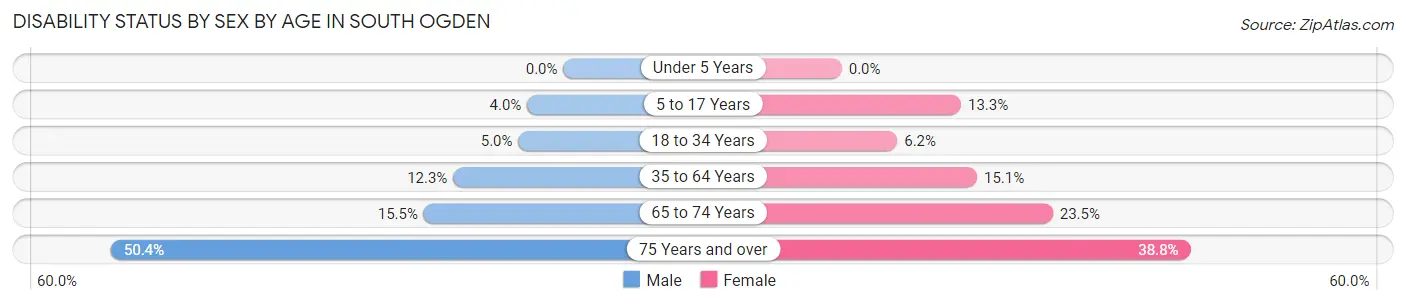
| Age Bracket | Male | Female |
| Under 5 Years | 0 (0.0%) | 0 (0.0%) |
| 5 to 17 Years | 70 (4.0%) | 182 (13.3%) |
| 18 to 34 Years | 118 (5.0%) | 141 (6.2%) |
| 35 to 64 Years | 341 (12.3%) | 444 (15.1%) |
| 65 to 74 Years | 129 (15.5%) | 164 (23.5%) |
| 75 Years and over | 193 (50.4%) | 191 (38.8%) |
Disability Class by Sex by Age in South Ogden
Disability Class: Hearing Difficulty
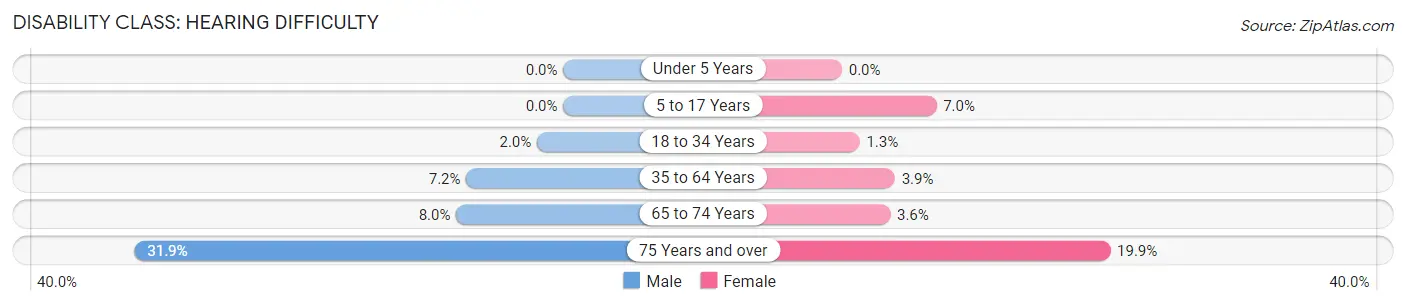
| Age Bracket | Male | Female |
| Under 5 Years | 0 (0.0%) | 0 (0.0%) |
| 5 to 17 Years | 0 (0.0%) | 96 (7.0%) |
| 18 to 34 Years | 46 (1.9%) | 30 (1.3%) |
| 35 to 64 Years | 200 (7.2%) | 116 (3.9%) |
| 65 to 74 Years | 66 (8.0%) | 25 (3.6%) |
| 75 Years and over | 122 (31.9%) | 98 (19.9%) |
Disability Class: Vision Difficulty
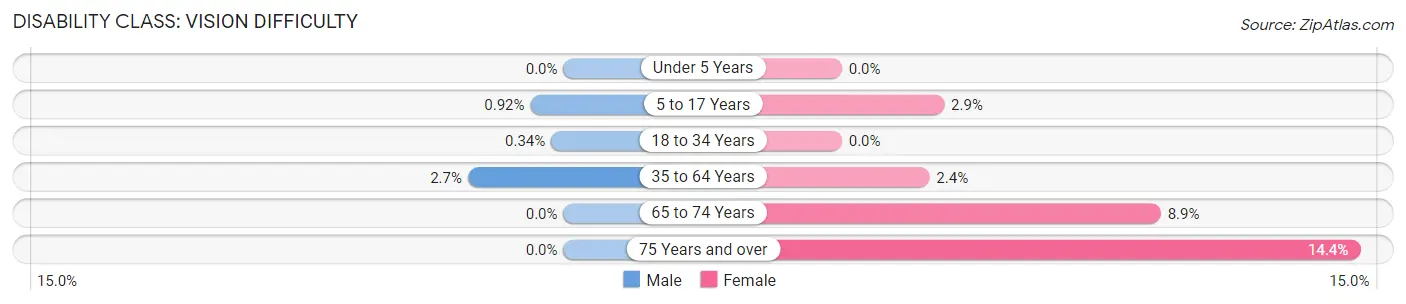
| Age Bracket | Male | Female |
| Under 5 Years | 0 (0.0%) | 0 (0.0%) |
| 5 to 17 Years | 16 (0.9%) | 39 (2.9%) |
| 18 to 34 Years | 8 (0.3%) | 0 (0.0%) |
| 35 to 64 Years | 74 (2.7%) | 72 (2.4%) |
| 65 to 74 Years | 0 (0.0%) | 62 (8.9%) |
| 75 Years and over | 0 (0.0%) | 71 (14.4%) |
Disability Class: Cognitive Difficulty
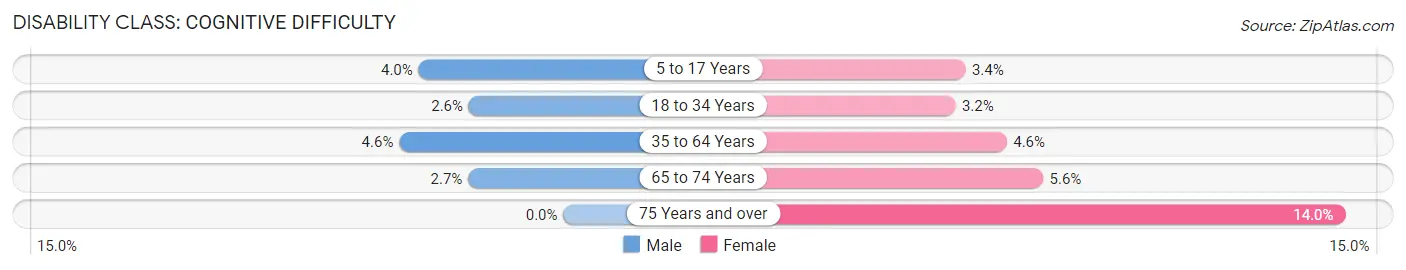
| Age Bracket | Male | Female |
| 5 to 17 Years | 70 (4.0%) | 47 (3.4%) |
| 18 to 34 Years | 62 (2.6%) | 72 (3.2%) |
| 35 to 64 Years | 127 (4.6%) | 135 (4.6%) |
| 65 to 74 Years | 22 (2.6%) | 39 (5.6%) |
| 75 Years and over | 0 (0.0%) | 69 (14.0%) |
Disability Class: Ambulatory Difficulty
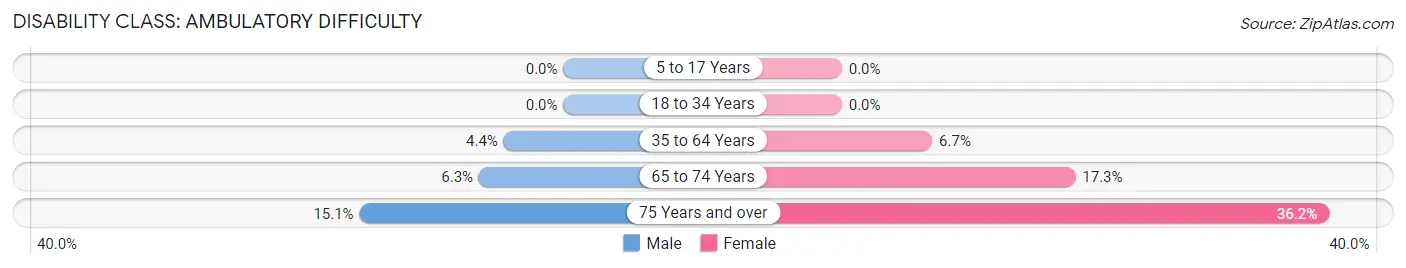
| Age Bracket | Male | Female |
| 5 to 17 Years | 0 (0.0%) | 0 (0.0%) |
| 18 to 34 Years | 0 (0.0%) | 0 (0.0%) |
| 35 to 64 Years | 123 (4.4%) | 198 (6.7%) |
| 65 to 74 Years | 52 (6.3%) | 121 (17.3%) |
| 75 Years and over | 58 (15.1%) | 178 (36.2%) |
Disability Class: Self-Care Difficulty
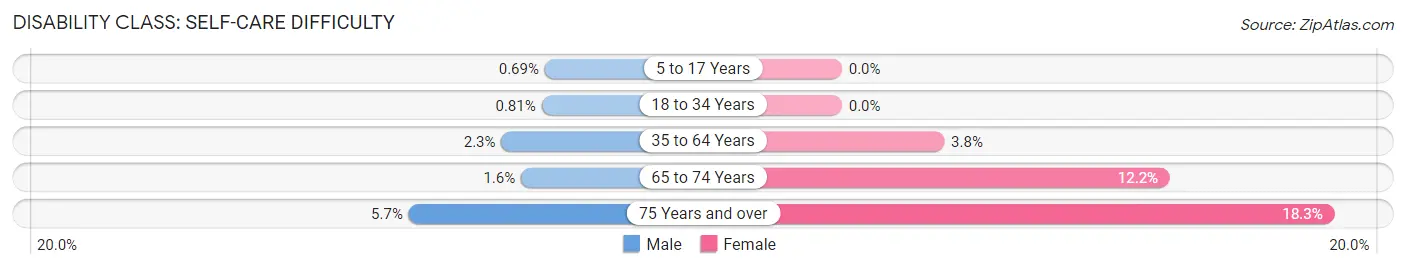
| Age Bracket | Male | Female |
| 5 to 17 Years | 12 (0.7%) | 0 (0.0%) |
| 18 to 34 Years | 19 (0.8%) | 0 (0.0%) |
| 35 to 64 Years | 64 (2.3%) | 112 (3.8%) |
| 65 to 74 Years | 13 (1.6%) | 85 (12.2%) |
| 75 Years and over | 22 (5.7%) | 90 (18.3%) |
Technology Access in South Ogden
Computing Device Access in South Ogden
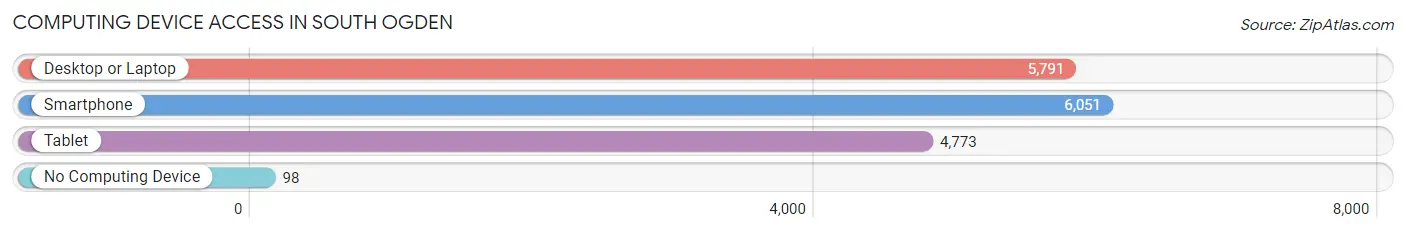
| Device Type | # Households | % Households |
| Desktop or Laptop | 5,791 | 89.3% |
| Smartphone | 6,051 | 93.3% |
| Tablet | 4,773 | 73.6% |
| No Computing Device | 98 | 1.5% |
| Total | 6,487 | 100.0% |
Internet Access in South Ogden
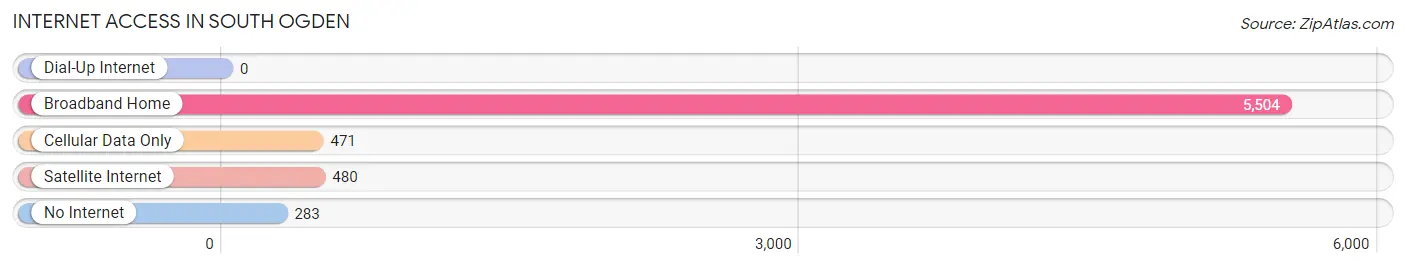
| Internet Type | # Households | % Households |
| Dial-Up Internet | 0 | 0.0% |
| Broadband Home | 5,504 | 84.9% |
| Cellular Data Only | 471 | 7.3% |
| Satellite Internet | 480 | 7.4% |
| No Internet | 283 | 4.4% |
| Total | 6,487 | 100.0% |
South Ogden Summary
History
South Ogden is a city located in Weber County, Utah, United States. It is part of the Ogden-Clearfield Metropolitan Statistical Area. The city was incorporated in 1938 and has a population of approximately 18,000 people.
The area that is now South Ogden was originally inhabited by the Shoshone and Ute Native American tribes. The first white settlers arrived in the area in the early 1800s, and the area was officially settled in 1847 by a group of Mormon pioneers led by Miles Goodyear. The area was originally known as Goodyear’s Settlement, and was later renamed South Ogden in 1868.
The city of South Ogden was officially incorporated in 1938, and has since grown to become a thriving community. The city is home to several businesses, including a number of restaurants, retail stores, and medical facilities. The city is also home to Weber State University, which is located just south of the city.
Geography
South Ogden is located in the northern part of Weber County, Utah, and is part of the Ogden-Clearfield Metropolitan Statistical Area. The city is situated at an elevation of 4,521 feet above sea level, and is located approximately 20 miles north of Salt Lake City.
The city covers an area of 8.3 square miles, and is bordered by the cities of Ogden to the north, Riverdale to the east, and Washington Terrace to the south. The city is also bordered by the Wasatch Mountains to the west.
Economy
South Ogden is home to a variety of businesses, including restaurants, retail stores, and medical facilities. The city is also home to Weber State University, which is located just south of the city.
The city’s economy is largely driven by the education and healthcare sectors. The city is home to several medical facilities, including Ogden Regional Medical Center and McKay-Dee Hospital. The city is also home to several educational institutions, including Weber State University, Ogden-Weber Technical College, and Davis Applied Technology College.
Demographics
As of the 2010 census, South Ogden had a population of 18,212 people. The racial makeup of the city was 87.3% White, 1.3% African American, 0.7% Native American, 2.2% Asian, 0.2% Pacific Islander, 5.2% from other races, and 3.3% from two or more races. Hispanic or Latino of any race were 11.2% of the population.
The median household income in South Ogden was $50,945, and the median family income was $58,945. The per capita income for the city was $22,845. About 6.3% of families and 8.7% of the population were below the poverty line, including 10.2% of those under age 18 and 5.2% of those age 65 or over.
Common Questions
What is Per Capita Income in South Ogden?
Per Capita income in South Ogden is $40,539.
What is the Median Family Income in South Ogden?
Median Family Income in South Ogden is $93,776.
What is the Median Household income in South Ogden?
Median Household Income in South Ogden is $80,762.
What is Income or Wage Gap in South Ogden?
Income or Wage Gap in South Ogden is 27.7%.
Women in South Ogden earn 72.3 cents for every dollar earned by a man.
What is Inequality or Gini Index in South Ogden?
Inequality or Gini Index in South Ogden is 0.45.
What is the Total Population of South Ogden?
Total Population of South Ogden is 17,476.
What is the Total Male Population of South Ogden?
Total Male Population of South Ogden is 8,788.
What is the Total Female Population of South Ogden?
Total Female Population of South Ogden is 8,688.
What is the Ratio of Males per 100 Females in South Ogden?
There are 101.15 Males per 100 Females in South Ogden.
What is the Ratio of Females per 100 Males in South Ogden?
There are 98.86 Females per 100 Males in South Ogden.
What is the Median Population Age in South Ogden?
Median Population Age in South Ogden is 33.5 Years.
What is the Average Family Size in South Ogden
Average Family Size in South Ogden is 3.2 People.
What is the Average Household Size in South Ogden
Average Household Size in South Ogden is 2.7 People.
How Large is the Labor Force in South Ogden?
There are 9,205 People in the Labor Forcein in South Ogden.
What is the Percentage of People in the Labor Force in South Ogden?
67.8% of People are in the Labor Force in South Ogden.
What is the Unemployment Rate in South Ogden?
Unemployment Rate in South Ogden is 2.1%.