Highland, UT Map & Demographics
Highland Map
Highland Overview
$56,315
PER CAPITA INCOME
$166,913
AVG FAMILY INCOME
$166,429
AVG HOUSEHOLD INCOME
72.9%
WAGE / INCOME GAP [ % ]
27.1¢/ $1
WAGE / INCOME GAP [ $ ]
$18,269
FAMILY INCOME DEFICIT
0.45
INEQUALITY / GINI INDEX
19,267
TOTAL POPULATION
10,004
MALE POPULATION
9,263
FEMALE POPULATION
108.00
MALES / 100 FEMALES
92.59
FEMALES / 100 MALES
24.6
MEDIAN AGE
4.3
AVG FAMILY SIZE
4.2
AVG HOUSEHOLD SIZE
8,616
LABOR FORCE [ PEOPLE ]
66.5%
PERCENT IN LABOR FORCE
2.8%
UNEMPLOYMENT RATE
Income in Highland
Income Overview in Highland
Per Capita Income in Highland is $56,315, while median incomes of families and households are $166,913 and $166,429 respectively.
| Characteristic | Number | Measure |
| Per Capita Income | 19,267 | $56,315 |
| Median Family Income | 4,355 | $166,913 |
| Mean Family Income | 4,355 | $237,345 |
| Median Household Income | 4,606 | $166,429 |
| Mean Household Income | 4,606 | $231,164 |
| Income Deficit | 4,355 | $18,269 |
| Wage / Income Gap (%) | 19,267 | 72.90% |
| Wage / Income Gap ($) | 19,267 | 27.10¢ per $1 |
| Gini / Inequality Index | 19,267 | 0.45 |
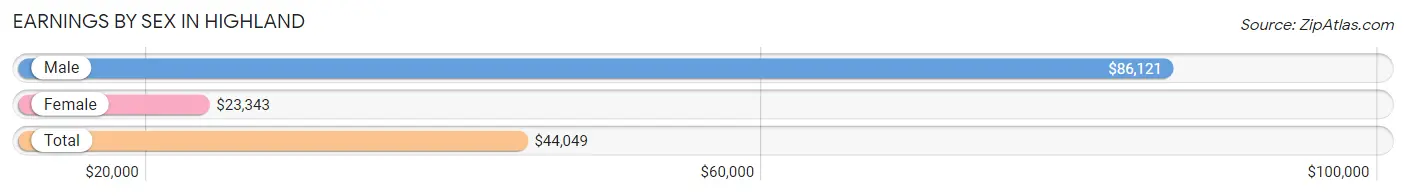
Earnings by Sex in Highland
Average Earnings in Highland are $44,049, $86,121 for men and $23,343 for women, a difference of 72.9%.
| Sex | Number | Average Earnings |
| Male | 5,702 (61.4%) | $86,121 |
| Female | 3,583 (38.6%) | $23,343 |
| Total | 9,285 (100.0%) | $44,049 |
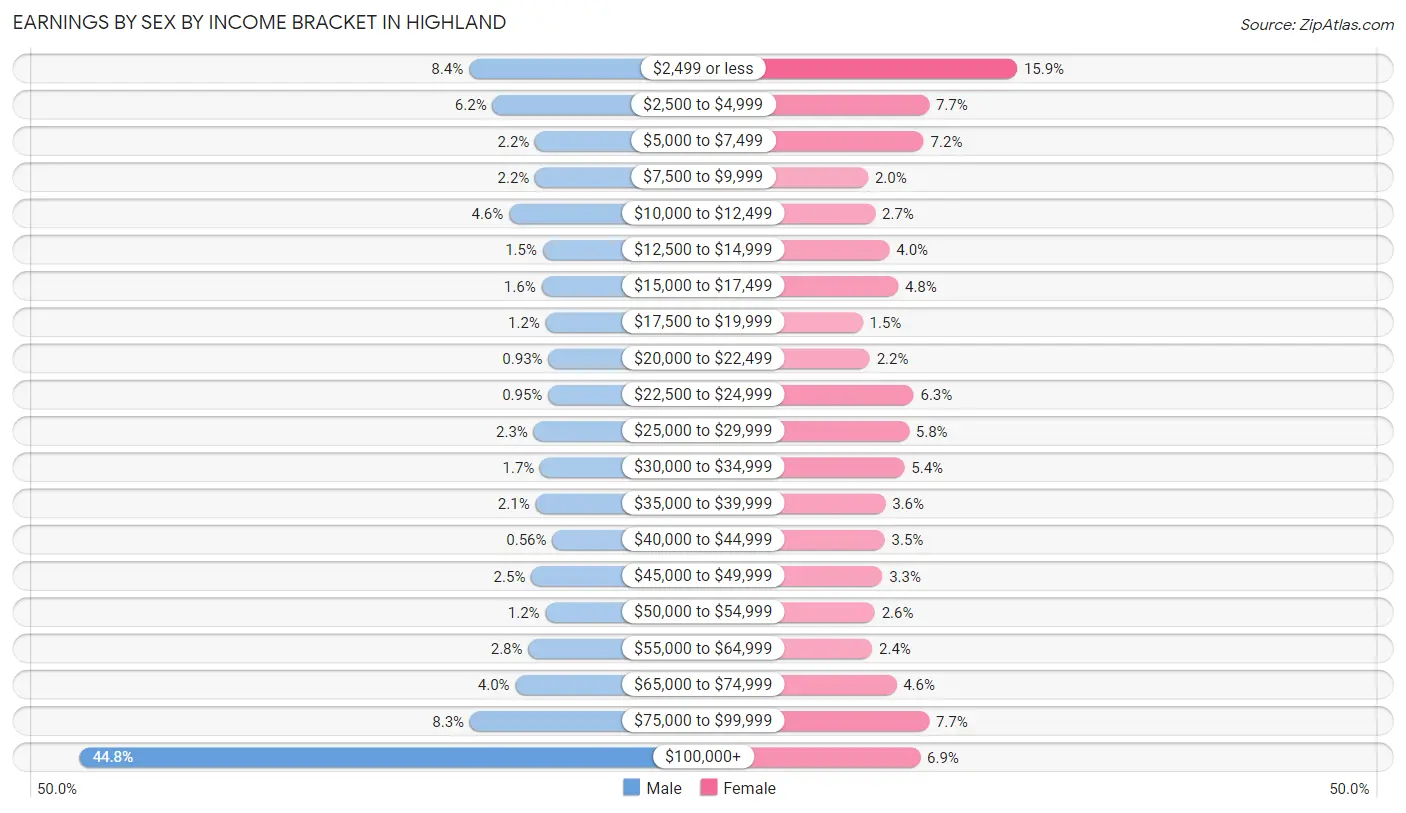
Earnings by Sex by Income Bracket in Highland
The most common earnings brackets in Highland are $100,000+ for men (2,556 | 44.8%) and $2,499 or less for women (571 | 15.9%).
| Income | Male | Female |
| $2,499 or less | 477 (8.4%) | 571 (15.9%) |
| $2,500 to $4,999 | 352 (6.2%) | 276 (7.7%) |
| $5,000 to $7,499 | 124 (2.2%) | 258 (7.2%) |
| $7,500 to $9,999 | 124 (2.2%) | 71 (2.0%) |
| $10,000 to $12,499 | 263 (4.6%) | 95 (2.6%) |
| $12,500 to $14,999 | 83 (1.5%) | 143 (4.0%) |
| $15,000 to $17,499 | 90 (1.6%) | 172 (4.8%) |
| $17,500 to $19,999 | 68 (1.2%) | 53 (1.5%) |
| $20,000 to $22,499 | 53 (0.9%) | 77 (2.1%) |
| $22,500 to $24,999 | 54 (0.9%) | 224 (6.2%) |
| $25,000 to $29,999 | 132 (2.3%) | 208 (5.8%) |
| $30,000 to $34,999 | 97 (1.7%) | 193 (5.4%) |
| $35,000 to $39,999 | 122 (2.1%) | 129 (3.6%) |
| $40,000 to $44,999 | 32 (0.6%) | 127 (3.5%) |
| $45,000 to $49,999 | 145 (2.5%) | 119 (3.3%) |
| $50,000 to $54,999 | 69 (1.2%) | 94 (2.6%) |
| $55,000 to $64,999 | 160 (2.8%) | 85 (2.4%) |
| $65,000 to $74,999 | 229 (4.0%) | 166 (4.6%) |
| $75,000 to $99,999 | 472 (8.3%) | 276 (7.7%) |
| $100,000+ | 2,556 (44.8%) | 246 (6.9%) |
| Total | 5,702 (100.0%) | 3,583 (100.0%) |
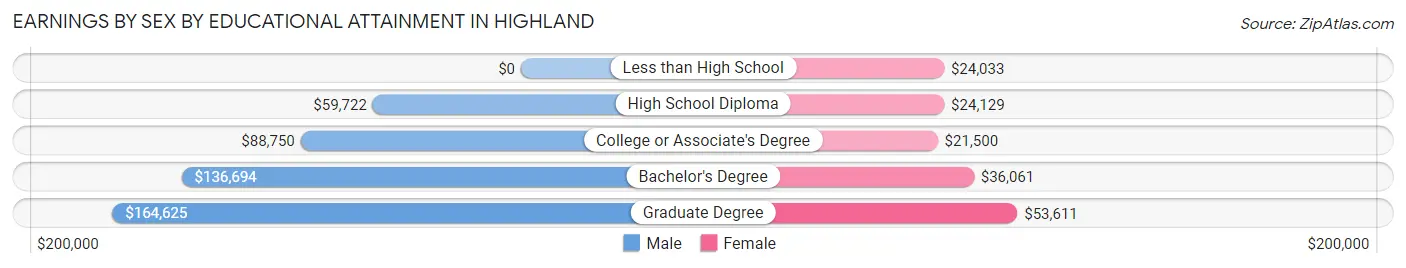
Earnings by Sex by Educational Attainment in Highland
Average earnings in Highland are $121,655 for men and $32,290 for women, a difference of 73.5%. Men with an educational attainment of graduate degree enjoy the highest average annual earnings of $164,625, while those with high school diploma education earn the least with $59,722. Women with an educational attainment of graduate degree earn the most with the average annual earnings of $53,611, while those with college or associate's degree education have the smallest earnings of $21,500.
| Educational Attainment | Male Income | Female Income |
| Less than High School | - | - |
| High School Diploma | $59,722 | $24,129 |
| College or Associate's Degree | $88,750 | $21,500 |
| Bachelor's Degree | $136,694 | $36,061 |
| Graduate Degree | $164,625 | $53,611 |
| Total | $121,655 | $32,290 |
Family Income in Highland
Family Income Brackets in Highland
According to the Highland family income data, there are 1,694 families falling into the $200,000+ income range, which is the most common income bracket and makes up 38.9% of all families. Conversely, the $10,000 to $14,999 income bracket is the least frequent group with only 9 families (0.2%) belonging to this category.
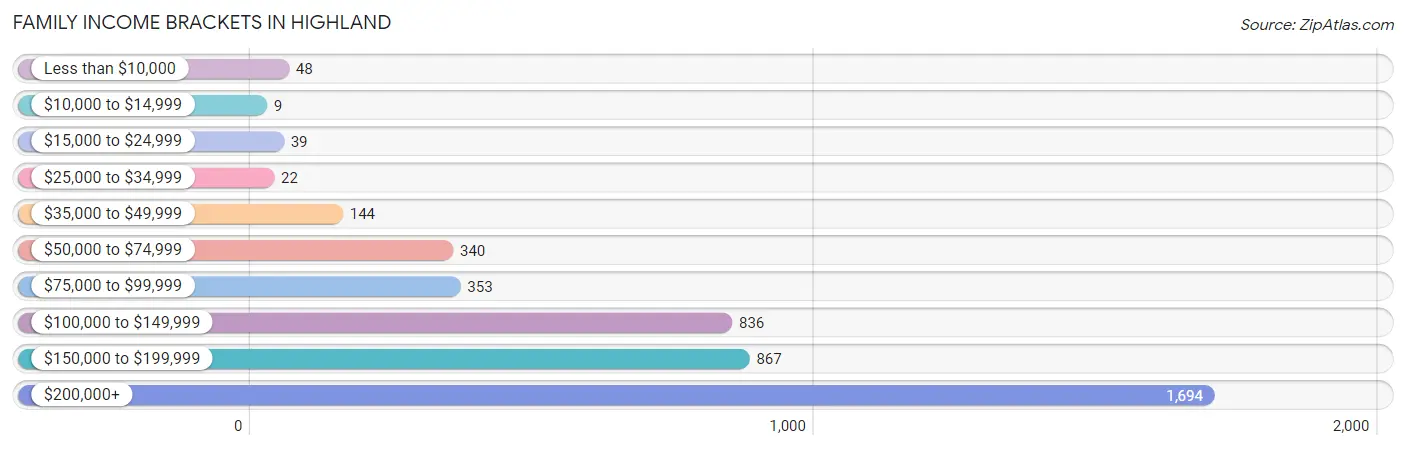
| Income Bracket | # Families | % Families |
| Less than $10,000 | 48 | 1.1% |
| $10,000 to $14,999 | 9 | 0.2% |
| $15,000 to $24,999 | 39 | 0.9% |
| $25,000 to $34,999 | 22 | 0.5% |
| $35,000 to $49,999 | 144 | 3.3% |
| $50,000 to $74,999 | 340 | 7.8% |
| $75,000 to $99,999 | 353 | 8.1% |
| $100,000 to $149,999 | 836 | 19.2% |
| $150,000 to $199,999 | 867 | 19.9% |
| $200,000+ | 1,694 | 38.9% |
Family Income by Famaliy Size in Highland
7+ person families (389 | 8.9%) account for the highest median family income in Highland with $213,646 per family, while 2-person families (1,273 | 29.2%) have the highest median income of $63,532 per family member.
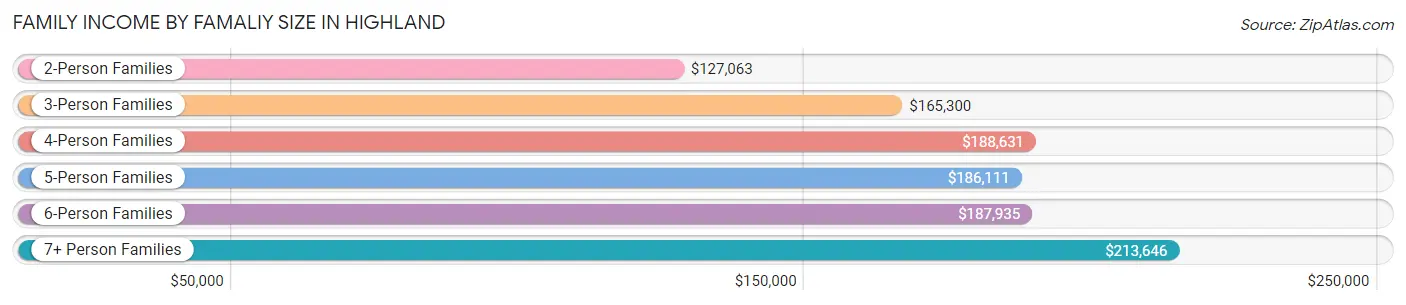
| Income Bracket | # Families | Median Income |
| 2-Person Families | 1,273 (29.2%) | $127,063 |
| 3-Person Families | 594 (13.6%) | $165,300 |
| 4-Person Families | 619 (14.2%) | $188,631 |
| 5-Person Families | 686 (15.8%) | $186,111 |
| 6-Person Families | 794 (18.2%) | $187,935 |
| 7+ Person Families | 389 (8.9%) | $213,646 |
| Total | 4,355 (100.0%) | $166,913 |
Family Income by Number of Earners in Highland
The median family income in Highland is $166,913, with families comprising 3+ earners (1,170) having the highest median family income of $206,471, while families with no earners (357) have the lowest median family income of $90,750, accounting for 26.9% and 8.2% of families, respectively.
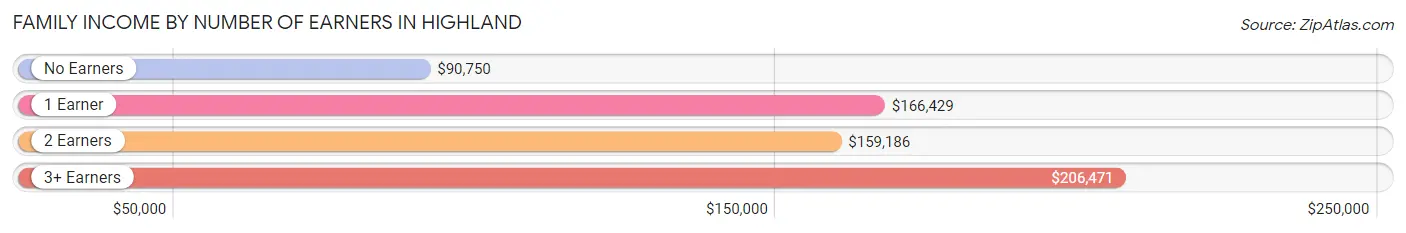
| Number of Earners | # Families | Median Income |
| No Earners | 357 (8.2%) | $90,750 |
| 1 Earner | 1,322 (30.4%) | $166,429 |
| 2 Earners | 1,506 (34.6%) | $159,186 |
| 3+ Earners | 1,170 (26.9%) | $206,471 |
| Total | 4,355 (100.0%) | $166,913 |
Household Income in Highland
Household Income Brackets in Highland
With 1,723 households falling in the category, the $200,000+ income range is the most frequent in Highland, accounting for 37.4% of all households. In contrast, only 23 households (0.5%) fall into the $10,000 to $14,999 income bracket, making it the least populous group.
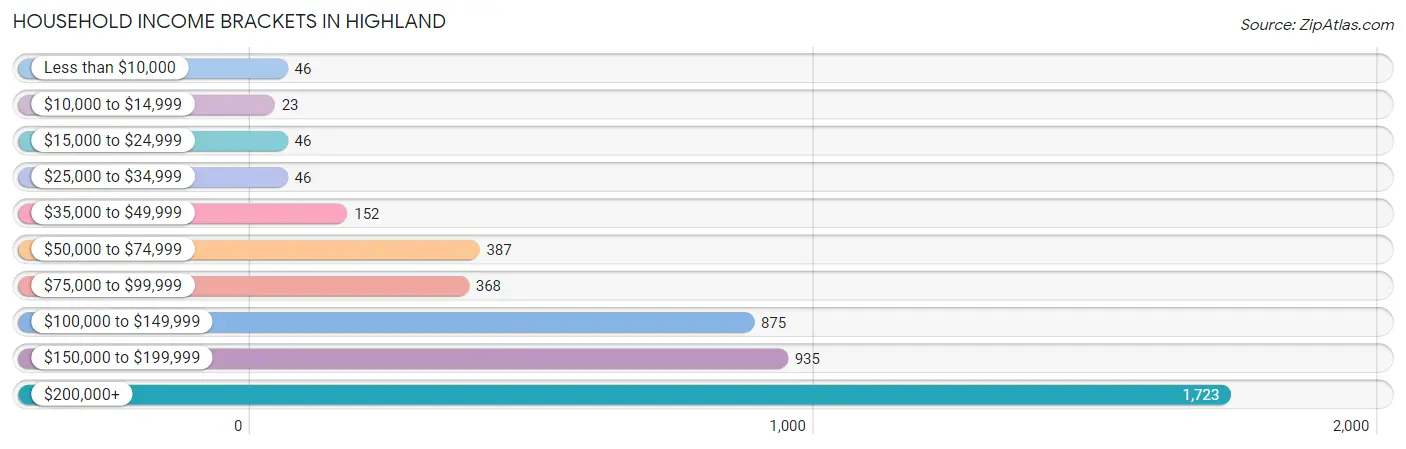
| Income Bracket | # Households | % Households |
| Less than $10,000 | 46 | 1.0% |
| $10,000 to $14,999 | 23 | 0.5% |
| $15,000 to $24,999 | 46 | 1.0% |
| $25,000 to $34,999 | 46 | 1.0% |
| $35,000 to $49,999 | 152 | 3.3% |
| $50,000 to $74,999 | 387 | 8.4% |
| $75,000 to $99,999 | 368 | 8.0% |
| $100,000 to $149,999 | 875 | 19.0% |
| $150,000 to $199,999 | 935 | 20.3% |
| $200,000+ | 1,723 | 37.4% |
Household Income by Householder Age in Highland
The median household income in Highland is $166,429, with the highest median household income of $185,464 found in the 45 to 64 years age bracket for the primary householder. A total of 2,045 households (44.4%) fall into this category. Meanwhile, the 15 to 24 years age bracket for the primary householder has the lowest median household income of $63,071, with 87 households (1.9%) in this group.
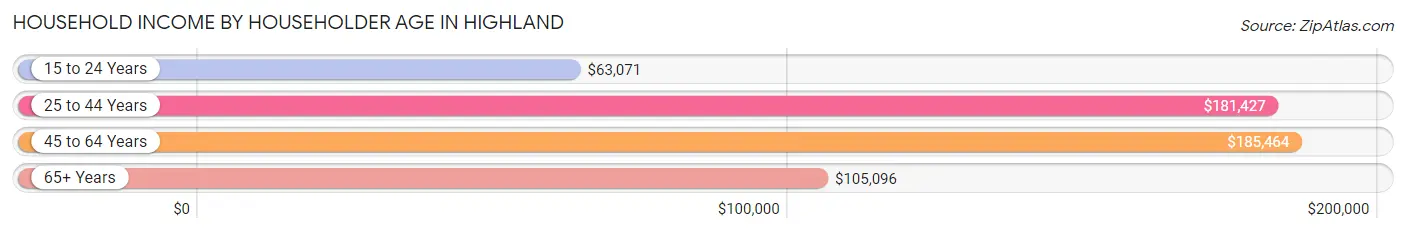
| Income Bracket | # Households | Median Income |
| 15 to 24 Years | 87 (1.9%) | $63,071 |
| 25 to 44 Years | 1,527 (33.2%) | $181,427 |
| 45 to 64 Years | 2,045 (44.4%) | $185,464 |
| 65+ Years | 947 (20.6%) | $105,096 |
| Total | 4,606 (100.0%) | $166,429 |
Poverty in Highland
Income Below Poverty by Sex and Age in Highland
With 1.5% poverty level for males and 2.6% for females among the residents of Highland, 16 and 17 year old males and 18 to 24 year old females are the most vulnerable to poverty, with 37 males (5.4%) and 59 females (6.2%) in their respective age groups living below the poverty level.
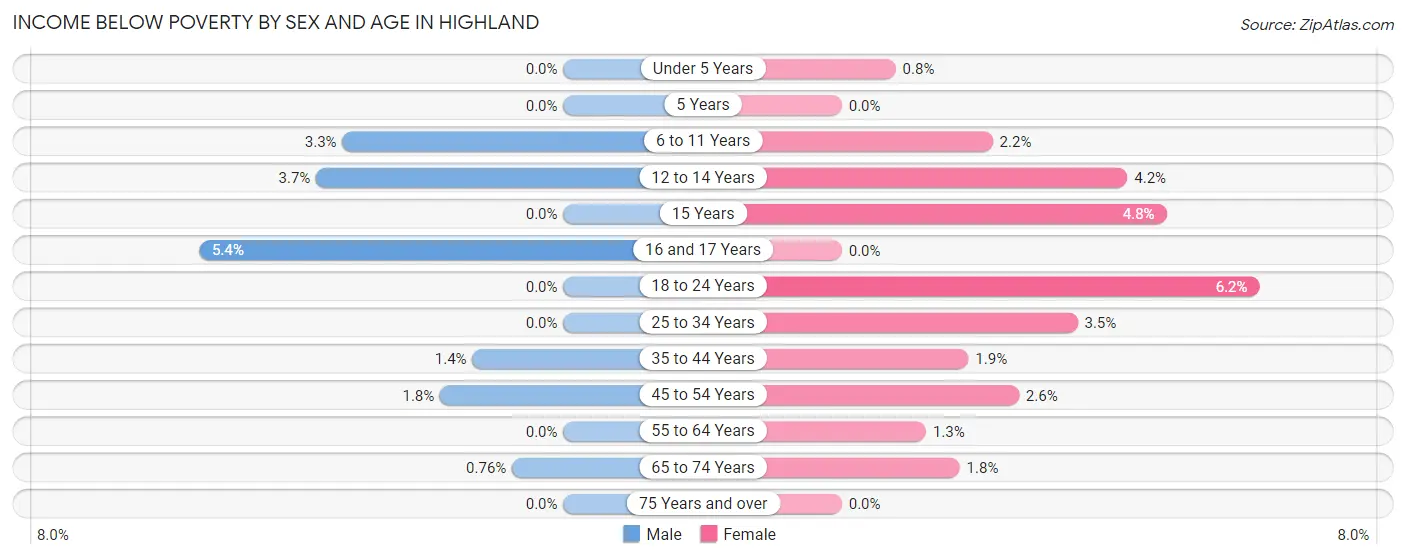
| Age Bracket | Male | Female |
| Under 5 Years | 0 (0.0%) | 4 (0.8%) |
| 5 Years | 0 (0.0%) | 0 (0.0%) |
| 6 to 11 Years | 36 (3.3%) | 29 (2.2%) |
| 12 to 14 Years | 29 (3.7%) | 37 (4.2%) |
| 15 Years | 0 (0.0%) | 12 (4.8%) |
| 16 and 17 Years | 37 (5.4%) | 0 (0.0%) |
| 18 to 24 Years | 0 (0.0%) | 59 (6.2%) |
| 25 to 34 Years | 0 (0.0%) | 23 (3.5%) |
| 35 to 44 Years | 19 (1.3%) | 22 (1.9%) |
| 45 to 54 Years | 22 (1.8%) | 36 (2.6%) |
| 55 to 64 Years | 0 (0.0%) | 9 (1.3%) |
| 65 to 74 Years | 4 (0.8%) | 9 (1.8%) |
| 75 Years and over | 0 (0.0%) | 0 (0.0%) |
| Total | 147 (1.5%) | 240 (2.6%) |
Income Above Poverty by Sex and Age in Highland
According to the poverty statistics in Highland, males aged under 5 years and females aged 5 years are the age groups that are most secure financially, with 100.0% of males and 100.0% of females in these age groups living above the poverty line.
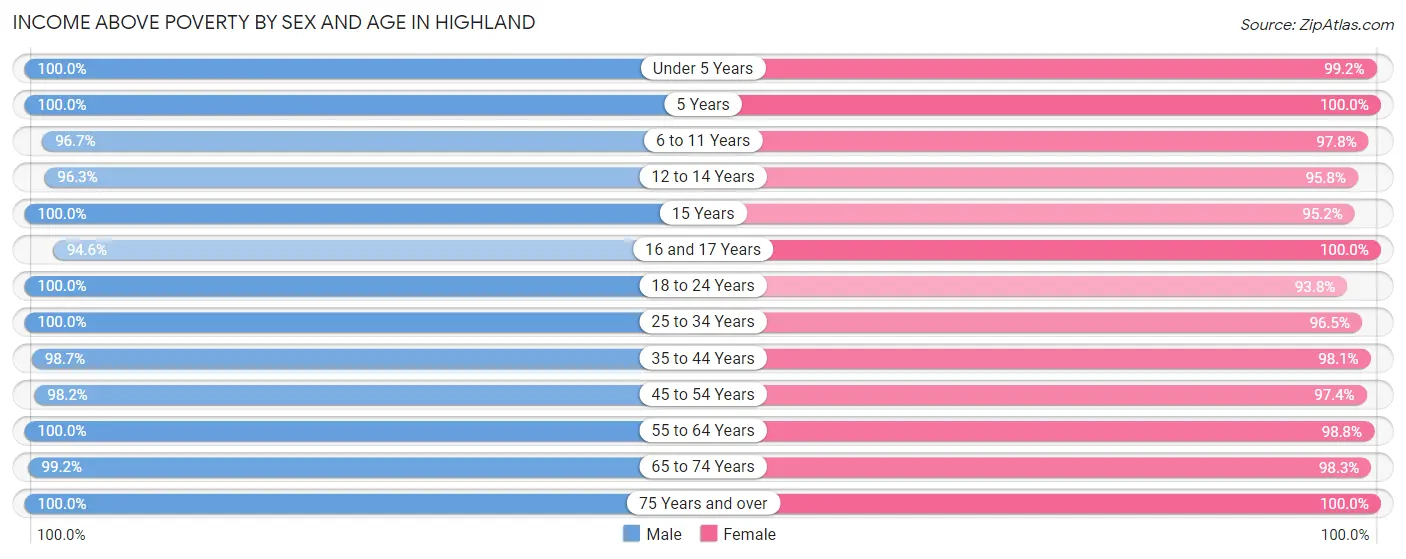
| Age Bracket | Male | Female |
| Under 5 Years | 707 (100.0%) | 495 (99.2%) |
| 5 Years | 344 (100.0%) | 150 (100.0%) |
| 6 to 11 Years | 1,060 (96.7%) | 1,268 (97.8%) |
| 12 to 14 Years | 761 (96.3%) | 836 (95.8%) |
| 15 Years | 263 (100.0%) | 237 (95.2%) |
| 16 and 17 Years | 647 (94.6%) | 524 (100.0%) |
| 18 to 24 Years | 1,228 (100.0%) | 892 (93.8%) |
| 25 to 34 Years | 620 (100.0%) | 635 (96.5%) |
| 35 to 44 Years | 1,385 (98.7%) | 1,148 (98.1%) |
| 45 to 54 Years | 1,181 (98.2%) | 1,333 (97.4%) |
| 55 to 64 Years | 832 (100.0%) | 710 (98.8%) |
| 65 to 74 Years | 522 (99.2%) | 505 (98.3%) |
| 75 Years and over | 261 (100.0%) | 280 (100.0%) |
| Total | 9,811 (98.5%) | 9,013 (97.4%) |
Income Below Poverty Among Married-Couple Families in Highland
The poverty statistics for married-couple families in Highland show that 1.0% or 39 of the total 3,873 families live below the poverty line. Families with 3 or 4 children have the highest poverty rate of 1.7%, comprising of 18 families. On the other hand, families with 5 or more children have the lowest poverty rate of 0.0%, which includes 0 families.
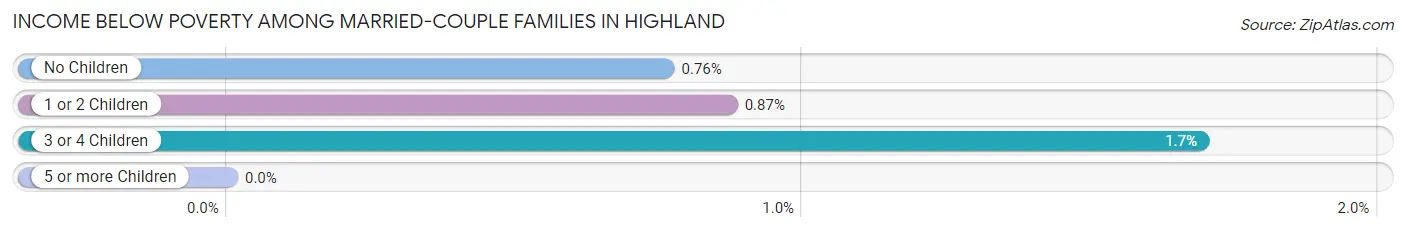
| Children | Above Poverty | Below Poverty |
| No Children | 1,435 (99.2%) | 11 (0.8%) |
| 1 or 2 Children | 1,134 (99.1%) | 10 (0.9%) |
| 3 or 4 Children | 1,048 (98.3%) | 18 (1.7%) |
| 5 or more Children | 217 (100.0%) | 0 (0.0%) |
| Total | 3,834 (99.0%) | 39 (1.0%) |
Income Below Poverty Among Single-Parent Households in Highland
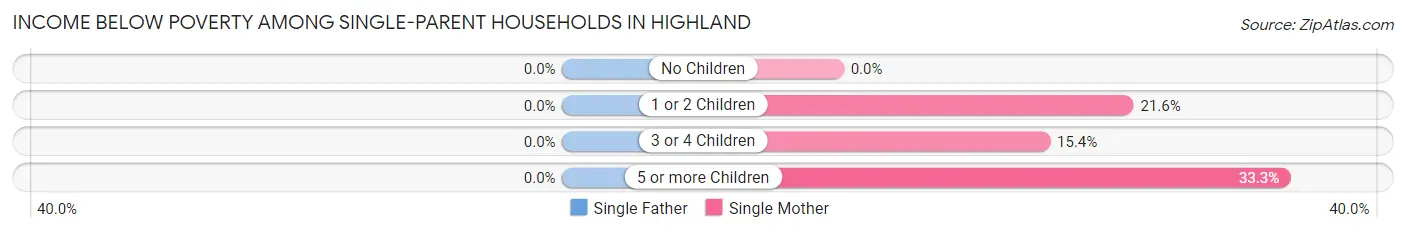
| Children | Single Father | Single Mother |
| No Children | 0 (0.0%) | 0 (0.0%) |
| 1 or 2 Children | 0 (0.0%) | 27 (21.6%) |
| 3 or 4 Children | 0 (0.0%) | 8 (15.4%) |
| 5 or more Children | 0 (0.0%) | 4 (33.3%) |
| Total | 0 (0.0%) | 39 (14.4%) |
Income Below Poverty Among Married-Couple vs Single-Parent Households in Highland
The poverty data for Highland shows that 39 of the married-couple family households (1.0%) and 39 of the single-parent households (8.1%) are living below the poverty level. Within the married-couple family households, those with 3 or 4 children have the highest poverty rate, with 18 households (1.7%) falling below the poverty line. Among the single-parent households, those with 5 or more children have the highest poverty rate, with 4 household (33.3%) living below poverty.
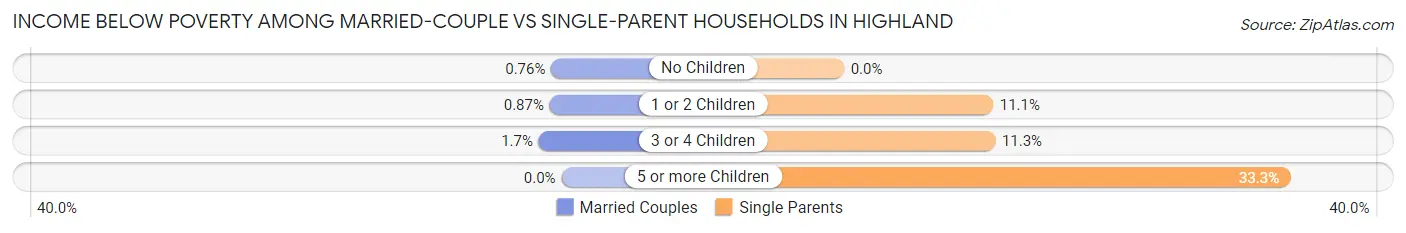
| Children | Married-Couple Families | Single-Parent Households |
| No Children | 11 (0.8%) | 0 (0.0%) |
| 1 or 2 Children | 10 (0.9%) | 27 (11.1%) |
| 3 or 4 Children | 18 (1.7%) | 8 (11.3%) |
| 5 or more Children | 0 (0.0%) | 4 (33.3%) |
| Total | 39 (1.0%) | 39 (8.1%) |
Race in Highland
The most populous races in Highland are White / Caucasian (17,386 | 90.2%), Two or more Races (830 | 4.3%), and Hispanic or Latino (537 | 2.8%).
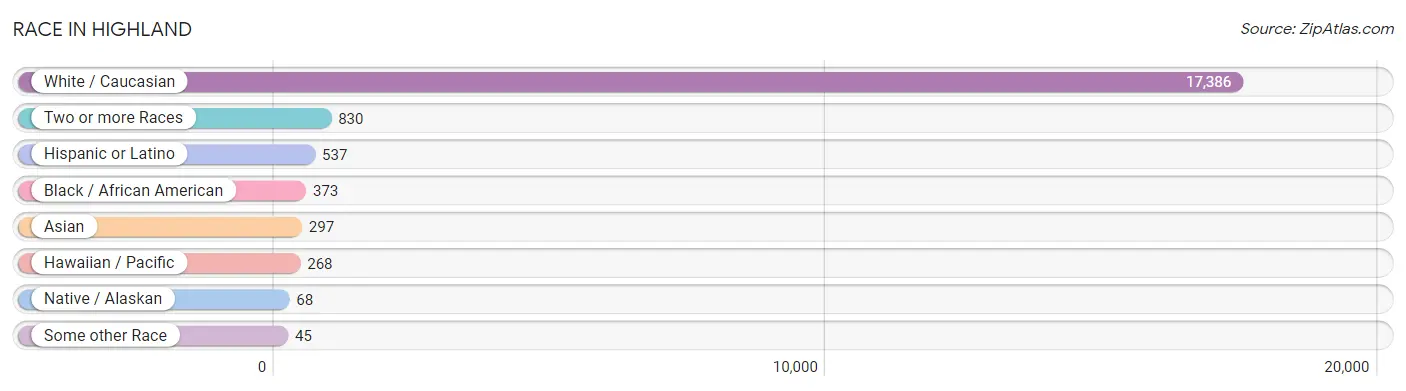
| Race | # Population | % Population |
| Asian | 297 | 1.5% |
| Black / African American | 373 | 1.9% |
| Hawaiian / Pacific | 268 | 1.4% |
| Hispanic or Latino | 537 | 2.8% |
| Native / Alaskan | 68 | 0.4% |
| White / Caucasian | 17,386 | 90.2% |
| Two or more Races | 830 | 4.3% |
| Some other Race | 45 | 0.2% |
| Total | 19,267 | 100.0% |
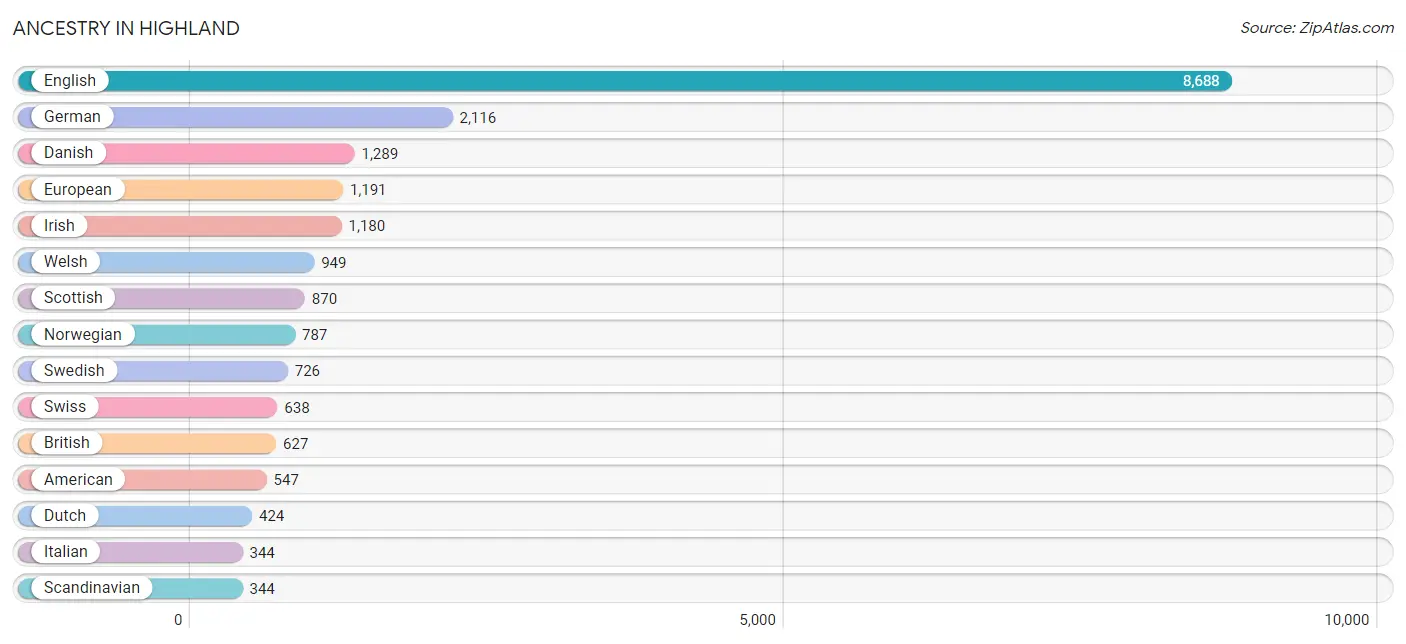
Ancestry in Highland
The most populous ancestries reported in Highland are English (8,688 | 45.1%), German (2,116 | 11.0%), Danish (1,289 | 6.7%), European (1,191 | 6.2%), and Irish (1,180 | 6.1%), together accounting for 75.1% of all Highland residents.
| Ancestry | # Population | % Population |
| American | 547 | 2.8% |
| Arab | 52 | 0.3% |
| Armenian | 9 | 0.1% |
| Austrian | 7 | 0.0% |
| Bhutanese | 306 | 1.6% |
| Brazilian | 36 | 0.2% |
| British | 627 | 3.3% |
| Burmese | 113 | 0.6% |
| Canadian | 12 | 0.1% |
| Central American | 25 | 0.1% |
| Chilean | 7 | 0.0% |
| Colombian | 49 | 0.3% |
| Cuban | 56 | 0.3% |
| Czech | 125 | 0.6% |
| Czechoslovakian | 8 | 0.0% |
| Danish | 1,289 | 6.7% |
| Dutch | 424 | 2.2% |
| Eastern European | 6 | 0.0% |
| English | 8,688 | 45.1% |
| European | 1,191 | 6.2% |
| Finnish | 10 | 0.1% |
| French | 220 | 1.1% |
| French American Indian | 29 | 0.2% |
| German | 2,116 | 11.0% |
| Guamanian / Chamorro | 20 | 0.1% |
| Guatemalan | 15 | 0.1% |
| Honduran | 10 | 0.1% |
| Hungarian | 12 | 0.1% |
| Indian (Asian) | 151 | 0.8% |
| Irish | 1,180 | 6.1% |
| Italian | 344 | 1.8% |
| Korean | 36 | 0.2% |
| Lebanese | 52 | 0.3% |
| Mexican | 330 | 1.7% |
| Native Hawaiian | 47 | 0.2% |
| Navajo | 45 | 0.2% |
| Northern European | 41 | 0.2% |
| Norwegian | 787 | 4.1% |
| Pakistani | 47 | 0.2% |
| Pennsylvania German | 23 | 0.1% |
| Polish | 23 | 0.1% |
| Portuguese | 55 | 0.3% |
| Puerto Rican | 18 | 0.1% |
| Romanian | 9 | 0.1% |
| Russian | 47 | 0.2% |
| Samoan | 256 | 1.3% |
| Scandinavian | 344 | 1.8% |
| Scotch-Irish | 286 | 1.5% |
| Scottish | 870 | 4.5% |
| Slovak | 8 | 0.0% |
| South American | 56 | 0.3% |
| Spanish | 40 | 0.2% |
| Spanish American | 12 | 0.1% |
| Sri Lankan | 36 | 0.2% |
| Swedish | 726 | 3.8% |
| Swiss | 638 | 3.3% |
| Thai | 18 | 0.1% |
| Ukrainian | 9 | 0.1% |
| Welsh | 949 | 4.9% |
| Yugoslavian | 6 | 0.0% | View All 60 Rows |
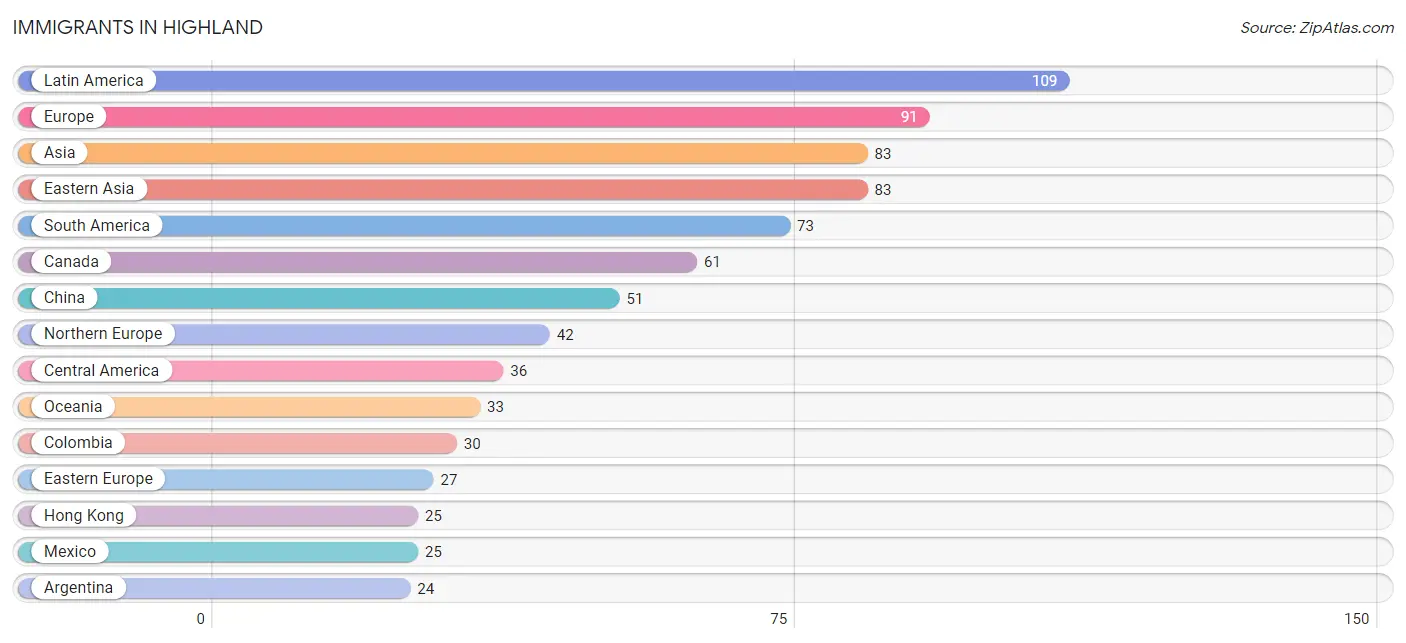
Immigrants in Highland
The most numerous immigrant groups reported in Highland came from Latin America (109 | 0.6%), Europe (91 | 0.5%), Asia (83 | 0.4%), Eastern Asia (83 | 0.4%), and South America (73 | 0.4%), together accounting for 2.3% of all Highland residents.
| Immigration Origin | # Population | % Population |
| Argentina | 24 | 0.1% |
| Asia | 83 | 0.4% |
| Brazil | 19 | 0.1% |
| Canada | 61 | 0.3% |
| Central America | 36 | 0.2% |
| China | 51 | 0.3% |
| Colombia | 30 | 0.2% |
| Denmark | 12 | 0.1% |
| Eastern Asia | 83 | 0.4% |
| Eastern Europe | 27 | 0.1% |
| England | 12 | 0.1% |
| Europe | 91 | 0.5% |
| Germany | 22 | 0.1% |
| Guatemala | 1 | 0.0% |
| Honduras | 10 | 0.1% |
| Hong Kong | 25 | 0.1% |
| Japan | 9 | 0.1% |
| Korea | 23 | 0.1% |
| Latin America | 109 | 0.6% |
| Mexico | 25 | 0.1% |
| Northern Europe | 42 | 0.2% |
| Oceania | 33 | 0.2% |
| Romania | 9 | 0.1% |
| Russia | 18 | 0.1% |
| South America | 73 | 0.4% |
| Western Europe | 22 | 0.1% | View All 26 Rows |
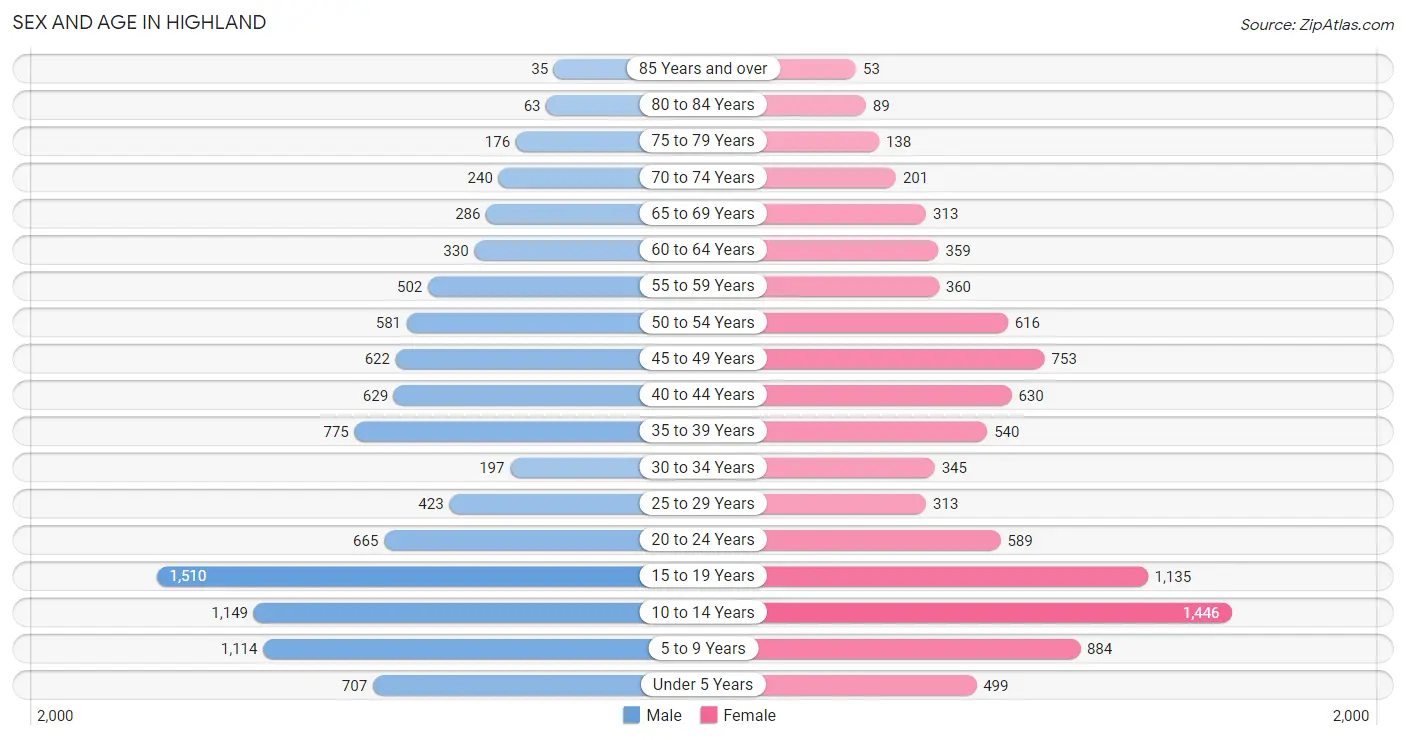
Sex and Age in Highland
Sex and Age in Highland
The most populous age groups in Highland are 15 to 19 Years (1,510 | 15.1%) for men and 10 to 14 Years (1,446 | 15.6%) for women.
| Age Bracket | Male | Female |
| Under 5 Years | 707 (7.1%) | 499 (5.4%) |
| 5 to 9 Years | 1,114 (11.1%) | 884 (9.5%) |
| 10 to 14 Years | 1,149 (11.5%) | 1,446 (15.6%) |
| 15 to 19 Years | 1,510 (15.1%) | 1,135 (12.2%) |
| 20 to 24 Years | 665 (6.7%) | 589 (6.4%) |
| 25 to 29 Years | 423 (4.2%) | 313 (3.4%) |
| 30 to 34 Years | 197 (2.0%) | 345 (3.7%) |
| 35 to 39 Years | 775 (7.7%) | 540 (5.8%) |
| 40 to 44 Years | 629 (6.3%) | 630 (6.8%) |
| 45 to 49 Years | 622 (6.2%) | 753 (8.1%) |
| 50 to 54 Years | 581 (5.8%) | 616 (6.7%) |
| 55 to 59 Years | 502 (5.0%) | 360 (3.9%) |
| 60 to 64 Years | 330 (3.3%) | 359 (3.9%) |
| 65 to 69 Years | 286 (2.9%) | 313 (3.4%) |
| 70 to 74 Years | 240 (2.4%) | 201 (2.2%) |
| 75 to 79 Years | 176 (1.8%) | 138 (1.5%) |
| 80 to 84 Years | 63 (0.6%) | 89 (1.0%) |
| 85 Years and over | 35 (0.4%) | 53 (0.6%) |
| Total | 10,004 (100.0%) | 9,263 (100.0%) |
Families and Households in Highland
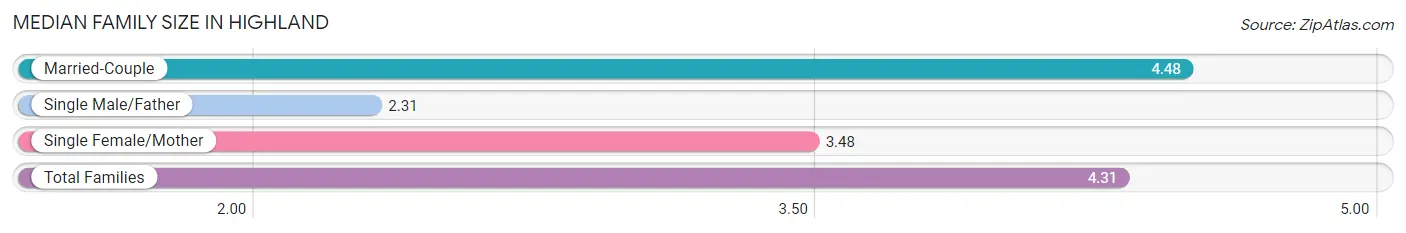
Median Family Size in Highland
The median family size in Highland is 4.31 persons per family, with married-couple families (3,873 | 88.9%) accounting for the largest median family size of 4.48 persons per family. On the other hand, single male/father families (211 | 4.9%) represent the smallest median family size with 2.31 persons per family.
| Family Type | # Families | Family Size |
| Married-Couple | 3,873 (88.9%) | 4.48 |
| Single Male/Father | 211 (4.9%) | 2.31 |
| Single Female/Mother | 271 (6.2%) | 3.48 |
| Total Families | 4,355 (100.0%) | 4.31 |
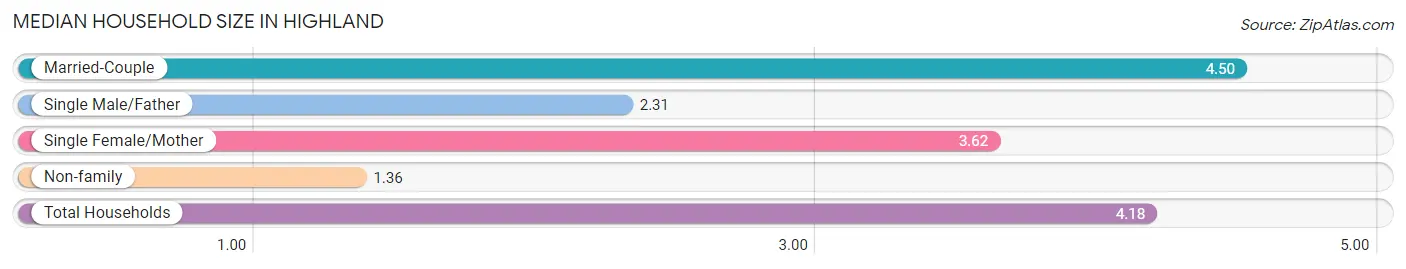
Median Household Size in Highland
The median household size in Highland is 4.18 persons per household, with married-couple households (3,873 | 84.1%) accounting for the largest median household size of 4.5 persons per household. non-family households (251 | 5.4%) represent the smallest median household size with 1.36 persons per household.
| Household Type | # Households | Household Size |
| Married-Couple | 3,873 (84.1%) | 4.50 |
| Single Male/Father | 211 (4.6%) | 2.31 |
| Single Female/Mother | 271 (5.9%) | 3.62 |
| Non-family | 251 (5.4%) | 1.36 |
| Total Households | 4,606 (100.0%) | 4.18 |
Household Size by Marriage Status in Highland
Out of a total of 4,606 households in Highland, 4,355 (94.6%) are family households, while 251 (5.4%) are nonfamily households. The most numerous type of family households are 2-person households, comprising 1,232, and the most common type of nonfamily households are 1-person households, comprising 218.
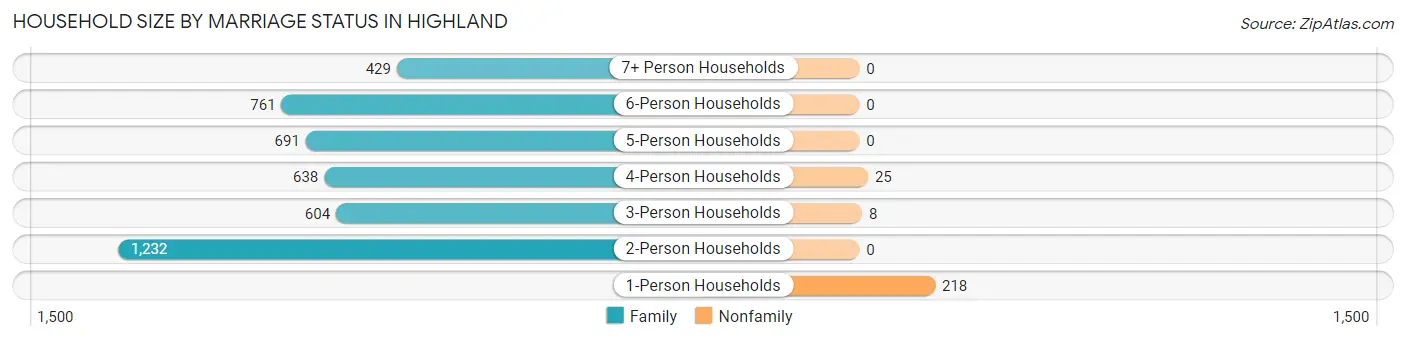
| Household Size | Family Households | Nonfamily Households |
| 1-Person Households | - | 218 (4.7%) |
| 2-Person Households | 1,232 (26.8%) | 0 (0.0%) |
| 3-Person Households | 604 (13.1%) | 8 (0.2%) |
| 4-Person Households | 638 (13.9%) | 25 (0.5%) |
| 5-Person Households | 691 (15.0%) | 0 (0.0%) |
| 6-Person Households | 761 (16.5%) | 0 (0.0%) |
| 7+ Person Households | 429 (9.3%) | 0 (0.0%) |
| Total | 4,355 (94.6%) | 251 (5.4%) |
Female Fertility in Highland
Fertility by Age in Highland
Average fertility rate in Highland is 59.0 births per 1,000 women. Women in the age bracket of 20 to 34 years have the highest fertility rate with 135.0 births per 1,000 women. Women in the age bracket of 20 to 34 years acount for 63.6% of all women with births.
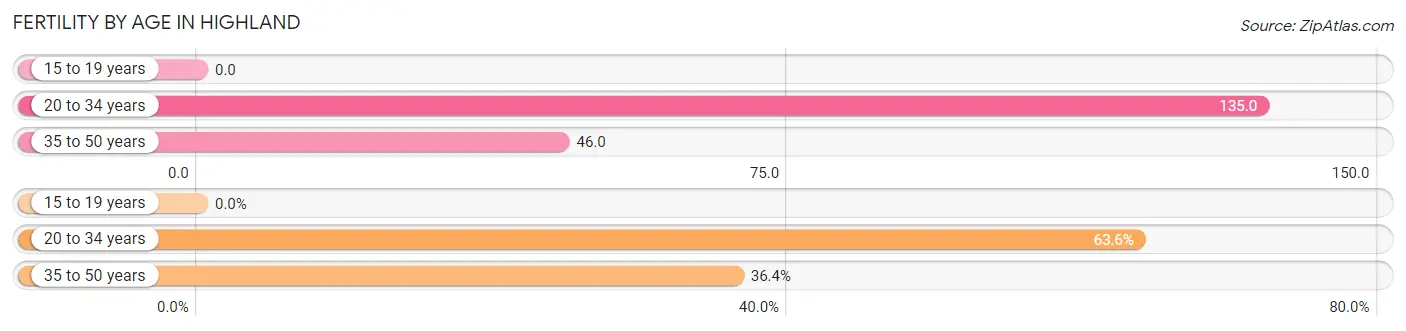
| Age Bracket | Women with Births | Births / 1,000 Women |
| 15 to 19 years | 0 (0.0%) | 0.0 |
| 20 to 34 years | 168 (63.6%) | 135.0 |
| 35 to 50 years | 96 (36.4%) | 46.0 |
| Total | 264 (100.0%) | 59.0 |
Fertility by Age by Marriage Status in Highland
90.9% of women with births (264) in Highland are married. The highest percentage of unmarried women with births falls into 20 to 34 years age bracket with 14.3% of them unmarried at the time of birth, while the lowest percentage of unmarried women with births belong to 35 to 50 years age bracket with 0.0% of them unmarried.
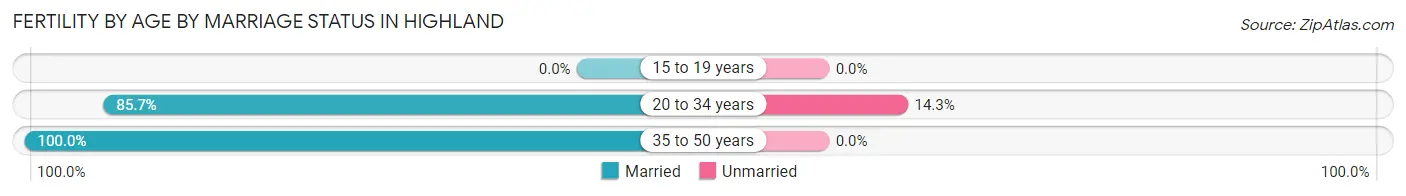
| Age Bracket | Married | Unmarried |
| 15 to 19 years | 0 (0.0%) | 0 (0.0%) |
| 20 to 34 years | 144 (85.7%) | 24 (14.3%) |
| 35 to 50 years | 96 (100.0%) | 0 (0.0%) |
| Total | 240 (90.9%) | 24 (9.1%) |
Fertility by Education in Highland
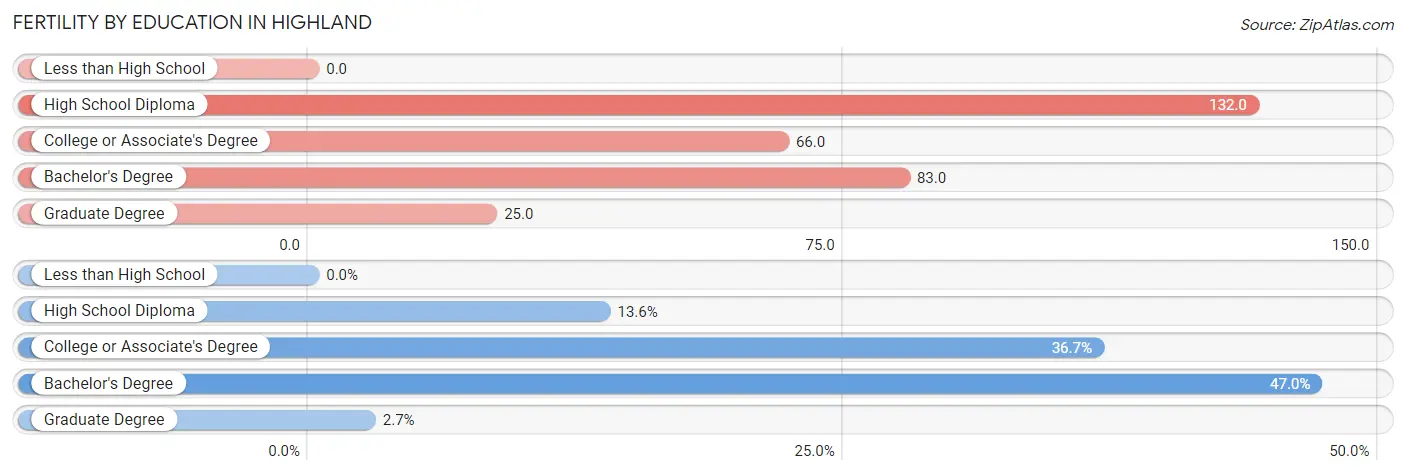
| Educational Attainment | Women with Births | Births / 1,000 Women |
| Less than High School | 0 (0.0%) | 0.0 |
| High School Diploma | 36 (13.6%) | 132.0 |
| College or Associate's Degree | 97 (36.7%) | 66.0 |
| Bachelor's Degree | 124 (47.0%) | 83.0 |
| Graduate Degree | 7 (2.6%) | 25.0 |
| Total | 264 (100.0%) | 59.0 |
Fertility by Education by Marriage Status in Highland
9.1% of women with births in Highland are unmarried. Women with the educational attainment of bachelor's degree are most likely to be married with 100.0% of them married at childbirth, while women with the educational attainment of high school diploma are least likely to be married with 41.7% of them unmarried at childbirth.
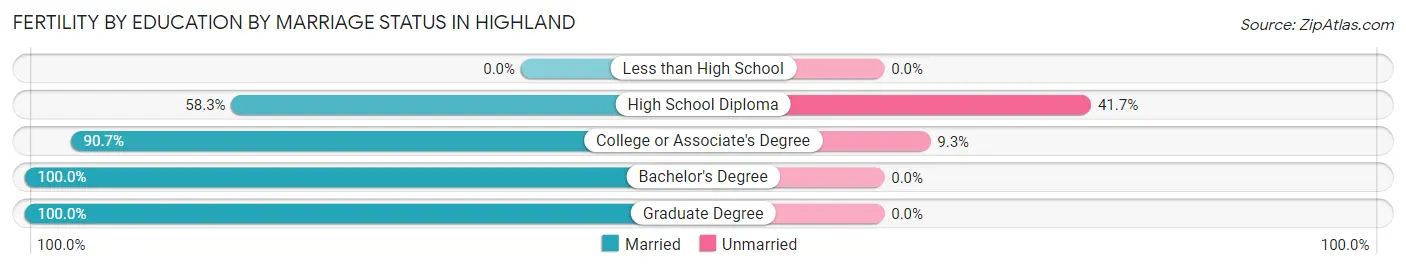
| Educational Attainment | Married | Unmarried |
| Less than High School | 0 (0.0%) | 0 (0.0%) |
| High School Diploma | 21 (58.3%) | 15 (41.7%) |
| College or Associate's Degree | 88 (90.7%) | 9 (9.3%) |
| Bachelor's Degree | 124 (100.0%) | 0 (0.0%) |
| Graduate Degree | 7 (100.0%) | 0 (0.0%) |
| Total | 240 (90.9%) | 24 (9.1%) |
Employment Characteristics in Highland
Employment by Class of Employer in Highland
Among the 8,224 employed individuals in Highland, private company employees (5,612 | 68.2%), self-employed (incorporated) (701 | 8.5%), and not-for-profit organizations (613 | 7.4%) make up the most common classes of employment.
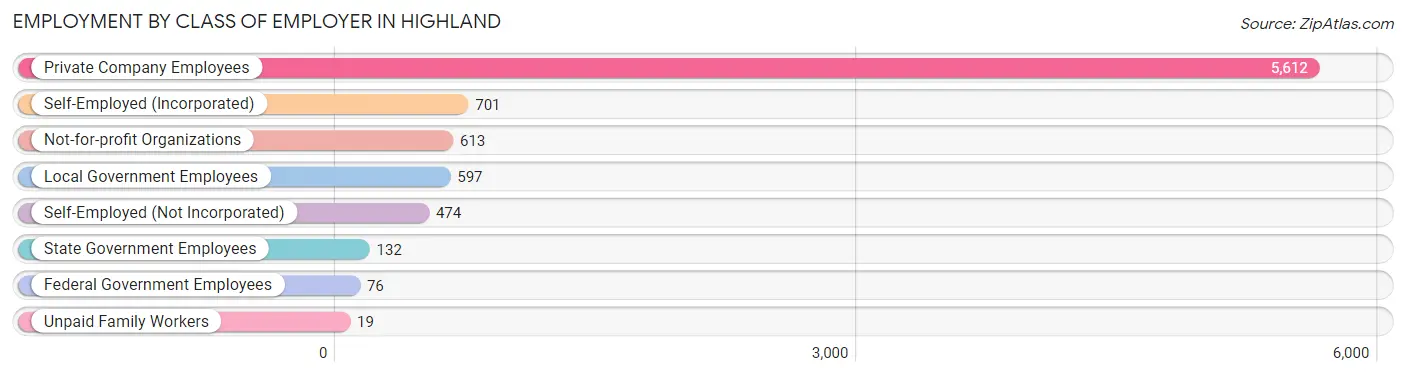
| Employer Class | # Employees | % Employees |
| Private Company Employees | 5,612 | 68.2% |
| Self-Employed (Incorporated) | 701 | 8.5% |
| Self-Employed (Not Incorporated) | 474 | 5.8% |
| Not-for-profit Organizations | 613 | 7.4% |
| Local Government Employees | 597 | 7.3% |
| State Government Employees | 132 | 1.6% |
| Federal Government Employees | 76 | 0.9% |
| Unpaid Family Workers | 19 | 0.2% |
| Total | 8,224 | 100.0% |
Employment Status by Age in Highland
According to the labor force statistics for Highland, out of the total population over 16 years of age (12,956), 66.5% or 8,616 individuals are in the labor force, with 2.8% or 241 of them unemployed. The age group with the highest labor force participation rate is 25 to 29 years, with 82.9% or 610 individuals in the labor force. Within the labor force, the 20 to 24 years age range has the highest percentage of unemployed individuals, with 7.2% or 70 of them being unemployed.
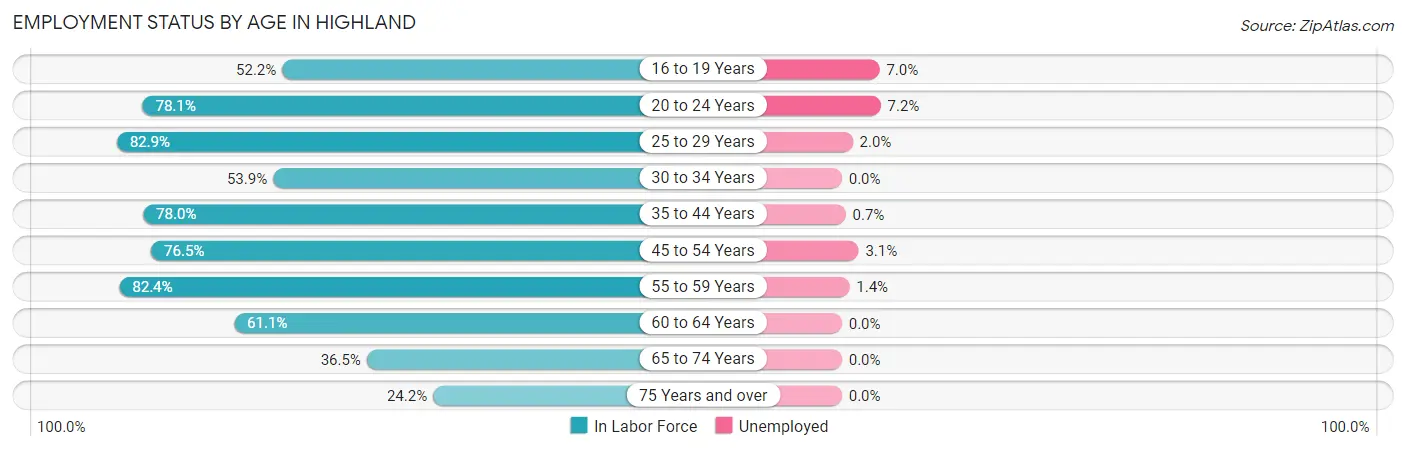
| Age Bracket | In Labor Force | Unemployed |
| 16 to 19 Years | 1,113 (52.2%) | 78 (7.0%) |
| 20 to 24 Years | 979 (78.1%) | 70 (7.2%) |
| 25 to 29 Years | 610 (82.9%) | 12 (2.0%) |
| 30 to 34 Years | 292 (53.9%) | 0 (0.0%) |
| 35 to 44 Years | 2,008 (78.0%) | 14 (0.7%) |
| 45 to 54 Years | 1,968 (76.5%) | 61 (3.1%) |
| 55 to 59 Years | 710 (82.4%) | 10 (1.4%) |
| 60 to 64 Years | 421 (61.1%) | 0 (0.0%) |
| 65 to 74 Years | 380 (36.5%) | 0 (0.0%) |
| 75 Years and over | 134 (24.2%) | 0 (0.0%) |
| Total | 8,616 (66.5%) | 241 (2.8%) |
Employment Status by Educational Attainment in Highland
According to labor force statistics for Highland, 75.3% of individuals (6,005) out of the total population between 25 and 64 years of age (7,975) are in the labor force, with 1.6% or 96 of them being unemployed. The group with the highest labor force participation rate are those with the educational attainment of bachelor's degree or higher, with 80.2% or 4,253 individuals in the labor force. Within the labor force, individuals with bachelor's degree or higher education have the highest percentage of unemployment, with 2.0% or 85 of them being unemployed.
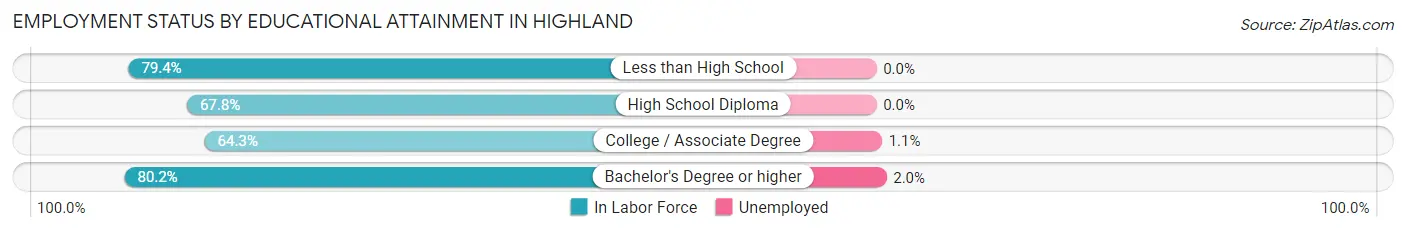
| Educational Attainment | In Labor Force | Unemployed |
| Less than High School | 81 (79.4%) | 0 (0.0%) |
| High School Diploma | 400 (67.8%) | 0 (0.0%) |
| College / Associate Degree | 1,273 (64.3%) | 22 (1.1%) |
| Bachelor's Degree or higher | 4,253 (80.2%) | 106 (2.0%) |
| Total | 6,005 (75.3%) | 128 (1.6%) |
Employment Occupations by Sex in Highland
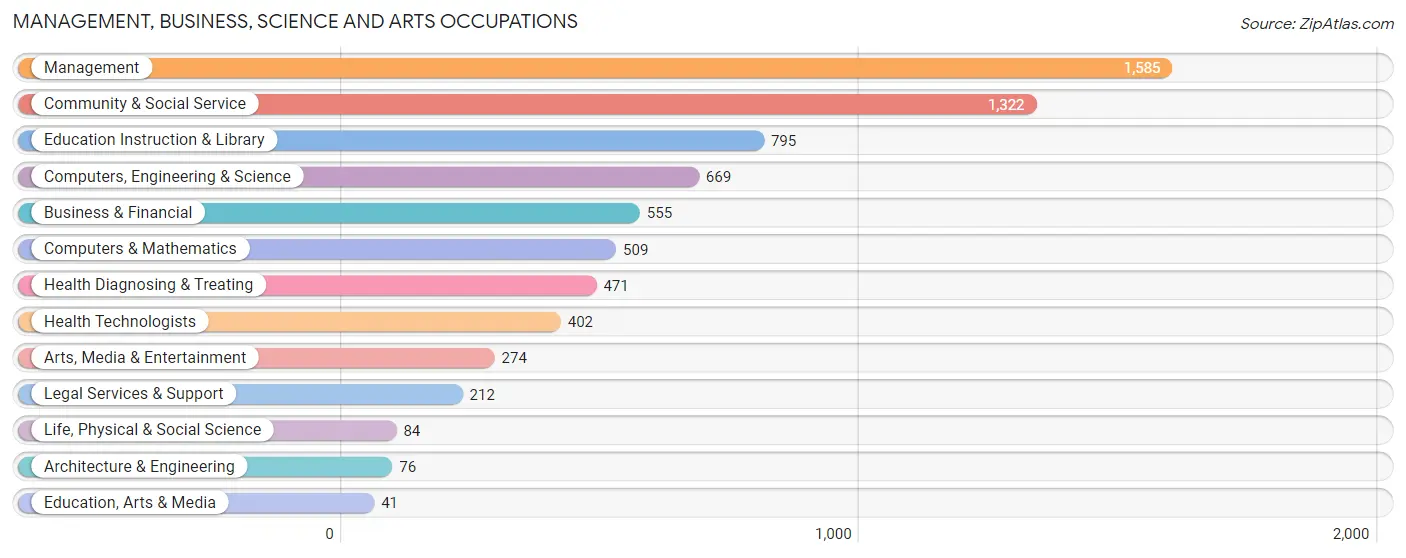
Management, Business, Science and Arts Occupations
The most common Management, Business, Science and Arts occupations in Highland are Management (1,585 | 19.0%), Community & Social Service (1,322 | 15.8%), Education Instruction & Library (795 | 9.5%), Computers, Engineering & Science (669 | 8.0%), and Business & Financial (555 | 6.6%).
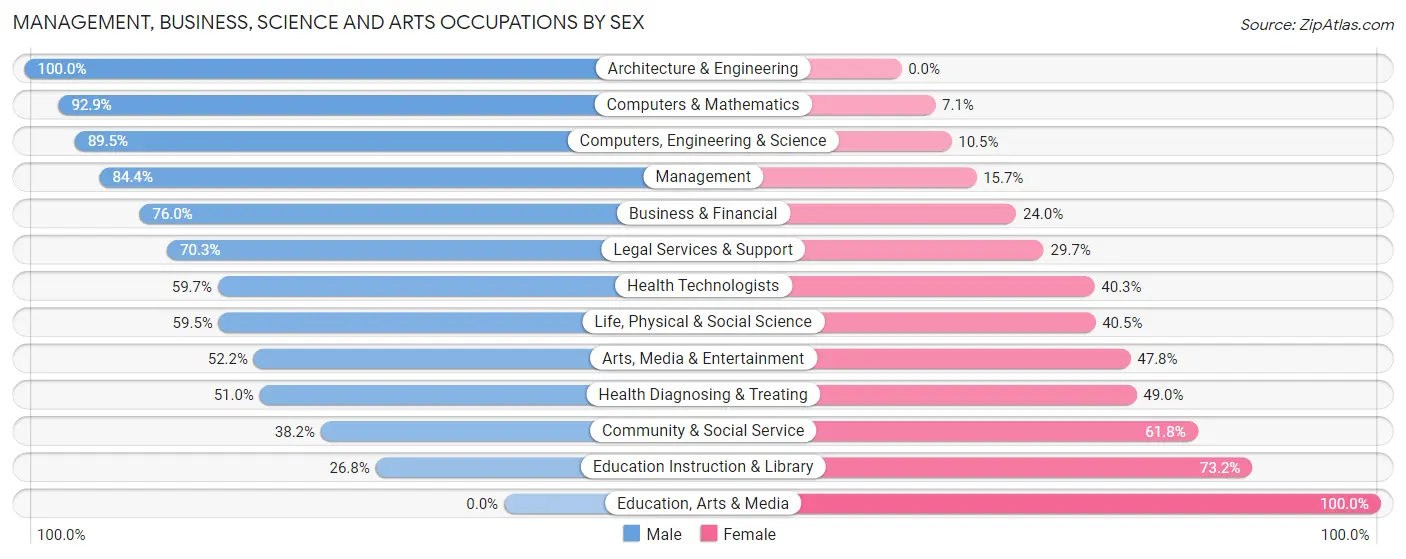
Management, Business, Science and Arts Occupations by Sex
Within the Management, Business, Science and Arts occupations in Highland, the most male-oriented occupations are Architecture & Engineering (100.0%), Computers & Mathematics (92.9%), and Computers, Engineering & Science (89.5%), while the most female-oriented occupations are Education, Arts & Media (100.0%), Education Instruction & Library (73.2%), and Community & Social Service (61.8%).
| Occupation | Male | Female |
| Management | 1,337 (84.4%) | 248 (15.7%) |
| Business & Financial | 422 (76.0%) | 133 (24.0%) |
| Computers, Engineering & Science | 599 (89.5%) | 70 (10.5%) |
| Computers & Mathematics | 473 (92.9%) | 36 (7.1%) |
| Architecture & Engineering | 76 (100.0%) | 0 (0.0%) |
| Life, Physical & Social Science | 50 (59.5%) | 34 (40.5%) |
| Community & Social Service | 505 (38.2%) | 817 (61.8%) |
| Education, Arts & Media | 0 (0.0%) | 41 (100.0%) |
| Legal Services & Support | 149 (70.3%) | 63 (29.7%) |
| Education Instruction & Library | 213 (26.8%) | 582 (73.2%) |
| Arts, Media & Entertainment | 143 (52.2%) | 131 (47.8%) |
| Health Diagnosing & Treating | 240 (51.0%) | 231 (49.0%) |
| Health Technologists | 240 (59.7%) | 162 (40.3%) |
| Total (Category) | 3,103 (67.4%) | 1,499 (32.6%) |
| Total (Overall) | 5,218 (62.4%) | 3,148 (37.6%) |
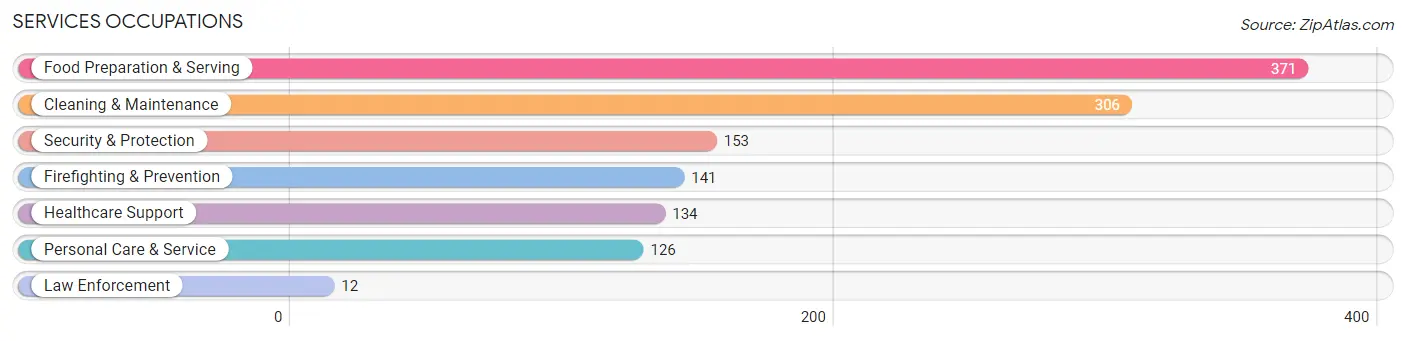
Services Occupations
The most common Services occupations in Highland are Food Preparation & Serving (371 | 4.4%), Cleaning & Maintenance (306 | 3.7%), Security & Protection (153 | 1.8%), Firefighting & Prevention (141 | 1.7%), and Healthcare Support (134 | 1.6%).
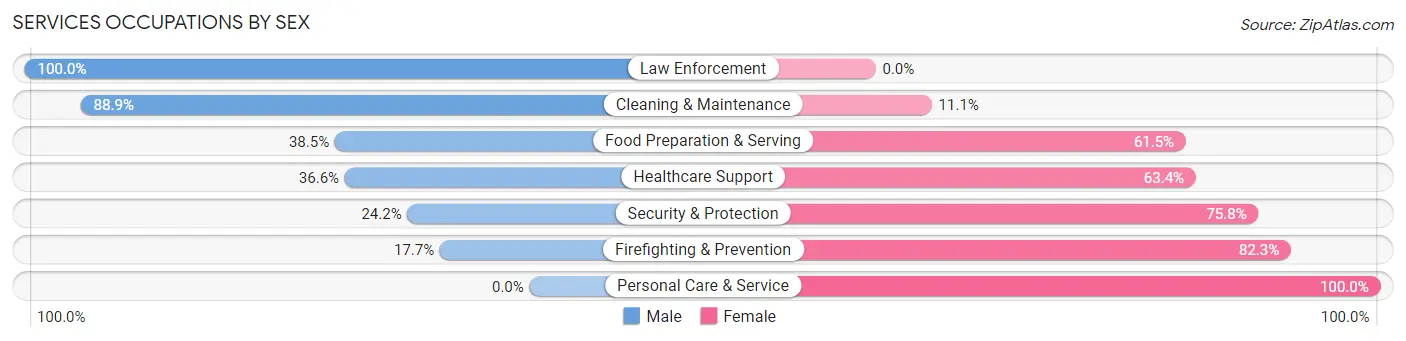
Services Occupations by Sex
Within the Services occupations in Highland, the most male-oriented occupations are Law Enforcement (100.0%), Cleaning & Maintenance (88.9%), and Food Preparation & Serving (38.5%), while the most female-oriented occupations are Personal Care & Service (100.0%), Firefighting & Prevention (82.3%), and Security & Protection (75.8%).
| Occupation | Male | Female |
| Healthcare Support | 49 (36.6%) | 85 (63.4%) |
| Security & Protection | 37 (24.2%) | 116 (75.8%) |
| Firefighting & Prevention | 25 (17.7%) | 116 (82.3%) |
| Law Enforcement | 12 (100.0%) | 0 (0.0%) |
| Food Preparation & Serving | 143 (38.5%) | 228 (61.5%) |
| Cleaning & Maintenance | 272 (88.9%) | 34 (11.1%) |
| Personal Care & Service | 0 (0.0%) | 126 (100.0%) |
| Total (Category) | 501 (46.0%) | 589 (54.0%) |
| Total (Overall) | 5,218 (62.4%) | 3,148 (37.6%) |
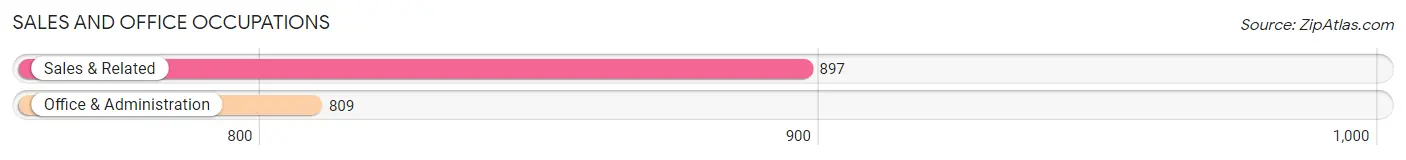
Sales and Office Occupations
The most common Sales and Office occupations in Highland are Sales & Related (897 | 10.7%), and Office & Administration (809 | 9.7%).
Sales and Office Occupations by Sex
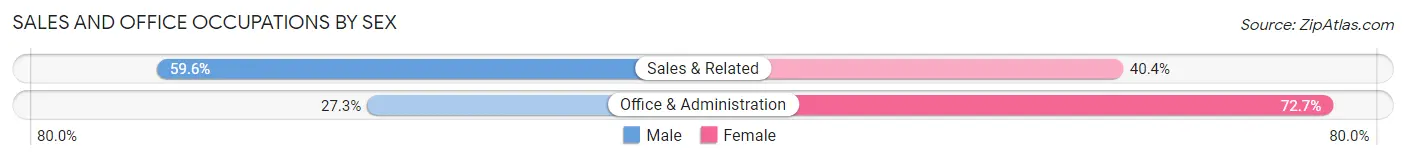
| Occupation | Male | Female |
| Sales & Related | 535 (59.6%) | 362 (40.4%) |
| Office & Administration | 221 (27.3%) | 588 (72.7%) |
| Total (Category) | 756 (44.3%) | 950 (55.7%) |
| Total (Overall) | 5,218 (62.4%) | 3,148 (37.6%) |
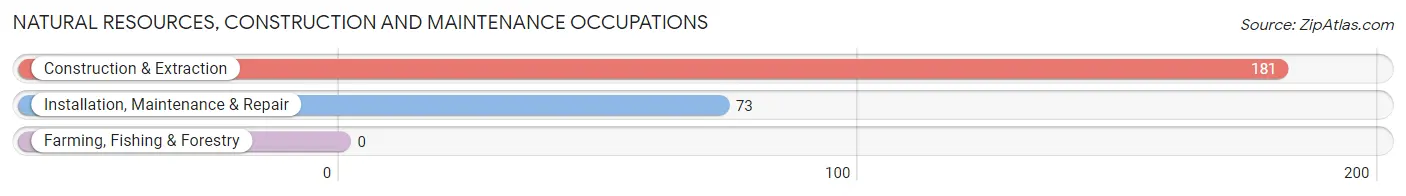
Natural Resources, Construction and Maintenance Occupations
The most common Natural Resources, Construction and Maintenance occupations in Highland are Construction & Extraction (181 | 2.2%), and Installation, Maintenance & Repair (73 | 0.9%).
Natural Resources, Construction and Maintenance Occupations by Sex
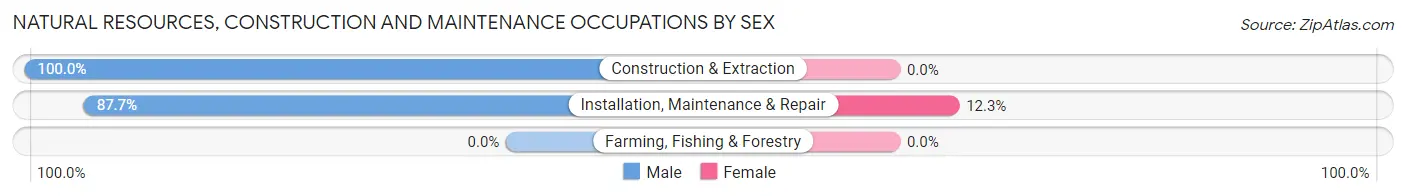
| Occupation | Male | Female |
| Farming, Fishing & Forestry | 0 (0.0%) | 0 (0.0%) |
| Construction & Extraction | 181 (100.0%) | 0 (0.0%) |
| Installation, Maintenance & Repair | 64 (87.7%) | 9 (12.3%) |
| Total (Category) | 245 (96.5%) | 9 (3.5%) |
| Total (Overall) | 5,218 (62.4%) | 3,148 (37.6%) |
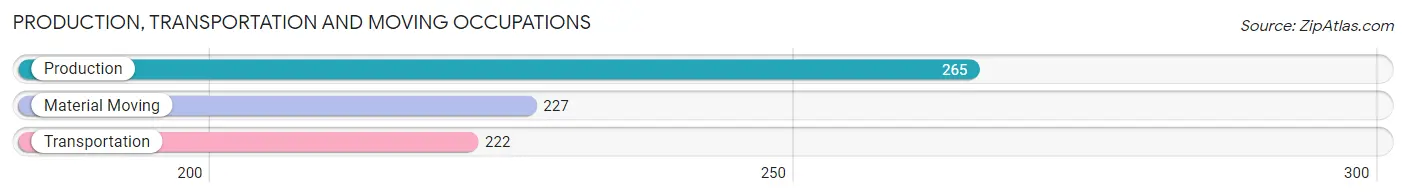
Production, Transportation and Moving Occupations
The most common Production, Transportation and Moving occupations in Highland are Production (265 | 3.2%), Material Moving (227 | 2.7%), and Transportation (222 | 2.6%).
Production, Transportation and Moving Occupations by Sex
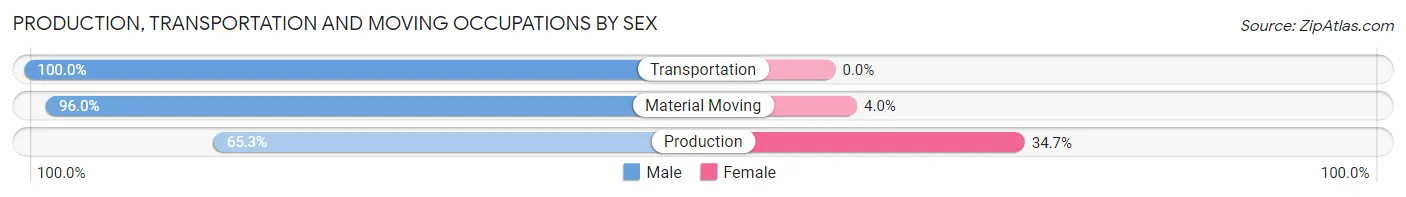
| Occupation | Male | Female |
| Production | 173 (65.3%) | 92 (34.7%) |
| Transportation | 222 (100.0%) | 0 (0.0%) |
| Material Moving | 218 (96.0%) | 9 (4.0%) |
| Total (Category) | 613 (85.9%) | 101 (14.1%) |
| Total (Overall) | 5,218 (62.4%) | 3,148 (37.6%) |
Employment Industries by Sex in Highland
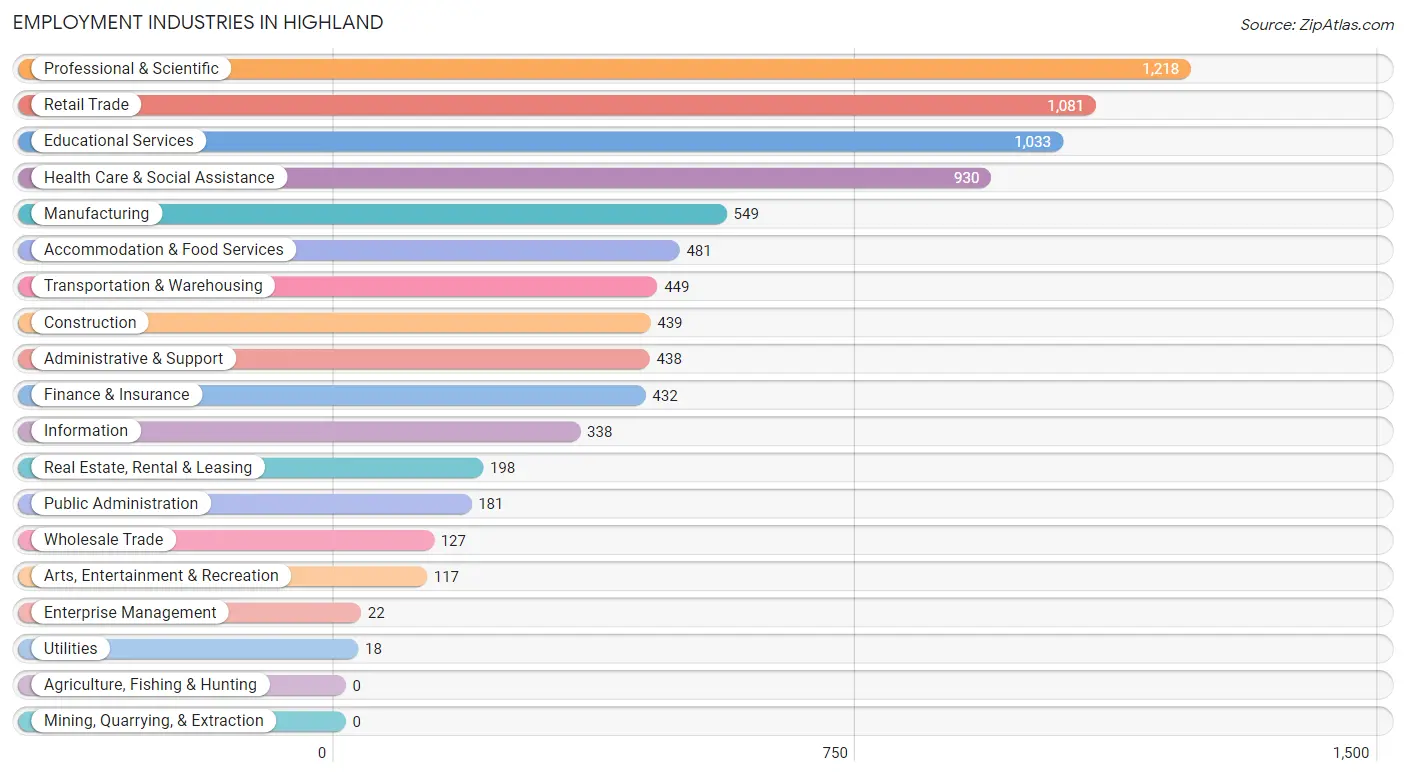
Employment Industries in Highland
The major employment industries in Highland include Professional & Scientific (1,218 | 14.6%), Retail Trade (1,081 | 12.9%), Educational Services (1,033 | 12.3%), Health Care & Social Assistance (930 | 11.1%), and Manufacturing (549 | 6.6%).
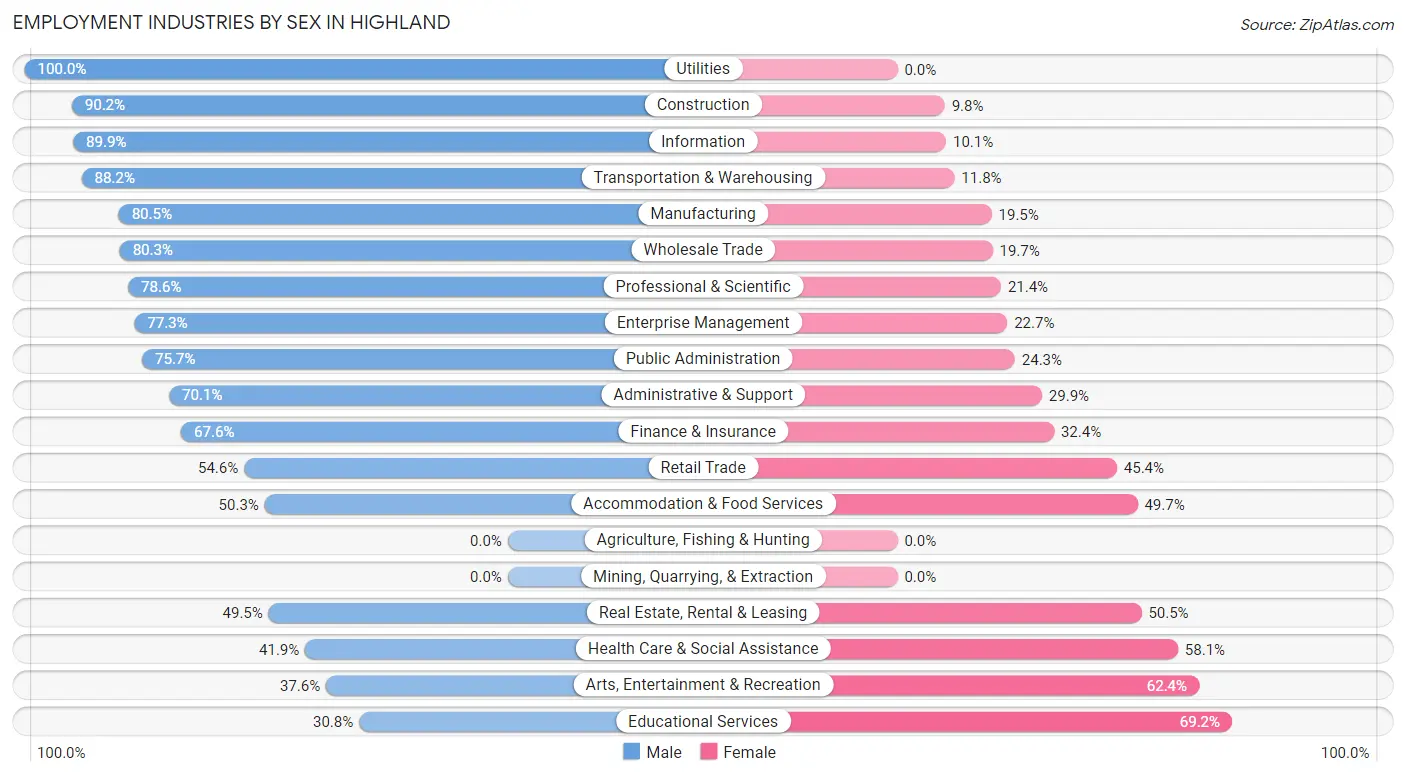
Employment Industries by Sex in Highland
The Highland industries that see more men than women are Utilities (100.0%), Construction (90.2%), and Information (89.9%), whereas the industries that tend to have a higher number of women are Educational Services (69.2%), Arts, Entertainment & Recreation (62.4%), and Health Care & Social Assistance (58.1%).
| Industry | Male | Female |
| Agriculture, Fishing & Hunting | 0 (0.0%) | 0 (0.0%) |
| Mining, Quarrying, & Extraction | 0 (0.0%) | 0 (0.0%) |
| Construction | 396 (90.2%) | 43 (9.8%) |
| Manufacturing | 442 (80.5%) | 107 (19.5%) |
| Wholesale Trade | 102 (80.3%) | 25 (19.7%) |
| Retail Trade | 590 (54.6%) | 491 (45.4%) |
| Transportation & Warehousing | 396 (88.2%) | 53 (11.8%) |
| Utilities | 18 (100.0%) | 0 (0.0%) |
| Information | 304 (89.9%) | 34 (10.1%) |
| Finance & Insurance | 292 (67.6%) | 140 (32.4%) |
| Real Estate, Rental & Leasing | 98 (49.5%) | 100 (50.5%) |
| Professional & Scientific | 957 (78.6%) | 261 (21.4%) |
| Enterprise Management | 17 (77.3%) | 5 (22.7%) |
| Administrative & Support | 307 (70.1%) | 131 (29.9%) |
| Educational Services | 318 (30.8%) | 715 (69.2%) |
| Health Care & Social Assistance | 390 (41.9%) | 540 (58.1%) |
| Arts, Entertainment & Recreation | 44 (37.6%) | 73 (62.4%) |
| Accommodation & Food Services | 242 (50.3%) | 239 (49.7%) |
| Public Administration | 137 (75.7%) | 44 (24.3%) |
| Total | 5,218 (62.4%) | 3,148 (37.6%) |
Education in Highland
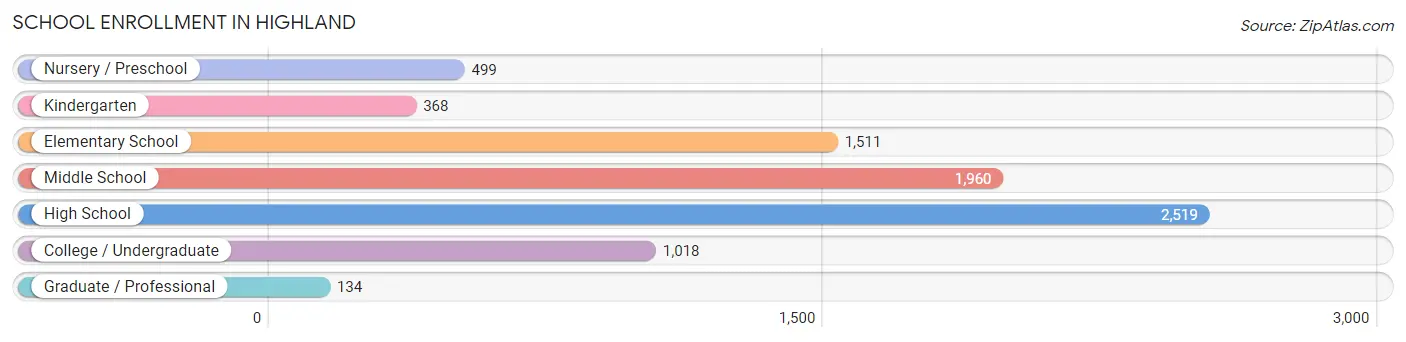
School Enrollment in Highland
The most common levels of schooling among the 8,009 students in Highland are high school (2,519 | 31.5%), middle school (1,960 | 24.5%), and elementary school (1,511 | 18.9%).
| School Level | # Students | % Students |
| Nursery / Preschool | 499 | 6.2% |
| Kindergarten | 368 | 4.6% |
| Elementary School | 1,511 | 18.9% |
| Middle School | 1,960 | 24.5% |
| High School | 2,519 | 31.5% |
| College / Undergraduate | 1,018 | 12.7% |
| Graduate / Professional | 134 | 1.7% |
| Total | 8,009 | 100.0% |
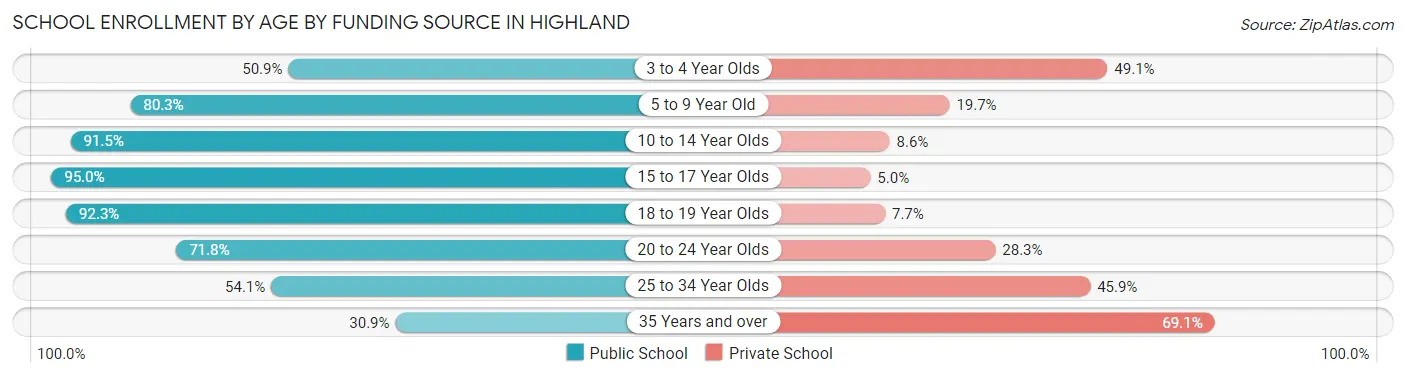
School Enrollment by Age by Funding Source in Highland
Out of a total of 8,009 students who are enrolled in schools in Highland, 1,257 (15.7%) attend a private institution, while the remaining 6,752 (84.3%) are enrolled in public schools. The age group of 35 years and over has the highest likelihood of being enrolled in private schools, with 154 (69.1% in the age bracket) enrolled. Conversely, the age group of 15 to 17 year olds has the lowest likelihood of being enrolled in a private school, with 1,623 (95.0% in the age bracket) attending a public institution.
| Age Bracket | Public School | Private School |
| 3 to 4 Year Olds | 174 (50.9%) | 168 (49.1%) |
| 5 to 9 Year Old | 1,537 (80.3%) | 377 (19.7%) |
| 10 to 14 Year Olds | 2,290 (91.4%) | 214 (8.6%) |
| 15 to 17 Year Olds | 1,623 (95.0%) | 85 (5.0%) |
| 18 to 19 Year Olds | 587 (92.3%) | 49 (7.7%) |
| 20 to 24 Year Olds | 419 (71.8%) | 165 (28.2%) |
| 25 to 34 Year Olds | 53 (54.1%) | 45 (45.9%) |
| 35 Years and over | 69 (30.9%) | 154 (69.1%) |
| Total | 6,752 (84.3%) | 1,257 (15.7%) |
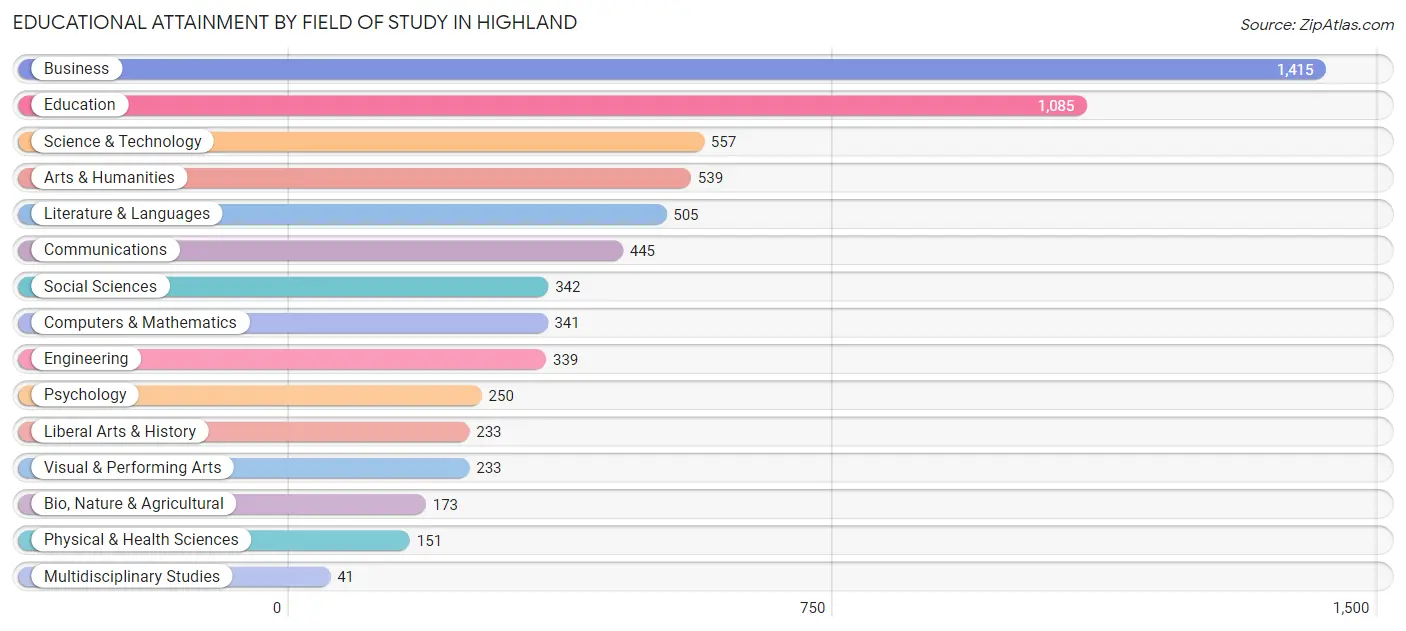
Educational Attainment by Field of Study in Highland
Business (1,415 | 21.3%), education (1,085 | 16.3%), science & technology (557 | 8.4%), arts & humanities (539 | 8.1%), and literature & languages (505 | 7.6%) are the most common fields of study among 6,649 individuals in Highland who have obtained a bachelor's degree or higher.
| Field of Study | # Graduates | % Graduates |
| Computers & Mathematics | 341 | 5.1% |
| Bio, Nature & Agricultural | 173 | 2.6% |
| Physical & Health Sciences | 151 | 2.3% |
| Psychology | 250 | 3.8% |
| Social Sciences | 342 | 5.1% |
| Engineering | 339 | 5.1% |
| Multidisciplinary Studies | 41 | 0.6% |
| Science & Technology | 557 | 8.4% |
| Business | 1,415 | 21.3% |
| Education | 1,085 | 16.3% |
| Literature & Languages | 505 | 7.6% |
| Liberal Arts & History | 233 | 3.5% |
| Visual & Performing Arts | 233 | 3.5% |
| Communications | 445 | 6.7% |
| Arts & Humanities | 539 | 8.1% |
| Total | 6,649 | 100.0% |
Transportation & Commute in Highland
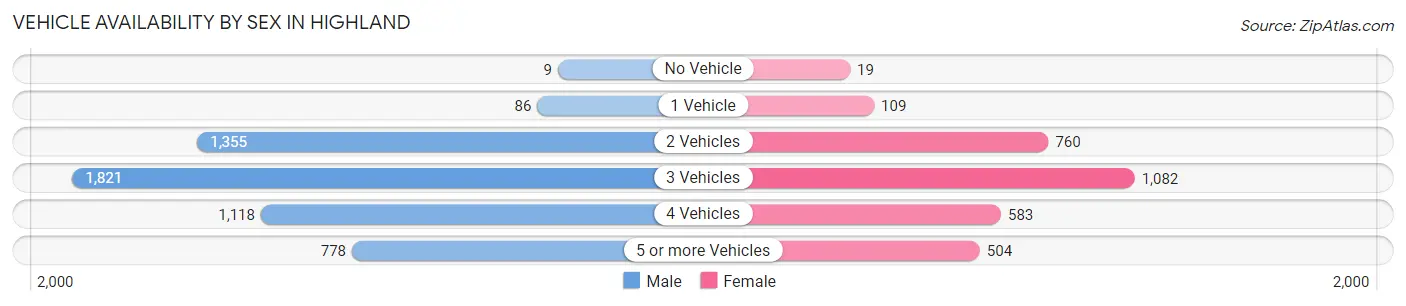
Vehicle Availability by Sex in Highland
The most prevalent vehicle ownership categories in Highland are males with 3 vehicles (1,821, accounting for 35.2%) and females with 3 vehicles (1,082, making up 59.6%).
| Vehicles Available | Male | Female |
| No Vehicle | 9 (0.2%) | 19 (0.6%) |
| 1 Vehicle | 86 (1.7%) | 109 (3.6%) |
| 2 Vehicles | 1,355 (26.2%) | 760 (24.9%) |
| 3 Vehicles | 1,821 (35.2%) | 1,082 (35.4%) |
| 4 Vehicles | 1,118 (21.6%) | 583 (19.1%) |
| 5 or more Vehicles | 778 (15.1%) | 504 (16.5%) |
| Total | 5,167 (100.0%) | 3,057 (100.0%) |
Commute Time in Highland
The most frequently occuring commute durations in Highland are 10 to 14 minutes (1,084 commuters, 16.7%), 15 to 19 minutes (1,005 commuters, 15.5%), and 30 to 34 minutes (919 commuters, 14.2%).
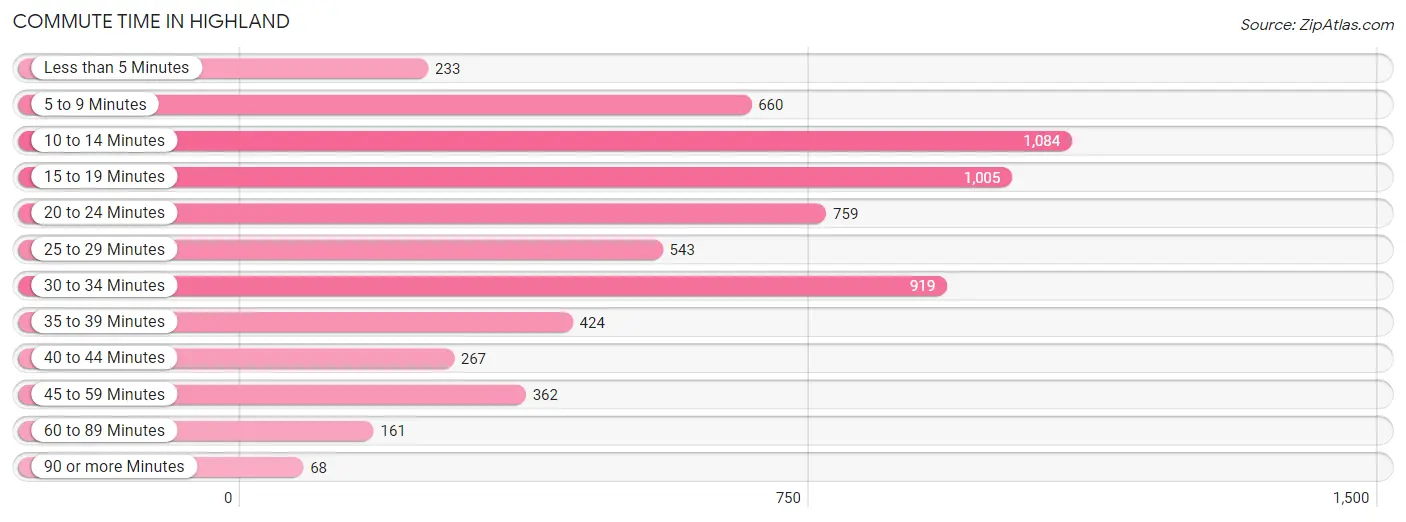
| Commute Time | # Commuters | % Commuters |
| Less than 5 Minutes | 233 | 3.6% |
| 5 to 9 Minutes | 660 | 10.2% |
| 10 to 14 Minutes | 1,084 | 16.7% |
| 15 to 19 Minutes | 1,005 | 15.5% |
| 20 to 24 Minutes | 759 | 11.7% |
| 25 to 29 Minutes | 543 | 8.4% |
| 30 to 34 Minutes | 919 | 14.2% |
| 35 to 39 Minutes | 424 | 6.5% |
| 40 to 44 Minutes | 267 | 4.1% |
| 45 to 59 Minutes | 362 | 5.6% |
| 60 to 89 Minutes | 161 | 2.5% |
| 90 or more Minutes | 68 | 1.1% |
Commute Time by Sex in Highland
The most common commute times in Highland are 10 to 14 minutes (629 commuters, 15.1%) for males and 20 to 24 minutes (470 commuters, 20.3%) for females.
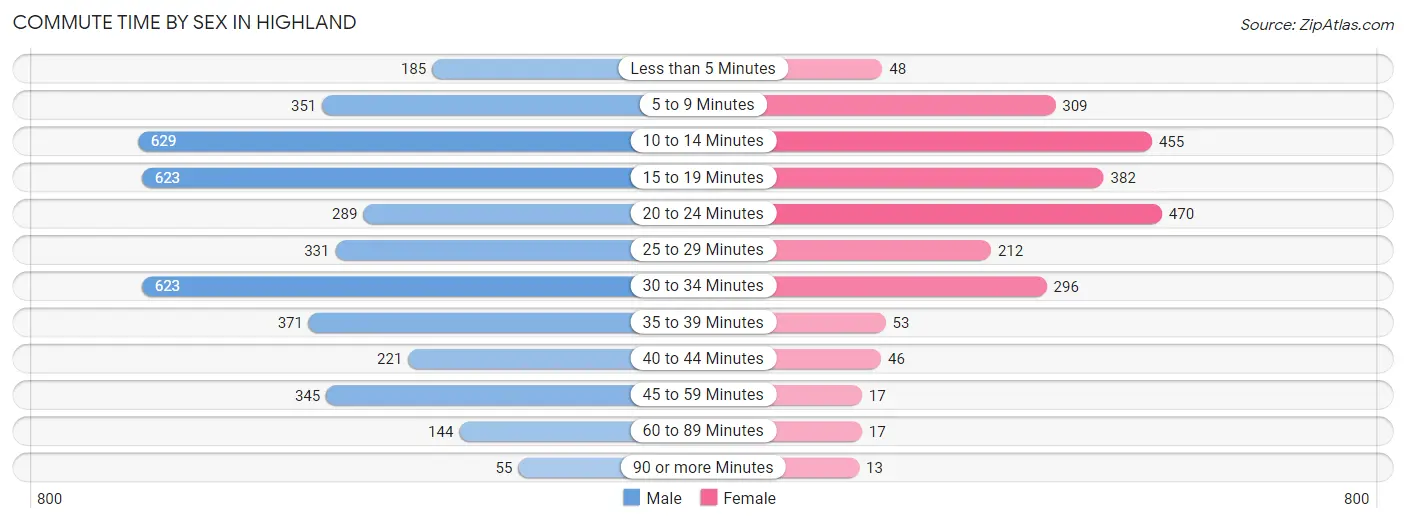
| Commute Time | Male | Female |
| Less than 5 Minutes | 185 (4.4%) | 48 (2.1%) |
| 5 to 9 Minutes | 351 (8.4%) | 309 (13.3%) |
| 10 to 14 Minutes | 629 (15.1%) | 455 (19.6%) |
| 15 to 19 Minutes | 623 (14.9%) | 382 (16.5%) |
| 20 to 24 Minutes | 289 (6.9%) | 470 (20.3%) |
| 25 to 29 Minutes | 331 (7.9%) | 212 (9.1%) |
| 30 to 34 Minutes | 623 (14.9%) | 296 (12.8%) |
| 35 to 39 Minutes | 371 (8.9%) | 53 (2.3%) |
| 40 to 44 Minutes | 221 (5.3%) | 46 (2.0%) |
| 45 to 59 Minutes | 345 (8.3%) | 17 (0.7%) |
| 60 to 89 Minutes | 144 (3.5%) | 17 (0.7%) |
| 90 or more Minutes | 55 (1.3%) | 13 (0.6%) |
Time of Departure to Work by Sex in Highland
The most frequent times of departure to work in Highland are 8:00 AM to 8:29 AM (673, 16.2%) for males and 9:00 AM to 9:59 AM (389, 16.8%) for females.
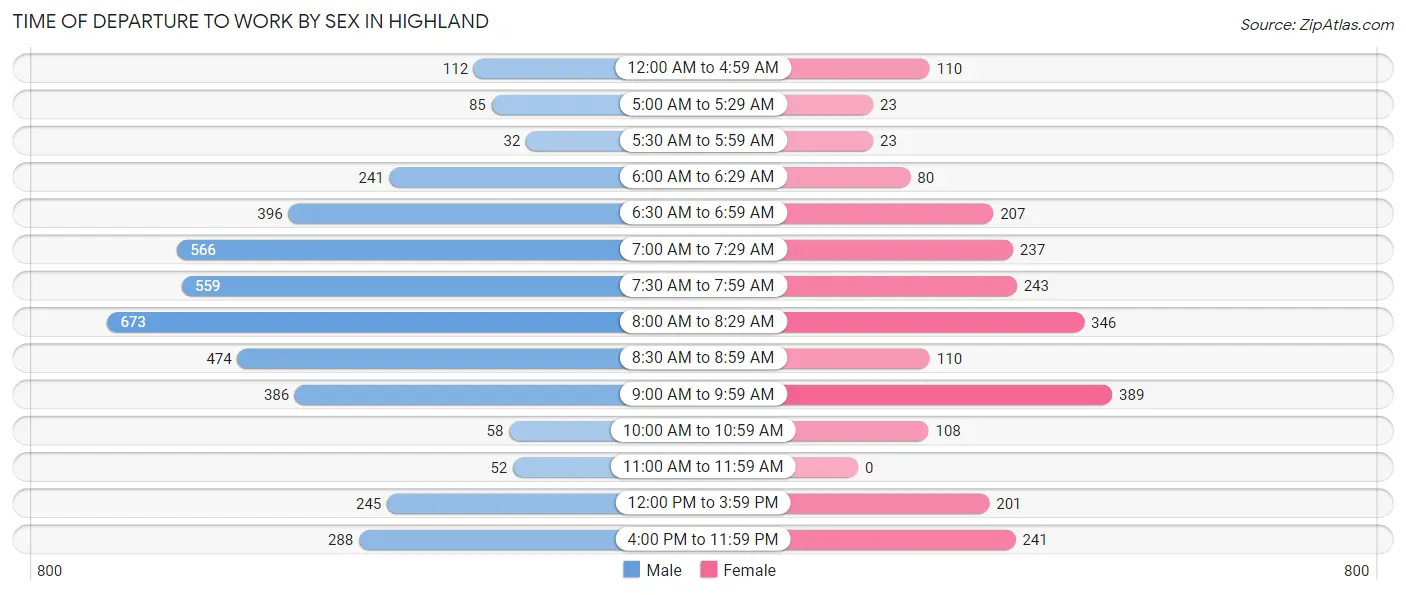
| Time of Departure | Male | Female |
| 12:00 AM to 4:59 AM | 112 (2.7%) | 110 (4.8%) |
| 5:00 AM to 5:29 AM | 85 (2.0%) | 23 (1.0%) |
| 5:30 AM to 5:59 AM | 32 (0.8%) | 23 (1.0%) |
| 6:00 AM to 6:29 AM | 241 (5.8%) | 80 (3.5%) |
| 6:30 AM to 6:59 AM | 396 (9.5%) | 207 (8.9%) |
| 7:00 AM to 7:29 AM | 566 (13.6%) | 237 (10.2%) |
| 7:30 AM to 7:59 AM | 559 (13.4%) | 243 (10.5%) |
| 8:00 AM to 8:29 AM | 673 (16.2%) | 346 (14.9%) |
| 8:30 AM to 8:59 AM | 474 (11.4%) | 110 (4.8%) |
| 9:00 AM to 9:59 AM | 386 (9.3%) | 389 (16.8%) |
| 10:00 AM to 10:59 AM | 58 (1.4%) | 108 (4.7%) |
| 11:00 AM to 11:59 AM | 52 (1.3%) | 0 (0.0%) |
| 12:00 PM to 3:59 PM | 245 (5.9%) | 201 (8.7%) |
| 4:00 PM to 11:59 PM | 288 (6.9%) | 241 (10.4%) |
| Total | 4,167 (100.0%) | 2,318 (100.0%) |
Housing Occupancy in Highland
Occupancy by Ownership in Highland
Of the total 4,606 dwellings in Highland, owner-occupied units account for 4,196 (91.1%), while renter-occupied units make up 410 (8.9%).
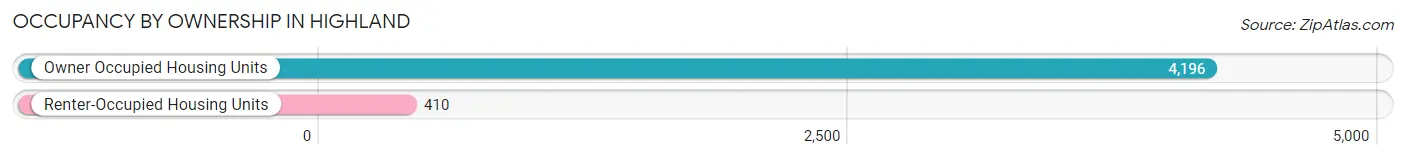
| Occupancy | # Housing Units | % Housing Units |
| Owner Occupied Housing Units | 4,196 | 91.1% |
| Renter-Occupied Housing Units | 410 | 8.9% |
| Total Occupied Housing Units | 4,606 | 100.0% |
Occupancy by Household Size in Highland
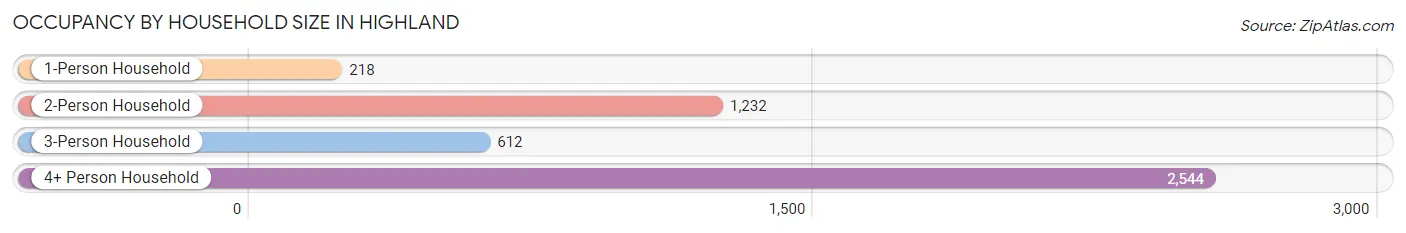
| Household Size | # Housing Units | % Housing Units |
| 1-Person Household | 218 | 4.7% |
| 2-Person Household | 1,232 | 26.8% |
| 3-Person Household | 612 | 13.3% |
| 4+ Person Household | 2,544 | 55.2% |
| Total Housing Units | 4,606 | 100.0% |
Occupancy by Ownership by Household Size in Highland
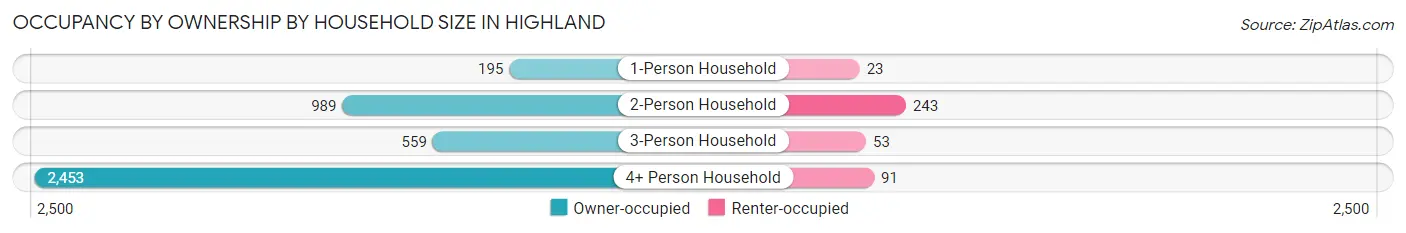
| Household Size | Owner-occupied | Renter-occupied |
| 1-Person Household | 195 (89.4%) | 23 (10.5%) |
| 2-Person Household | 989 (80.3%) | 243 (19.7%) |
| 3-Person Household | 559 (91.3%) | 53 (8.7%) |
| 4+ Person Household | 2,453 (96.4%) | 91 (3.6%) |
| Total Housing Units | 4,196 (91.1%) | 410 (8.9%) |
Occupancy by Educational Attainment in Highland
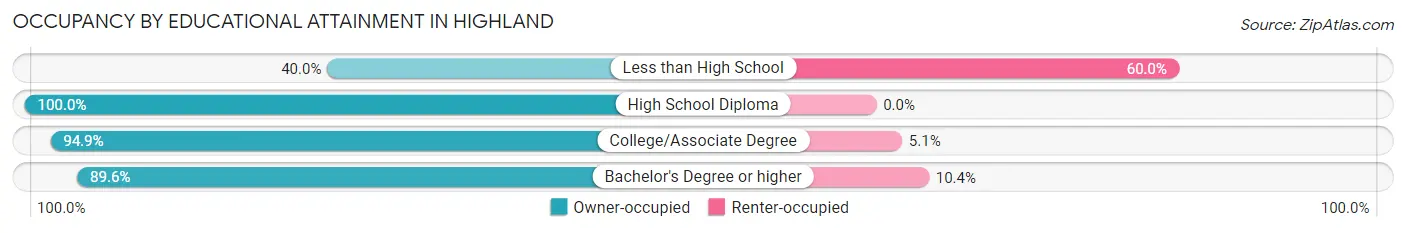
| Household Size | Owner-occupied | Renter-occupied |
| Less than High School | 8 (40.0%) | 12 (60.0%) |
| High School Diploma | 211 (100.0%) | 0 (0.0%) |
| College/Associate Degree | 1,041 (94.9%) | 56 (5.1%) |
| Bachelor's Degree or higher | 2,936 (89.6%) | 342 (10.4%) |
Occupancy by Age of Householder in Highland
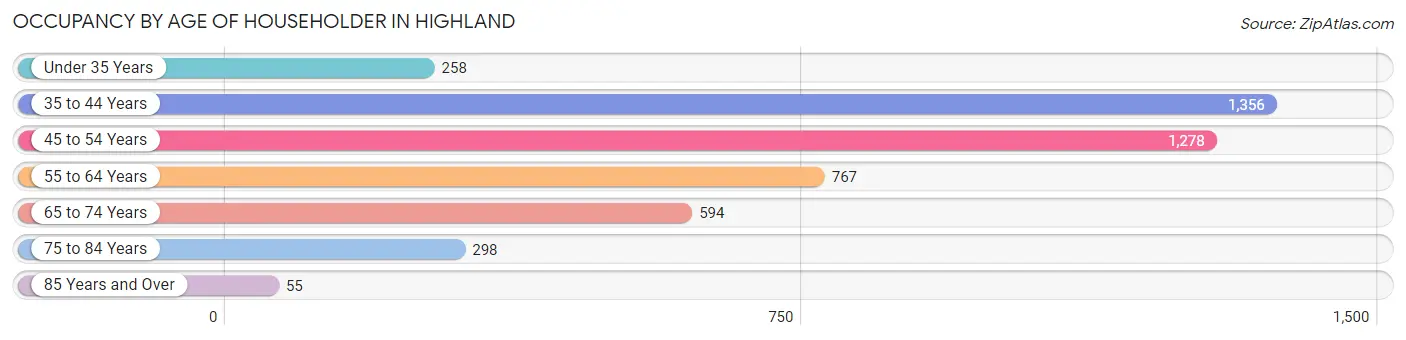
| Age Bracket | # Households | % Households |
| Under 35 Years | 258 | 5.6% |
| 35 to 44 Years | 1,356 | 29.4% |
| 45 to 54 Years | 1,278 | 27.8% |
| 55 to 64 Years | 767 | 16.7% |
| 65 to 74 Years | 594 | 12.9% |
| 75 to 84 Years | 298 | 6.5% |
| 85 Years and Over | 55 | 1.2% |
| Total | 4,606 | 100.0% |
Housing Finances in Highland
Median Income by Occupancy in Highland
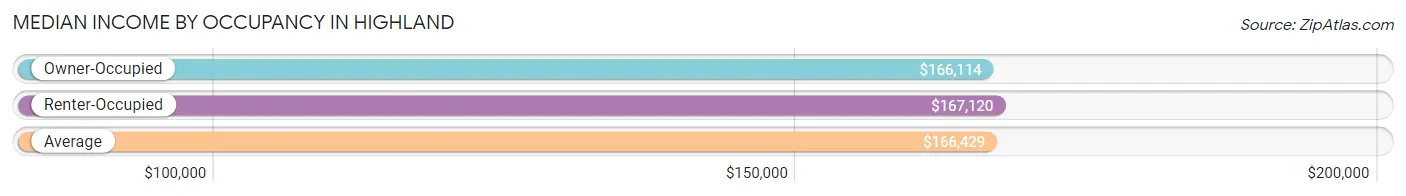
| Occupancy Type | # Households | Median Income |
| Owner-Occupied | 4,196 (91.1%) | $166,114 |
| Renter-Occupied | 410 (8.9%) | $167,120 |
| Average | 4,606 (100.0%) | $166,429 |
Occupancy by Householder Income Bracket in Highland
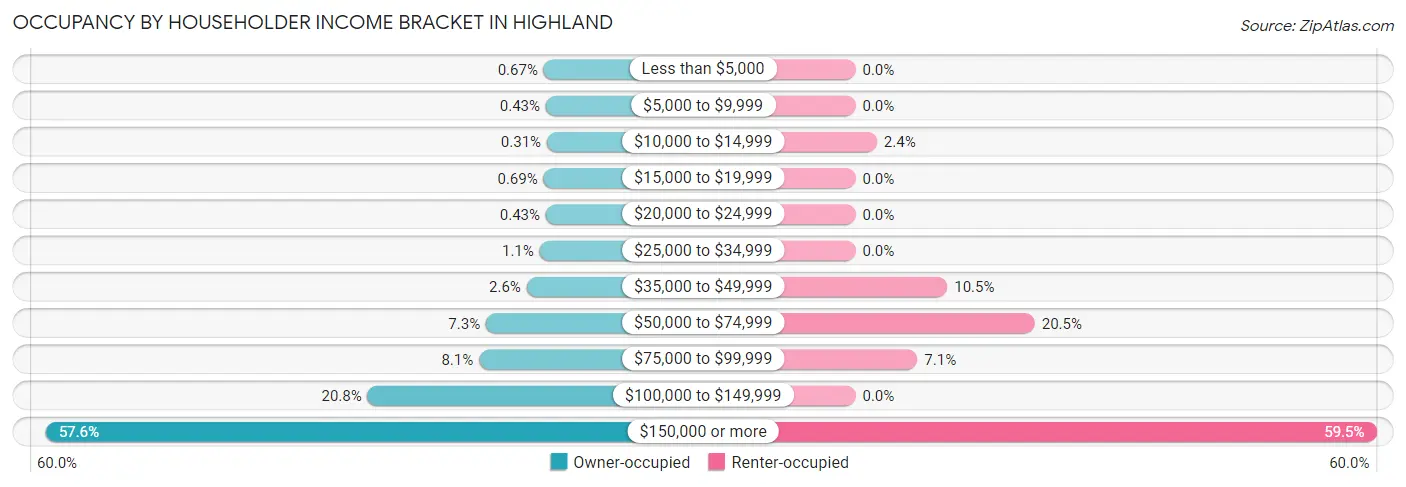
| Income Bracket | Owner-occupied | Renter-occupied |
| Less than $5,000 | 28 (0.7%) | 0 (0.0%) |
| $5,000 to $9,999 | 18 (0.4%) | 0 (0.0%) |
| $10,000 to $14,999 | 13 (0.3%) | 10 (2.4%) |
| $15,000 to $19,999 | 29 (0.7%) | 0 (0.0%) |
| $20,000 to $24,999 | 18 (0.4%) | 0 (0.0%) |
| $25,000 to $34,999 | 48 (1.1%) | 0 (0.0%) |
| $35,000 to $49,999 | 110 (2.6%) | 43 (10.5%) |
| $50,000 to $74,999 | 305 (7.3%) | 84 (20.5%) |
| $75,000 to $99,999 | 338 (8.1%) | 29 (7.1%) |
| $100,000 to $149,999 | 873 (20.8%) | 0 (0.0%) |
| $150,000 or more | 2,416 (57.6%) | 244 (59.5%) |
| Total | 4,196 (100.0%) | 410 (100.0%) |
Monthly Housing Cost Tiers in Highland
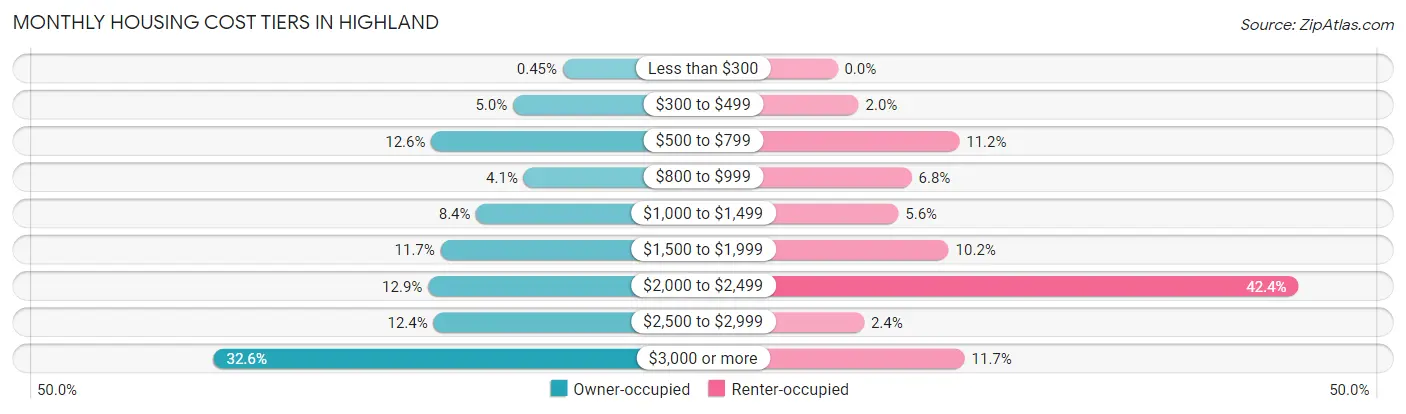
| Monthly Cost | Owner-occupied | Renter-occupied |
| Less than $300 | 19 (0.4%) | 0 (0.0%) |
| $300 to $499 | 211 (5.0%) | 8 (1.9%) |
| $500 to $799 | 527 (12.6%) | 46 (11.2%) |
| $800 to $999 | 170 (4.1%) | 28 (6.8%) |
| $1,000 to $1,499 | 353 (8.4%) | 23 (5.6%) |
| $1,500 to $1,999 | 491 (11.7%) | 42 (10.2%) |
| $2,000 to $2,499 | 539 (12.9%) | 174 (42.4%) |
| $2,500 to $2,999 | 518 (12.3%) | 10 (2.4%) |
| $3,000 or more | 1,368 (32.6%) | 48 (11.7%) |
| Total | 4,196 (100.0%) | 410 (100.0%) |
Physical Housing Characteristics in Highland
Housing Structures in Highland
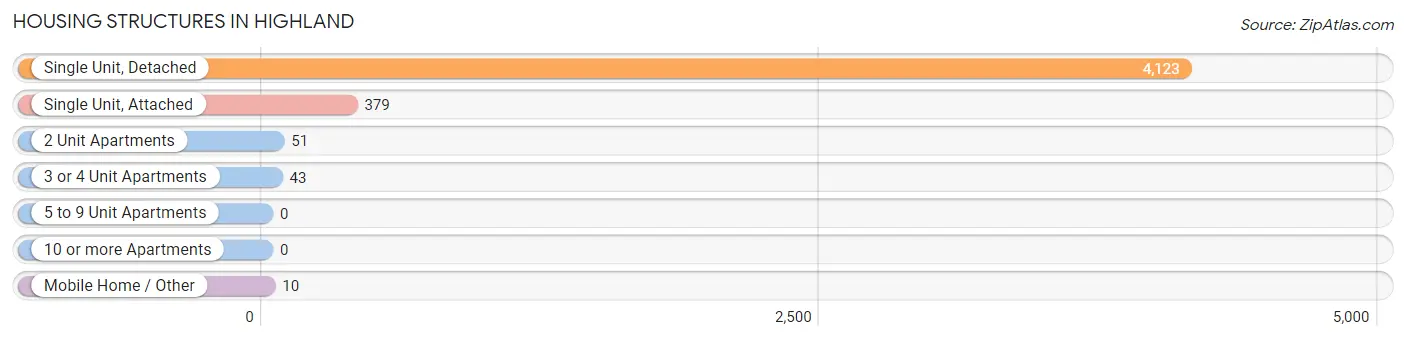
| Structure Type | # Housing Units | % Housing Units |
| Single Unit, Detached | 4,123 | 89.5% |
| Single Unit, Attached | 379 | 8.2% |
| 2 Unit Apartments | 51 | 1.1% |
| 3 or 4 Unit Apartments | 43 | 0.9% |
| 5 to 9 Unit Apartments | 0 | 0.0% |
| 10 or more Apartments | 0 | 0.0% |
| Mobile Home / Other | 10 | 0.2% |
| Total | 4,606 | 100.0% |
Housing Structures by Occupancy in Highland
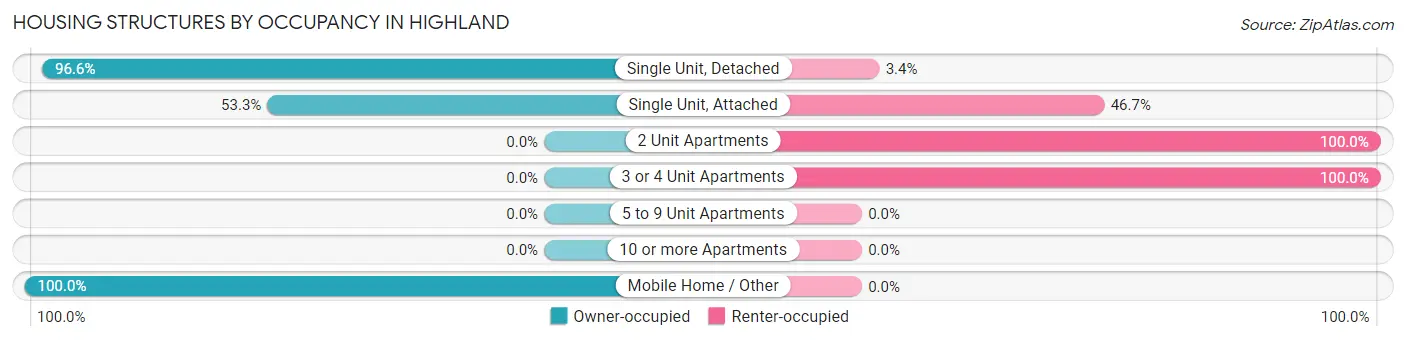
| Structure Type | Owner-occupied | Renter-occupied |
| Single Unit, Detached | 3,984 (96.6%) | 139 (3.4%) |
| Single Unit, Attached | 202 (53.3%) | 177 (46.7%) |
| 2 Unit Apartments | 0 (0.0%) | 51 (100.0%) |
| 3 or 4 Unit Apartments | 0 (0.0%) | 43 (100.0%) |
| 5 to 9 Unit Apartments | 0 (0.0%) | 0 (0.0%) |
| 10 or more Apartments | 0 (0.0%) | 0 (0.0%) |
| Mobile Home / Other | 10 (100.0%) | 0 (0.0%) |
| Total | 4,196 (91.1%) | 410 (8.9%) |
Housing Structures by Number of Rooms in Highland
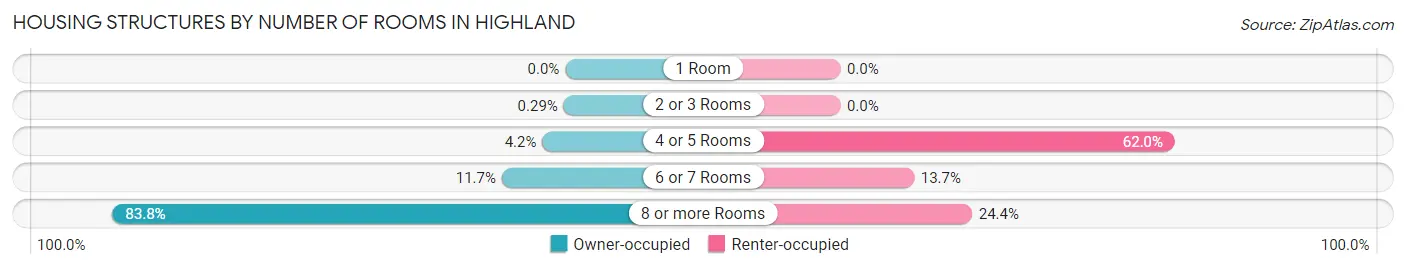
| Number of Rooms | Owner-occupied | Renter-occupied |
| 1 Room | 0 (0.0%) | 0 (0.0%) |
| 2 or 3 Rooms | 12 (0.3%) | 0 (0.0%) |
| 4 or 5 Rooms | 178 (4.2%) | 254 (62.0%) |
| 6 or 7 Rooms | 492 (11.7%) | 56 (13.7%) |
| 8 or more Rooms | 3,514 (83.8%) | 100 (24.4%) |
| Total | 4,196 (100.0%) | 410 (100.0%) |
Housing Structure by Heating Type in Highland
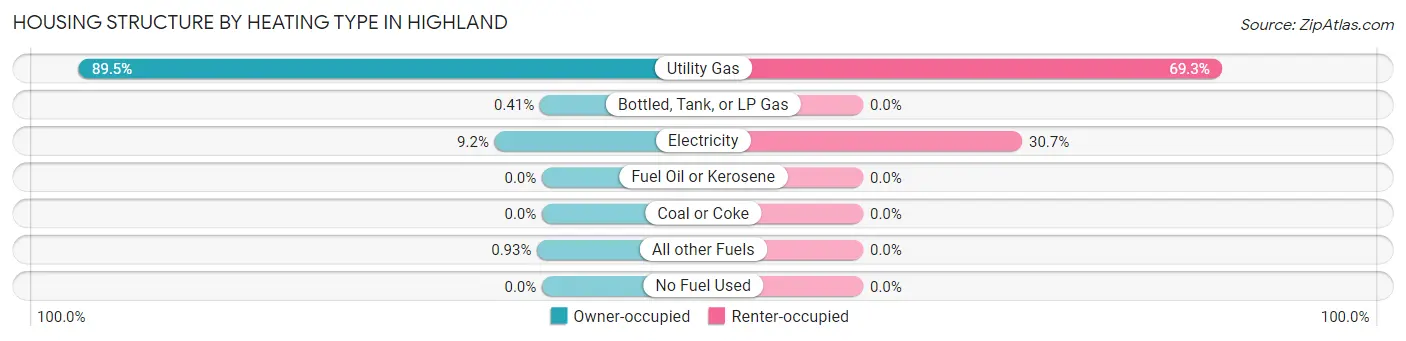
| Heating Type | Owner-occupied | Renter-occupied |
| Utility Gas | 3,756 (89.5%) | 284 (69.3%) |
| Bottled, Tank, or LP Gas | 17 (0.4%) | 0 (0.0%) |
| Electricity | 384 (9.1%) | 126 (30.7%) |
| Fuel Oil or Kerosene | 0 (0.0%) | 0 (0.0%) |
| Coal or Coke | 0 (0.0%) | 0 (0.0%) |
| All other Fuels | 39 (0.9%) | 0 (0.0%) |
| No Fuel Used | 0 (0.0%) | 0 (0.0%) |
| Total | 4,196 (100.0%) | 410 (100.0%) |
Household Vehicle Usage in Highland
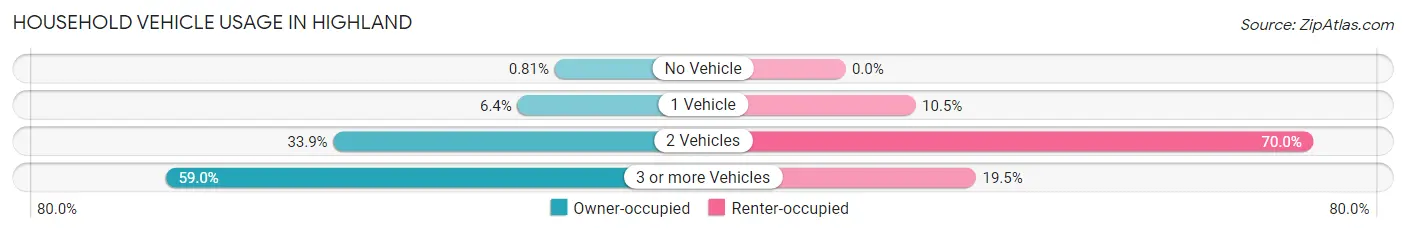
| Vehicles per Household | Owner-occupied | Renter-occupied |
| No Vehicle | 34 (0.8%) | 0 (0.0%) |
| 1 Vehicle | 267 (6.4%) | 43 (10.5%) |
| 2 Vehicles | 1,421 (33.9%) | 287 (70.0%) |
| 3 or more Vehicles | 2,474 (59.0%) | 80 (19.5%) |
| Total | 4,196 (100.0%) | 410 (100.0%) |
Real Estate & Mortgages in Highland
Real Estate and Mortgage Overview in Highland
| Characteristic | Without Mortgage | With Mortgage |
| Housing Units | 1,056 | 3,140 |
| Median Property Value | $766,300 | $742,900 |
| Median Household Income | $130,714 | $1,927 |
| Monthly Housing Costs | $686 | $1,361 |
| Real Estate Taxes | $3,293 | $61 |
Property Value by Mortgage Status in Highland
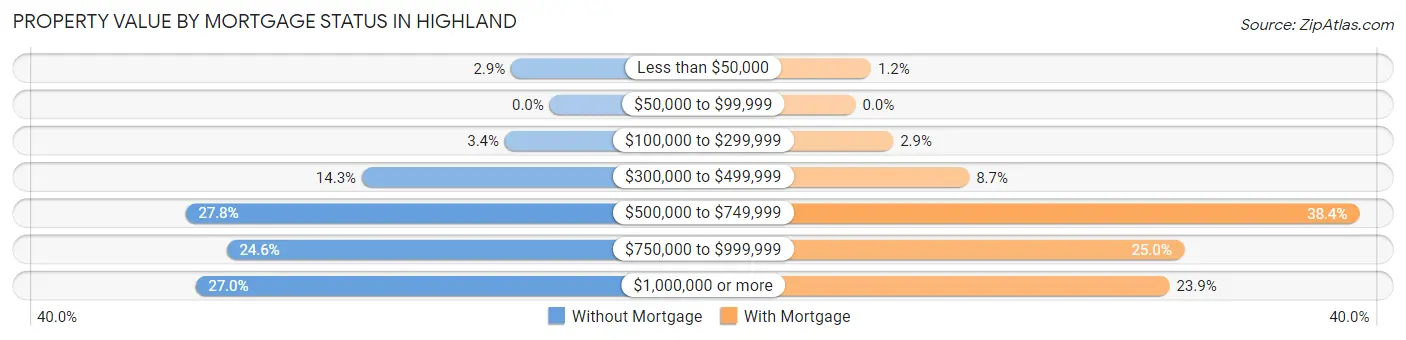
| Property Value | Without Mortgage | With Mortgage |
| Less than $50,000 | 31 (2.9%) | 37 (1.2%) |
| $50,000 to $99,999 | 0 (0.0%) | 0 (0.0%) |
| $100,000 to $299,999 | 36 (3.4%) | 90 (2.9%) |
| $300,000 to $499,999 | 151 (14.3%) | 272 (8.7%) |
| $500,000 to $749,999 | 293 (27.8%) | 1,205 (38.4%) |
| $750,000 to $999,999 | 260 (24.6%) | 785 (25.0%) |
| $1,000,000 or more | 285 (27.0%) | 751 (23.9%) |
| Total | 1,056 (100.0%) | 3,140 (100.0%) |
Household Income by Mortgage Status in Highland
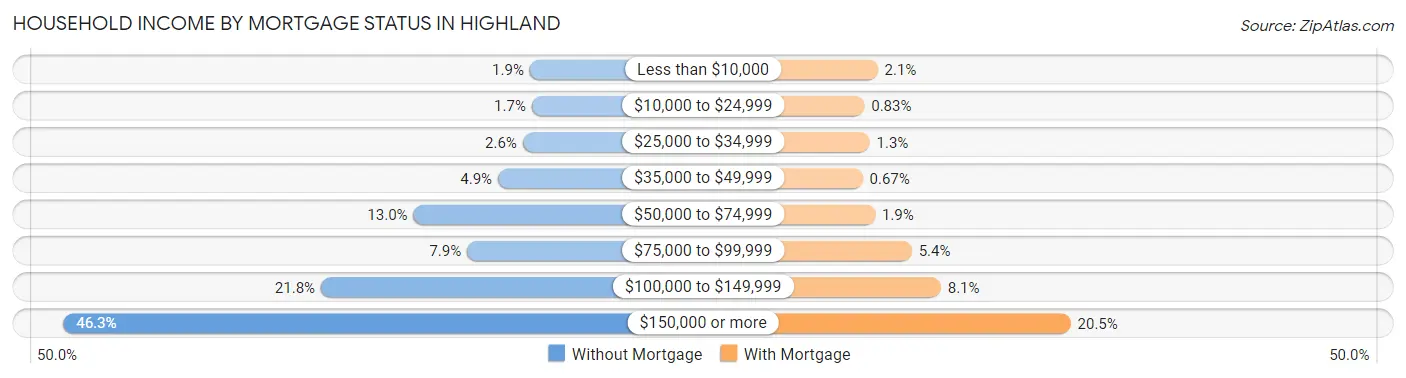
| Household Income | Without Mortgage | With Mortgage |
| Less than $10,000 | 20 (1.9%) | 66 (2.1%) |
| $10,000 to $24,999 | 18 (1.7%) | 26 (0.8%) |
| $25,000 to $34,999 | 27 (2.6%) | 42 (1.3%) |
| $35,000 to $49,999 | 52 (4.9%) | 21 (0.7%) |
| $50,000 to $74,999 | 137 (13.0%) | 58 (1.8%) |
| $75,000 to $99,999 | 83 (7.9%) | 168 (5.3%) |
| $100,000 to $149,999 | 230 (21.8%) | 255 (8.1%) |
| $150,000 or more | 489 (46.3%) | 643 (20.5%) |
| Total | 1,056 (100.0%) | 3,140 (100.0%) |
Property Value to Household Income Ratio in Highland
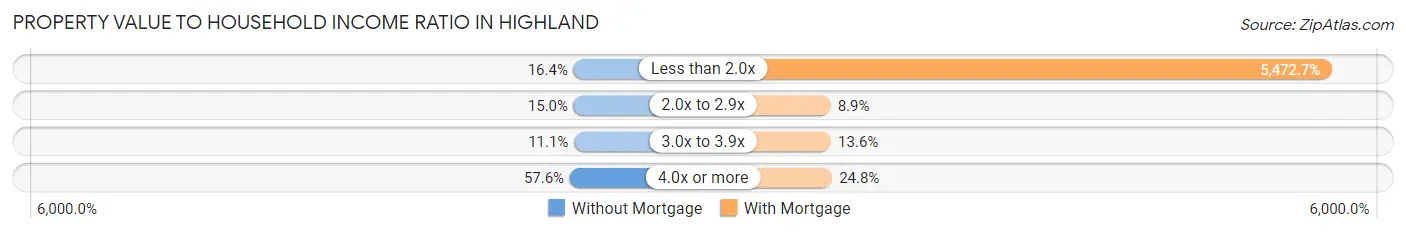
| Value-to-Income Ratio | Without Mortgage | With Mortgage |
| Less than 2.0x | 173 (16.4%) | 171,842 (5,472.7%) |
| 2.0x to 2.9x | 158 (15.0%) | 280 (8.9%) |
| 3.0x to 3.9x | 117 (11.1%) | 426 (13.6%) |
| 4.0x or more | 608 (57.6%) | 778 (24.8%) |
| Total | 1,056 (100.0%) | 3,140 (100.0%) |
Real Estate Taxes by Mortgage Status in Highland
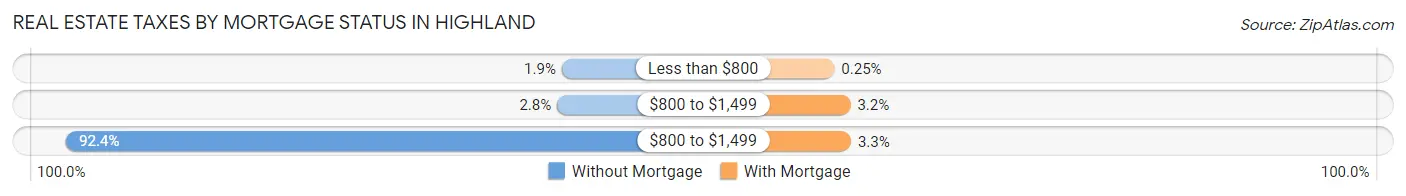
| Property Taxes | Without Mortgage | With Mortgage |
| Less than $800 | 20 (1.9%) | 8 (0.3%) |
| $800 to $1,499 | 29 (2.8%) | 100 (3.2%) |
| $800 to $1,499 | 976 (92.4%) | 103 (3.3%) |
| Total | 1,056 (100.0%) | 3,140 (100.0%) |
Health & Disability in Highland
Health Insurance Coverage by Age in Highland
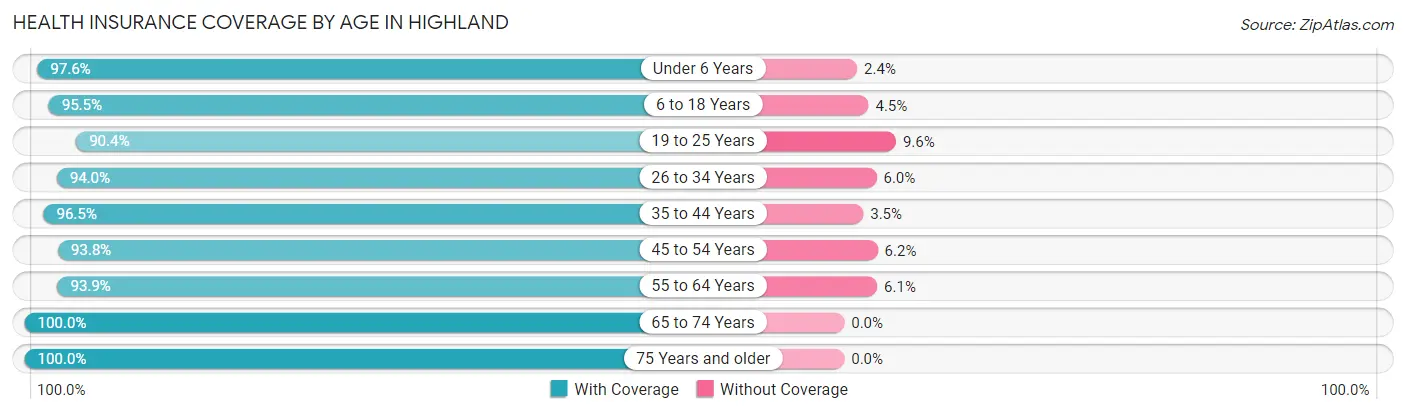
| Age Bracket | With Coverage | Without Coverage |
| Under 6 Years | 1,669 (97.6%) | 41 (2.4%) |
| 6 to 18 Years | 6,083 (95.5%) | 288 (4.5%) |
| 19 to 25 Years | 1,574 (90.4%) | 168 (9.6%) |
| 26 to 34 Years | 1,080 (94.0%) | 69 (6.0%) |
| 35 to 44 Years | 2,483 (96.5%) | 91 (3.5%) |
| 45 to 54 Years | 2,412 (93.8%) | 160 (6.2%) |
| 55 to 64 Years | 1,456 (93.9%) | 95 (6.1%) |
| 65 to 74 Years | 1,040 (100.0%) | 0 (0.0%) |
| 75 Years and older | 541 (100.0%) | 0 (0.0%) |
| Total | 18,338 (95.3%) | 912 (4.7%) |
Health Insurance Coverage by Citizenship Status in Highland
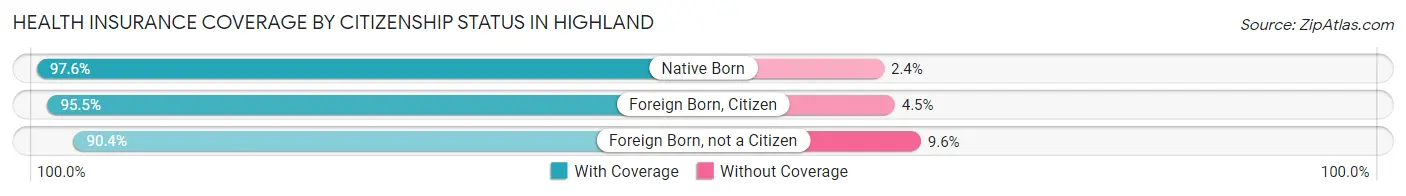
| Citizenship Status | With Coverage | Without Coverage |
| Native Born | 1,669 (97.6%) | 41 (2.4%) |
| Foreign Born, Citizen | 6,083 (95.5%) | 288 (4.5%) |
| Foreign Born, not a Citizen | 1,574 (90.4%) | 168 (9.6%) |
Health Insurance Coverage by Household Income in Highland
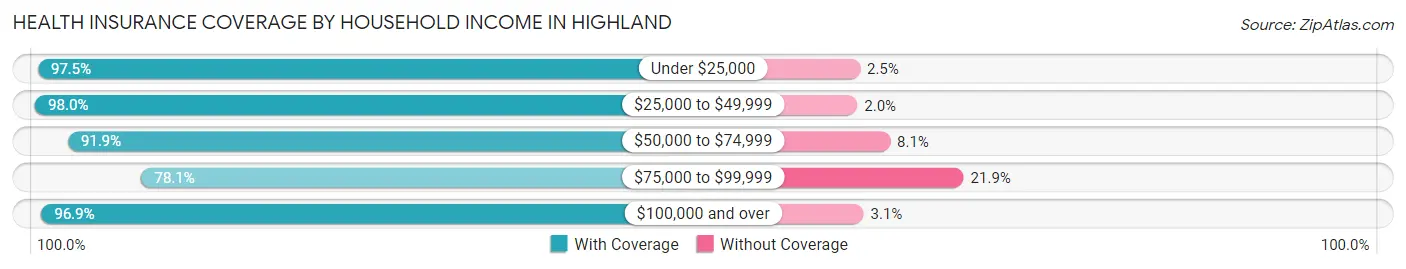
| Household Income | With Coverage | Without Coverage |
| Under $25,000 | 354 (97.5%) | 9 (2.5%) |
| $25,000 to $49,999 | 445 (98.0%) | 9 (2.0%) |
| $50,000 to $74,999 | 1,008 (91.9%) | 89 (8.1%) |
| $75,000 to $99,999 | 1,085 (78.1%) | 304 (21.9%) |
| $100,000 and over | 15,446 (96.9%) | 501 (3.1%) |
Public vs Private Health Insurance Coverage by Age in Highland
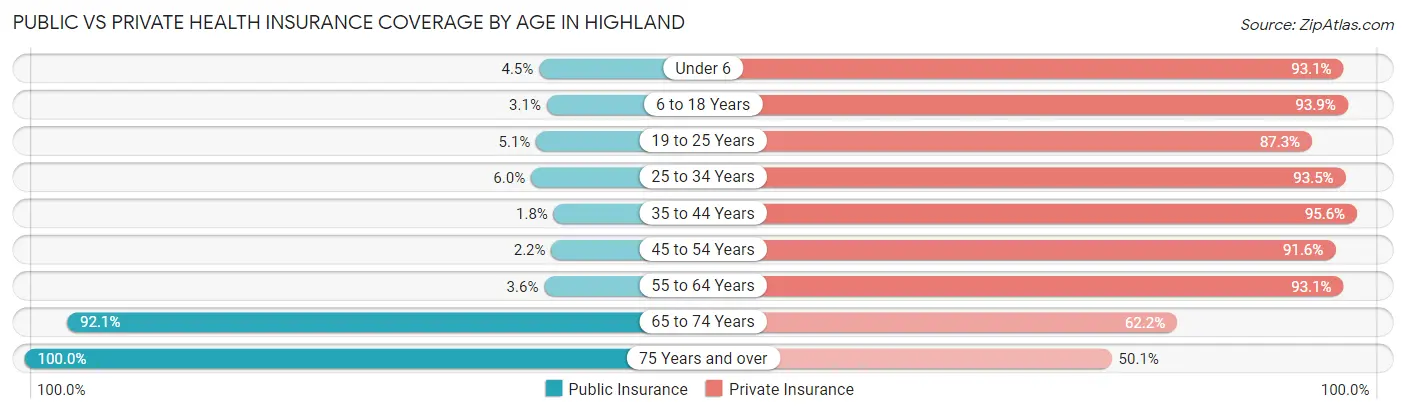
| Age Bracket | Public Insurance | Private Insurance |
| Under 6 | 77 (4.5%) | 1,592 (93.1%) |
| 6 to 18 Years | 196 (3.1%) | 5,981 (93.9%) |
| 19 to 25 Years | 88 (5.1%) | 1,520 (87.3%) |
| 25 to 34 Years | 69 (6.0%) | 1,074 (93.5%) |
| 35 to 44 Years | 46 (1.8%) | 2,461 (95.6%) |
| 45 to 54 Years | 57 (2.2%) | 2,355 (91.6%) |
| 55 to 64 Years | 55 (3.5%) | 1,444 (93.1%) |
| 65 to 74 Years | 958 (92.1%) | 647 (62.2%) |
| 75 Years and over | 541 (100.0%) | 271 (50.1%) |
| Total | 2,087 (10.8%) | 17,345 (90.1%) |
Disability Status by Sex by Age in Highland
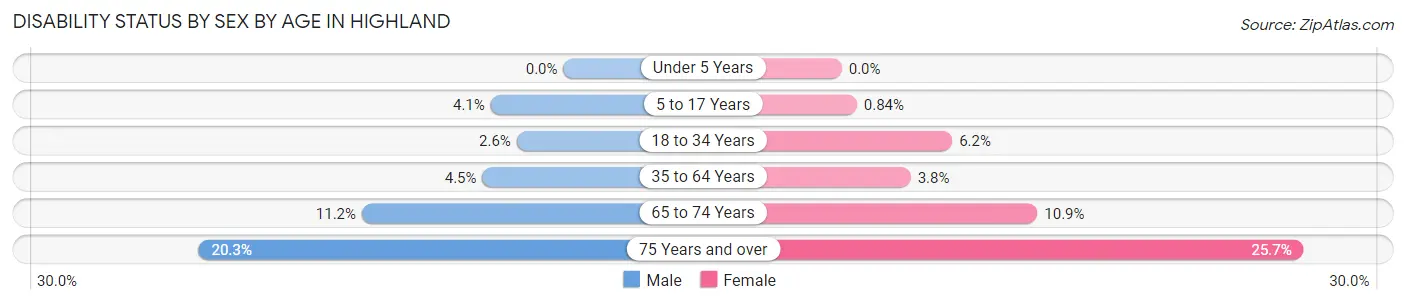
| Age Bracket | Male | Female |
| Under 5 Years | 0 (0.0%) | 0 (0.0%) |
| 5 to 17 Years | 130 (4.1%) | 26 (0.8%) |
| 18 to 34 Years | 48 (2.6%) | 99 (6.1%) |
| 35 to 64 Years | 155 (4.5%) | 125 (3.8%) |
| 65 to 74 Years | 59 (11.2%) | 56 (10.9%) |
| 75 Years and over | 53 (20.3%) | 72 (25.7%) |
Disability Class by Sex by Age in Highland
Disability Class: Hearing Difficulty
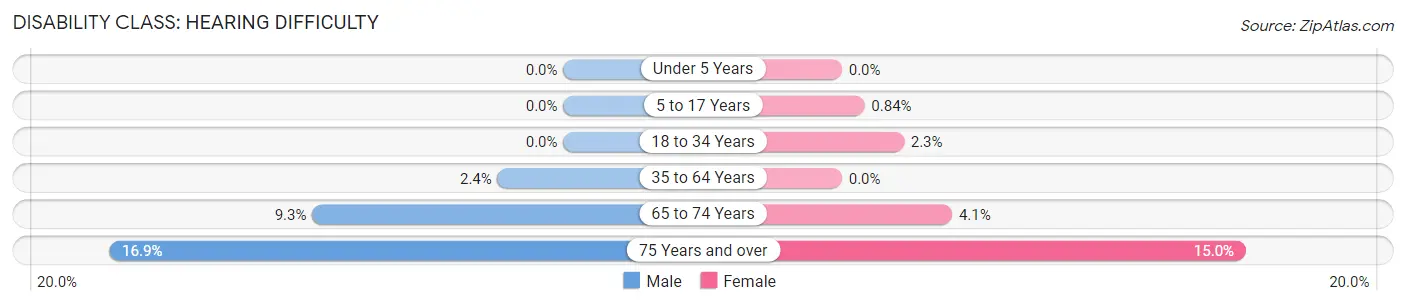
| Age Bracket | Male | Female |
| Under 5 Years | 0 (0.0%) | 0 (0.0%) |
| 5 to 17 Years | 0 (0.0%) | 26 (0.8%) |
| 18 to 34 Years | 0 (0.0%) | 37 (2.3%) |
| 35 to 64 Years | 84 (2.4%) | 0 (0.0%) |
| 65 to 74 Years | 49 (9.3%) | 21 (4.1%) |
| 75 Years and over | 44 (16.9%) | 42 (15.0%) |
Disability Class: Vision Difficulty
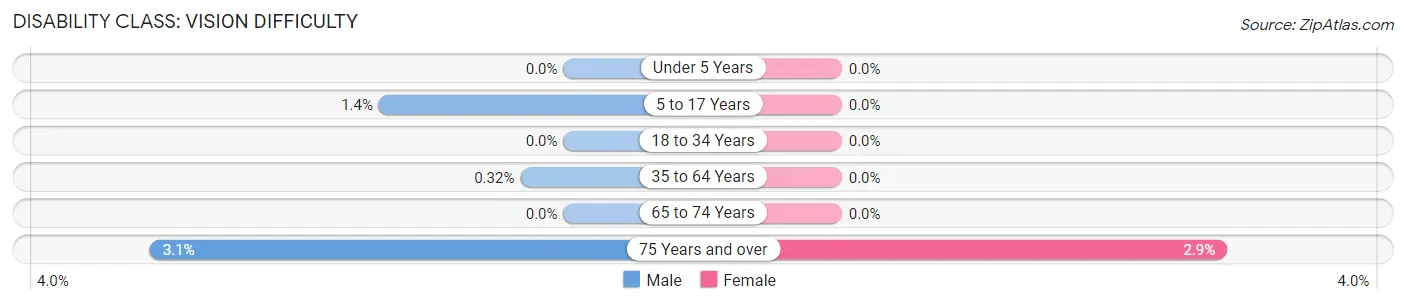
| Age Bracket | Male | Female |
| Under 5 Years | 0 (0.0%) | 0 (0.0%) |
| 5 to 17 Years | 44 (1.4%) | 0 (0.0%) |
| 18 to 34 Years | 0 (0.0%) | 0 (0.0%) |
| 35 to 64 Years | 11 (0.3%) | 0 (0.0%) |
| 65 to 74 Years | 0 (0.0%) | 0 (0.0%) |
| 75 Years and over | 8 (3.1%) | 8 (2.9%) |
Disability Class: Cognitive Difficulty
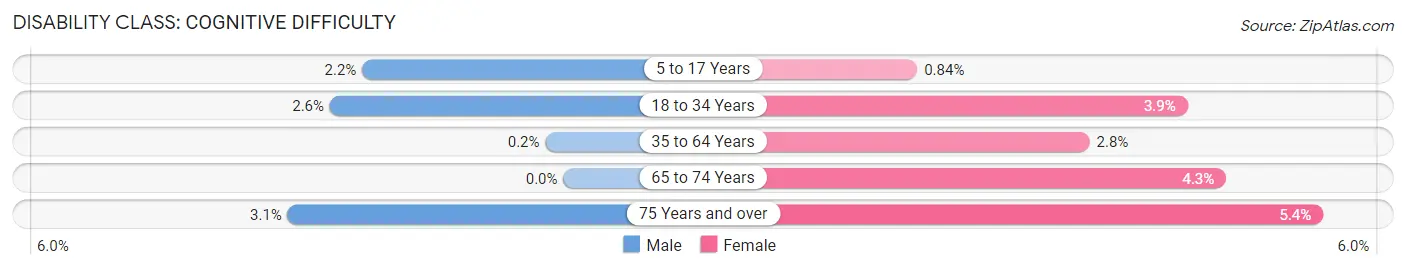
| Age Bracket | Male | Female |
| 5 to 17 Years | 72 (2.2%) | 26 (0.8%) |
| 18 to 34 Years | 48 (2.6%) | 62 (3.8%) |
| 35 to 64 Years | 7 (0.2%) | 90 (2.8%) |
| 65 to 74 Years | 0 (0.0%) | 22 (4.3%) |
| 75 Years and over | 8 (3.1%) | 15 (5.4%) |
Disability Class: Ambulatory Difficulty
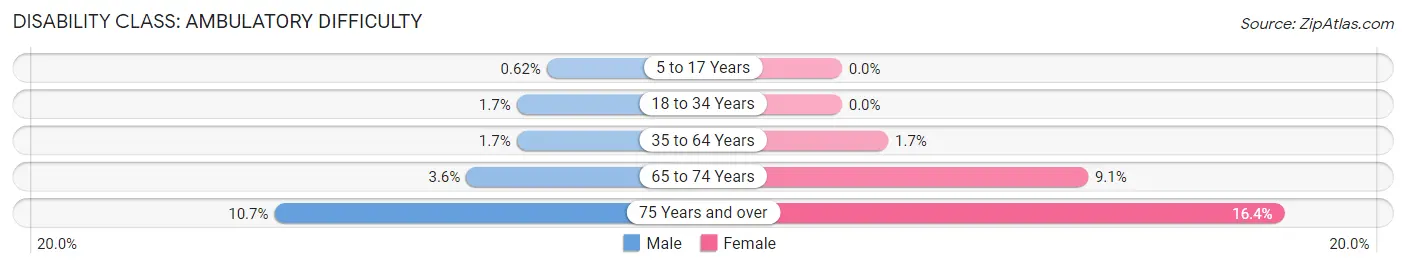
| Age Bracket | Male | Female |
| 5 to 17 Years | 20 (0.6%) | 0 (0.0%) |
| 18 to 34 Years | 32 (1.7%) | 0 (0.0%) |
| 35 to 64 Years | 60 (1.7%) | 56 (1.7%) |
| 65 to 74 Years | 19 (3.6%) | 47 (9.1%) |
| 75 Years and over | 28 (10.7%) | 46 (16.4%) |
Disability Class: Self-Care Difficulty
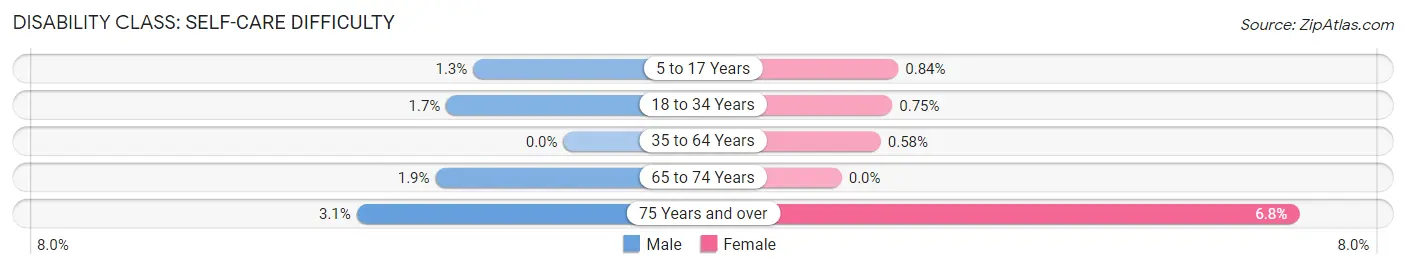
| Age Bracket | Male | Female |
| 5 to 17 Years | 43 (1.3%) | 26 (0.8%) |
| 18 to 34 Years | 32 (1.7%) | 12 (0.7%) |
| 35 to 64 Years | 0 (0.0%) | 19 (0.6%) |
| 65 to 74 Years | 10 (1.9%) | 0 (0.0%) |
| 75 Years and over | 8 (3.1%) | 19 (6.8%) |
Technology Access in Highland
Computing Device Access in Highland
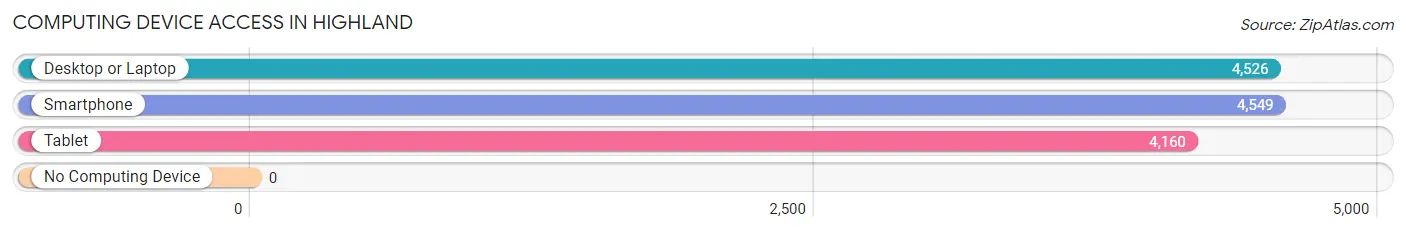
| Device Type | # Households | % Households |
| Desktop or Laptop | 4,526 | 98.3% |
| Smartphone | 4,549 | 98.8% |
| Tablet | 4,160 | 90.3% |
| No Computing Device | 0 | 0.0% |
| Total | 4,606 | 100.0% |
Internet Access in Highland
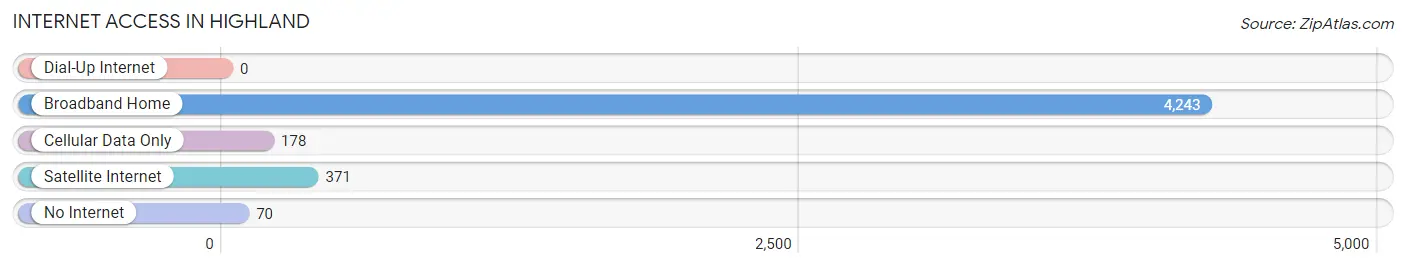
| Internet Type | # Households | % Households |
| Dial-Up Internet | 0 | 0.0% |
| Broadband Home | 4,243 | 92.1% |
| Cellular Data Only | 178 | 3.9% |
| Satellite Internet | 371 | 8.1% |
| No Internet | 70 | 1.5% |
| Total | 4,606 | 100.0% |
Highland Summary
Highland, Utah is a small city located in Utah County, Utah, United States. It is part of the Provo-Orem Metropolitan Statistical Area. The population was 7,918 at the 2010 census.
History
Highland was first settled in the late 1850s by a group of Mormon pioneers. The area was originally known as "Little Denmark" due to the large number of Danish immigrants who settled there. The town was officially incorporated in 1977.
Geography
Highland is located at 40°31'17" North, 111°48'17" West (40.5214, -111.8047). It is situated in the foothills of the Wasatch Mountains, at an elevation of 4,735 feet (1,444 m).
The city covers an area of 4.7 square miles (12.2 km2), all of it land. It is bordered by Alpine to the north, American Fork to the east, Cedar Hills to the south, and Lehi to the west.
Economy
Highland is a bedroom community for the larger cities of Provo and Orem. The city is home to several small businesses, including a grocery store, a hardware store, and a few restaurants.
The city is also home to several technology companies including Ancestry com Vivint and Xactware
Demographics
As of the 2010 census, there were 7,918 people, 2,541 households, and 2,092 families residing in the city. The population density was 1,683.3 people per square mile (650.2/km2). There were 2,717 housing units at an average density of 576.3 per square mile (222.7/km2). The racial makeup of the city was 94.2% White, 0.7% African American, 0.3% Native American, 1.2% Asian, 0.2% Pacific Islander, 1.7% from other races, and 1.8% from two or more races. Hispanic or Latino of any race were 4.7% of the population.
There were 2,541 households, out of which 48.2% had children under the age of 18 living with them, 73.2% were married couples living together, 6.3% had a female householder with no husband present, and 17.3% were non-families. 13.2% of all households were made up of individuals, and 4.2% had someone living alone who was 65 years of age or older. The average household size was 3.12 and the average family size was 3.43.
In the city, the population was spread out, with 33.2% under the age of 18, 7.2% from 18 to 24, 28.2% from 25 to 44, 24.2% from 45 to 64, and 7.2% who were 65 years of age or older. The median age was 34 years. For every 100 females, there were 98.2 males. For every 100 females age 18 and over, there were 95.2 males.
The median income for a household in the city was $76,945, and the median income for a family was $81,945. Males had a median income of $51,945 versus $35,945 for females. The per capita income for the city was $27,945. About 2.2% of families and 3.2% of the population were below the poverty line, including 3.2% of those under age 18 and 4.2% of those age 65 or over.
Common Questions
What is Per Capita Income in Highland?
Per Capita income in Highland is $56,315.
What is the Median Family Income in Highland?
Median Family Income in Highland is $166,913.
What is the Median Household income in Highland?
Median Household Income in Highland is $166,429.
What is Income or Wage Gap in Highland?
Income or Wage Gap in Highland is 72.9%.
Women in Highland earn 27.1 cents for every dollar earned by a man.
What is Family Income Deficit in Highland?
Family Income Deficit in Highland is $18,269.
Families that are below poverty line in Highland earn $18,269 less on average than the poverty threshold level.
What is Inequality or Gini Index in Highland?
Inequality or Gini Index in Highland is 0.45.
What is the Total Population of Highland?
Total Population of Highland is 19,267.
What is the Total Male Population of Highland?
Total Male Population of Highland is 10,004.
What is the Total Female Population of Highland?
Total Female Population of Highland is 9,263.
What is the Ratio of Males per 100 Females in Highland?
There are 108.00 Males per 100 Females in Highland.
What is the Ratio of Females per 100 Males in Highland?
There are 92.59 Females per 100 Males in Highland.
What is the Median Population Age in Highland?
Median Population Age in Highland is 24.6 Years.
What is the Average Family Size in Highland
Average Family Size in Highland is 4.3 People.
What is the Average Household Size in Highland
Average Household Size in Highland is 4.2 People.
How Large is the Labor Force in Highland?
There are 8,616 People in the Labor Forcein in Highland.
What is the Percentage of People in the Labor Force in Highland?
66.5% of People are in the Labor Force in Highland.
What is the Unemployment Rate in Highland?
Unemployment Rate in Highland is 2.8%.