Zip Codes with the Highest Percentage of Population Employed in Accommodation & Food Services in Park City, UT
RELATED REPORTS & OPTIONS
Accommodation & Food Services
Park City
Compare Zip Codes
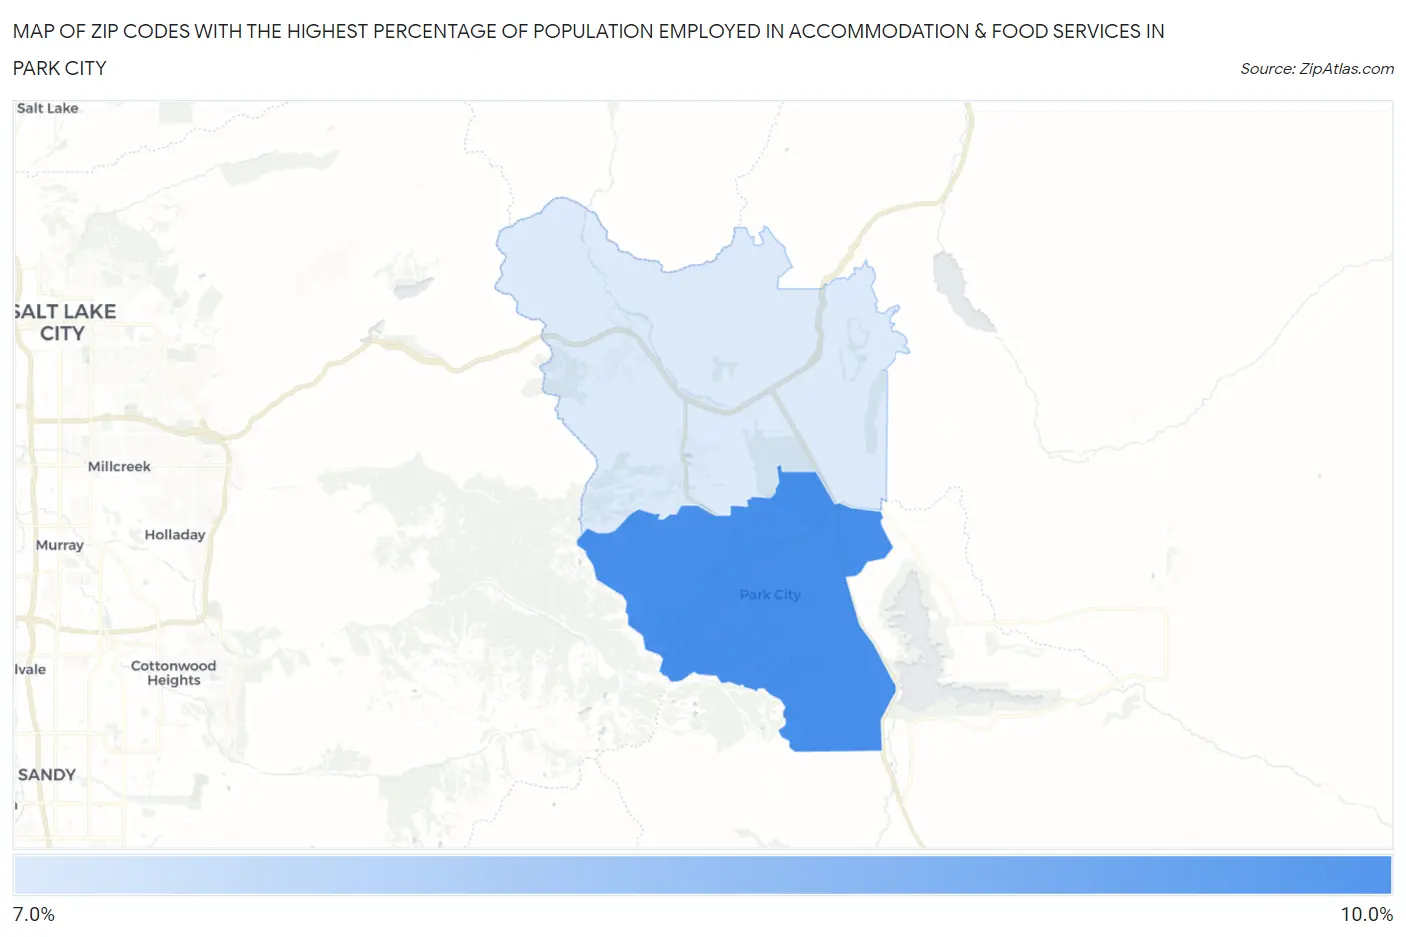
Map of Zip Codes with the Highest Percentage of Population Employed in Accommodation & Food Services in Park City
7.7%
8.1%
Zip Codes with the Highest Percentage of Population Employed in Accommodation & Food Services in Park City, UT
| Zip Code | % Employed | vs State | vs National | |
| 1. | 84060 | 8.1% | 6.1%(+1.98)#69 | 6.9%(+1.22)#7,623 |
| 2. | 84098 | 7.7% | 6.1%(+1.59)#74 | 6.9%(+0.830)#8,469 |
1
Common Questions
What are the Top Zip Codes with the Highest Percentage of Population Employed in Accommodation & Food Services in Park City, UT?
Top Zip Codes with the Highest Percentage of Population Employed in Accommodation & Food Services in Park City, UT are:
What zip code has the Highest Percentage of Population Employed in Accommodation & Food Services in Park City, UT?
84060 has the Highest Percentage of Population Employed in Accommodation & Food Services in Park City, UT with 8.1%.
What is the Percentage of Population Employed in Accommodation & Food Services in Park City, UT?
Percentage of Population Employed in Accommodation & Food Services in Park City is 8.4%.
What is the Percentage of Population Employed in Accommodation & Food Services in Utah?
Percentage of Population Employed in Accommodation & Food Services in Utah is 6.1%.
What is the Percentage of Population Employed in Accommodation & Food Services in the United States?
Percentage of Population Employed in Accommodation & Food Services in the United States is 6.9%.