Granite, UT Map & Demographics
Granite Map
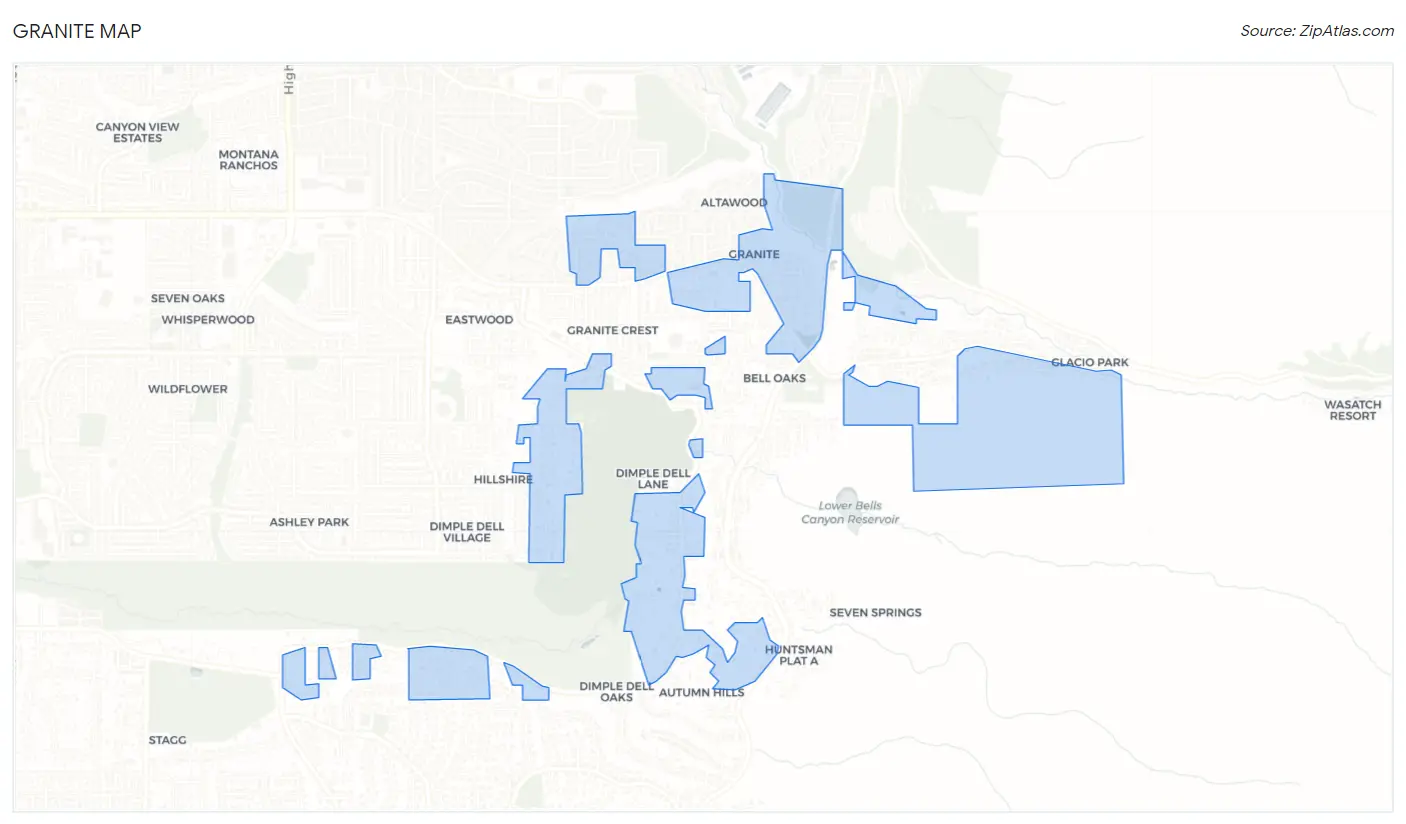
Granite Overview
$66,352
PER CAPITA INCOME
$117,135
AVG FAMILY INCOME
$115,417
AVG HOUSEHOLD INCOME
0.54
INEQUALITY / GINI INDEX
703
TOTAL POPULATION
320
MALE POPULATION
383
FEMALE POPULATION
83.55
MALES / 100 FEMALES
119.69
FEMALES / 100 MALES
51.8
MEDIAN AGE
3.2
AVG FAMILY SIZE
2.9
AVG HOUSEHOLD SIZE
376
LABOR FORCE [ PEOPLE ]
58.1%
PERCENT IN LABOR FORCE
7.4%
UNEMPLOYMENT RATE
Income in Granite
Income Overview in Granite
Per Capita Income in Granite is $66,352, while median incomes of families and households are $117,135 and $115,417 respectively.
| Characteristic | Number | Measure |
| Per Capita Income | 703 | $66,352 |
| Median Family Income | 195 | $117,135 |
| Mean Family Income | 195 | $225,550 |
| Median Household Income | 228 | $115,417 |
| Mean Household Income | 228 | $197,701 |
| Income Deficit | 195 | $0 |
| Wage / Income Gap (%) | 703 | 0.00% |
| Wage / Income Gap ($) | 703 | 100.00¢ per $1 |
| Gini / Inequality Index | 703 | 0.54 |
Earnings by Sex in Granite
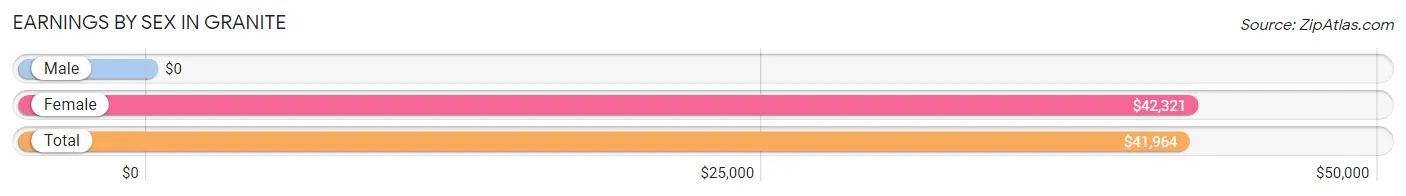
| Sex | Number | Average Earnings |
| Male | 216 (54.1%) | $0 |
| Female | 183 (45.9%) | $42,321 |
| Total | 399 (100.0%) | $41,964 |
Earnings by Sex by Income Bracket in Granite
The most common earnings brackets in Granite are $100,000+ for men (40 | 18.5%) and $100,000+ for women (44 | 24.0%).
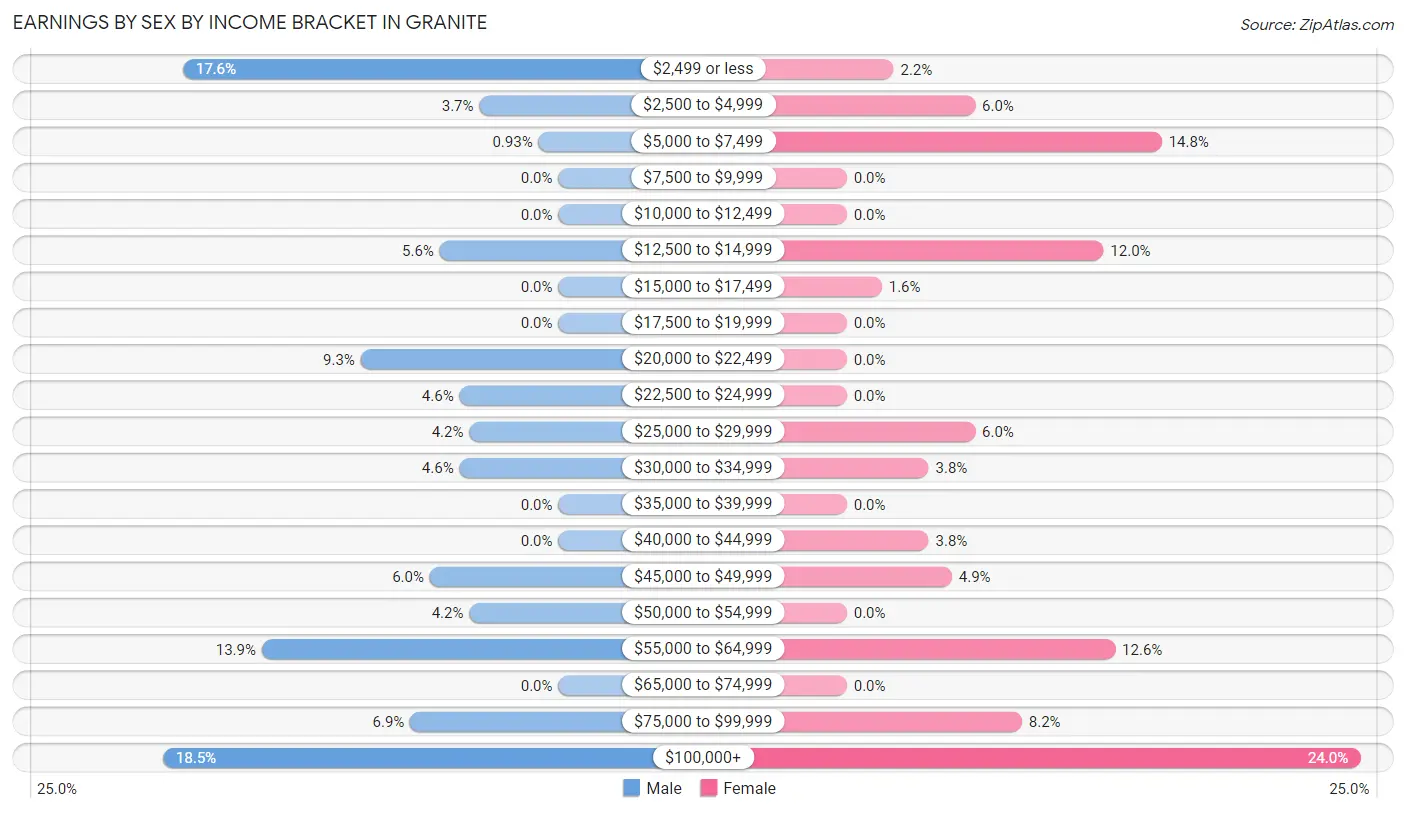
| Income | Male | Female |
| $2,499 or less | 38 (17.6%) | 4 (2.2%) |
| $2,500 to $4,999 | 8 (3.7%) | 11 (6.0%) |
| $5,000 to $7,499 | 2 (0.9%) | 27 (14.7%) |
| $7,500 to $9,999 | 0 (0.0%) | 0 (0.0%) |
| $10,000 to $12,499 | 0 (0.0%) | 0 (0.0%) |
| $12,500 to $14,999 | 12 (5.6%) | 22 (12.0%) |
| $15,000 to $17,499 | 0 (0.0%) | 3 (1.6%) |
| $17,500 to $19,999 | 0 (0.0%) | 0 (0.0%) |
| $20,000 to $22,499 | 20 (9.3%) | 0 (0.0%) |
| $22,500 to $24,999 | 10 (4.6%) | 0 (0.0%) |
| $25,000 to $29,999 | 9 (4.2%) | 11 (6.0%) |
| $30,000 to $34,999 | 10 (4.6%) | 7 (3.8%) |
| $35,000 to $39,999 | 0 (0.0%) | 0 (0.0%) |
| $40,000 to $44,999 | 0 (0.0%) | 7 (3.8%) |
| $45,000 to $49,999 | 13 (6.0%) | 9 (4.9%) |
| $50,000 to $54,999 | 9 (4.2%) | 0 (0.0%) |
| $55,000 to $64,999 | 30 (13.9%) | 23 (12.6%) |
| $65,000 to $74,999 | 0 (0.0%) | 0 (0.0%) |
| $75,000 to $99,999 | 15 (6.9%) | 15 (8.2%) |
| $100,000+ | 40 (18.5%) | 44 (24.0%) |
| Total | 216 (100.0%) | 183 (100.0%) |
Earnings by Sex by Educational Attainment in Granite
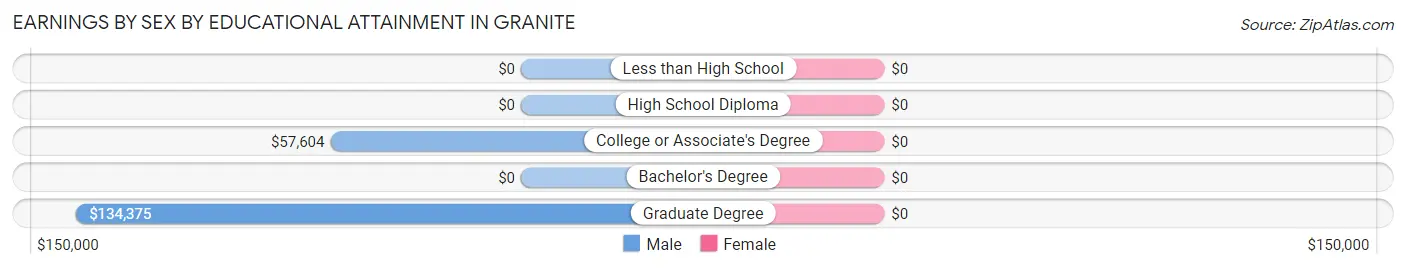
| Educational Attainment | Male Income | Female Income |
| Less than High School | - | - |
| High School Diploma | - | - |
| College or Associate's Degree | $57,604 | $0 |
| Bachelor's Degree | - | - |
| Graduate Degree | $134,375 | $0 |
| Total | $52,361 | $56,250 |
Family Income in Granite
Family Income Brackets in Granite
According to the Granite family income data, there are 74 families falling into the $100,000 to $149,999 income range, which is the most common income bracket and makes up 38.0% of all families.
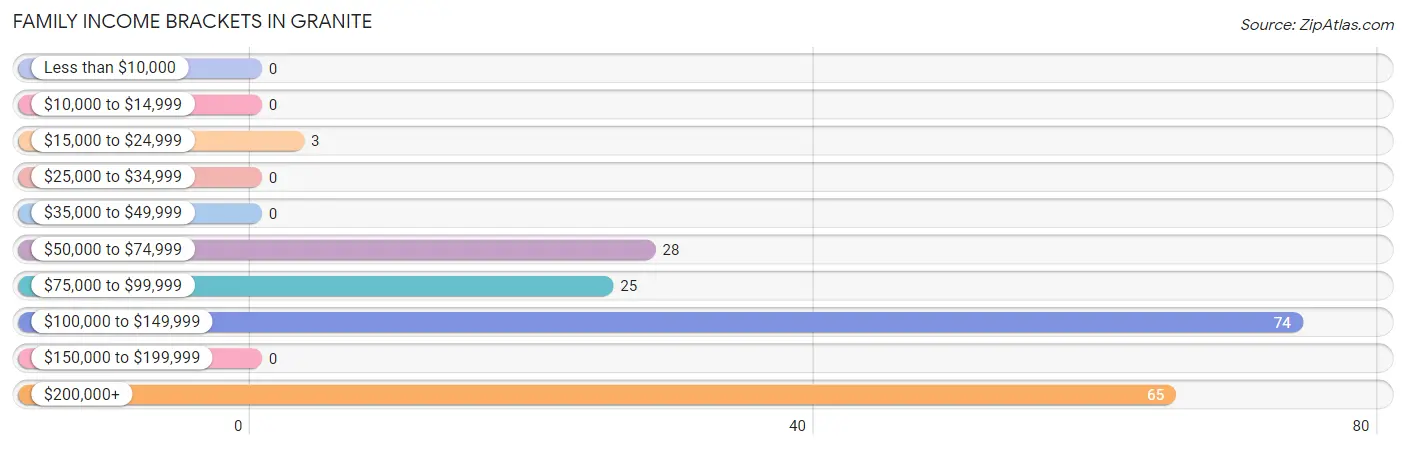
| Income Bracket | # Families | % Families |
| Less than $10,000 | 0 | 0.0% |
| $10,000 to $14,999 | 0 | 0.0% |
| $15,000 to $24,999 | 3 | 1.5% |
| $25,000 to $34,999 | 0 | 0.0% |
| $35,000 to $49,999 | 0 | 0.0% |
| $50,000 to $74,999 | 28 | 14.4% |
| $75,000 to $99,999 | 25 | 12.8% |
| $100,000 to $149,999 | 74 | 37.9% |
| $150,000 to $199,999 | 0 | 0.0% |
| $200,000+ | 65 | 33.3% |
Family Income by Famaliy Size in Granite
3-person families (58 | 29.7%) account for the highest median family income in Granite with $203,333 per family, while 3-person families (58 | 29.7%) have the highest median income of $67,778 per family member.
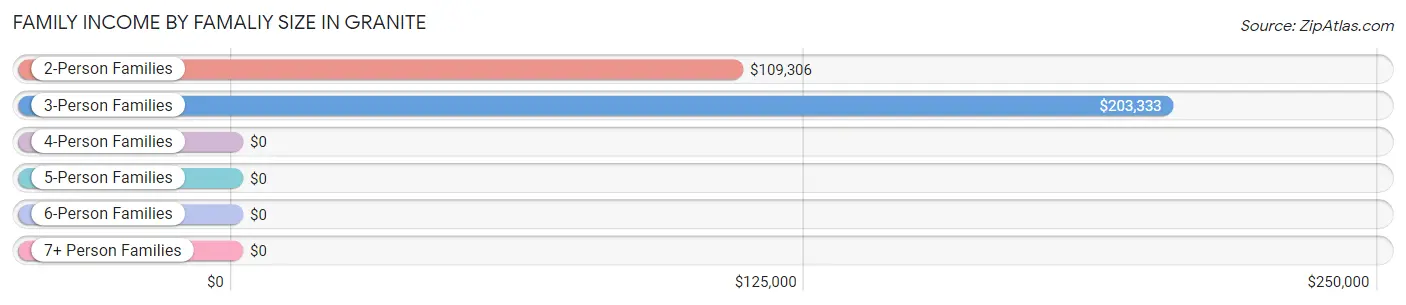
| Income Bracket | # Families | Median Income |
| 2-Person Families | 85 (43.6%) | $109,306 |
| 3-Person Families | 58 (29.7%) | $203,333 |
| 4-Person Families | 27 (13.9%) | $0 |
| 5-Person Families | 6 (3.1%) | $0 |
| 6-Person Families | 19 (9.7%) | $0 |
| 7+ Person Families | 0 (0.0%) | $0 |
| Total | 195 (100.0%) | $117,135 |
Family Income by Number of Earners in Granite
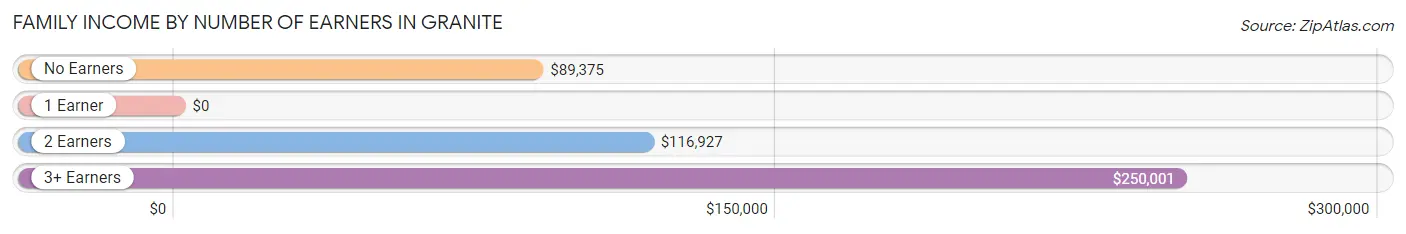
| Number of Earners | # Families | Median Income |
| No Earners | 52 (26.7%) | $89,375 |
| 1 Earner | 15 (7.7%) | $0 |
| 2 Earners | 77 (39.5%) | $116,927 |
| 3+ Earners | 51 (26.2%) | $250,001 |
| Total | 195 (100.0%) | $117,135 |
Household Income in Granite
Household Income Brackets in Granite
With 74 households falling in the category, the $100,000 to $149,999 income range is the most frequent in Granite, accounting for 32.5% of all households.
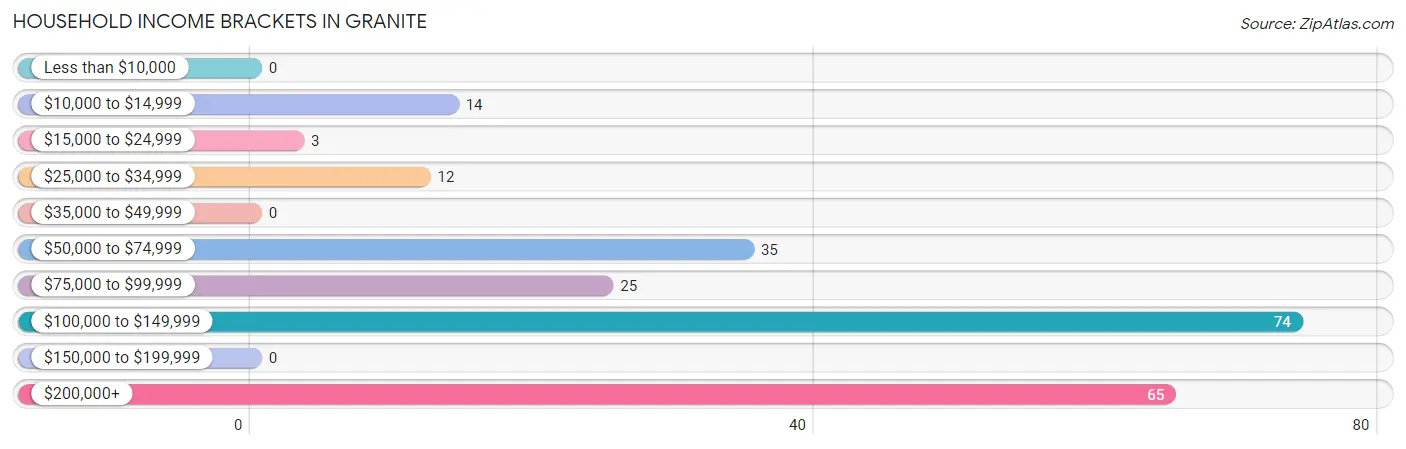
| Income Bracket | # Households | % Households |
| Less than $10,000 | 0 | 0.0% |
| $10,000 to $14,999 | 14 | 6.1% |
| $15,000 to $24,999 | 3 | 1.3% |
| $25,000 to $34,999 | 12 | 5.3% |
| $35,000 to $49,999 | 0 | 0.0% |
| $50,000 to $74,999 | 35 | 15.4% |
| $75,000 to $99,999 | 25 | 11.0% |
| $100,000 to $149,999 | 74 | 32.5% |
| $150,000 to $199,999 | 0 | 0.0% |
| $200,000+ | 65 | 28.5% |
Household Income by Householder Age in Granite
The median household income in Granite is $115,417, with the highest median household income of $116,719 found in the 45 to 64 years age bracket for the primary householder. A total of 107 households (46.9%) fall into this category.
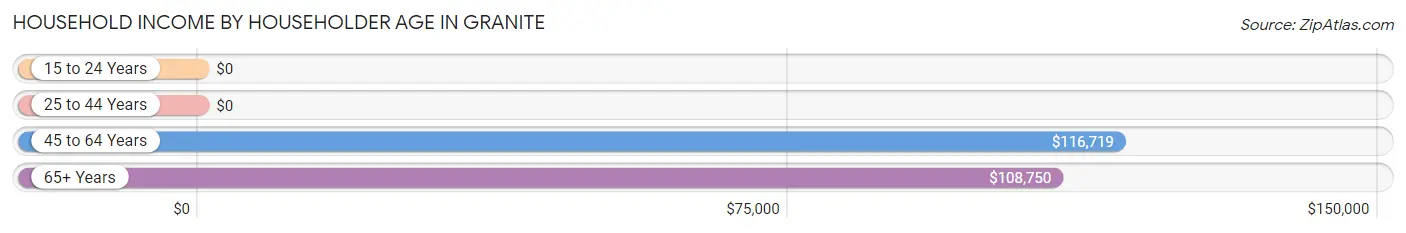
| Income Bracket | # Households | Median Income |
| 15 to 24 Years | 0 (0.0%) | $0 |
| 25 to 44 Years | 22 (9.7%) | $0 |
| 45 to 64 Years | 107 (46.9%) | $116,719 |
| 65+ Years | 99 (43.4%) | $108,750 |
| Total | 228 (100.0%) | $115,417 |
Poverty in Granite
Income Below Poverty by Sex and Age in Granite
With 1.6% poverty level for males and 7.1% for females among the residents of Granite, 75 year old and over males and 25 to 34 year old females are the most vulnerable to poverty, with 3 males (7.1%) and 8 females (30.8%) in their respective age groups living below the poverty level.
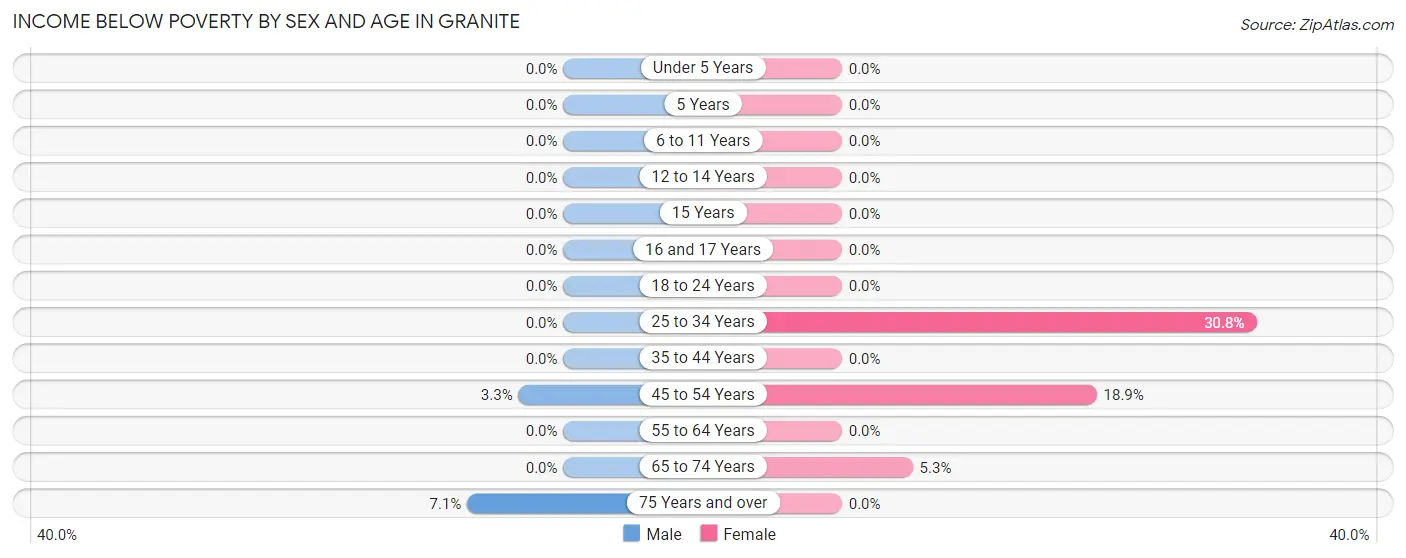
| Age Bracket | Male | Female |
| Under 5 Years | 0 (0.0%) | 0 (0.0%) |
| 5 Years | 0 (0.0%) | 0 (0.0%) |
| 6 to 11 Years | 0 (0.0%) | 0 (0.0%) |
| 12 to 14 Years | 0 (0.0%) | 0 (0.0%) |
| 15 Years | 0 (0.0%) | 0 (0.0%) |
| 16 and 17 Years | 0 (0.0%) | 0 (0.0%) |
| 18 to 24 Years | 0 (0.0%) | 0 (0.0%) |
| 25 to 34 Years | 0 (0.0%) | 8 (30.8%) |
| 35 to 44 Years | 0 (0.0%) | 0 (0.0%) |
| 45 to 54 Years | 2 (3.3%) | 14 (18.9%) |
| 55 to 64 Years | 0 (0.0%) | 0 (0.0%) |
| 65 to 74 Years | 0 (0.0%) | 4 (5.3%) |
| 75 Years and over | 3 (7.1%) | 0 (0.0%) |
| Total | 5 (1.6%) | 26 (7.1%) |
Income Above Poverty by Sex and Age in Granite
According to the poverty statistics in Granite, males aged 6 to 11 years and females aged 6 to 11 years are the age groups that are most secure financially, with 100.0% of males and 100.0% of females in these age groups living above the poverty line.
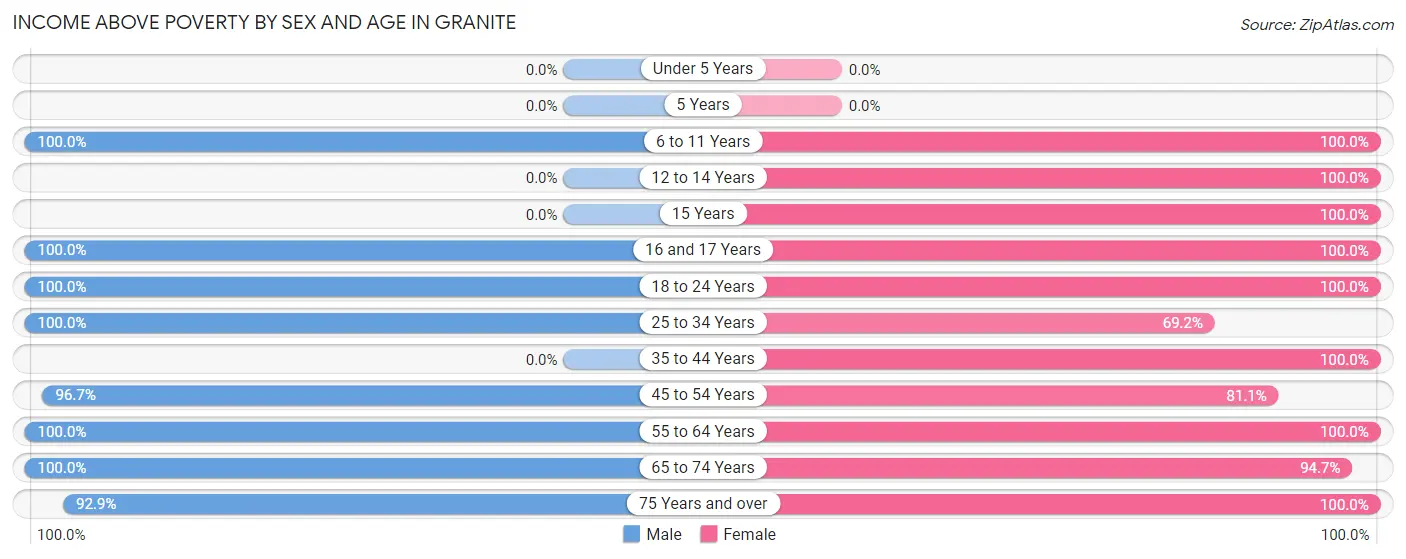
| Age Bracket | Male | Female |
| Under 5 Years | 0 (0.0%) | 0 (0.0%) |
| 5 Years | 0 (0.0%) | 0 (0.0%) |
| 6 to 11 Years | 16 (100.0%) | 10 (100.0%) |
| 12 to 14 Years | 0 (0.0%) | 15 (100.0%) |
| 15 Years | 0 (0.0%) | 9 (100.0%) |
| 16 and 17 Years | 24 (100.0%) | 22 (100.0%) |
| 18 to 24 Years | 42 (100.0%) | 38 (100.0%) |
| 25 to 34 Years | 10 (100.0%) | 18 (69.2%) |
| 35 to 44 Years | 0 (0.0%) | 23 (100.0%) |
| 45 to 54 Years | 58 (96.7%) | 60 (81.1%) |
| 55 to 64 Years | 69 (100.0%) | 29 (100.0%) |
| 65 to 74 Years | 57 (100.0%) | 72 (94.7%) |
| 75 Years and over | 39 (92.9%) | 45 (100.0%) |
| Total | 315 (98.4%) | 341 (92.9%) |
Income Below Poverty Among Married-Couple Families in Granite
The poverty statistics for married-couple families in Granite show that 1.5% or 3 of the total 195 families live below the poverty line. Families with no children have the highest poverty rate of 2.5%, comprising of 3 families. On the other hand, families with 1 or 2 children have the lowest poverty rate of 0.0%, which includes 0 families.
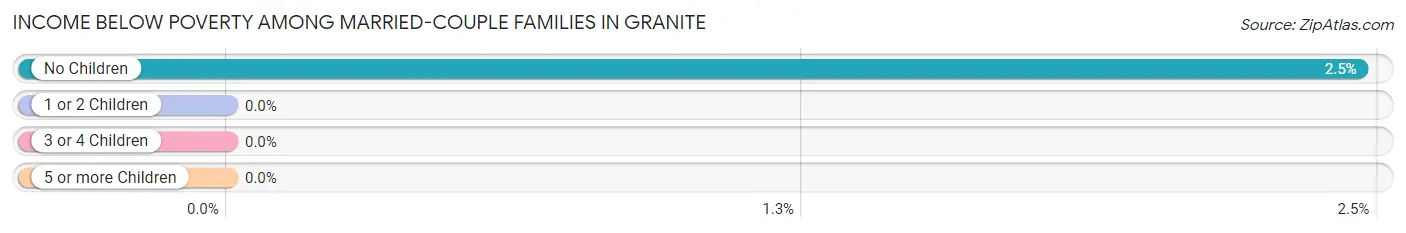
| Children | Above Poverty | Below Poverty |
| No Children | 119 (97.5%) | 3 (2.5%) |
| 1 or 2 Children | 73 (100.0%) | 0 (0.0%) |
| 3 or 4 Children | 0 (0.0%) | 0 (0.0%) |
| 5 or more Children | 0 (0.0%) | 0 (0.0%) |
| Total | 192 (98.5%) | 3 (1.5%) |
Income Below Poverty Among Single-Parent Households in Granite
| Children | Single Father | Single Mother |
| No Children | 0 (0.0%) | 0 (0.0%) |
| 1 or 2 Children | 0 (0.0%) | 0 (0.0%) |
| 3 or 4 Children | 0 (0.0%) | 0 (0.0%) |
| 5 or more Children | 0 (0.0%) | 0 (0.0%) |
| Total | 0 (0.0%) | 0 (0.0%) |
Income Below Poverty Among Married-Couple vs Single-Parent Households in Granite
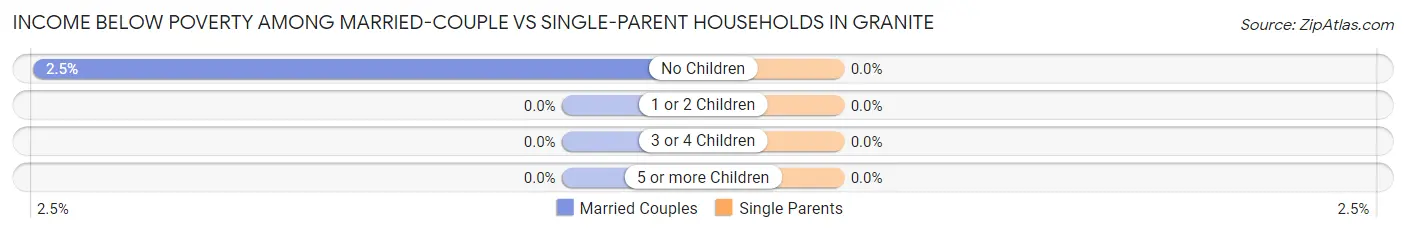
| Children | Married-Couple Families | Single-Parent Households |
| No Children | 3 (2.5%) | 0 (0.0%) |
| 1 or 2 Children | 0 (0.0%) | 0 (0.0%) |
| 3 or 4 Children | 0 (0.0%) | 0 (0.0%) |
| 5 or more Children | 0 (0.0%) | 0 (0.0%) |
| Total | 3 (1.5%) | 0 (0.0%) |
Race in Granite
The most populous races in Granite are White / Caucasian (675 | 96.0%), Black / African American (10 | 1.4%), and Two or more Races (10 | 1.4%).
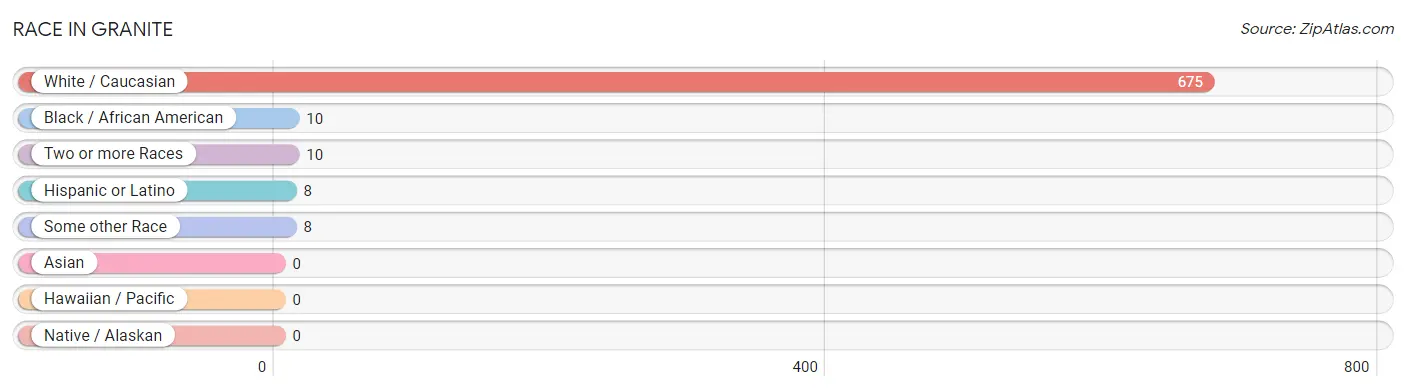
| Race | # Population | % Population |
| Asian | 0 | 0.0% |
| Black / African American | 10 | 1.4% |
| Hawaiian / Pacific | 0 | 0.0% |
| Hispanic or Latino | 8 | 1.1% |
| Native / Alaskan | 0 | 0.0% |
| White / Caucasian | 675 | 96.0% |
| Two or more Races | 10 | 1.4% |
| Some other Race | 8 | 1.1% |
| Total | 703 | 100.0% |
Ancestry in Granite
The most populous ancestries reported in Granite are English (248 | 35.3%), Swedish (139 | 19.8%), German (78 | 11.1%), Norwegian (55 | 7.8%), and British (54 | 7.7%), together accounting for 81.7% of all Granite residents.
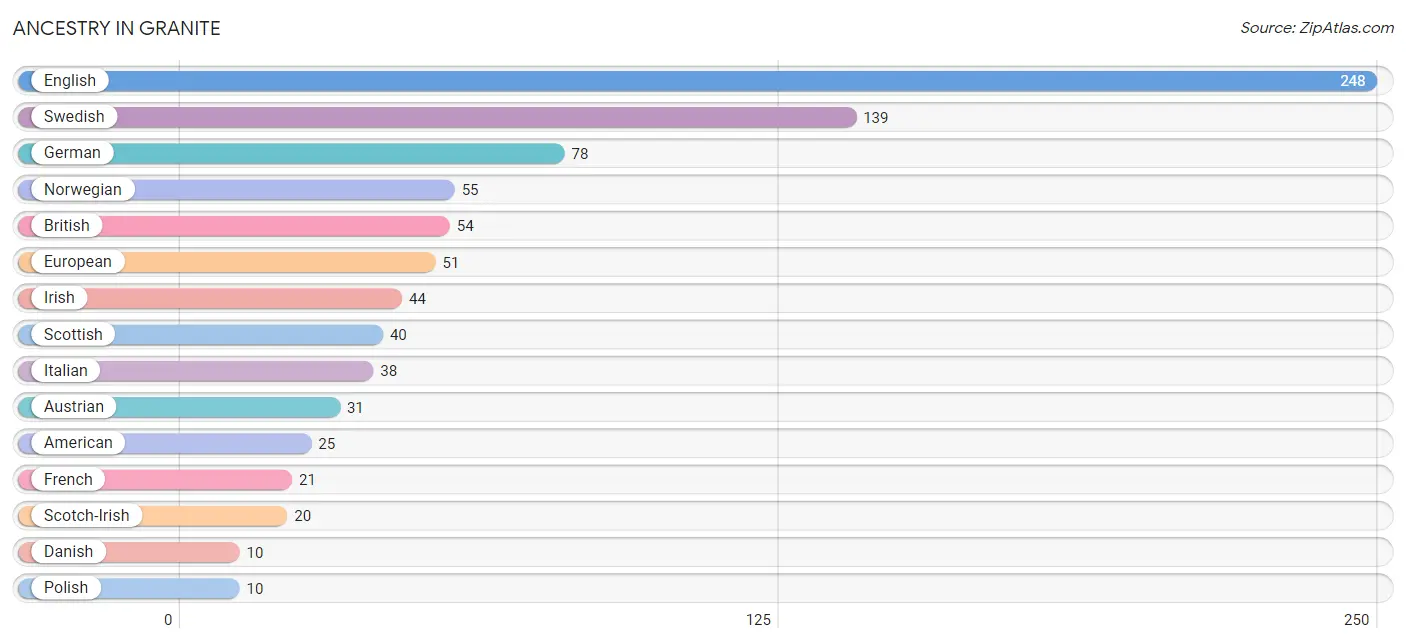
| Ancestry | # Population | % Population |
| American | 25 | 3.6% |
| Austrian | 31 | 4.4% |
| British | 54 | 7.7% |
| Czechoslovakian | 8 | 1.1% |
| Danish | 10 | 1.4% |
| Eastern European | 1 | 0.1% |
| English | 248 | 35.3% |
| European | 51 | 7.2% |
| French | 21 | 3.0% |
| German | 78 | 11.1% |
| Greek | 9 | 1.3% |
| Irish | 44 | 6.3% |
| Italian | 38 | 5.4% |
| Macedonian | 3 | 0.4% |
| Mexican | 8 | 1.1% |
| Norwegian | 55 | 7.8% |
| Polish | 10 | 1.4% |
| Russian | 2 | 0.3% |
| Scandinavian | 10 | 1.4% |
| Scotch-Irish | 20 | 2.8% |
| Scottish | 40 | 5.7% |
| Swedish | 139 | 19.8% | View All 22 Rows |
Immigrants in Granite
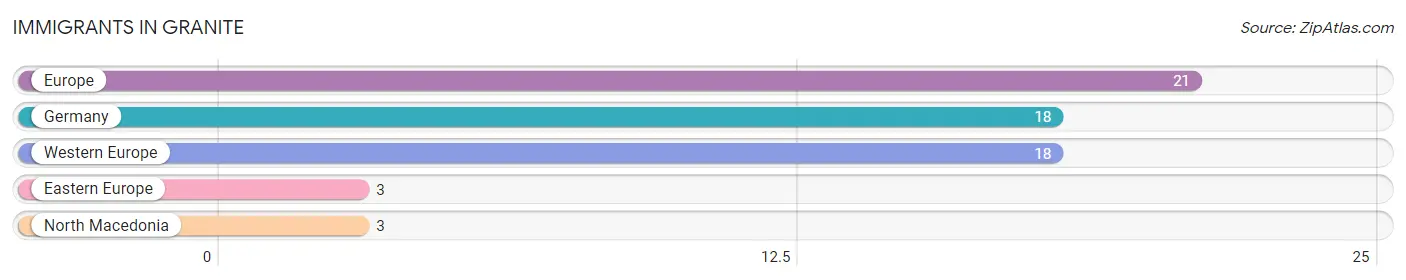
The most numerous immigrant groups reported in Granite came from Europe (21 | 3.0%), Germany (18 | 2.6%), Western Europe (18 | 2.6%), Eastern Europe (3 | 0.4%), and North Macedonia (3 | 0.4%), together accounting for 9.0% of all Granite residents.
| Immigration Origin | # Population | % Population |
| Eastern Europe | 3 | 0.4% |
| Europe | 21 | 3.0% |
| Germany | 18 | 2.6% |
| North Macedonia | 3 | 0.4% |
| Western Europe | 18 | 2.6% | View All 5 Rows |
Sex and Age in Granite
Sex and Age in Granite
The most populous age groups in Granite are 20 to 24 Years (42 | 13.1%) for men and 65 to 69 Years (55 | 14.4%) for women.
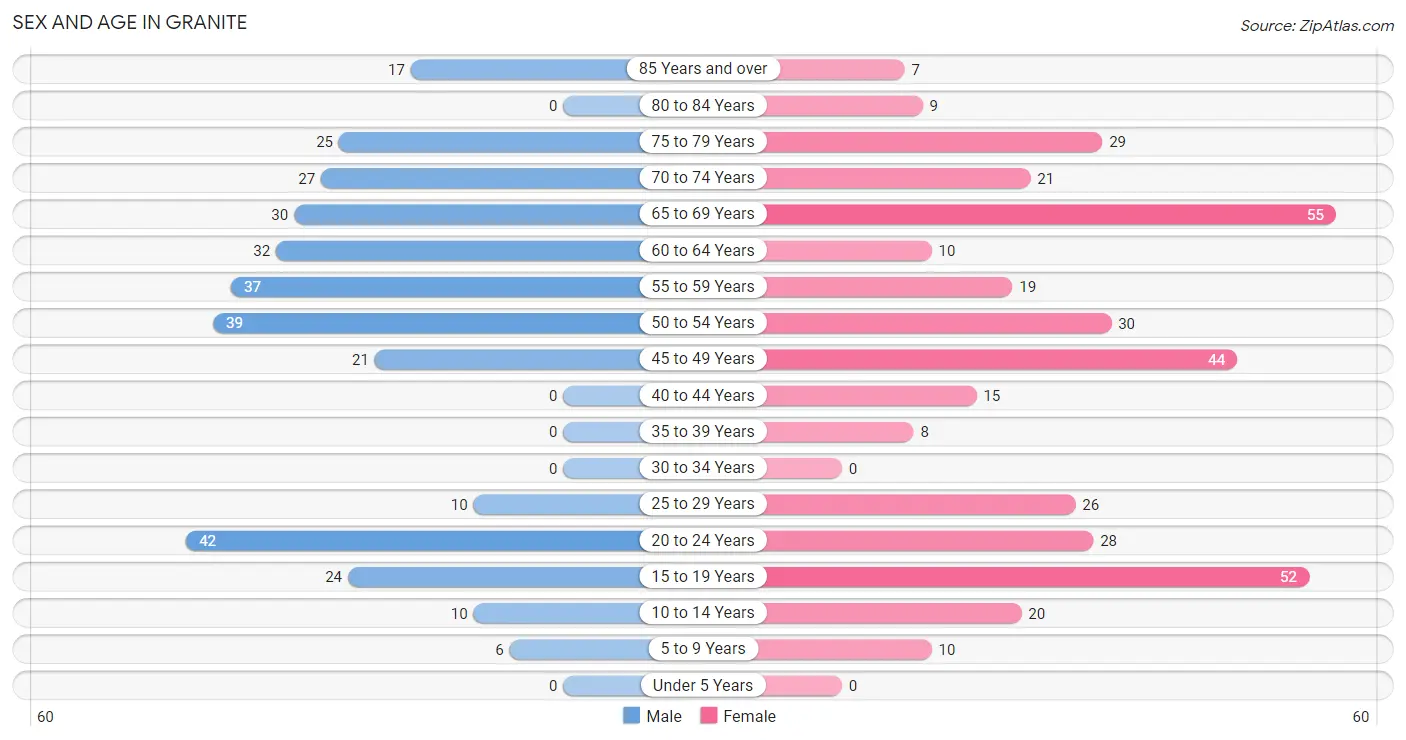
| Age Bracket | Male | Female |
| Under 5 Years | 0 (0.0%) | 0 (0.0%) |
| 5 to 9 Years | 6 (1.9%) | 10 (2.6%) |
| 10 to 14 Years | 10 (3.1%) | 20 (5.2%) |
| 15 to 19 Years | 24 (7.5%) | 52 (13.6%) |
| 20 to 24 Years | 42 (13.1%) | 28 (7.3%) |
| 25 to 29 Years | 10 (3.1%) | 26 (6.8%) |
| 30 to 34 Years | 0 (0.0%) | 0 (0.0%) |
| 35 to 39 Years | 0 (0.0%) | 8 (2.1%) |
| 40 to 44 Years | 0 (0.0%) | 15 (3.9%) |
| 45 to 49 Years | 21 (6.6%) | 44 (11.5%) |
| 50 to 54 Years | 39 (12.2%) | 30 (7.8%) |
| 55 to 59 Years | 37 (11.6%) | 19 (5.0%) |
| 60 to 64 Years | 32 (10.0%) | 10 (2.6%) |
| 65 to 69 Years | 30 (9.4%) | 55 (14.4%) |
| 70 to 74 Years | 27 (8.4%) | 21 (5.5%) |
| 75 to 79 Years | 25 (7.8%) | 29 (7.6%) |
| 80 to 84 Years | 0 (0.0%) | 9 (2.4%) |
| 85 Years and over | 17 (5.3%) | 7 (1.8%) |
| Total | 320 (100.0%) | 383 (100.0%) |
Families and Households in Granite
Median Family Size in Granite
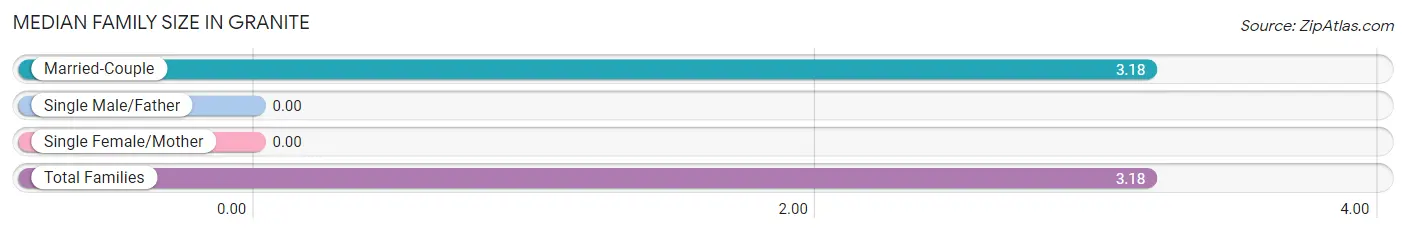
| Family Type | # Families | Family Size |
| Married-Couple | 195 (100.0%) | 3.18 |
| Single Male/Father | 0 (0.0%) | - |
| Single Female/Mother | 0 (0.0%) | - |
| Total Families | 195 (100.0%) | 3.18 |
Median Household Size in Granite
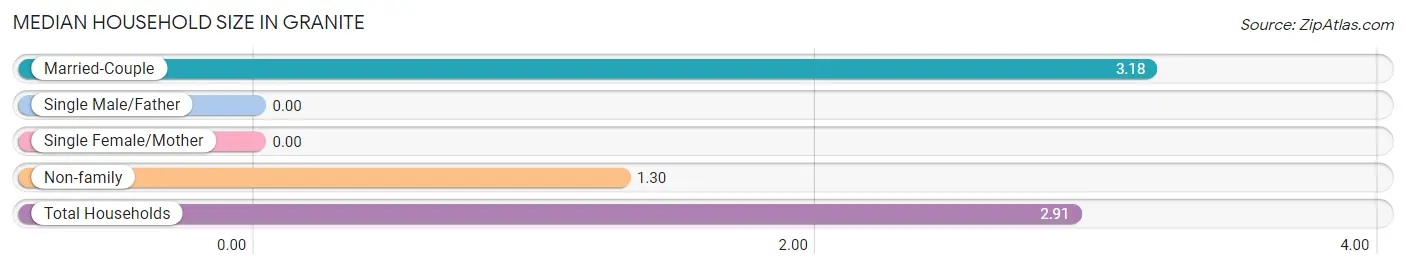
| Household Type | # Households | Household Size |
| Married-Couple | 195 (85.5%) | 3.18 |
| Single Male/Father | 0 (0.0%) | - |
| Single Female/Mother | 0 (0.0%) | - |
| Non-family | 33 (14.5%) | 1.30 |
| Total Households | 228 (100.0%) | 2.91 |
Household Size by Marriage Status in Granite
Out of a total of 228 households in Granite, 195 (85.5%) are family households, while 33 (14.5%) are nonfamily households. The most numerous type of family households are 2-person households, comprising 85, and the most common type of nonfamily households are 1-person households, comprising 26.
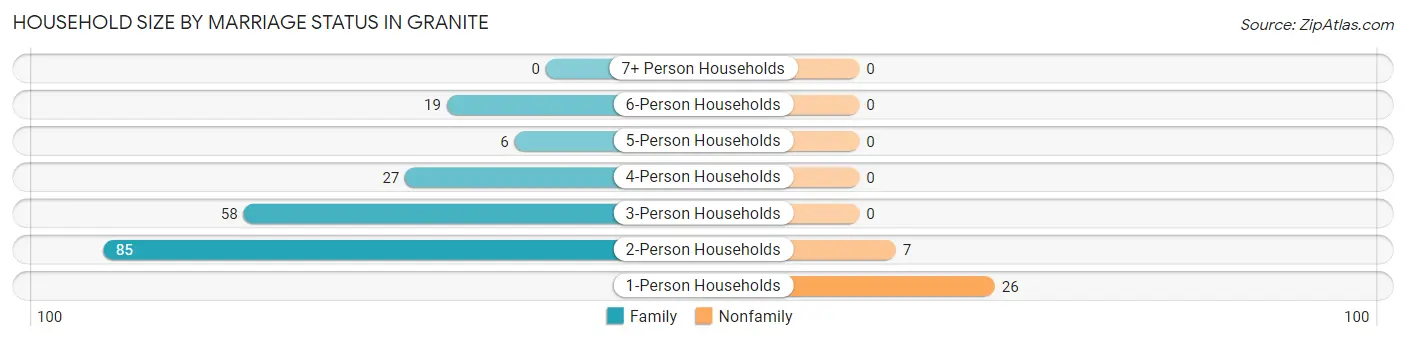
| Household Size | Family Households | Nonfamily Households |
| 1-Person Households | - | 26 (11.4%) |
| 2-Person Households | 85 (37.3%) | 7 (3.1%) |
| 3-Person Households | 58 (25.4%) | 0 (0.0%) |
| 4-Person Households | 27 (11.8%) | 0 (0.0%) |
| 5-Person Households | 6 (2.6%) | 0 (0.0%) |
| 6-Person Households | 19 (8.3%) | 0 (0.0%) |
| 7+ Person Households | 0 (0.0%) | 0 (0.0%) |
| Total | 195 (85.5%) | 33 (14.5%) |
Female Fertility in Granite
Fertility by Age in Granite
| Age Bracket | Women with Births | Births / 1,000 Women |
| 15 to 19 years | 0 (0.0%) | 0.0 |
| 20 to 34 years | 0 (0.0%) | 0.0 |
| 35 to 50 years | 0 (0.0%) | 0.0 |
| Total | 0 (0.0%) | 0.0 |
Fertility by Age by Marriage Status in Granite
| Age Bracket | Married | Unmarried |
| 15 to 19 years | 0 (0.0%) | 0 (0.0%) |
| 20 to 34 years | 0 (0.0%) | 0 (0.0%) |
| 35 to 50 years | 0 (0.0%) | 0 (0.0%) |
| Total | 0 (0.0%) | 0 (0.0%) |
Fertility by Education in Granite
| Educational Attainment | Women with Births | Births / 1,000 Women |
| Less than High School | 0 (0.0%) | 0.0 |
| High School Diploma | 0 (0.0%) | 0.0 |
| College or Associate's Degree | 0 (0.0%) | 0.0 |
| Bachelor's Degree | 0 (0.0%) | 0.0 |
| Graduate Degree | 0 (0.0%) | 0.0 |
| Total | 0 (0.0%) | 0.0 |
Fertility by Education by Marriage Status in Granite
| Educational Attainment | Married | Unmarried |
| Less than High School | 0 (0.0%) | 0 (0.0%) |
| High School Diploma | 0 (0.0%) | 0 (0.0%) |
| College or Associate's Degree | 0 (0.0%) | 0 (0.0%) |
| Bachelor's Degree | 0 (0.0%) | 0 (0.0%) |
| Graduate Degree | 0 (0.0%) | 0 (0.0%) |
| Total | 0 (0.0%) | 0 (0.0%) |
Employment Characteristics in Granite
Employment by Class of Employer in Granite
Among the 348 employed individuals in Granite, private company employees (187 | 53.7%), self-employed (incorporated) (71 | 20.4%), and not-for-profit organizations (39 | 11.2%) make up the most common classes of employment.
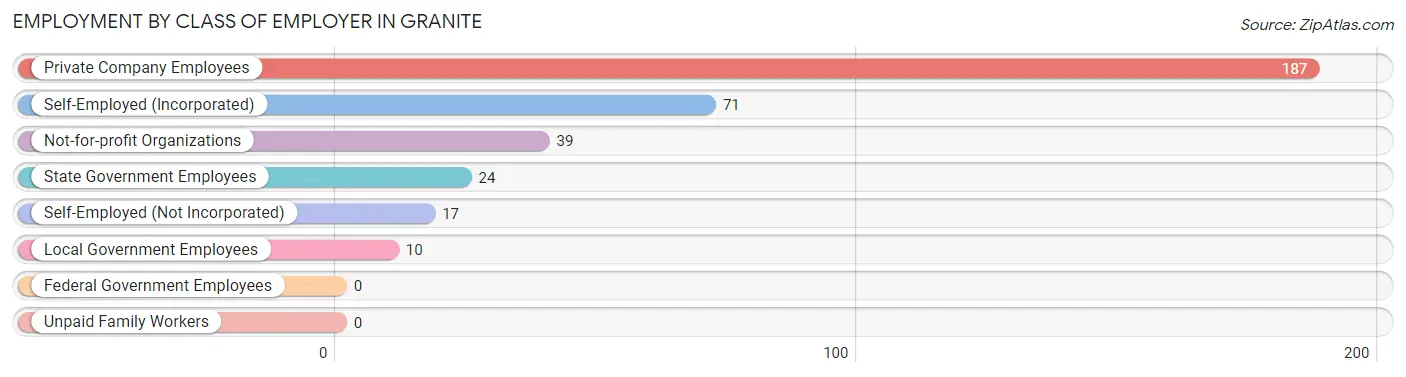
| Employer Class | # Employees | % Employees |
| Private Company Employees | 187 | 53.7% |
| Self-Employed (Incorporated) | 71 | 20.4% |
| Self-Employed (Not Incorporated) | 17 | 4.9% |
| Not-for-profit Organizations | 39 | 11.2% |
| Local Government Employees | 10 | 2.9% |
| State Government Employees | 24 | 6.9% |
| Federal Government Employees | 0 | 0.0% |
| Unpaid Family Workers | 0 | 0.0% |
| Total | 348 | 100.0% |
Employment Status by Age in Granite
According to the labor force statistics for Granite, out of the total population over 16 years of age (647), 58.1% or 376 individuals are in the labor force, with 7.4% or 28 of them unemployed. The age group with the highest labor force participation rate is 60 to 64 years, with 100.0% or 42 individuals in the labor force. Within the labor force, the 20 to 24 years age range has the highest percentage of unemployed individuals, with 41.5% or 17 of them being unemployed.
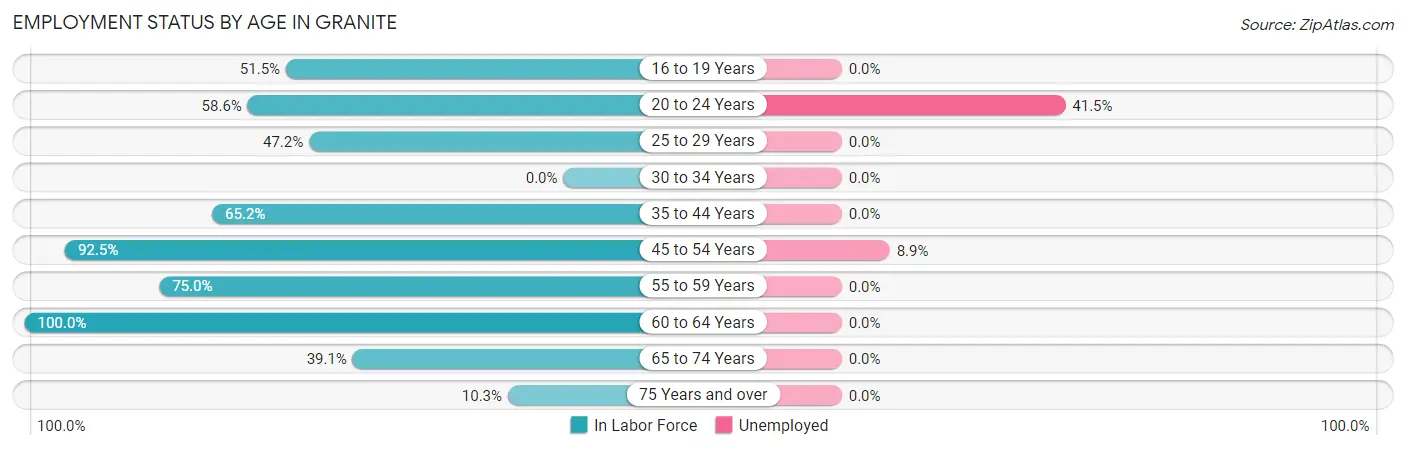
| Age Bracket | In Labor Force | Unemployed |
| 16 to 19 Years | 34 (51.5%) | 0 (0.0%) |
| 20 to 24 Years | 41 (58.6%) | 17 (41.5%) |
| 25 to 29 Years | 17 (47.2%) | 0 (0.0%) |
| 30 to 34 Years | 0 (0.0%) | 0 (0.0%) |
| 35 to 44 Years | 15 (65.2%) | 0 (0.0%) |
| 45 to 54 Years | 124 (92.5%) | 11 (8.9%) |
| 55 to 59 Years | 42 (75.0%) | 0 (0.0%) |
| 60 to 64 Years | 42 (100.0%) | 0 (0.0%) |
| 65 to 74 Years | 52 (39.1%) | 0 (0.0%) |
| 75 Years and over | 9 (10.3%) | 0 (0.0%) |
| Total | 376 (58.1%) | 28 (7.4%) |
Employment Status by Educational Attainment in Granite
According to labor force statistics for Granite, 82.5% of individuals (240) out of the total population between 25 and 64 years of age (291) are in the labor force, with 4.6% or 11 of them being unemployed. The group with the highest labor force participation rate are those with the educational attainment of high school diploma, with 100.0% or 20 individuals in the labor force. Within the labor force, individuals with bachelor's degree or higher education have the highest percentage of unemployment, with 8.7% or 11 of them being unemployed.
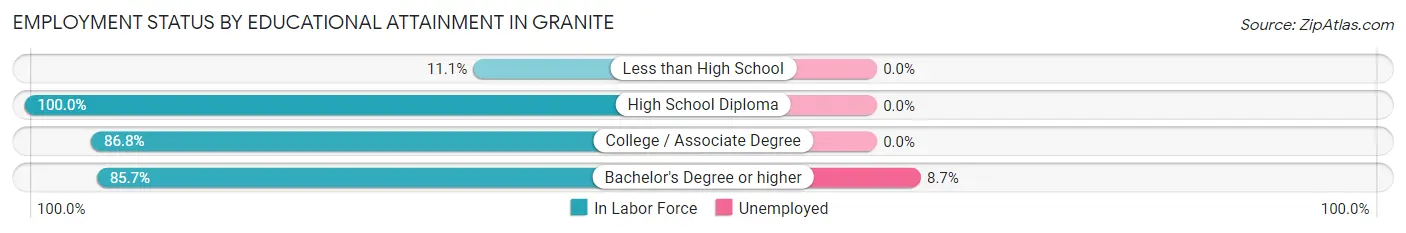
| Educational Attainment | In Labor Force | Unemployed |
| Less than High School | 2 (11.1%) | 0 (0.0%) |
| High School Diploma | 20 (100.0%) | 0 (0.0%) |
| College / Associate Degree | 92 (86.8%) | 0 (0.0%) |
| Bachelor's Degree or higher | 126 (85.7%) | 13 (8.7%) |
| Total | 240 (82.5%) | 13 (4.6%) |
Employment Occupations by Sex in Granite
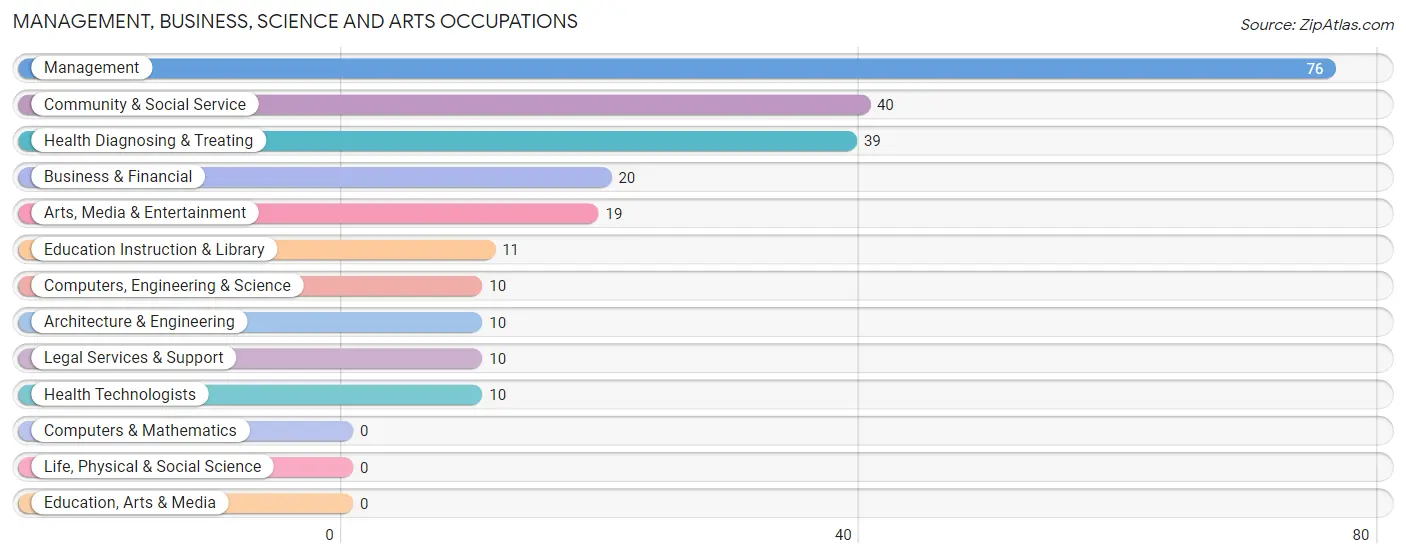
Management, Business, Science and Arts Occupations
The most common Management, Business, Science and Arts occupations in Granite are Management (76 | 21.8%), Community & Social Service (40 | 11.5%), Health Diagnosing & Treating (39 | 11.2%), Business & Financial (20 | 5.8%), and Arts, Media & Entertainment (19 | 5.5%).
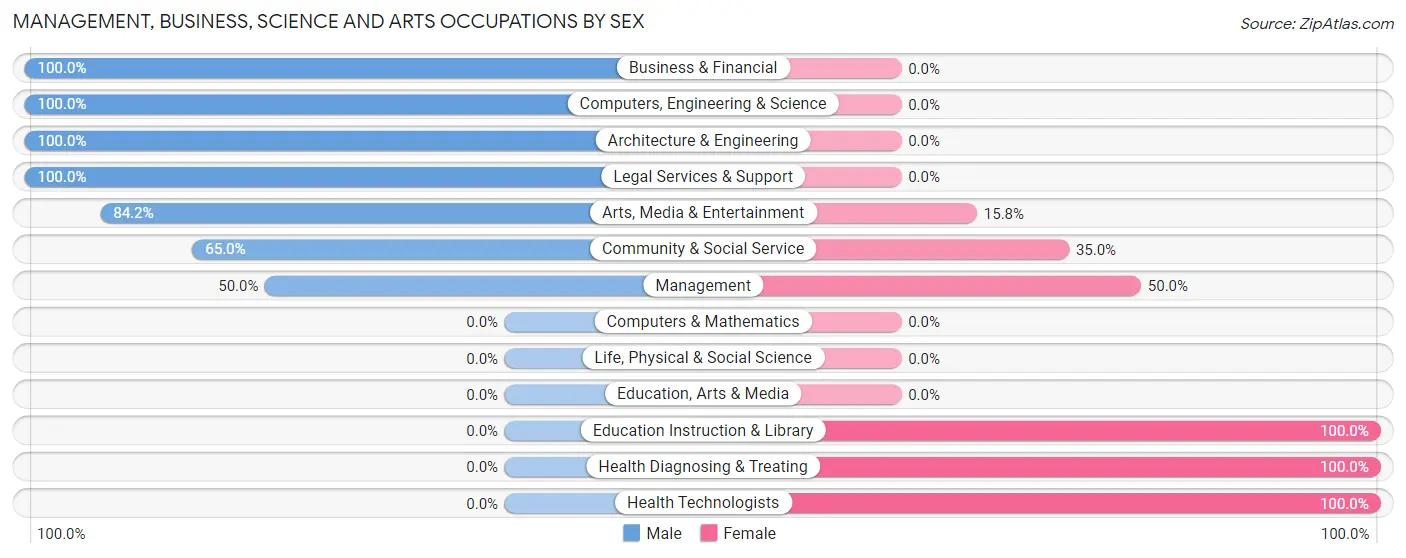
Management, Business, Science and Arts Occupations by Sex
Within the Management, Business, Science and Arts occupations in Granite, the most male-oriented occupations are Business & Financial (100.0%), Computers, Engineering & Science (100.0%), and Architecture & Engineering (100.0%), while the most female-oriented occupations are Education Instruction & Library (100.0%), Health Diagnosing & Treating (100.0%), and Health Technologists (100.0%).
| Occupation | Male | Female |
| Management | 38 (50.0%) | 38 (50.0%) |
| Business & Financial | 20 (100.0%) | 0 (0.0%) |
| Computers, Engineering & Science | 10 (100.0%) | 0 (0.0%) |
| Computers & Mathematics | 0 (0.0%) | 0 (0.0%) |
| Architecture & Engineering | 10 (100.0%) | 0 (0.0%) |
| Life, Physical & Social Science | 0 (0.0%) | 0 (0.0%) |
| Community & Social Service | 26 (65.0%) | 14 (35.0%) |
| Education, Arts & Media | 0 (0.0%) | 0 (0.0%) |
| Legal Services & Support | 10 (100.0%) | 0 (0.0%) |
| Education Instruction & Library | 0 (0.0%) | 11 (100.0%) |
| Arts, Media & Entertainment | 16 (84.2%) | 3 (15.8%) |
| Health Diagnosing & Treating | 0 (0.0%) | 39 (100.0%) |
| Health Technologists | 0 (0.0%) | 10 (100.0%) |
| Total (Category) | 94 (50.8%) | 91 (49.2%) |
| Total (Overall) | 205 (58.9%) | 143 (41.1%) |
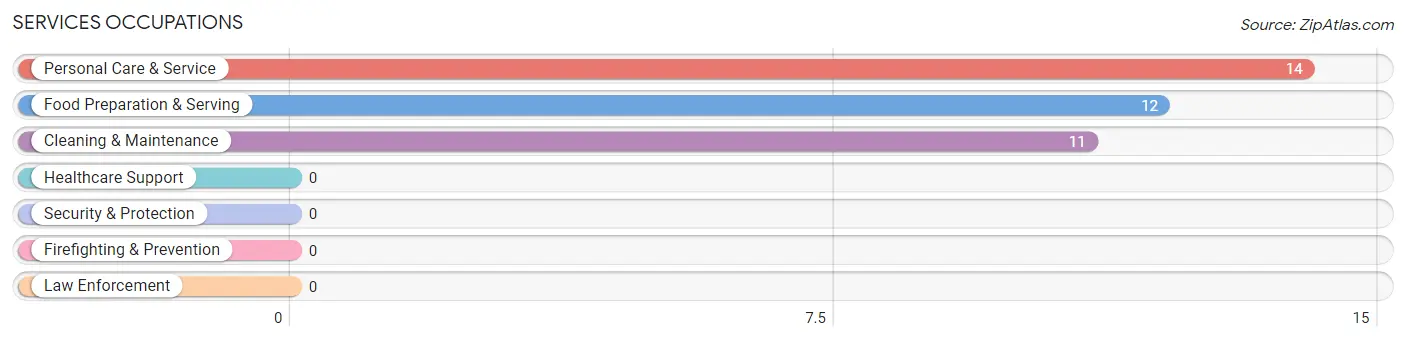
Services Occupations
The most common Services occupations in Granite are Personal Care & Service (14 | 4.0%), Food Preparation & Serving (12 | 3.5%), and Cleaning & Maintenance (11 | 3.2%).
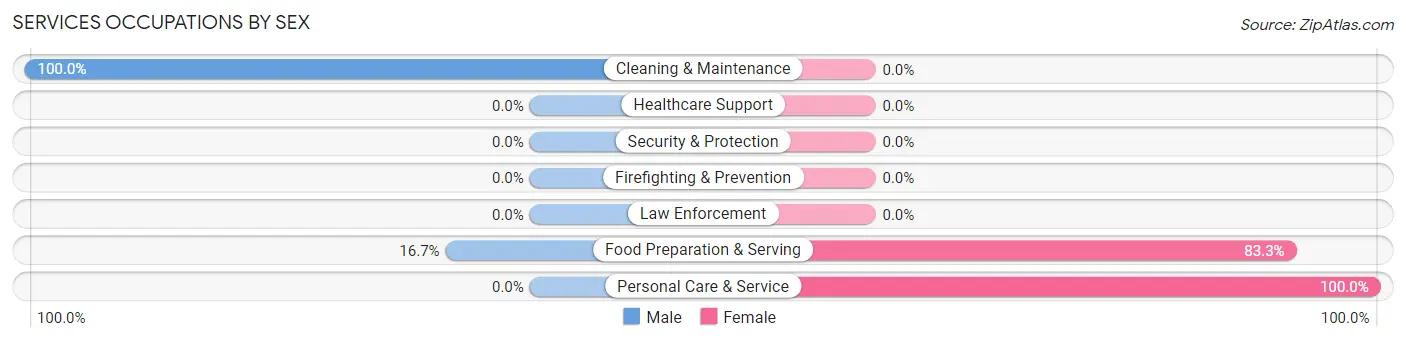
Services Occupations by Sex
Within the Services occupations in Granite, the most male-oriented occupations are Cleaning & Maintenance (100.0%), and Food Preparation & Serving (16.7%), while the most female-oriented occupations are Personal Care & Service (100.0%), and Food Preparation & Serving (83.3%).
| Occupation | Male | Female |
| Healthcare Support | 0 (0.0%) | 0 (0.0%) |
| Security & Protection | 0 (0.0%) | 0 (0.0%) |
| Firefighting & Prevention | 0 (0.0%) | 0 (0.0%) |
| Law Enforcement | 0 (0.0%) | 0 (0.0%) |
| Food Preparation & Serving | 2 (16.7%) | 10 (83.3%) |
| Cleaning & Maintenance | 11 (100.0%) | 0 (0.0%) |
| Personal Care & Service | 0 (0.0%) | 14 (100.0%) |
| Total (Category) | 13 (35.1%) | 24 (64.9%) |
| Total (Overall) | 205 (58.9%) | 143 (41.1%) |
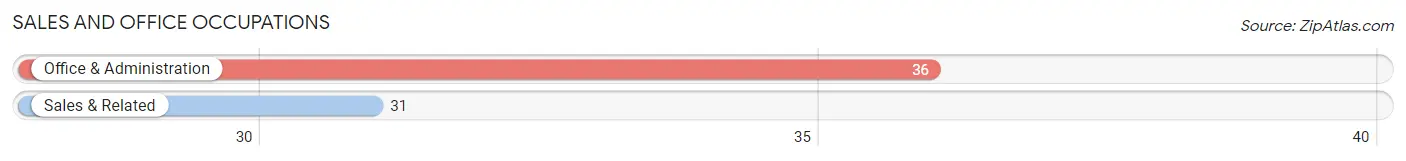
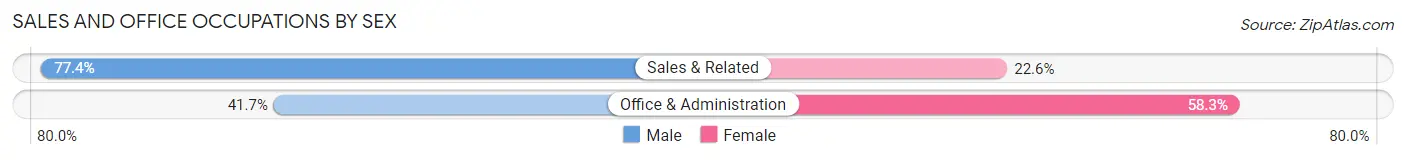
Sales and Office Occupations
The most common Sales and Office occupations in Granite are Office & Administration (36 | 10.3%), and Sales & Related (31 | 8.9%).
Sales and Office Occupations by Sex
| Occupation | Male | Female |
| Sales & Related | 24 (77.4%) | 7 (22.6%) |
| Office & Administration | 15 (41.7%) | 21 (58.3%) |
| Total (Category) | 39 (58.2%) | 28 (41.8%) |
| Total (Overall) | 205 (58.9%) | 143 (41.1%) |
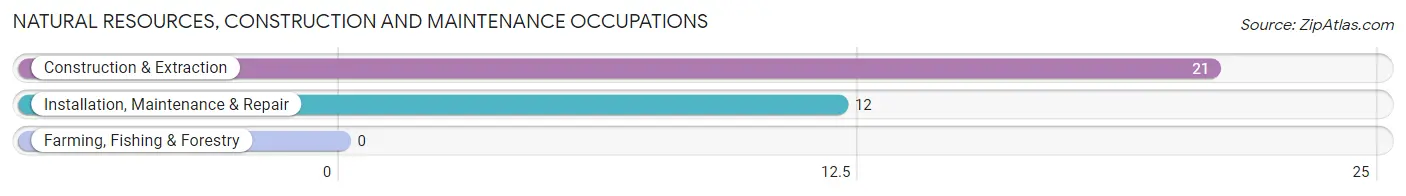
Natural Resources, Construction and Maintenance Occupations
The most common Natural Resources, Construction and Maintenance occupations in Granite are Construction & Extraction (21 | 6.0%), and Installation, Maintenance & Repair (12 | 3.5%).
Natural Resources, Construction and Maintenance Occupations by Sex
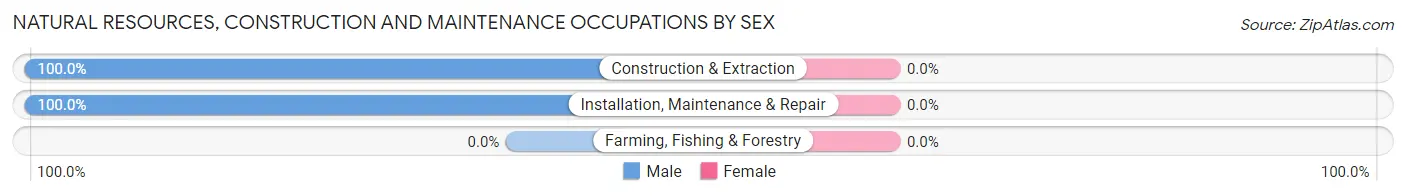
| Occupation | Male | Female |
| Farming, Fishing & Forestry | 0 (0.0%) | 0 (0.0%) |
| Construction & Extraction | 21 (100.0%) | 0 (0.0%) |
| Installation, Maintenance & Repair | 12 (100.0%) | 0 (0.0%) |
| Total (Category) | 33 (100.0%) | 0 (0.0%) |
| Total (Overall) | 205 (58.9%) | 143 (41.1%) |
Production, Transportation and Moving Occupations
The most common Production, Transportation and Moving occupations in Granite are Transportation (18 | 5.2%), and Material Moving (8 | 2.3%).
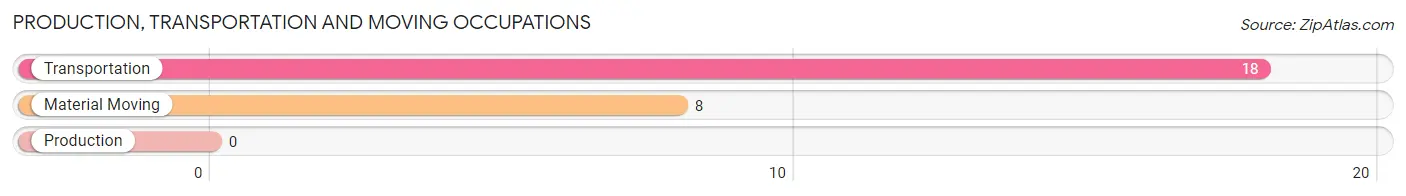
Production, Transportation and Moving Occupations by Sex
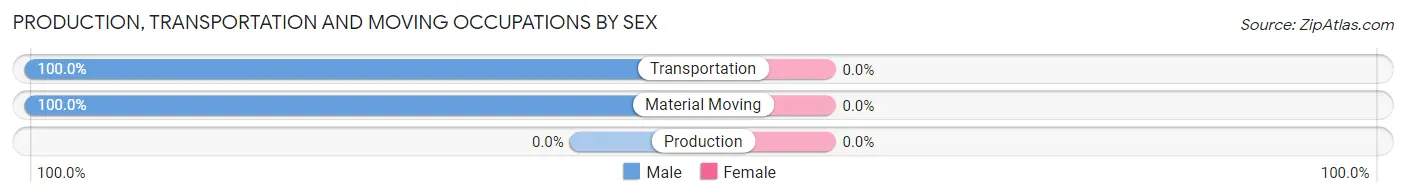
| Occupation | Male | Female |
| Production | 0 (0.0%) | 0 (0.0%) |
| Transportation | 18 (100.0%) | 0 (0.0%) |
| Material Moving | 8 (100.0%) | 0 (0.0%) |
| Total (Category) | 26 (100.0%) | 0 (0.0%) |
| Total (Overall) | 205 (58.9%) | 143 (41.1%) |
Employment Industries by Sex in Granite
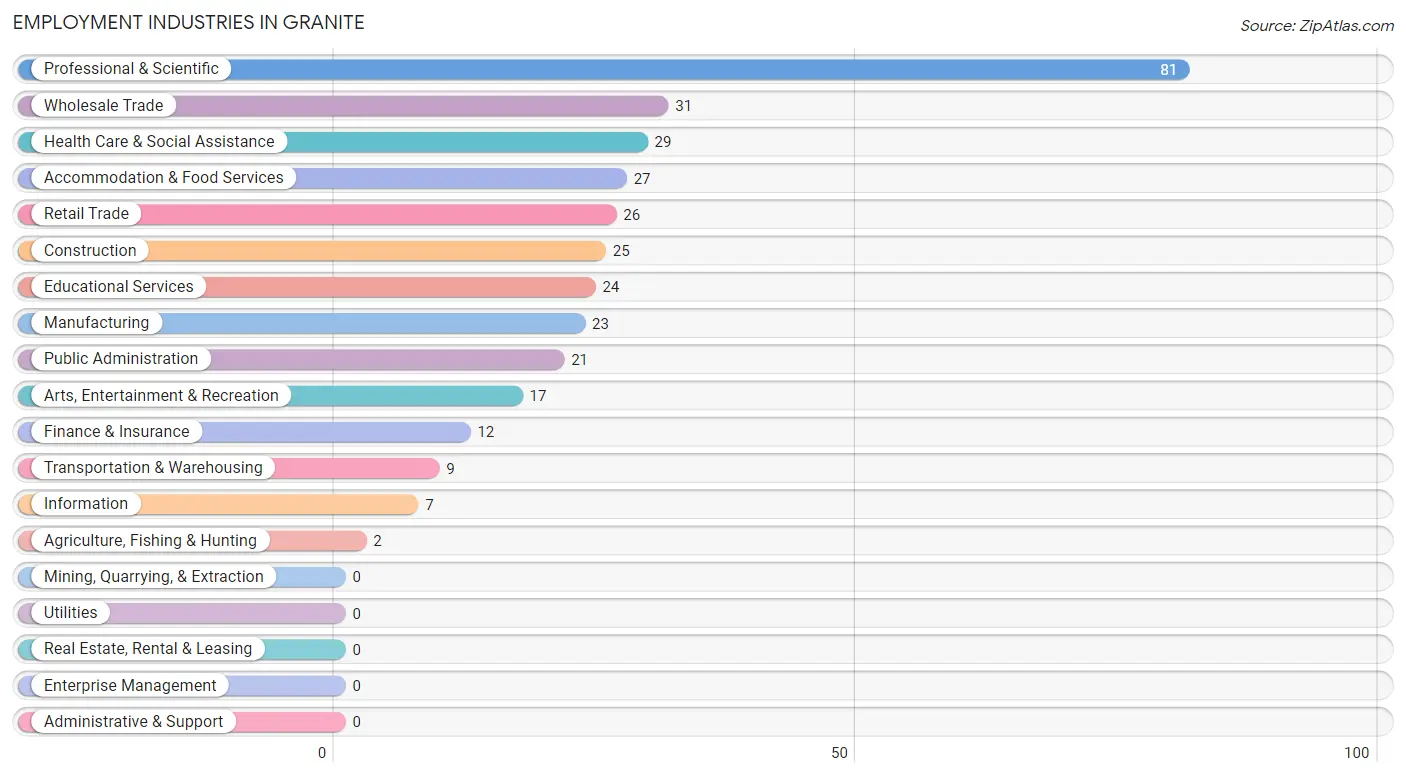
Employment Industries in Granite
The major employment industries in Granite include Professional & Scientific (81 | 23.3%), Wholesale Trade (31 | 8.9%), Health Care & Social Assistance (29 | 8.3%), Accommodation & Food Services (27 | 7.8%), and Retail Trade (26 | 7.5%).
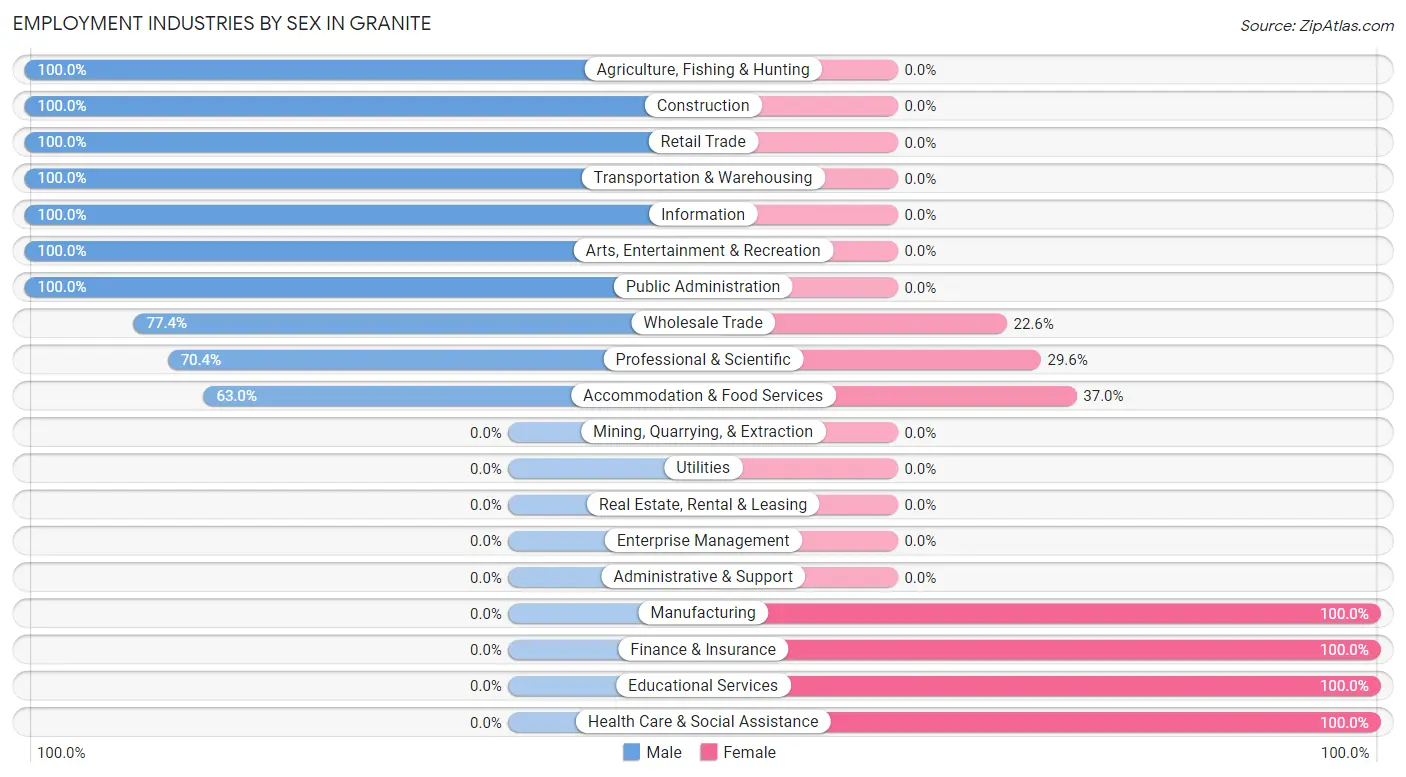
Employment Industries by Sex in Granite
The Granite industries that see more men than women are Agriculture, Fishing & Hunting (100.0%), Construction (100.0%), and Retail Trade (100.0%), whereas the industries that tend to have a higher number of women are Manufacturing (100.0%), Finance & Insurance (100.0%), and Educational Services (100.0%).
| Industry | Male | Female |
| Agriculture, Fishing & Hunting | 2 (100.0%) | 0 (0.0%) |
| Mining, Quarrying, & Extraction | 0 (0.0%) | 0 (0.0%) |
| Construction | 25 (100.0%) | 0 (0.0%) |
| Manufacturing | 0 (0.0%) | 23 (100.0%) |
| Wholesale Trade | 24 (77.4%) | 7 (22.6%) |
| Retail Trade | 26 (100.0%) | 0 (0.0%) |
| Transportation & Warehousing | 9 (100.0%) | 0 (0.0%) |
| Utilities | 0 (0.0%) | 0 (0.0%) |
| Information | 7 (100.0%) | 0 (0.0%) |
| Finance & Insurance | 0 (0.0%) | 12 (100.0%) |
| Real Estate, Rental & Leasing | 0 (0.0%) | 0 (0.0%) |
| Professional & Scientific | 57 (70.4%) | 24 (29.6%) |
| Enterprise Management | 0 (0.0%) | 0 (0.0%) |
| Administrative & Support | 0 (0.0%) | 0 (0.0%) |
| Educational Services | 0 (0.0%) | 24 (100.0%) |
| Health Care & Social Assistance | 0 (0.0%) | 29 (100.0%) |
| Arts, Entertainment & Recreation | 17 (100.0%) | 0 (0.0%) |
| Accommodation & Food Services | 17 (63.0%) | 10 (37.0%) |
| Public Administration | 21 (100.0%) | 0 (0.0%) |
| Total | 205 (58.9%) | 143 (41.1%) |
Education in Granite
School Enrollment in Granite
The most common levels of schooling among the 169 students in Granite are high school (80 | 47.3%), college / undergraduate (36 | 21.3%), and elementary school (26 | 15.4%).
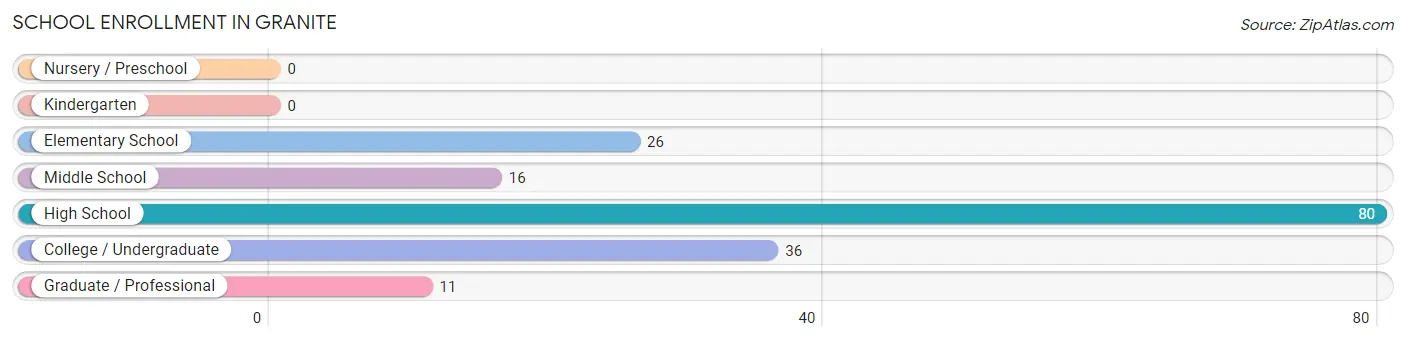
| School Level | # Students | % Students |
| Nursery / Preschool | 0 | 0.0% |
| Kindergarten | 0 | 0.0% |
| Elementary School | 26 | 15.4% |
| Middle School | 16 | 9.5% |
| High School | 80 | 47.3% |
| College / Undergraduate | 36 | 21.3% |
| Graduate / Professional | 11 | 6.5% |
| Total | 169 | 100.0% |
School Enrollment by Age by Funding Source in Granite
Out of a total of 169 students who are enrolled in schools in Granite, 65 (38.5%) attend a private institution, while the remaining 104 (61.5%) are enrolled in public schools. The age group of 25 to 34 year olds has the highest likelihood of being enrolled in private schools, with 11 (100.0% in the age bracket) enrolled. Conversely, the age group of 5 to 9 year old has the lowest likelihood of being enrolled in a private school, with 16 (100.0% in the age bracket) attending a public institution.
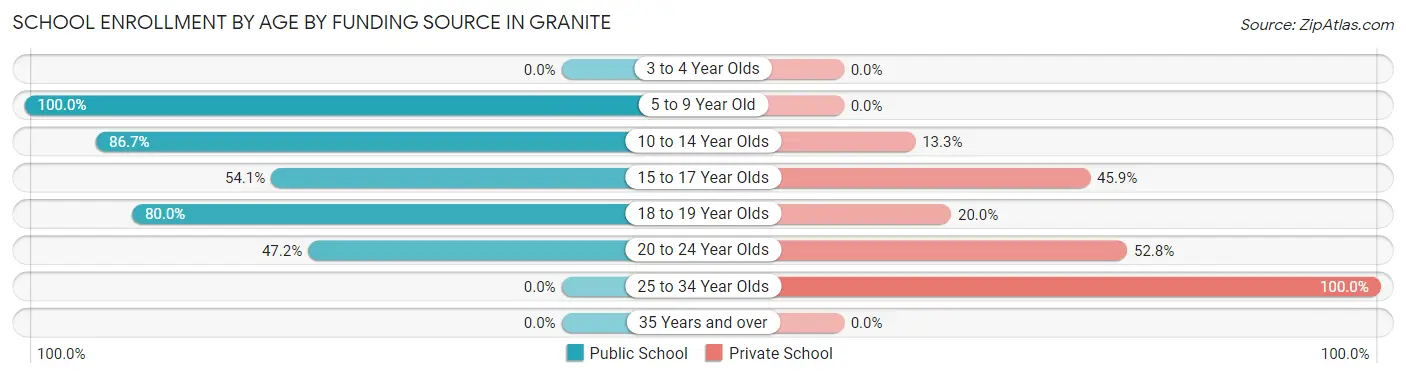
| Age Bracket | Public School | Private School |
| 3 to 4 Year Olds | 0 (0.0%) | 0 (0.0%) |
| 5 to 9 Year Old | 16 (100.0%) | 0 (0.0%) |
| 10 to 14 Year Olds | 26 (86.7%) | 4 (13.3%) |
| 15 to 17 Year Olds | 33 (54.1%) | 28 (45.9%) |
| 18 to 19 Year Olds | 12 (80.0%) | 3 (20.0%) |
| 20 to 24 Year Olds | 17 (47.2%) | 19 (52.8%) |
| 25 to 34 Year Olds | 0 (0.0%) | 11 (100.0%) |
| 35 Years and over | 0 (0.0%) | 0 (0.0%) |
| Total | 104 (61.5%) | 65 (38.5%) |
Educational Attainment by Field of Study in Granite
Science & technology (65 | 20.4%), business (64 | 20.1%), social sciences (56 | 17.5%), communications (44 | 13.8%), and education (26 | 8.2%) are the most common fields of study among 319 individuals in Granite who have obtained a bachelor's degree or higher.
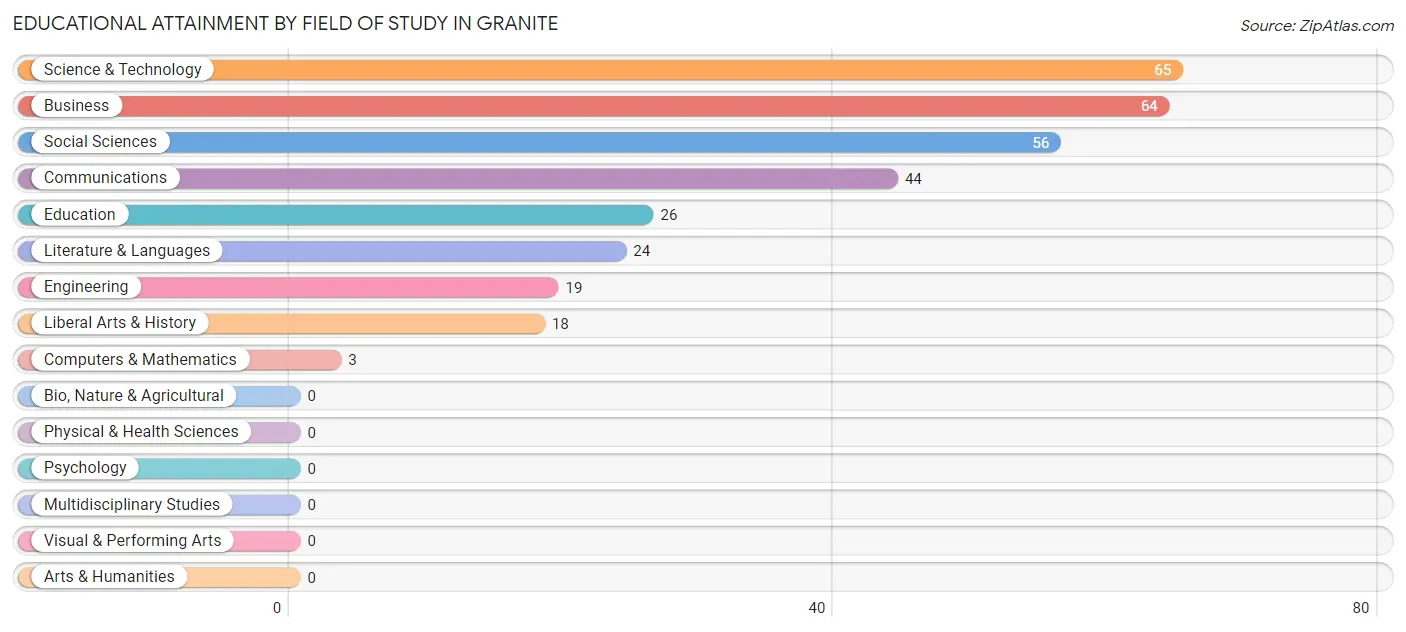
| Field of Study | # Graduates | % Graduates |
| Computers & Mathematics | 3 | 0.9% |
| Bio, Nature & Agricultural | 0 | 0.0% |
| Physical & Health Sciences | 0 | 0.0% |
| Psychology | 0 | 0.0% |
| Social Sciences | 56 | 17.5% |
| Engineering | 19 | 6.0% |
| Multidisciplinary Studies | 0 | 0.0% |
| Science & Technology | 65 | 20.4% |
| Business | 64 | 20.1% |
| Education | 26 | 8.2% |
| Literature & Languages | 24 | 7.5% |
| Liberal Arts & History | 18 | 5.6% |
| Visual & Performing Arts | 0 | 0.0% |
| Communications | 44 | 13.8% |
| Arts & Humanities | 0 | 0.0% |
| Total | 319 | 100.0% |
Transportation & Commute in Granite
Vehicle Availability by Sex in Granite
The most prevalent vehicle ownership categories in Granite are males with 3 vehicles (90, accounting for 44.8%) and females with 3 vehicles (48, making up 64.3%).
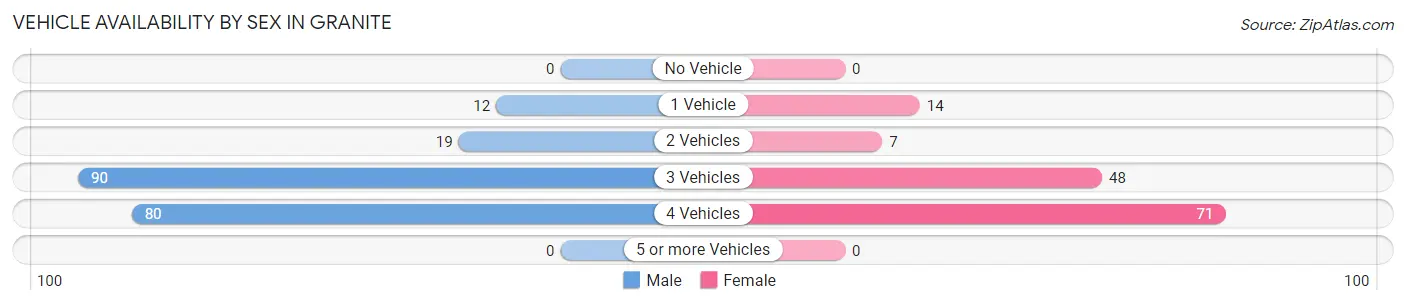
| Vehicles Available | Male | Female |
| No Vehicle | 0 (0.0%) | 0 (0.0%) |
| 1 Vehicle | 12 (6.0%) | 14 (10.0%) |
| 2 Vehicles | 19 (9.5%) | 7 (5.0%) |
| 3 Vehicles | 90 (44.8%) | 48 (34.3%) |
| 4 Vehicles | 80 (39.8%) | 71 (50.7%) |
| 5 or more Vehicles | 0 (0.0%) | 0 (0.0%) |
| Total | 201 (100.0%) | 140 (100.0%) |
Commute Time in Granite
The most frequently occuring commute durations in Granite are 25 to 29 minutes (80 commuters, 33.3%), 20 to 24 minutes (49 commuters, 20.4%), and 30 to 34 minutes (28 commuters, 11.7%).
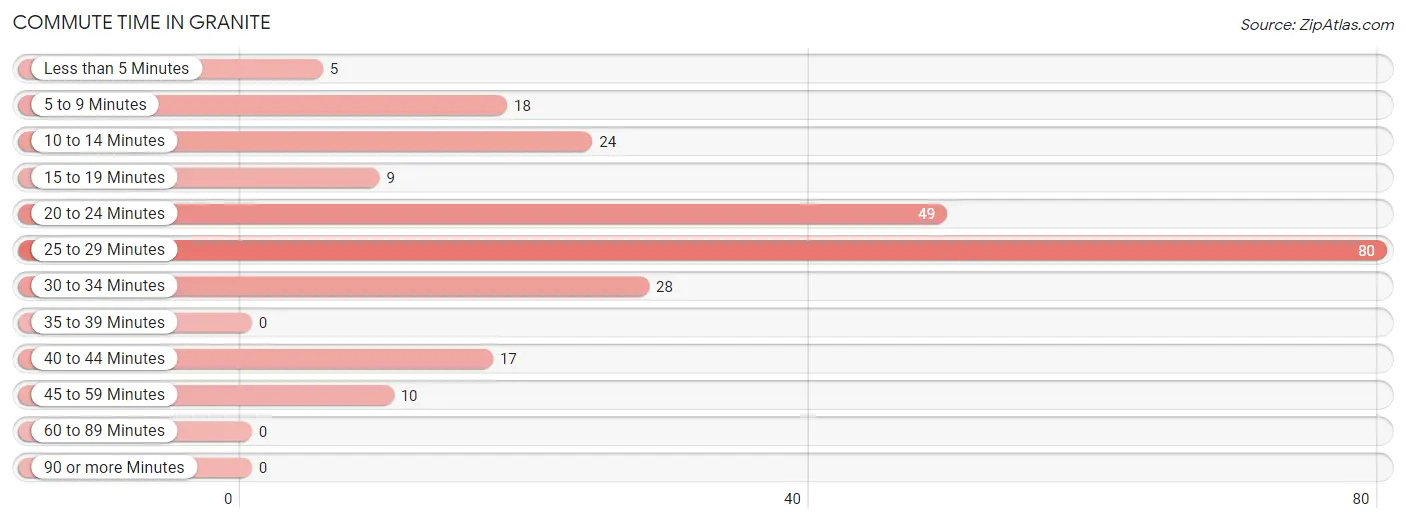
| Commute Time | # Commuters | % Commuters |
| Less than 5 Minutes | 5 | 2.1% |
| 5 to 9 Minutes | 18 | 7.5% |
| 10 to 14 Minutes | 24 | 10.0% |
| 15 to 19 Minutes | 9 | 3.7% |
| 20 to 24 Minutes | 49 | 20.4% |
| 25 to 29 Minutes | 80 | 33.3% |
| 30 to 34 Minutes | 28 | 11.7% |
| 35 to 39 Minutes | 0 | 0.0% |
| 40 to 44 Minutes | 17 | 7.1% |
| 45 to 59 Minutes | 10 | 4.2% |
| 60 to 89 Minutes | 0 | 0.0% |
| 90 or more Minutes | 0 | 0.0% |
Commute Time by Sex in Granite
The most common commute times in Granite are 25 to 29 minutes (44 commuters, 29.5%) for males and 25 to 29 minutes (36 commuters, 39.6%) for females.
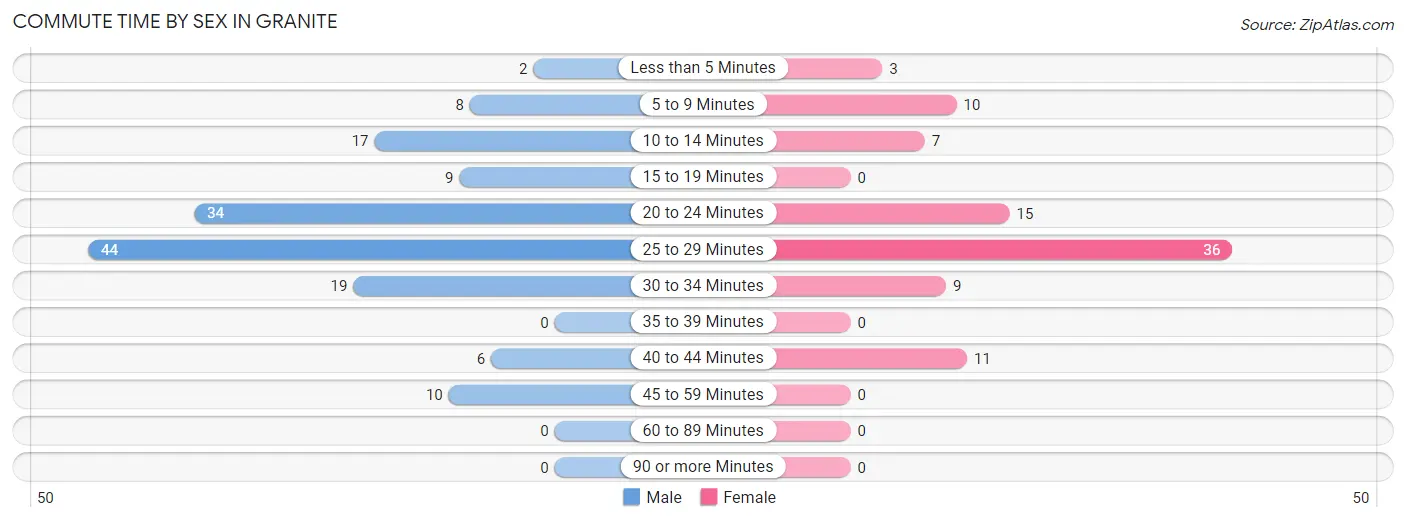
| Commute Time | Male | Female |
| Less than 5 Minutes | 2 (1.3%) | 3 (3.3%) |
| 5 to 9 Minutes | 8 (5.4%) | 10 (11.0%) |
| 10 to 14 Minutes | 17 (11.4%) | 7 (7.7%) |
| 15 to 19 Minutes | 9 (6.0%) | 0 (0.0%) |
| 20 to 24 Minutes | 34 (22.8%) | 15 (16.5%) |
| 25 to 29 Minutes | 44 (29.5%) | 36 (39.6%) |
| 30 to 34 Minutes | 19 (12.8%) | 9 (9.9%) |
| 35 to 39 Minutes | 0 (0.0%) | 0 (0.0%) |
| 40 to 44 Minutes | 6 (4.0%) | 11 (12.1%) |
| 45 to 59 Minutes | 10 (6.7%) | 0 (0.0%) |
| 60 to 89 Minutes | 0 (0.0%) | 0 (0.0%) |
| 90 or more Minutes | 0 (0.0%) | 0 (0.0%) |
Time of Departure to Work by Sex in Granite
The most frequent times of departure to work in Granite are 10:00 AM to 10:59 AM (34, 22.8%) for males and 7:00 AM to 7:29 AM (25, 27.5%) for females.
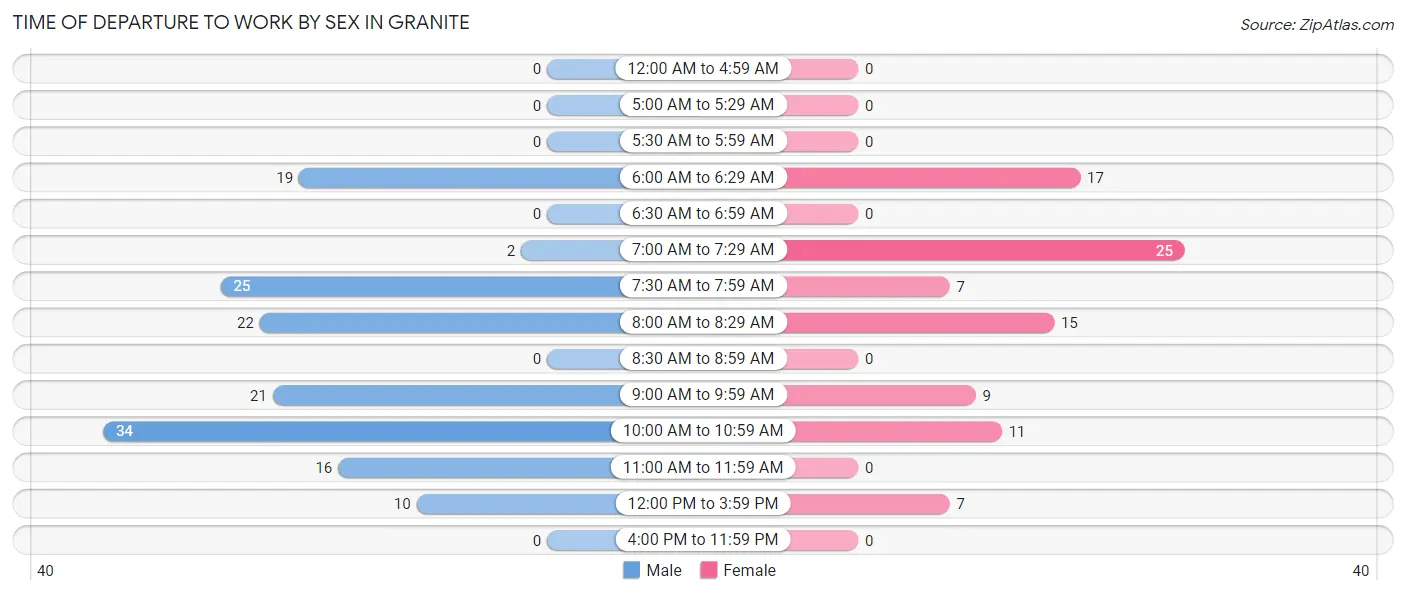
| Time of Departure | Male | Female |
| 12:00 AM to 4:59 AM | 0 (0.0%) | 0 (0.0%) |
| 5:00 AM to 5:29 AM | 0 (0.0%) | 0 (0.0%) |
| 5:30 AM to 5:59 AM | 0 (0.0%) | 0 (0.0%) |
| 6:00 AM to 6:29 AM | 19 (12.8%) | 17 (18.7%) |
| 6:30 AM to 6:59 AM | 0 (0.0%) | 0 (0.0%) |
| 7:00 AM to 7:29 AM | 2 (1.3%) | 25 (27.5%) |
| 7:30 AM to 7:59 AM | 25 (16.8%) | 7 (7.7%) |
| 8:00 AM to 8:29 AM | 22 (14.8%) | 15 (16.5%) |
| 8:30 AM to 8:59 AM | 0 (0.0%) | 0 (0.0%) |
| 9:00 AM to 9:59 AM | 21 (14.1%) | 9 (9.9%) |
| 10:00 AM to 10:59 AM | 34 (22.8%) | 11 (12.1%) |
| 11:00 AM to 11:59 AM | 16 (10.7%) | 0 (0.0%) |
| 12:00 PM to 3:59 PM | 10 (6.7%) | 7 (7.7%) |
| 4:00 PM to 11:59 PM | 0 (0.0%) | 0 (0.0%) |
| Total | 149 (100.0%) | 91 (100.0%) |
Housing Occupancy in Granite
Occupancy by Ownership in Granite
Of the total 228 dwellings in Granite, owner-occupied units account for 207 (90.8%), while renter-occupied units make up 21 (9.2%).
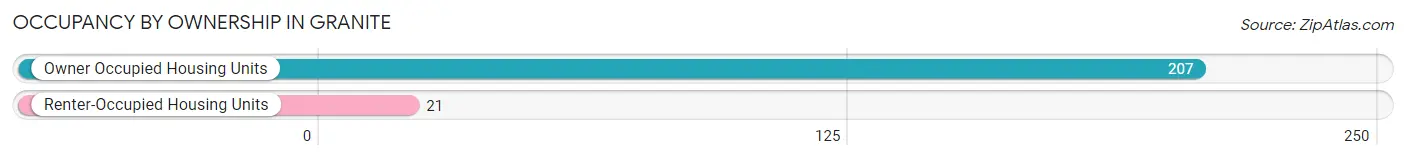
| Occupancy | # Housing Units | % Housing Units |
| Owner Occupied Housing Units | 207 | 90.8% |
| Renter-Occupied Housing Units | 21 | 9.2% |
| Total Occupied Housing Units | 228 | 100.0% |
Occupancy by Household Size in Granite
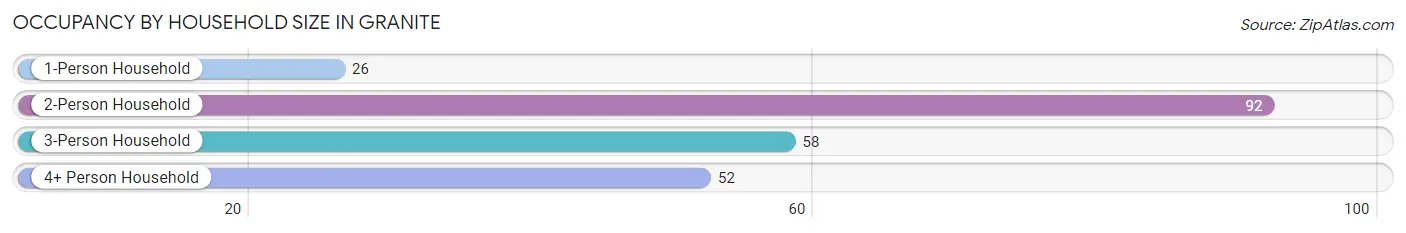
| Household Size | # Housing Units | % Housing Units |
| 1-Person Household | 26 | 11.4% |
| 2-Person Household | 92 | 40.4% |
| 3-Person Household | 58 | 25.4% |
| 4+ Person Household | 52 | 22.8% |
| Total Housing Units | 228 | 100.0% |
Occupancy by Ownership by Household Size in Granite
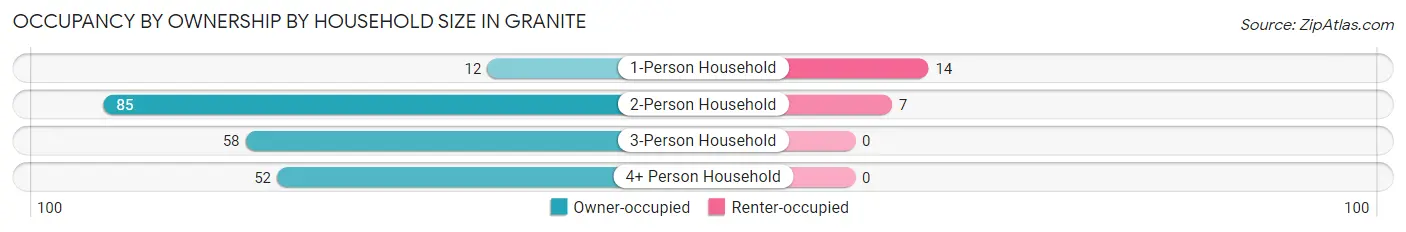
| Household Size | Owner-occupied | Renter-occupied |
| 1-Person Household | 12 (46.2%) | 14 (53.8%) |
| 2-Person Household | 85 (92.4%) | 7 (7.6%) |
| 3-Person Household | 58 (100.0%) | 0 (0.0%) |
| 4+ Person Household | 52 (100.0%) | 0 (0.0%) |
| Total Housing Units | 207 (90.8%) | 21 (9.2%) |
Occupancy by Educational Attainment in Granite
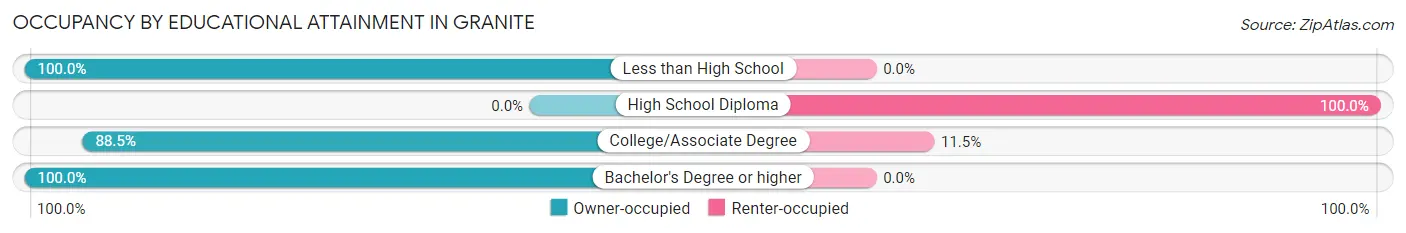
| Household Size | Owner-occupied | Renter-occupied |
| Less than High School | 8 (100.0%) | 0 (0.0%) |
| High School Diploma | 0 (0.0%) | 14 (100.0%) |
| College/Associate Degree | 54 (88.5%) | 7 (11.5%) |
| Bachelor's Degree or higher | 145 (100.0%) | 0 (0.0%) |
Occupancy by Age of Householder in Granite
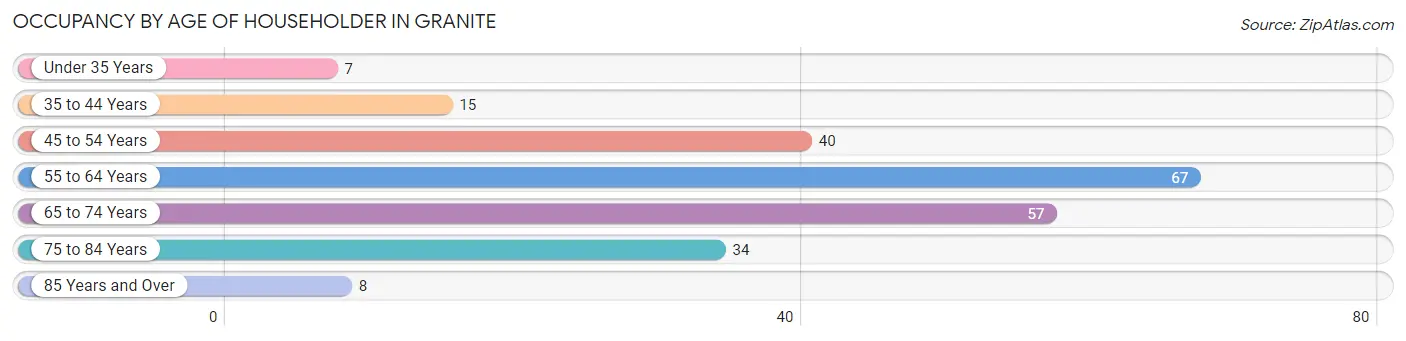
| Age Bracket | # Households | % Households |
| Under 35 Years | 7 | 3.1% |
| 35 to 44 Years | 15 | 6.6% |
| 45 to 54 Years | 40 | 17.5% |
| 55 to 64 Years | 67 | 29.4% |
| 65 to 74 Years | 57 | 25.0% |
| 75 to 84 Years | 34 | 14.9% |
| 85 Years and Over | 8 | 3.5% |
| Total | 228 | 100.0% |
Housing Finances in Granite
Median Income by Occupancy in Granite
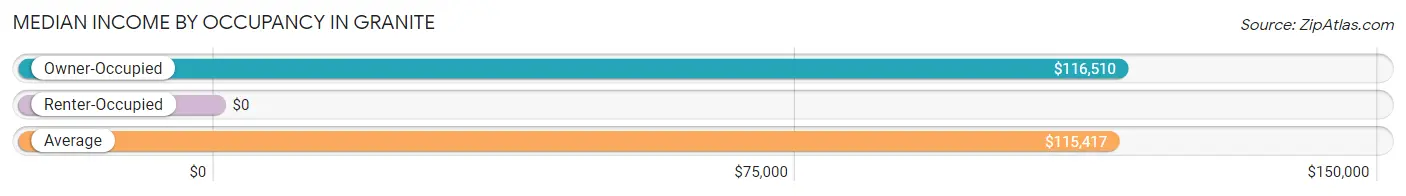
| Occupancy Type | # Households | Median Income |
| Owner-Occupied | 207 (90.8%) | $116,510 |
| Renter-Occupied | 21 (9.2%) | $0 |
| Average | 228 (100.0%) | $115,417 |
Occupancy by Householder Income Bracket in Granite
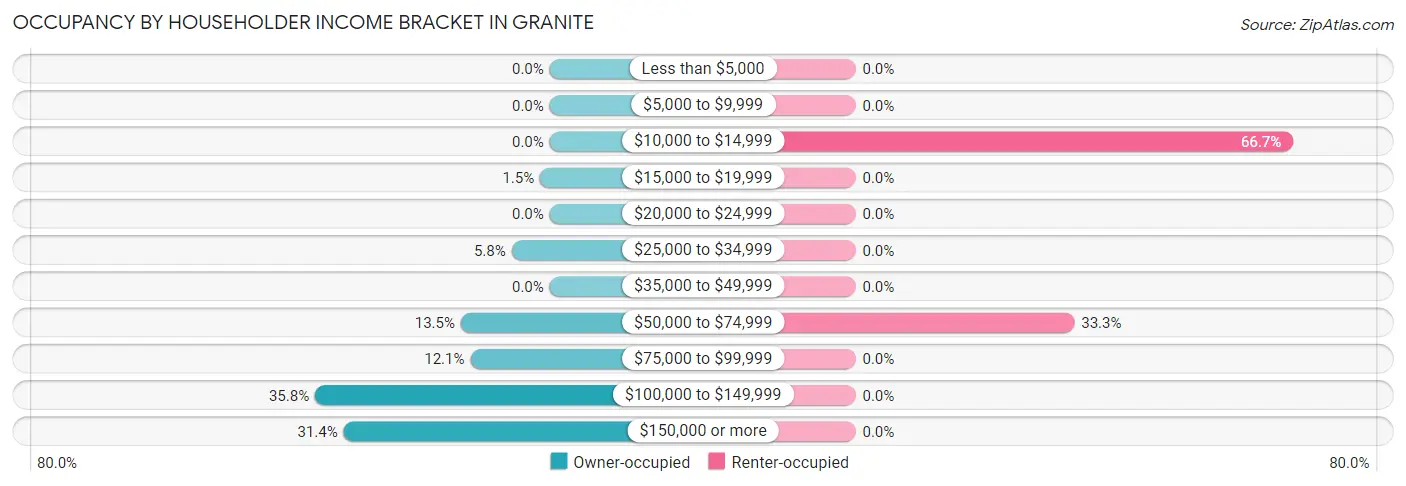
| Income Bracket | Owner-occupied | Renter-occupied |
| Less than $5,000 | 0 (0.0%) | 0 (0.0%) |
| $5,000 to $9,999 | 0 (0.0%) | 0 (0.0%) |
| $10,000 to $14,999 | 0 (0.0%) | 14 (66.7%) |
| $15,000 to $19,999 | 3 (1.5%) | 0 (0.0%) |
| $20,000 to $24,999 | 0 (0.0%) | 0 (0.0%) |
| $25,000 to $34,999 | 12 (5.8%) | 0 (0.0%) |
| $35,000 to $49,999 | 0 (0.0%) | 0 (0.0%) |
| $50,000 to $74,999 | 28 (13.5%) | 7 (33.3%) |
| $75,000 to $99,999 | 25 (12.1%) | 0 (0.0%) |
| $100,000 to $149,999 | 74 (35.7%) | 0 (0.0%) |
| $150,000 or more | 65 (31.4%) | 0 (0.0%) |
| Total | 207 (100.0%) | 21 (100.0%) |
Monthly Housing Cost Tiers in Granite
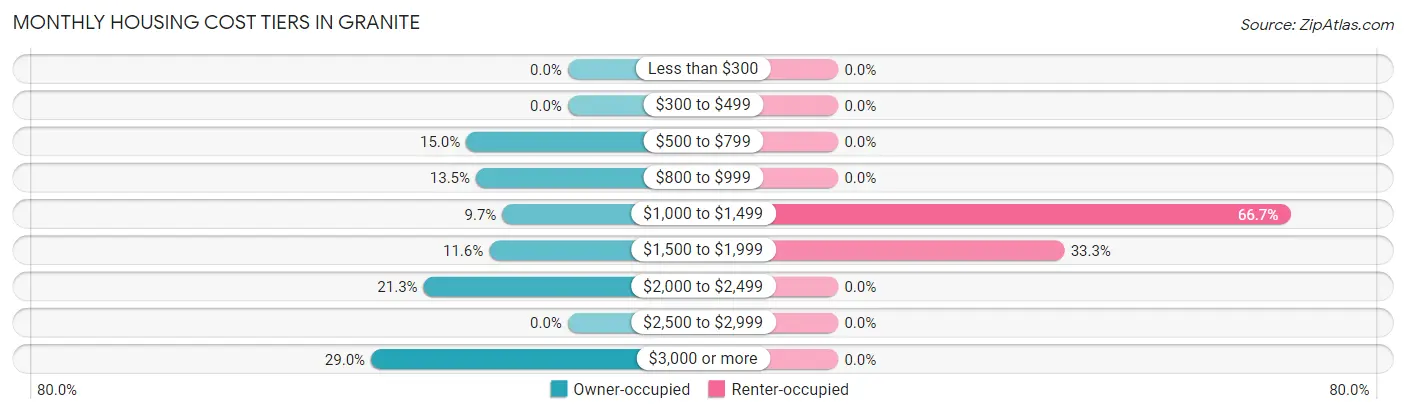
| Monthly Cost | Owner-occupied | Renter-occupied |
| Less than $300 | 0 (0.0%) | 0 (0.0%) |
| $300 to $499 | 0 (0.0%) | 0 (0.0%) |
| $500 to $799 | 31 (15.0%) | 0 (0.0%) |
| $800 to $999 | 28 (13.5%) | 0 (0.0%) |
| $1,000 to $1,499 | 20 (9.7%) | 14 (66.7%) |
| $1,500 to $1,999 | 24 (11.6%) | 7 (33.3%) |
| $2,000 to $2,499 | 44 (21.3%) | 0 (0.0%) |
| $2,500 to $2,999 | 0 (0.0%) | 0 (0.0%) |
| $3,000 or more | 60 (29.0%) | 0 (0.0%) |
| Total | 207 (100.0%) | 21 (100.0%) |
Physical Housing Characteristics in Granite
Housing Structures in Granite
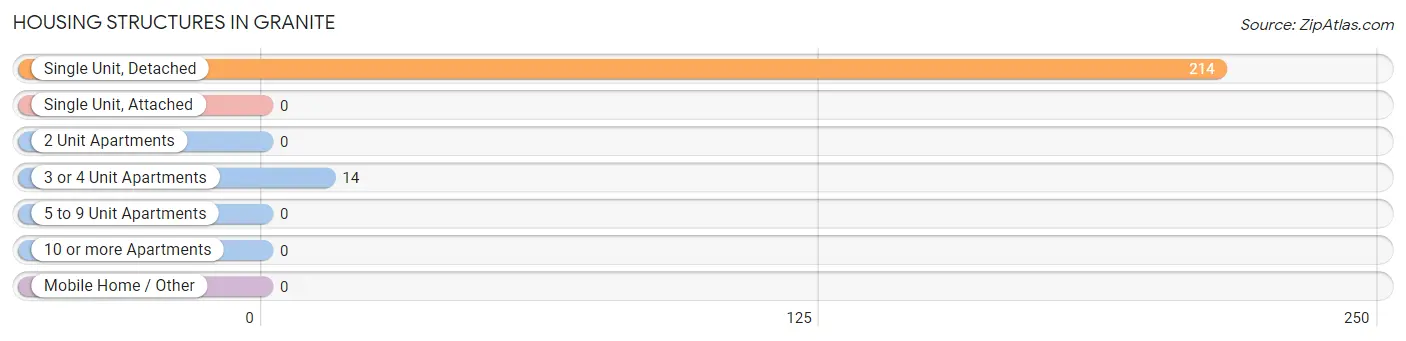
| Structure Type | # Housing Units | % Housing Units |
| Single Unit, Detached | 214 | 93.9% |
| Single Unit, Attached | 0 | 0.0% |
| 2 Unit Apartments | 0 | 0.0% |
| 3 or 4 Unit Apartments | 14 | 6.1% |
| 5 to 9 Unit Apartments | 0 | 0.0% |
| 10 or more Apartments | 0 | 0.0% |
| Mobile Home / Other | 0 | 0.0% |
| Total | 228 | 100.0% |
Housing Structures by Occupancy in Granite
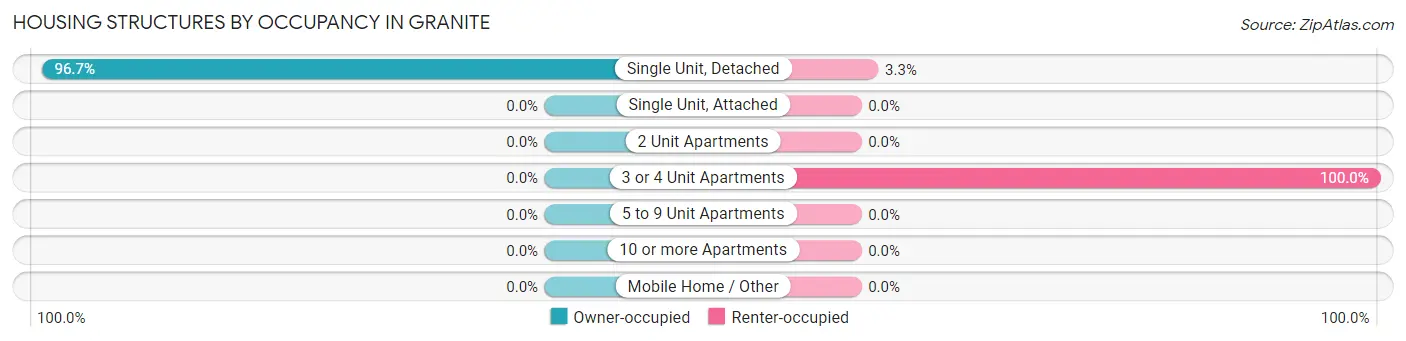
| Structure Type | Owner-occupied | Renter-occupied |
| Single Unit, Detached | 207 (96.7%) | 7 (3.3%) |
| Single Unit, Attached | 0 (0.0%) | 0 (0.0%) |
| 2 Unit Apartments | 0 (0.0%) | 0 (0.0%) |
| 3 or 4 Unit Apartments | 0 (0.0%) | 14 (100.0%) |
| 5 to 9 Unit Apartments | 0 (0.0%) | 0 (0.0%) |
| 10 or more Apartments | 0 (0.0%) | 0 (0.0%) |
| Mobile Home / Other | 0 (0.0%) | 0 (0.0%) |
| Total | 207 (90.8%) | 21 (9.2%) |
Housing Structures by Number of Rooms in Granite
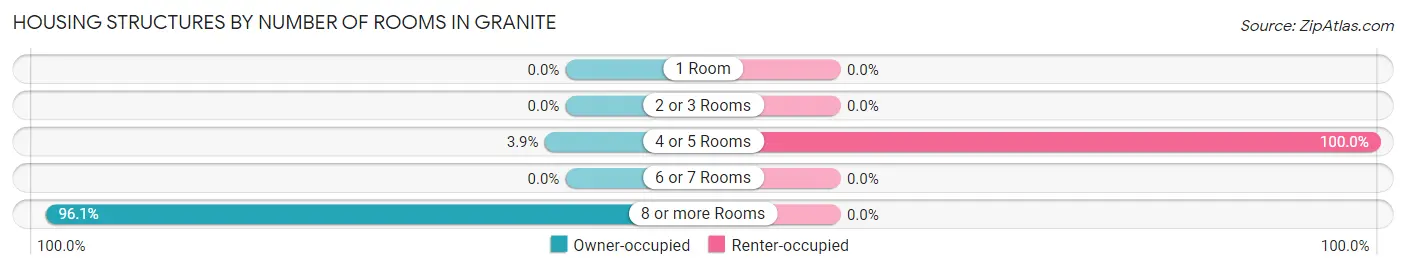
| Number of Rooms | Owner-occupied | Renter-occupied |
| 1 Room | 0 (0.0%) | 0 (0.0%) |
| 2 or 3 Rooms | 0 (0.0%) | 0 (0.0%) |
| 4 or 5 Rooms | 8 (3.9%) | 21 (100.0%) |
| 6 or 7 Rooms | 0 (0.0%) | 0 (0.0%) |
| 8 or more Rooms | 199 (96.1%) | 0 (0.0%) |
| Total | 207 (100.0%) | 21 (100.0%) |
Housing Structure by Heating Type in Granite
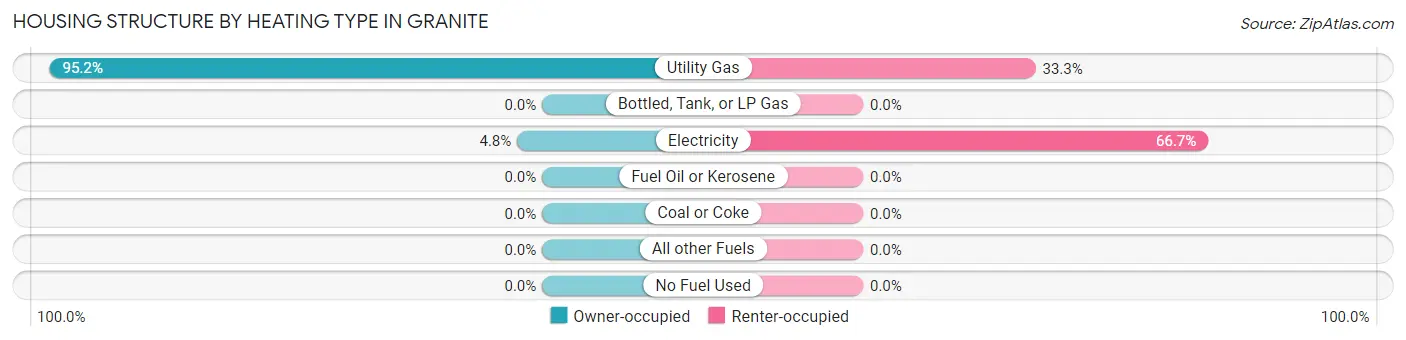
| Heating Type | Owner-occupied | Renter-occupied |
| Utility Gas | 197 (95.2%) | 7 (33.3%) |
| Bottled, Tank, or LP Gas | 0 (0.0%) | 0 (0.0%) |
| Electricity | 10 (4.8%) | 14 (66.7%) |
| Fuel Oil or Kerosene | 0 (0.0%) | 0 (0.0%) |
| Coal or Coke | 0 (0.0%) | 0 (0.0%) |
| All other Fuels | 0 (0.0%) | 0 (0.0%) |
| No Fuel Used | 0 (0.0%) | 0 (0.0%) |
| Total | 207 (100.0%) | 21 (100.0%) |
Household Vehicle Usage in Granite
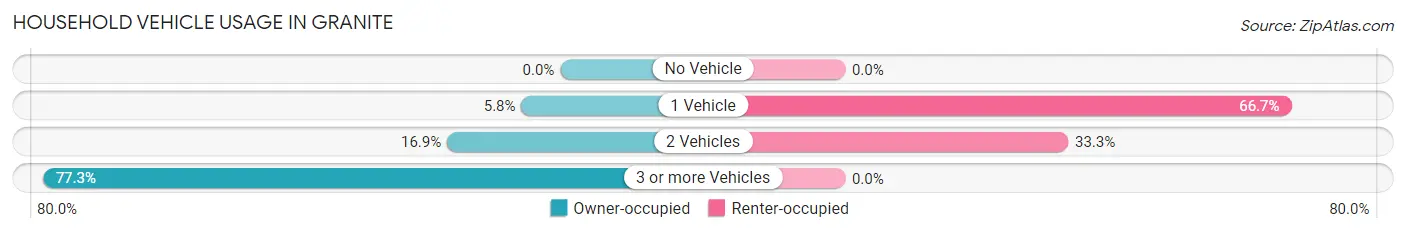
| Vehicles per Household | Owner-occupied | Renter-occupied |
| No Vehicle | 0 (0.0%) | 0 (0.0%) |
| 1 Vehicle | 12 (5.8%) | 14 (66.7%) |
| 2 Vehicles | 35 (16.9%) | 7 (33.3%) |
| 3 or more Vehicles | 160 (77.3%) | 0 (0.0%) |
| Total | 207 (100.0%) | 21 (100.0%) |
Real Estate & Mortgages in Granite
Real Estate and Mortgage Overview in Granite
| Characteristic | Without Mortgage | With Mortgage |
| Housing Units | 98 | 109 |
| Median Property Value | $1,069,000 | $778,800 |
| Median Household Income | $96,667 | $51 |
| Monthly Housing Costs | $964 | $60 |
| Real Estate Taxes | $5,455 | $0 |
Property Value by Mortgage Status in Granite
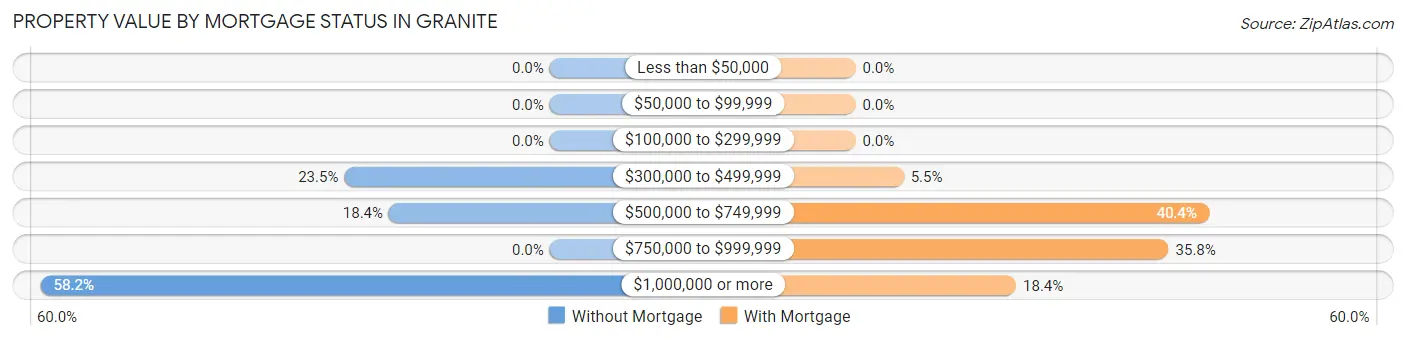
| Property Value | Without Mortgage | With Mortgage |
| Less than $50,000 | 0 (0.0%) | 0 (0.0%) |
| $50,000 to $99,999 | 0 (0.0%) | 0 (0.0%) |
| $100,000 to $299,999 | 0 (0.0%) | 0 (0.0%) |
| $300,000 to $499,999 | 23 (23.5%) | 6 (5.5%) |
| $500,000 to $749,999 | 18 (18.4%) | 44 (40.4%) |
| $750,000 to $999,999 | 0 (0.0%) | 39 (35.8%) |
| $1,000,000 or more | 57 (58.2%) | 20 (18.3%) |
| Total | 98 (100.0%) | 109 (100.0%) |
Household Income by Mortgage Status in Granite
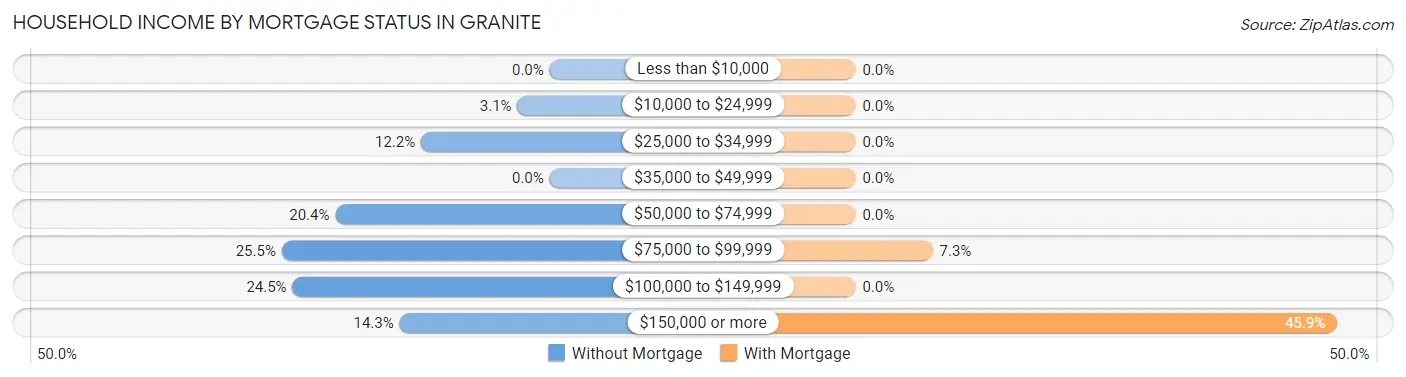
| Household Income | Without Mortgage | With Mortgage |
| Less than $10,000 | 0 (0.0%) | 0 (0.0%) |
| $10,000 to $24,999 | 3 (3.1%) | 0 (0.0%) |
| $25,000 to $34,999 | 12 (12.2%) | 0 (0.0%) |
| $35,000 to $49,999 | 0 (0.0%) | 0 (0.0%) |
| $50,000 to $74,999 | 20 (20.4%) | 0 (0.0%) |
| $75,000 to $99,999 | 25 (25.5%) | 8 (7.3%) |
| $100,000 to $149,999 | 24 (24.5%) | 0 (0.0%) |
| $150,000 or more | 14 (14.3%) | 50 (45.9%) |
| Total | 98 (100.0%) | 109 (100.0%) |
Property Value to Household Income Ratio in Granite
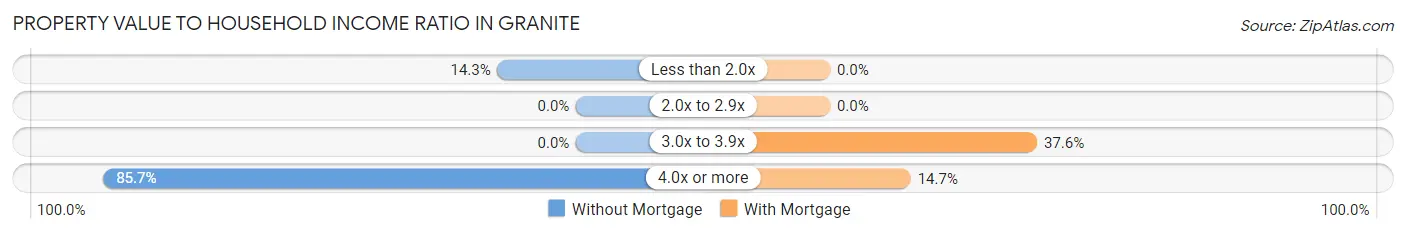
| Value-to-Income Ratio | Without Mortgage | With Mortgage |
| Less than 2.0x | 14 (14.3%) | 0 (0.0%) |
| 2.0x to 2.9x | 0 (0.0%) | 0 (0.0%) |
| 3.0x to 3.9x | 0 (0.0%) | 41 (37.6%) |
| 4.0x or more | 84 (85.7%) | 16 (14.7%) |
| Total | 98 (100.0%) | 109 (100.0%) |
Real Estate Taxes by Mortgage Status in Granite
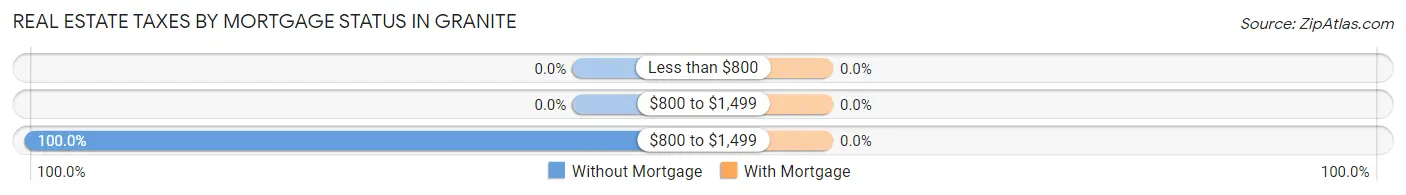
| Property Taxes | Without Mortgage | With Mortgage |
| Less than $800 | 0 (0.0%) | 0 (0.0%) |
| $800 to $1,499 | 0 (0.0%) | 0 (0.0%) |
| $800 to $1,499 | 98 (100.0%) | 0 (0.0%) |
| Total | 98 (100.0%) | 109 (100.0%) |
Health & Disability in Granite
Health Insurance Coverage by Age in Granite
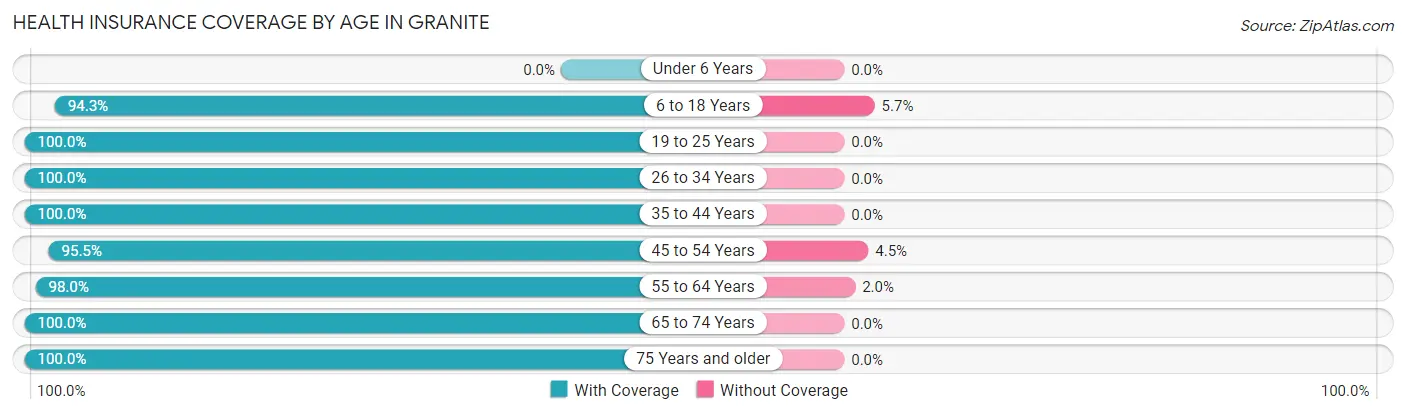
| Age Bracket | With Coverage | Without Coverage |
| Under 6 Years | 0 (0.0%) | 0 (0.0%) |
| 6 to 18 Years | 100 (94.3%) | 6 (5.7%) |
| 19 to 25 Years | 77 (100.0%) | 0 (0.0%) |
| 26 to 34 Years | 29 (100.0%) | 0 (0.0%) |
| 35 to 44 Years | 23 (100.0%) | 0 (0.0%) |
| 45 to 54 Years | 128 (95.5%) | 6 (4.5%) |
| 55 to 64 Years | 96 (98.0%) | 2 (2.0%) |
| 65 to 74 Years | 133 (100.0%) | 0 (0.0%) |
| 75 Years and older | 87 (100.0%) | 0 (0.0%) |
| Total | 673 (98.0%) | 14 (2.0%) |
Health Insurance Coverage by Citizenship Status in Granite
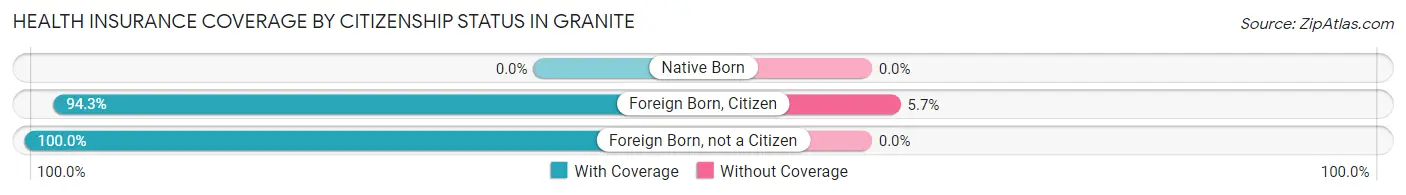
| Citizenship Status | With Coverage | Without Coverage |
| Native Born | 0 (0.0%) | 0 (0.0%) |
| Foreign Born, Citizen | 100 (94.3%) | 6 (5.7%) |
| Foreign Born, not a Citizen | 77 (100.0%) | 0 (0.0%) |
Health Insurance Coverage by Household Income in Granite
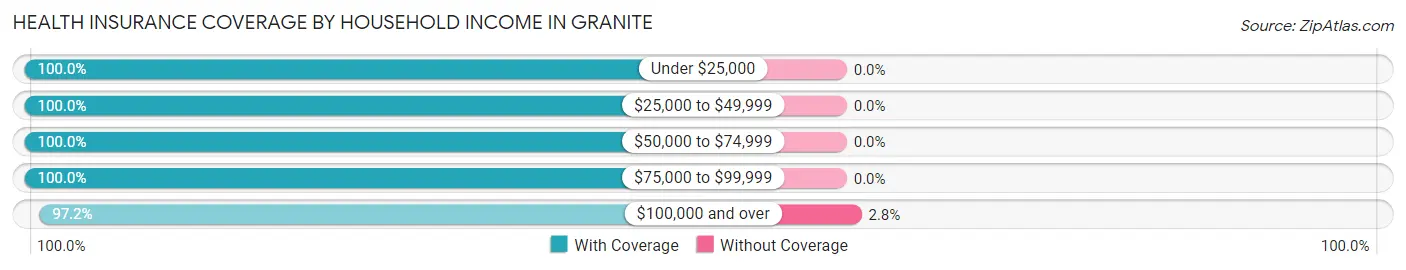
| Household Income | With Coverage | Without Coverage |
| Under $25,000 | 21 (100.0%) | 0 (0.0%) |
| $25,000 to $49,999 | 12 (100.0%) | 0 (0.0%) |
| $50,000 to $74,999 | 105 (100.0%) | 0 (0.0%) |
| $75,000 to $99,999 | 91 (100.0%) | 0 (0.0%) |
| $100,000 and over | 423 (97.2%) | 12 (2.8%) |
Public vs Private Health Insurance Coverage by Age in Granite
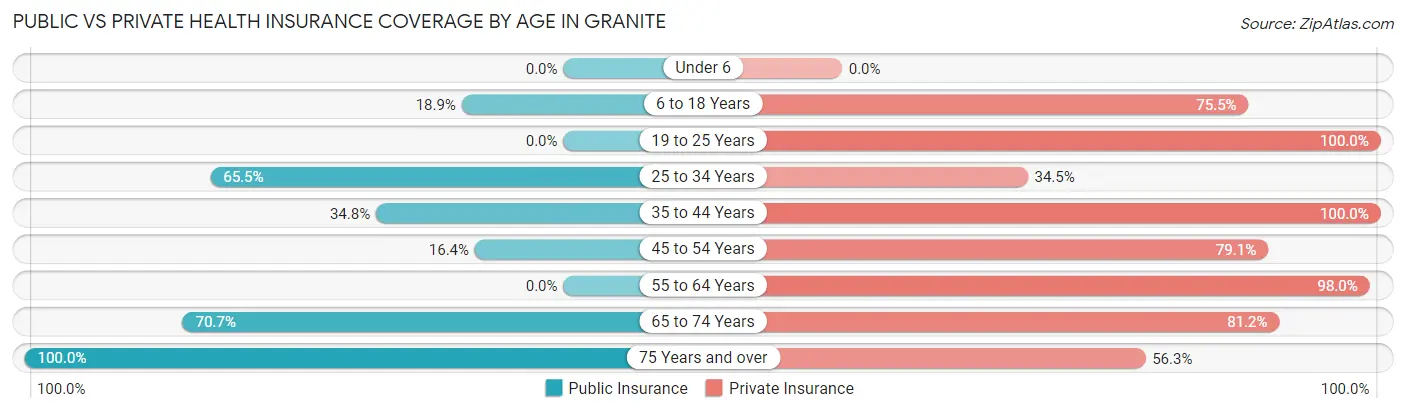
| Age Bracket | Public Insurance | Private Insurance |
| Under 6 | 0 (0.0%) | 0 (0.0%) |
| 6 to 18 Years | 20 (18.9%) | 80 (75.5%) |
| 19 to 25 Years | 0 (0.0%) | 77 (100.0%) |
| 25 to 34 Years | 19 (65.5%) | 10 (34.5%) |
| 35 to 44 Years | 8 (34.8%) | 23 (100.0%) |
| 45 to 54 Years | 22 (16.4%) | 106 (79.1%) |
| 55 to 64 Years | 0 (0.0%) | 96 (98.0%) |
| 65 to 74 Years | 94 (70.7%) | 108 (81.2%) |
| 75 Years and over | 87 (100.0%) | 49 (56.3%) |
| Total | 250 (36.4%) | 549 (79.9%) |
Disability Status by Sex by Age in Granite
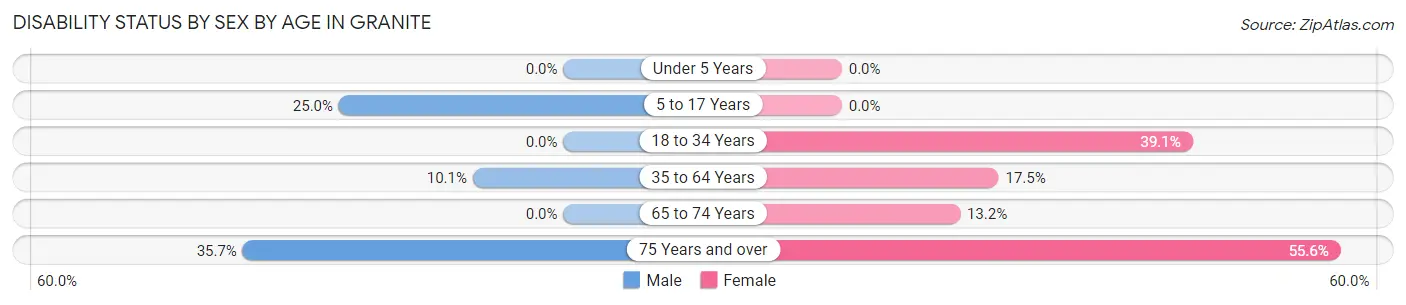
| Age Bracket | Male | Female |
| Under 5 Years | 0 (0.0%) | 0 (0.0%) |
| 5 to 17 Years | 10 (25.0%) | 0 (0.0%) |
| 18 to 34 Years | 0 (0.0%) | 25 (39.1%) |
| 35 to 64 Years | 13 (10.1%) | 22 (17.5%) |
| 65 to 74 Years | 0 (0.0%) | 10 (13.2%) |
| 75 Years and over | 15 (35.7%) | 25 (55.6%) |
Disability Class by Sex by Age in Granite
Disability Class: Hearing Difficulty
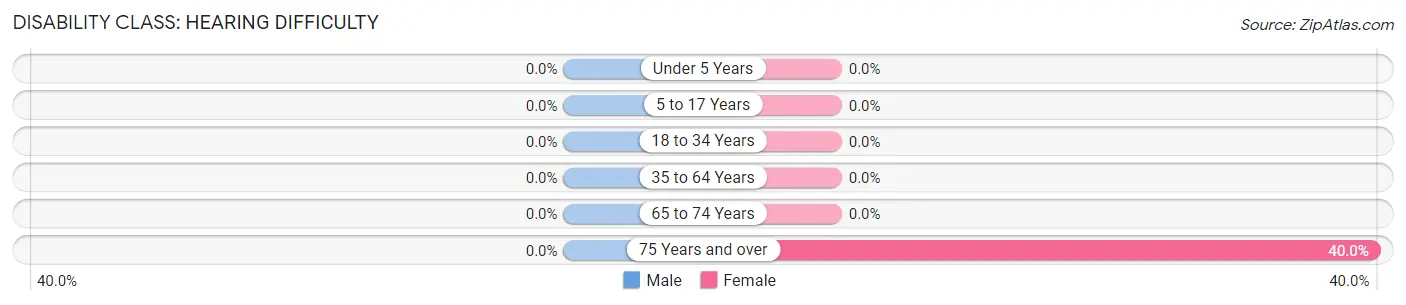
| Age Bracket | Male | Female |
| Under 5 Years | 0 (0.0%) | 0 (0.0%) |
| 5 to 17 Years | 0 (0.0%) | 0 (0.0%) |
| 18 to 34 Years | 0 (0.0%) | 0 (0.0%) |
| 35 to 64 Years | 0 (0.0%) | 0 (0.0%) |
| 65 to 74 Years | 0 (0.0%) | 0 (0.0%) |
| 75 Years and over | 0 (0.0%) | 18 (40.0%) |
Disability Class: Vision Difficulty
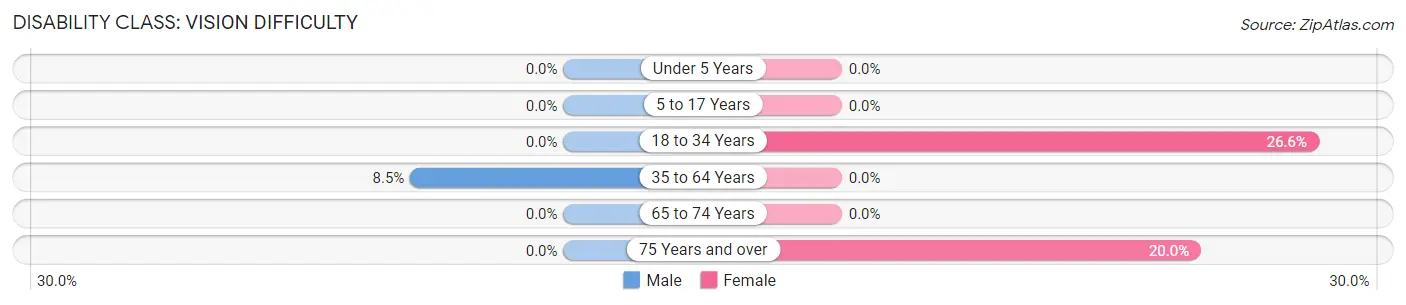
| Age Bracket | Male | Female |
| Under 5 Years | 0 (0.0%) | 0 (0.0%) |
| 5 to 17 Years | 0 (0.0%) | 0 (0.0%) |
| 18 to 34 Years | 0 (0.0%) | 17 (26.6%) |
| 35 to 64 Years | 11 (8.5%) | 0 (0.0%) |
| 65 to 74 Years | 0 (0.0%) | 0 (0.0%) |
| 75 Years and over | 0 (0.0%) | 9 (20.0%) |
Disability Class: Cognitive Difficulty
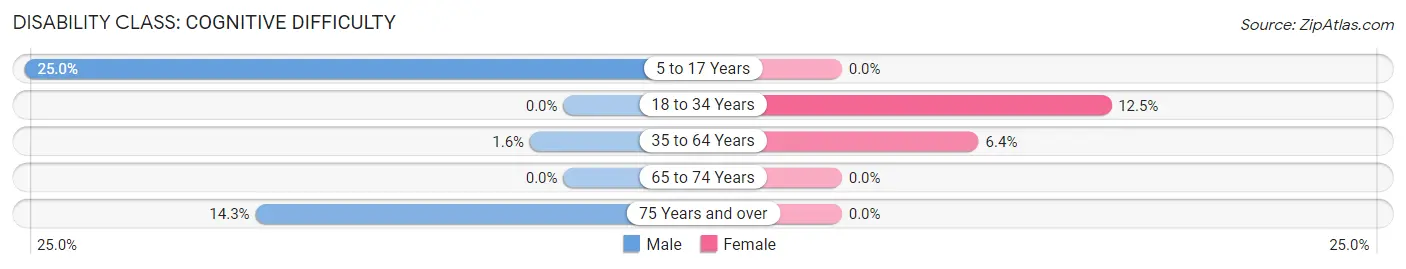
| Age Bracket | Male | Female |
| 5 to 17 Years | 10 (25.0%) | 0 (0.0%) |
| 18 to 34 Years | 0 (0.0%) | 8 (12.5%) |
| 35 to 64 Years | 2 (1.5%) | 8 (6.4%) |
| 65 to 74 Years | 0 (0.0%) | 0 (0.0%) |
| 75 Years and over | 6 (14.3%) | 0 (0.0%) |
Disability Class: Ambulatory Difficulty
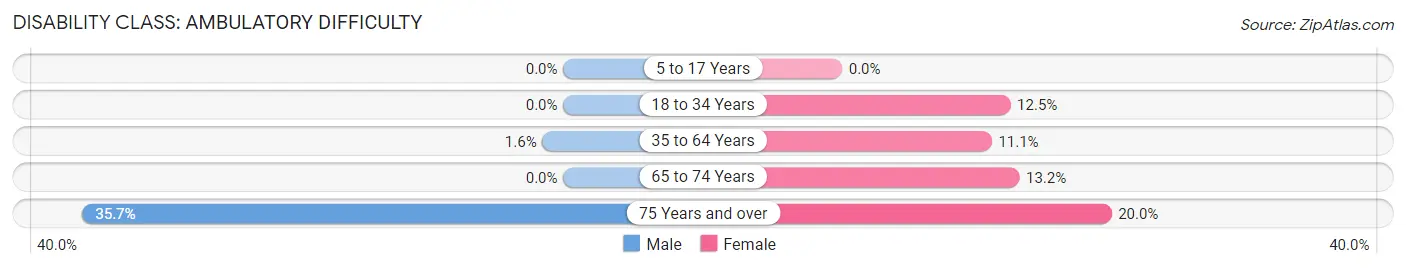
| Age Bracket | Male | Female |
| 5 to 17 Years | 0 (0.0%) | 0 (0.0%) |
| 18 to 34 Years | 0 (0.0%) | 8 (12.5%) |
| 35 to 64 Years | 2 (1.5%) | 14 (11.1%) |
| 65 to 74 Years | 0 (0.0%) | 10 (13.2%) |
| 75 Years and over | 15 (35.7%) | 9 (20.0%) |
Disability Class: Self-Care Difficulty
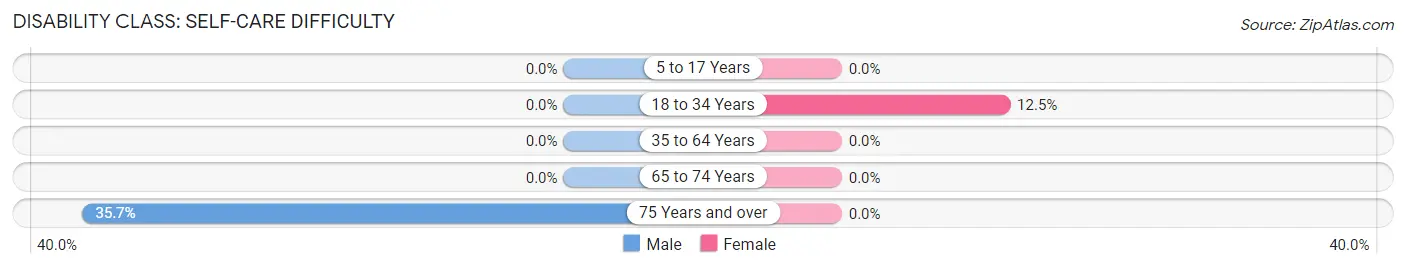
| Age Bracket | Male | Female |
| 5 to 17 Years | 0 (0.0%) | 0 (0.0%) |
| 18 to 34 Years | 0 (0.0%) | 8 (12.5%) |
| 35 to 64 Years | 0 (0.0%) | 0 (0.0%) |
| 65 to 74 Years | 0 (0.0%) | 0 (0.0%) |
| 75 Years and over | 15 (35.7%) | 0 (0.0%) |
Technology Access in Granite
Computing Device Access in Granite
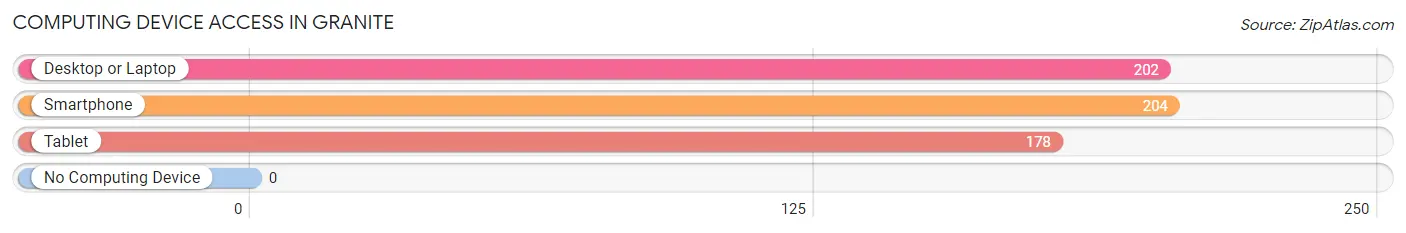
| Device Type | # Households | % Households |
| Desktop or Laptop | 202 | 88.6% |
| Smartphone | 204 | 89.5% |
| Tablet | 178 | 78.1% |
| No Computing Device | 0 | 0.0% |
| Total | 228 | 100.0% |
Internet Access in Granite
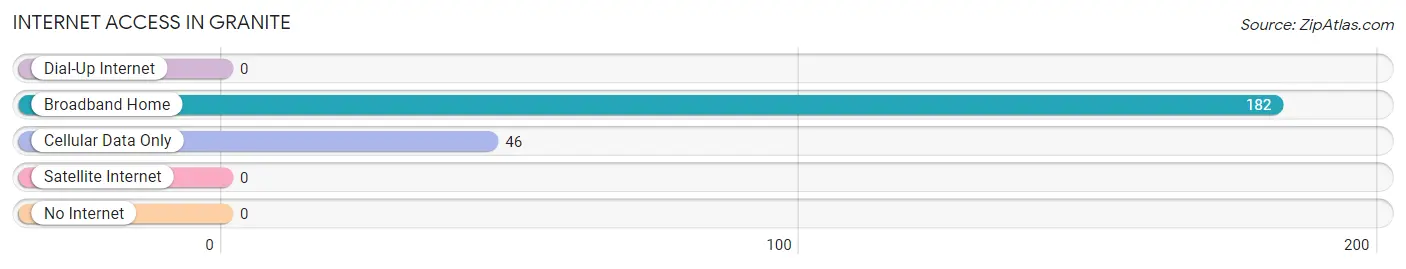
| Internet Type | # Households | % Households |
| Dial-Up Internet | 0 | 0.0% |
| Broadband Home | 182 | 79.8% |
| Cellular Data Only | 46 | 20.2% |
| Satellite Internet | 0 | 0.0% |
| No Internet | 0 | 0.0% |
| Total | 228 | 100.0% |
Granite Summary
Granite, Utah is a small city located in Salt Lake County, Utah. It is situated in the foothills of the Wasatch Mountains, just south of Salt Lake City. The city was founded in 1847 by Mormon pioneers and was named after the granite found in the area. Granite is known for its rich history, beautiful geography, and diverse economy.
History
Granite was founded in 1847 by Mormon pioneers, who were sent by Brigham Young to settle the area. The city was named after the granite found in the area, which was used to build the Salt Lake Temple. The city was incorporated in 1868 and has since grown to become a thriving community.
Granite has a rich history of industry and commerce. In the late 1800s, the city was home to several sawmills, a brickyard, and a woolen mill. In the early 1900s, the city was home to a large copper smelter, which provided jobs for many of the city’s residents.
Granite has also been home to several notable figures in Utah’s history. In 1877, Granite was the site of the first Mormon temple in Utah. In the early 1900s, Granite was home to the first Mormon-owned bank in the state. In the late 1900s, Granite was the home of the first Mormon-owned radio station in the state.
Geography
Granite is located in the foothills of the Wasatch Mountains, just south of Salt Lake City. The city is situated at an elevation of 4,400 feet and is surrounded by mountains and canyons. The city is home to several parks and trails, including the Granite Creek Trail, which offers stunning views of the Wasatch Mountains.
The city is also home to several lakes, including Granite Lake, which is a popular spot for fishing and boating. The city is also home to several creeks, including Granite Creek, which is a popular spot for kayaking and canoeing.
Economy
Granite has a diverse economy, with a variety of industries providing jobs for its residents. The city is home to several manufacturing companies, including a large copper smelter and several sawmills. The city is also home to several retail stores, restaurants, and other businesses.
The city is also home to several educational institutions, including the University of Utah, Salt Lake Community College, and the Granite School District. The city is also home to several hospitals, including the University of Utah Medical Center and the Intermountain Medical Center.
Demographics
As of the 2010 census, Granite had a population of 8,945. The city has a median age of 33.7 years, with a median household income of $50,945. The city is predominantly white, with a population that is 79.3% white, 8.2% Hispanic or Latino, and 6.2% Asian.
Granite is a diverse city, with a variety of cultures and backgrounds. The city is home to several churches, including the Church of Jesus Christ of Latter-day Saints, the Catholic Church, and several Protestant denominations. The city is also home to several synagogues and mosques.
Conclusion
Granite, Utah is a small city located in Salt Lake County, Utah. It is situated in the foothills of the Wasatch Mountains, just south of Salt Lake City. The city was founded in 1847 by Mormon pioneers and was named after the granite found in the area. Granite is known for its rich history, beautiful geography, and diverse economy. The city has a diverse population and a variety of industries providing jobs for its residents. Granite is a vibrant city with a rich history and a bright future.
Common Questions
What is Per Capita Income in Granite?
Per Capita income in Granite is $66,352.
What is the Median Family Income in Granite?
Median Family Income in Granite is $117,135.
What is the Median Household income in Granite?
Median Household Income in Granite is $115,417.
What is Inequality or Gini Index in Granite?
Inequality or Gini Index in Granite is 0.54.
What is the Total Population of Granite?
Total Population of Granite is 703.
What is the Total Male Population of Granite?
Total Male Population of Granite is 320.
What is the Total Female Population of Granite?
Total Female Population of Granite is 383.
What is the Ratio of Males per 100 Females in Granite?
There are 83.55 Males per 100 Females in Granite.
What is the Ratio of Females per 100 Males in Granite?
There are 119.69 Females per 100 Males in Granite.
What is the Median Population Age in Granite?
Median Population Age in Granite is 51.8 Years.
What is the Average Family Size in Granite
Average Family Size in Granite is 3.2 People.
What is the Average Household Size in Granite
Average Household Size in Granite is 2.9 People.
How Large is the Labor Force in Granite?
There are 376 People in the Labor Forcein in Granite.
What is the Percentage of People in the Labor Force in Granite?
58.1% of People are in the Labor Force in Granite.
What is the Unemployment Rate in Granite?
Unemployment Rate in Granite is 7.4%.