Bryce Canyon City, UT Map & Demographics
Bryce Canyon City Map
Bryce Canyon City Overview
$20,862
PER CAPITA INCOME
0.31
INEQUALITY / GINI INDEX
229
TOTAL POPULATION
162
MALE POPULATION
67
FEMALE POPULATION
241.79
MALES / 100 FEMALES
41.36
FEMALES / 100 MALES
33.7
MEDIAN AGE
2.6
AVG FAMILY SIZE
2.6
AVG HOUSEHOLD SIZE
187
LABOR FORCE [ PEOPLE ]
85.4%
PERCENT IN LABOR FORCE
7.5%
UNEMPLOYMENT RATE
Bryce Canyon City Area Codes
Income in Bryce Canyon City
Income Overview in Bryce Canyon City
| Characteristic | Number | Measure |
| Per Capita Income | 229 | $20,862 |
| Median Family Income | 34 | $0 |
| Mean Family Income | 34 | $129,038 |
| Median Household Income | 34 | $0 |
| Mean Household Income | 34 | $129,038 |
| Income Deficit | 34 | $0 |
| Wage / Income Gap (%) | 229 | 0.00% |
| Wage / Income Gap ($) | 229 | 100.00¢ per $1 |
| Gini / Inequality Index | 229 | 0.31 |
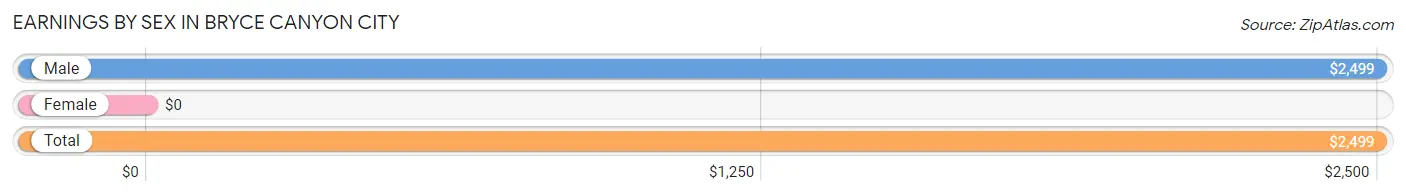
Earnings by Sex in Bryce Canyon City
| Sex | Number | Average Earnings |
| Male | 153 (76.1%) | $2,499 |
| Female | 48 (23.9%) | $0 |
| Total | 201 (100.0%) | $2,499 |
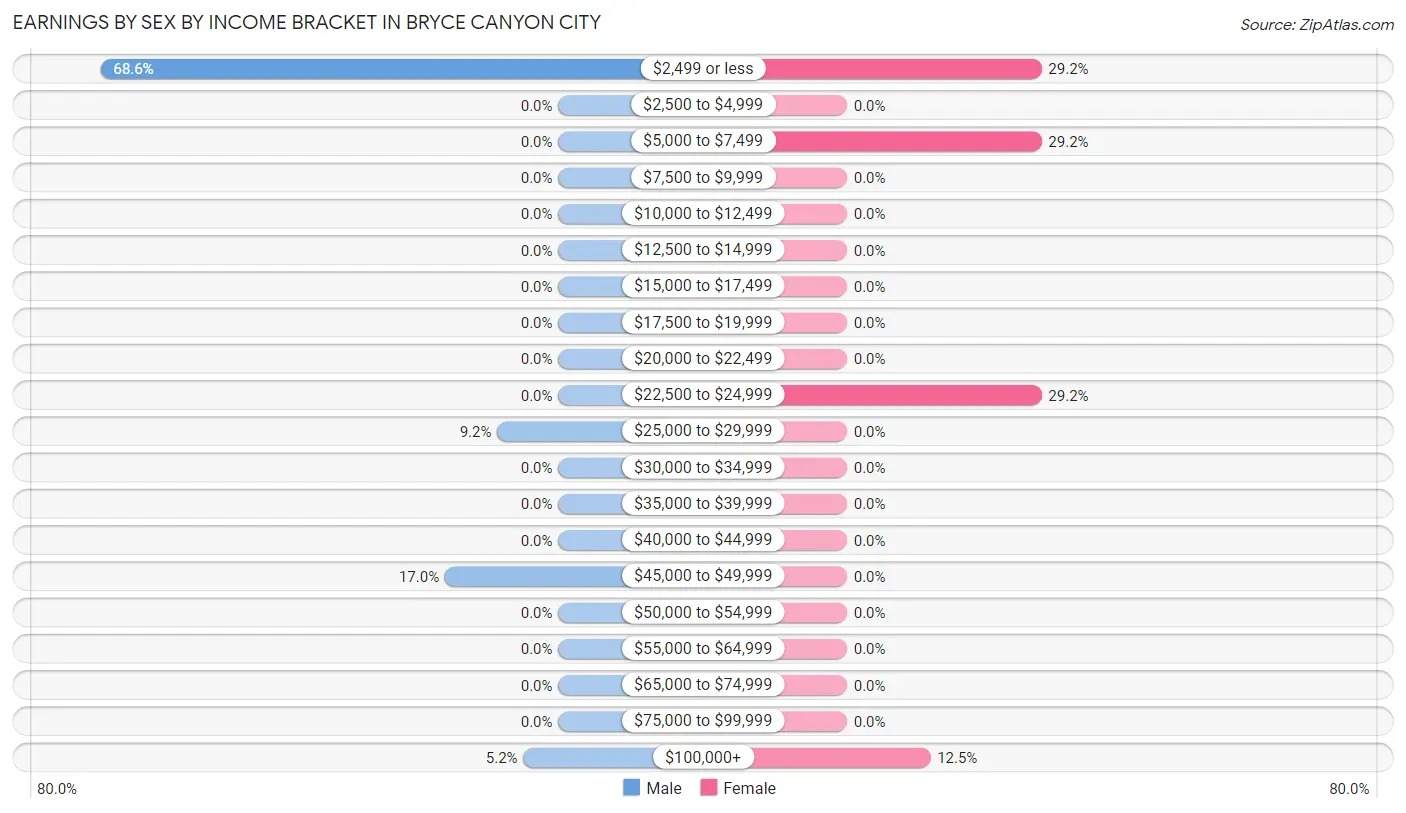
Earnings by Sex by Income Bracket in Bryce Canyon City
The most common earnings brackets in Bryce Canyon City are $2,499 or less for men (105 | 68.6%) and $2,499 or less for women (14 | 29.2%).
| Income | Male | Female |
| $2,499 or less | 105 (68.6%) | 14 (29.2%) |
| $2,500 to $4,999 | 0 (0.0%) | 0 (0.0%) |
| $5,000 to $7,499 | 0 (0.0%) | 14 (29.2%) |
| $7,500 to $9,999 | 0 (0.0%) | 0 (0.0%) |
| $10,000 to $12,499 | 0 (0.0%) | 0 (0.0%) |
| $12,500 to $14,999 | 0 (0.0%) | 0 (0.0%) |
| $15,000 to $17,499 | 0 (0.0%) | 0 (0.0%) |
| $17,500 to $19,999 | 0 (0.0%) | 0 (0.0%) |
| $20,000 to $22,499 | 0 (0.0%) | 0 (0.0%) |
| $22,500 to $24,999 | 0 (0.0%) | 14 (29.2%) |
| $25,000 to $29,999 | 14 (9.1%) | 0 (0.0%) |
| $30,000 to $34,999 | 0 (0.0%) | 0 (0.0%) |
| $35,000 to $39,999 | 0 (0.0%) | 0 (0.0%) |
| $40,000 to $44,999 | 0 (0.0%) | 0 (0.0%) |
| $45,000 to $49,999 | 26 (17.0%) | 0 (0.0%) |
| $50,000 to $54,999 | 0 (0.0%) | 0 (0.0%) |
| $55,000 to $64,999 | 0 (0.0%) | 0 (0.0%) |
| $65,000 to $74,999 | 0 (0.0%) | 0 (0.0%) |
| $75,000 to $99,999 | 0 (0.0%) | 0 (0.0%) |
| $100,000+ | 8 (5.2%) | 6 (12.5%) |
| Total | 153 (100.0%) | 48 (100.0%) |
Earnings by Sex by Educational Attainment in Bryce Canyon City
| Educational Attainment | Male Income | Female Income |
| Less than High School | - | - |
| High School Diploma | - | - |
| College or Associate's Degree | - | - |
| Bachelor's Degree | - | - |
| Graduate Degree | - | - |
| Total | $2,499 | $0 |
Family Income in Bryce Canyon City
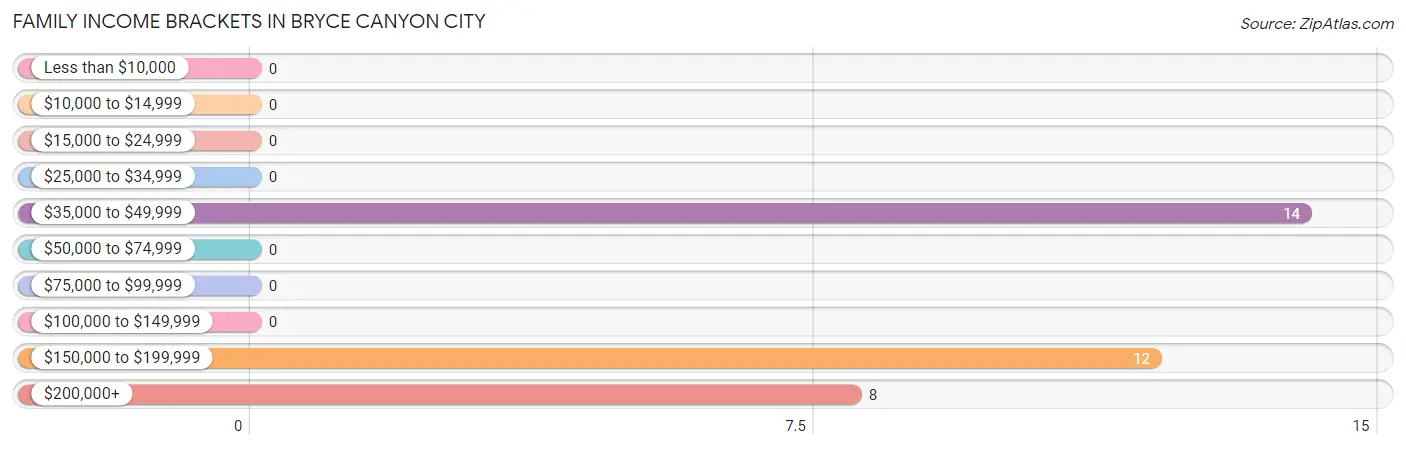
Family Income Brackets in Bryce Canyon City
According to the Bryce Canyon City family income data, there are 14 families falling into the $35,000 to $49,999 income range, which is the most common income bracket and makes up 41.2% of all families.
| Income Bracket | # Families | % Families |
| Less than $10,000 | 0 | 0.0% |
| $10,000 to $14,999 | 0 | 0.0% |
| $15,000 to $24,999 | 0 | 0.0% |
| $25,000 to $34,999 | 0 | 0.0% |
| $35,000 to $49,999 | 14 | 41.2% |
| $50,000 to $74,999 | 0 | 0.0% |
| $75,000 to $99,999 | 0 | 0.0% |
| $100,000 to $149,999 | 0 | 0.0% |
| $150,000 to $199,999 | 12 | 35.3% |
| $200,000+ | 8 | 23.5% |
Family Income by Famaliy Size in Bryce Canyon City
| Income Bracket | # Families | Median Income |
| 2-Person Families | 22 (64.7%) | $0 |
| 3-Person Families | 0 (0.0%) | $0 |
| 4-Person Families | 0 (0.0%) | $0 |
| 5-Person Families | 12 (35.3%) | $0 |
| 6-Person Families | 0 (0.0%) | $0 |
| 7+ Person Families | 0 (0.0%) | $0 |
| Total | 34 (100.0%) | $0 |
Family Income by Number of Earners in Bryce Canyon City
| Number of Earners | # Families | Median Income |
| No Earners | 0 (0.0%) | $0 |
| 1 Earner | 8 (23.5%) | $0 |
| 2 Earners | 14 (41.2%) | $0 |
| 3+ Earners | 12 (35.3%) | $0 |
| Total | 34 (100.0%) | $0 |
Household Income in Bryce Canyon City
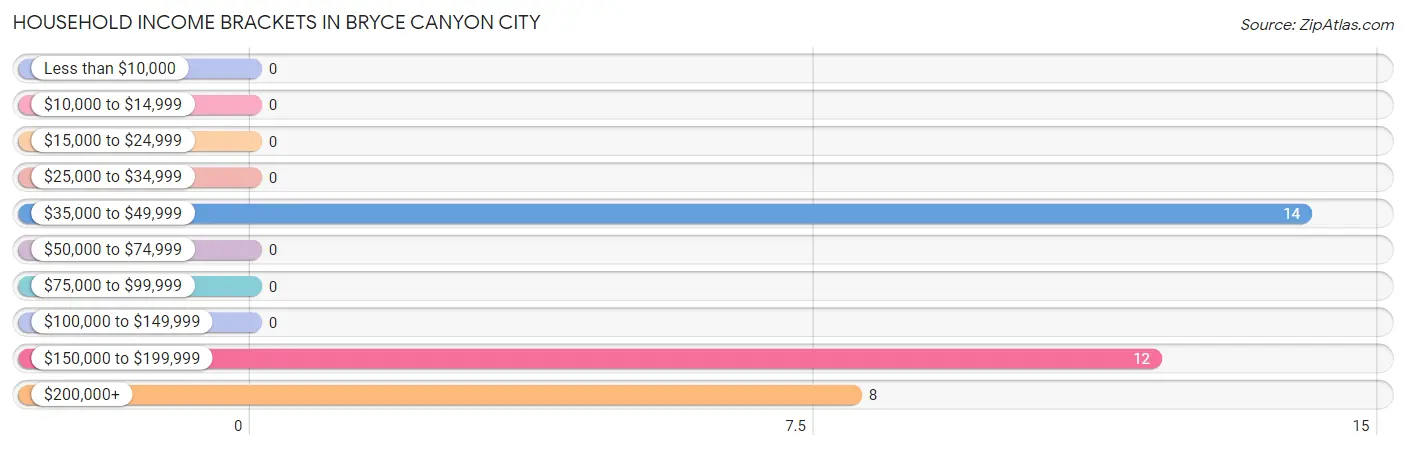
Household Income Brackets in Bryce Canyon City
With 14 households falling in the category, the $35,000 to $49,999 income range is the most frequent in Bryce Canyon City, accounting for 41.2% of all households.
| Income Bracket | # Households | % Households |
| Less than $10,000 | 0 | 0.0% |
| $10,000 to $14,999 | 0 | 0.0% |
| $15,000 to $24,999 | 0 | 0.0% |
| $25,000 to $34,999 | 0 | 0.0% |
| $35,000 to $49,999 | 14 | 41.2% |
| $50,000 to $74,999 | 0 | 0.0% |
| $75,000 to $99,999 | 0 | 0.0% |
| $100,000 to $149,999 | 0 | 0.0% |
| $150,000 to $199,999 | 12 | 35.3% |
| $200,000+ | 8 | 23.5% |
Household Income by Householder Age in Bryce Canyon City
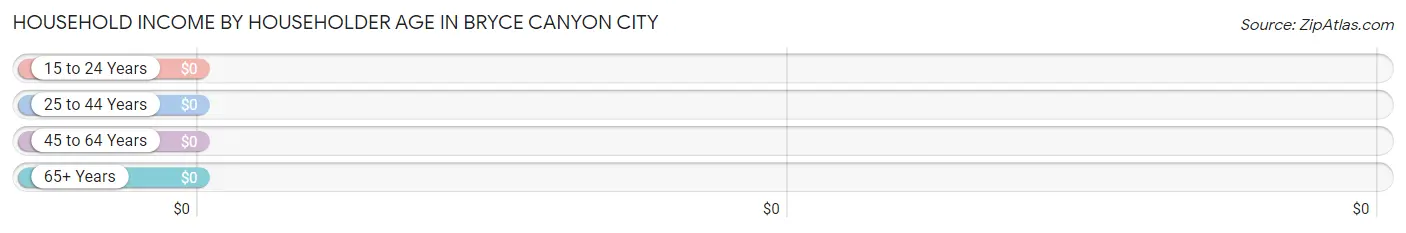
| Income Bracket | # Households | Median Income |
| 15 to 24 Years | 0 (0.0%) | $0 |
| 25 to 44 Years | 12 (35.3%) | $0 |
| 45 to 64 Years | 14 (41.2%) | $0 |
| 65+ Years | 8 (23.5%) | $0 |
| Total | 34 (100.0%) | $0 |
Poverty in Bryce Canyon City
Income Below Poverty by Sex and Age in Bryce Canyon City
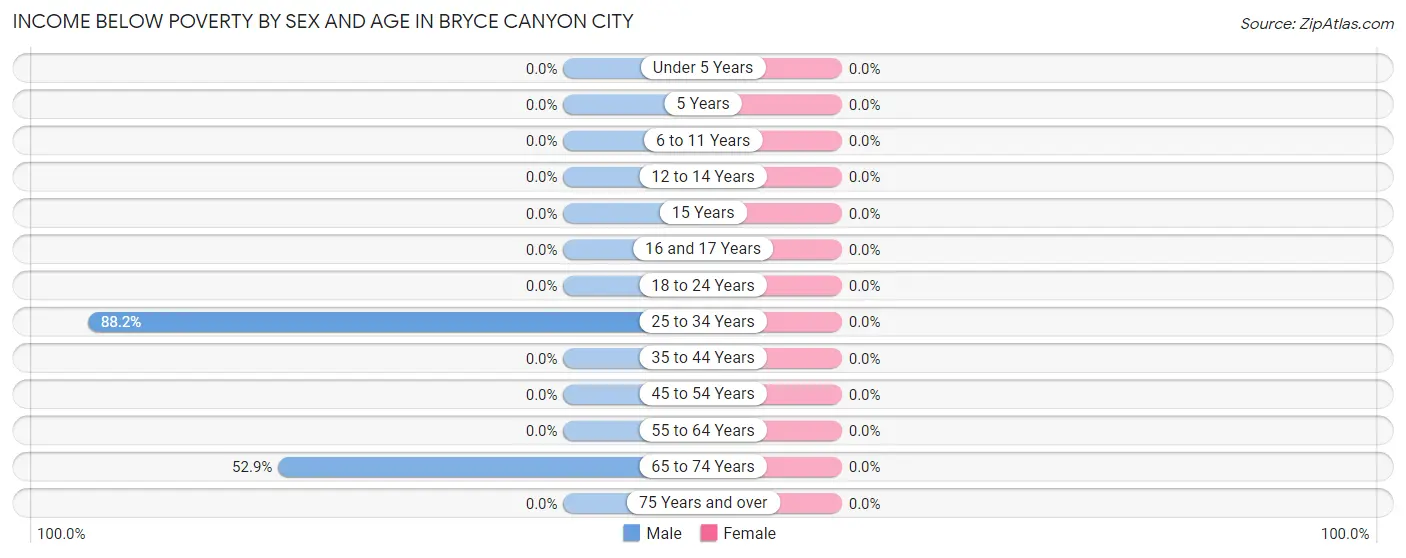
| Age Bracket | Male | Female |
| Under 5 Years | 0 (0.0%) | 0 (0.0%) |
| 5 Years | 0 (0.0%) | 0 (0.0%) |
| 6 to 11 Years | 0 (0.0%) | 0 (0.0%) |
| 12 to 14 Years | 0 (0.0%) | 0 (0.0%) |
| 15 Years | 0 (0.0%) | 0 (0.0%) |
| 16 and 17 Years | 0 (0.0%) | 0 (0.0%) |
| 18 to 24 Years | 0 (0.0%) | 0 (0.0%) |
| 25 to 34 Years | 105 (88.2%) | 0 (0.0%) |
| 35 to 44 Years | 0 (0.0%) | 0 (0.0%) |
| 45 to 54 Years | 0 (0.0%) | 0 (0.0%) |
| 55 to 64 Years | 0 (0.0%) | 0 (0.0%) |
| 65 to 74 Years | 9 (52.9%) | 0 (0.0%) |
| 75 Years and over | 0 (0.0%) | 0 (0.0%) |
| Total | 114 (70.4%) | 0 (0.0%) |
Income Above Poverty by Sex and Age in Bryce Canyon City
According to the poverty statistics in Bryce Canyon City, males aged 35 to 44 years and females aged 6 to 11 years are the age groups that are most secure financially, with 100.0% of males and 100.0% of females in these age groups living above the poverty line.
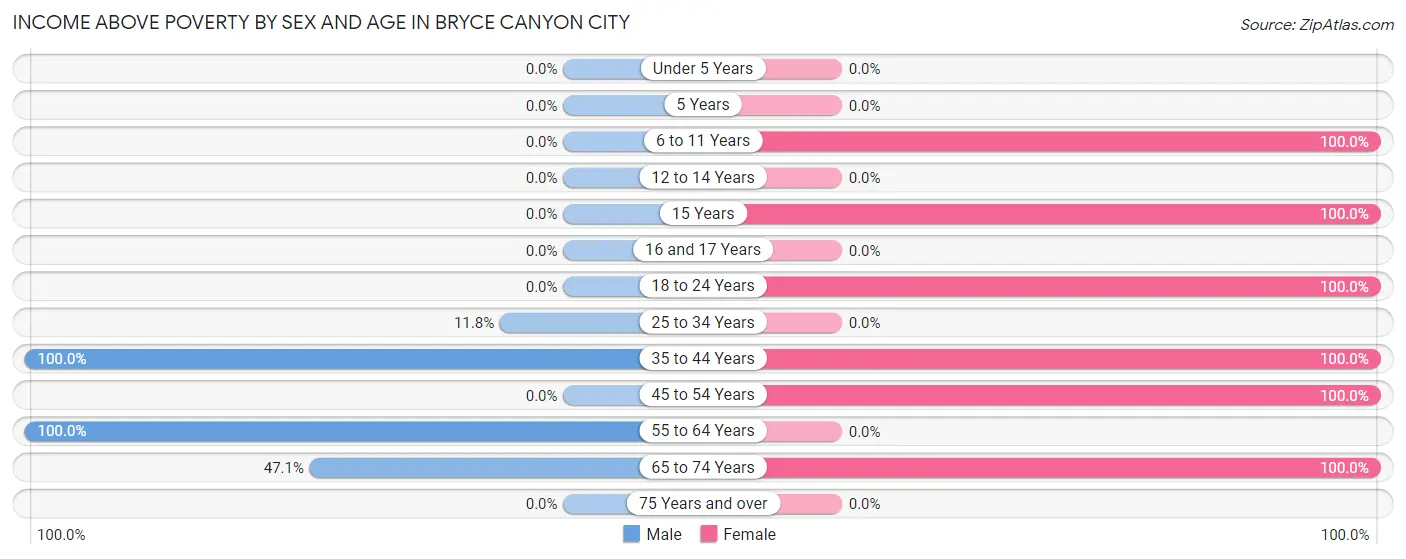
| Age Bracket | Male | Female |
| Under 5 Years | 0 (0.0%) | 0 (0.0%) |
| 5 Years | 0 (0.0%) | 0 (0.0%) |
| 6 to 11 Years | 0 (0.0%) | 5 (100.0%) |
| 12 to 14 Years | 0 (0.0%) | 0 (0.0%) |
| 15 Years | 0 (0.0%) | 5 (100.0%) |
| 16 and 17 Years | 0 (0.0%) | 0 (0.0%) |
| 18 to 24 Years | 0 (0.0%) | 14 (100.0%) |
| 25 to 34 Years | 14 (11.8%) | 0 (0.0%) |
| 35 to 44 Years | 12 (100.0%) | 6 (100.0%) |
| 45 to 54 Years | 0 (0.0%) | 28 (100.0%) |
| 55 to 64 Years | 14 (100.0%) | 0 (0.0%) |
| 65 to 74 Years | 8 (47.1%) | 9 (100.0%) |
| 75 Years and over | 0 (0.0%) | 0 (0.0%) |
| Total | 48 (29.6%) | 67 (100.0%) |
Income Below Poverty Among Married-Couple Families in Bryce Canyon City
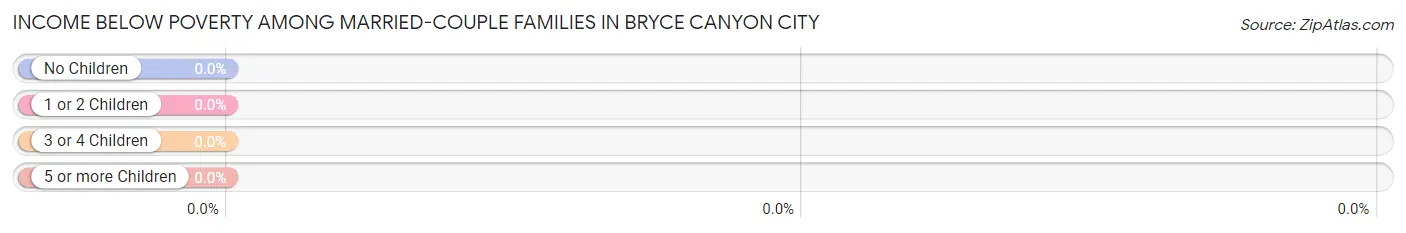
| Children | Above Poverty | Below Poverty |
| No Children | 22 (100.0%) | 0 (0.0%) |
| 1 or 2 Children | 12 (100.0%) | 0 (0.0%) |
| 3 or 4 Children | 0 (0.0%) | 0 (0.0%) |
| 5 or more Children | 0 (0.0%) | 0 (0.0%) |
| Total | 34 (100.0%) | 0 (0.0%) |
Income Below Poverty Among Single-Parent Households in Bryce Canyon City
| Children | Single Father | Single Mother |
| No Children | 0 (0.0%) | 0 (0.0%) |
| 1 or 2 Children | 0 (0.0%) | 0 (0.0%) |
| 3 or 4 Children | 0 (0.0%) | 0 (0.0%) |
| 5 or more Children | 0 (0.0%) | 0 (0.0%) |
| Total | 0 (0.0%) | 0 (0.0%) |
Income Below Poverty Among Married-Couple vs Single-Parent Households in Bryce Canyon City
| Children | Married-Couple Families | Single-Parent Households |
| No Children | 0 (0.0%) | 0 (0.0%) |
| 1 or 2 Children | 0 (0.0%) | 0 (0.0%) |
| 3 or 4 Children | 0 (0.0%) | 0 (0.0%) |
| 5 or more Children | 0 (0.0%) | 0 (0.0%) |
| Total | 0 (0.0%) | 0 (0.0%) |
Race in Bryce Canyon City
The most populous races in Bryce Canyon City are White / Caucasian (124 | 54.1%), Native / Alaskan (105 | 45.9%), and Hispanic or Latino (64 | 28.0%).
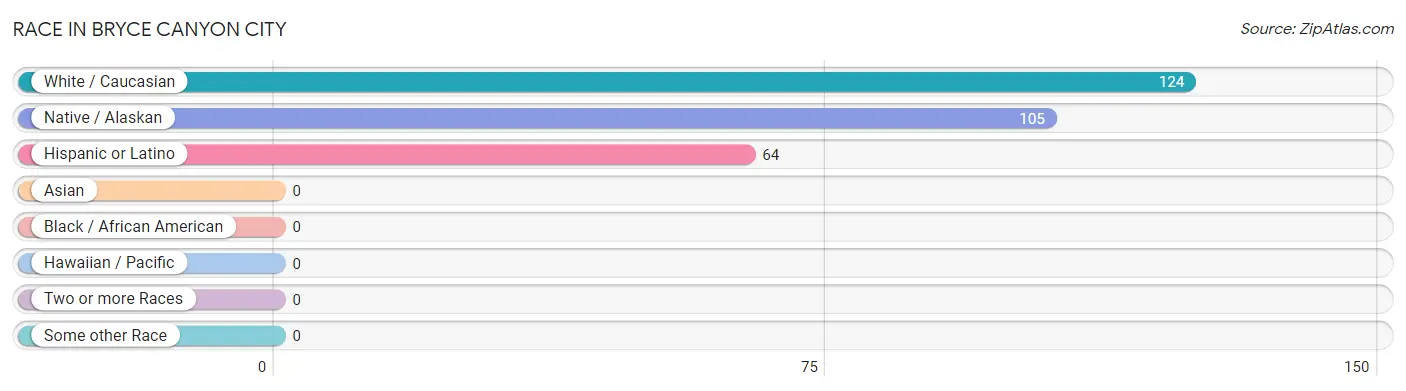
| Race | # Population | % Population |
| Asian | 0 | 0.0% |
| Black / African American | 0 | 0.0% |
| Hawaiian / Pacific | 0 | 0.0% |
| Hispanic or Latino | 64 | 28.0% |
| Native / Alaskan | 105 | 45.9% |
| White / Caucasian | 124 | 54.1% |
| Two or more Races | 0 | 0.0% |
| Some other Race | 0 | 0.0% |
| Total | 229 | 100.0% |
Ancestry in Bryce Canyon City
The most populous ancestries reported in Bryce Canyon City are Mexican (59 | 25.8%), Irish (28 | 12.2%), German (23 | 10.0%), English (17 | 7.4%), and American (14 | 6.1%), together accounting for 61.6% of all Bryce Canyon City residents.
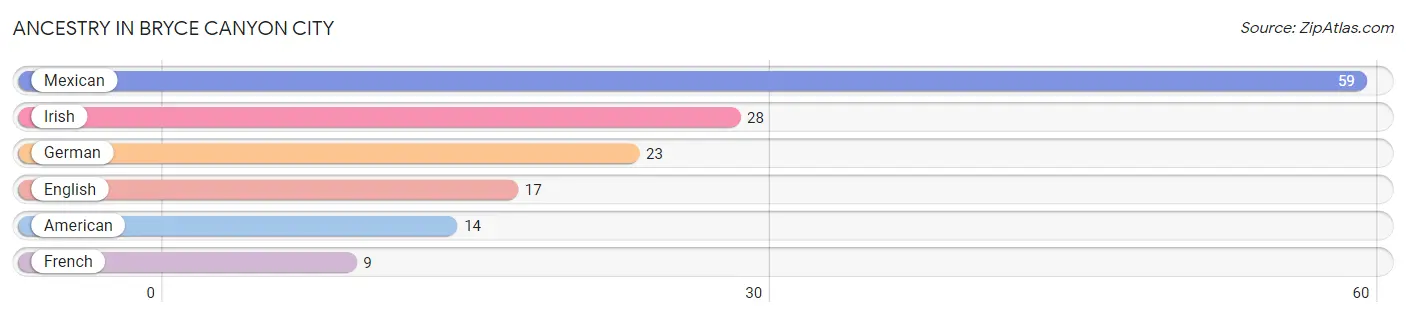
| Ancestry | # Population | % Population |
| American | 14 | 6.1% |
| English | 17 | 7.4% |
| French | 9 | 3.9% |
| German | 23 | 10.0% |
| Irish | 28 | 12.2% |
| Mexican | 59 | 25.8% | View All 6 Rows |
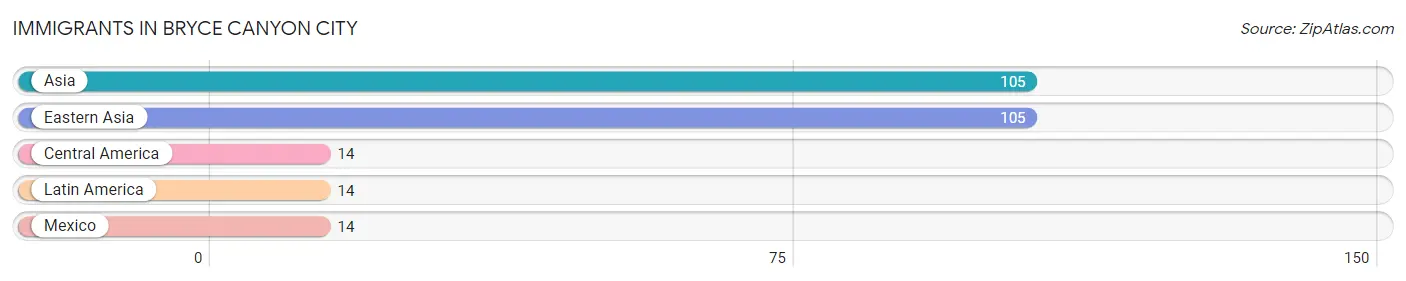
Immigrants in Bryce Canyon City
The most numerous immigrant groups reported in Bryce Canyon City came from Asia (105 | 45.9%), Eastern Asia (105 | 45.9%), Central America (14 | 6.1%), Latin America (14 | 6.1%), and Mexico (14 | 6.1%), together accounting for 110.0% of all Bryce Canyon City residents.
| Immigration Origin | # Population | % Population |
| Asia | 105 | 45.9% |
| Central America | 14 | 6.1% |
| Eastern Asia | 105 | 45.9% |
| Latin America | 14 | 6.1% |
| Mexico | 14 | 6.1% | View All 5 Rows |
Sex and Age in Bryce Canyon City
Sex and Age in Bryce Canyon City
The most populous age groups in Bryce Canyon City are 30 to 34 Years (105 | 64.8%) for men and 50 to 54 Years (28 | 41.8%) for women.
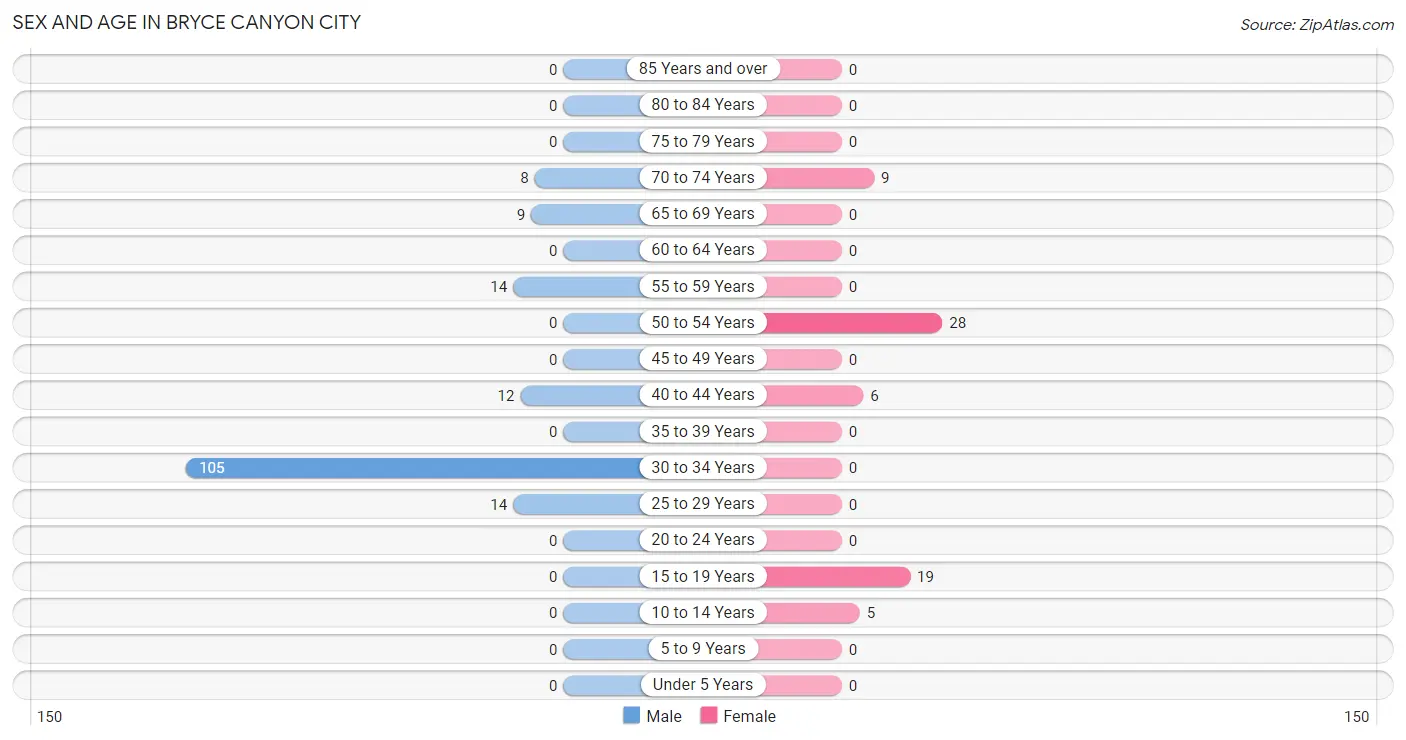
| Age Bracket | Male | Female |
| Under 5 Years | 0 (0.0%) | 0 (0.0%) |
| 5 to 9 Years | 0 (0.0%) | 0 (0.0%) |
| 10 to 14 Years | 0 (0.0%) | 5 (7.5%) |
| 15 to 19 Years | 0 (0.0%) | 19 (28.4%) |
| 20 to 24 Years | 0 (0.0%) | 0 (0.0%) |
| 25 to 29 Years | 14 (8.6%) | 0 (0.0%) |
| 30 to 34 Years | 105 (64.8%) | 0 (0.0%) |
| 35 to 39 Years | 0 (0.0%) | 0 (0.0%) |
| 40 to 44 Years | 12 (7.4%) | 6 (9.0%) |
| 45 to 49 Years | 0 (0.0%) | 0 (0.0%) |
| 50 to 54 Years | 0 (0.0%) | 28 (41.8%) |
| 55 to 59 Years | 14 (8.6%) | 0 (0.0%) |
| 60 to 64 Years | 0 (0.0%) | 0 (0.0%) |
| 65 to 69 Years | 9 (5.6%) | 0 (0.0%) |
| 70 to 74 Years | 8 (4.9%) | 9 (13.4%) |
| 75 to 79 Years | 0 (0.0%) | 0 (0.0%) |
| 80 to 84 Years | 0 (0.0%) | 0 (0.0%) |
| 85 Years and over | 0 (0.0%) | 0 (0.0%) |
| Total | 162 (100.0%) | 67 (100.0%) |
Families and Households in Bryce Canyon City
Median Family Size in Bryce Canyon City
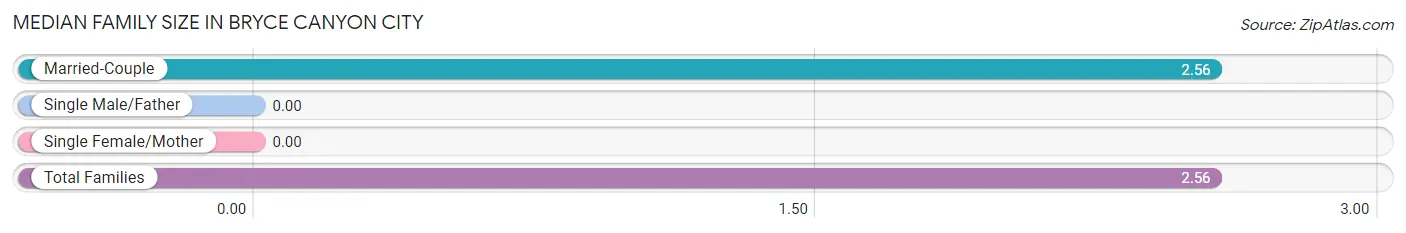
| Family Type | # Families | Family Size |
| Married-Couple | 34 (100.0%) | 2.56 |
| Single Male/Father | 0 (0.0%) | - |
| Single Female/Mother | 0 (0.0%) | - |
| Total Families | 34 (100.0%) | 2.56 |
Median Household Size in Bryce Canyon City
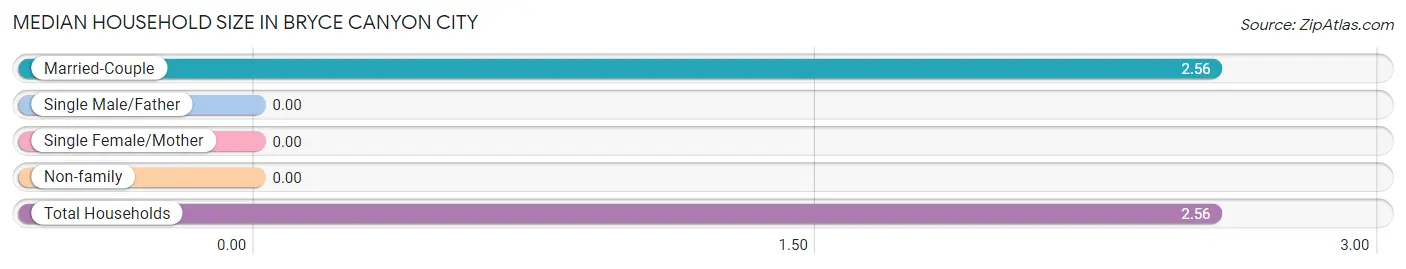
| Household Type | # Households | Household Size |
| Married-Couple | 34 (100.0%) | 2.56 |
| Single Male/Father | 0 (0.0%) | - |
| Single Female/Mother | 0 (0.0%) | - |
| Non-family | 0 (0.0%) | - |
| Total Households | 34 (100.0%) | 2.56 |
Household Size by Marriage Status in Bryce Canyon City
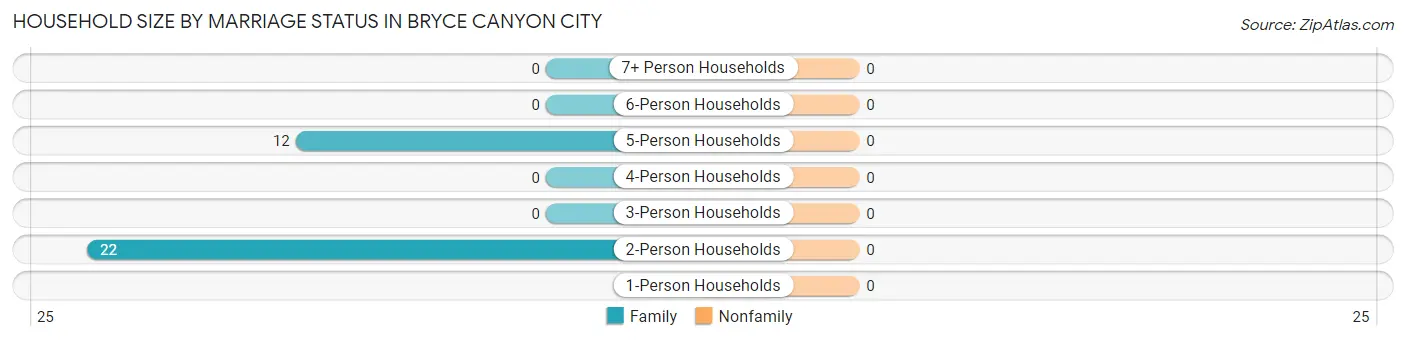
| Household Size | Family Households | Nonfamily Households |
| 1-Person Households | - | 0 (0.0%) |
| 2-Person Households | 22 (64.7%) | 0 (0.0%) |
| 3-Person Households | 0 (0.0%) | 0 (0.0%) |
| 4-Person Households | 0 (0.0%) | 0 (0.0%) |
| 5-Person Households | 12 (35.3%) | 0 (0.0%) |
| 6-Person Households | 0 (0.0%) | 0 (0.0%) |
| 7+ Person Households | 0 (0.0%) | 0 (0.0%) |
| Total | 34 (100.0%) | 0 (0.0%) |
Female Fertility in Bryce Canyon City
Fertility by Age in Bryce Canyon City
| Age Bracket | Women with Births | Births / 1,000 Women |
| 15 to 19 years | 0 (0.0%) | 0.0 |
| 20 to 34 years | 0 (0.0%) | 0.0 |
| 35 to 50 years | 0 (0.0%) | 0.0 |
| Total | 0 (0.0%) | 0.0 |
Fertility by Age by Marriage Status in Bryce Canyon City
| Age Bracket | Married | Unmarried |
| 15 to 19 years | 0 (0.0%) | 0 (0.0%) |
| 20 to 34 years | 0 (0.0%) | 0 (0.0%) |
| 35 to 50 years | 0 (0.0%) | 0 (0.0%) |
| Total | 0 (0.0%) | 0 (0.0%) |
Fertility by Education in Bryce Canyon City
| Educational Attainment | Women with Births | Births / 1,000 Women |
| Less than High School | 0 (0.0%) | 0.0 |
| High School Diploma | 0 (0.0%) | 0.0 |
| College or Associate's Degree | 0 (0.0%) | 0.0 |
| Bachelor's Degree | 0 (0.0%) | 0.0 |
| Graduate Degree | 0 (0.0%) | 0.0 |
| Total | 0 (0.0%) | 0.0 |
Fertility by Education by Marriage Status in Bryce Canyon City
| Educational Attainment | Married | Unmarried |
| Less than High School | 0 (0.0%) | 0 (0.0%) |
| High School Diploma | 0 (0.0%) | 0 (0.0%) |
| College or Associate's Degree | 0 (0.0%) | 0 (0.0%) |
| Bachelor's Degree | 0 (0.0%) | 0 (0.0%) |
| Graduate Degree | 0 (0.0%) | 0 (0.0%) |
| Total | 0 (0.0%) | 0 (0.0%) |
Employment Characteristics in Bryce Canyon City
Employment by Class of Employer in Bryce Canyon City
Among the 173 employed individuals in Bryce Canyon City, not-for-profit organizations (105 | 60.7%), and private company employees (68 | 39.3%) make up the most common classes of employment.
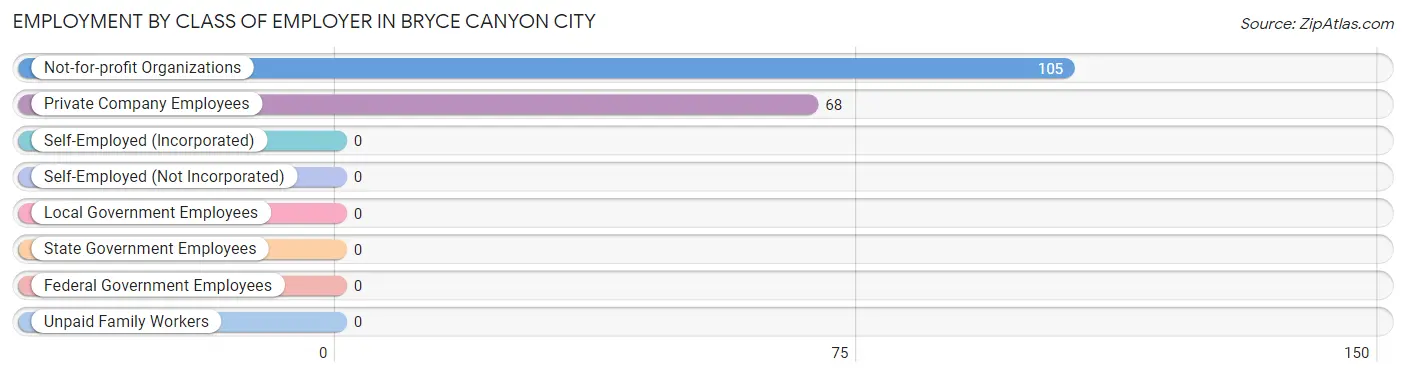
| Employer Class | # Employees | % Employees |
| Private Company Employees | 68 | 39.3% |
| Self-Employed (Incorporated) | 0 | 0.0% |
| Self-Employed (Not Incorporated) | 0 | 0.0% |
| Not-for-profit Organizations | 105 | 60.7% |
| Local Government Employees | 0 | 0.0% |
| State Government Employees | 0 | 0.0% |
| Federal Government Employees | 0 | 0.0% |
| Unpaid Family Workers | 0 | 0.0% |
| Total | 173 | 100.0% |
Employment Status by Age in Bryce Canyon City
According to the labor force statistics for Bryce Canyon City, out of the total population over 16 years of age (219), 85.4% or 187 individuals are in the labor force, with 7.5% or 14 of them unemployed. The age group with the highest labor force participation rate is 16 to 19 years, with 100.0% or 14 individuals in the labor force. Within the labor force, the 16 to 19 years age range has the highest percentage of unemployed individuals, with 100.0% or 14 of them being unemployed.
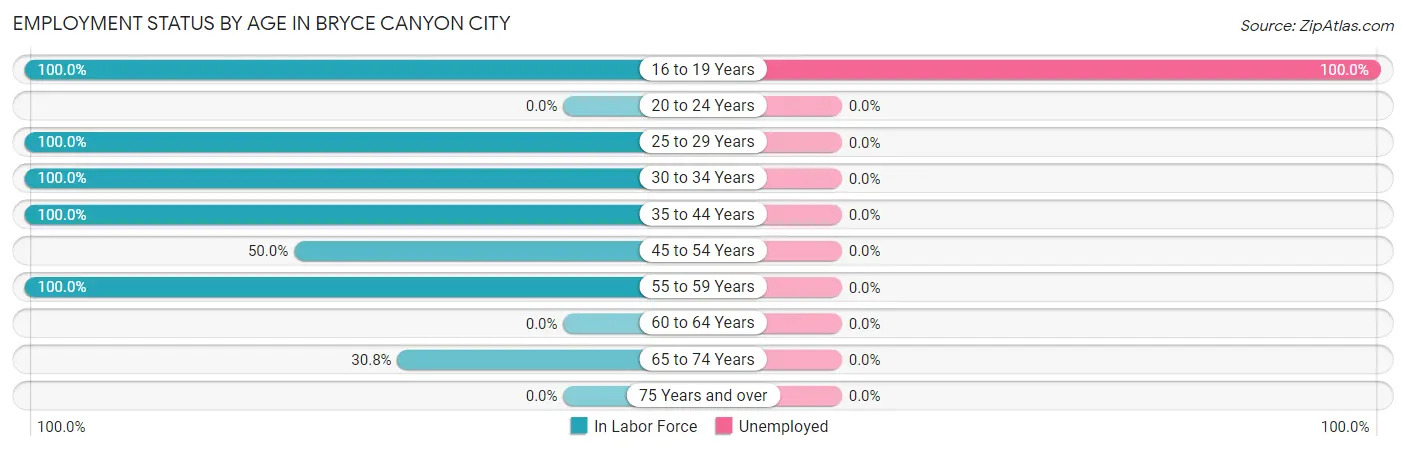
| Age Bracket | In Labor Force | Unemployed |
| 16 to 19 Years | 14 (100.0%) | 14 (100.0%) |
| 20 to 24 Years | 0 (0.0%) | 0 (0.0%) |
| 25 to 29 Years | 14 (100.0%) | 0 (0.0%) |
| 30 to 34 Years | 105 (100.0%) | 0 (0.0%) |
| 35 to 44 Years | 18 (100.0%) | 0 (0.0%) |
| 45 to 54 Years | 14 (50.0%) | 0 (0.0%) |
| 55 to 59 Years | 14 (100.0%) | 0 (0.0%) |
| 60 to 64 Years | 0 (0.0%) | 0 (0.0%) |
| 65 to 74 Years | 8 (30.8%) | 0 (0.0%) |
| 75 Years and over | 0 (0.0%) | 0 (0.0%) |
| Total | 187 (85.4%) | 14 (7.5%) |
Employment Status by Educational Attainment in Bryce Canyon City
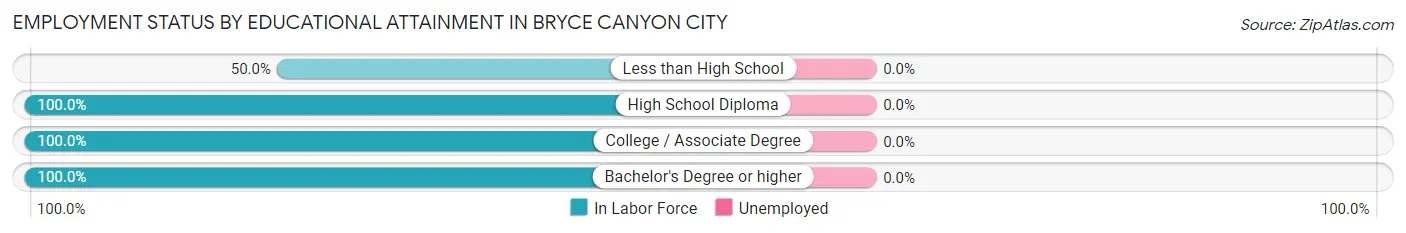
| Educational Attainment | In Labor Force | Unemployed |
| Less than High School | 14 (50.0%) | 0 (0.0%) |
| High School Diploma | 26 (100.0%) | 0 (0.0%) |
| College / Associate Degree | 14 (100.0%) | 0 (0.0%) |
| Bachelor's Degree or higher | 111 (100.0%) | 0 (0.0%) |
| Total | 165 (92.2%) | 0 (0.0%) |
Employment Occupations by Sex in Bryce Canyon City
Management, Business, Science and Arts Occupations
The most common Management, Business, Science and Arts occupations in Bryce Canyon City are Management (8 | 4.6%), Community & Social Service (6 | 3.5%), and Education, Arts & Media (6 | 3.5%).
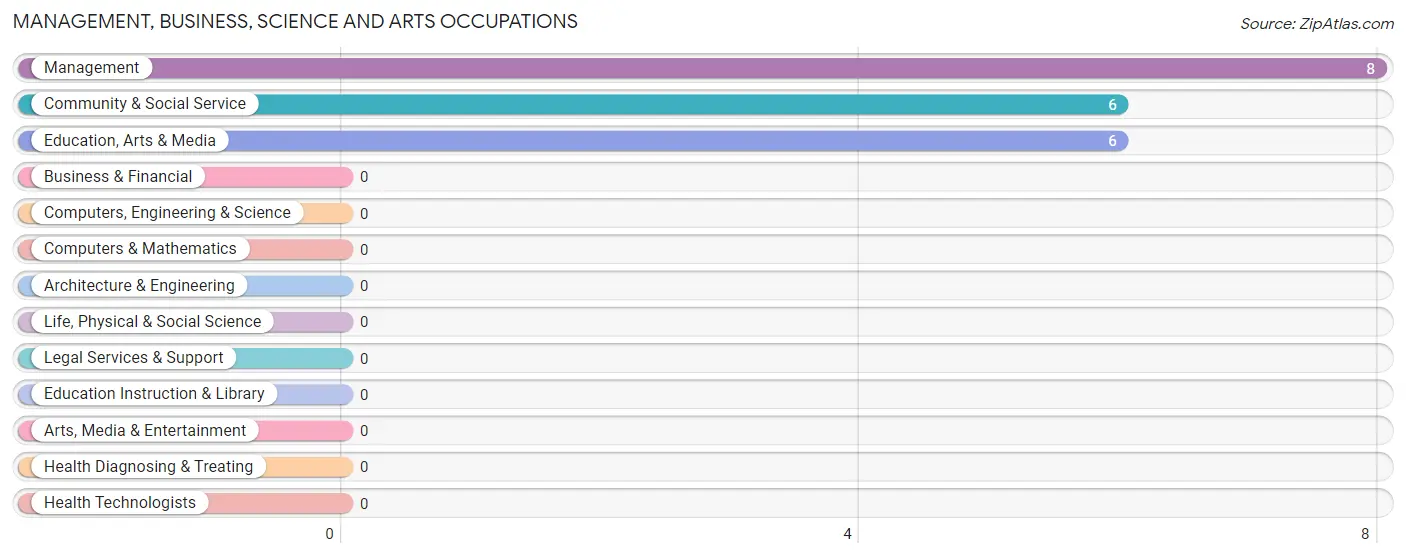
Management, Business, Science and Arts Occupations by Sex
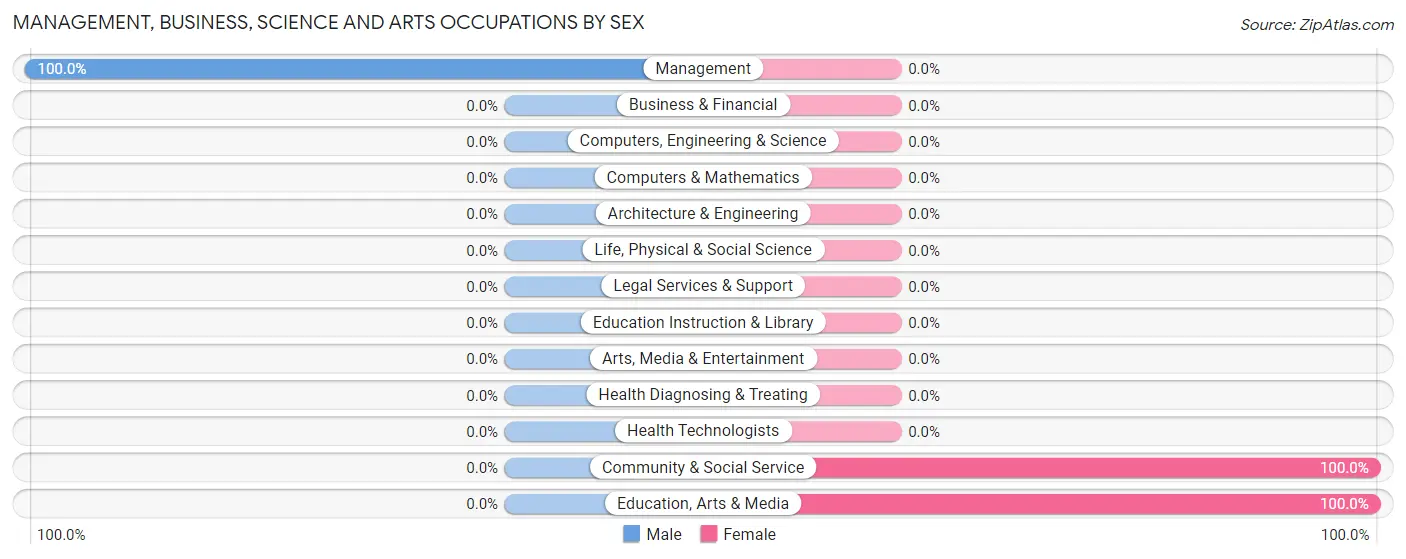
| Occupation | Male | Female |
| Management | 8 (100.0%) | 0 (0.0%) |
| Business & Financial | 0 (0.0%) | 0 (0.0%) |
| Computers, Engineering & Science | 0 (0.0%) | 0 (0.0%) |
| Computers & Mathematics | 0 (0.0%) | 0 (0.0%) |
| Architecture & Engineering | 0 (0.0%) | 0 (0.0%) |
| Life, Physical & Social Science | 0 (0.0%) | 0 (0.0%) |
| Community & Social Service | 0 (0.0%) | 6 (100.0%) |
| Education, Arts & Media | 0 (0.0%) | 6 (100.0%) |
| Legal Services & Support | 0 (0.0%) | 0 (0.0%) |
| Education Instruction & Library | 0 (0.0%) | 0 (0.0%) |
| Arts, Media & Entertainment | 0 (0.0%) | 0 (0.0%) |
| Health Diagnosing & Treating | 0 (0.0%) | 0 (0.0%) |
| Health Technologists | 0 (0.0%) | 0 (0.0%) |
| Total (Category) | 8 (57.1%) | 6 (42.9%) |
| Total (Overall) | 153 (88.4%) | 20 (11.6%) |
Services Occupations
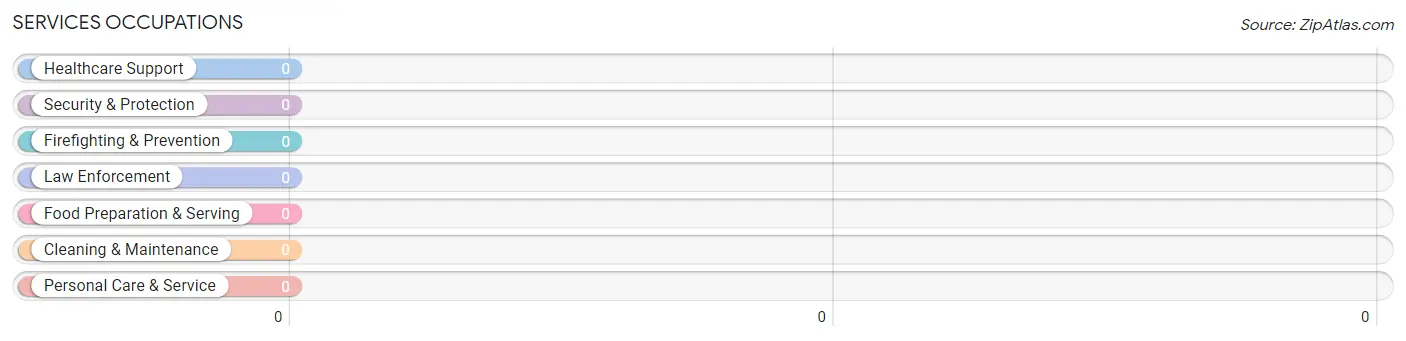
Services Occupations by Sex
| Occupation | Male | Female |
| Healthcare Support | 0 (0.0%) | 0 (0.0%) |
| Security & Protection | 0 (0.0%) | 0 (0.0%) |
| Firefighting & Prevention | 0 (0.0%) | 0 (0.0%) |
| Law Enforcement | 0 (0.0%) | 0 (0.0%) |
| Food Preparation & Serving | 0 (0.0%) | 0 (0.0%) |
| Cleaning & Maintenance | 0 (0.0%) | 0 (0.0%) |
| Personal Care & Service | 0 (0.0%) | 0 (0.0%) |
| Total (Category) | 0 (0.0%) | 0 (0.0%) |
| Total (Overall) | 153 (88.4%) | 20 (11.6%) |
Sales and Office Occupations
The most common Sales and Office occupations in Bryce Canyon City are , and Sales & Related (14 | 8.1%).
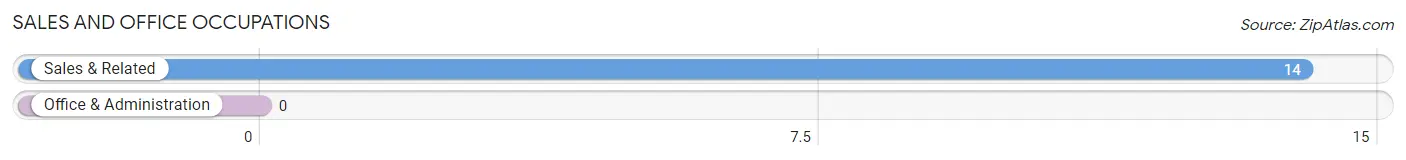
Sales and Office Occupations by Sex
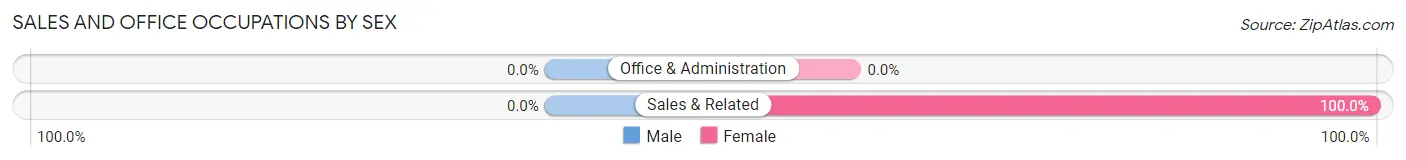
| Occupation | Male | Female |
| Sales & Related | 0 (0.0%) | 14 (100.0%) |
| Office & Administration | 0 (0.0%) | 0 (0.0%) |
| Total (Category) | 0 (0.0%) | 14 (100.0%) |
| Total (Overall) | 153 (88.4%) | 20 (11.6%) |
Natural Resources, Construction and Maintenance Occupations
The most common Natural Resources, Construction and Maintenance occupations in Bryce Canyon City are , and Installation, Maintenance & Repair (28 | 16.2%).
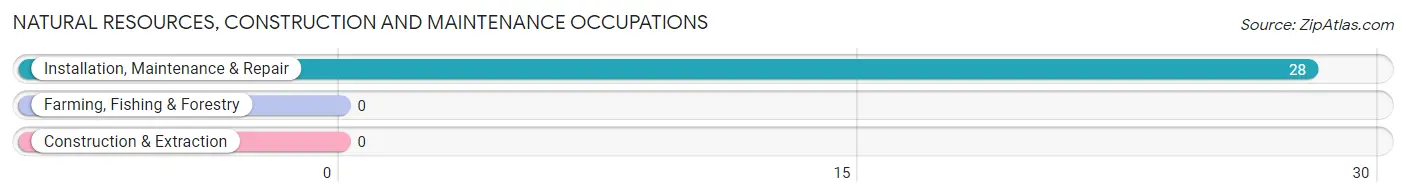
Natural Resources, Construction and Maintenance Occupations by Sex
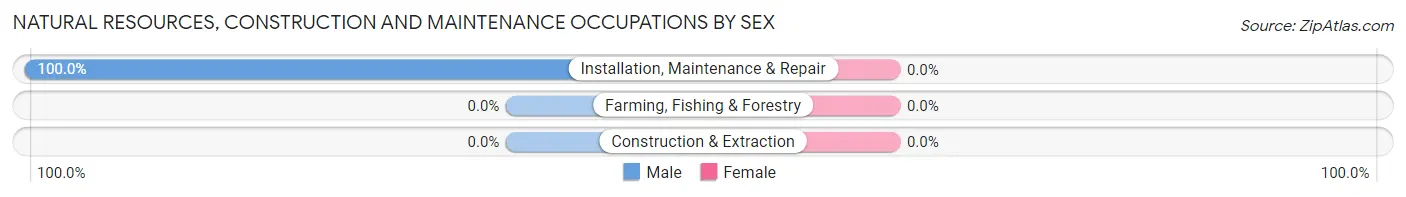
| Occupation | Male | Female |
| Farming, Fishing & Forestry | 0 (0.0%) | 0 (0.0%) |
| Construction & Extraction | 0 (0.0%) | 0 (0.0%) |
| Installation, Maintenance & Repair | 28 (100.0%) | 0 (0.0%) |
| Total (Category) | 28 (100.0%) | 0 (0.0%) |
| Total (Overall) | 153 (88.4%) | 20 (11.6%) |
Production, Transportation and Moving Occupations
The most common Production, Transportation and Moving occupations in Bryce Canyon City are , and Production (117 | 67.6%).
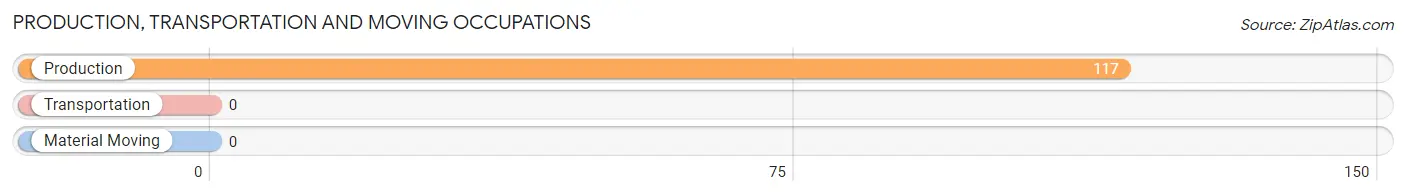
Production, Transportation and Moving Occupations by Sex
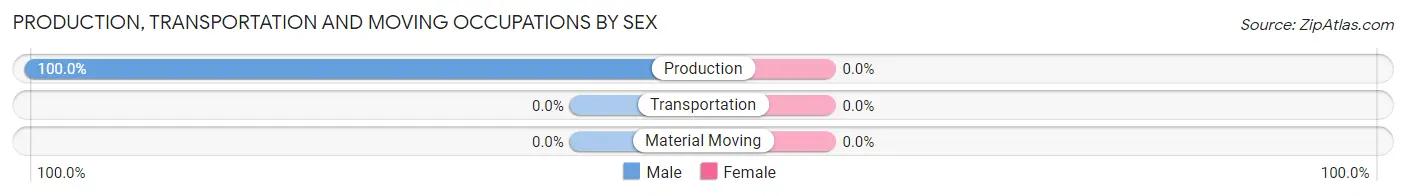
| Occupation | Male | Female |
| Production | 117 (100.0%) | 0 (0.0%) |
| Transportation | 0 (0.0%) | 0 (0.0%) |
| Material Moving | 0 (0.0%) | 0 (0.0%) |
| Total (Category) | 117 (100.0%) | 0 (0.0%) |
| Total (Overall) | 153 (88.4%) | 20 (11.6%) |
Employment Industries by Sex in Bryce Canyon City
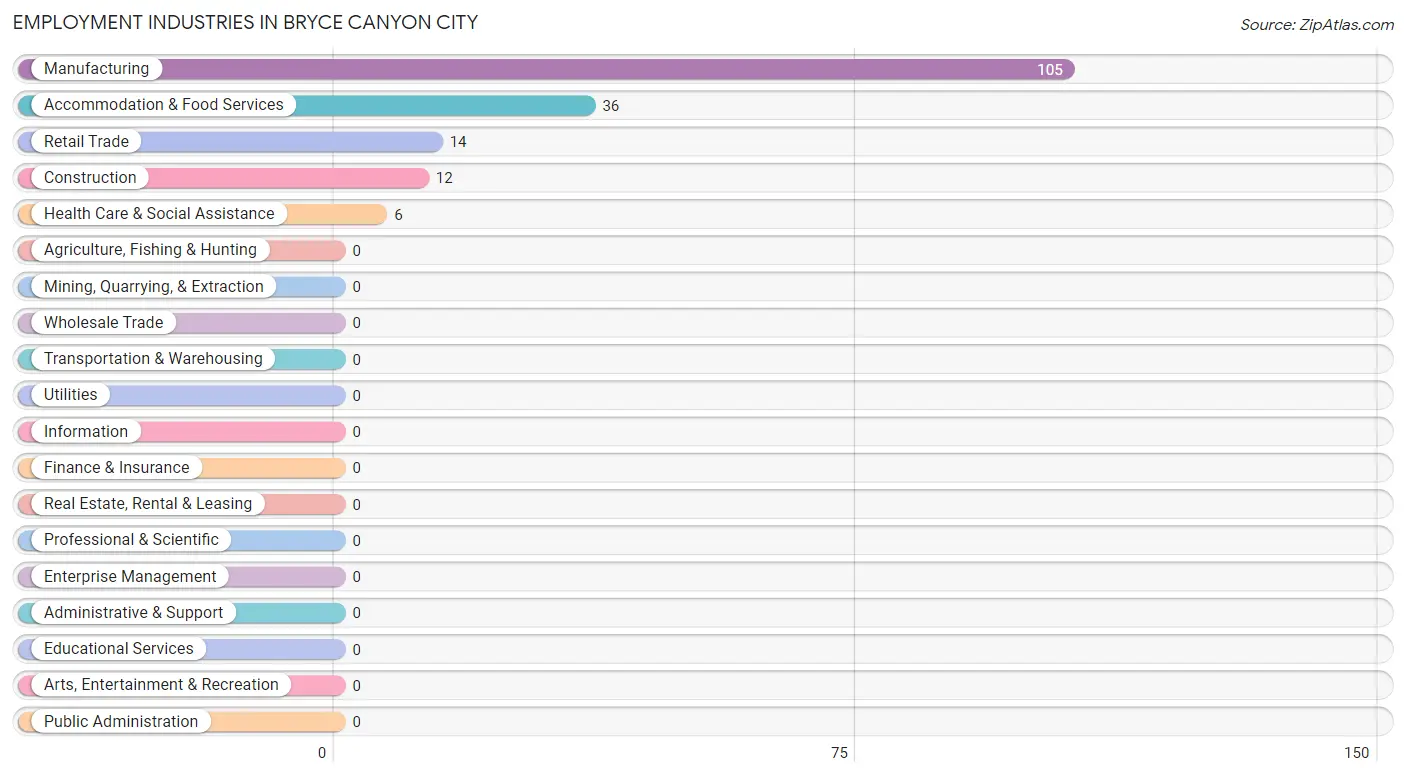
Employment Industries in Bryce Canyon City
The major employment industries in Bryce Canyon City include Manufacturing (105 | 60.7%), Accommodation & Food Services (36 | 20.8%), Retail Trade (14 | 8.1%), Construction (12 | 6.9%), and Health Care & Social Assistance (6 | 3.5%).
Employment Industries by Sex in Bryce Canyon City
The Bryce Canyon City industries that see more men than women are Construction (100.0%), Manufacturing (100.0%), and Accommodation & Food Services (100.0%), whereas the industries that tend to have a higher number of women are Retail Trade (100.0%), and Health Care & Social Assistance (100.0%).
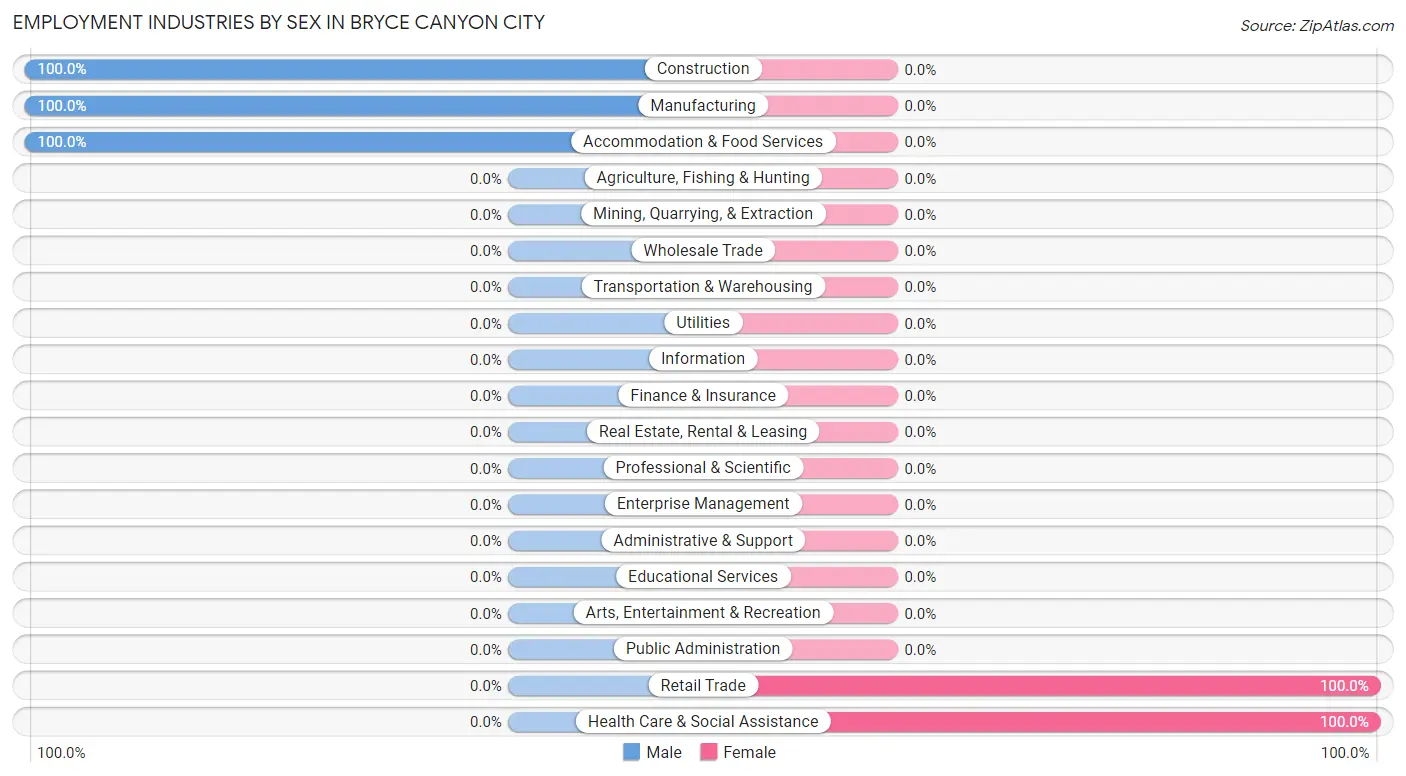
| Industry | Male | Female |
| Agriculture, Fishing & Hunting | 0 (0.0%) | 0 (0.0%) |
| Mining, Quarrying, & Extraction | 0 (0.0%) | 0 (0.0%) |
| Construction | 12 (100.0%) | 0 (0.0%) |
| Manufacturing | 105 (100.0%) | 0 (0.0%) |
| Wholesale Trade | 0 (0.0%) | 0 (0.0%) |
| Retail Trade | 0 (0.0%) | 14 (100.0%) |
| Transportation & Warehousing | 0 (0.0%) | 0 (0.0%) |
| Utilities | 0 (0.0%) | 0 (0.0%) |
| Information | 0 (0.0%) | 0 (0.0%) |
| Finance & Insurance | 0 (0.0%) | 0 (0.0%) |
| Real Estate, Rental & Leasing | 0 (0.0%) | 0 (0.0%) |
| Professional & Scientific | 0 (0.0%) | 0 (0.0%) |
| Enterprise Management | 0 (0.0%) | 0 (0.0%) |
| Administrative & Support | 0 (0.0%) | 0 (0.0%) |
| Educational Services | 0 (0.0%) | 0 (0.0%) |
| Health Care & Social Assistance | 0 (0.0%) | 6 (100.0%) |
| Arts, Entertainment & Recreation | 0 (0.0%) | 0 (0.0%) |
| Accommodation & Food Services | 36 (100.0%) | 0 (0.0%) |
| Public Administration | 0 (0.0%) | 0 (0.0%) |
| Total | 153 (88.4%) | 20 (11.6%) |
Education in Bryce Canyon City
School Enrollment in Bryce Canyon City
The most common levels of schooling among the 10 students in Bryce Canyon City are middle school (5 | 50.0%), and high school (5 | 50.0%).
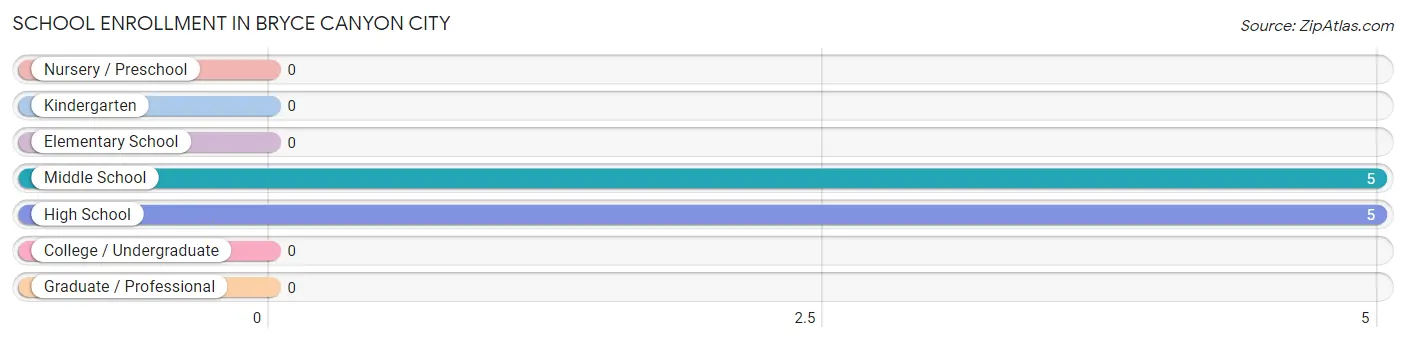
| School Level | # Students | % Students |
| Nursery / Preschool | 0 | 0.0% |
| Kindergarten | 0 | 0.0% |
| Elementary School | 0 | 0.0% |
| Middle School | 5 | 50.0% |
| High School | 5 | 50.0% |
| College / Undergraduate | 0 | 0.0% |
| Graduate / Professional | 0 | 0.0% |
| Total | 10 | 100.0% |
School Enrollment by Age by Funding Source in Bryce Canyon City
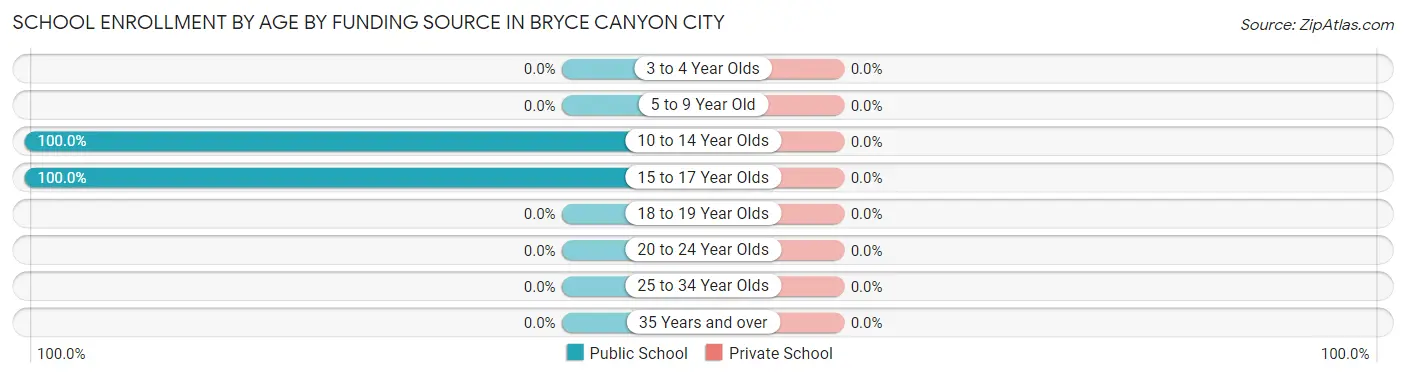
| Age Bracket | Public School | Private School |
| 3 to 4 Year Olds | 0 (0.0%) | 0 (0.0%) |
| 5 to 9 Year Old | 0 (0.0%) | 0 (0.0%) |
| 10 to 14 Year Olds | 5 (100.0%) | 0 (0.0%) |
| 15 to 17 Year Olds | 5 (100.0%) | 0 (0.0%) |
| 18 to 19 Year Olds | 0 (0.0%) | 0 (0.0%) |
| 20 to 24 Year Olds | 0 (0.0%) | 0 (0.0%) |
| 25 to 34 Year Olds | 0 (0.0%) | 0 (0.0%) |
| 35 Years and over | 0 (0.0%) | 0 (0.0%) |
| Total | 10 (100.0%) | 0 (0.0%) |
Educational Attainment by Field of Study in Bryce Canyon City
Visual & performing arts (105 | 46.9%), communications (105 | 46.9%), bio, nature & agricultural (8 | 3.6%), and arts & humanities (6 | 2.7%) are the most common fields of study among 224 individuals in Bryce Canyon City who have obtained a bachelor's degree or higher.
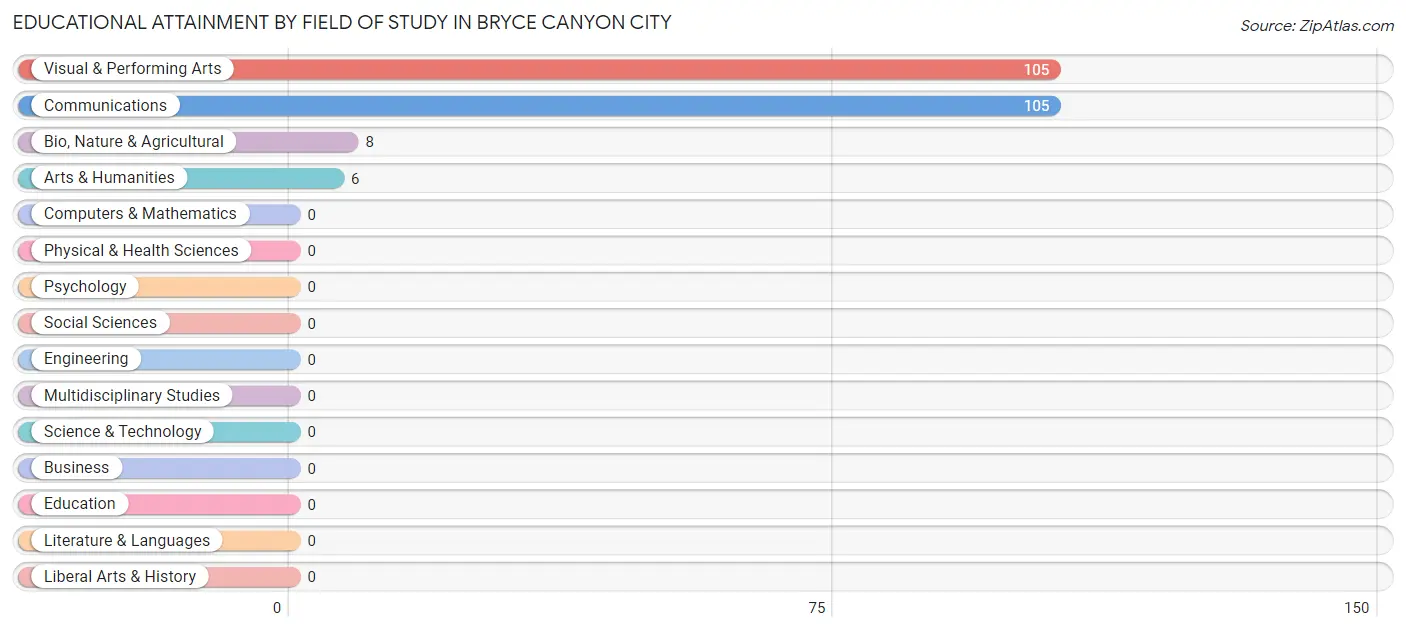
| Field of Study | # Graduates | % Graduates |
| Computers & Mathematics | 0 | 0.0% |
| Bio, Nature & Agricultural | 8 | 3.6% |
| Physical & Health Sciences | 0 | 0.0% |
| Psychology | 0 | 0.0% |
| Social Sciences | 0 | 0.0% |
| Engineering | 0 | 0.0% |
| Multidisciplinary Studies | 0 | 0.0% |
| Science & Technology | 0 | 0.0% |
| Business | 0 | 0.0% |
| Education | 0 | 0.0% |
| Literature & Languages | 0 | 0.0% |
| Liberal Arts & History | 0 | 0.0% |
| Visual & Performing Arts | 105 | 46.9% |
| Communications | 105 | 46.9% |
| Arts & Humanities | 6 | 2.7% |
| Total | 224 | 100.0% |
Transportation & Commute in Bryce Canyon City
Vehicle Availability by Sex in Bryce Canyon City
The most prevalent vehicle ownership categories in Bryce Canyon City are males with 2 vehicles (22, accounting for 64.7%) and females with 2 vehicles (0, making up 366.7%).
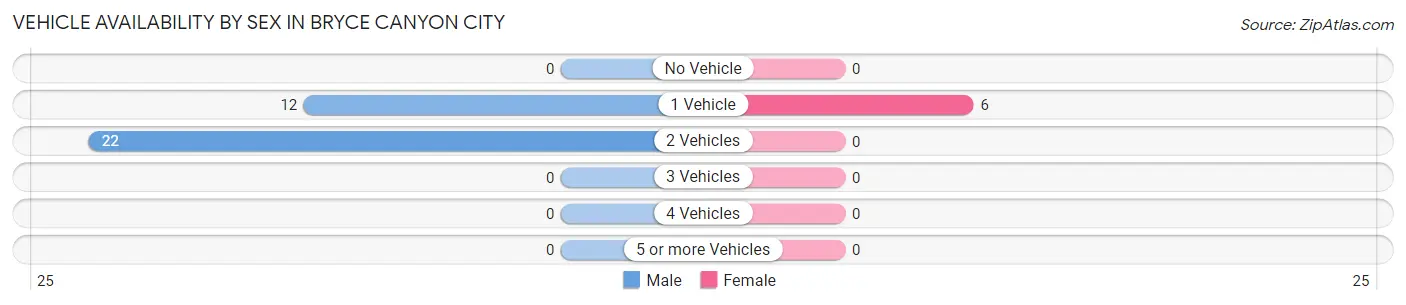
| Vehicles Available | Male | Female |
| No Vehicle | 0 (0.0%) | 0 (0.0%) |
| 1 Vehicle | 12 (35.3%) | 6 (100.0%) |
| 2 Vehicles | 22 (64.7%) | 0 (0.0%) |
| 3 Vehicles | 0 (0.0%) | 0 (0.0%) |
| 4 Vehicles | 0 (0.0%) | 0 (0.0%) |
| 5 or more Vehicles | 0 (0.0%) | 0 (0.0%) |
| Total | 34 (100.0%) | 6 (100.0%) |
Commute Time in Bryce Canyon City
The most frequently occuring commute durations in Bryce Canyon City are 5 to 9 minutes (119 commuters, 68.8%), less than 5 minutes (36 commuters, 20.8%), and 10 to 14 minutes (12 commuters, 6.9%).
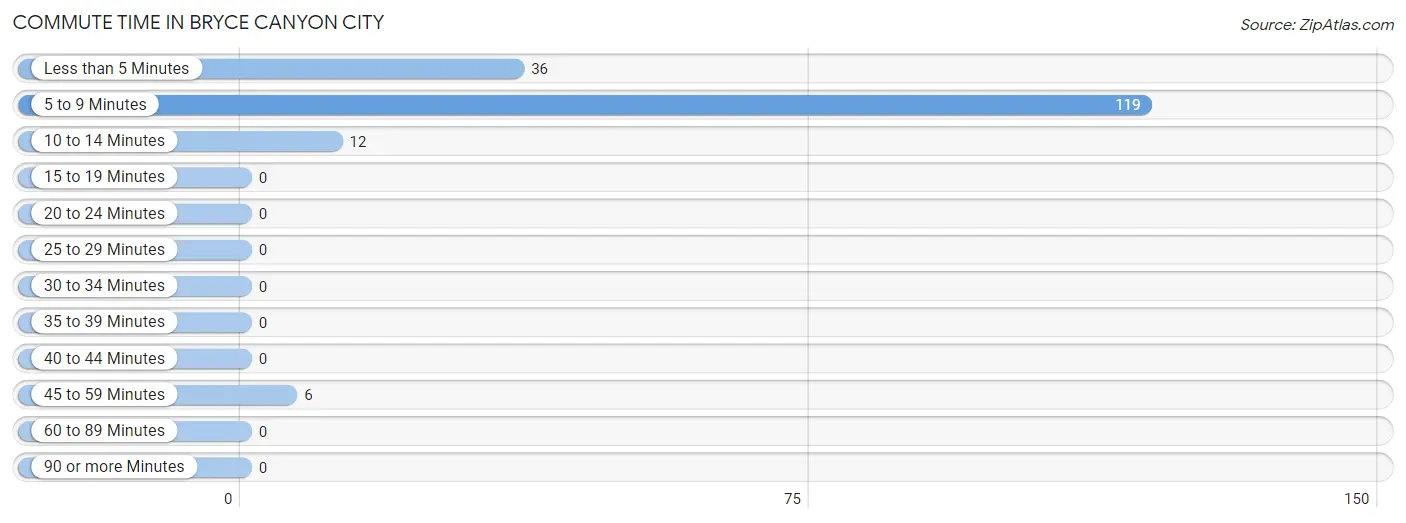
| Commute Time | # Commuters | % Commuters |
| Less than 5 Minutes | 36 | 20.8% |
| 5 to 9 Minutes | 119 | 68.8% |
| 10 to 14 Minutes | 12 | 6.9% |
| 15 to 19 Minutes | 0 | 0.0% |
| 20 to 24 Minutes | 0 | 0.0% |
| 25 to 29 Minutes | 0 | 0.0% |
| 30 to 34 Minutes | 0 | 0.0% |
| 35 to 39 Minutes | 0 | 0.0% |
| 40 to 44 Minutes | 0 | 0.0% |
| 45 to 59 Minutes | 6 | 3.5% |
| 60 to 89 Minutes | 0 | 0.0% |
| 90 or more Minutes | 0 | 0.0% |
Commute Time by Sex in Bryce Canyon City
The most common commute times in Bryce Canyon City are 5 to 9 minutes (105 commuters, 68.6%) for males and 5 to 9 minutes (14 commuters, 70.0%) for females.
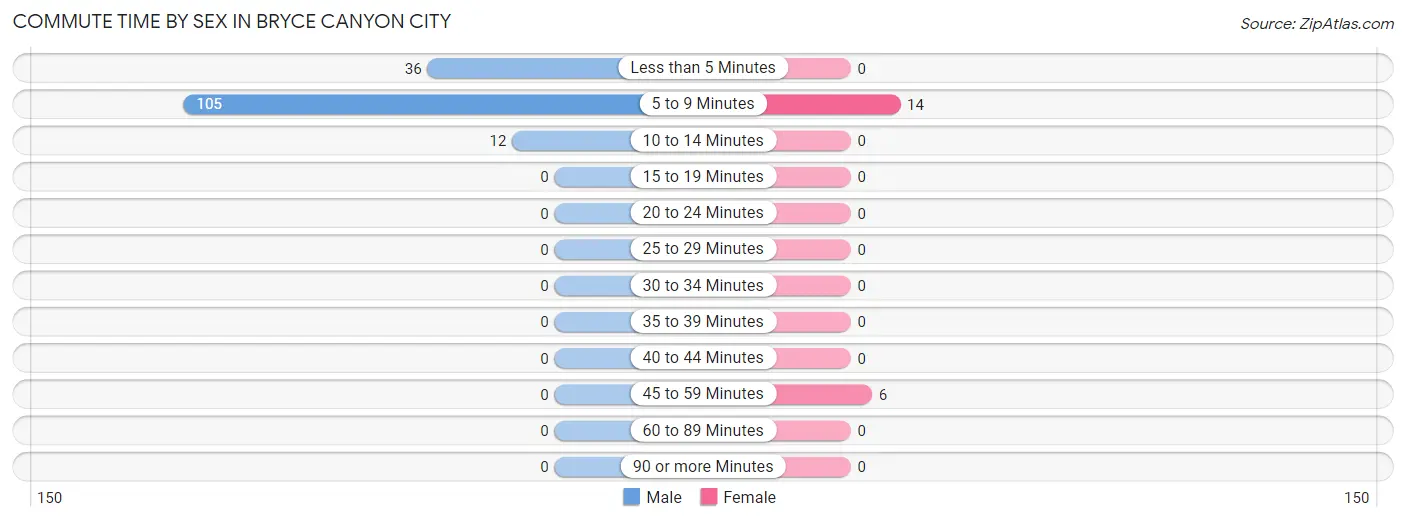
| Commute Time | Male | Female |
| Less than 5 Minutes | 36 (23.5%) | 0 (0.0%) |
| 5 to 9 Minutes | 105 (68.6%) | 14 (70.0%) |
| 10 to 14 Minutes | 12 (7.8%) | 0 (0.0%) |
| 15 to 19 Minutes | 0 (0.0%) | 0 (0.0%) |
| 20 to 24 Minutes | 0 (0.0%) | 0 (0.0%) |
| 25 to 29 Minutes | 0 (0.0%) | 0 (0.0%) |
| 30 to 34 Minutes | 0 (0.0%) | 0 (0.0%) |
| 35 to 39 Minutes | 0 (0.0%) | 0 (0.0%) |
| 40 to 44 Minutes | 0 (0.0%) | 0 (0.0%) |
| 45 to 59 Minutes | 0 (0.0%) | 6 (30.0%) |
| 60 to 89 Minutes | 0 (0.0%) | 0 (0.0%) |
| 90 or more Minutes | 0 (0.0%) | 0 (0.0%) |
Time of Departure to Work by Sex in Bryce Canyon City
The most frequent times of departure to work in Bryce Canyon City are 6:00 AM to 6:29 AM (105, 68.6%) for males and 9:00 AM to 9:59 AM (14, 70.0%) for females.
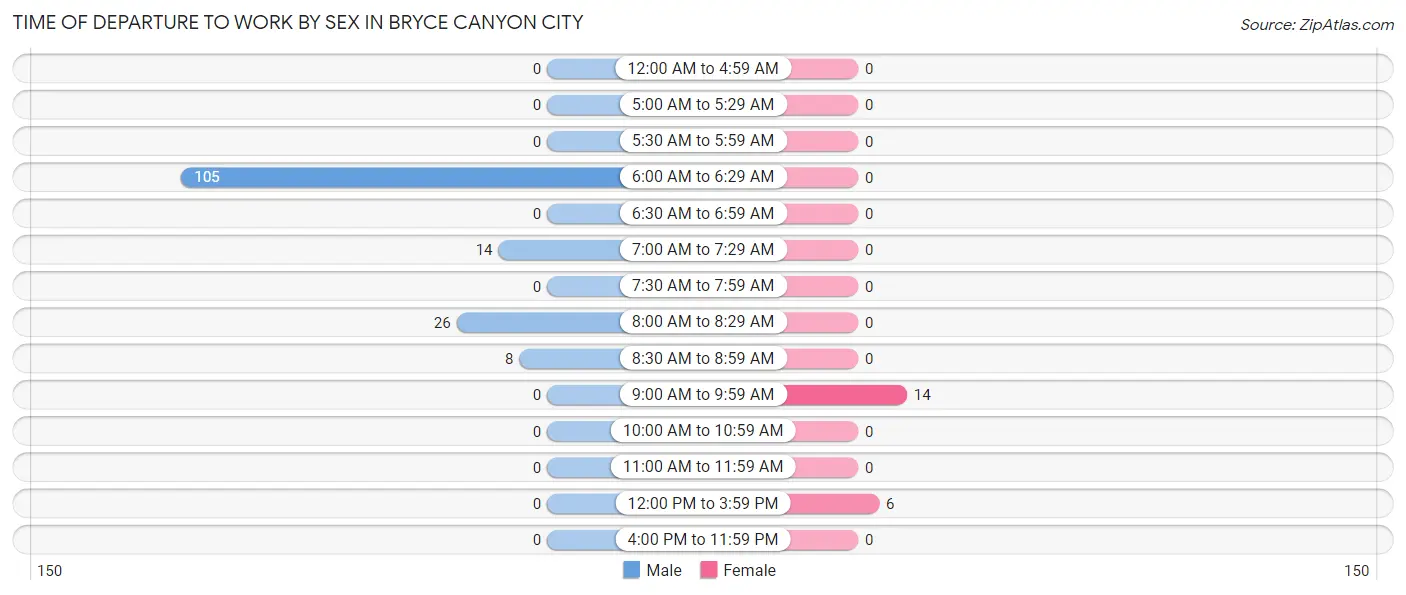
| Time of Departure | Male | Female |
| 12:00 AM to 4:59 AM | 0 (0.0%) | 0 (0.0%) |
| 5:00 AM to 5:29 AM | 0 (0.0%) | 0 (0.0%) |
| 5:30 AM to 5:59 AM | 0 (0.0%) | 0 (0.0%) |
| 6:00 AM to 6:29 AM | 105 (68.6%) | 0 (0.0%) |
| 6:30 AM to 6:59 AM | 0 (0.0%) | 0 (0.0%) |
| 7:00 AM to 7:29 AM | 14 (9.1%) | 0 (0.0%) |
| 7:30 AM to 7:59 AM | 0 (0.0%) | 0 (0.0%) |
| 8:00 AM to 8:29 AM | 26 (17.0%) | 0 (0.0%) |
| 8:30 AM to 8:59 AM | 8 (5.2%) | 0 (0.0%) |
| 9:00 AM to 9:59 AM | 0 (0.0%) | 14 (70.0%) |
| 10:00 AM to 10:59 AM | 0 (0.0%) | 0 (0.0%) |
| 11:00 AM to 11:59 AM | 0 (0.0%) | 0 (0.0%) |
| 12:00 PM to 3:59 PM | 0 (0.0%) | 6 (30.0%) |
| 4:00 PM to 11:59 PM | 0 (0.0%) | 0 (0.0%) |
| Total | 153 (100.0%) | 20 (100.0%) |
Housing Occupancy in Bryce Canyon City
Occupancy by Ownership in Bryce Canyon City
Of the total 34 dwellings in Bryce Canyon City, owner-occupied units account for 8 (23.5%), while renter-occupied units make up 26 (76.5%).
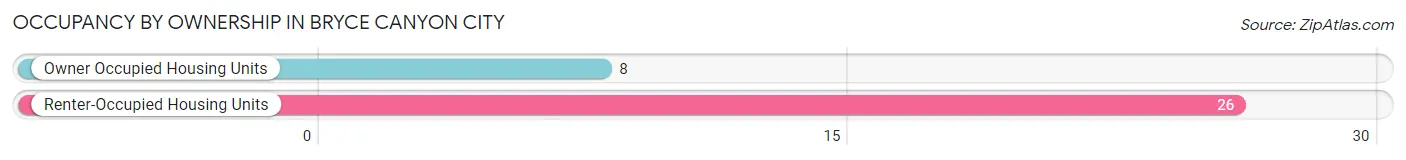
| Occupancy | # Housing Units | % Housing Units |
| Owner Occupied Housing Units | 8 | 23.5% |
| Renter-Occupied Housing Units | 26 | 76.5% |
| Total Occupied Housing Units | 34 | 100.0% |
Occupancy by Household Size in Bryce Canyon City
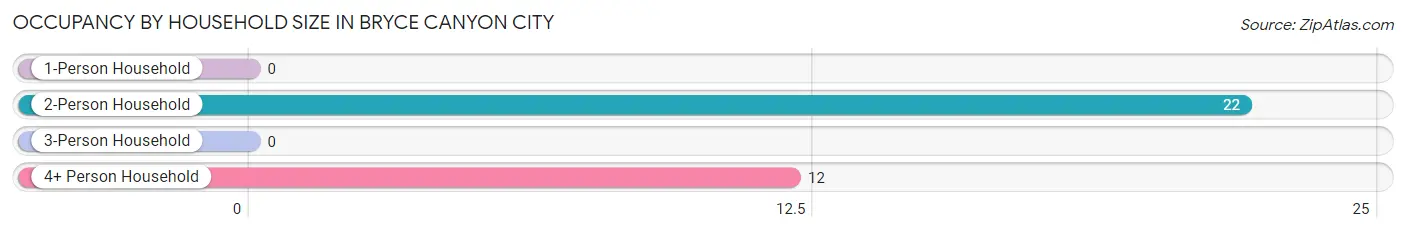
| Household Size | # Housing Units | % Housing Units |
| 1-Person Household | 0 | 0.0% |
| 2-Person Household | 22 | 64.7% |
| 3-Person Household | 0 | 0.0% |
| 4+ Person Household | 12 | 35.3% |
| Total Housing Units | 34 | 100.0% |
Occupancy by Ownership by Household Size in Bryce Canyon City
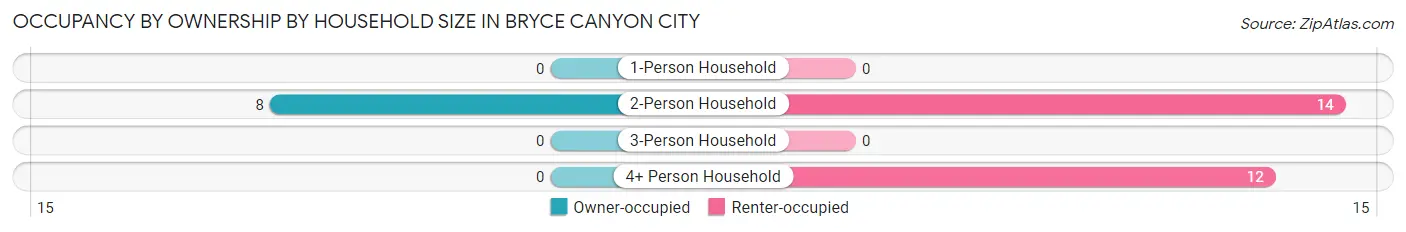
| Household Size | Owner-occupied | Renter-occupied |
| 1-Person Household | 0 (0.0%) | 0 (0.0%) |
| 2-Person Household | 8 (36.4%) | 14 (63.6%) |
| 3-Person Household | 0 (0.0%) | 0 (0.0%) |
| 4+ Person Household | 0 (0.0%) | 12 (100.0%) |
| Total Housing Units | 8 (23.5%) | 26 (76.5%) |
Occupancy by Educational Attainment in Bryce Canyon City
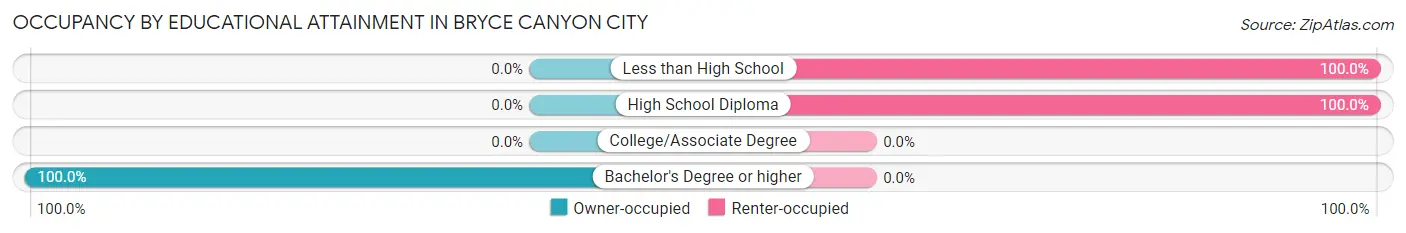
| Household Size | Owner-occupied | Renter-occupied |
| Less than High School | 0 (0.0%) | 14 (100.0%) |
| High School Diploma | 0 (0.0%) | 12 (100.0%) |
| College/Associate Degree | 0 (0.0%) | 0 (0.0%) |
| Bachelor's Degree or higher | 8 (100.0%) | 0 (0.0%) |
Occupancy by Age of Householder in Bryce Canyon City
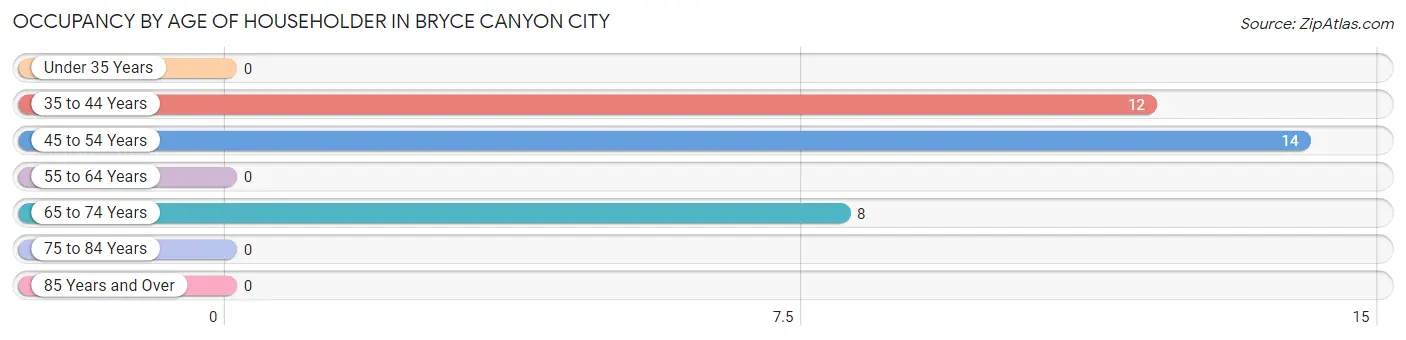
| Age Bracket | # Households | % Households |
| Under 35 Years | 0 | 0.0% |
| 35 to 44 Years | 12 | 35.3% |
| 45 to 54 Years | 14 | 41.2% |
| 55 to 64 Years | 0 | 0.0% |
| 65 to 74 Years | 8 | 23.5% |
| 75 to 84 Years | 0 | 0.0% |
| 85 Years and Over | 0 | 0.0% |
| Total | 34 | 100.0% |
Housing Finances in Bryce Canyon City
Median Income by Occupancy in Bryce Canyon City
| Occupancy Type | # Households | Median Income |
| Owner-Occupied | 8 (23.5%) | $0 |
| Renter-Occupied | 26 (76.5%) | $0 |
| Average | 34 (100.0%) | $0 |
Occupancy by Householder Income Bracket in Bryce Canyon City
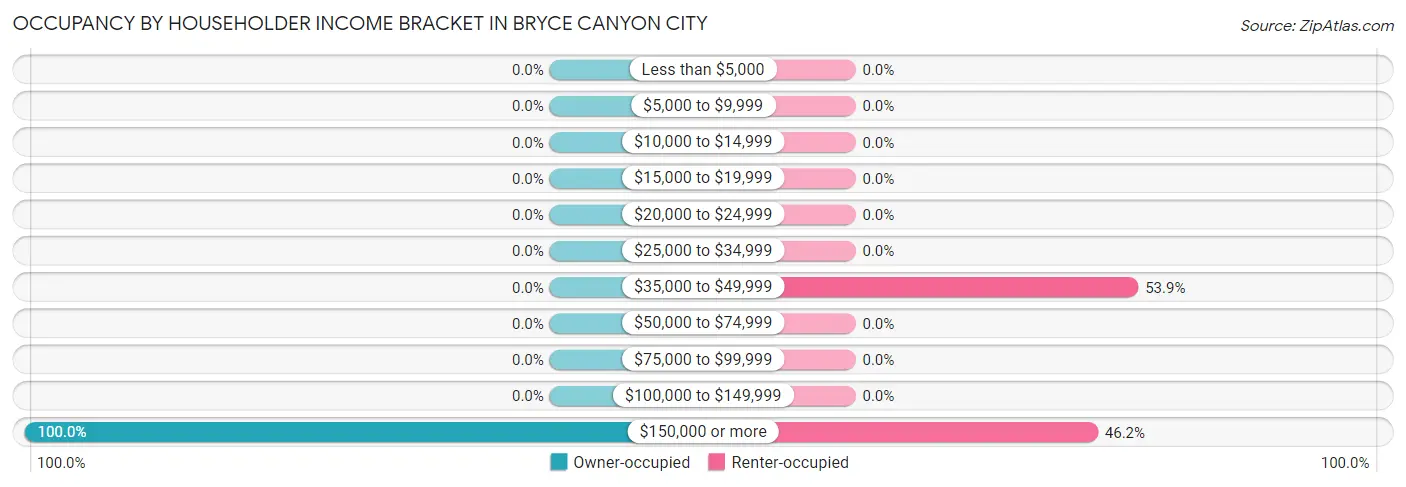
| Income Bracket | Owner-occupied | Renter-occupied |
| Less than $5,000 | 0 (0.0%) | 0 (0.0%) |
| $5,000 to $9,999 | 0 (0.0%) | 0 (0.0%) |
| $10,000 to $14,999 | 0 (0.0%) | 0 (0.0%) |
| $15,000 to $19,999 | 0 (0.0%) | 0 (0.0%) |
| $20,000 to $24,999 | 0 (0.0%) | 0 (0.0%) |
| $25,000 to $34,999 | 0 (0.0%) | 0 (0.0%) |
| $35,000 to $49,999 | 0 (0.0%) | 14 (53.8%) |
| $50,000 to $74,999 | 0 (0.0%) | 0 (0.0%) |
| $75,000 to $99,999 | 0 (0.0%) | 0 (0.0%) |
| $100,000 to $149,999 | 0 (0.0%) | 0 (0.0%) |
| $150,000 or more | 8 (100.0%) | 12 (46.2%) |
| Total | 8 (100.0%) | 26 (100.0%) |
Monthly Housing Cost Tiers in Bryce Canyon City
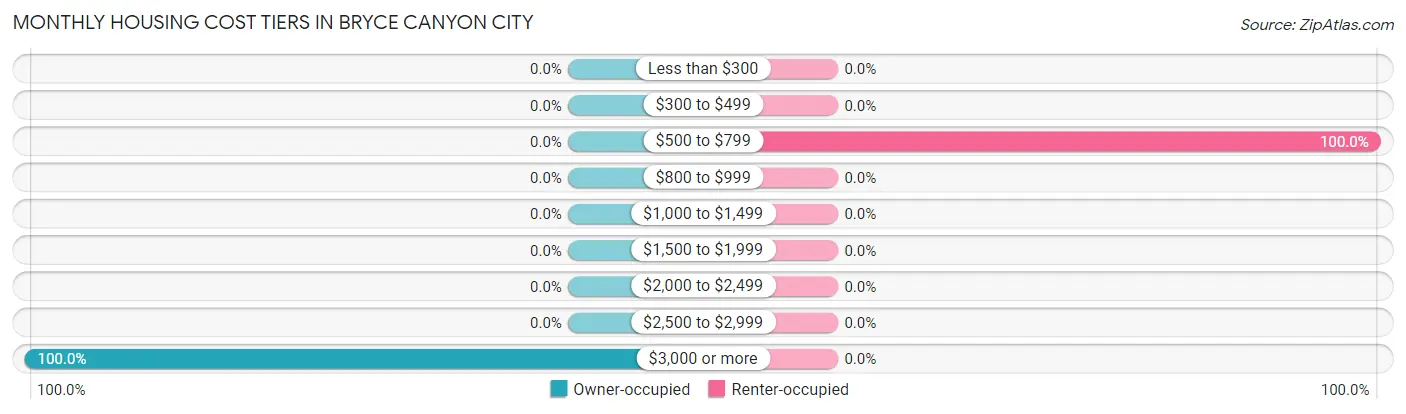
| Monthly Cost | Owner-occupied | Renter-occupied |
| Less than $300 | 0 (0.0%) | 0 (0.0%) |
| $300 to $499 | 0 (0.0%) | 0 (0.0%) |
| $500 to $799 | 0 (0.0%) | 26 (100.0%) |
| $800 to $999 | 0 (0.0%) | 0 (0.0%) |
| $1,000 to $1,499 | 0 (0.0%) | 0 (0.0%) |
| $1,500 to $1,999 | 0 (0.0%) | 0 (0.0%) |
| $2,000 to $2,499 | 0 (0.0%) | 0 (0.0%) |
| $2,500 to $2,999 | 0 (0.0%) | 0 (0.0%) |
| $3,000 or more | 8 (100.0%) | 0 (0.0%) |
| Total | 8 (100.0%) | 26 (100.0%) |
Physical Housing Characteristics in Bryce Canyon City
Housing Structures in Bryce Canyon City
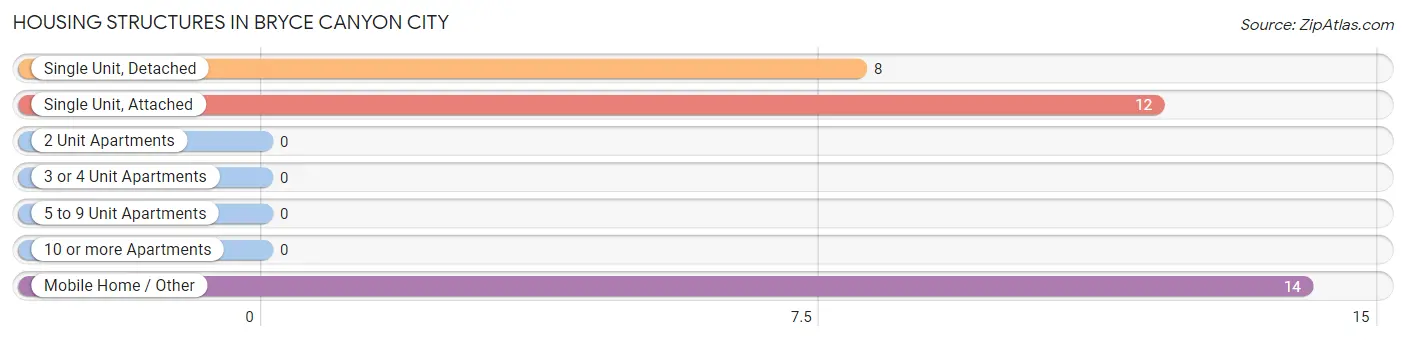
| Structure Type | # Housing Units | % Housing Units |
| Single Unit, Detached | 8 | 23.5% |
| Single Unit, Attached | 12 | 35.3% |
| 2 Unit Apartments | 0 | 0.0% |
| 3 or 4 Unit Apartments | 0 | 0.0% |
| 5 to 9 Unit Apartments | 0 | 0.0% |
| 10 or more Apartments | 0 | 0.0% |
| Mobile Home / Other | 14 | 41.2% |
| Total | 34 | 100.0% |
Housing Structures by Occupancy in Bryce Canyon City
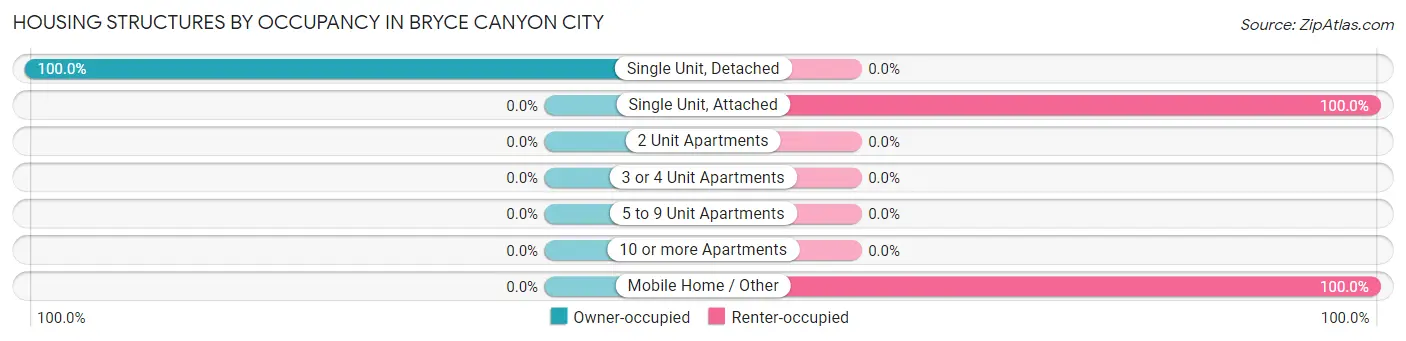
| Structure Type | Owner-occupied | Renter-occupied |
| Single Unit, Detached | 8 (100.0%) | 0 (0.0%) |
| Single Unit, Attached | 0 (0.0%) | 12 (100.0%) |
| 2 Unit Apartments | 0 (0.0%) | 0 (0.0%) |
| 3 or 4 Unit Apartments | 0 (0.0%) | 0 (0.0%) |
| 5 to 9 Unit Apartments | 0 (0.0%) | 0 (0.0%) |
| 10 or more Apartments | 0 (0.0%) | 0 (0.0%) |
| Mobile Home / Other | 0 (0.0%) | 14 (100.0%) |
| Total | 8 (23.5%) | 26 (76.5%) |
Housing Structures by Number of Rooms in Bryce Canyon City
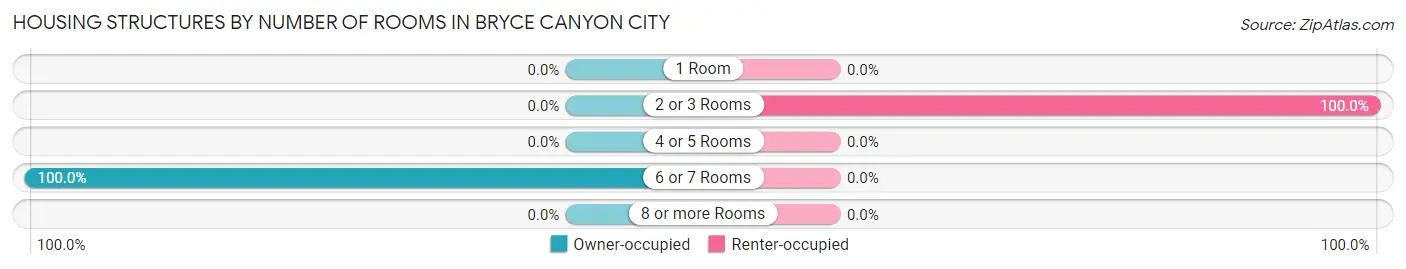
| Number of Rooms | Owner-occupied | Renter-occupied |
| 1 Room | 0 (0.0%) | 0 (0.0%) |
| 2 or 3 Rooms | 0 (0.0%) | 26 (100.0%) |
| 4 or 5 Rooms | 0 (0.0%) | 0 (0.0%) |
| 6 or 7 Rooms | 8 (100.0%) | 0 (0.0%) |
| 8 or more Rooms | 0 (0.0%) | 0 (0.0%) |
| Total | 8 (100.0%) | 26 (100.0%) |
Housing Structure by Heating Type in Bryce Canyon City
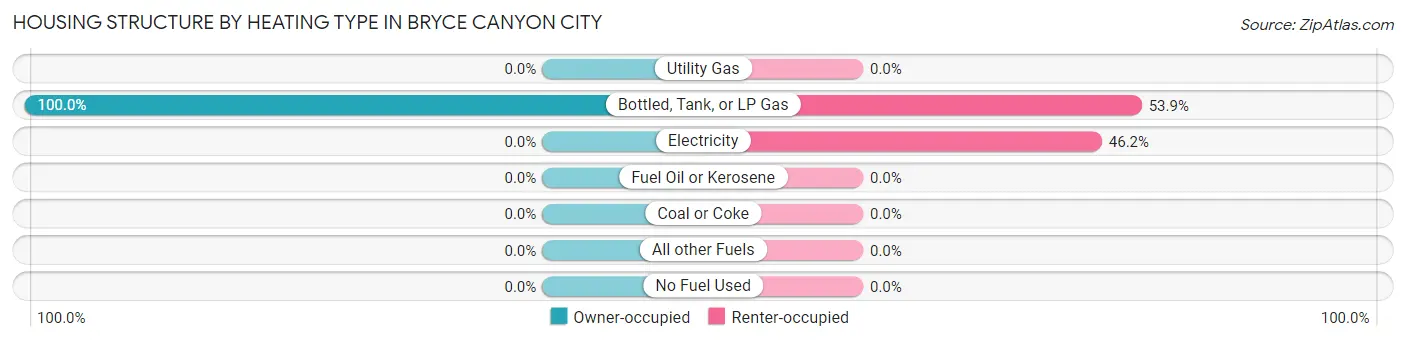
| Heating Type | Owner-occupied | Renter-occupied |
| Utility Gas | 0 (0.0%) | 0 (0.0%) |
| Bottled, Tank, or LP Gas | 8 (100.0%) | 14 (53.8%) |
| Electricity | 0 (0.0%) | 12 (46.2%) |
| Fuel Oil or Kerosene | 0 (0.0%) | 0 (0.0%) |
| Coal or Coke | 0 (0.0%) | 0 (0.0%) |
| All other Fuels | 0 (0.0%) | 0 (0.0%) |
| No Fuel Used | 0 (0.0%) | 0 (0.0%) |
| Total | 8 (100.0%) | 26 (100.0%) |
Household Vehicle Usage in Bryce Canyon City
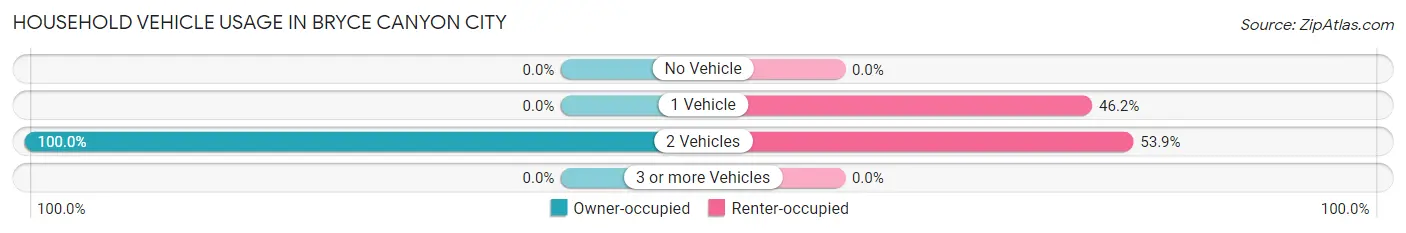
| Vehicles per Household | Owner-occupied | Renter-occupied |
| No Vehicle | 0 (0.0%) | 0 (0.0%) |
| 1 Vehicle | 0 (0.0%) | 12 (46.2%) |
| 2 Vehicles | 8 (100.0%) | 14 (53.8%) |
| 3 or more Vehicles | 0 (0.0%) | 0 (0.0%) |
| Total | 8 (100.0%) | 26 (100.0%) |
Real Estate & Mortgages in Bryce Canyon City
Real Estate and Mortgage Overview in Bryce Canyon City
| Characteristic | Without Mortgage | With Mortgage |
| Housing Units | 0 | 8 |
| Median Property Value | - | - |
| Median Household Income | - | - |
| Monthly Housing Costs | - | - |
| Real Estate Taxes | - | - |
Property Value by Mortgage Status in Bryce Canyon City
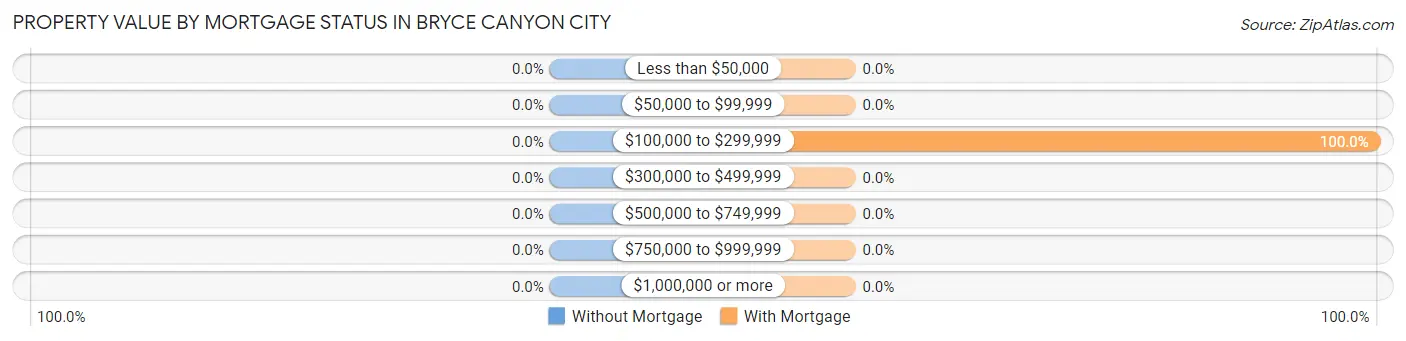
| Property Value | Without Mortgage | With Mortgage |
| Less than $50,000 | 0 (0.0%) | 0 (0.0%) |
| $50,000 to $99,999 | 0 (0.0%) | 0 (0.0%) |
| $100,000 to $299,999 | 0 (0.0%) | 8 (100.0%) |
| $300,000 to $499,999 | 0 (0.0%) | 0 (0.0%) |
| $500,000 to $749,999 | 0 (0.0%) | 0 (0.0%) |
| $750,000 to $999,999 | 0 (0.0%) | 0 (0.0%) |
| $1,000,000 or more | 0 (0.0%) | 0 (0.0%) |
| Total | 0 (0.0%) | 8 (100.0%) |
Household Income by Mortgage Status in Bryce Canyon City
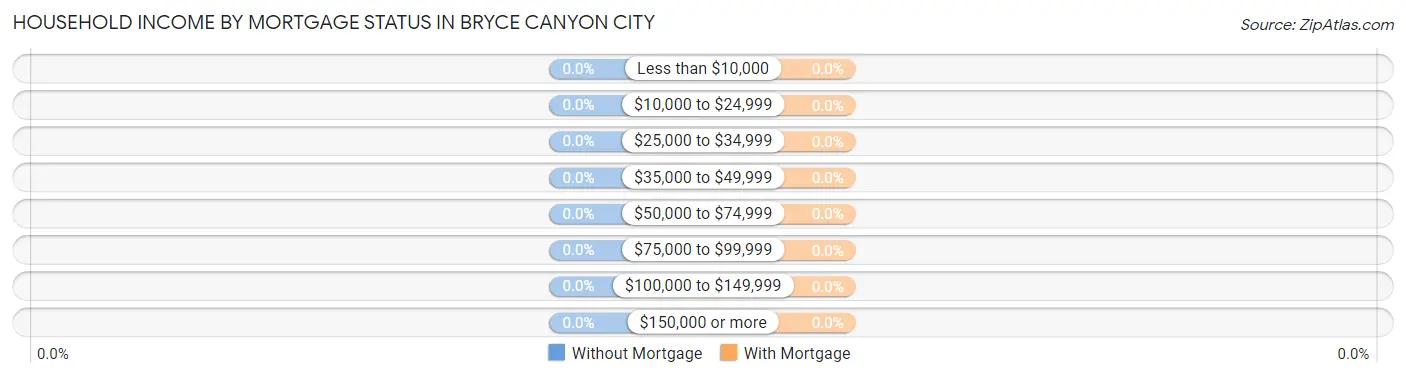
| Household Income | Without Mortgage | With Mortgage |
| Less than $10,000 | 0 (0.0%) | 0 (0.0%) |
| $10,000 to $24,999 | 0 (0.0%) | 0 (0.0%) |
| $25,000 to $34,999 | 0 (0.0%) | 0 (0.0%) |
| $35,000 to $49,999 | 0 (0.0%) | 0 (0.0%) |
| $50,000 to $74,999 | 0 (0.0%) | 0 (0.0%) |
| $75,000 to $99,999 | 0 (0.0%) | 0 (0.0%) |
| $100,000 to $149,999 | 0 (0.0%) | 0 (0.0%) |
| $150,000 or more | 0 (0.0%) | 0 (0.0%) |
| Total | 0 (0.0%) | 8 (100.0%) |
Property Value to Household Income Ratio in Bryce Canyon City
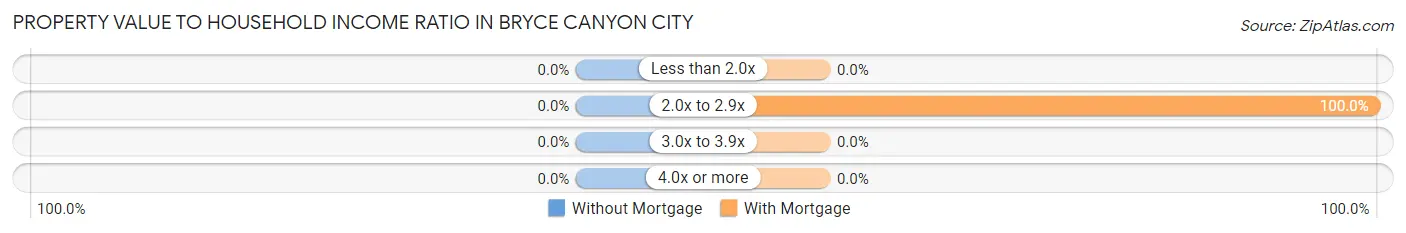
| Value-to-Income Ratio | Without Mortgage | With Mortgage |
| Less than 2.0x | 0 (0.0%) | 0 (0.0%) |
| 2.0x to 2.9x | 0 (0.0%) | 8 (100.0%) |
| 3.0x to 3.9x | 0 (0.0%) | 0 (0.0%) |
| 4.0x or more | 0 (0.0%) | 0 (0.0%) |
| Total | 0 (0.0%) | 8 (100.0%) |
Real Estate Taxes by Mortgage Status in Bryce Canyon City
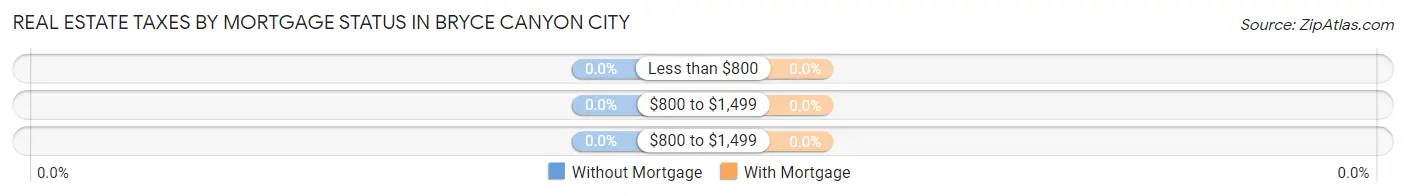
| Property Taxes | Without Mortgage | With Mortgage |
| Less than $800 | 0 (0.0%) | 0 (0.0%) |
| $800 to $1,499 | 0 (0.0%) | 0 (0.0%) |
| $800 to $1,499 | 0 (0.0%) | 0 (0.0%) |
| Total | 0 (0.0%) | 8 (100.0%) |
Health & Disability in Bryce Canyon City
Health Insurance Coverage by Age in Bryce Canyon City
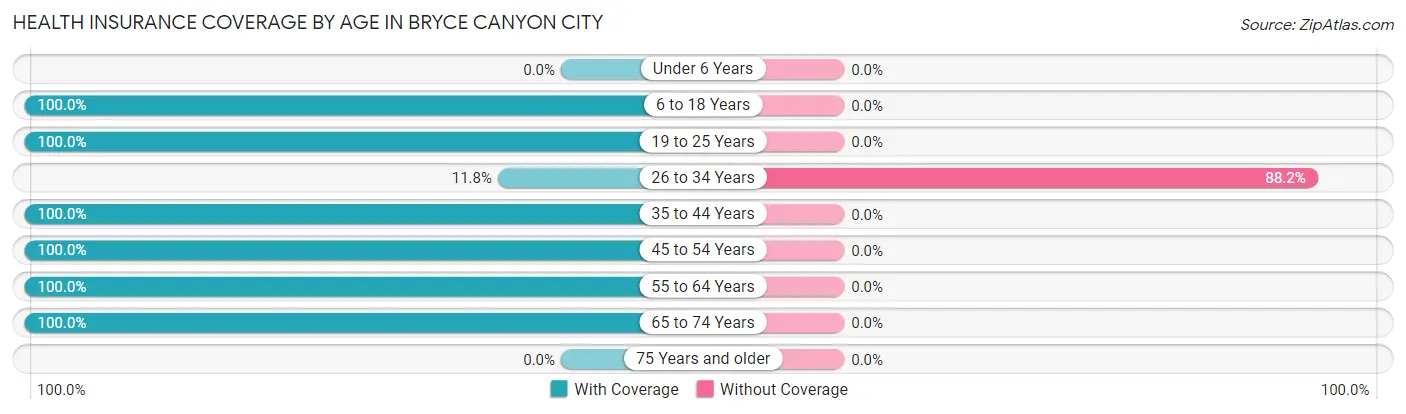
| Age Bracket | With Coverage | Without Coverage |
| Under 6 Years | 0 (0.0%) | 0 (0.0%) |
| 6 to 18 Years | 10 (100.0%) | 0 (0.0%) |
| 19 to 25 Years | 14 (100.0%) | 0 (0.0%) |
| 26 to 34 Years | 14 (11.8%) | 105 (88.2%) |
| 35 to 44 Years | 18 (100.0%) | 0 (0.0%) |
| 45 to 54 Years | 28 (100.0%) | 0 (0.0%) |
| 55 to 64 Years | 14 (100.0%) | 0 (0.0%) |
| 65 to 74 Years | 26 (100.0%) | 0 (0.0%) |
| 75 Years and older | 0 (0.0%) | 0 (0.0%) |
| Total | 124 (54.1%) | 105 (45.9%) |
Health Insurance Coverage by Citizenship Status in Bryce Canyon City
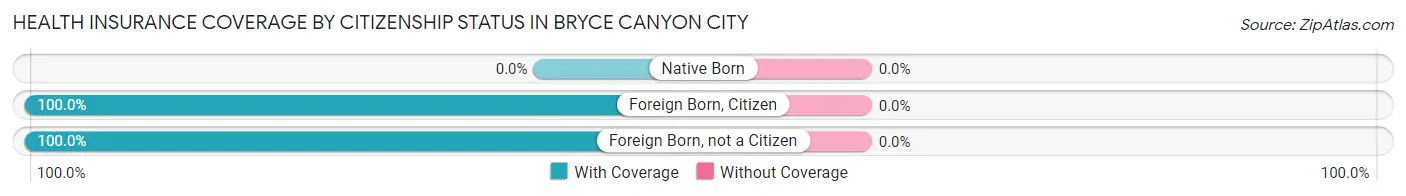
| Citizenship Status | With Coverage | Without Coverage |
| Native Born | 0 (0.0%) | 0 (0.0%) |
| Foreign Born, Citizen | 10 (100.0%) | 0 (0.0%) |
| Foreign Born, not a Citizen | 14 (100.0%) | 0 (0.0%) |
Health Insurance Coverage by Household Income in Bryce Canyon City
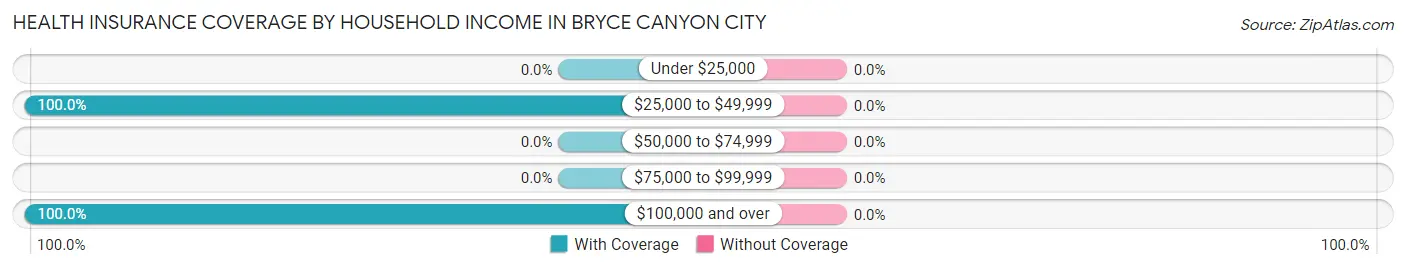
| Household Income | With Coverage | Without Coverage |
| Under $25,000 | 0 (0.0%) | 0 (0.0%) |
| $25,000 to $49,999 | 28 (100.0%) | 0 (0.0%) |
| $50,000 to $74,999 | 0 (0.0%) | 0 (0.0%) |
| $75,000 to $99,999 | 0 (0.0%) | 0 (0.0%) |
| $100,000 and over | 59 (100.0%) | 0 (0.0%) |
Public vs Private Health Insurance Coverage by Age in Bryce Canyon City
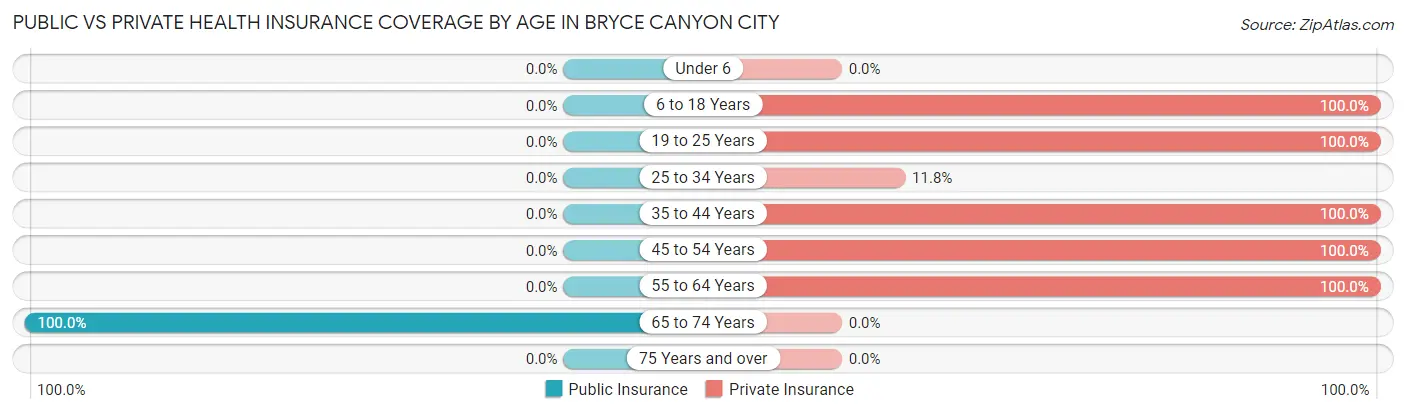
| Age Bracket | Public Insurance | Private Insurance |
| Under 6 | 0 (0.0%) | 0 (0.0%) |
| 6 to 18 Years | 0 (0.0%) | 10 (100.0%) |
| 19 to 25 Years | 0 (0.0%) | 14 (100.0%) |
| 25 to 34 Years | 0 (0.0%) | 14 (11.8%) |
| 35 to 44 Years | 0 (0.0%) | 18 (100.0%) |
| 45 to 54 Years | 0 (0.0%) | 28 (100.0%) |
| 55 to 64 Years | 0 (0.0%) | 14 (100.0%) |
| 65 to 74 Years | 26 (100.0%) | 0 (0.0%) |
| 75 Years and over | 0 (0.0%) | 0 (0.0%) |
| Total | 26 (11.4%) | 98 (42.8%) |
Disability Status by Sex by Age in Bryce Canyon City
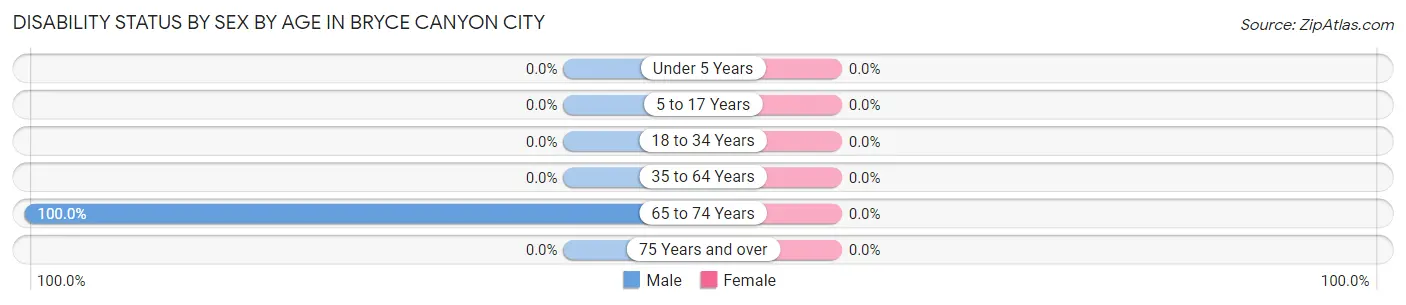
| Age Bracket | Male | Female |
| Under 5 Years | 0 (0.0%) | 0 (0.0%) |
| 5 to 17 Years | 0 (0.0%) | 0 (0.0%) |
| 18 to 34 Years | 0 (0.0%) | 0 (0.0%) |
| 35 to 64 Years | 0 (0.0%) | 0 (0.0%) |
| 65 to 74 Years | 17 (100.0%) | 0 (0.0%) |
| 75 Years and over | 0 (0.0%) | 0 (0.0%) |
Disability Class by Sex by Age in Bryce Canyon City
Disability Class: Hearing Difficulty
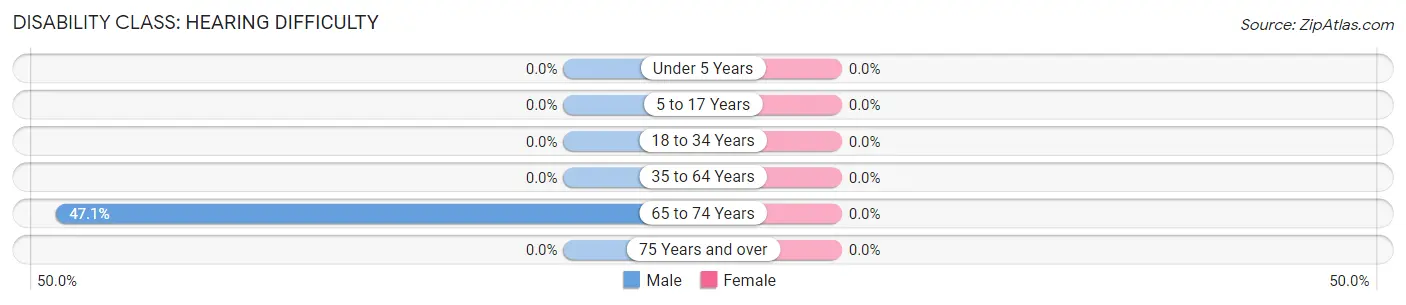
| Age Bracket | Male | Female |
| Under 5 Years | 0 (0.0%) | 0 (0.0%) |
| 5 to 17 Years | 0 (0.0%) | 0 (0.0%) |
| 18 to 34 Years | 0 (0.0%) | 0 (0.0%) |
| 35 to 64 Years | 0 (0.0%) | 0 (0.0%) |
| 65 to 74 Years | 8 (47.1%) | 0 (0.0%) |
| 75 Years and over | 0 (0.0%) | 0 (0.0%) |
Disability Class: Vision Difficulty
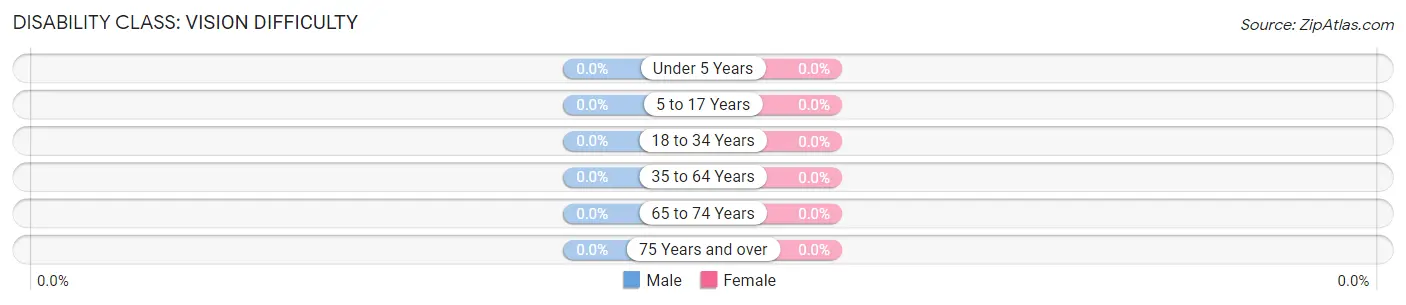
| Age Bracket | Male | Female |
| Under 5 Years | 0 (0.0%) | 0 (0.0%) |
| 5 to 17 Years | 0 (0.0%) | 0 (0.0%) |
| 18 to 34 Years | 0 (0.0%) | 0 (0.0%) |
| 35 to 64 Years | 0 (0.0%) | 0 (0.0%) |
| 65 to 74 Years | 0 (0.0%) | 0 (0.0%) |
| 75 Years and over | 0 (0.0%) | 0 (0.0%) |
Disability Class: Cognitive Difficulty
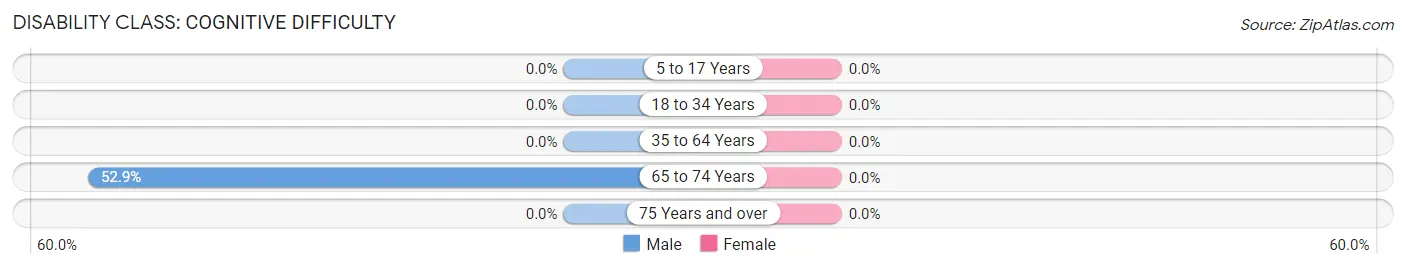
| Age Bracket | Male | Female |
| 5 to 17 Years | 0 (0.0%) | 0 (0.0%) |
| 18 to 34 Years | 0 (0.0%) | 0 (0.0%) |
| 35 to 64 Years | 0 (0.0%) | 0 (0.0%) |
| 65 to 74 Years | 9 (52.9%) | 0 (0.0%) |
| 75 Years and over | 0 (0.0%) | 0 (0.0%) |
Disability Class: Ambulatory Difficulty
| Age Bracket | Male | Female |
| 5 to 17 Years | 0 (0.0%) | 0 (0.0%) |
| 18 to 34 Years | 0 (0.0%) | 0 (0.0%) |
| 35 to 64 Years | 0 (0.0%) | 0 (0.0%) |
| 65 to 74 Years | 0 (0.0%) | 0 (0.0%) |
| 75 Years and over | 0 (0.0%) | 0 (0.0%) |
Disability Class: Self-Care Difficulty
| Age Bracket | Male | Female |
| 5 to 17 Years | 0 (0.0%) | 0 (0.0%) |
| 18 to 34 Years | 0 (0.0%) | 0 (0.0%) |
| 35 to 64 Years | 0 (0.0%) | 0 (0.0%) |
| 65 to 74 Years | 0 (0.0%) | 0 (0.0%) |
| 75 Years and over | 0 (0.0%) | 0 (0.0%) |
Technology Access in Bryce Canyon City
Computing Device Access in Bryce Canyon City
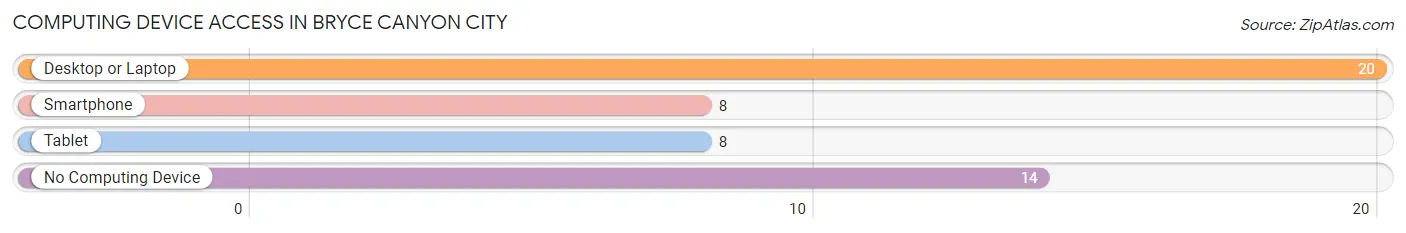
| Device Type | # Households | % Households |
| Desktop or Laptop | 20 | 58.8% |
| Smartphone | 8 | 23.5% |
| Tablet | 8 | 23.5% |
| No Computing Device | 14 | 41.2% |
| Total | 34 | 100.0% |
Internet Access in Bryce Canyon City
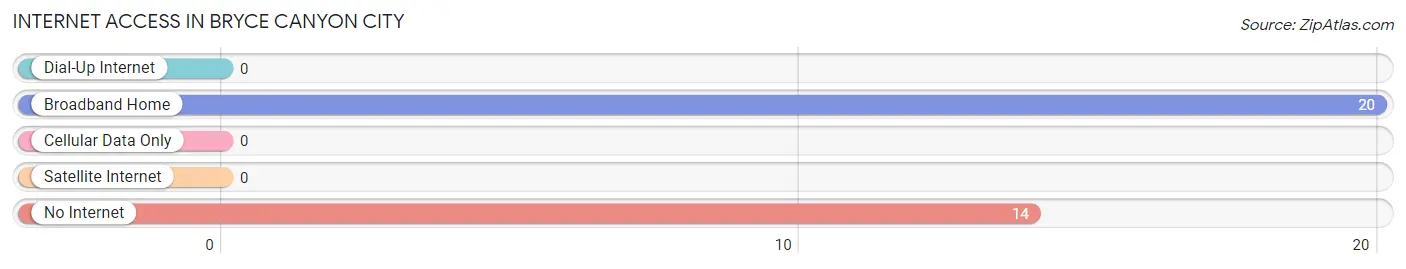
| Internet Type | # Households | % Households |
| Dial-Up Internet | 0 | 0.0% |
| Broadband Home | 20 | 58.8% |
| Cellular Data Only | 0 | 0.0% |
| Satellite Internet | 0 | 0.0% |
| No Internet | 14 | 41.2% |
| Total | 34 | 100.0% |
Bryce Canyon City Summary
Bryce Canyon City is a small city located in Garfield County, Utah, United States. It is situated in the southwestern part of the state, approximately 50 miles from the state capital of Salt Lake City. The city is located in the heart of the Bryce Canyon National Park, and is the gateway to the park. The city is home to a population of approximately 2,000 people, and is a popular tourist destination due to its proximity to the national park.
Geography
Bryce Canyon City is located in the southwestern part of Utah, in Garfield County. It is situated at an elevation of 6,620 feet, and is surrounded by the majestic beauty of the Bryce Canyon National Park. The city is located approximately 50 miles from the state capital of Salt Lake City, and is accessible by road via US Route 89. The city is located in a semi-arid climate, with hot summers and cold winters. The average annual precipitation is approximately 11 inches, and the average annual temperature is approximately 50 degrees Fahrenheit.
History
Bryce Canyon City was founded in 1875 by Ebenezer Bryce, a Mormon pioneer. The city was originally named Ruby City, but was later changed to Bryce Canyon City in honor of its founder. The city was initially established as a trading post for the local Paiute Indians, and was later used as a stopover for travelers heading to the nearby national park. The city was incorporated in 1924, and has since grown to become a popular tourist destination.
Economy
Bryce Canyon City’s economy is largely based on tourism, as it is the gateway to the nearby Bryce Canyon National Park. The city is home to a variety of hotels, restaurants, and other tourist-related businesses. The city also has a small manufacturing sector, which produces a variety of products, including furniture, clothing, and jewelry. The city is also home to a number of small businesses, including retail stores, restaurants, and other service-oriented businesses.
Demographics
As of the 2010 census, Bryce Canyon City had a population of 2,006 people. The racial makeup of the city was 95.3% White, 0.3% African American, 0.7% Native American, 0.3% Asian, 0.1% Pacific Islander, 1.2% from other races, and 2.3% from two or more races. The median household income was $37,917, and the median family income was $45,917. The per capita income was $20,917.
Conclusion
Bryce Canyon City is a small city located in Garfield County, Utah, United States. It is situated in the southwestern part of the state, approximately 50 miles from the state capital of Salt Lake City. The city is located in the heart of the Bryce Canyon National Park, and is the gateway to the park. The city is home to a population of approximately 2,000 people, and is a popular tourist destination due to its proximity to the national park. The city’s economy is largely based on tourism, and it is home to a variety of hotels, restaurants, and other tourist-related businesses. The city also has a small manufacturing sector, which produces a variety of products, including furniture, clothing, and jewelry. The racial makeup of the city is 95.3% White, 0.3% African American, 0.7% Native American, 0.3% Asian, 0.1% Pacific Islander, 1.2% from other races, and 2.3% from two or more races. The median household income was $37,917, and the median family income was $45,917. The per capita income was $20,917.
Common Questions
What is Per Capita Income in Bryce Canyon City?
Per Capita income in Bryce Canyon City is $20,862.
What is Inequality or Gini Index in Bryce Canyon City?
Inequality or Gini Index in Bryce Canyon City is 0.31.
What is the Total Population of Bryce Canyon City?
Total Population of Bryce Canyon City is 229.
What is the Total Male Population of Bryce Canyon City?
Total Male Population of Bryce Canyon City is 162.
What is the Total Female Population of Bryce Canyon City?
Total Female Population of Bryce Canyon City is 67.
What is the Ratio of Males per 100 Females in Bryce Canyon City?
There are 241.79 Males per 100 Females in Bryce Canyon City.
What is the Ratio of Females per 100 Males in Bryce Canyon City?
There are 41.36 Females per 100 Males in Bryce Canyon City.
What is the Median Population Age in Bryce Canyon City?
Median Population Age in Bryce Canyon City is 33.7 Years.
What is the Average Family Size in Bryce Canyon City
Average Family Size in Bryce Canyon City is 2.6 People.
What is the Average Household Size in Bryce Canyon City
Average Household Size in Bryce Canyon City is 2.6 People.
How Large is the Labor Force in Bryce Canyon City?
There are 187 People in the Labor Forcein in Bryce Canyon City.
What is the Percentage of People in the Labor Force in Bryce Canyon City?
85.4% of People are in the Labor Force in Bryce Canyon City.
What is the Unemployment Rate in Bryce Canyon City?
Unemployment Rate in Bryce Canyon City is 7.5%.