Halchita, UT Map & Demographics
Halchita Map
Halchita Overview
$14,388
PER CAPITA INCOME
0.53
INEQUALITY / GINI INDEX
256
TOTAL POPULATION
154
MALE POPULATION
102
FEMALE POPULATION
150.98
MALES / 100 FEMALES
66.23
FEMALES / 100 MALES
41.3
MEDIAN AGE
3.9
AVG FAMILY SIZE
2.7
AVG HOUSEHOLD SIZE
93
LABOR FORCE [ PEOPLE ]
53.1%
PERCENT IN LABOR FORCE
Income in Halchita
Income Overview in Halchita
| Characteristic | Number | Measure |
| Per Capita Income | 256 | $14,388 |
| Median Family Income | 51 | $0 |
| Mean Family Income | 51 | $46,388 |
| Median Household Income | 94 | $0 |
| Mean Household Income | 94 | $38,891 |
| Income Deficit | 51 | $0 |
| Wage / Income Gap (%) | 256 | 0.00% |
| Wage / Income Gap ($) | 256 | 100.00¢ per $1 |
| Gini / Inequality Index | 256 | 0.53 |
Earnings by Sex in Halchita
| Sex | Number | Average Earnings |
| Male | 59 (59.0%) | $0 |
| Female | 41 (41.0%) | $0 |
| Total | 100 (100.0%) | $0 |
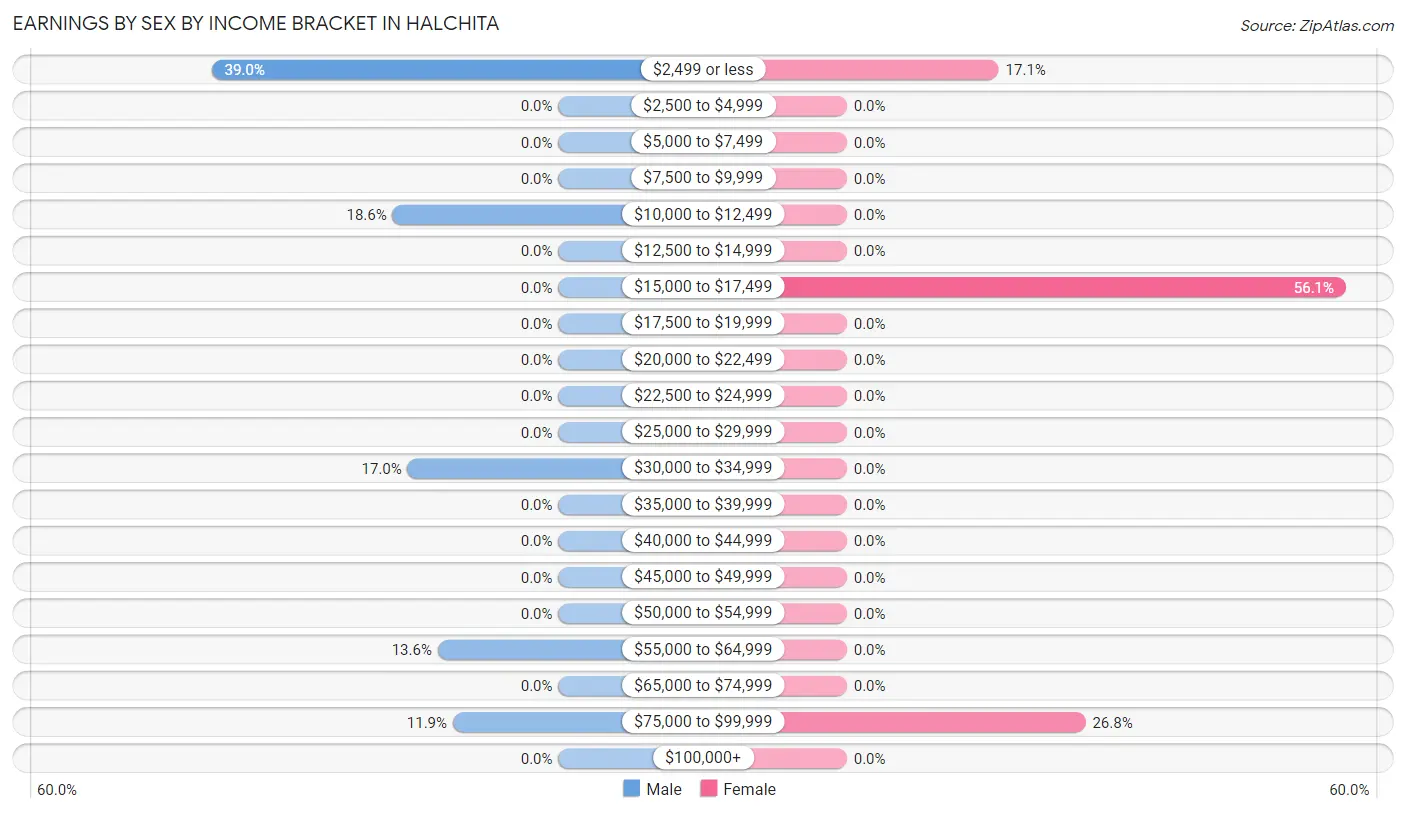
Earnings by Sex by Income Bracket in Halchita
The most common earnings brackets in Halchita are $2,499 or less for men (23 | 39.0%) and $15,000 to $17,499 for women (23 | 56.1%).
| Income | Male | Female |
| $2,499 or less | 23 (39.0%) | 7 (17.1%) |
| $2,500 to $4,999 | 0 (0.0%) | 0 (0.0%) |
| $5,000 to $7,499 | 0 (0.0%) | 0 (0.0%) |
| $7,500 to $9,999 | 0 (0.0%) | 0 (0.0%) |
| $10,000 to $12,499 | 11 (18.6%) | 0 (0.0%) |
| $12,500 to $14,999 | 0 (0.0%) | 0 (0.0%) |
| $15,000 to $17,499 | 0 (0.0%) | 23 (56.1%) |
| $17,500 to $19,999 | 0 (0.0%) | 0 (0.0%) |
| $20,000 to $22,499 | 0 (0.0%) | 0 (0.0%) |
| $22,500 to $24,999 | 0 (0.0%) | 0 (0.0%) |
| $25,000 to $29,999 | 0 (0.0%) | 0 (0.0%) |
| $30,000 to $34,999 | 10 (17.0%) | 0 (0.0%) |
| $35,000 to $39,999 | 0 (0.0%) | 0 (0.0%) |
| $40,000 to $44,999 | 0 (0.0%) | 0 (0.0%) |
| $45,000 to $49,999 | 0 (0.0%) | 0 (0.0%) |
| $50,000 to $54,999 | 0 (0.0%) | 0 (0.0%) |
| $55,000 to $64,999 | 8 (13.6%) | 0 (0.0%) |
| $65,000 to $74,999 | 0 (0.0%) | 0 (0.0%) |
| $75,000 to $99,999 | 7 (11.9%) | 11 (26.8%) |
| $100,000+ | 0 (0.0%) | 0 (0.0%) |
| Total | 59 (100.0%) | 41 (100.0%) |
Earnings by Sex by Educational Attainment in Halchita
| Educational Attainment | Male Income | Female Income |
| Less than High School | - | - |
| High School Diploma | - | - |
| College or Associate's Degree | - | - |
| Bachelor's Degree | - | - |
| Graduate Degree | - | - |
| Total | - | - |
Family Income in Halchita
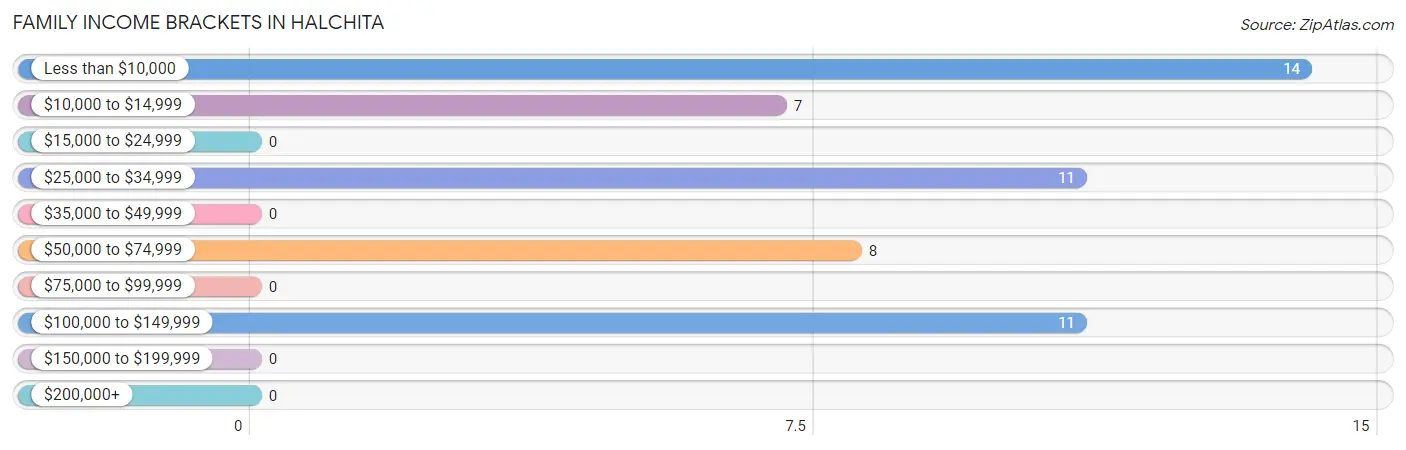
Family Income Brackets in Halchita
According to the Halchita family income data, there are 14 families falling into the less than $10,000 income range, which is the most common income bracket and makes up 27.5% of all families.
| Income Bracket | # Families | % Families |
| Less than $10,000 | 14 | 27.5% |
| $10,000 to $14,999 | 7 | 13.7% |
| $15,000 to $24,999 | 0 | 0.0% |
| $25,000 to $34,999 | 11 | 21.6% |
| $35,000 to $49,999 | 0 | 0.0% |
| $50,000 to $74,999 | 8 | 15.7% |
| $75,000 to $99,999 | 0 | 0.0% |
| $100,000 to $149,999 | 11 | 21.6% |
| $150,000 to $199,999 | 0 | 0.0% |
| $200,000+ | 0 | 0.0% |
Family Income by Famaliy Size in Halchita
| Income Bracket | # Families | Median Income |
| 2-Person Families | 24 (47.1%) | $0 |
| 3-Person Families | 8 (15.7%) | $0 |
| 4-Person Families | 8 (15.7%) | $0 |
| 5-Person Families | 11 (21.6%) | $0 |
| 6-Person Families | 0 (0.0%) | $0 |
| 7+ Person Families | 0 (0.0%) | $0 |
| Total | 51 (100.0%) | $0 |
Family Income by Number of Earners in Halchita
| Number of Earners | # Families | Median Income |
| No Earners | 19 (37.2%) | $0 |
| 1 Earner | 14 (27.5%) | $0 |
| 2 Earners | 18 (35.3%) | $0 |
| 3+ Earners | 0 (0.0%) | $0 |
| Total | 51 (100.0%) | $0 |
Household Income in Halchita
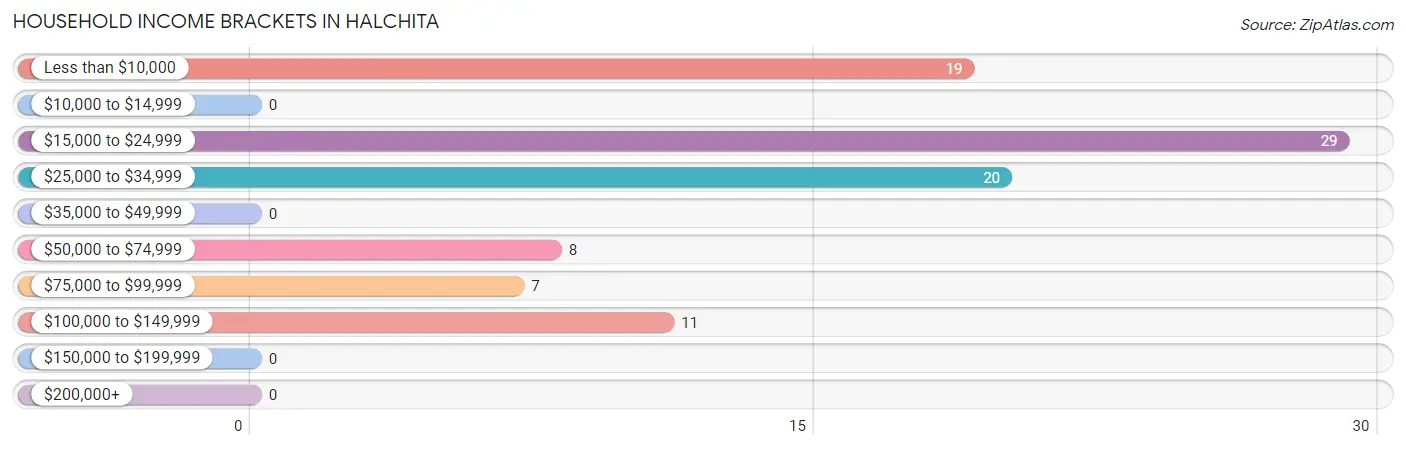
Household Income Brackets in Halchita
With 29 households falling in the category, the $15,000 to $24,999 income range is the most frequent in Halchita, accounting for 30.8% of all households.
| Income Bracket | # Households | % Households |
| Less than $10,000 | 19 | 20.2% |
| $10,000 to $14,999 | 0 | 0.0% |
| $15,000 to $24,999 | 29 | 30.9% |
| $25,000 to $34,999 | 20 | 21.3% |
| $35,000 to $49,999 | 0 | 0.0% |
| $50,000 to $74,999 | 8 | 8.5% |
| $75,000 to $99,999 | 7 | 7.4% |
| $100,000 to $149,999 | 11 | 11.7% |
| $150,000 to $199,999 | 0 | 0.0% |
| $200,000+ | 0 | 0.0% |
Household Income by Householder Age in Halchita
The median household income in Halchita is $0, with the highest median household income of $29,444 found in the 65+ years age bracket for the primary householder. A total of 26 households (27.7%) fall into this category.
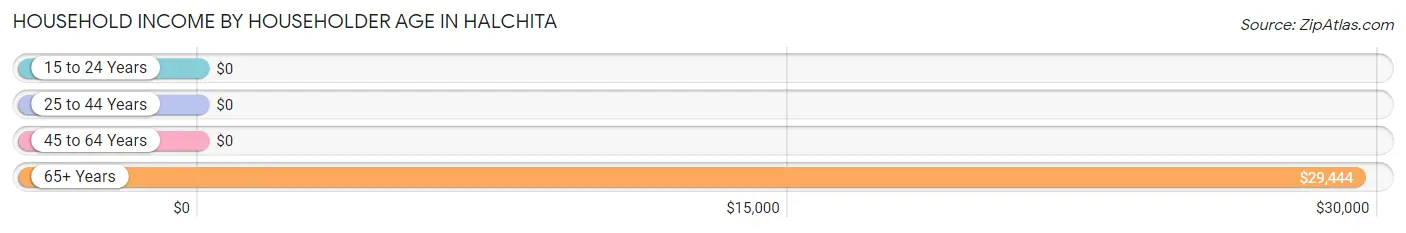
| Income Bracket | # Households | Median Income |
| 15 to 24 Years | 0 (0.0%) | $0 |
| 25 to 44 Years | 53 (56.4%) | $0 |
| 45 to 64 Years | 15 (16.0%) | $0 |
| 65+ Years | 26 (27.7%) | $29,444 |
| Total | 94 (100.0%) | $0 |
Poverty in Halchita
Income Below Poverty by Sex and Age in Halchita
With 45.5% poverty level for males and 36.3% for females among the residents of Halchita, 6 to 11 year old males and 6 to 11 year old females are the most vulnerable to poverty, with 10 males (100.0%) and 14 females (100.0%) in their respective age groups living below the poverty level.
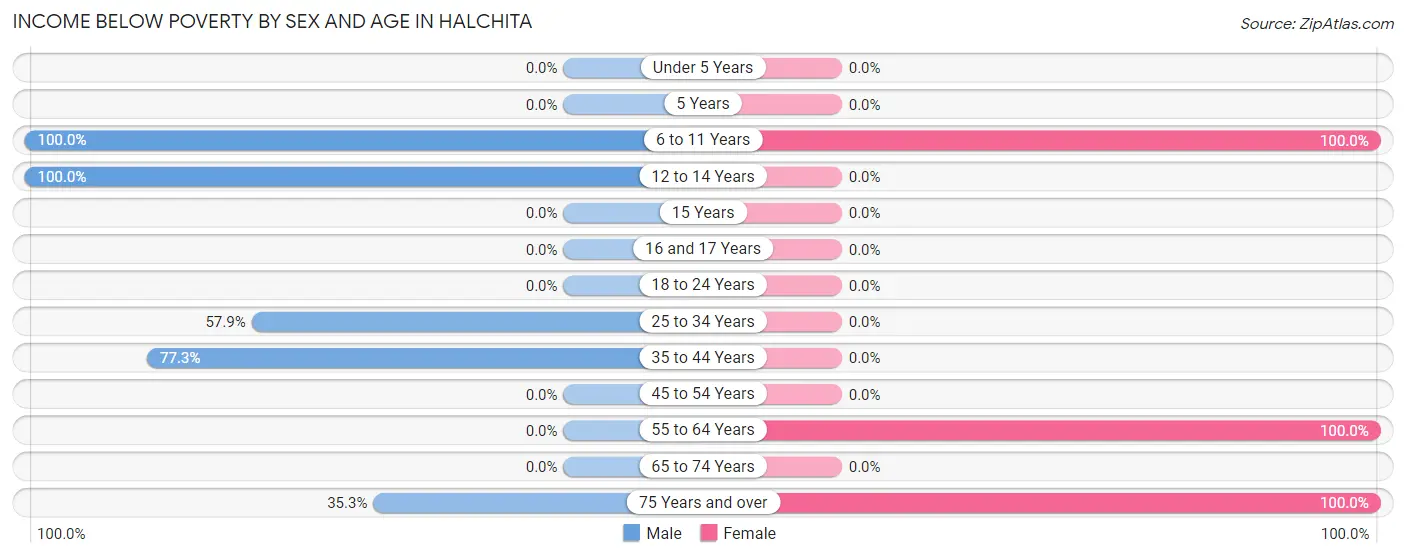
| Age Bracket | Male | Female |
| Under 5 Years | 0 (0.0%) | 0 (0.0%) |
| 5 Years | 0 (0.0%) | 0 (0.0%) |
| 6 to 11 Years | 10 (100.0%) | 14 (100.0%) |
| 12 to 14 Years | 9 (100.0%) | 0 (0.0%) |
| 15 Years | 0 (0.0%) | 0 (0.0%) |
| 16 and 17 Years | 0 (0.0%) | 0 (0.0%) |
| 18 to 24 Years | 0 (0.0%) | 0 (0.0%) |
| 25 to 34 Years | 11 (57.9%) | 0 (0.0%) |
| 35 to 44 Years | 34 (77.3%) | 0 (0.0%) |
| 45 to 54 Years | 0 (0.0%) | 0 (0.0%) |
| 55 to 64 Years | 0 (0.0%) | 15 (100.0%) |
| 65 to 74 Years | 0 (0.0%) | 0 (0.0%) |
| 75 Years and over | 6 (35.3%) | 8 (100.0%) |
| Total | 70 (45.5%) | 37 (36.3%) |
Income Above Poverty by Sex and Age in Halchita
According to the poverty statistics in Halchita, males aged under 5 years and females aged 35 to 44 years are the age groups that are most secure financially, with 100.0% of males and 100.0% of females in these age groups living above the poverty line.
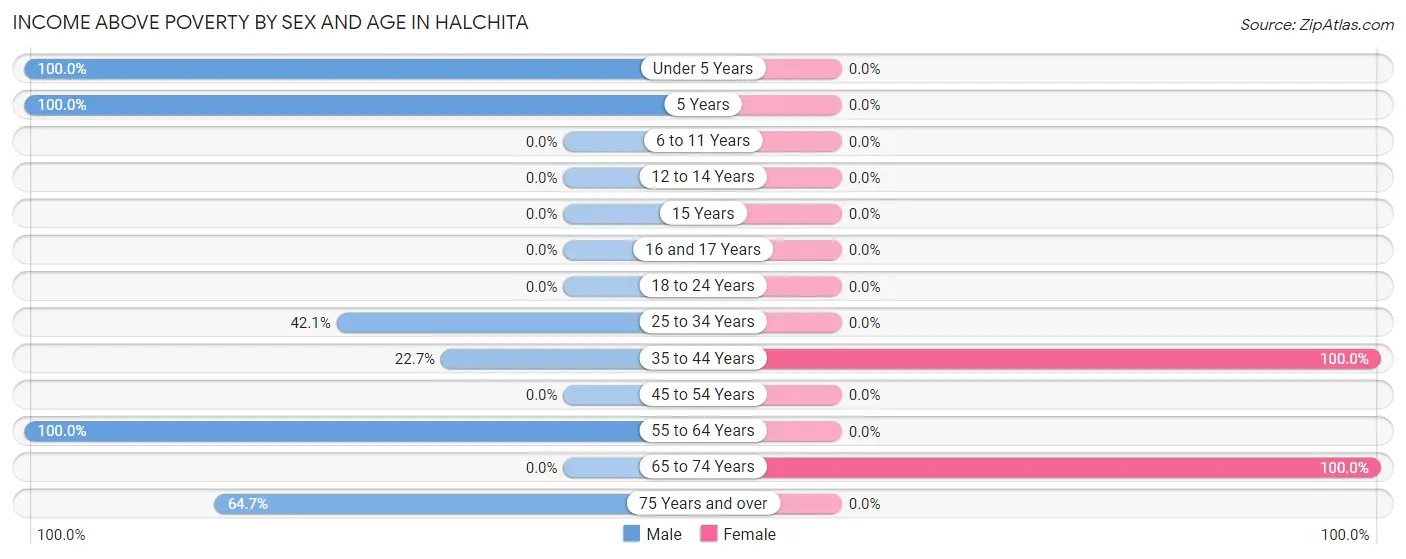
| Age Bracket | Male | Female |
| Under 5 Years | 29 (100.0%) | 0 (0.0%) |
| 5 Years | 19 (100.0%) | 0 (0.0%) |
| 6 to 11 Years | 0 (0.0%) | 0 (0.0%) |
| 12 to 14 Years | 0 (0.0%) | 0 (0.0%) |
| 15 Years | 0 (0.0%) | 0 (0.0%) |
| 16 and 17 Years | 0 (0.0%) | 0 (0.0%) |
| 18 to 24 Years | 0 (0.0%) | 0 (0.0%) |
| 25 to 34 Years | 8 (42.1%) | 0 (0.0%) |
| 35 to 44 Years | 10 (22.7%) | 34 (100.0%) |
| 45 to 54 Years | 0 (0.0%) | 0 (0.0%) |
| 55 to 64 Years | 7 (100.0%) | 0 (0.0%) |
| 65 to 74 Years | 0 (0.0%) | 31 (100.0%) |
| 75 Years and over | 11 (64.7%) | 0 (0.0%) |
| Total | 84 (54.5%) | 65 (63.7%) |
Income Below Poverty Among Married-Couple Families in Halchita
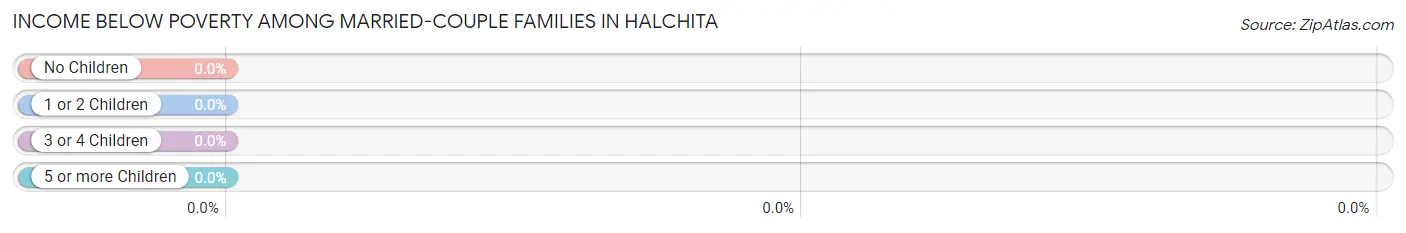
| Children | Above Poverty | Below Poverty |
| No Children | 0 (0.0%) | 0 (0.0%) |
| 1 or 2 Children | 0 (0.0%) | 0 (0.0%) |
| 3 or 4 Children | 11 (100.0%) | 0 (0.0%) |
| 5 or more Children | 0 (0.0%) | 0 (0.0%) |
| Total | 11 (100.0%) | 0 (0.0%) |
Income Below Poverty Among Single-Parent Households in Halchita
According to the poverty data in Halchita, 24.0% or 6 single-father households and 100.0% or 15 single-mother households are living below the poverty line. Among single-father households, those with no children have the highest poverty rate, with 6 households (35.3%) experiencing poverty. Likewise, among single-mother households, those with no children have the highest poverty rate, with 7 households (100.0%) falling below the poverty line.
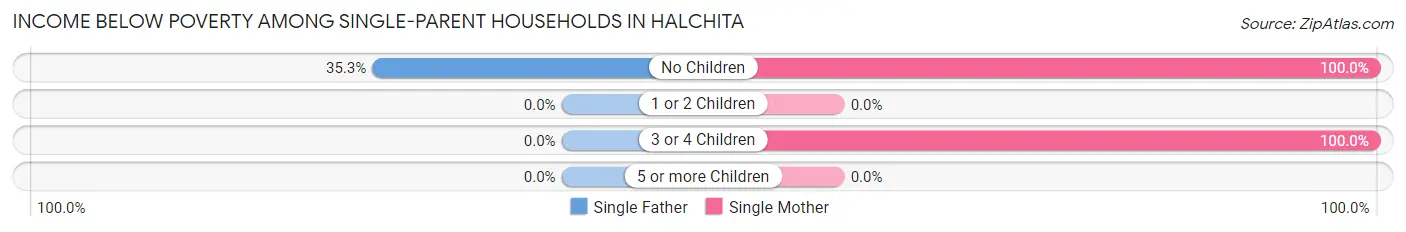
| Children | Single Father | Single Mother |
| No Children | 6 (35.3%) | 7 (100.0%) |
| 1 or 2 Children | 0 (0.0%) | 0 (0.0%) |
| 3 or 4 Children | 0 (0.0%) | 8 (100.0%) |
| 5 or more Children | 0 (0.0%) | 0 (0.0%) |
| Total | 6 (24.0%) | 15 (100.0%) |
Income Below Poverty Among Married-Couple vs Single-Parent Households in Halchita
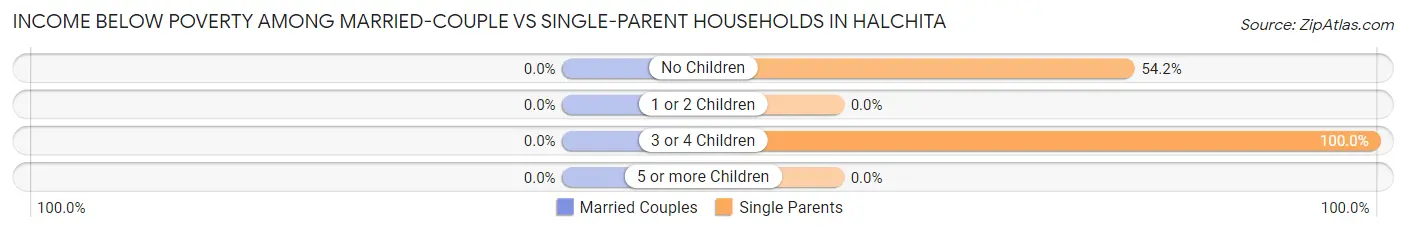
| Children | Married-Couple Families | Single-Parent Households |
| No Children | 0 (0.0%) | 13 (54.2%) |
| 1 or 2 Children | 0 (0.0%) | 0 (0.0%) |
| 3 or 4 Children | 0 (0.0%) | 8 (100.0%) |
| 5 or more Children | 0 (0.0%) | 0 (0.0%) |
| Total | 0 (0.0%) | 21 (52.5%) |
Race in Halchita
The most populous races in Halchita are , and Native / Alaskan (256 | 100.0%).
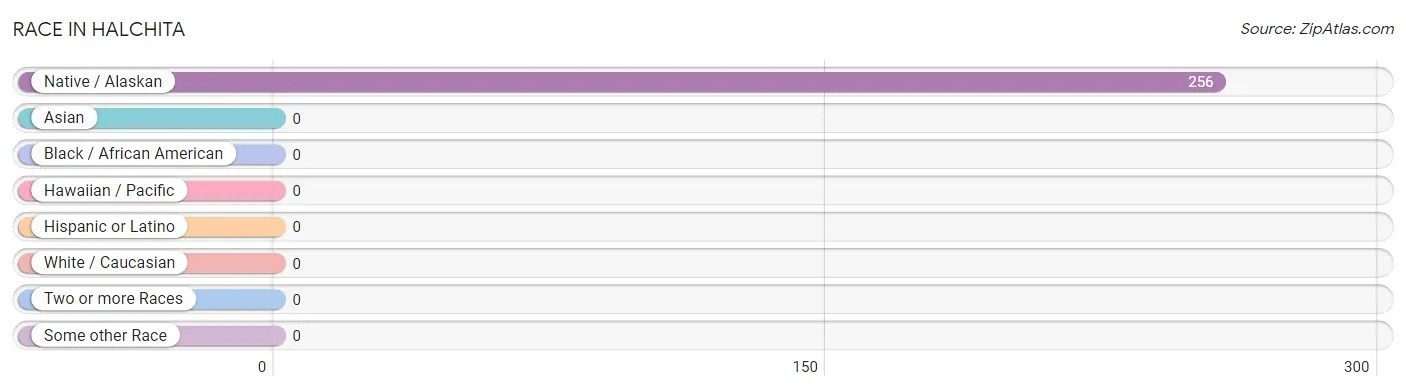
| Race | # Population | % Population |
| Asian | 0 | 0.0% |
| Black / African American | 0 | 0.0% |
| Hawaiian / Pacific | 0 | 0.0% |
| Hispanic or Latino | 0 | 0.0% |
| Native / Alaskan | 256 | 100.0% |
| White / Caucasian | 0 | 0.0% |
| Two or more Races | 0 | 0.0% |
| Some other Race | 0 | 0.0% |
| Total | 256 | 100.0% |
Ancestry in Halchita
The most populous ancestries reported in Halchita are , and Navajo (256 | 100.0%), together accounting for 100.0% of all Halchita residents.

| Ancestry | # Population | % Population |
| Navajo | 256 | 100.0% | View All 1 Rows |
Immigrants in Halchita

| Immigration Origin | # Population | % Population | View All 0 Rows |
Sex and Age in Halchita
Sex and Age in Halchita
The most populous age groups in Halchita are 40 to 44 Years (34 | 22.1%) for men and 40 to 44 Years (23 | 22.6%) for women.
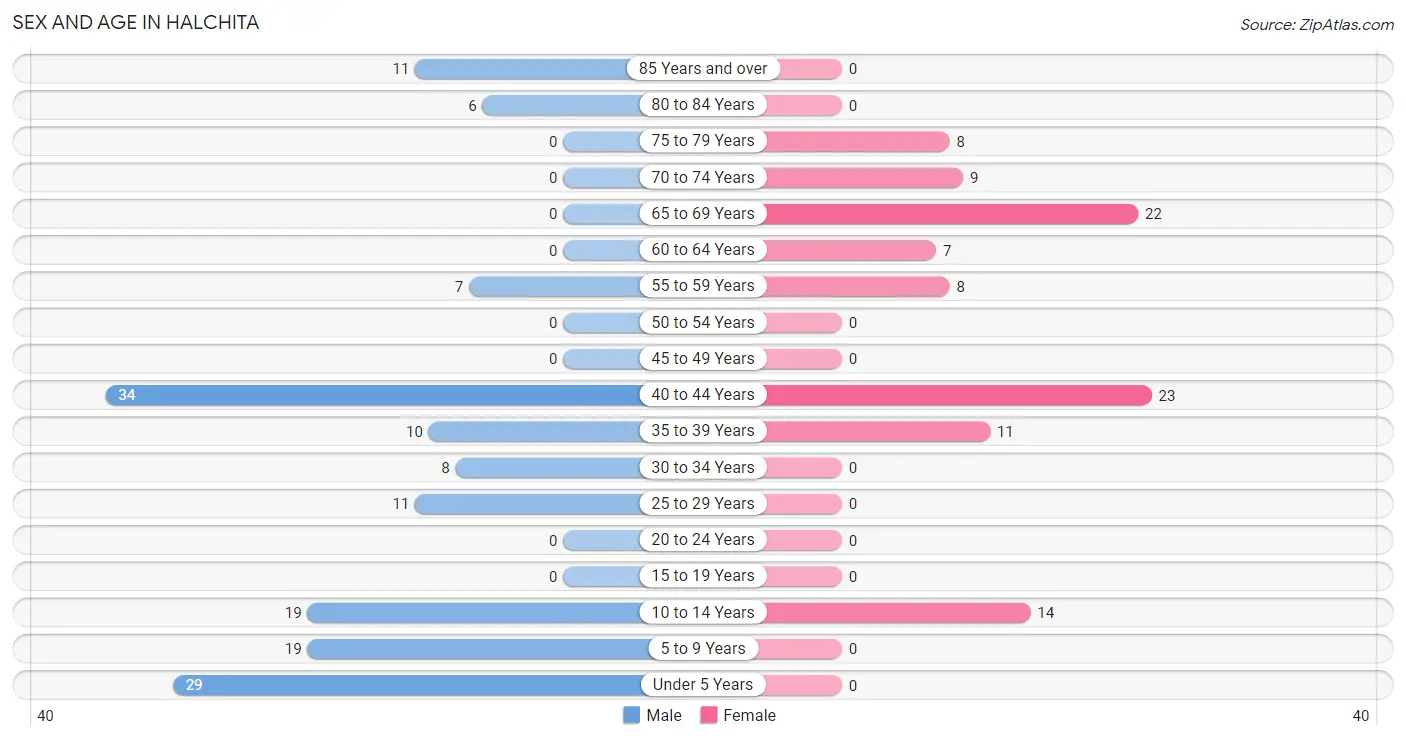
| Age Bracket | Male | Female |
| Under 5 Years | 29 (18.8%) | 0 (0.0%) |
| 5 to 9 Years | 19 (12.3%) | 0 (0.0%) |
| 10 to 14 Years | 19 (12.3%) | 14 (13.7%) |
| 15 to 19 Years | 0 (0.0%) | 0 (0.0%) |
| 20 to 24 Years | 0 (0.0%) | 0 (0.0%) |
| 25 to 29 Years | 11 (7.1%) | 0 (0.0%) |
| 30 to 34 Years | 8 (5.2%) | 0 (0.0%) |
| 35 to 39 Years | 10 (6.5%) | 11 (10.8%) |
| 40 to 44 Years | 34 (22.1%) | 23 (22.6%) |
| 45 to 49 Years | 0 (0.0%) | 0 (0.0%) |
| 50 to 54 Years | 0 (0.0%) | 0 (0.0%) |
| 55 to 59 Years | 7 (4.5%) | 8 (7.8%) |
| 60 to 64 Years | 0 (0.0%) | 7 (6.9%) |
| 65 to 69 Years | 0 (0.0%) | 22 (21.6%) |
| 70 to 74 Years | 0 (0.0%) | 9 (8.8%) |
| 75 to 79 Years | 0 (0.0%) | 8 (7.8%) |
| 80 to 84 Years | 6 (3.9%) | 0 (0.0%) |
| 85 Years and over | 11 (7.1%) | 0 (0.0%) |
| Total | 154 (100.0%) | 102 (100.0%) |
Families and Households in Halchita
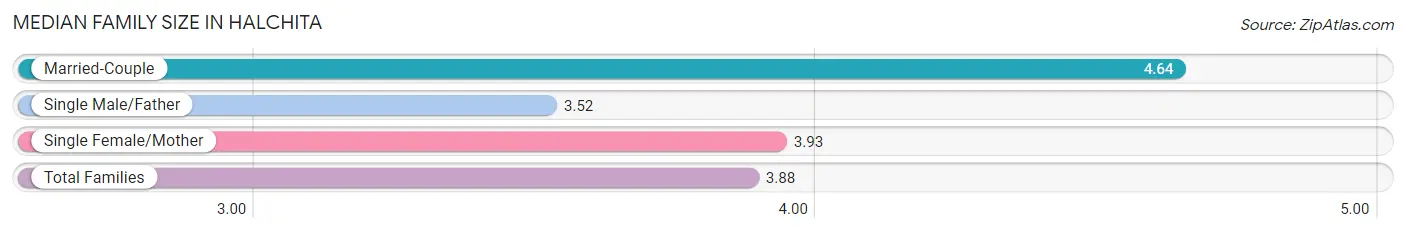
Median Family Size in Halchita
The median family size in Halchita is 3.88 persons per family, with married-couple families (11 | 21.6%) accounting for the largest median family size of 4.64 persons per family. On the other hand, single male/father families (25 | 49.0%) represent the smallest median family size with 3.52 persons per family.
| Family Type | # Families | Family Size |
| Married-Couple | 11 (21.6%) | 4.64 |
| Single Male/Father | 25 (49.0%) | 3.52 |
| Single Female/Mother | 15 (29.4%) | 3.93 |
| Total Families | 51 (100.0%) | 3.88 |
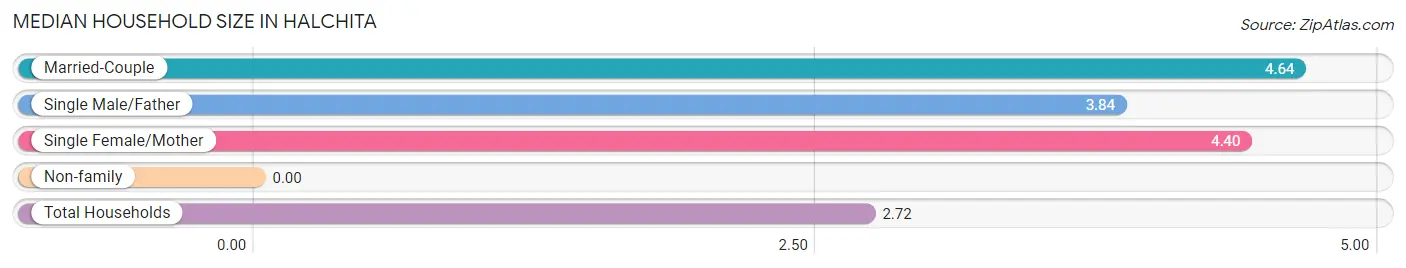
Median Household Size in Halchita
| Household Type | # Households | Household Size |
| Married-Couple | 11 (11.7%) | 4.64 |
| Single Male/Father | 25 (26.6%) | 3.84 |
| Single Female/Mother | 15 (16.0%) | 4.40 |
| Non-family | 43 (45.7%) | - |
| Total Households | 94 (100.0%) | 2.72 |
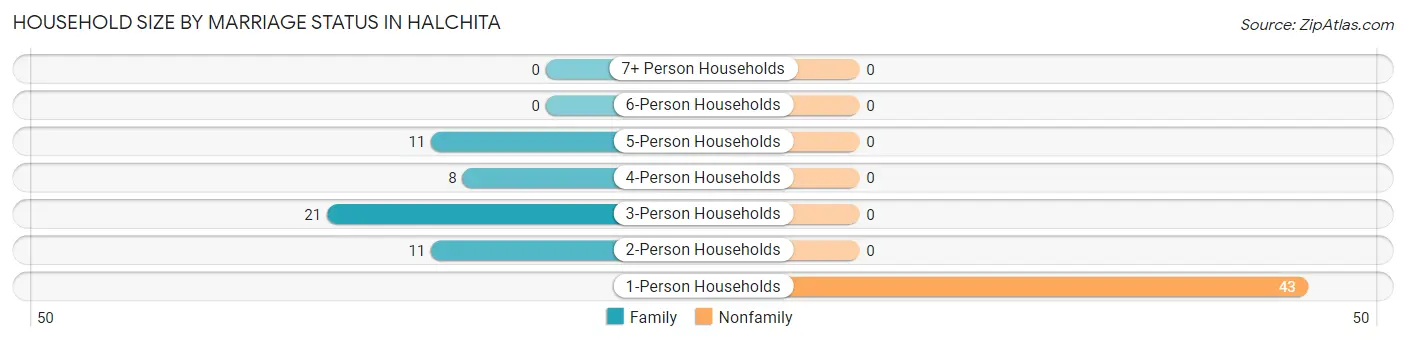
Household Size by Marriage Status in Halchita
Out of a total of 94 households in Halchita, 51 (54.3%) are family households, while 43 (45.7%) are nonfamily households. The most numerous type of family households are 3-person households, comprising 21, and the most common type of nonfamily households are 1-person households, comprising 43.
| Household Size | Family Households | Nonfamily Households |
| 1-Person Households | - | 43 (45.7%) |
| 2-Person Households | 11 (11.7%) | 0 (0.0%) |
| 3-Person Households | 21 (22.3%) | 0 (0.0%) |
| 4-Person Households | 8 (8.5%) | 0 (0.0%) |
| 5-Person Households | 11 (11.7%) | 0 (0.0%) |
| 6-Person Households | 0 (0.0%) | 0 (0.0%) |
| 7+ Person Households | 0 (0.0%) | 0 (0.0%) |
| Total | 51 (54.3%) | 43 (45.7%) |
Female Fertility in Halchita
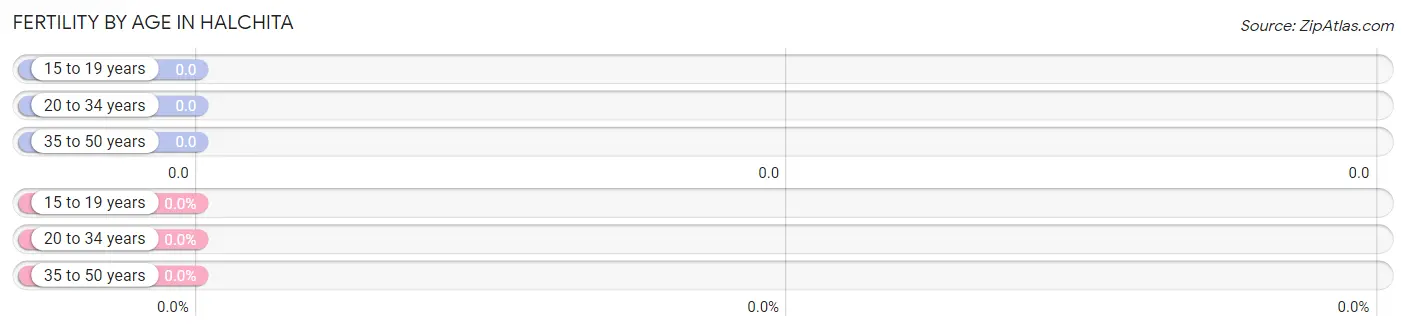
Fertility by Age in Halchita
| Age Bracket | Women with Births | Births / 1,000 Women |
| 15 to 19 years | 0 (0.0%) | 0.0 |
| 20 to 34 years | 0 (0.0%) | 0.0 |
| 35 to 50 years | 0 (0.0%) | 0.0 |
| Total | 0 (0.0%) | 0.0 |
Fertility by Age by Marriage Status in Halchita
| Age Bracket | Married | Unmarried |
| 15 to 19 years | 0 (0.0%) | 0 (0.0%) |
| 20 to 34 years | 0 (0.0%) | 0 (0.0%) |
| 35 to 50 years | 0 (0.0%) | 0 (0.0%) |
| Total | 0 (0.0%) | 0 (0.0%) |
Fertility by Education in Halchita
| Educational Attainment | Women with Births | Births / 1,000 Women |
| Less than High School | 0 (0.0%) | 0.0 |
| High School Diploma | 0 (0.0%) | 0.0 |
| College or Associate's Degree | 0 (0.0%) | 0.0 |
| Bachelor's Degree | 0 (0.0%) | 0.0 |
| Graduate Degree | 0 (0.0%) | 0.0 |
| Total | 0 (0.0%) | 0.0 |
Fertility by Education by Marriage Status in Halchita
| Educational Attainment | Married | Unmarried |
| Less than High School | 0 (0.0%) | 0 (0.0%) |
| High School Diploma | 0 (0.0%) | 0 (0.0%) |
| College or Associate's Degree | 0 (0.0%) | 0 (0.0%) |
| Bachelor's Degree | 0 (0.0%) | 0 (0.0%) |
| Graduate Degree | 0 (0.0%) | 0 (0.0%) |
| Total | 0 (0.0%) | 0 (0.0%) |
Employment Characteristics in Halchita
Employment by Class of Employer in Halchita
Among the 74 employed individuals in Halchita, private company employees (64 | 86.5%), and not-for-profit organizations (10 | 13.5%) make up the most common classes of employment.
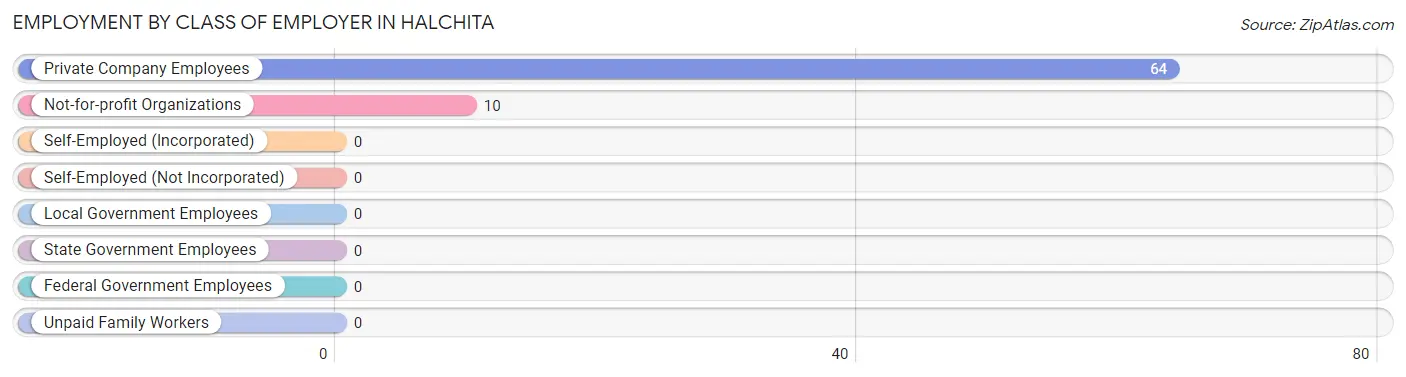
| Employer Class | # Employees | % Employees |
| Private Company Employees | 64 | 86.5% |
| Self-Employed (Incorporated) | 0 | 0.0% |
| Self-Employed (Not Incorporated) | 0 | 0.0% |
| Not-for-profit Organizations | 10 | 13.5% |
| Local Government Employees | 0 | 0.0% |
| State Government Employees | 0 | 0.0% |
| Federal Government Employees | 0 | 0.0% |
| Unpaid Family Workers | 0 | 0.0% |
| Total | 74 | 100.0% |
Employment Status by Age in Halchita
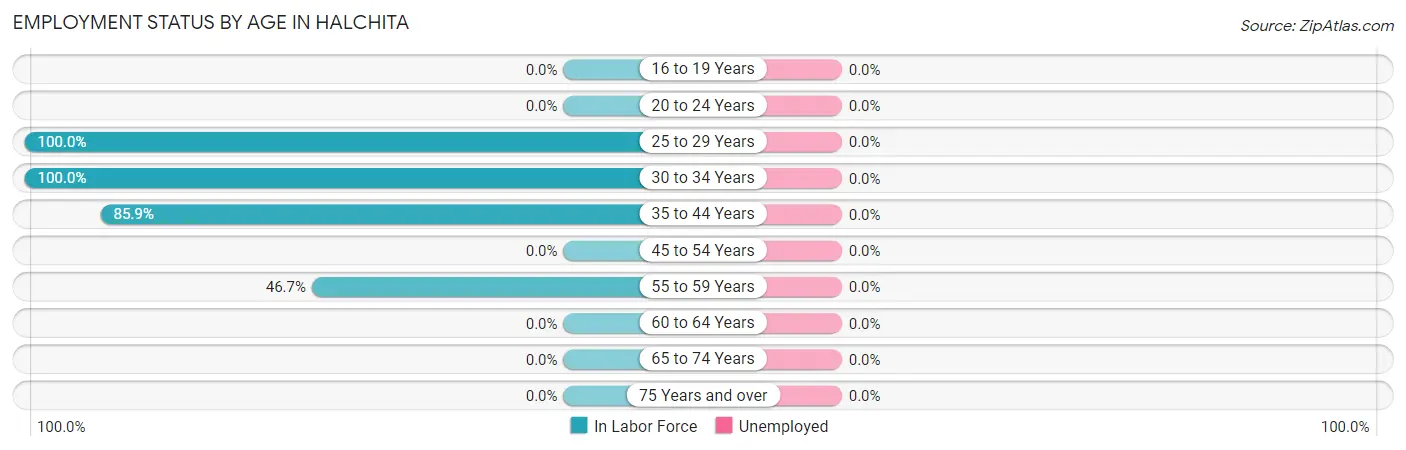
| Age Bracket | In Labor Force | Unemployed |
| 16 to 19 Years | 0 (0.0%) | 0 (0.0%) |
| 20 to 24 Years | 0 (0.0%) | 0 (0.0%) |
| 25 to 29 Years | 11 (100.0%) | 0 (0.0%) |
| 30 to 34 Years | 8 (100.0%) | 0 (0.0%) |
| 35 to 44 Years | 67 (85.9%) | 0 (0.0%) |
| 45 to 54 Years | 0 (0.0%) | 0 (0.0%) |
| 55 to 59 Years | 7 (46.7%) | 0 (0.0%) |
| 60 to 64 Years | 0 (0.0%) | 0 (0.0%) |
| 65 to 74 Years | 0 (0.0%) | 0 (0.0%) |
| 75 Years and over | 0 (0.0%) | 0 (0.0%) |
| Total | 93 (53.1%) | 0 (0.0%) |
Employment Status by Educational Attainment in Halchita
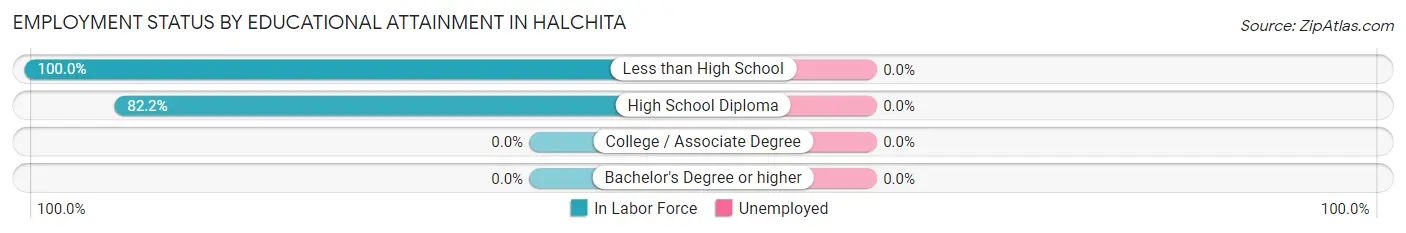
| Educational Attainment | In Labor Force | Unemployed |
| Less than High School | 10 (100.0%) | 0 (0.0%) |
| High School Diploma | 83 (82.2%) | 0 (0.0%) |
| College / Associate Degree | 0 (0.0%) | 0 (0.0%) |
| Bachelor's Degree or higher | 0 (0.0%) | 0 (0.0%) |
| Total | 93 (78.2%) | 0 (0.0%) |
Employment Occupations by Sex in Halchita
Management, Business, Science and Arts Occupations
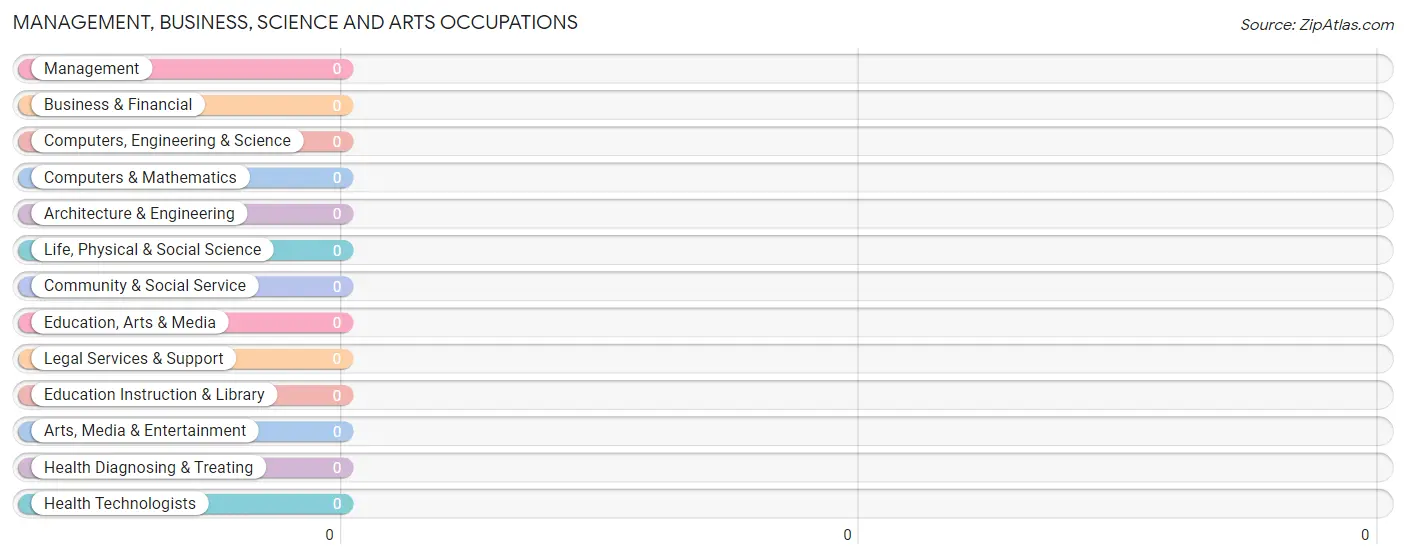
Management, Business, Science and Arts Occupations by Sex
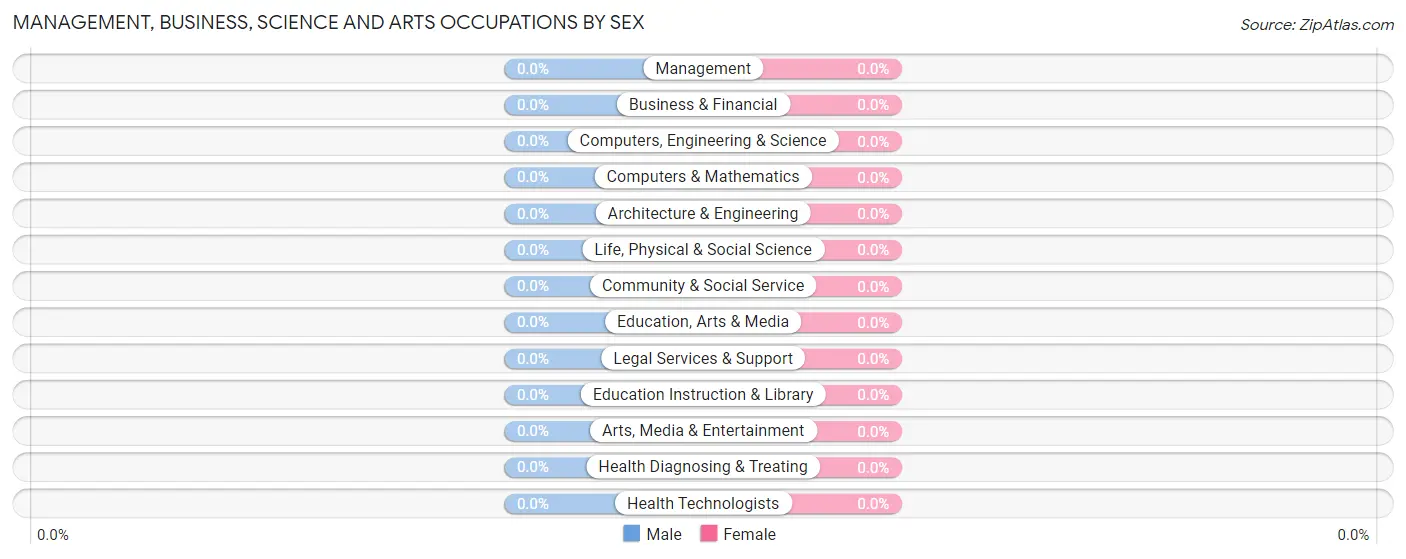
| Occupation | Male | Female |
| Management | 0 (0.0%) | 0 (0.0%) |
| Business & Financial | 0 (0.0%) | 0 (0.0%) |
| Computers, Engineering & Science | 0 (0.0%) | 0 (0.0%) |
| Computers & Mathematics | 0 (0.0%) | 0 (0.0%) |
| Architecture & Engineering | 0 (0.0%) | 0 (0.0%) |
| Life, Physical & Social Science | 0 (0.0%) | 0 (0.0%) |
| Community & Social Service | 0 (0.0%) | 0 (0.0%) |
| Education, Arts & Media | 0 (0.0%) | 0 (0.0%) |
| Legal Services & Support | 0 (0.0%) | 0 (0.0%) |
| Education Instruction & Library | 0 (0.0%) | 0 (0.0%) |
| Arts, Media & Entertainment | 0 (0.0%) | 0 (0.0%) |
| Health Diagnosing & Treating | 0 (0.0%) | 0 (0.0%) |
| Health Technologists | 0 (0.0%) | 0 (0.0%) |
| Total (Category) | 0 (0.0%) | 0 (0.0%) |
| Total (Overall) | 59 (63.4%) | 34 (36.6%) |
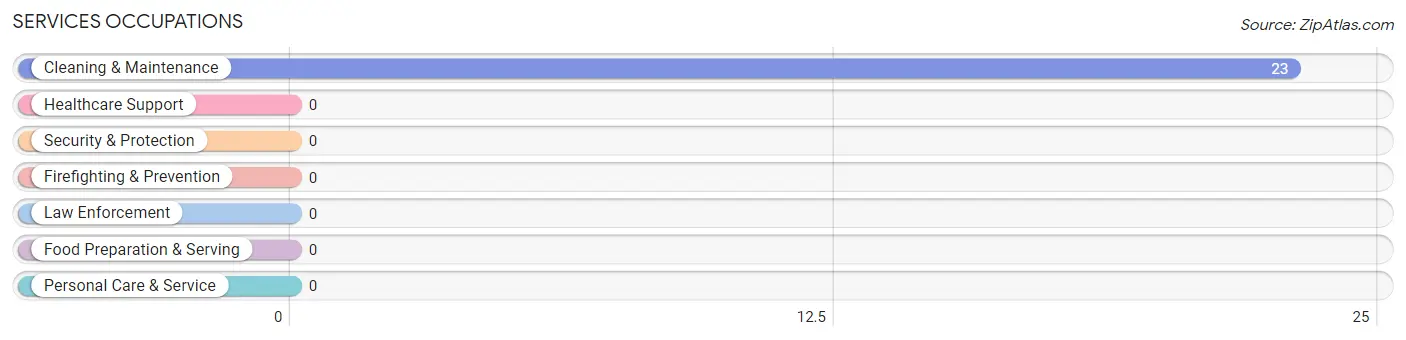
Services Occupations
The most common Services occupations in Halchita are , and Cleaning & Maintenance (23 | 24.7%).
Services Occupations by Sex
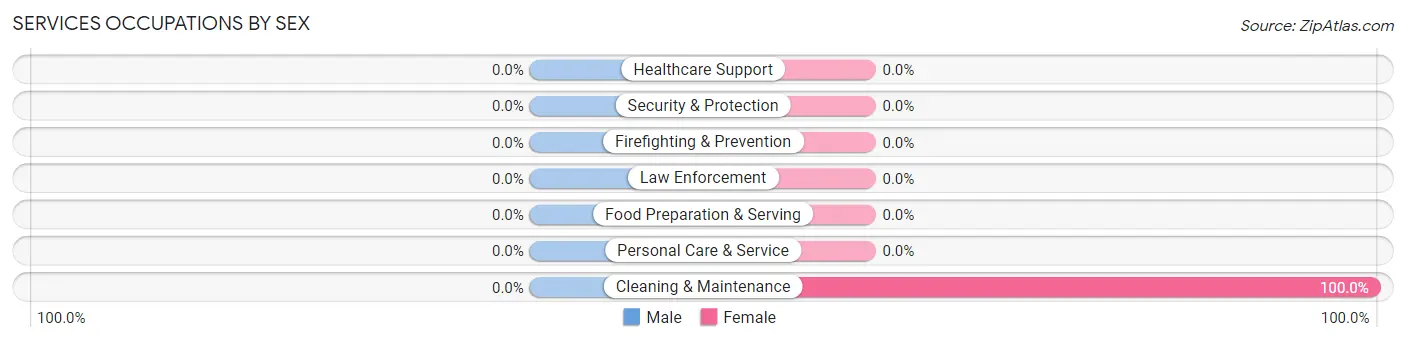
| Occupation | Male | Female |
| Healthcare Support | 0 (0.0%) | 0 (0.0%) |
| Security & Protection | 0 (0.0%) | 0 (0.0%) |
| Firefighting & Prevention | 0 (0.0%) | 0 (0.0%) |
| Law Enforcement | 0 (0.0%) | 0 (0.0%) |
| Food Preparation & Serving | 0 (0.0%) | 0 (0.0%) |
| Cleaning & Maintenance | 0 (0.0%) | 23 (100.0%) |
| Personal Care & Service | 0 (0.0%) | 0 (0.0%) |
| Total (Category) | 0 (0.0%) | 23 (100.0%) |
| Total (Overall) | 59 (63.4%) | 34 (36.6%) |
Sales and Office Occupations
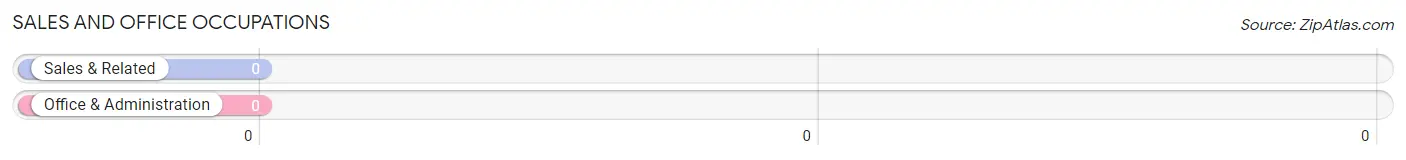
Sales and Office Occupations by Sex
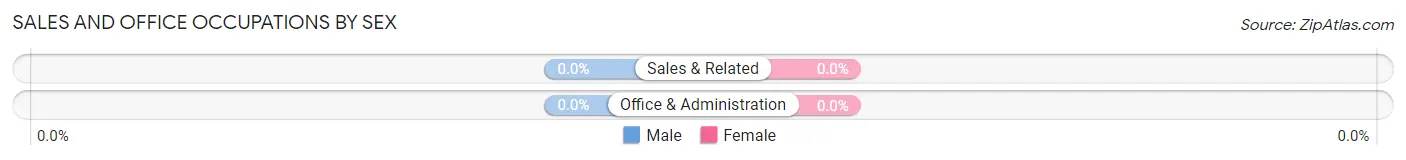
| Occupation | Male | Female |
| Sales & Related | 0 (0.0%) | 0 (0.0%) |
| Office & Administration | 0 (0.0%) | 0 (0.0%) |
| Total (Category) | 0 (0.0%) | 0 (0.0%) |
| Total (Overall) | 59 (63.4%) | 34 (36.6%) |
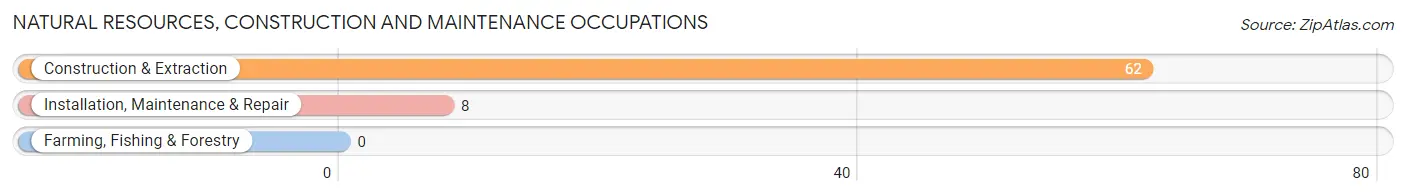
Natural Resources, Construction and Maintenance Occupations
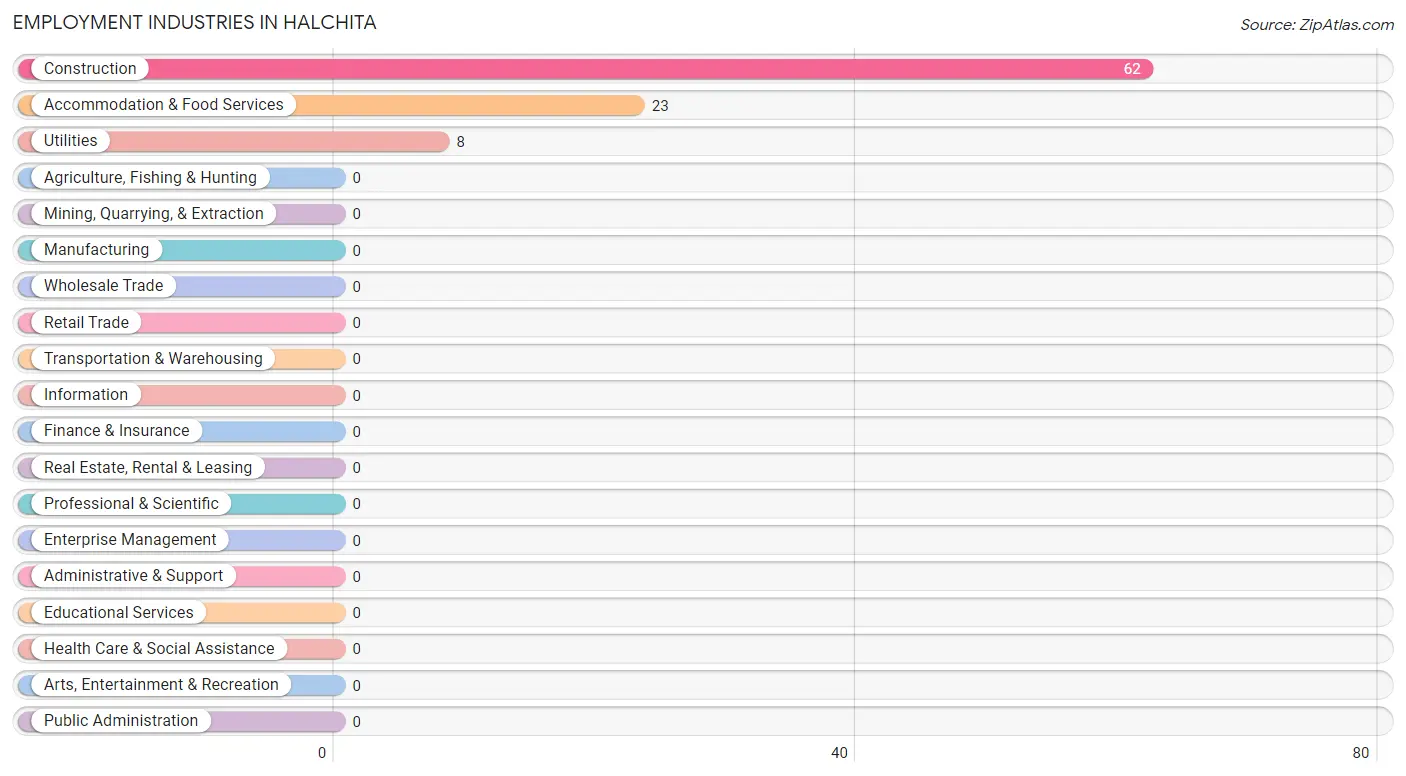
The most common Natural Resources, Construction and Maintenance occupations in Halchita are Construction & Extraction (62 | 66.7%), and Installation, Maintenance & Repair (8 | 8.6%).
Natural Resources, Construction and Maintenance Occupations by Sex
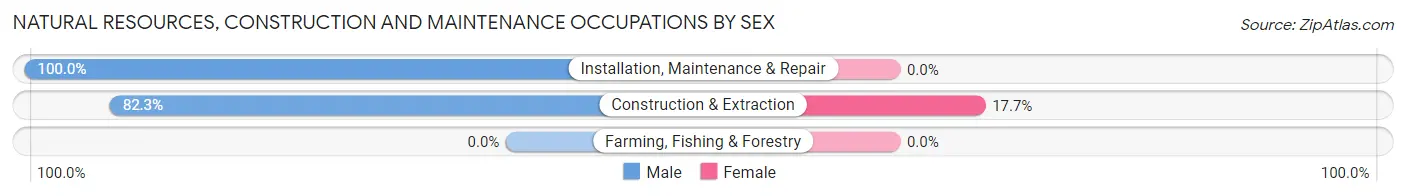
| Occupation | Male | Female |
| Farming, Fishing & Forestry | 0 (0.0%) | 0 (0.0%) |
| Construction & Extraction | 51 (82.3%) | 11 (17.7%) |
| Installation, Maintenance & Repair | 8 (100.0%) | 0 (0.0%) |
| Total (Category) | 59 (84.3%) | 11 (15.7%) |
| Total (Overall) | 59 (63.4%) | 34 (36.6%) |
Production, Transportation and Moving Occupations
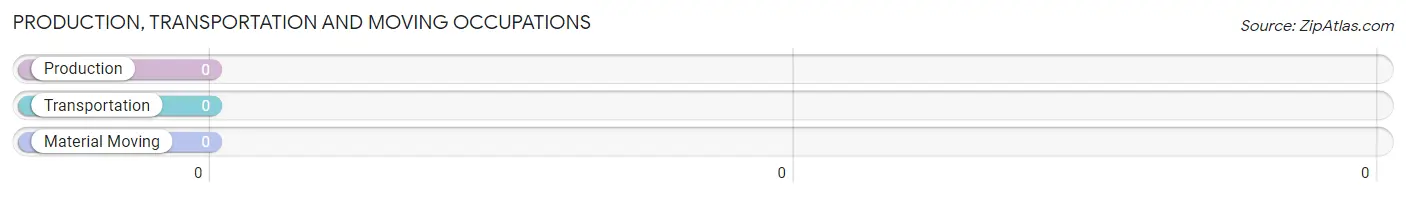
Production, Transportation and Moving Occupations by Sex
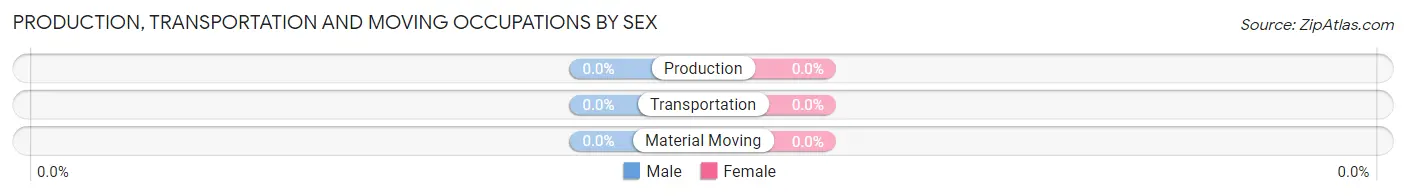
| Occupation | Male | Female |
| Production | 0 (0.0%) | 0 (0.0%) |
| Transportation | 0 (0.0%) | 0 (0.0%) |
| Material Moving | 0 (0.0%) | 0 (0.0%) |
| Total (Category) | 0 (0.0%) | 0 (0.0%) |
| Total (Overall) | 59 (63.4%) | 34 (36.6%) |
Employment Industries by Sex in Halchita
Employment Industries in Halchita
The major employment industries in Halchita include Construction (62 | 66.7%), Accommodation & Food Services (23 | 24.7%), and Utilities (8 | 8.6%).
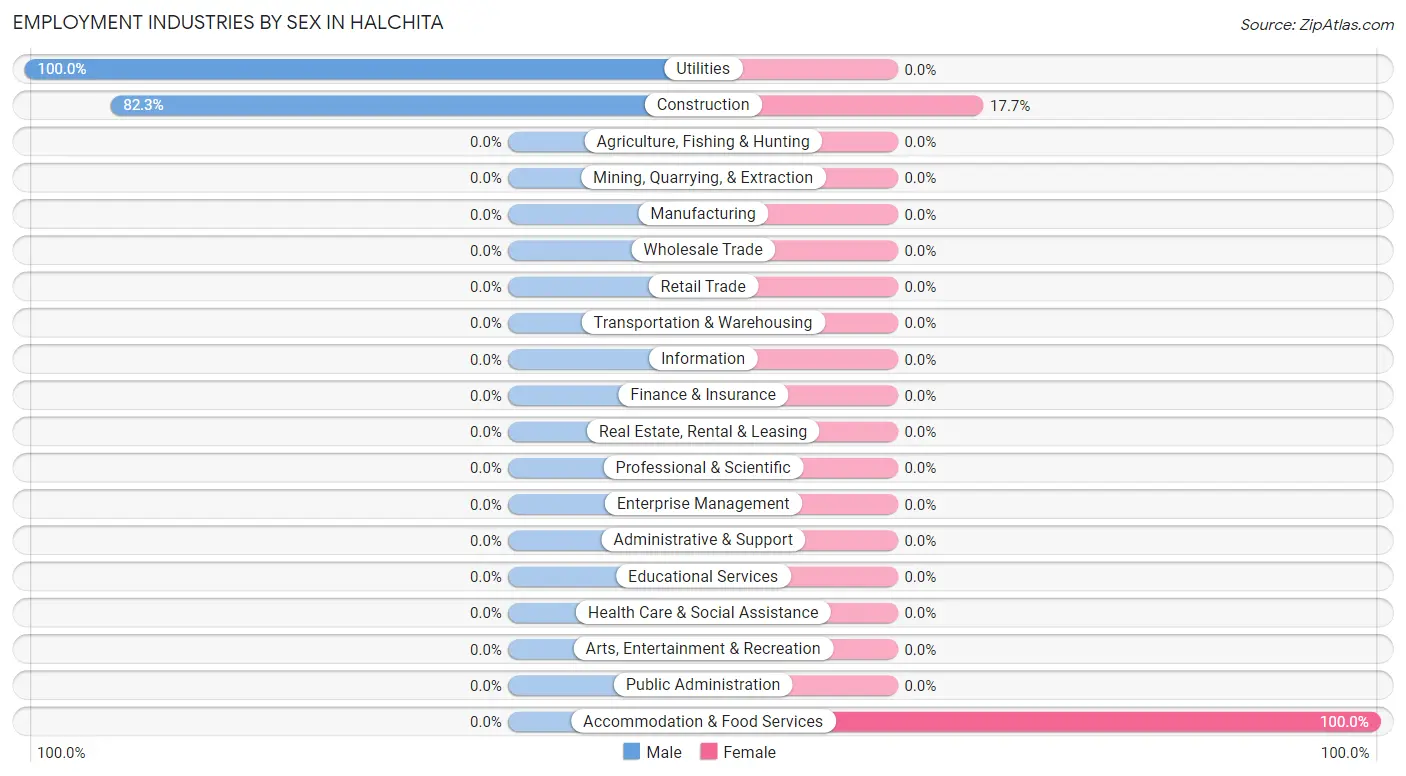
Employment Industries by Sex in Halchita
The Halchita industries that see more men than women are Utilities (100.0%), and Construction (82.3%), whereas the industries that tend to have a higher number of women are Accommodation & Food Services (100.0%), and Construction (17.7%).
| Industry | Male | Female |
| Agriculture, Fishing & Hunting | 0 (0.0%) | 0 (0.0%) |
| Mining, Quarrying, & Extraction | 0 (0.0%) | 0 (0.0%) |
| Construction | 51 (82.3%) | 11 (17.7%) |
| Manufacturing | 0 (0.0%) | 0 (0.0%) |
| Wholesale Trade | 0 (0.0%) | 0 (0.0%) |
| Retail Trade | 0 (0.0%) | 0 (0.0%) |
| Transportation & Warehousing | 0 (0.0%) | 0 (0.0%) |
| Utilities | 8 (100.0%) | 0 (0.0%) |
| Information | 0 (0.0%) | 0 (0.0%) |
| Finance & Insurance | 0 (0.0%) | 0 (0.0%) |
| Real Estate, Rental & Leasing | 0 (0.0%) | 0 (0.0%) |
| Professional & Scientific | 0 (0.0%) | 0 (0.0%) |
| Enterprise Management | 0 (0.0%) | 0 (0.0%) |
| Administrative & Support | 0 (0.0%) | 0 (0.0%) |
| Educational Services | 0 (0.0%) | 0 (0.0%) |
| Health Care & Social Assistance | 0 (0.0%) | 0 (0.0%) |
| Arts, Entertainment & Recreation | 0 (0.0%) | 0 (0.0%) |
| Accommodation & Food Services | 0 (0.0%) | 23 (100.0%) |
| Public Administration | 0 (0.0%) | 0 (0.0%) |
| Total | 59 (63.4%) | 34 (36.6%) |
Education in Halchita
School Enrollment in Halchita
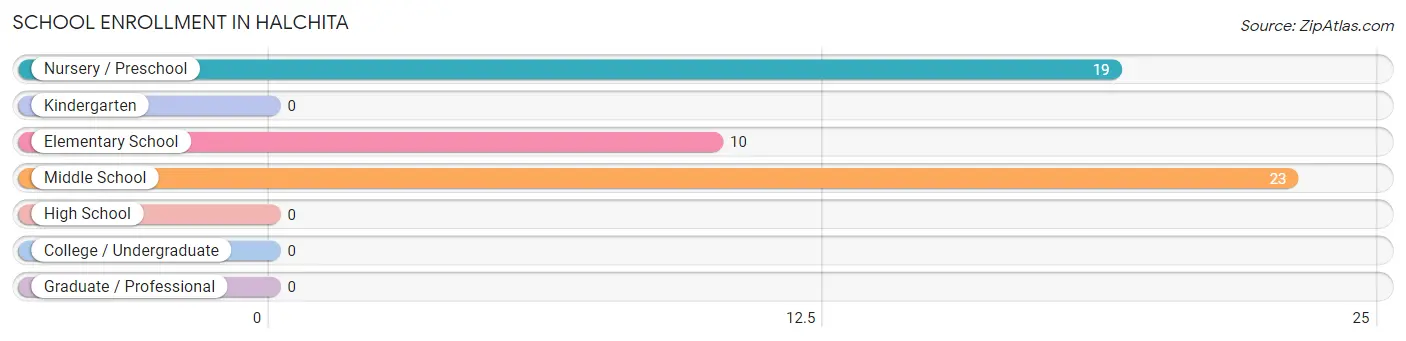
The most common levels of schooling among the 52 students in Halchita are middle school (23 | 44.2%), nursery / preschool (19 | 36.5%), and elementary school (10 | 19.2%).
| School Level | # Students | % Students |
| Nursery / Preschool | 19 | 36.5% |
| Kindergarten | 0 | 0.0% |
| Elementary School | 10 | 19.2% |
| Middle School | 23 | 44.2% |
| High School | 0 | 0.0% |
| College / Undergraduate | 0 | 0.0% |
| Graduate / Professional | 0 | 0.0% |
| Total | 52 | 100.0% |
School Enrollment by Age by Funding Source in Halchita
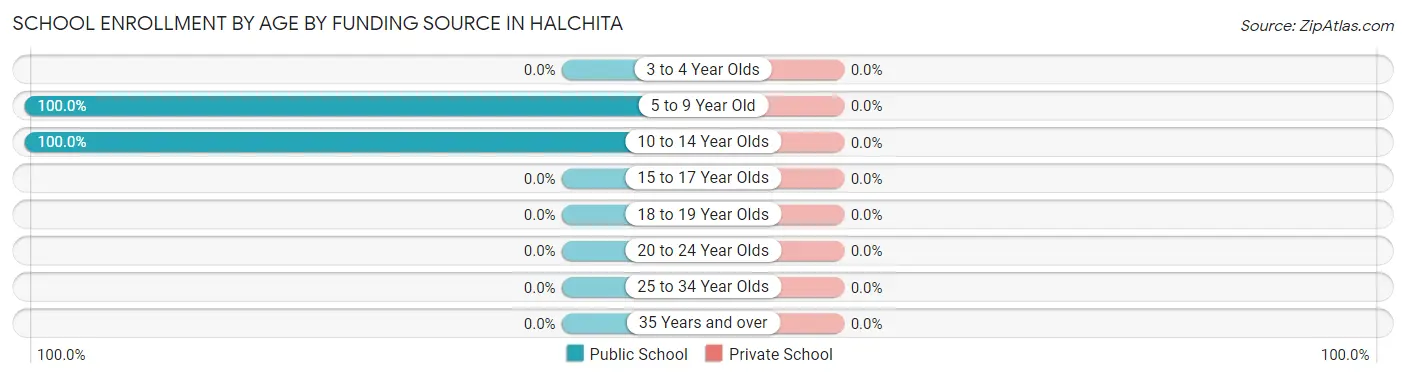
| Age Bracket | Public School | Private School |
| 3 to 4 Year Olds | 0 (0.0%) | 0 (0.0%) |
| 5 to 9 Year Old | 19 (100.0%) | 0 (0.0%) |
| 10 to 14 Year Olds | 33 (100.0%) | 0 (0.0%) |
| 15 to 17 Year Olds | 0 (0.0%) | 0 (0.0%) |
| 18 to 19 Year Olds | 0 (0.0%) | 0 (0.0%) |
| 20 to 24 Year Olds | 0 (0.0%) | 0 (0.0%) |
| 25 to 34 Year Olds | 0 (0.0%) | 0 (0.0%) |
| 35 Years and over | 0 (0.0%) | 0 (0.0%) |
| Total | 52 (100.0%) | 0 (0.0%) |
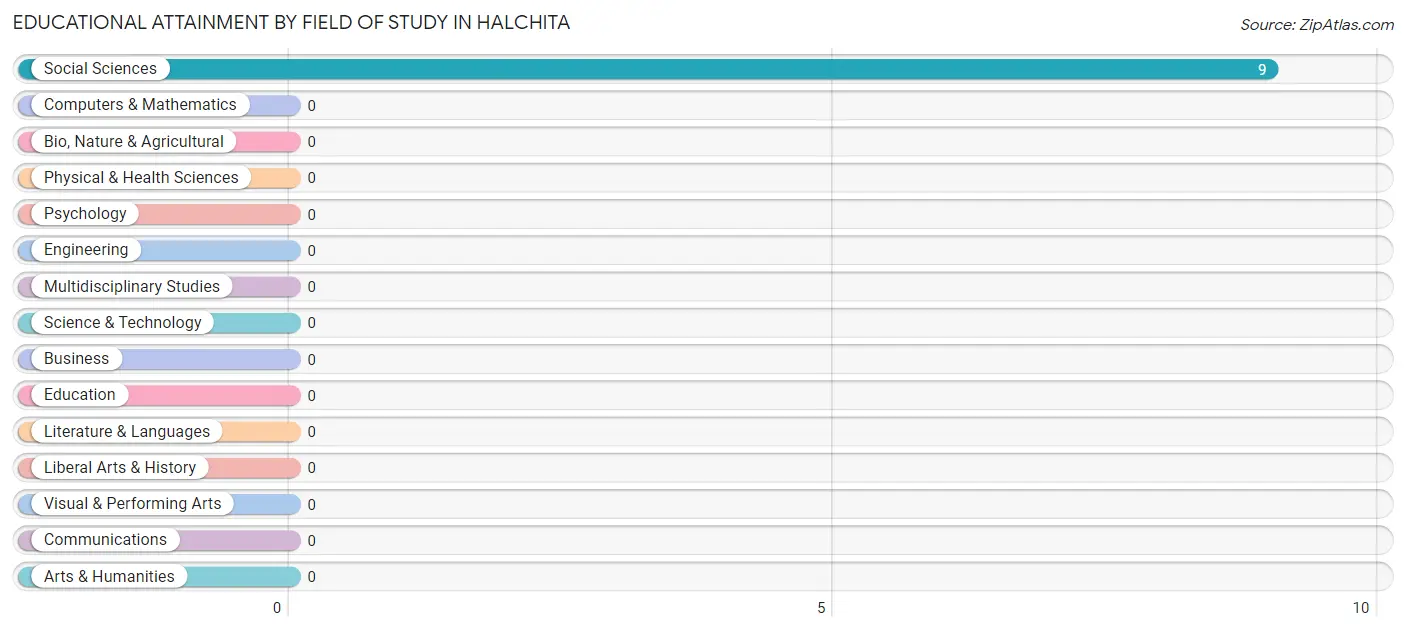
Educational Attainment by Field of Study in Halchita
, and social sciences (9 | 100.0%) are the most common fields of study among 9 individuals in Halchita who have obtained a bachelor's degree or higher.
| Field of Study | # Graduates | % Graduates |
| Computers & Mathematics | 0 | 0.0% |
| Bio, Nature & Agricultural | 0 | 0.0% |
| Physical & Health Sciences | 0 | 0.0% |
| Psychology | 0 | 0.0% |
| Social Sciences | 9 | 100.0% |
| Engineering | 0 | 0.0% |
| Multidisciplinary Studies | 0 | 0.0% |
| Science & Technology | 0 | 0.0% |
| Business | 0 | 0.0% |
| Education | 0 | 0.0% |
| Literature & Languages | 0 | 0.0% |
| Liberal Arts & History | 0 | 0.0% |
| Visual & Performing Arts | 0 | 0.0% |
| Communications | 0 | 0.0% |
| Arts & Humanities | 0 | 0.0% |
| Total | 9 | 100.0% |
Transportation & Commute in Halchita
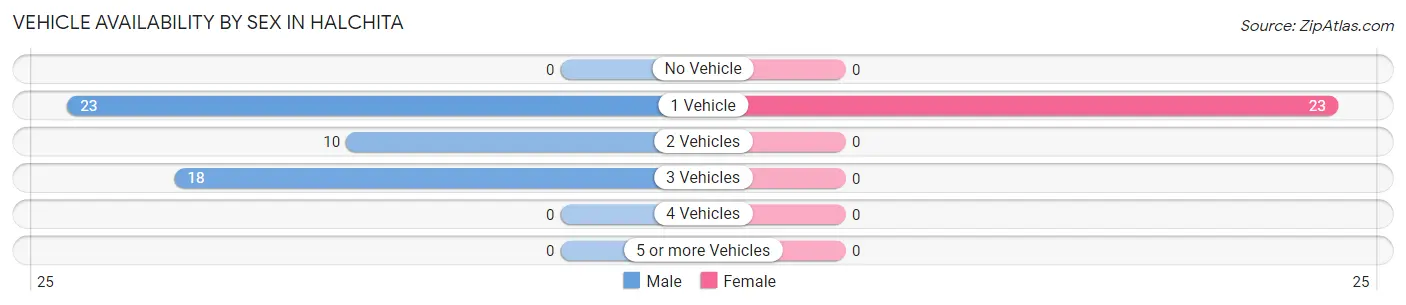
Vehicle Availability by Sex in Halchita
The most prevalent vehicle ownership categories in Halchita are males with 1 vehicle (23, accounting for 45.1%) and females with 1 vehicle (23, making up 100.0%).
| Vehicles Available | Male | Female |
| No Vehicle | 0 (0.0%) | 0 (0.0%) |
| 1 Vehicle | 23 (45.1%) | 23 (100.0%) |
| 2 Vehicles | 10 (19.6%) | 0 (0.0%) |
| 3 Vehicles | 18 (35.3%) | 0 (0.0%) |
| 4 Vehicles | 0 (0.0%) | 0 (0.0%) |
| 5 or more Vehicles | 0 (0.0%) | 0 (0.0%) |
| Total | 51 (100.0%) | 23 (100.0%) |
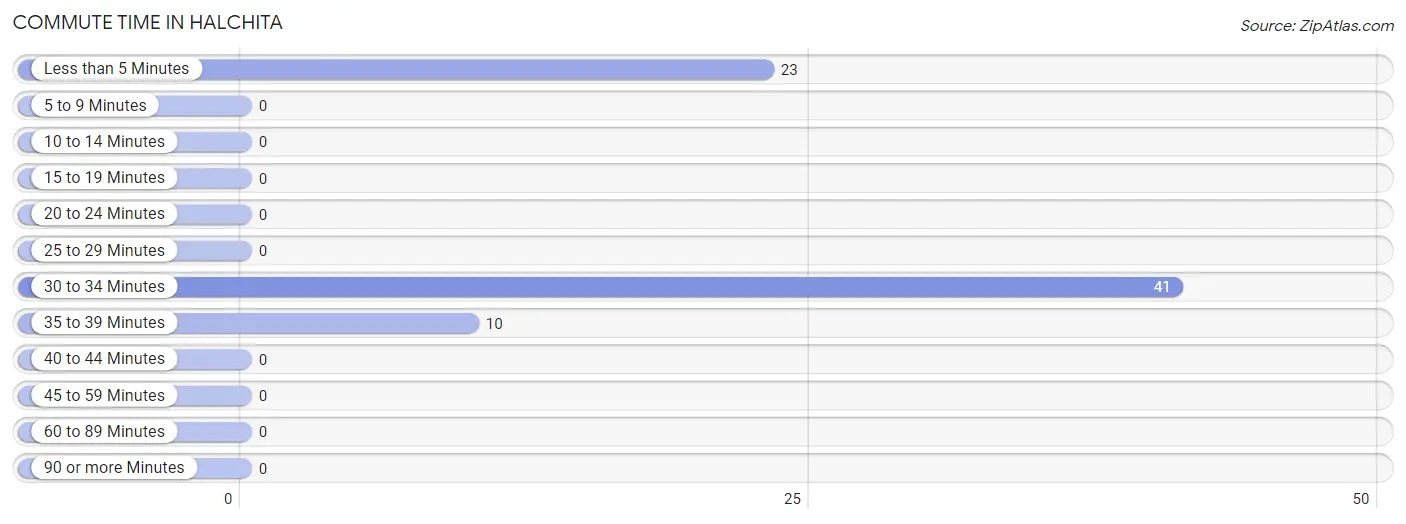
Commute Time in Halchita
The most frequently occuring commute durations in Halchita are 30 to 34 minutes (41 commuters, 55.4%), less than 5 minutes (23 commuters, 31.1%), and 35 to 39 minutes (10 commuters, 13.5%).
| Commute Time | # Commuters | % Commuters |
| Less than 5 Minutes | 23 | 31.1% |
| 5 to 9 Minutes | 0 | 0.0% |
| 10 to 14 Minutes | 0 | 0.0% |
| 15 to 19 Minutes | 0 | 0.0% |
| 20 to 24 Minutes | 0 | 0.0% |
| 25 to 29 Minutes | 0 | 0.0% |
| 30 to 34 Minutes | 41 | 55.4% |
| 35 to 39 Minutes | 10 | 13.5% |
| 40 to 44 Minutes | 0 | 0.0% |
| 45 to 59 Minutes | 0 | 0.0% |
| 60 to 89 Minutes | 0 | 0.0% |
| 90 or more Minutes | 0 | 0.0% |
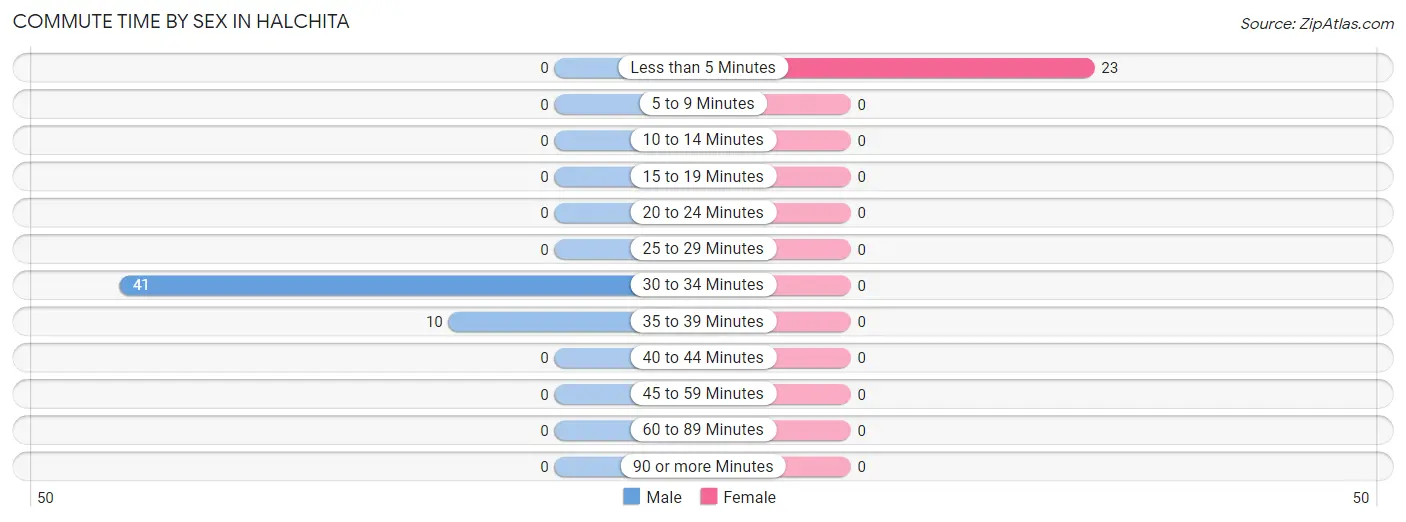
Commute Time by Sex in Halchita
The most common commute times in Halchita are 30 to 34 minutes (41 commuters, 80.4%) for males and less than 5 minutes (23 commuters, 100.0%) for females.
| Commute Time | Male | Female |
| Less than 5 Minutes | 0 (0.0%) | 23 (100.0%) |
| 5 to 9 Minutes | 0 (0.0%) | 0 (0.0%) |
| 10 to 14 Minutes | 0 (0.0%) | 0 (0.0%) |
| 15 to 19 Minutes | 0 (0.0%) | 0 (0.0%) |
| 20 to 24 Minutes | 0 (0.0%) | 0 (0.0%) |
| 25 to 29 Minutes | 0 (0.0%) | 0 (0.0%) |
| 30 to 34 Minutes | 41 (80.4%) | 0 (0.0%) |
| 35 to 39 Minutes | 10 (19.6%) | 0 (0.0%) |
| 40 to 44 Minutes | 0 (0.0%) | 0 (0.0%) |
| 45 to 59 Minutes | 0 (0.0%) | 0 (0.0%) |
| 60 to 89 Minutes | 0 (0.0%) | 0 (0.0%) |
| 90 or more Minutes | 0 (0.0%) | 0 (0.0%) |
Time of Departure to Work by Sex in Halchita
The most frequent times of departure to work in Halchita are 9:00 AM to 9:59 AM (23, 45.1%) for males and 9:00 AM to 9:59 AM (23, 100.0%) for females.
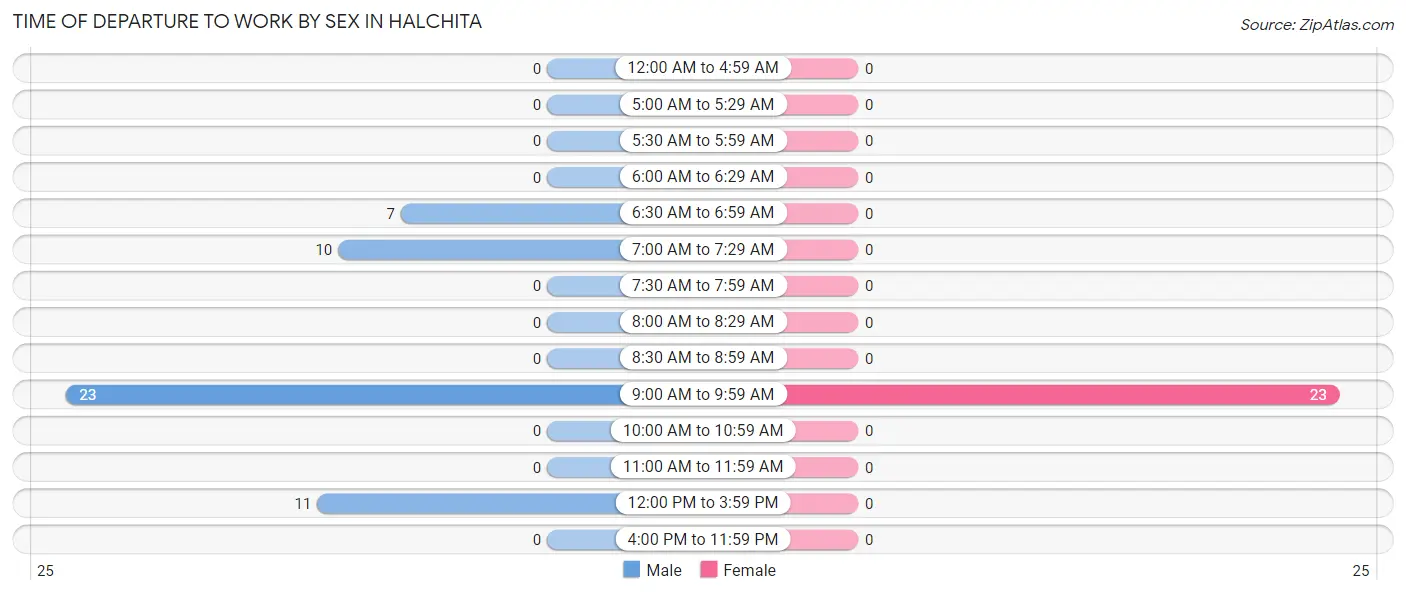
| Time of Departure | Male | Female |
| 12:00 AM to 4:59 AM | 0 (0.0%) | 0 (0.0%) |
| 5:00 AM to 5:29 AM | 0 (0.0%) | 0 (0.0%) |
| 5:30 AM to 5:59 AM | 0 (0.0%) | 0 (0.0%) |
| 6:00 AM to 6:29 AM | 0 (0.0%) | 0 (0.0%) |
| 6:30 AM to 6:59 AM | 7 (13.7%) | 0 (0.0%) |
| 7:00 AM to 7:29 AM | 10 (19.6%) | 0 (0.0%) |
| 7:30 AM to 7:59 AM | 0 (0.0%) | 0 (0.0%) |
| 8:00 AM to 8:29 AM | 0 (0.0%) | 0 (0.0%) |
| 8:30 AM to 8:59 AM | 0 (0.0%) | 0 (0.0%) |
| 9:00 AM to 9:59 AM | 23 (45.1%) | 23 (100.0%) |
| 10:00 AM to 10:59 AM | 0 (0.0%) | 0 (0.0%) |
| 11:00 AM to 11:59 AM | 0 (0.0%) | 0 (0.0%) |
| 12:00 PM to 3:59 PM | 11 (21.6%) | 0 (0.0%) |
| 4:00 PM to 11:59 PM | 0 (0.0%) | 0 (0.0%) |
| Total | 51 (100.0%) | 23 (100.0%) |
Housing Occupancy in Halchita
Occupancy by Ownership in Halchita
Of the total 94 dwellings in Halchita, owner-occupied units account for 79 (84.0%), while renter-occupied units make up 15 (16.0%).
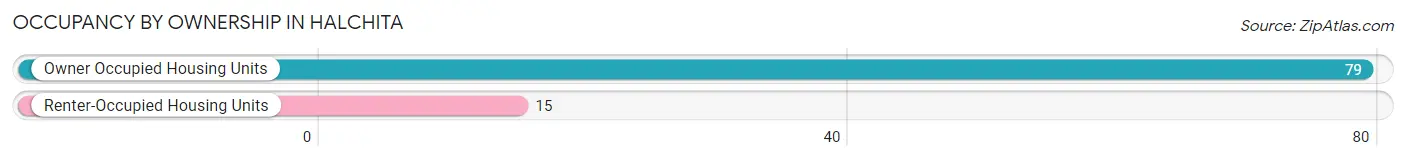
| Occupancy | # Housing Units | % Housing Units |
| Owner Occupied Housing Units | 79 | 84.0% |
| Renter-Occupied Housing Units | 15 | 16.0% |
| Total Occupied Housing Units | 94 | 100.0% |
Occupancy by Household Size in Halchita
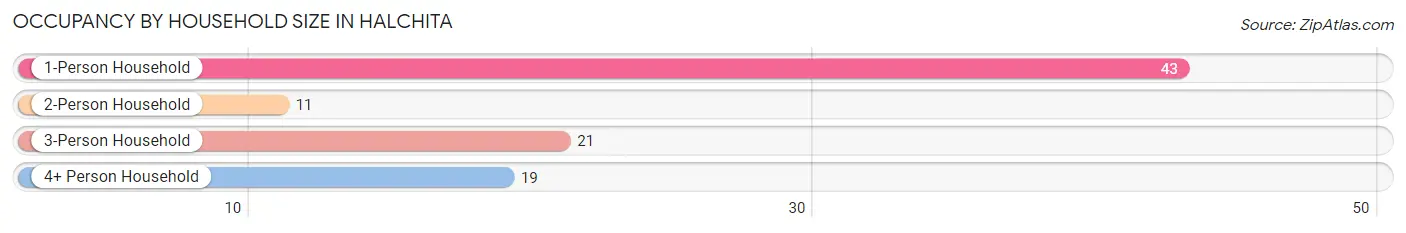
| Household Size | # Housing Units | % Housing Units |
| 1-Person Household | 43 | 45.7% |
| 2-Person Household | 11 | 11.7% |
| 3-Person Household | 21 | 22.3% |
| 4+ Person Household | 19 | 20.2% |
| Total Housing Units | 94 | 100.0% |
Occupancy by Ownership by Household Size in Halchita
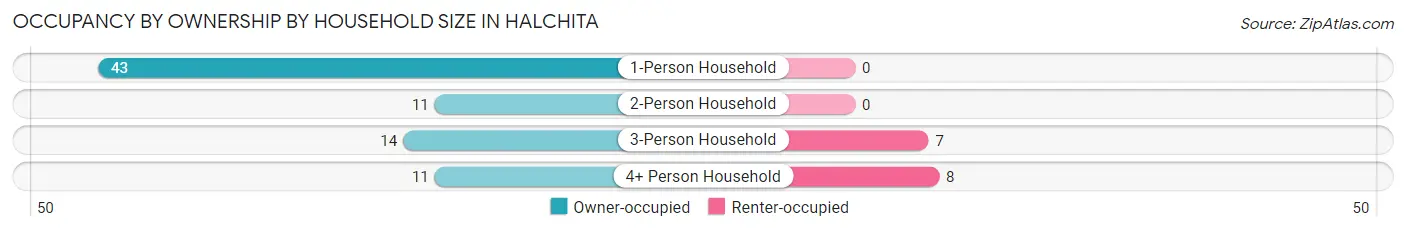
| Household Size | Owner-occupied | Renter-occupied |
| 1-Person Household | 43 (100.0%) | 0 (0.0%) |
| 2-Person Household | 11 (100.0%) | 0 (0.0%) |
| 3-Person Household | 14 (66.7%) | 7 (33.3%) |
| 4+ Person Household | 11 (57.9%) | 8 (42.1%) |
| Total Housing Units | 79 (84.0%) | 15 (16.0%) |
Occupancy by Educational Attainment in Halchita
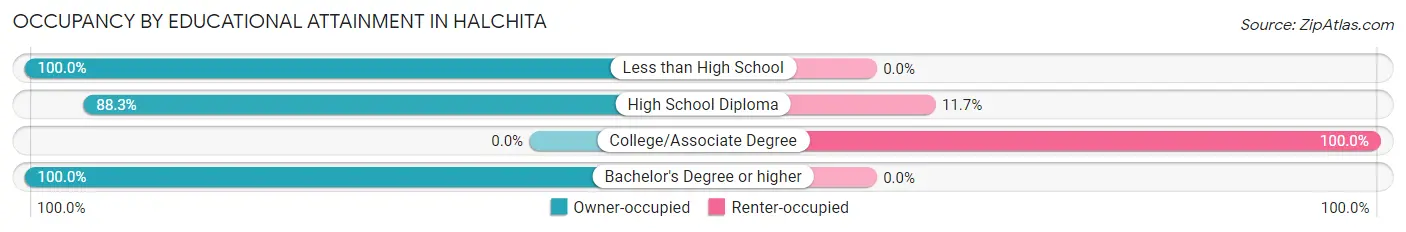
| Household Size | Owner-occupied | Renter-occupied |
| Less than High School | 17 (100.0%) | 0 (0.0%) |
| High School Diploma | 53 (88.3%) | 7 (11.7%) |
| College/Associate Degree | 0 (0.0%) | 8 (100.0%) |
| Bachelor's Degree or higher | 9 (100.0%) | 0 (0.0%) |
Occupancy by Age of Householder in Halchita
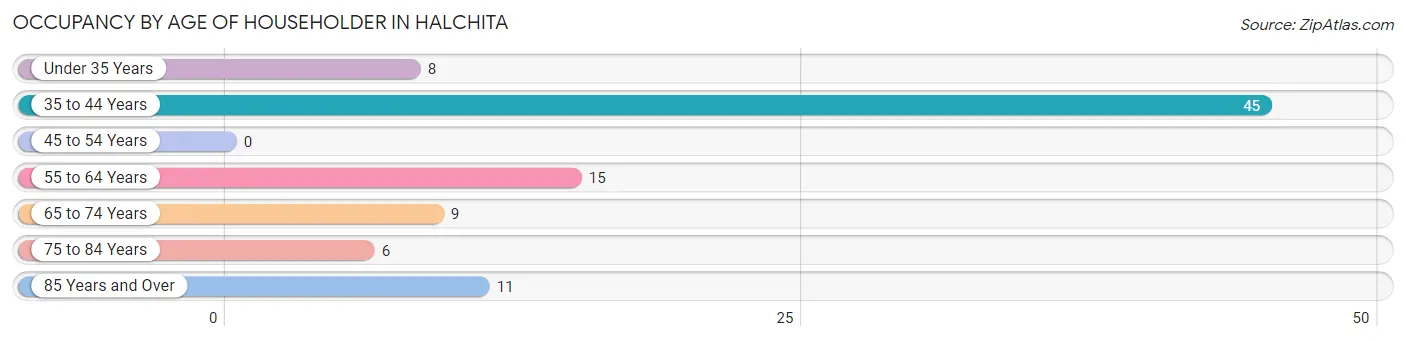
| Age Bracket | # Households | % Households |
| Under 35 Years | 8 | 8.5% |
| 35 to 44 Years | 45 | 47.9% |
| 45 to 54 Years | 0 | 0.0% |
| 55 to 64 Years | 15 | 16.0% |
| 65 to 74 Years | 9 | 9.6% |
| 75 to 84 Years | 6 | 6.4% |
| 85 Years and Over | 11 | 11.7% |
| Total | 94 | 100.0% |
Housing Finances in Halchita
Median Income by Occupancy in Halchita
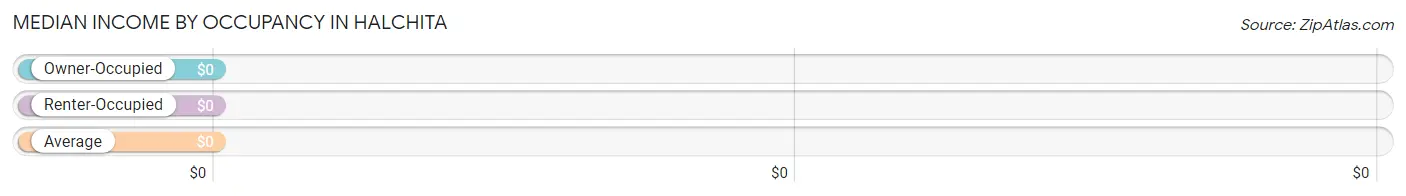
| Occupancy Type | # Households | Median Income |
| Owner-Occupied | 79 (84.0%) | $0 |
| Renter-Occupied | 15 (16.0%) | $0 |
| Average | 94 (100.0%) | $0 |
Occupancy by Householder Income Bracket in Halchita
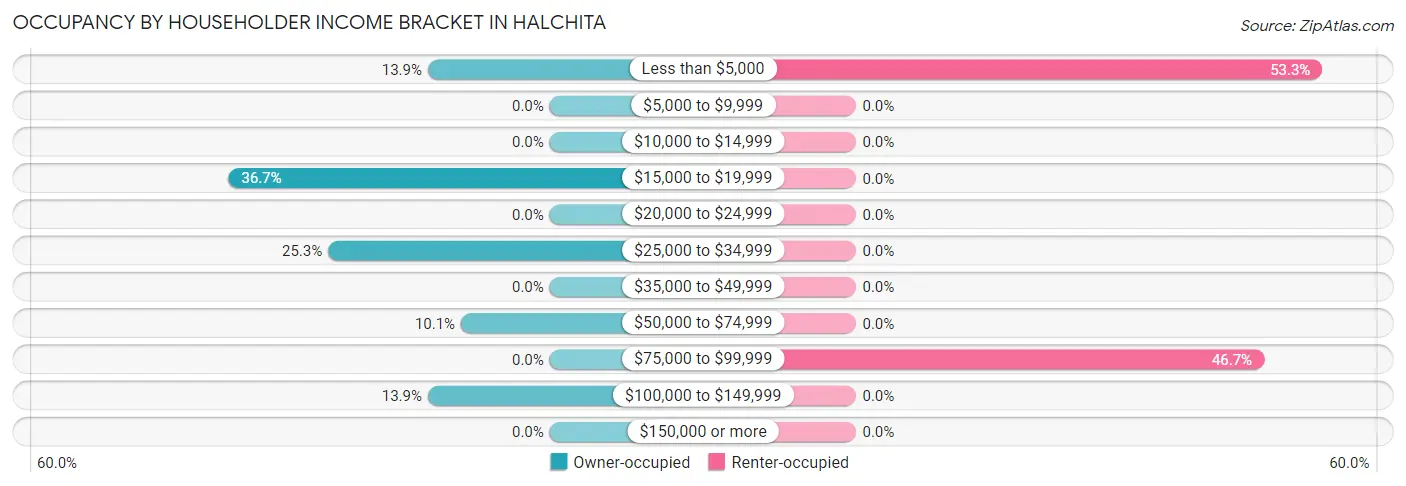
| Income Bracket | Owner-occupied | Renter-occupied |
| Less than $5,000 | 11 (13.9%) | 8 (53.3%) |
| $5,000 to $9,999 | 0 (0.0%) | 0 (0.0%) |
| $10,000 to $14,999 | 0 (0.0%) | 0 (0.0%) |
| $15,000 to $19,999 | 29 (36.7%) | 0 (0.0%) |
| $20,000 to $24,999 | 0 (0.0%) | 0 (0.0%) |
| $25,000 to $34,999 | 20 (25.3%) | 0 (0.0%) |
| $35,000 to $49,999 | 0 (0.0%) | 0 (0.0%) |
| $50,000 to $74,999 | 8 (10.1%) | 0 (0.0%) |
| $75,000 to $99,999 | 0 (0.0%) | 7 (46.7%) |
| $100,000 to $149,999 | 11 (13.9%) | 0 (0.0%) |
| $150,000 or more | 0 (0.0%) | 0 (0.0%) |
| Total | 79 (100.0%) | 15 (100.0%) |
Monthly Housing Cost Tiers in Halchita
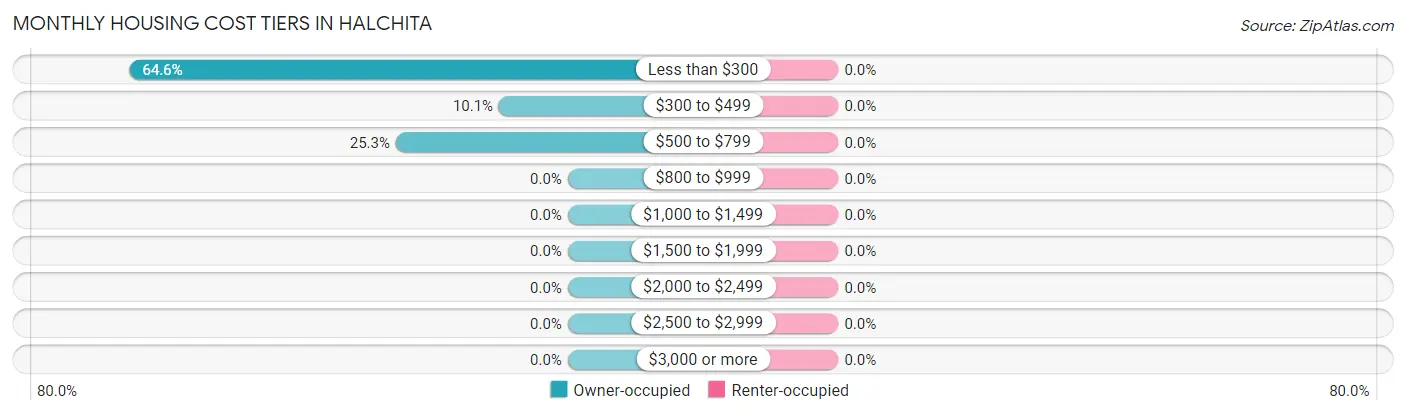
| Monthly Cost | Owner-occupied | Renter-occupied |
| Less than $300 | 51 (64.6%) | 0 (0.0%) |
| $300 to $499 | 8 (10.1%) | 0 (0.0%) |
| $500 to $799 | 20 (25.3%) | 0 (0.0%) |
| $800 to $999 | 0 (0.0%) | 0 (0.0%) |
| $1,000 to $1,499 | 0 (0.0%) | 0 (0.0%) |
| $1,500 to $1,999 | 0 (0.0%) | 0 (0.0%) |
| $2,000 to $2,499 | 0 (0.0%) | 0 (0.0%) |
| $2,500 to $2,999 | 0 (0.0%) | 0 (0.0%) |
| $3,000 or more | 0 (0.0%) | 0 (0.0%) |
| Total | 79 (100.0%) | 15 (100.0%) |
Physical Housing Characteristics in Halchita
Housing Structures in Halchita
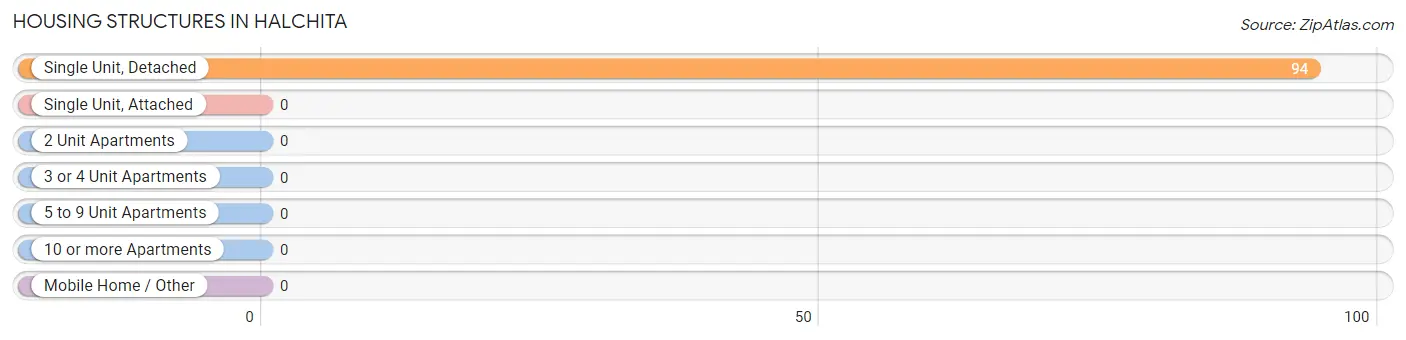
| Structure Type | # Housing Units | % Housing Units |
| Single Unit, Detached | 94 | 100.0% |
| Single Unit, Attached | 0 | 0.0% |
| 2 Unit Apartments | 0 | 0.0% |
| 3 or 4 Unit Apartments | 0 | 0.0% |
| 5 to 9 Unit Apartments | 0 | 0.0% |
| 10 or more Apartments | 0 | 0.0% |
| Mobile Home / Other | 0 | 0.0% |
| Total | 94 | 100.0% |
Housing Structures by Occupancy in Halchita
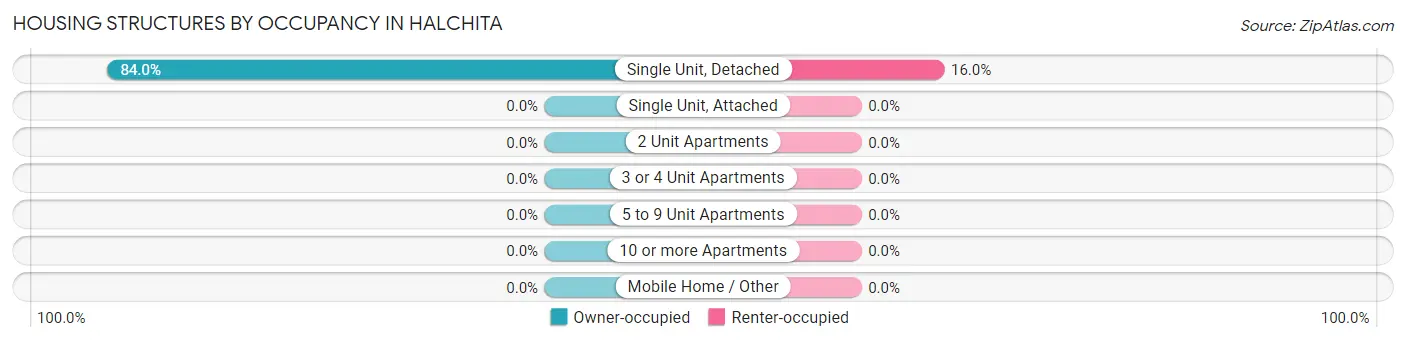
| Structure Type | Owner-occupied | Renter-occupied |
| Single Unit, Detached | 79 (84.0%) | 15 (16.0%) |
| Single Unit, Attached | 0 (0.0%) | 0 (0.0%) |
| 2 Unit Apartments | 0 (0.0%) | 0 (0.0%) |
| 3 or 4 Unit Apartments | 0 (0.0%) | 0 (0.0%) |
| 5 to 9 Unit Apartments | 0 (0.0%) | 0 (0.0%) |
| 10 or more Apartments | 0 (0.0%) | 0 (0.0%) |
| Mobile Home / Other | 0 (0.0%) | 0 (0.0%) |
| Total | 79 (84.0%) | 15 (16.0%) |
Housing Structures by Number of Rooms in Halchita
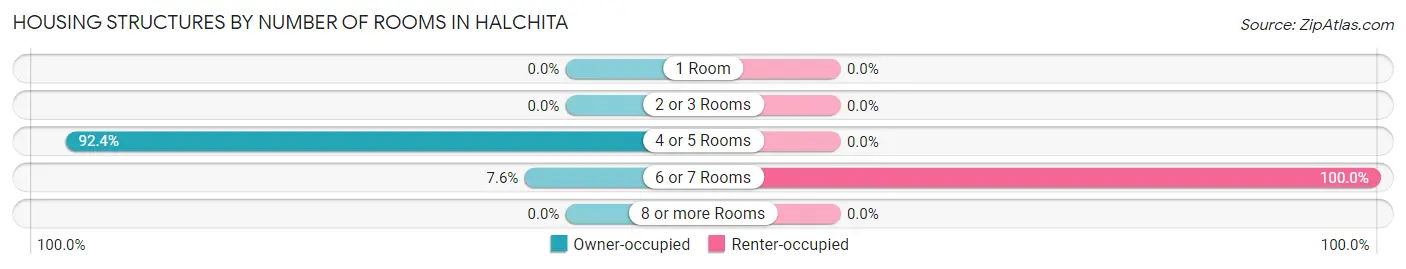
| Number of Rooms | Owner-occupied | Renter-occupied |
| 1 Room | 0 (0.0%) | 0 (0.0%) |
| 2 or 3 Rooms | 0 (0.0%) | 0 (0.0%) |
| 4 or 5 Rooms | 73 (92.4%) | 0 (0.0%) |
| 6 or 7 Rooms | 6 (7.6%) | 15 (100.0%) |
| 8 or more Rooms | 0 (0.0%) | 0 (0.0%) |
| Total | 79 (100.0%) | 15 (100.0%) |
Housing Structure by Heating Type in Halchita
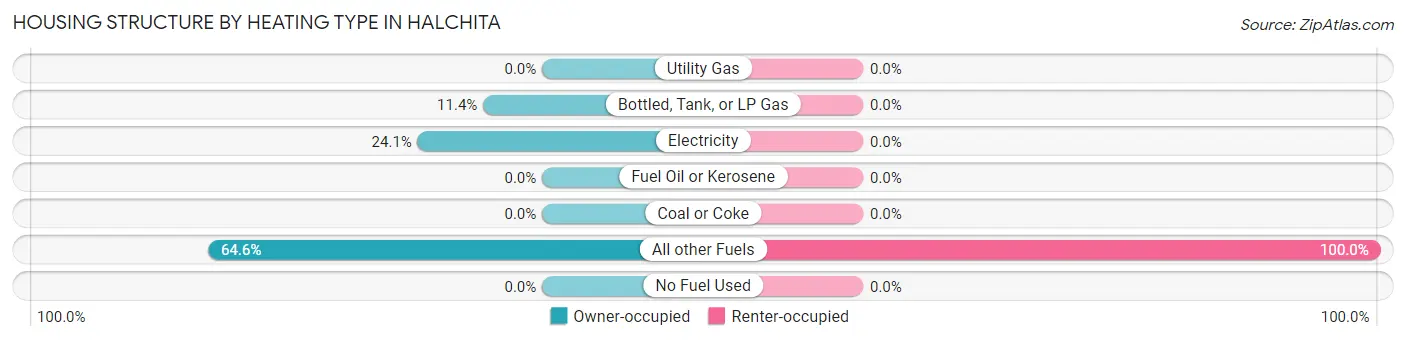
| Heating Type | Owner-occupied | Renter-occupied |
| Utility Gas | 0 (0.0%) | 0 (0.0%) |
| Bottled, Tank, or LP Gas | 9 (11.4%) | 0 (0.0%) |
| Electricity | 19 (24.0%) | 0 (0.0%) |
| Fuel Oil or Kerosene | 0 (0.0%) | 0 (0.0%) |
| Coal or Coke | 0 (0.0%) | 0 (0.0%) |
| All other Fuels | 51 (64.6%) | 15 (100.0%) |
| No Fuel Used | 0 (0.0%) | 0 (0.0%) |
| Total | 79 (100.0%) | 15 (100.0%) |
Household Vehicle Usage in Halchita
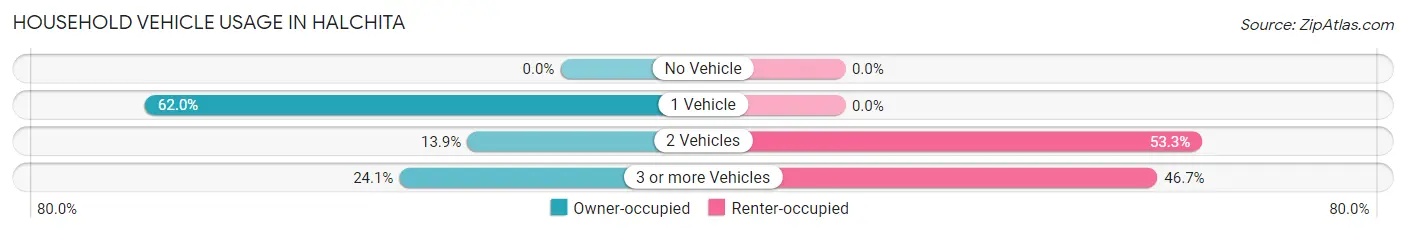
| Vehicles per Household | Owner-occupied | Renter-occupied |
| No Vehicle | 0 (0.0%) | 0 (0.0%) |
| 1 Vehicle | 49 (62.0%) | 0 (0.0%) |
| 2 Vehicles | 11 (13.9%) | 8 (53.3%) |
| 3 or more Vehicles | 19 (24.0%) | 7 (46.7%) |
| Total | 79 (100.0%) | 15 (100.0%) |
Real Estate & Mortgages in Halchita
Real Estate and Mortgage Overview in Halchita
| Characteristic | Without Mortgage | With Mortgage |
| Housing Units | 79 | 0 |
| Median Property Value | $71,800 | $0 |
| Median Household Income | - | - |
| Monthly Housing Costs | $225 | $0 |
| Real Estate Taxes | - | - |
Property Value by Mortgage Status in Halchita
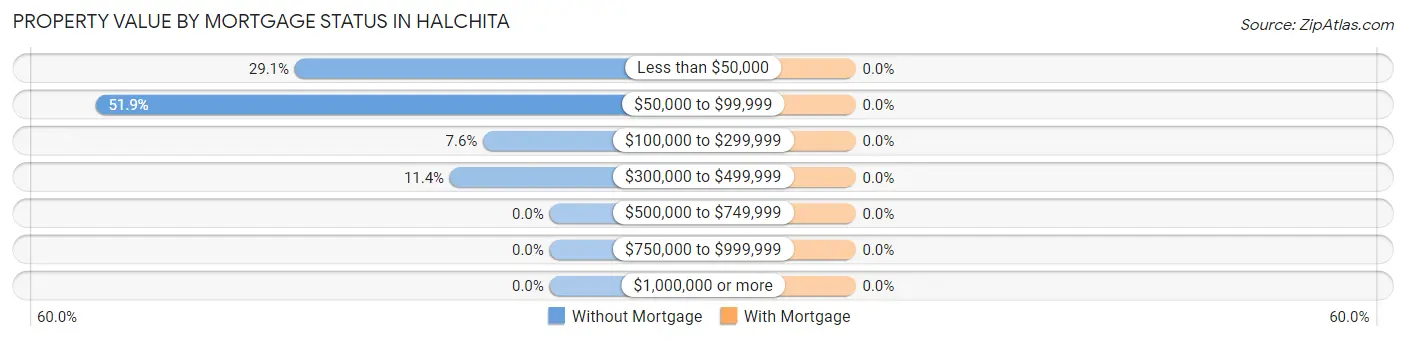
| Property Value | Without Mortgage | With Mortgage |
| Less than $50,000 | 23 (29.1%) | 0 (0.0%) |
| $50,000 to $99,999 | 41 (51.9%) | 0 (0.0%) |
| $100,000 to $299,999 | 6 (7.6%) | 0 (0.0%) |
| $300,000 to $499,999 | 9 (11.4%) | 0 (0.0%) |
| $500,000 to $749,999 | 0 (0.0%) | 0 (0.0%) |
| $750,000 to $999,999 | 0 (0.0%) | 0 (0.0%) |
| $1,000,000 or more | 0 (0.0%) | 0 (0.0%) |
| Total | 79 (100.0%) | 0 (0.0%) |
Household Income by Mortgage Status in Halchita
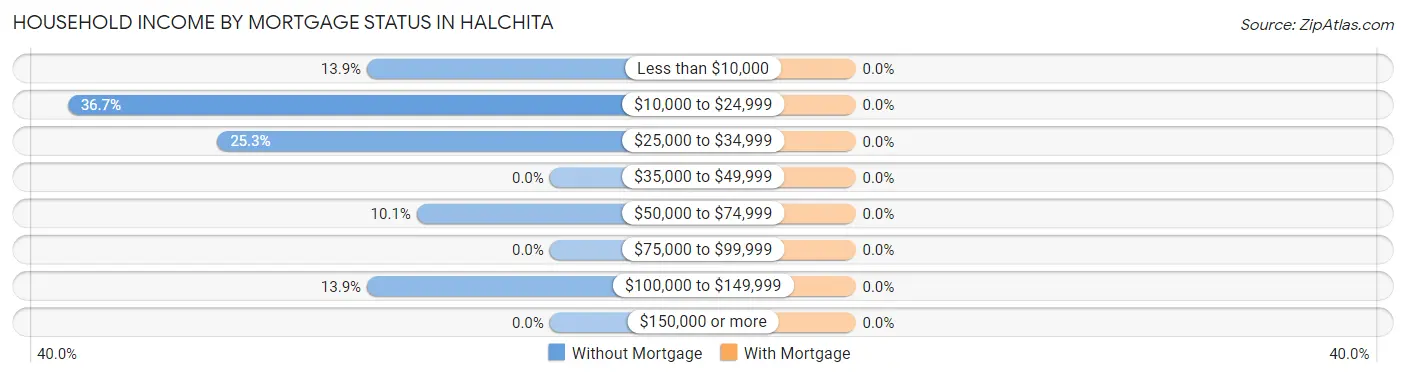
| Household Income | Without Mortgage | With Mortgage |
| Less than $10,000 | 11 (13.9%) | 0 (0.0%) |
| $10,000 to $24,999 | 29 (36.7%) | 0 (0.0%) |
| $25,000 to $34,999 | 20 (25.3%) | 0 (0.0%) |
| $35,000 to $49,999 | 0 (0.0%) | 0 (0.0%) |
| $50,000 to $74,999 | 8 (10.1%) | 0 (0.0%) |
| $75,000 to $99,999 | 0 (0.0%) | 0 (0.0%) |
| $100,000 to $149,999 | 11 (13.9%) | 0 (0.0%) |
| $150,000 or more | 0 (0.0%) | 0 (0.0%) |
| Total | 79 (100.0%) | 0 (0.0%) |
Property Value to Household Income Ratio in Halchita
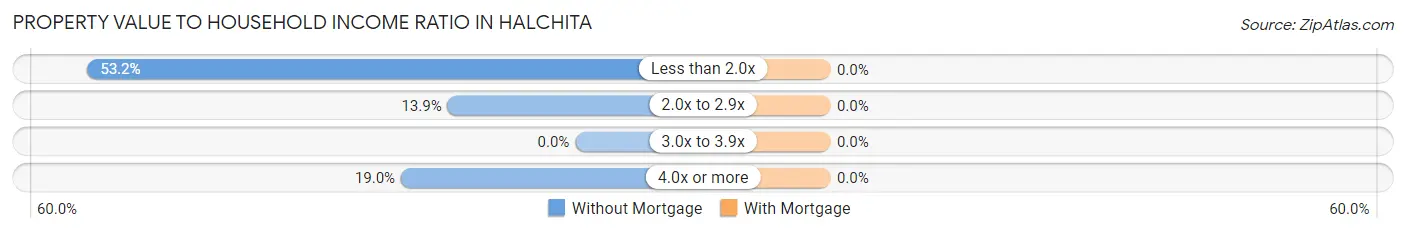
| Value-to-Income Ratio | Without Mortgage | With Mortgage |
| Less than 2.0x | 42 (53.2%) | 0 (0.0%) |
| 2.0x to 2.9x | 11 (13.9%) | 0 (0.0%) |
| 3.0x to 3.9x | 0 (0.0%) | 0 (0.0%) |
| 4.0x or more | 15 (19.0%) | 0 (0.0%) |
| Total | 79 (100.0%) | 0 (0.0%) |
Real Estate Taxes by Mortgage Status in Halchita
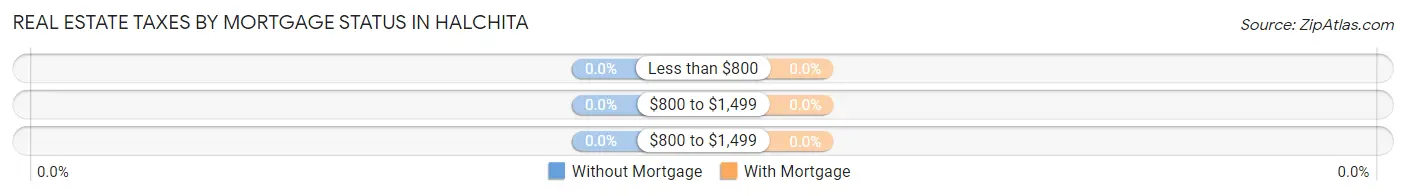
| Property Taxes | Without Mortgage | With Mortgage |
| Less than $800 | 0 (0.0%) | 0 (0.0%) |
| $800 to $1,499 | 0 (0.0%) | 0 (0.0%) |
| $800 to $1,499 | 0 (0.0%) | 0 (0.0%) |
| Total | 79 (100.0%) | 0 (0.0%) |
Health & Disability in Halchita
Health Insurance Coverage by Age in Halchita
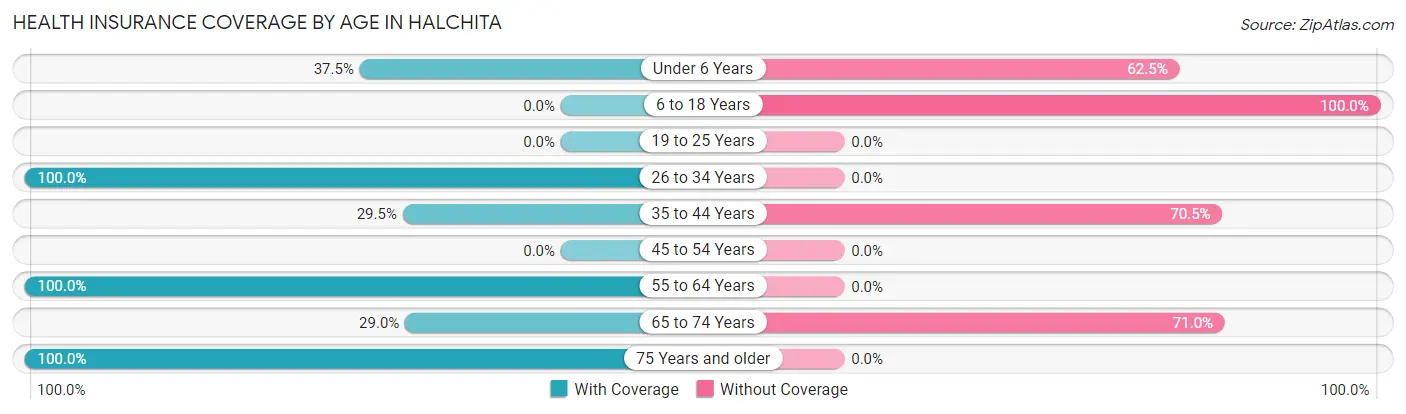
| Age Bracket | With Coverage | Without Coverage |
| Under 6 Years | 18 (37.5%) | 30 (62.5%) |
| 6 to 18 Years | 0 (0.0%) | 33 (100.0%) |
| 19 to 25 Years | 0 (0.0%) | 0 (0.0%) |
| 26 to 34 Years | 19 (100.0%) | 0 (0.0%) |
| 35 to 44 Years | 23 (29.5%) | 55 (70.5%) |
| 45 to 54 Years | 0 (0.0%) | 0 (0.0%) |
| 55 to 64 Years | 22 (100.0%) | 0 (0.0%) |
| 65 to 74 Years | 9 (29.0%) | 22 (71.0%) |
| 75 Years and older | 25 (100.0%) | 0 (0.0%) |
| Total | 116 (45.3%) | 140 (54.7%) |
Health Insurance Coverage by Citizenship Status in Halchita
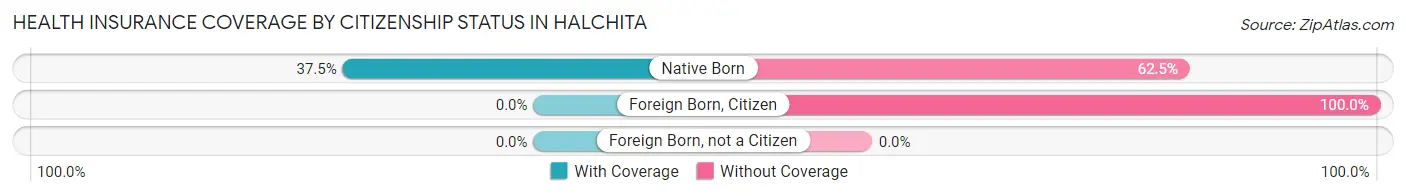
| Citizenship Status | With Coverage | Without Coverage |
| Native Born | 18 (37.5%) | 30 (62.5%) |
| Foreign Born, Citizen | 0 (0.0%) | 33 (100.0%) |
| Foreign Born, not a Citizen | 0 (0.0%) | 0 (0.0%) |
Health Insurance Coverage by Household Income in Halchita
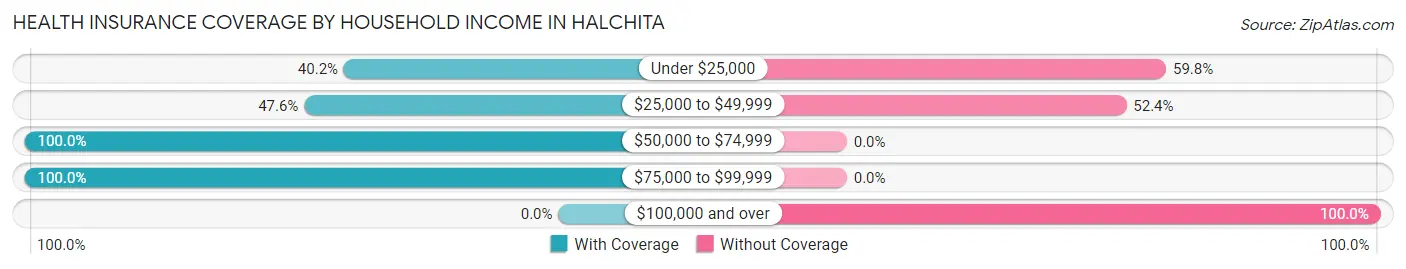
| Household Income | With Coverage | Without Coverage |
| Under $25,000 | 45 (40.2%) | 67 (59.8%) |
| $25,000 to $49,999 | 20 (47.6%) | 22 (52.4%) |
| $50,000 to $74,999 | 26 (100.0%) | 0 (0.0%) |
| $75,000 to $99,999 | 25 (100.0%) | 0 (0.0%) |
| $100,000 and over | 0 (0.0%) | 51 (100.0%) |
Public vs Private Health Insurance Coverage by Age in Halchita
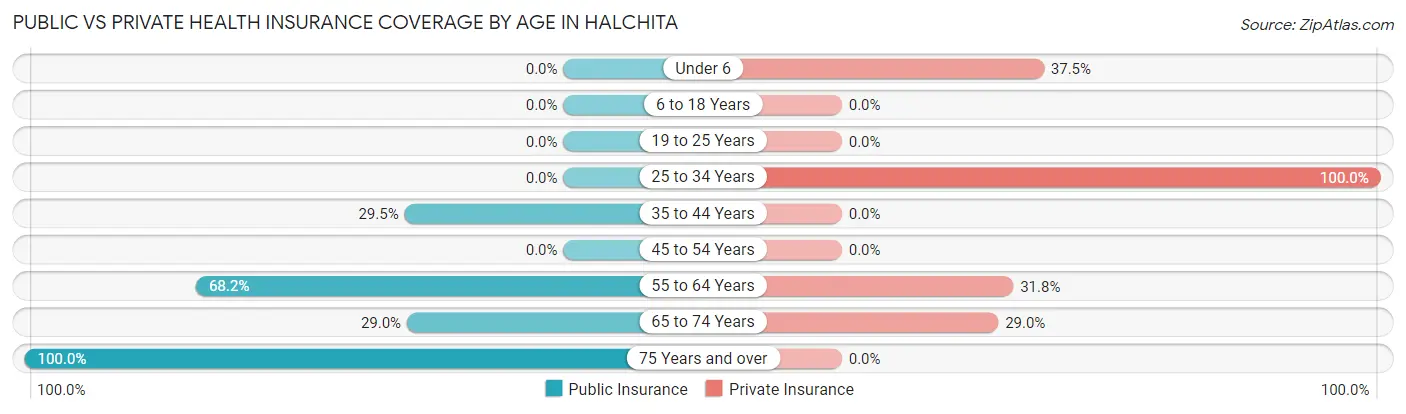
| Age Bracket | Public Insurance | Private Insurance |
| Under 6 | 0 (0.0%) | 18 (37.5%) |
| 6 to 18 Years | 0 (0.0%) | 0 (0.0%) |
| 19 to 25 Years | 0 (0.0%) | 0 (0.0%) |
| 25 to 34 Years | 0 (0.0%) | 19 (100.0%) |
| 35 to 44 Years | 23 (29.5%) | 0 (0.0%) |
| 45 to 54 Years | 0 (0.0%) | 0 (0.0%) |
| 55 to 64 Years | 15 (68.2%) | 7 (31.8%) |
| 65 to 74 Years | 9 (29.0%) | 9 (29.0%) |
| 75 Years and over | 25 (100.0%) | 0 (0.0%) |
| Total | 72 (28.1%) | 53 (20.7%) |
Disability Status by Sex by Age in Halchita
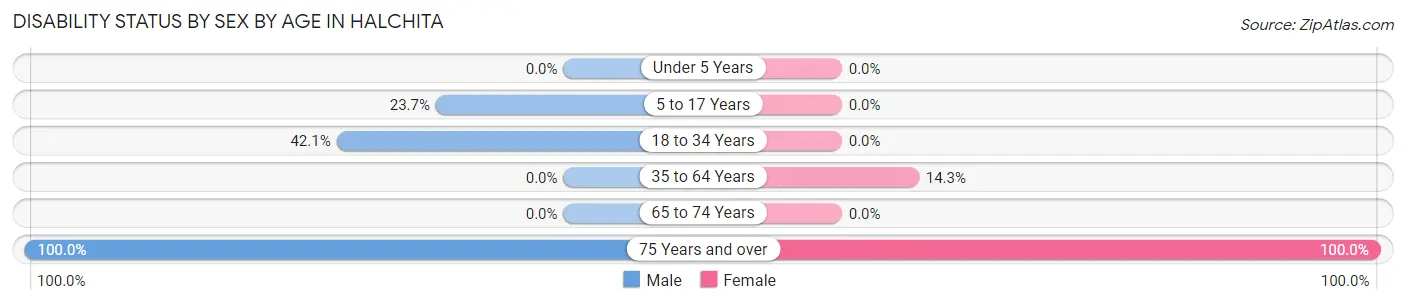
| Age Bracket | Male | Female |
| Under 5 Years | 0 (0.0%) | 0 (0.0%) |
| 5 to 17 Years | 9 (23.7%) | 0 (0.0%) |
| 18 to 34 Years | 8 (42.1%) | 0 (0.0%) |
| 35 to 64 Years | 0 (0.0%) | 7 (14.3%) |
| 65 to 74 Years | 0 (0.0%) | 0 (0.0%) |
| 75 Years and over | 17 (100.0%) | 8 (100.0%) |
Disability Class by Sex by Age in Halchita
Disability Class: Hearing Difficulty
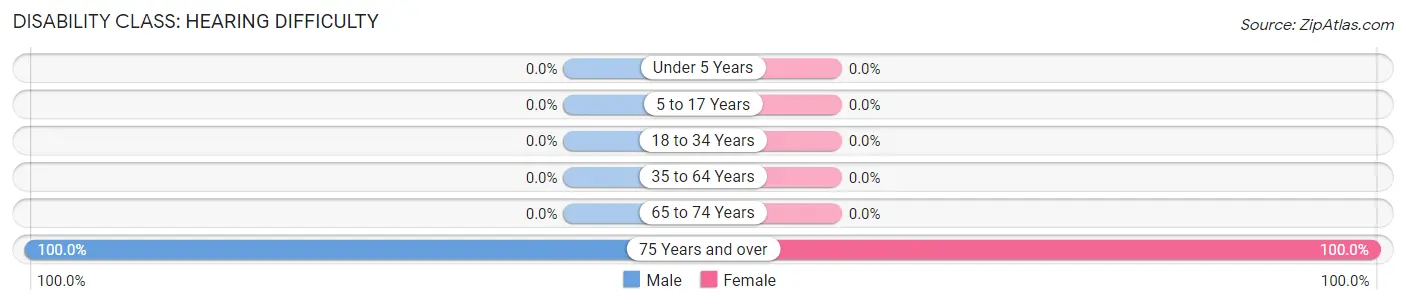
| Age Bracket | Male | Female |
| Under 5 Years | 0 (0.0%) | 0 (0.0%) |
| 5 to 17 Years | 0 (0.0%) | 0 (0.0%) |
| 18 to 34 Years | 0 (0.0%) | 0 (0.0%) |
| 35 to 64 Years | 0 (0.0%) | 0 (0.0%) |
| 65 to 74 Years | 0 (0.0%) | 0 (0.0%) |
| 75 Years and over | 17 (100.0%) | 8 (100.0%) |
Disability Class: Vision Difficulty
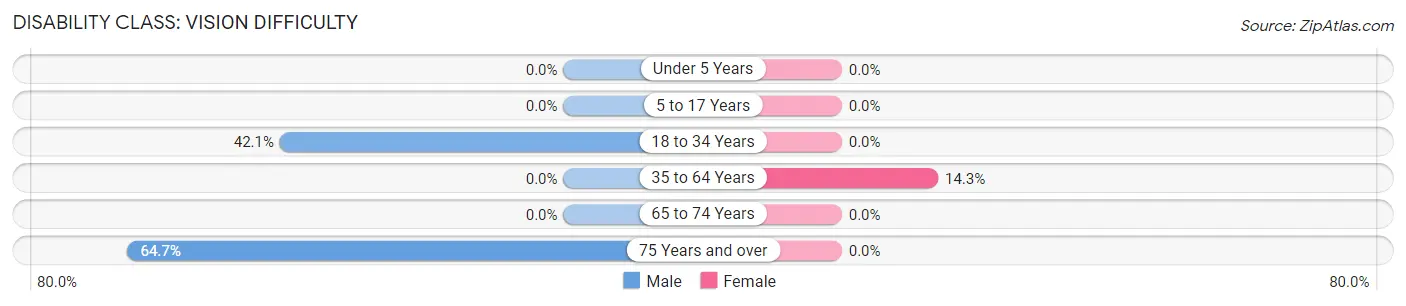
| Age Bracket | Male | Female |
| Under 5 Years | 0 (0.0%) | 0 (0.0%) |
| 5 to 17 Years | 0 (0.0%) | 0 (0.0%) |
| 18 to 34 Years | 8 (42.1%) | 0 (0.0%) |
| 35 to 64 Years | 0 (0.0%) | 7 (14.3%) |
| 65 to 74 Years | 0 (0.0%) | 0 (0.0%) |
| 75 Years and over | 11 (64.7%) | 0 (0.0%) |
Disability Class: Cognitive Difficulty
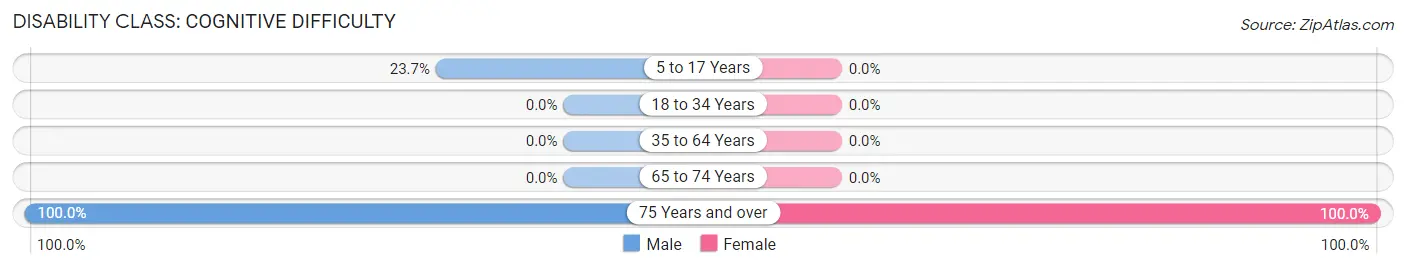
| Age Bracket | Male | Female |
| 5 to 17 Years | 9 (23.7%) | 0 (0.0%) |
| 18 to 34 Years | 0 (0.0%) | 0 (0.0%) |
| 35 to 64 Years | 0 (0.0%) | 0 (0.0%) |
| 65 to 74 Years | 0 (0.0%) | 0 (0.0%) |
| 75 Years and over | 17 (100.0%) | 8 (100.0%) |
Disability Class: Ambulatory Difficulty
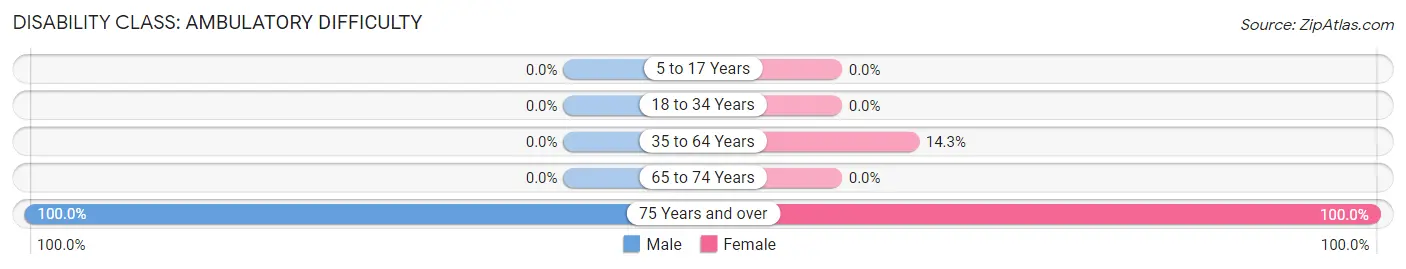
| Age Bracket | Male | Female |
| 5 to 17 Years | 0 (0.0%) | 0 (0.0%) |
| 18 to 34 Years | 0 (0.0%) | 0 (0.0%) |
| 35 to 64 Years | 0 (0.0%) | 7 (14.3%) |
| 65 to 74 Years | 0 (0.0%) | 0 (0.0%) |
| 75 Years and over | 17 (100.0%) | 8 (100.0%) |
Disability Class: Self-Care Difficulty
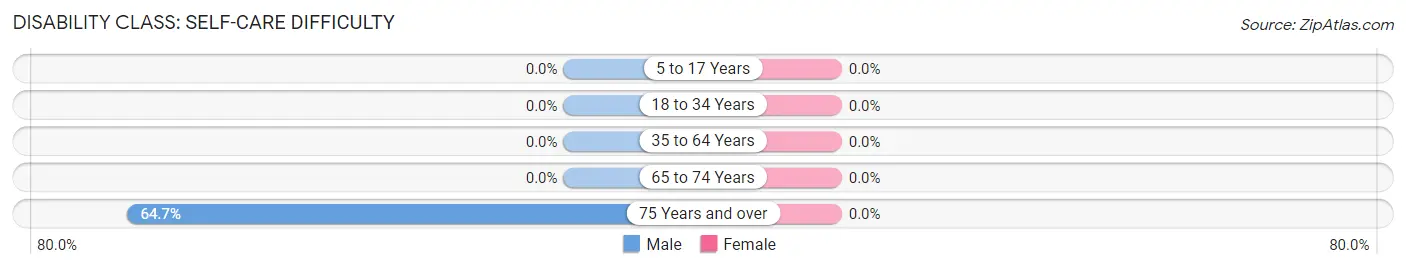
| Age Bracket | Male | Female |
| 5 to 17 Years | 0 (0.0%) | 0 (0.0%) |
| 18 to 34 Years | 0 (0.0%) | 0 (0.0%) |
| 35 to 64 Years | 0 (0.0%) | 0 (0.0%) |
| 65 to 74 Years | 0 (0.0%) | 0 (0.0%) |
| 75 Years and over | 11 (64.7%) | 0 (0.0%) |
Technology Access in Halchita
Computing Device Access in Halchita
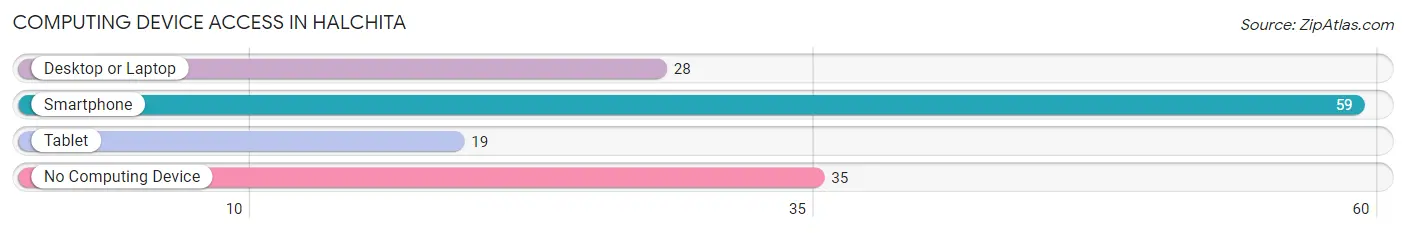
| Device Type | # Households | % Households |
| Desktop or Laptop | 28 | 29.8% |
| Smartphone | 59 | 62.8% |
| Tablet | 19 | 20.2% |
| No Computing Device | 35 | 37.2% |
| Total | 94 | 100.0% |
Internet Access in Halchita
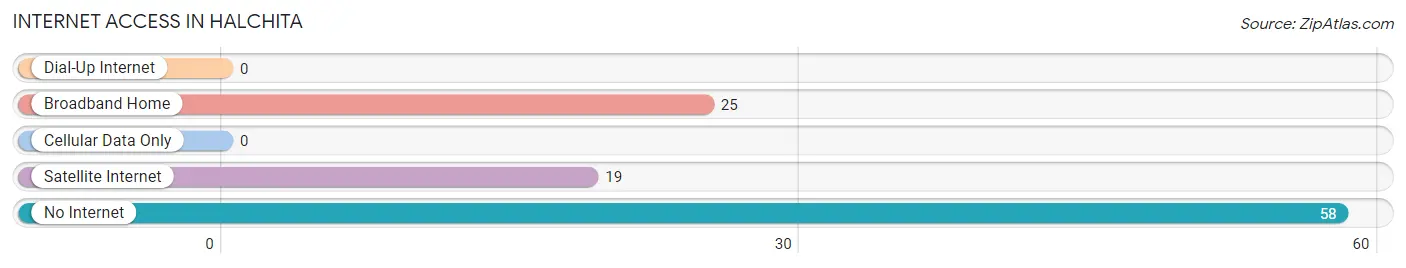
| Internet Type | # Households | % Households |
| Dial-Up Internet | 0 | 0.0% |
| Broadband Home | 25 | 26.6% |
| Cellular Data Only | 0 | 0.0% |
| Satellite Internet | 19 | 20.2% |
| No Internet | 58 | 61.7% |
| Total | 94 | 100.0% |
Halchita Summary
Halchita is a small unincorporated community located in San Juan County, Utah. It is situated on the banks of the San Juan River, near the Arizona border. The population of Halchita was estimated to be around 200 people in 2020.
History
Halchita was first settled in the late 1800s by Mormon pioneers. The town was named after a nearby mountain, which was named after a Paiute chief. The town was originally a farming community, but it soon became a trading post for the local Navajo and Paiute tribes. The town was also a stop on the Old Spanish Trail, which was used by traders and travelers to move goods between Santa Fe and Los Angeles.
In the early 1900s, Halchita became a popular tourist destination. The town was known for its natural beauty and its proximity to the Grand Canyon. The town also had a number of hotels and restaurants, as well as a movie theater.
In the 1950s, Halchita began to decline as the tourist trade moved elsewhere. The town was eventually abandoned in the 1970s. In the 1980s, the town was revived as a retirement community.
Geography
Halchita is located in the Four Corners region of the United States. It is situated on the banks of the San Juan River, near the Arizona border. The town is surrounded by the Navajo Nation and the San Juan River Indian Reservation.
The climate in Halchita is semi-arid, with hot summers and mild winters. The average annual temperature is around 70 degrees Fahrenheit. The town receives an average of 8 inches of precipitation per year.
Economy
The economy of Halchita is largely based on tourism. The town is a popular destination for outdoor enthusiasts, as it is close to the Grand Canyon and other natural attractions. The town also has a number of restaurants, hotels, and other businesses that cater to tourists.
The town also has a number of small businesses, such as a grocery store, a gas station, and a post office. The town also has a number of art galleries and craft stores.
Demographics
The population of Halchita was estimated to be around 200 people in 2020. The town is predominantly white, with a small Hispanic population. The median household income in Halchita is around $30,000. The town has a poverty rate of around 20%.
Conclusion
Halchita is a small unincorporated community located in San Juan County, Utah. It is situated on the banks of the San Juan River, near the Arizona border. The town was first settled in the late 1800s by Mormon pioneers and was originally a farming community. In the 1950s, Halchita began to decline as the tourist trade moved elsewhere. The town was eventually abandoned in the 1970s, but was revived as a retirement community in the 1980s. The economy of Halchita is largely based on tourism, and the town has a population of around 200 people. The town is predominantly white, with a small Hispanic population. The median household income in Halchita is around $30,000, and the town has a poverty rate of around 20%.
Common Questions
What is Per Capita Income in Halchita?
Per Capita income in Halchita is $14,388.
What is Inequality or Gini Index in Halchita?
Inequality or Gini Index in Halchita is 0.53.
What is the Total Population of Halchita?
Total Population of Halchita is 256.
What is the Total Male Population of Halchita?
Total Male Population of Halchita is 154.
What is the Total Female Population of Halchita?
Total Female Population of Halchita is 102.
What is the Ratio of Males per 100 Females in Halchita?
There are 150.98 Males per 100 Females in Halchita.
What is the Ratio of Females per 100 Males in Halchita?
There are 66.23 Females per 100 Males in Halchita.
What is the Median Population Age in Halchita?
Median Population Age in Halchita is 41.3 Years.
What is the Average Family Size in Halchita
Average Family Size in Halchita is 3.9 People.
What is the Average Household Size in Halchita
Average Household Size in Halchita is 2.7 People.
How Large is the Labor Force in Halchita?
There are 93 People in the Labor Forcein in Halchita.
What is the Percentage of People in the Labor Force in Halchita?
53.1% of People are in the Labor Force in Halchita.