Hatch, UT Map & Demographics
Hatch Map

Hatch Overview
$21,305
PER CAPITA INCOME
$93,125
AVG FAMILY INCOME
$93,125
AVG HOUSEHOLD INCOME
0.21
INEQUALITY / GINI INDEX
131
TOTAL POPULATION
63
MALE POPULATION
68
FEMALE POPULATION
92.65
MALES / 100 FEMALES
107.94
FEMALES / 100 MALES
36.1
MEDIAN AGE
3.7
AVG FAMILY SIZE
3.7
AVG HOUSEHOLD SIZE
43
LABOR FORCE [ PEOPLE ]
54.4%
PERCENT IN LABOR FORCE
16.3%
UNEMPLOYMENT RATE
Hatch Zip Codes
Hatch Area Codes
Income in Hatch
Income Overview in Hatch
Per Capita Income in Hatch is $21,305, while median incomes of families and households are $93,125 and $93,125 respectively.
| Characteristic | Number | Measure |
| Per Capita Income | 131 | $21,305 |
| Median Family Income | 35 | $93,125 |
| Mean Family Income | 35 | $83,534 |
| Median Household Income | 35 | $93,125 |
| Mean Household Income | 35 | $83,534 |
| Income Deficit | 35 | $0 |
| Wage / Income Gap (%) | 131 | 0.00% |
| Wage / Income Gap ($) | 131 | 100.00¢ per $1 |
| Gini / Inequality Index | 131 | 0.21 |
Earnings by Sex in Hatch
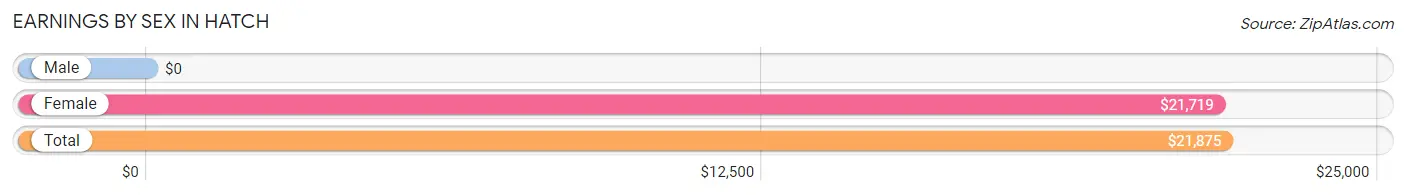
| Sex | Number | Average Earnings |
| Male | 14 (38.9%) | $0 |
| Female | 22 (61.1%) | $21,719 |
| Total | 36 (100.0%) | $21,875 |
Earnings by Sex by Income Bracket in Hatch
The most common earnings brackets in Hatch are $17,500 to $19,999 for men (6 | 42.9%) and $20,000 to $22,499 for women (16 | 72.7%).
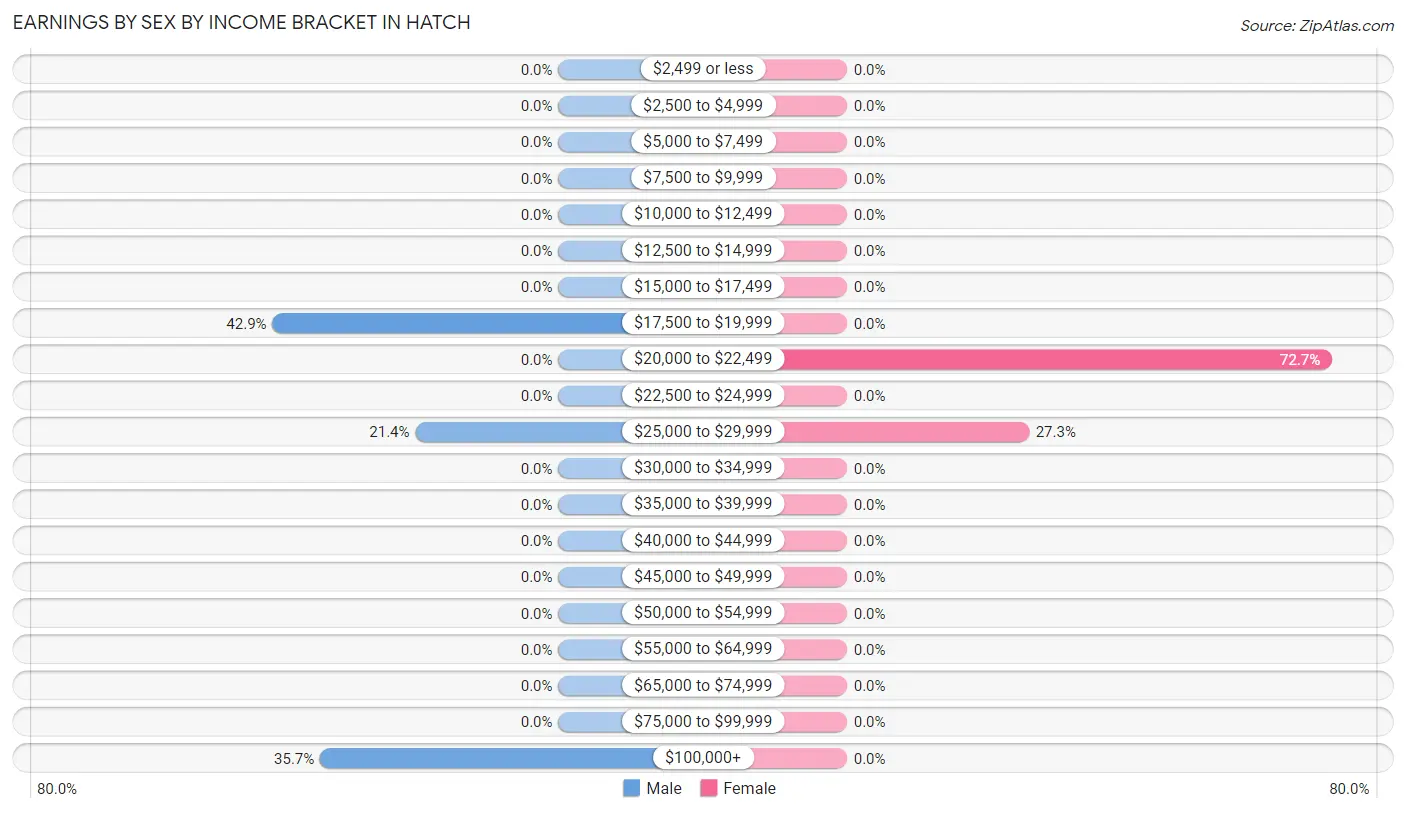
| Income | Male | Female |
| $2,499 or less | 0 (0.0%) | 0 (0.0%) |
| $2,500 to $4,999 | 0 (0.0%) | 0 (0.0%) |
| $5,000 to $7,499 | 0 (0.0%) | 0 (0.0%) |
| $7,500 to $9,999 | 0 (0.0%) | 0 (0.0%) |
| $10,000 to $12,499 | 0 (0.0%) | 0 (0.0%) |
| $12,500 to $14,999 | 0 (0.0%) | 0 (0.0%) |
| $15,000 to $17,499 | 0 (0.0%) | 0 (0.0%) |
| $17,500 to $19,999 | 6 (42.9%) | 0 (0.0%) |
| $20,000 to $22,499 | 0 (0.0%) | 16 (72.7%) |
| $22,500 to $24,999 | 0 (0.0%) | 0 (0.0%) |
| $25,000 to $29,999 | 3 (21.4%) | 6 (27.3%) |
| $30,000 to $34,999 | 0 (0.0%) | 0 (0.0%) |
| $35,000 to $39,999 | 0 (0.0%) | 0 (0.0%) |
| $40,000 to $44,999 | 0 (0.0%) | 0 (0.0%) |
| $45,000 to $49,999 | 0 (0.0%) | 0 (0.0%) |
| $50,000 to $54,999 | 0 (0.0%) | 0 (0.0%) |
| $55,000 to $64,999 | 0 (0.0%) | 0 (0.0%) |
| $65,000 to $74,999 | 0 (0.0%) | 0 (0.0%) |
| $75,000 to $99,999 | 0 (0.0%) | 0 (0.0%) |
| $100,000+ | 5 (35.7%) | 0 (0.0%) |
| Total | 14 (100.0%) | 22 (100.0%) |
Earnings by Sex by Educational Attainment in Hatch
| Educational Attainment | Male Income | Female Income |
| Less than High School | - | - |
| High School Diploma | - | - |
| College or Associate's Degree | - | - |
| Bachelor's Degree | - | - |
| Graduate Degree | - | - |
| Total | - | - |
Family Income in Hatch
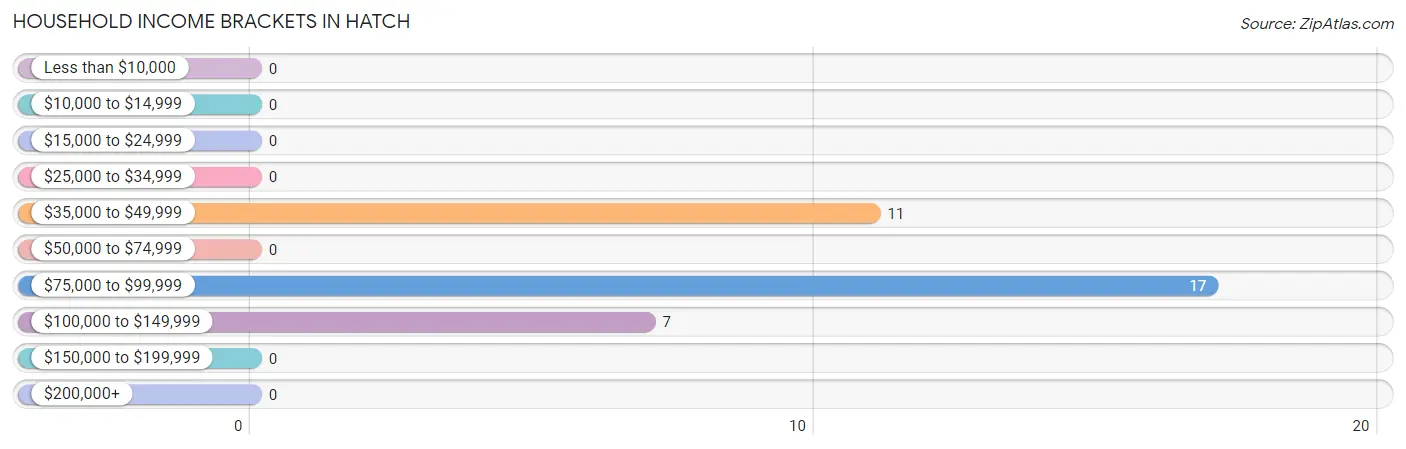
Family Income Brackets in Hatch
According to the Hatch family income data, there are 17 families falling into the $75,000 to $99,999 income range, which is the most common income bracket and makes up 48.6% of all families.
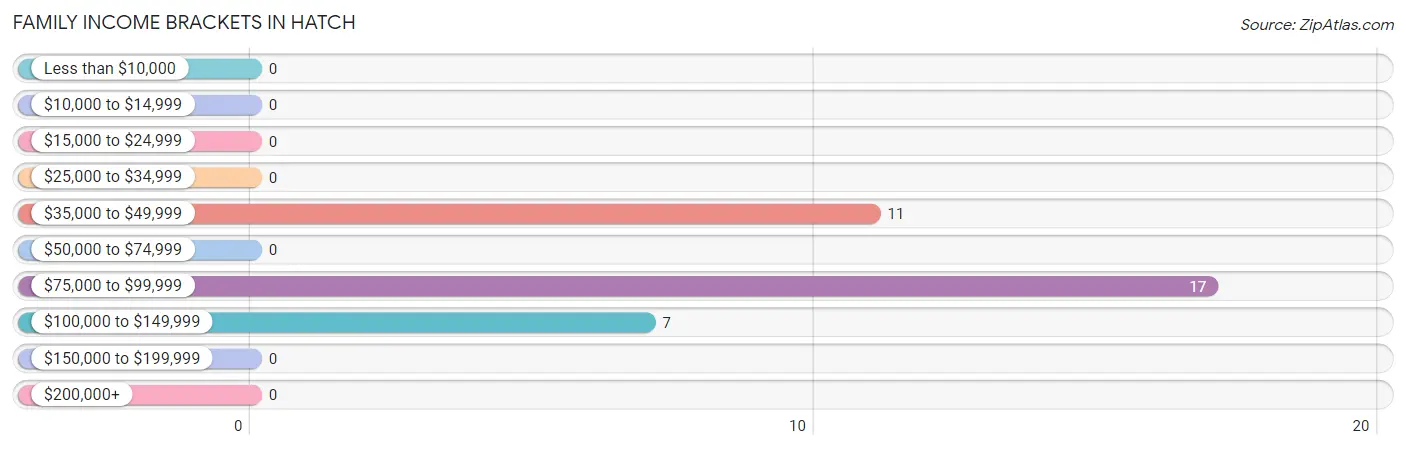
| Income Bracket | # Families | % Families |
| Less than $10,000 | 0 | 0.0% |
| $10,000 to $14,999 | 0 | 0.0% |
| $15,000 to $24,999 | 0 | 0.0% |
| $25,000 to $34,999 | 0 | 0.0% |
| $35,000 to $49,999 | 11 | 31.4% |
| $50,000 to $74,999 | 0 | 0.0% |
| $75,000 to $99,999 | 17 | 48.6% |
| $100,000 to $149,999 | 7 | 20.0% |
| $150,000 to $199,999 | 0 | 0.0% |
| $200,000+ | 0 | 0.0% |
Family Income by Famaliy Size in Hatch
2-person families (17 | 48.6%) account for the highest median family income in Hatch with $93,958 per family, while 2-person families (17 | 48.6%) have the highest median income of $46,979 per family member.
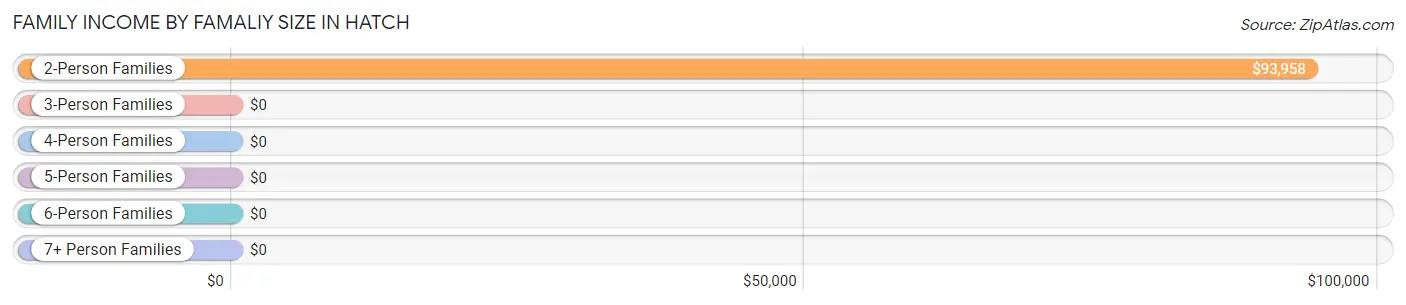
| Income Bracket | # Families | Median Income |
| 2-Person Families | 17 (48.6%) | $93,958 |
| 3-Person Families | 7 (20.0%) | $0 |
| 4-Person Families | 0 (0.0%) | $0 |
| 5-Person Families | 0 (0.0%) | $0 |
| 6-Person Families | 4 (11.4%) | $0 |
| 7+ Person Families | 7 (20.0%) | $0 |
| Total | 35 (100.0%) | $93,125 |
Family Income by Number of Earners in Hatch
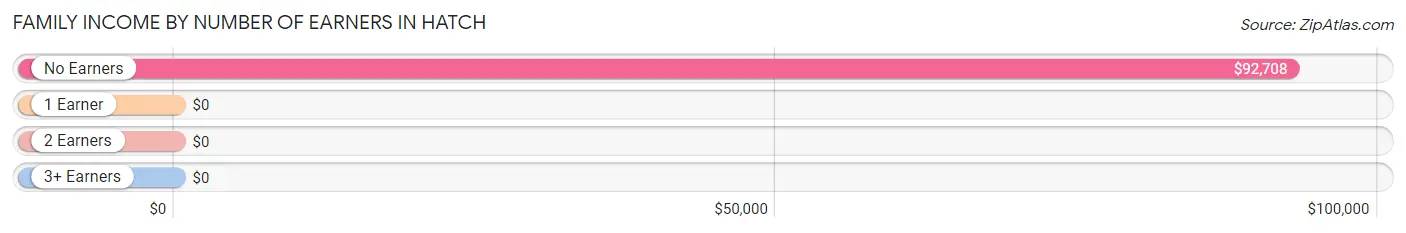
| Number of Earners | # Families | Median Income |
| No Earners | 11 (31.4%) | $92,708 |
| 1 Earner | 13 (37.1%) | $0 |
| 2 Earners | 11 (31.4%) | $0 |
| 3+ Earners | 0 (0.0%) | $0 |
| Total | 35 (100.0%) | $93,125 |
Household Income in Hatch
Household Income Brackets in Hatch
With 17 households falling in the category, the $75,000 to $99,999 income range is the most frequent in Hatch, accounting for 48.6% of all households.
| Income Bracket | # Households | % Households |
| Less than $10,000 | 0 | 0.0% |
| $10,000 to $14,999 | 0 | 0.0% |
| $15,000 to $24,999 | 0 | 0.0% |
| $25,000 to $34,999 | 0 | 0.0% |
| $35,000 to $49,999 | 11 | 31.4% |
| $50,000 to $74,999 | 0 | 0.0% |
| $75,000 to $99,999 | 17 | 48.6% |
| $100,000 to $149,999 | 7 | 20.0% |
| $150,000 to $199,999 | 0 | 0.0% |
| $200,000+ | 0 | 0.0% |
Household Income by Householder Age in Hatch
The median household income in Hatch is $93,125, with the highest median household income of $80,833 found in the 45 to 64 years age bracket for the primary householder. A total of 16 households (45.7%) fall into this category.
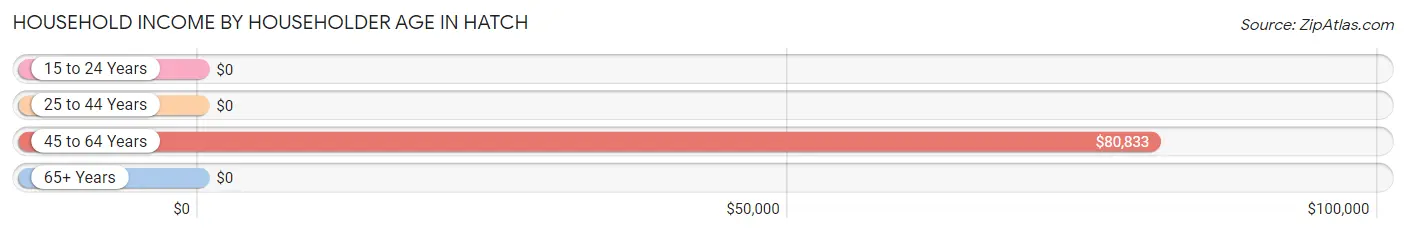
| Income Bracket | # Households | Median Income |
| 15 to 24 Years | 0 (0.0%) | $0 |
| 25 to 44 Years | 11 (31.4%) | $0 |
| 45 to 64 Years | 16 (45.7%) | $80,833 |
| 65+ Years | 8 (22.9%) | $0 |
| Total | 35 (100.0%) | $93,125 |
Poverty in Hatch
Income Below Poverty by Sex and Age in Hatch
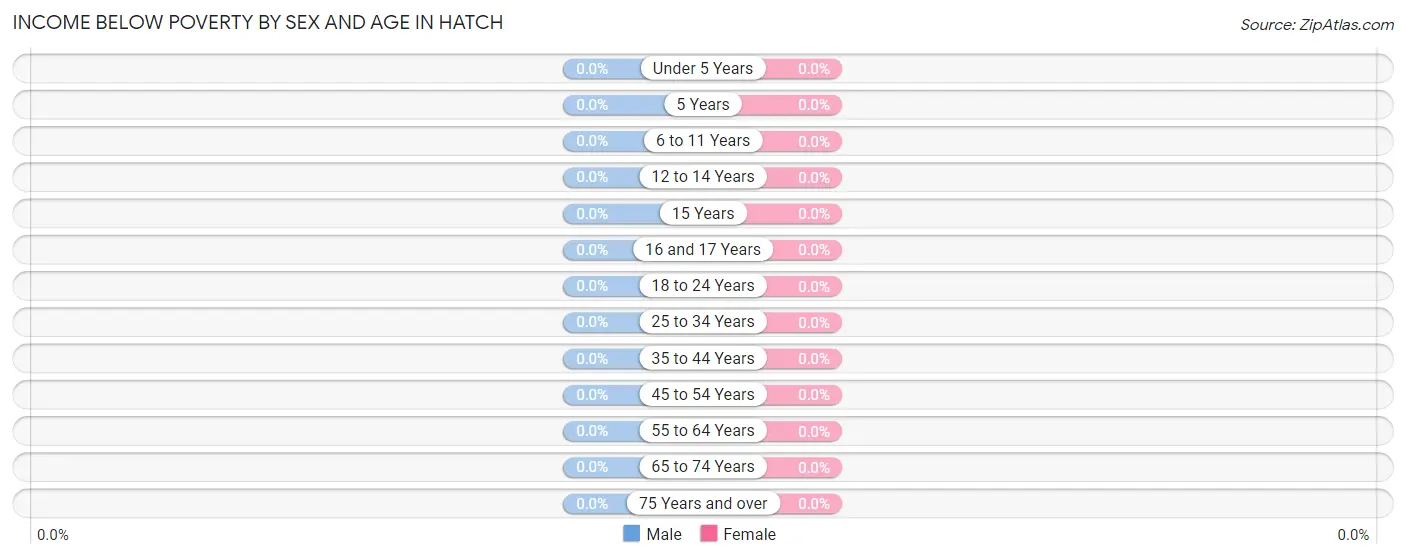
| Age Bracket | Male | Female |
| Under 5 Years | 0 (0.0%) | 0 (0.0%) |
| 5 Years | 0 (0.0%) | 0 (0.0%) |
| 6 to 11 Years | 0 (0.0%) | 0 (0.0%) |
| 12 to 14 Years | 0 (0.0%) | 0 (0.0%) |
| 15 Years | 0 (0.0%) | 0 (0.0%) |
| 16 and 17 Years | 0 (0.0%) | 0 (0.0%) |
| 18 to 24 Years | 0 (0.0%) | 0 (0.0%) |
| 25 to 34 Years | 0 (0.0%) | 0 (0.0%) |
| 35 to 44 Years | 0 (0.0%) | 0 (0.0%) |
| 45 to 54 Years | 0 (0.0%) | 0 (0.0%) |
| 55 to 64 Years | 0 (0.0%) | 0 (0.0%) |
| 65 to 74 Years | 0 (0.0%) | 0 (0.0%) |
| 75 Years and over | 0 (0.0%) | 0 (0.0%) |
| Total | 0 (0.0%) | 0 (0.0%) |
Income Above Poverty by Sex and Age in Hatch
According to the poverty statistics in Hatch, males aged under 5 years and females aged 6 to 11 years are the age groups that are most secure financially, with 100.0% of males and 100.0% of females in these age groups living above the poverty line.
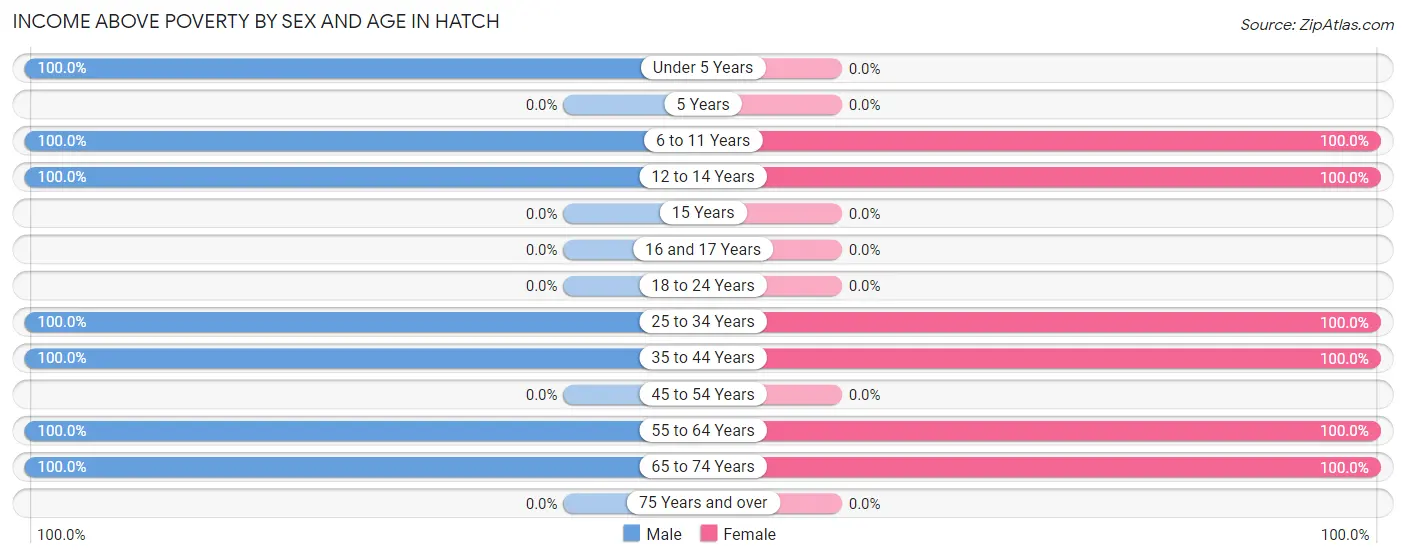
| Age Bracket | Male | Female |
| Under 5 Years | 12 (100.0%) | 0 (0.0%) |
| 5 Years | 0 (0.0%) | 0 (0.0%) |
| 6 to 11 Years | 6 (100.0%) | 16 (100.0%) |
| 12 to 14 Years | 6 (100.0%) | 12 (100.0%) |
| 15 Years | 0 (0.0%) | 0 (0.0%) |
| 16 and 17 Years | 0 (0.0%) | 0 (0.0%) |
| 18 to 24 Years | 0 (0.0%) | 0 (0.0%) |
| 25 to 34 Years | 6 (100.0%) | 7 (100.0%) |
| 35 to 44 Years | 8 (100.0%) | 4 (100.0%) |
| 45 to 54 Years | 0 (0.0%) | 0 (0.0%) |
| 55 to 64 Years | 17 (100.0%) | 21 (100.0%) |
| 65 to 74 Years | 8 (100.0%) | 8 (100.0%) |
| 75 Years and over | 0 (0.0%) | 0 (0.0%) |
| Total | 63 (100.0%) | 68 (100.0%) |
Income Below Poverty Among Married-Couple Families in Hatch
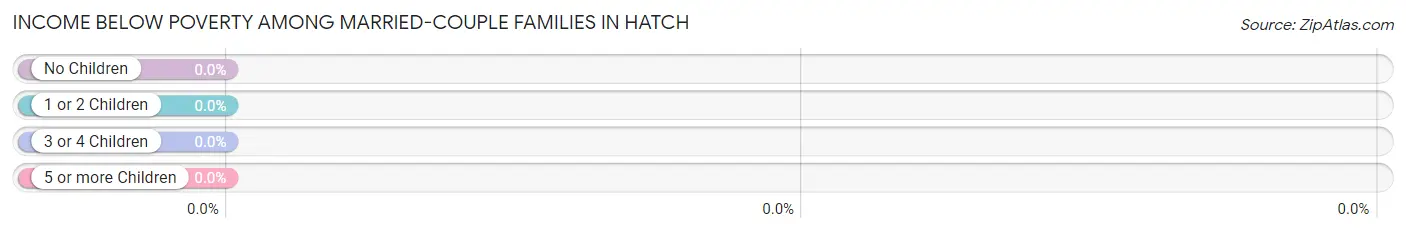
| Children | Above Poverty | Below Poverty |
| No Children | 24 (100.0%) | 0 (0.0%) |
| 1 or 2 Children | 0 (0.0%) | 0 (0.0%) |
| 3 or 4 Children | 4 (100.0%) | 0 (0.0%) |
| 5 or more Children | 7 (100.0%) | 0 (0.0%) |
| Total | 35 (100.0%) | 0 (0.0%) |
Income Below Poverty Among Single-Parent Households in Hatch
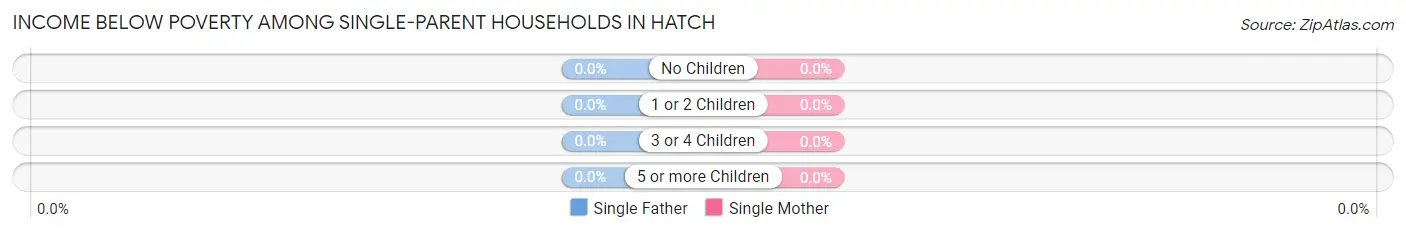
| Children | Single Father | Single Mother |
| No Children | 0 (0.0%) | 0 (0.0%) |
| 1 or 2 Children | 0 (0.0%) | 0 (0.0%) |
| 3 or 4 Children | 0 (0.0%) | 0 (0.0%) |
| 5 or more Children | 0 (0.0%) | 0 (0.0%) |
| Total | 0 (0.0%) | 0 (0.0%) |
Income Below Poverty Among Married-Couple vs Single-Parent Households in Hatch
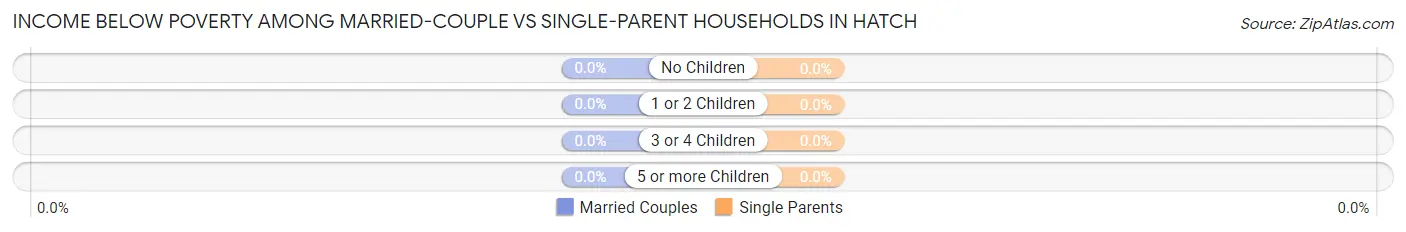
| Children | Married-Couple Families | Single-Parent Households |
| No Children | 0 (0.0%) | 0 (0.0%) |
| 1 or 2 Children | 0 (0.0%) | 0 (0.0%) |
| 3 or 4 Children | 0 (0.0%) | 0 (0.0%) |
| 5 or more Children | 0 (0.0%) | 0 (0.0%) |
| Total | 0 (0.0%) | 0 (0.0%) |
Race in Hatch
The most populous races in Hatch are White / Caucasian (106 | 80.9%), Two or more Races (25 | 19.1%), and Hispanic or Latino (18 | 13.7%).
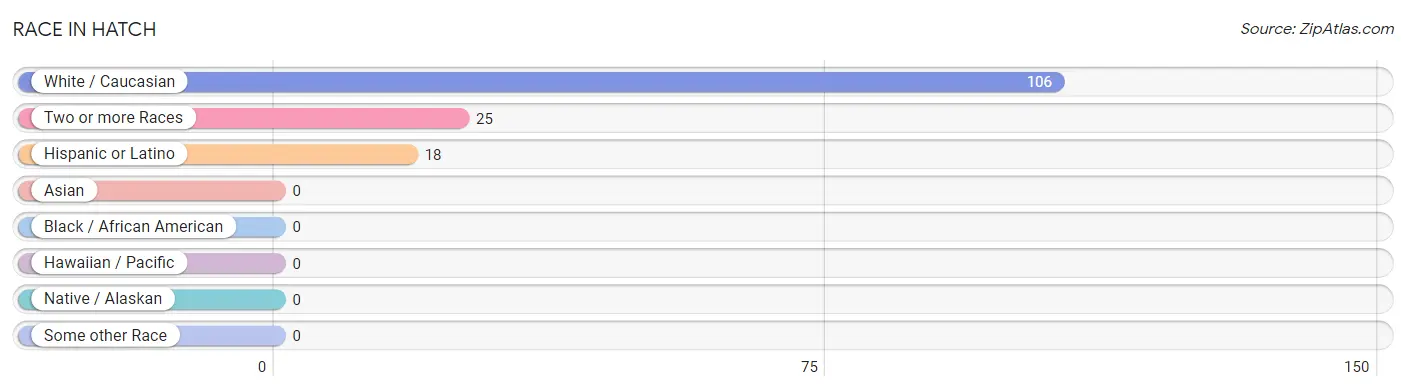
| Race | # Population | % Population |
| Asian | 0 | 0.0% |
| Black / African American | 0 | 0.0% |
| Hawaiian / Pacific | 0 | 0.0% |
| Hispanic or Latino | 18 | 13.7% |
| Native / Alaskan | 0 | 0.0% |
| White / Caucasian | 106 | 80.9% |
| Two or more Races | 25 | 19.1% |
| Some other Race | 0 | 0.0% |
| Total | 131 | 100.0% |
Ancestry in Hatch
The most populous ancestries reported in Hatch are English (69 | 52.7%), American (25 | 19.1%), German (24 | 18.3%), Mexican (18 | 13.7%), and Indian (Asian) (7 | 5.3%), together accounting for 109.1% of all Hatch residents.
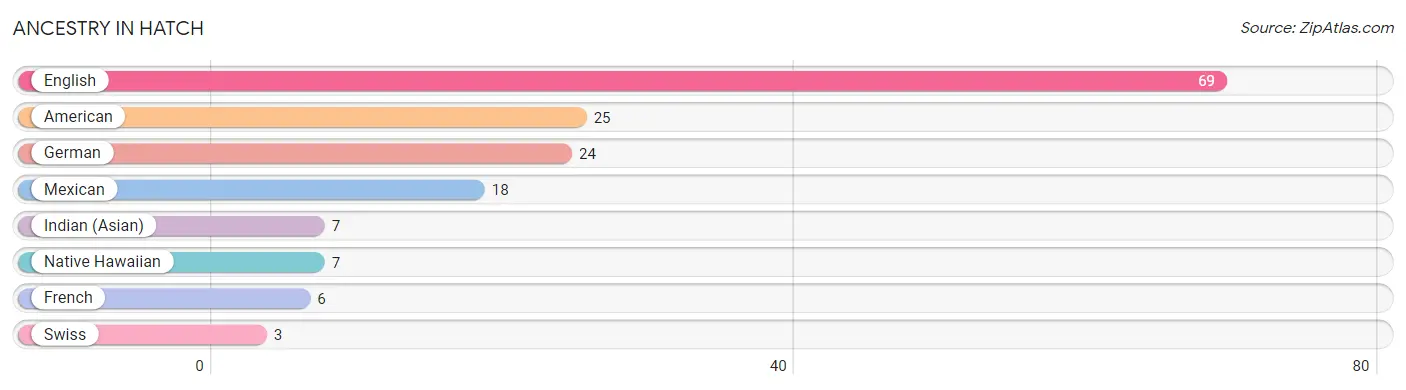
| Ancestry | # Population | % Population |
| American | 25 | 19.1% |
| English | 69 | 52.7% |
| French | 6 | 4.6% |
| German | 24 | 18.3% |
| Indian (Asian) | 7 | 5.3% |
| Mexican | 18 | 13.7% |
| Native Hawaiian | 7 | 5.3% |
| Swiss | 3 | 2.3% | View All 8 Rows |
Immigrants in Hatch

| Immigration Origin | # Population | % Population | View All 0 Rows |
Sex and Age in Hatch
Sex and Age in Hatch
The most populous age groups in Hatch are Under 5 Years (12 | 19.1%) for men and 10 to 14 Years (17 | 25.0%) for women.
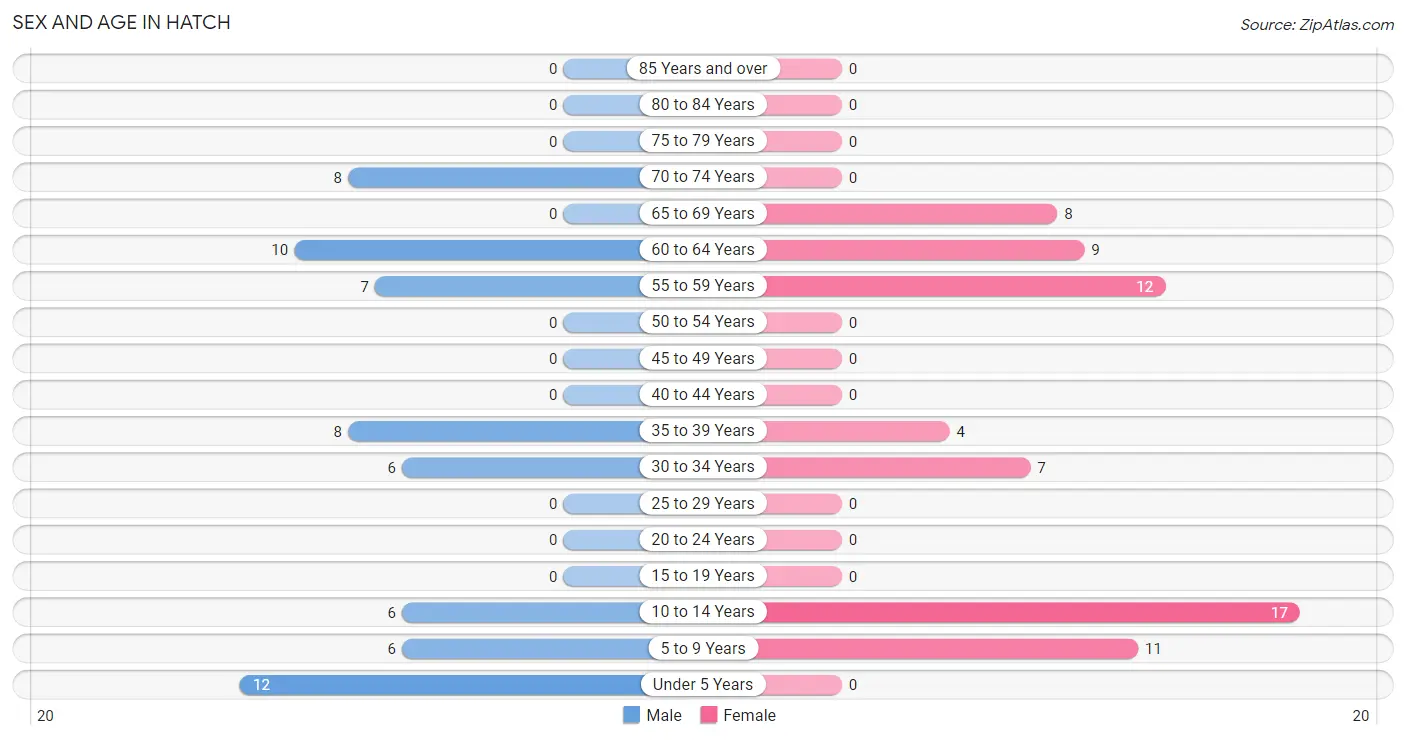
| Age Bracket | Male | Female |
| Under 5 Years | 12 (19.1%) | 0 (0.0%) |
| 5 to 9 Years | 6 (9.5%) | 11 (16.2%) |
| 10 to 14 Years | 6 (9.5%) | 17 (25.0%) |
| 15 to 19 Years | 0 (0.0%) | 0 (0.0%) |
| 20 to 24 Years | 0 (0.0%) | 0 (0.0%) |
| 25 to 29 Years | 0 (0.0%) | 0 (0.0%) |
| 30 to 34 Years | 6 (9.5%) | 7 (10.3%) |
| 35 to 39 Years | 8 (12.7%) | 4 (5.9%) |
| 40 to 44 Years | 0 (0.0%) | 0 (0.0%) |
| 45 to 49 Years | 0 (0.0%) | 0 (0.0%) |
| 50 to 54 Years | 0 (0.0%) | 0 (0.0%) |
| 55 to 59 Years | 7 (11.1%) | 12 (17.6%) |
| 60 to 64 Years | 10 (15.9%) | 9 (13.2%) |
| 65 to 69 Years | 0 (0.0%) | 8 (11.8%) |
| 70 to 74 Years | 8 (12.7%) | 0 (0.0%) |
| 75 to 79 Years | 0 (0.0%) | 0 (0.0%) |
| 80 to 84 Years | 0 (0.0%) | 0 (0.0%) |
| 85 Years and over | 0 (0.0%) | 0 (0.0%) |
| Total | 63 (100.0%) | 68 (100.0%) |
Families and Households in Hatch
Median Family Size in Hatch
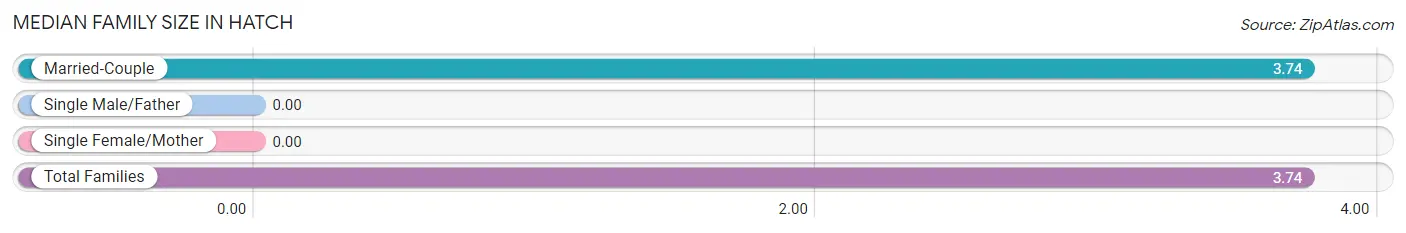
| Family Type | # Families | Family Size |
| Married-Couple | 35 (100.0%) | 3.74 |
| Single Male/Father | 0 (0.0%) | - |
| Single Female/Mother | 0 (0.0%) | - |
| Total Families | 35 (100.0%) | 3.74 |
Median Household Size in Hatch
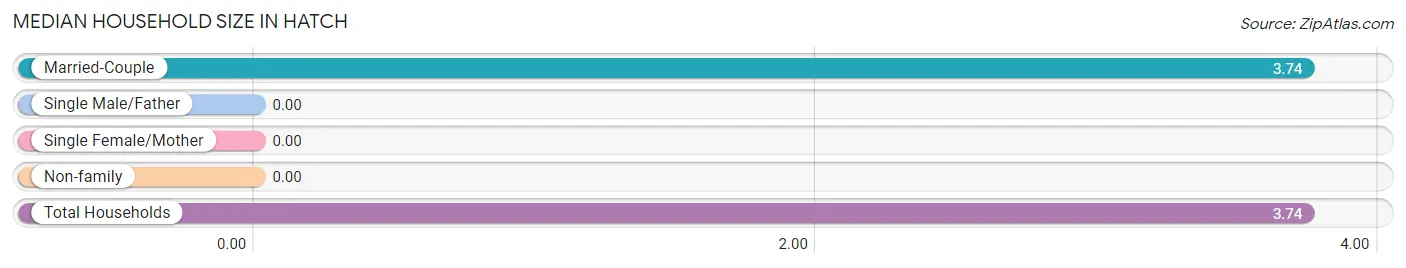
| Household Type | # Households | Household Size |
| Married-Couple | 35 (100.0%) | 3.74 |
| Single Male/Father | 0 (0.0%) | - |
| Single Female/Mother | 0 (0.0%) | - |
| Non-family | 0 (0.0%) | - |
| Total Households | 35 (100.0%) | 3.74 |
Household Size by Marriage Status in Hatch
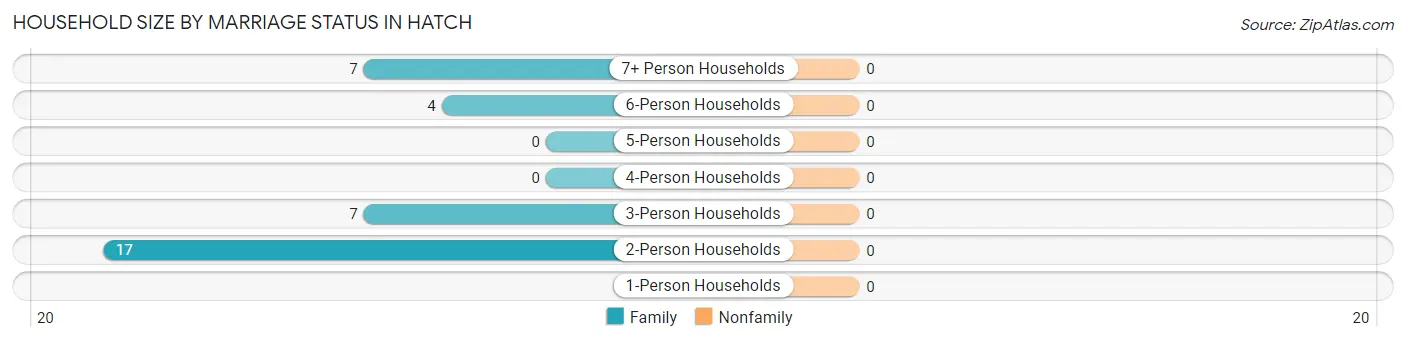
| Household Size | Family Households | Nonfamily Households |
| 1-Person Households | - | 0 (0.0%) |
| 2-Person Households | 17 (48.6%) | 0 (0.0%) |
| 3-Person Households | 7 (20.0%) | 0 (0.0%) |
| 4-Person Households | 0 (0.0%) | 0 (0.0%) |
| 5-Person Households | 0 (0.0%) | 0 (0.0%) |
| 6-Person Households | 4 (11.4%) | 0 (0.0%) |
| 7+ Person Households | 7 (20.0%) | 0 (0.0%) |
| Total | 35 (100.0%) | 0 (0.0%) |
Female Fertility in Hatch
Fertility by Age in Hatch
Average fertility rate in Hatch is 364.0 births per 1,000 women. Women in the age bracket of 35 to 50 years have the highest fertility rate with 1,000.0 births per 1,000 women. Women in the age bracket of 35 to 50 years acount for 100.0% of all women with births.
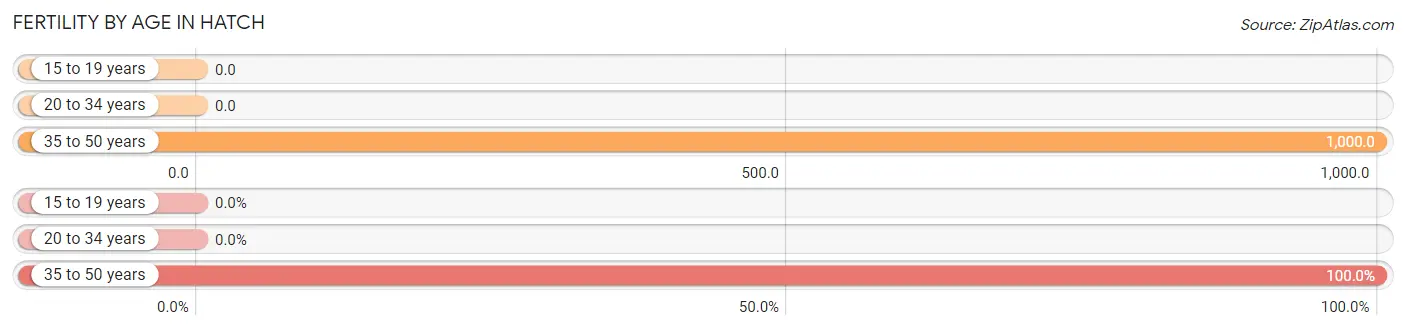
| Age Bracket | Women with Births | Births / 1,000 Women |
| 15 to 19 years | 0 (0.0%) | 0.0 |
| 20 to 34 years | 0 (0.0%) | 0.0 |
| 35 to 50 years | 4 (100.0%) | 1,000.0 |
| Total | 4 (100.0%) | 364.0 |
Fertility by Age by Marriage Status in Hatch
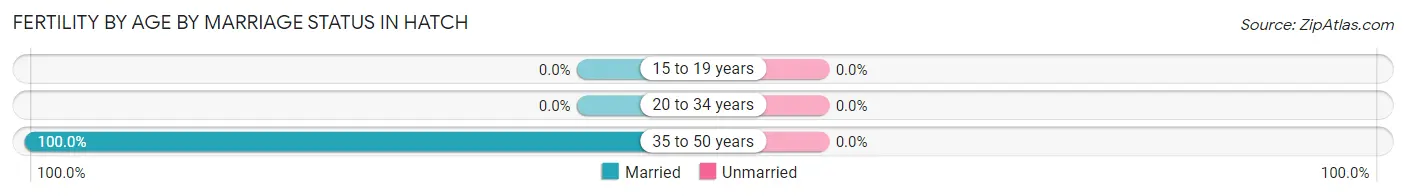
| Age Bracket | Married | Unmarried |
| 15 to 19 years | 0 (0.0%) | 0 (0.0%) |
| 20 to 34 years | 0 (0.0%) | 0 (0.0%) |
| 35 to 50 years | 4 (100.0%) | 0 (0.0%) |
| Total | 4 (100.0%) | 0 (0.0%) |
Fertility by Education in Hatch
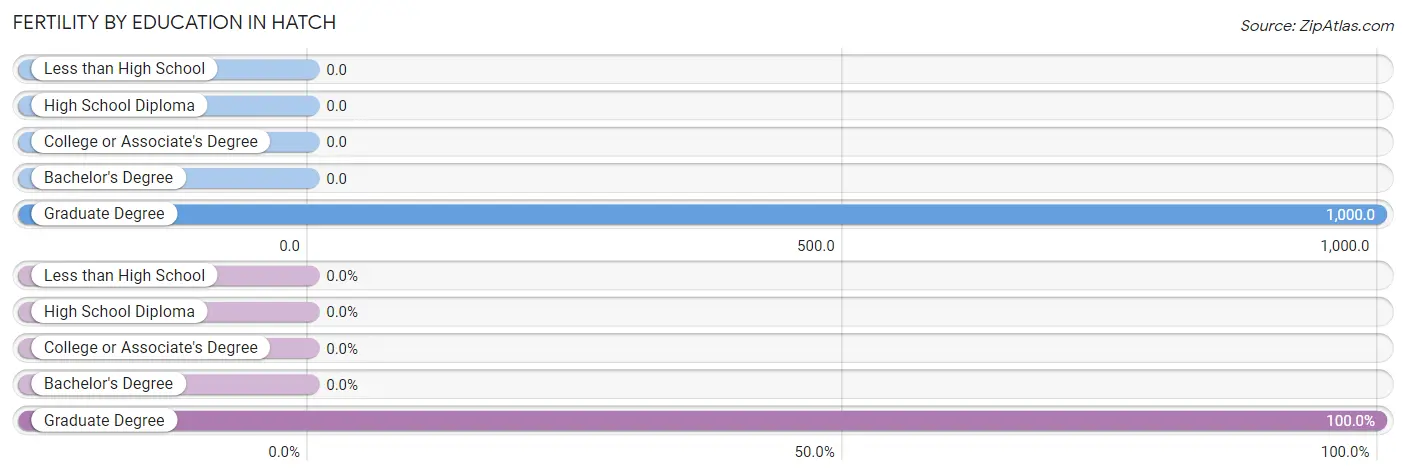
| Educational Attainment | Women with Births | Births / 1,000 Women |
| Less than High School | 0 (0.0%) | 0.0 |
| High School Diploma | 0 (0.0%) | 0.0 |
| College or Associate's Degree | 0 (0.0%) | 0.0 |
| Bachelor's Degree | 0 (0.0%) | 0.0 |
| Graduate Degree | 4 (100.0%) | 1,000.0 |
| Total | 4 (100.0%) | 364.0 |
Fertility by Education by Marriage Status in Hatch
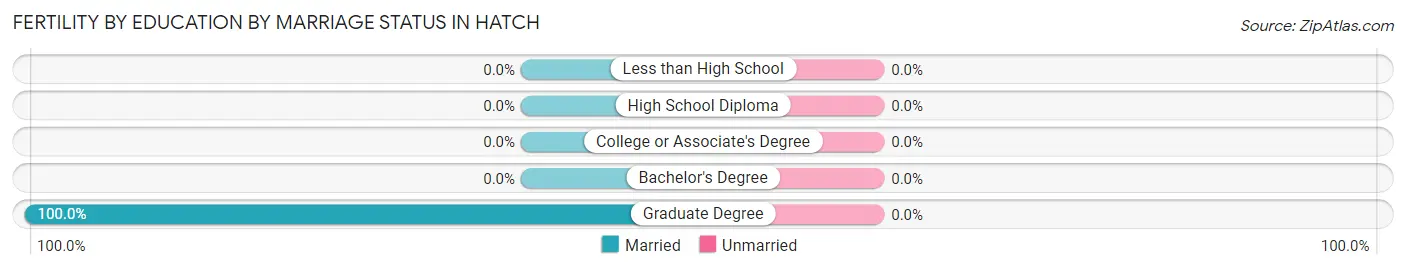
| Educational Attainment | Married | Unmarried |
| Less than High School | 0 (0.0%) | 0 (0.0%) |
| High School Diploma | 0 (0.0%) | 0 (0.0%) |
| College or Associate's Degree | 0 (0.0%) | 0 (0.0%) |
| Bachelor's Degree | 0 (0.0%) | 0 (0.0%) |
| Graduate Degree | 4 (100.0%) | 0 (0.0%) |
| Total | 4 (100.0%) | 0 (0.0%) |
Employment Characteristics in Hatch
Employment by Class of Employer in Hatch
Among the 36 employed individuals in Hatch, private company employees (24 | 66.7%), self-employed (not incorporated) (8 | 22.2%), and not-for-profit organizations (4 | 11.1%) make up the most common classes of employment.
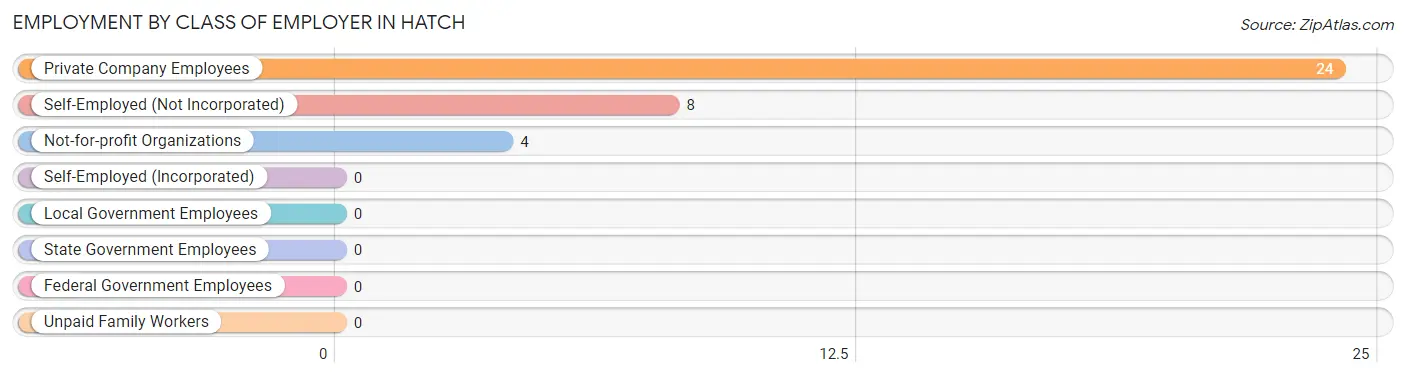
| Employer Class | # Employees | % Employees |
| Private Company Employees | 24 | 66.7% |
| Self-Employed (Incorporated) | 0 | 0.0% |
| Self-Employed (Not Incorporated) | 8 | 22.2% |
| Not-for-profit Organizations | 4 | 11.1% |
| Local Government Employees | 0 | 0.0% |
| State Government Employees | 0 | 0.0% |
| Federal Government Employees | 0 | 0.0% |
| Unpaid Family Workers | 0 | 0.0% |
| Total | 36 | 100.0% |
Employment Status by Age in Hatch
According to the labor force statistics for Hatch, out of the total population over 16 years of age (79), 54.4% or 43 individuals are in the labor force, with 16.3% or 7 of them unemployed. The age group with the highest labor force participation rate is 35 to 44 years, with 100.0% or 12 individuals in the labor force. Within the labor force, the 55 to 59 years age range has the highest percentage of unemployed individuals, with 36.8% or 7 of them being unemployed.
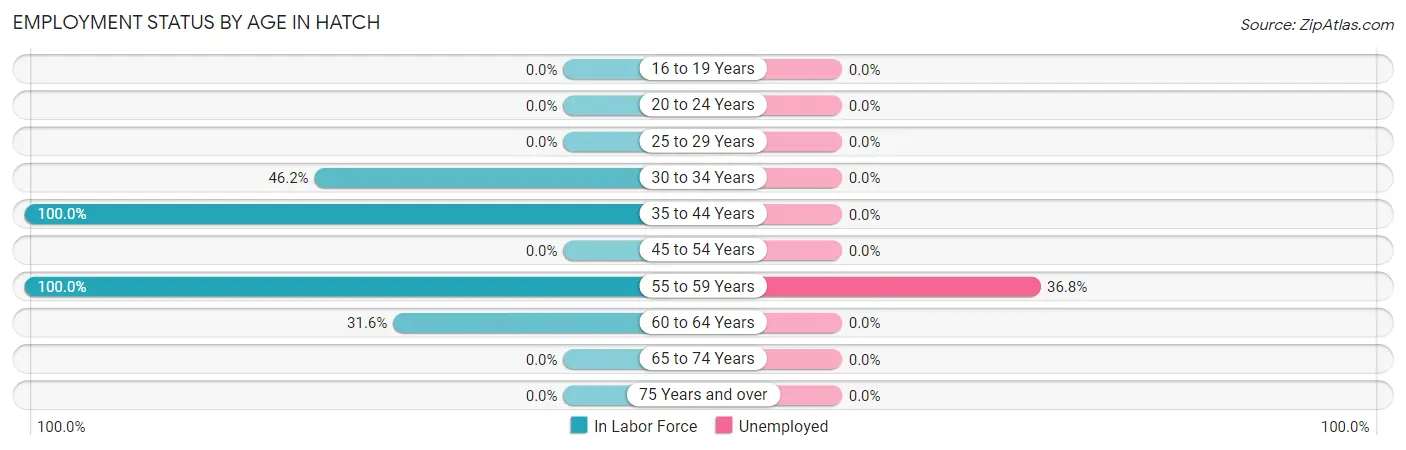
| Age Bracket | In Labor Force | Unemployed |
| 16 to 19 Years | 0 (0.0%) | 0 (0.0%) |
| 20 to 24 Years | 0 (0.0%) | 0 (0.0%) |
| 25 to 29 Years | 0 (0.0%) | 0 (0.0%) |
| 30 to 34 Years | 6 (46.2%) | 0 (0.0%) |
| 35 to 44 Years | 12 (100.0%) | 0 (0.0%) |
| 45 to 54 Years | 0 (0.0%) | 0 (0.0%) |
| 55 to 59 Years | 19 (100.0%) | 7 (36.8%) |
| 60 to 64 Years | 6 (31.6%) | 0 (0.0%) |
| 65 to 74 Years | 0 (0.0%) | 0 (0.0%) |
| 75 Years and over | 0 (0.0%) | 0 (0.0%) |
| Total | 43 (54.4%) | 7 (16.3%) |
Employment Status by Educational Attainment in Hatch
According to labor force statistics for Hatch, 68.3% of individuals (43) out of the total population between 25 and 64 years of age (63) are in the labor force, with 16.3% or 7 of them being unemployed. The group with the highest labor force participation rate are those with the educational attainment of less than high school, with 100.0% or 18 individuals in the labor force. Within the labor force, individuals with high school diploma education have the highest percentage of unemployment, with 58.3% or 7 of them being unemployed.
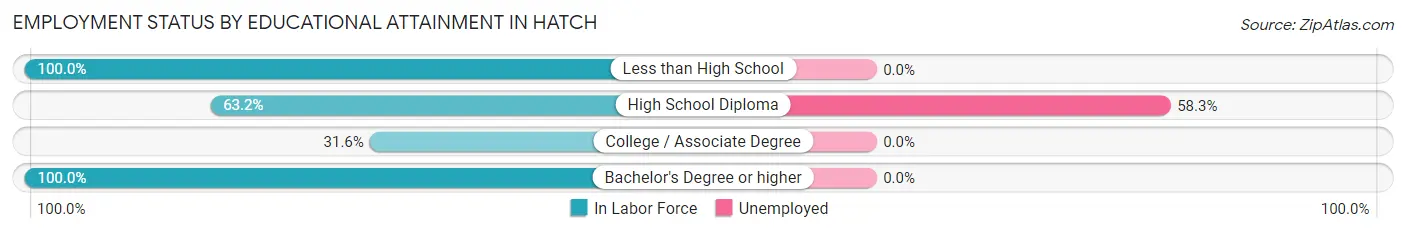
| Educational Attainment | In Labor Force | Unemployed |
| Less than High School | 18 (100.0%) | 0 (0.0%) |
| High School Diploma | 12 (63.2%) | 11 (58.3%) |
| College / Associate Degree | 6 (31.6%) | 0 (0.0%) |
| Bachelor's Degree or higher | 7 (100.0%) | 0 (0.0%) |
| Total | 43 (68.3%) | 10 (16.3%) |
Employment Occupations by Sex in Hatch
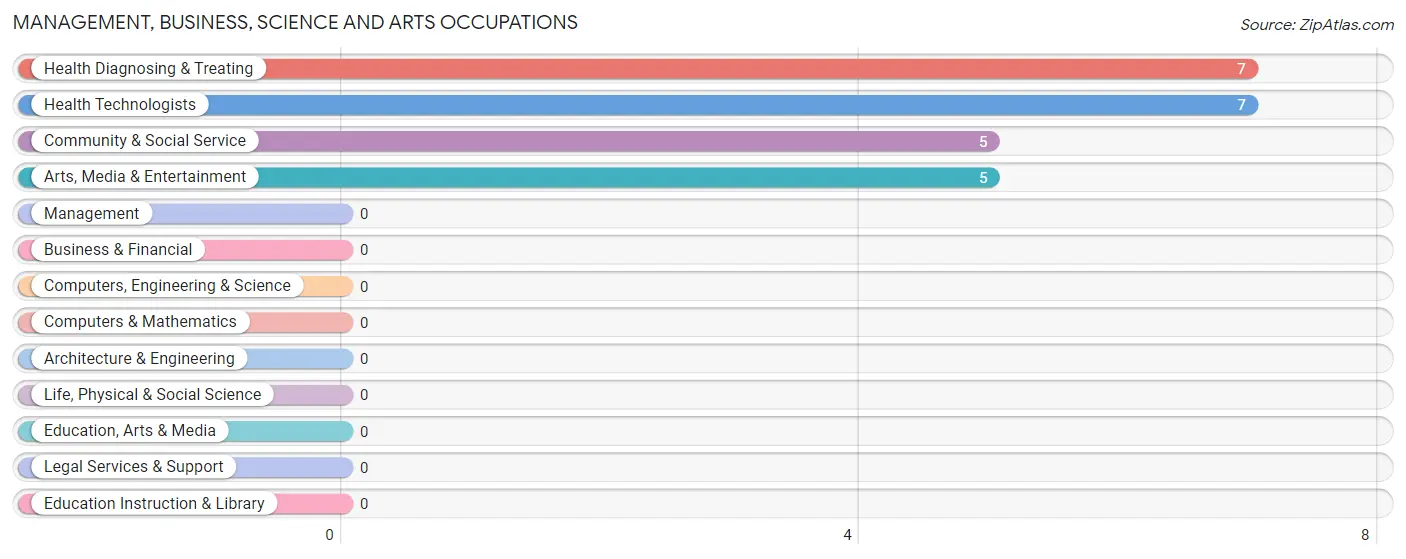
Management, Business, Science and Arts Occupations
The most common Management, Business, Science and Arts occupations in Hatch are Health Diagnosing & Treating (7 | 19.4%), Health Technologists (7 | 19.4%), Community & Social Service (5 | 13.9%), and Arts, Media & Entertainment (5 | 13.9%).
Management, Business, Science and Arts Occupations by Sex
Within the Management, Business, Science and Arts occupations in Hatch, the most male-oriented occupations are Community & Social Service (100.0%), Arts, Media & Entertainment (100.0%), and Health Diagnosing & Treating (42.9%), while the most female-oriented occupations are Health Diagnosing & Treating (57.1%), and Health Technologists (57.1%).
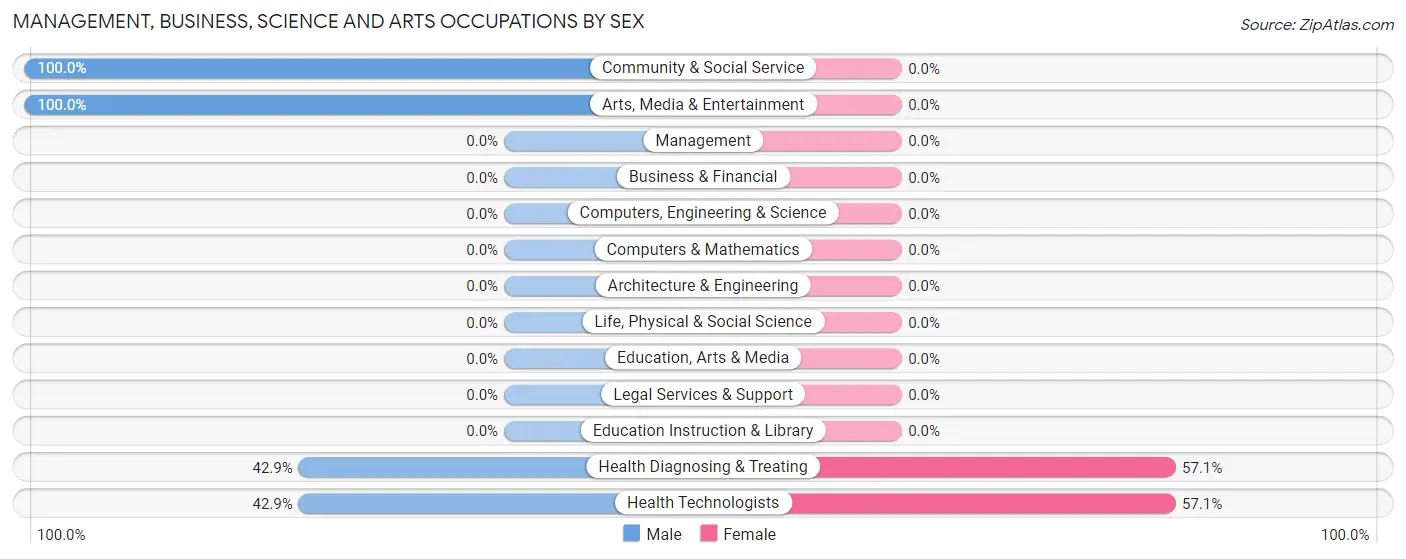
| Occupation | Male | Female |
| Management | 0 (0.0%) | 0 (0.0%) |
| Business & Financial | 0 (0.0%) | 0 (0.0%) |
| Computers, Engineering & Science | 0 (0.0%) | 0 (0.0%) |
| Computers & Mathematics | 0 (0.0%) | 0 (0.0%) |
| Architecture & Engineering | 0 (0.0%) | 0 (0.0%) |
| Life, Physical & Social Science | 0 (0.0%) | 0 (0.0%) |
| Community & Social Service | 5 (100.0%) | 0 (0.0%) |
| Education, Arts & Media | 0 (0.0%) | 0 (0.0%) |
| Legal Services & Support | 0 (0.0%) | 0 (0.0%) |
| Education Instruction & Library | 0 (0.0%) | 0 (0.0%) |
| Arts, Media & Entertainment | 5 (100.0%) | 0 (0.0%) |
| Health Diagnosing & Treating | 3 (42.9%) | 4 (57.1%) |
| Health Technologists | 3 (42.9%) | 4 (57.1%) |
| Total (Category) | 8 (66.7%) | 4 (33.3%) |
| Total (Overall) | 14 (38.9%) | 22 (61.1%) |
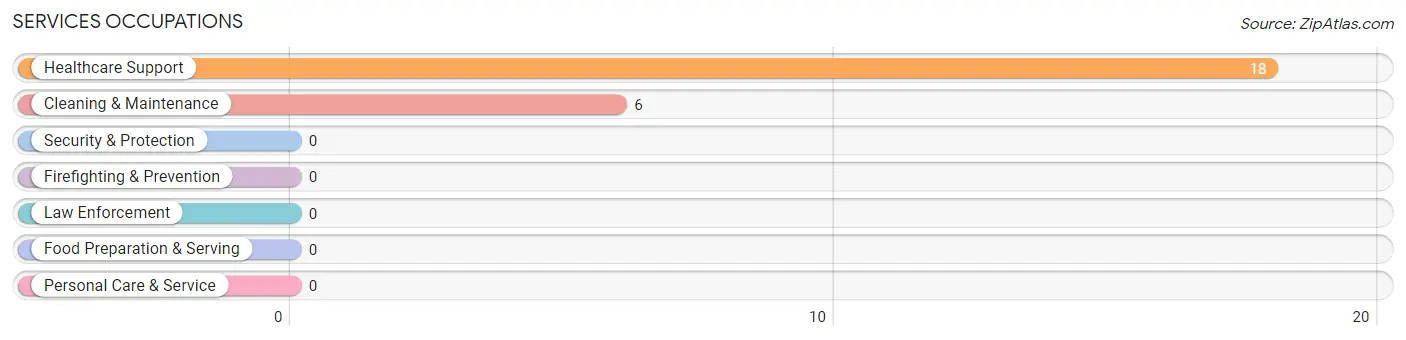
Services Occupations
The most common Services occupations in Hatch are Healthcare Support (18 | 50.0%), and Cleaning & Maintenance (6 | 16.7%).
Services Occupations by Sex
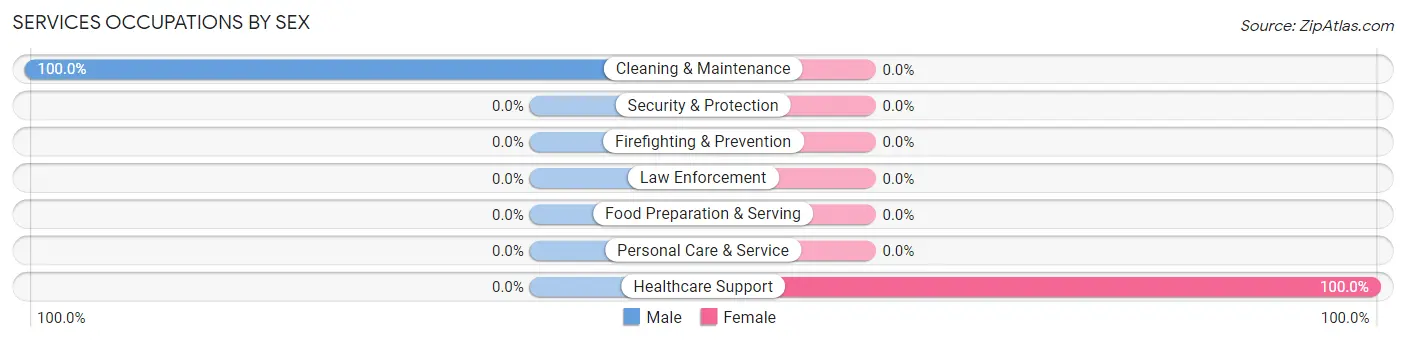
| Occupation | Male | Female |
| Healthcare Support | 0 (0.0%) | 18 (100.0%) |
| Security & Protection | 0 (0.0%) | 0 (0.0%) |
| Firefighting & Prevention | 0 (0.0%) | 0 (0.0%) |
| Law Enforcement | 0 (0.0%) | 0 (0.0%) |
| Food Preparation & Serving | 0 (0.0%) | 0 (0.0%) |
| Cleaning & Maintenance | 6 (100.0%) | 0 (0.0%) |
| Personal Care & Service | 0 (0.0%) | 0 (0.0%) |
| Total (Category) | 6 (25.0%) | 18 (75.0%) |
| Total (Overall) | 14 (38.9%) | 22 (61.1%) |
Sales and Office Occupations
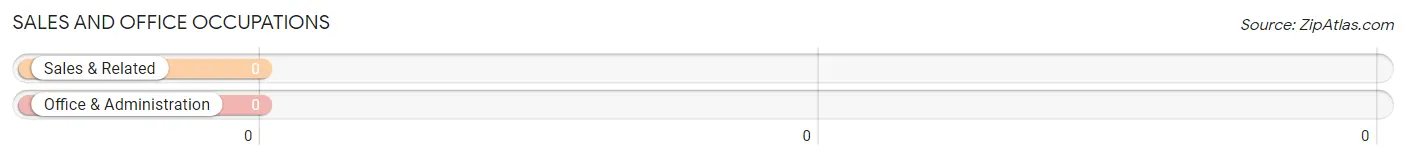
Sales and Office Occupations by Sex
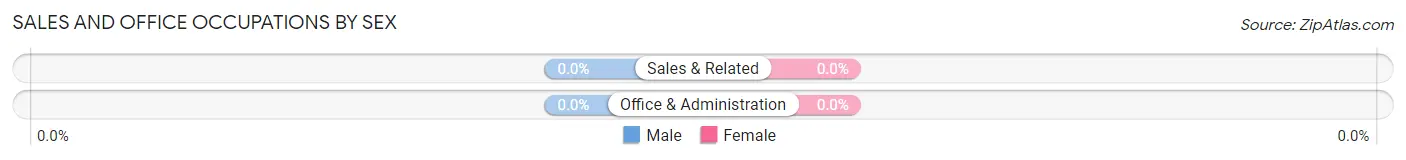
| Occupation | Male | Female |
| Sales & Related | 0 (0.0%) | 0 (0.0%) |
| Office & Administration | 0 (0.0%) | 0 (0.0%) |
| Total (Category) | 0 (0.0%) | 0 (0.0%) |
| Total (Overall) | 14 (38.9%) | 22 (61.1%) |
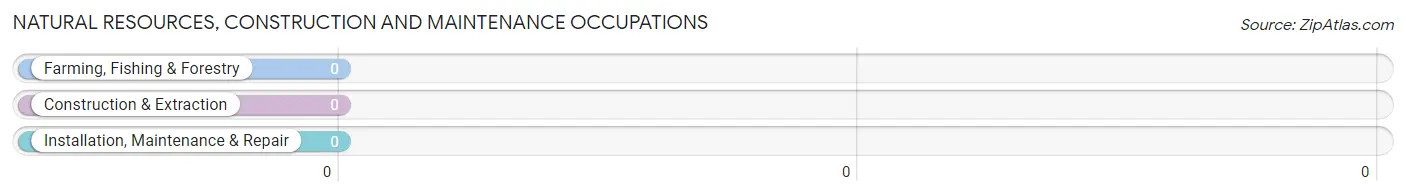
Natural Resources, Construction and Maintenance Occupations
Natural Resources, Construction and Maintenance Occupations by Sex
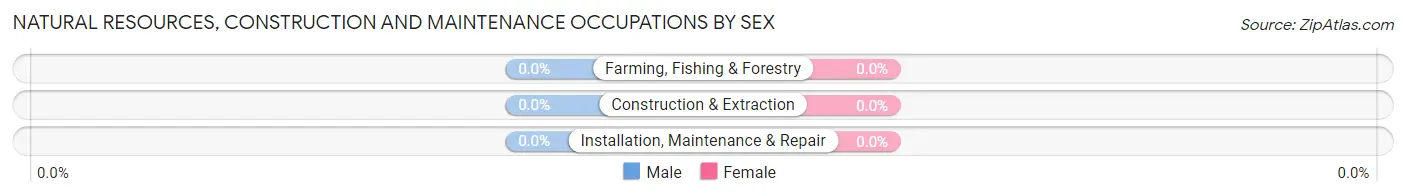
| Occupation | Male | Female |
| Farming, Fishing & Forestry | 0 (0.0%) | 0 (0.0%) |
| Construction & Extraction | 0 (0.0%) | 0 (0.0%) |
| Installation, Maintenance & Repair | 0 (0.0%) | 0 (0.0%) |
| Total (Category) | 0 (0.0%) | 0 (0.0%) |
| Total (Overall) | 14 (38.9%) | 22 (61.1%) |
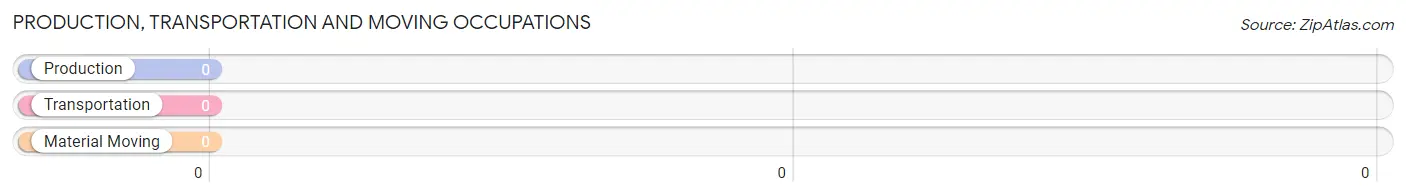
Production, Transportation and Moving Occupations
Production, Transportation and Moving Occupations by Sex
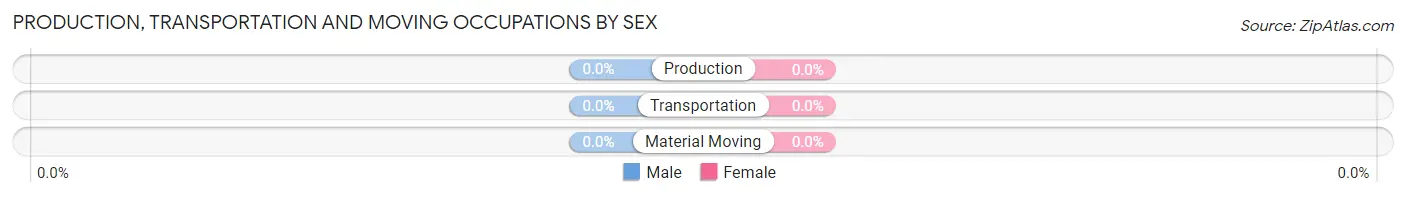
| Occupation | Male | Female |
| Production | 0 (0.0%) | 0 (0.0%) |
| Transportation | 0 (0.0%) | 0 (0.0%) |
| Material Moving | 0 (0.0%) | 0 (0.0%) |
| Total (Category) | 0 (0.0%) | 0 (0.0%) |
| Total (Overall) | 14 (38.9%) | 22 (61.1%) |
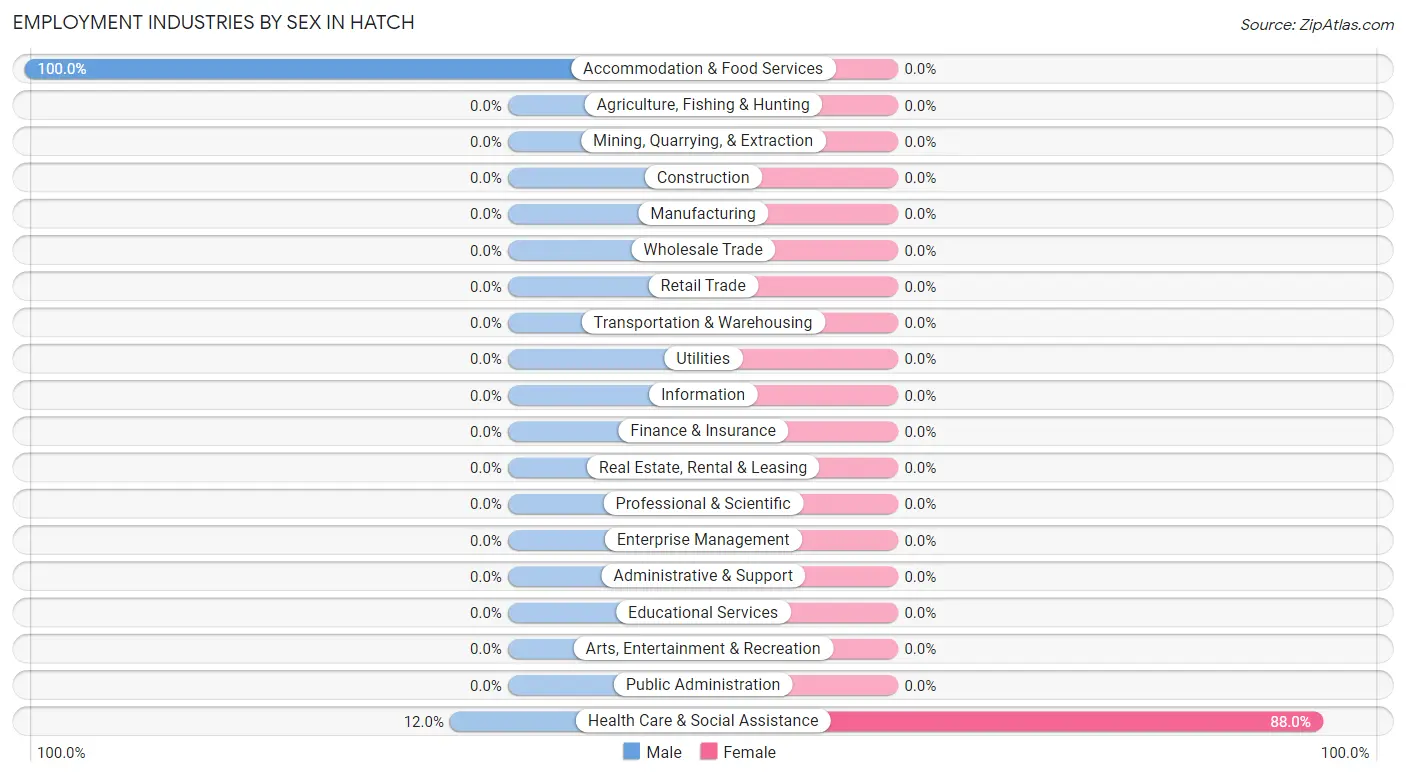
Employment Industries by Sex in Hatch
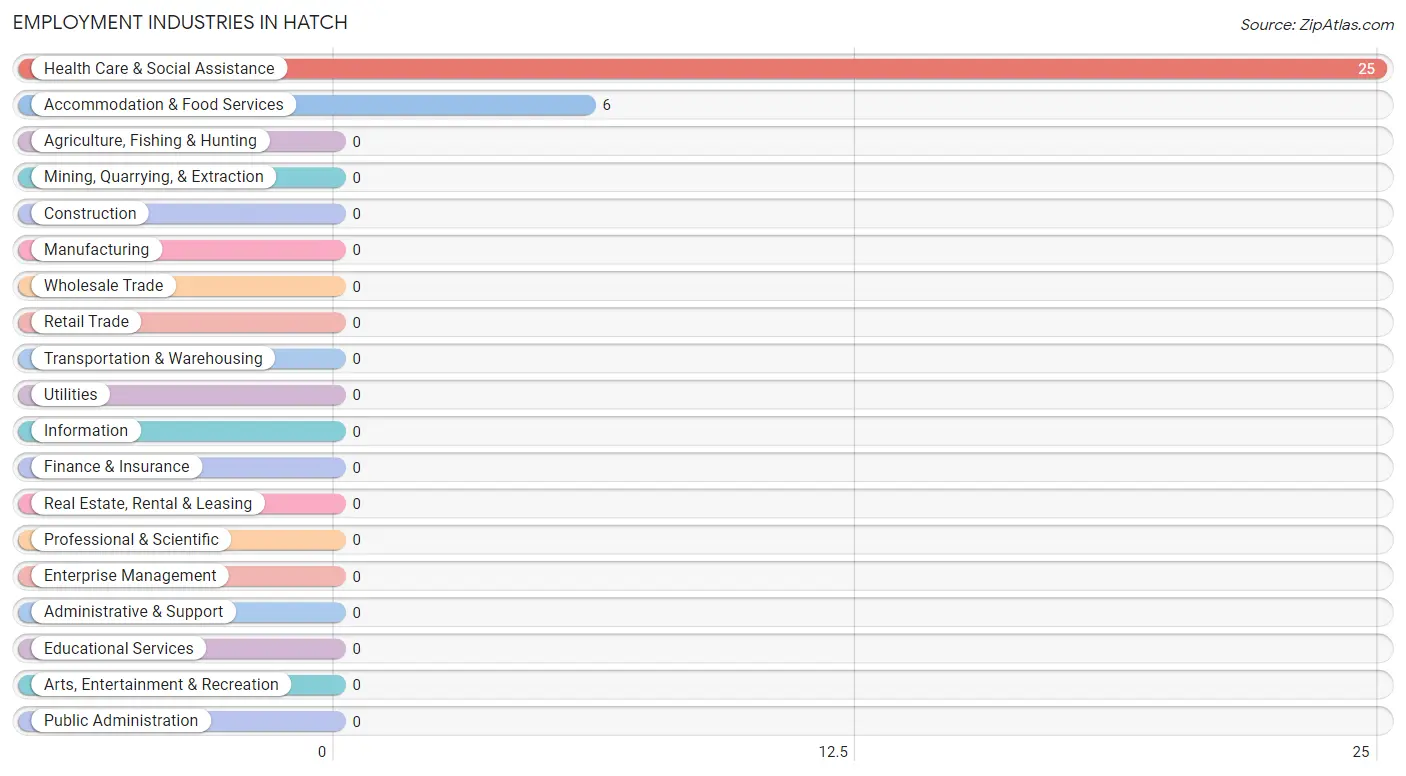
Employment Industries in Hatch
The major employment industries in Hatch include Health Care & Social Assistance (25 | 69.4%), and Accommodation & Food Services (6 | 16.7%).
Employment Industries by Sex in Hatch
| Industry | Male | Female |
| Agriculture, Fishing & Hunting | 0 (0.0%) | 0 (0.0%) |
| Mining, Quarrying, & Extraction | 0 (0.0%) | 0 (0.0%) |
| Construction | 0 (0.0%) | 0 (0.0%) |
| Manufacturing | 0 (0.0%) | 0 (0.0%) |
| Wholesale Trade | 0 (0.0%) | 0 (0.0%) |
| Retail Trade | 0 (0.0%) | 0 (0.0%) |
| Transportation & Warehousing | 0 (0.0%) | 0 (0.0%) |
| Utilities | 0 (0.0%) | 0 (0.0%) |
| Information | 0 (0.0%) | 0 (0.0%) |
| Finance & Insurance | 0 (0.0%) | 0 (0.0%) |
| Real Estate, Rental & Leasing | 0 (0.0%) | 0 (0.0%) |
| Professional & Scientific | 0 (0.0%) | 0 (0.0%) |
| Enterprise Management | 0 (0.0%) | 0 (0.0%) |
| Administrative & Support | 0 (0.0%) | 0 (0.0%) |
| Educational Services | 0 (0.0%) | 0 (0.0%) |
| Health Care & Social Assistance | 3 (12.0%) | 22 (88.0%) |
| Arts, Entertainment & Recreation | 0 (0.0%) | 0 (0.0%) |
| Accommodation & Food Services | 6 (100.0%) | 0 (0.0%) |
| Public Administration | 0 (0.0%) | 0 (0.0%) |
| Total | 14 (38.9%) | 22 (61.1%) |
Education in Hatch
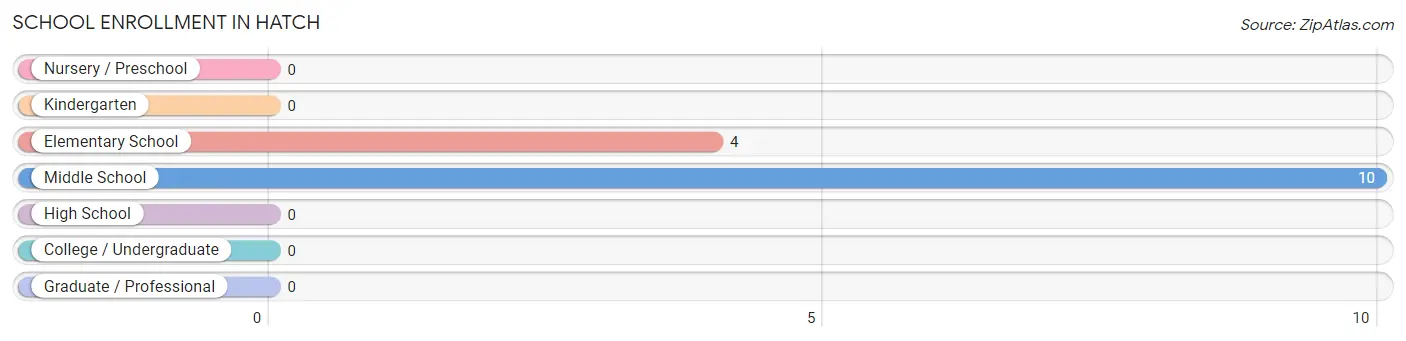
School Enrollment in Hatch
The most common levels of schooling among the 14 students in Hatch are middle school (10 | 71.4%), and elementary school (4 | 28.6%).
| School Level | # Students | % Students |
| Nursery / Preschool | 0 | 0.0% |
| Kindergarten | 0 | 0.0% |
| Elementary School | 4 | 28.6% |
| Middle School | 10 | 71.4% |
| High School | 0 | 0.0% |
| College / Undergraduate | 0 | 0.0% |
| Graduate / Professional | 0 | 0.0% |
| Total | 14 | 100.0% |
School Enrollment by Age by Funding Source in Hatch
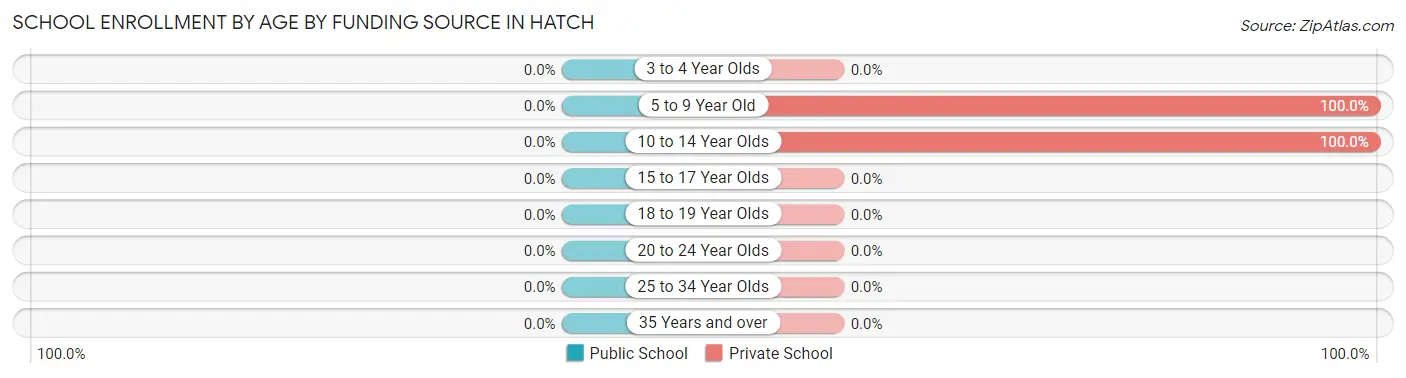
| Age Bracket | Public School | Private School |
| 3 to 4 Year Olds | 0 (0.0%) | 0 (0.0%) |
| 5 to 9 Year Old | 0 (0.0%) | 4 (100.0%) |
| 10 to 14 Year Olds | 0 (0.0%) | 10 (100.0%) |
| 15 to 17 Year Olds | 0 (0.0%) | 0 (0.0%) |
| 18 to 19 Year Olds | 0 (0.0%) | 0 (0.0%) |
| 20 to 24 Year Olds | 0 (0.0%) | 0 (0.0%) |
| 25 to 34 Year Olds | 0 (0.0%) | 0 (0.0%) |
| 35 Years and over | 0 (0.0%) | 0 (0.0%) |
| Total | 0 (0.0%) | 14 (100.0%) |
Educational Attainment by Field of Study in Hatch
Science & technology (7 | 36.8%), liberal arts & history (6 | 31.6%), and arts & humanities (6 | 31.6%) are the most common fields of study among 19 individuals in Hatch who have obtained a bachelor's degree or higher.
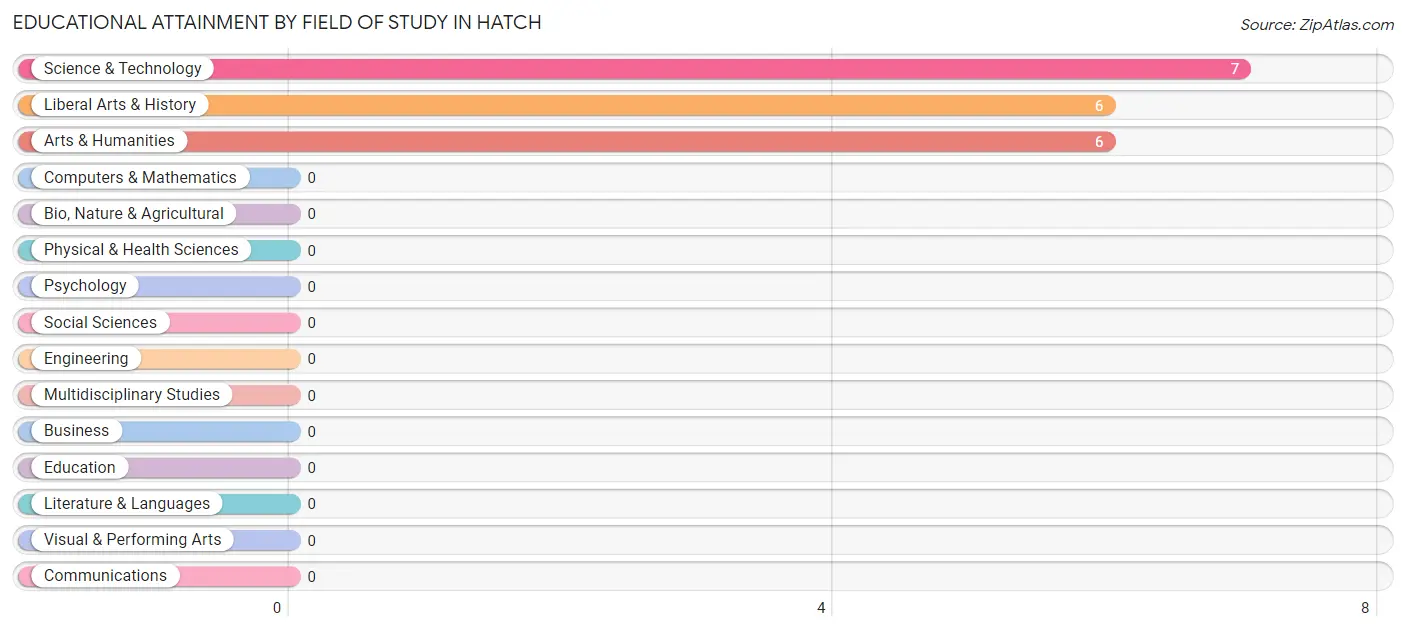
| Field of Study | # Graduates | % Graduates |
| Computers & Mathematics | 0 | 0.0% |
| Bio, Nature & Agricultural | 0 | 0.0% |
| Physical & Health Sciences | 0 | 0.0% |
| Psychology | 0 | 0.0% |
| Social Sciences | 0 | 0.0% |
| Engineering | 0 | 0.0% |
| Multidisciplinary Studies | 0 | 0.0% |
| Science & Technology | 7 | 36.8% |
| Business | 0 | 0.0% |
| Education | 0 | 0.0% |
| Literature & Languages | 0 | 0.0% |
| Liberal Arts & History | 6 | 31.6% |
| Visual & Performing Arts | 0 | 0.0% |
| Communications | 0 | 0.0% |
| Arts & Humanities | 6 | 31.6% |
| Total | 19 | 100.0% |
Transportation & Commute in Hatch
Vehicle Availability by Sex in Hatch
The most prevalent vehicle ownership categories in Hatch are males with 2 vehicles (8, accounting for 57.1%) and females with 2 vehicles (10, making up 36.4%).
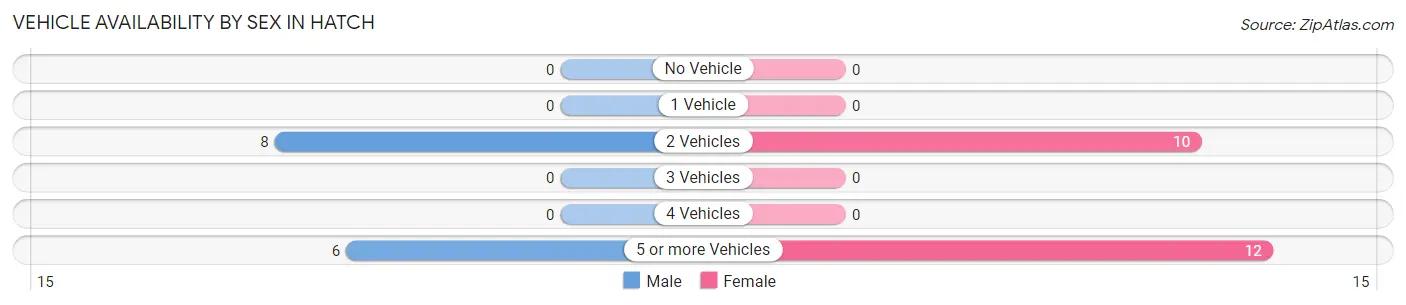
| Vehicles Available | Male | Female |
| No Vehicle | 0 (0.0%) | 0 (0.0%) |
| 1 Vehicle | 0 (0.0%) | 0 (0.0%) |
| 2 Vehicles | 8 (57.1%) | 10 (45.5%) |
| 3 Vehicles | 0 (0.0%) | 0 (0.0%) |
| 4 Vehicles | 0 (0.0%) | 0 (0.0%) |
| 5 or more Vehicles | 6 (42.9%) | 12 (54.5%) |
| Total | 14 (100.0%) | 22 (100.0%) |
Commute Time in Hatch
The most frequently occuring commute durations in Hatch are 20 to 24 minutes (18 commuters, 66.7%), less than 5 minutes (6 commuters, 22.2%), and 25 to 29 minutes (3 commuters, 11.1%).
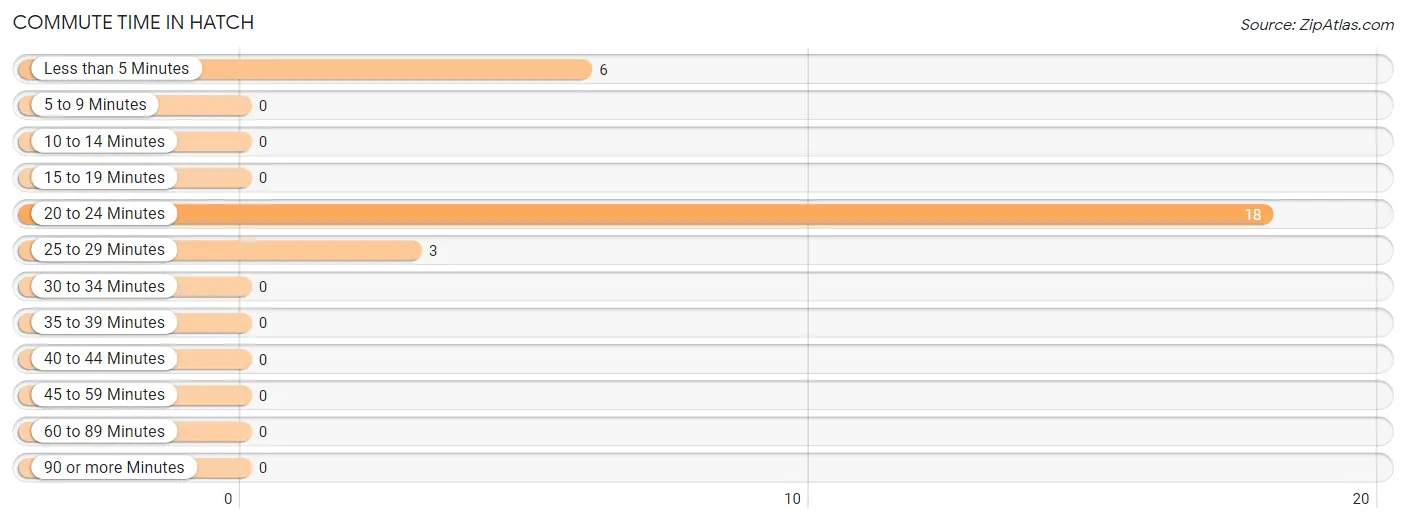
| Commute Time | # Commuters | % Commuters |
| Less than 5 Minutes | 6 | 22.2% |
| 5 to 9 Minutes | 0 | 0.0% |
| 10 to 14 Minutes | 0 | 0.0% |
| 15 to 19 Minutes | 0 | 0.0% |
| 20 to 24 Minutes | 18 | 66.7% |
| 25 to 29 Minutes | 3 | 11.1% |
| 30 to 34 Minutes | 0 | 0.0% |
| 35 to 39 Minutes | 0 | 0.0% |
| 40 to 44 Minutes | 0 | 0.0% |
| 45 to 59 Minutes | 0 | 0.0% |
| 60 to 89 Minutes | 0 | 0.0% |
| 90 or more Minutes | 0 | 0.0% |
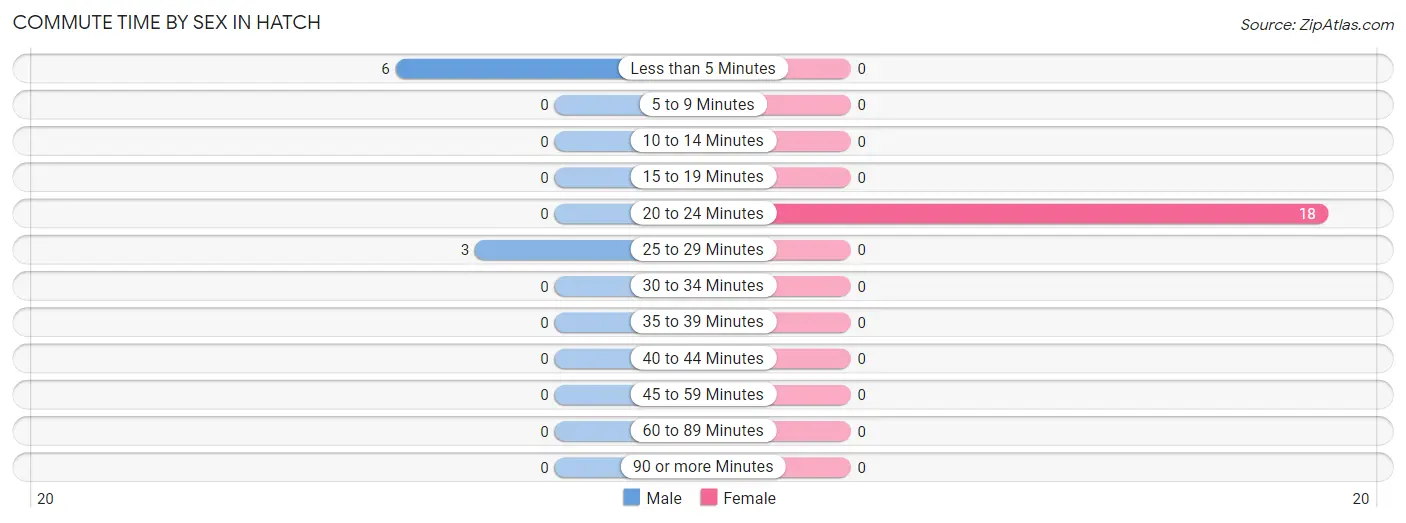
Commute Time by Sex in Hatch
The most common commute times in Hatch are less than 5 minutes (6 commuters, 66.7%) for males and 20 to 24 minutes (18 commuters, 100.0%) for females.
| Commute Time | Male | Female |
| Less than 5 Minutes | 6 (66.7%) | 0 (0.0%) |
| 5 to 9 Minutes | 0 (0.0%) | 0 (0.0%) |
| 10 to 14 Minutes | 0 (0.0%) | 0 (0.0%) |
| 15 to 19 Minutes | 0 (0.0%) | 0 (0.0%) |
| 20 to 24 Minutes | 0 (0.0%) | 18 (100.0%) |
| 25 to 29 Minutes | 3 (33.3%) | 0 (0.0%) |
| 30 to 34 Minutes | 0 (0.0%) | 0 (0.0%) |
| 35 to 39 Minutes | 0 (0.0%) | 0 (0.0%) |
| 40 to 44 Minutes | 0 (0.0%) | 0 (0.0%) |
| 45 to 59 Minutes | 0 (0.0%) | 0 (0.0%) |
| 60 to 89 Minutes | 0 (0.0%) | 0 (0.0%) |
| 90 or more Minutes | 0 (0.0%) | 0 (0.0%) |
Time of Departure to Work by Sex in Hatch
The most frequent times of departure to work in Hatch are 9:00 AM to 9:59 AM (9, 100.0%) for males and 5:00 AM to 5:29 AM (12, 66.7%) for females.
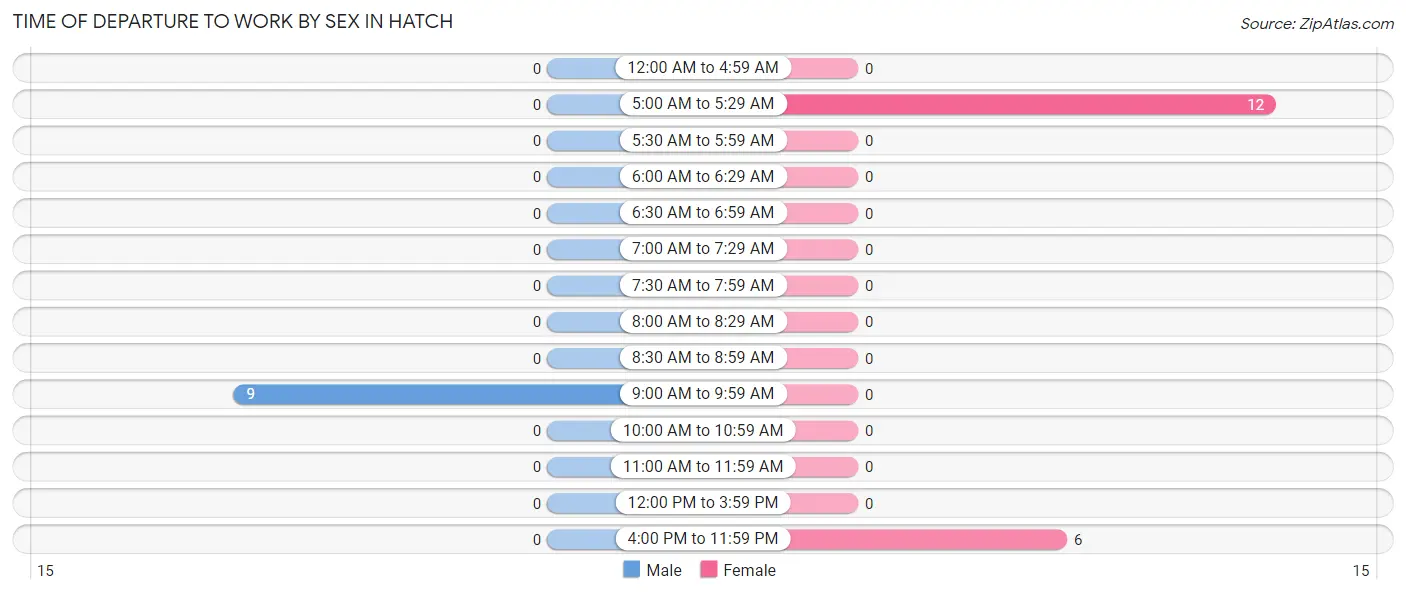
| Time of Departure | Male | Female |
| 12:00 AM to 4:59 AM | 0 (0.0%) | 0 (0.0%) |
| 5:00 AM to 5:29 AM | 0 (0.0%) | 12 (66.7%) |
| 5:30 AM to 5:59 AM | 0 (0.0%) | 0 (0.0%) |
| 6:00 AM to 6:29 AM | 0 (0.0%) | 0 (0.0%) |
| 6:30 AM to 6:59 AM | 0 (0.0%) | 0 (0.0%) |
| 7:00 AM to 7:29 AM | 0 (0.0%) | 0 (0.0%) |
| 7:30 AM to 7:59 AM | 0 (0.0%) | 0 (0.0%) |
| 8:00 AM to 8:29 AM | 0 (0.0%) | 0 (0.0%) |
| 8:30 AM to 8:59 AM | 0 (0.0%) | 0 (0.0%) |
| 9:00 AM to 9:59 AM | 9 (100.0%) | 0 (0.0%) |
| 10:00 AM to 10:59 AM | 0 (0.0%) | 0 (0.0%) |
| 11:00 AM to 11:59 AM | 0 (0.0%) | 0 (0.0%) |
| 12:00 PM to 3:59 PM | 0 (0.0%) | 0 (0.0%) |
| 4:00 PM to 11:59 PM | 0 (0.0%) | 6 (33.3%) |
| Total | 9 (100.0%) | 18 (100.0%) |
Housing Occupancy in Hatch
Occupancy by Ownership in Hatch
Of the total 35 dwellings in Hatch, owner-occupied units account for 24 (68.6%), while renter-occupied units make up 11 (31.4%).
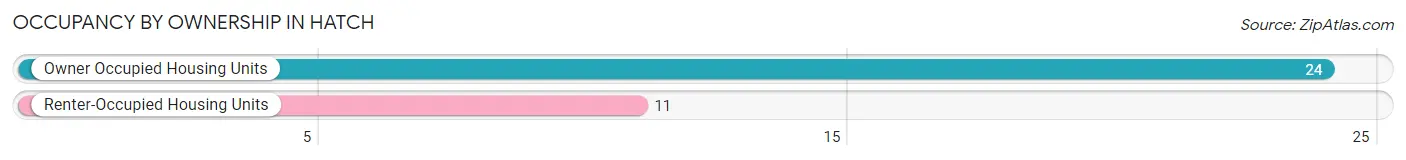
| Occupancy | # Housing Units | % Housing Units |
| Owner Occupied Housing Units | 24 | 68.6% |
| Renter-Occupied Housing Units | 11 | 31.4% |
| Total Occupied Housing Units | 35 | 100.0% |
Occupancy by Household Size in Hatch
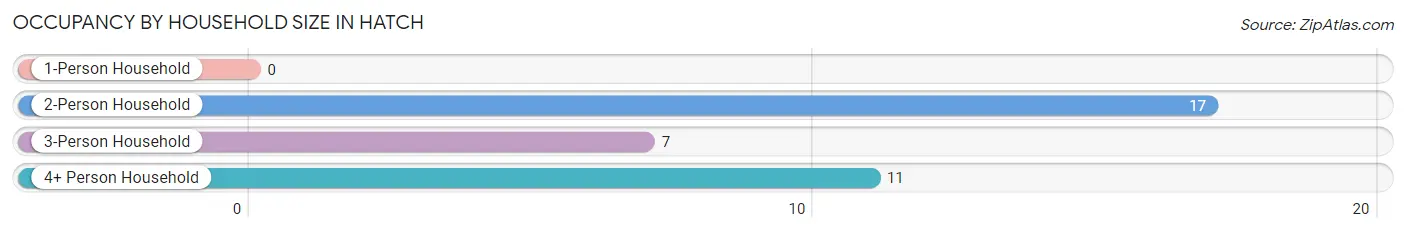
| Household Size | # Housing Units | % Housing Units |
| 1-Person Household | 0 | 0.0% |
| 2-Person Household | 17 | 48.6% |
| 3-Person Household | 7 | 20.0% |
| 4+ Person Household | 11 | 31.4% |
| Total Housing Units | 35 | 100.0% |
Occupancy by Ownership by Household Size in Hatch
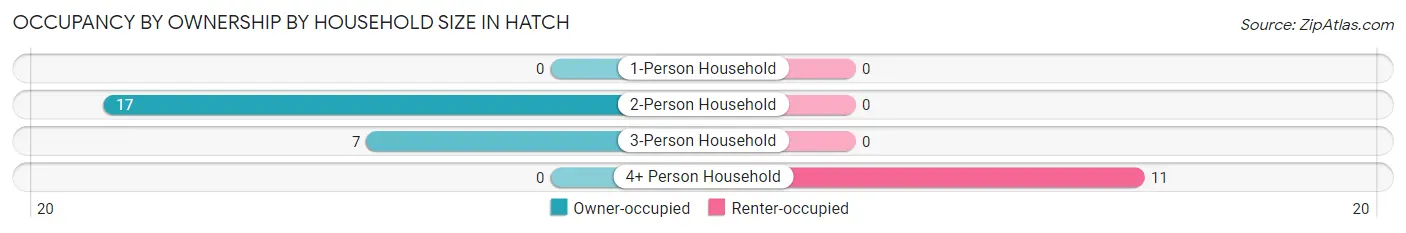
| Household Size | Owner-occupied | Renter-occupied |
| 1-Person Household | 0 (0.0%) | 0 (0.0%) |
| 2-Person Household | 17 (100.0%) | 0 (0.0%) |
| 3-Person Household | 7 (100.0%) | 0 (0.0%) |
| 4+ Person Household | 0 (0.0%) | 11 (100.0%) |
| Total Housing Units | 24 (68.6%) | 11 (31.4%) |
Occupancy by Educational Attainment in Hatch
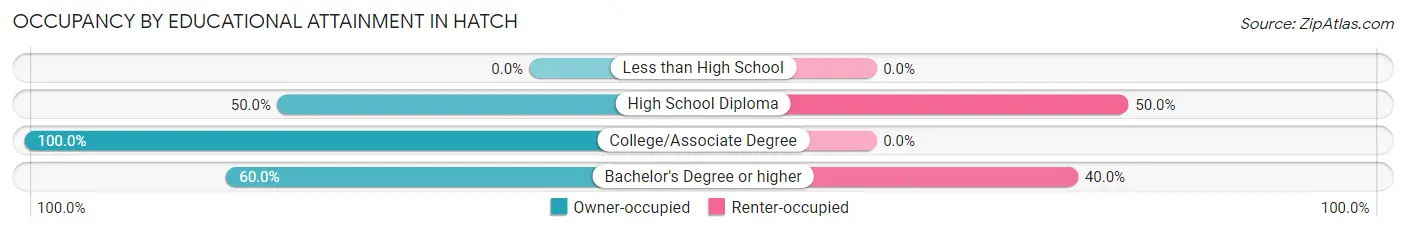
| Household Size | Owner-occupied | Renter-occupied |
| Less than High School | 0 (0.0%) | 0 (0.0%) |
| High School Diploma | 7 (50.0%) | 7 (50.0%) |
| College/Associate Degree | 11 (100.0%) | 0 (0.0%) |
| Bachelor's Degree or higher | 6 (60.0%) | 4 (40.0%) |
Occupancy by Age of Householder in Hatch
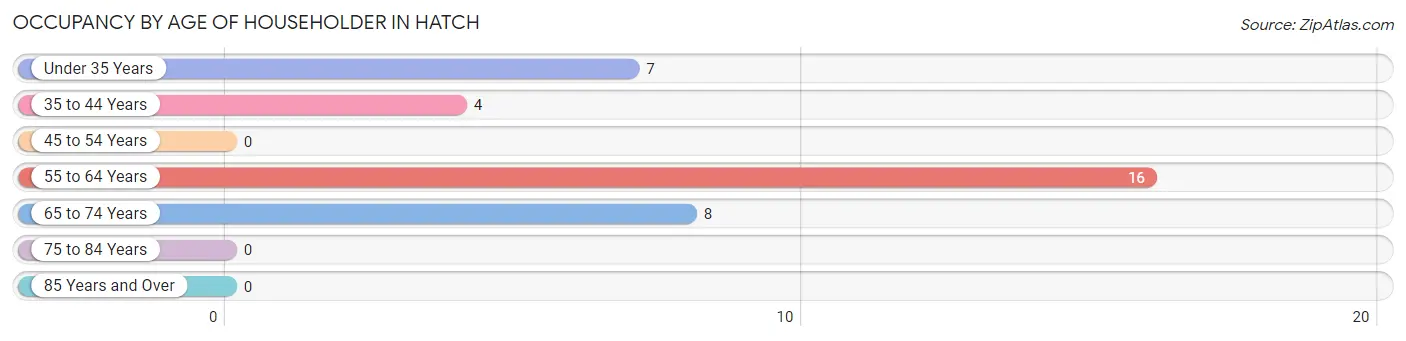
| Age Bracket | # Households | % Households |
| Under 35 Years | 7 | 20.0% |
| 35 to 44 Years | 4 | 11.4% |
| 45 to 54 Years | 0 | 0.0% |
| 55 to 64 Years | 16 | 45.7% |
| 65 to 74 Years | 8 | 22.9% |
| 75 to 84 Years | 0 | 0.0% |
| 85 Years and Over | 0 | 0.0% |
| Total | 35 | 100.0% |
Housing Finances in Hatch
Median Income by Occupancy in Hatch
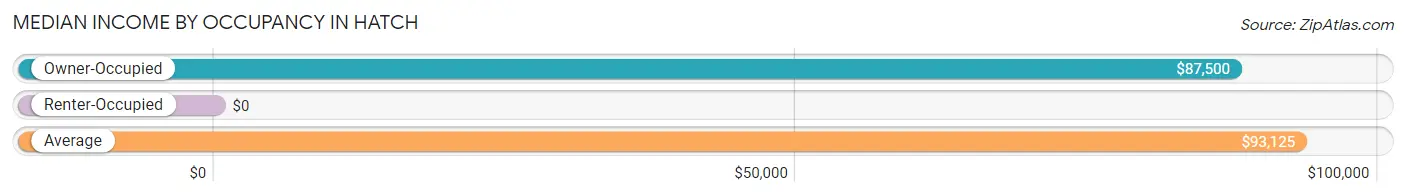
| Occupancy Type | # Households | Median Income |
| Owner-Occupied | 24 (68.6%) | $87,500 |
| Renter-Occupied | 11 (31.4%) | $0 |
| Average | 35 (100.0%) | $93,125 |
Occupancy by Householder Income Bracket in Hatch
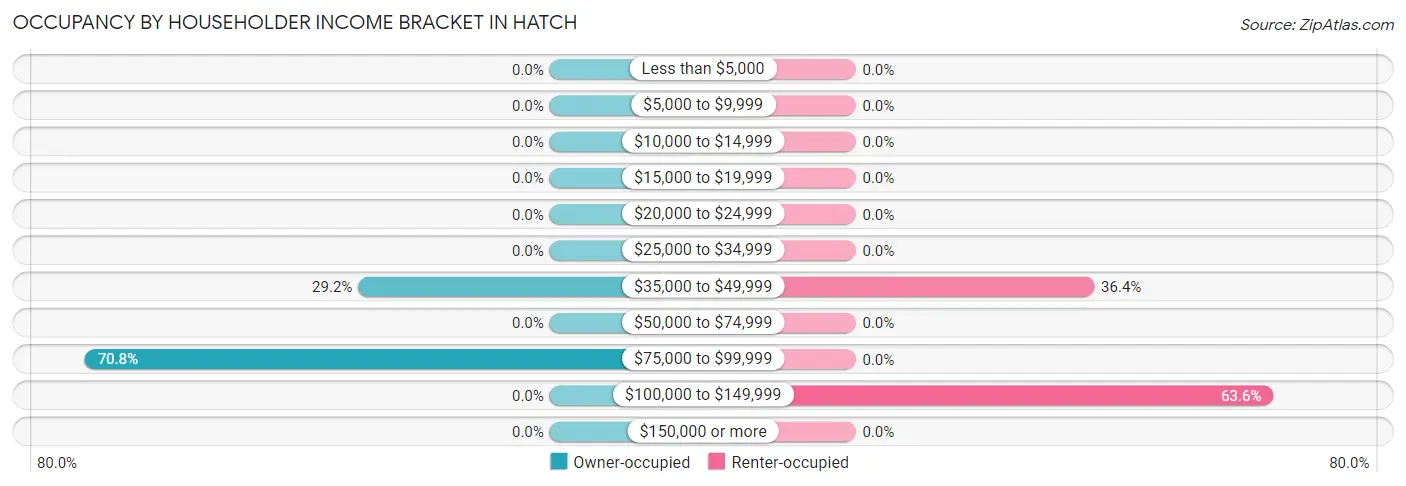
| Income Bracket | Owner-occupied | Renter-occupied |
| Less than $5,000 | 0 (0.0%) | 0 (0.0%) |
| $5,000 to $9,999 | 0 (0.0%) | 0 (0.0%) |
| $10,000 to $14,999 | 0 (0.0%) | 0 (0.0%) |
| $15,000 to $19,999 | 0 (0.0%) | 0 (0.0%) |
| $20,000 to $24,999 | 0 (0.0%) | 0 (0.0%) |
| $25,000 to $34,999 | 0 (0.0%) | 0 (0.0%) |
| $35,000 to $49,999 | 7 (29.2%) | 4 (36.4%) |
| $50,000 to $74,999 | 0 (0.0%) | 0 (0.0%) |
| $75,000 to $99,999 | 17 (70.8%) | 0 (0.0%) |
| $100,000 to $149,999 | 0 (0.0%) | 7 (63.6%) |
| $150,000 or more | 0 (0.0%) | 0 (0.0%) |
| Total | 24 (100.0%) | 11 (100.0%) |
Monthly Housing Cost Tiers in Hatch
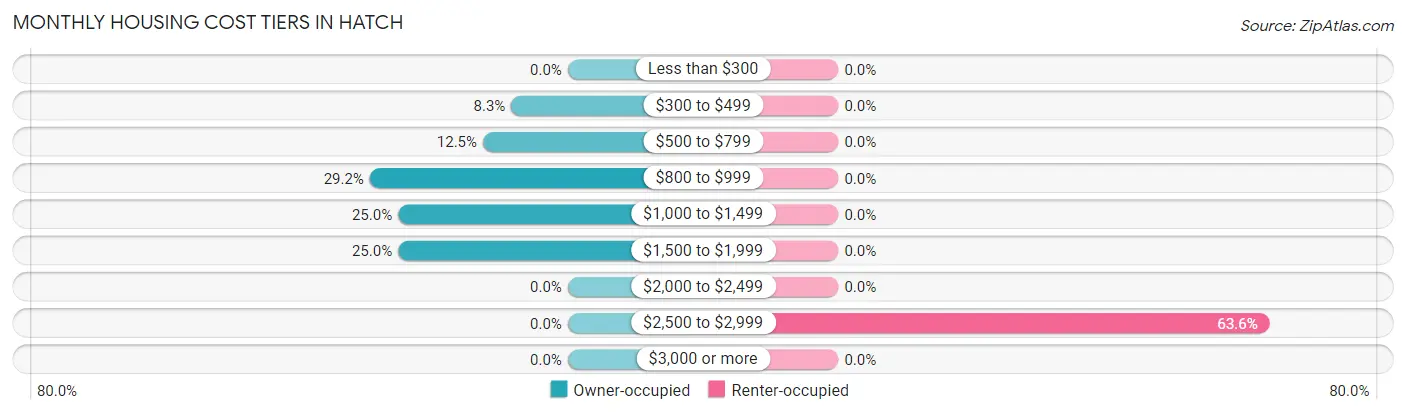
| Monthly Cost | Owner-occupied | Renter-occupied |
| Less than $300 | 0 (0.0%) | 0 (0.0%) |
| $300 to $499 | 2 (8.3%) | 0 (0.0%) |
| $500 to $799 | 3 (12.5%) | 0 (0.0%) |
| $800 to $999 | 7 (29.2%) | 0 (0.0%) |
| $1,000 to $1,499 | 6 (25.0%) | 0 (0.0%) |
| $1,500 to $1,999 | 6 (25.0%) | 0 (0.0%) |
| $2,000 to $2,499 | 0 (0.0%) | 0 (0.0%) |
| $2,500 to $2,999 | 0 (0.0%) | 7 (63.6%) |
| $3,000 or more | 0 (0.0%) | 0 (0.0%) |
| Total | 24 (100.0%) | 11 (100.0%) |
Physical Housing Characteristics in Hatch
Housing Structures in Hatch
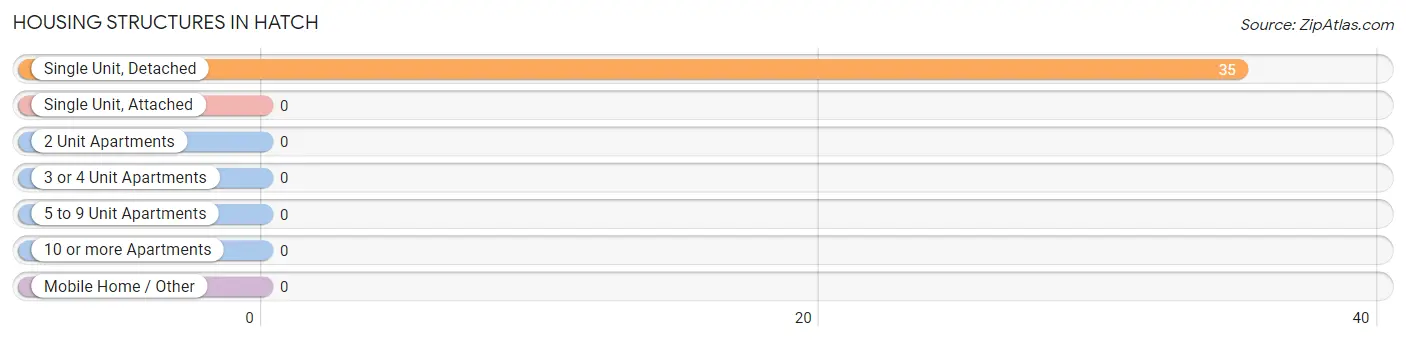
| Structure Type | # Housing Units | % Housing Units |
| Single Unit, Detached | 35 | 100.0% |
| Single Unit, Attached | 0 | 0.0% |
| 2 Unit Apartments | 0 | 0.0% |
| 3 or 4 Unit Apartments | 0 | 0.0% |
| 5 to 9 Unit Apartments | 0 | 0.0% |
| 10 or more Apartments | 0 | 0.0% |
| Mobile Home / Other | 0 | 0.0% |
| Total | 35 | 100.0% |
Housing Structures by Occupancy in Hatch
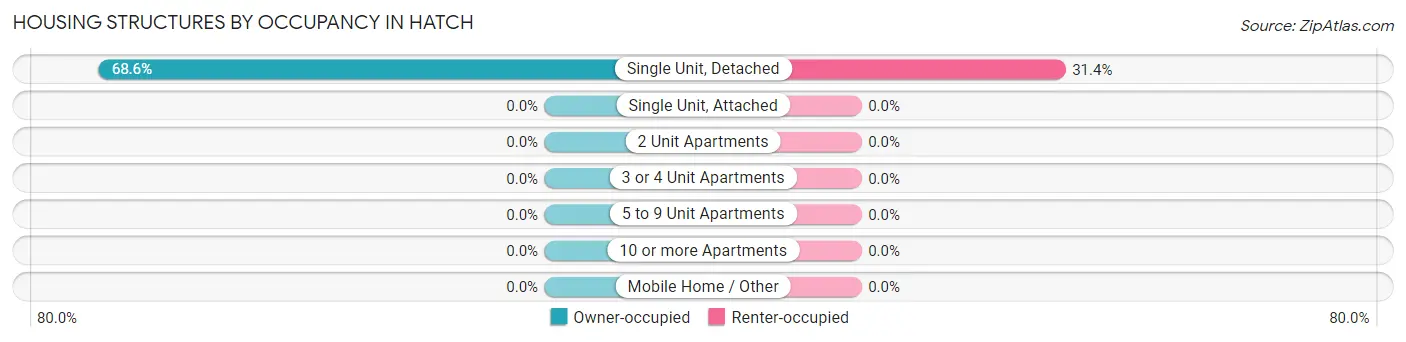
| Structure Type | Owner-occupied | Renter-occupied |
| Single Unit, Detached | 24 (68.6%) | 11 (31.4%) |
| Single Unit, Attached | 0 (0.0%) | 0 (0.0%) |
| 2 Unit Apartments | 0 (0.0%) | 0 (0.0%) |
| 3 or 4 Unit Apartments | 0 (0.0%) | 0 (0.0%) |
| 5 to 9 Unit Apartments | 0 (0.0%) | 0 (0.0%) |
| 10 or more Apartments | 0 (0.0%) | 0 (0.0%) |
| Mobile Home / Other | 0 (0.0%) | 0 (0.0%) |
| Total | 24 (68.6%) | 11 (31.4%) |
Housing Structures by Number of Rooms in Hatch
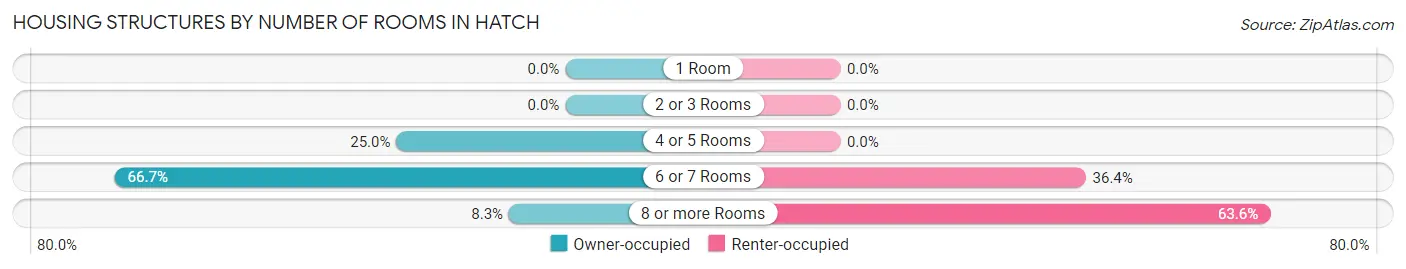
| Number of Rooms | Owner-occupied | Renter-occupied |
| 1 Room | 0 (0.0%) | 0 (0.0%) |
| 2 or 3 Rooms | 0 (0.0%) | 0 (0.0%) |
| 4 or 5 Rooms | 6 (25.0%) | 0 (0.0%) |
| 6 or 7 Rooms | 16 (66.7%) | 4 (36.4%) |
| 8 or more Rooms | 2 (8.3%) | 7 (63.6%) |
| Total | 24 (100.0%) | 11 (100.0%) |
Housing Structure by Heating Type in Hatch
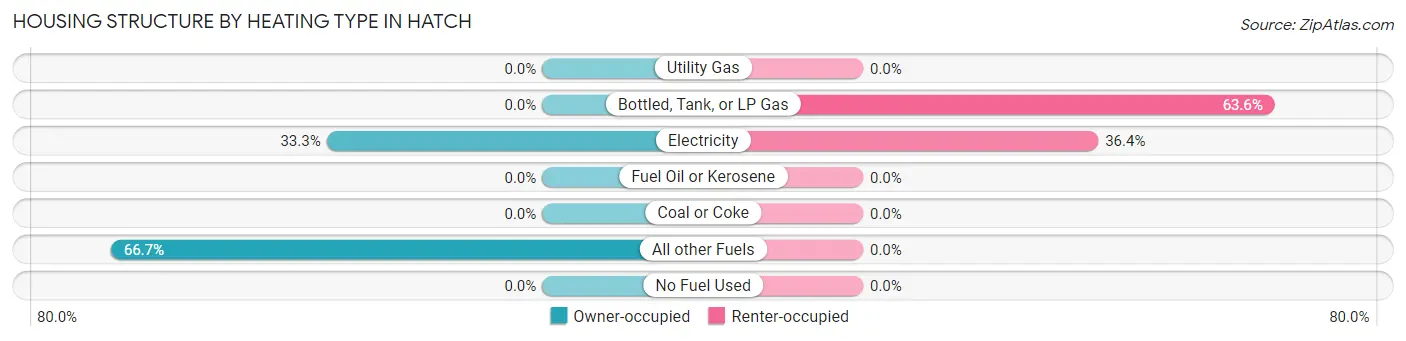
| Heating Type | Owner-occupied | Renter-occupied |
| Utility Gas | 0 (0.0%) | 0 (0.0%) |
| Bottled, Tank, or LP Gas | 0 (0.0%) | 7 (63.6%) |
| Electricity | 8 (33.3%) | 4 (36.4%) |
| Fuel Oil or Kerosene | 0 (0.0%) | 0 (0.0%) |
| Coal or Coke | 0 (0.0%) | 0 (0.0%) |
| All other Fuels | 16 (66.7%) | 0 (0.0%) |
| No Fuel Used | 0 (0.0%) | 0 (0.0%) |
| Total | 24 (100.0%) | 11 (100.0%) |
Household Vehicle Usage in Hatch
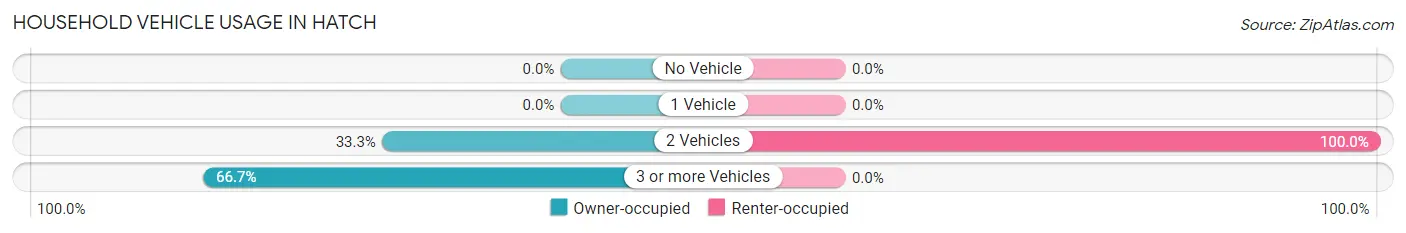
| Vehicles per Household | Owner-occupied | Renter-occupied |
| No Vehicle | 0 (0.0%) | 0 (0.0%) |
| 1 Vehicle | 0 (0.0%) | 0 (0.0%) |
| 2 Vehicles | 8 (33.3%) | 11 (100.0%) |
| 3 or more Vehicles | 16 (66.7%) | 0 (0.0%) |
| Total | 24 (100.0%) | 11 (100.0%) |
Real Estate & Mortgages in Hatch
Real Estate and Mortgage Overview in Hatch
| Characteristic | Without Mortgage | With Mortgage |
| Housing Units | 5 | 19 |
| Median Property Value | - | - |
| Median Household Income | - | - |
| Monthly Housing Costs | - | - |
| Real Estate Taxes | - | - |
Property Value by Mortgage Status in Hatch
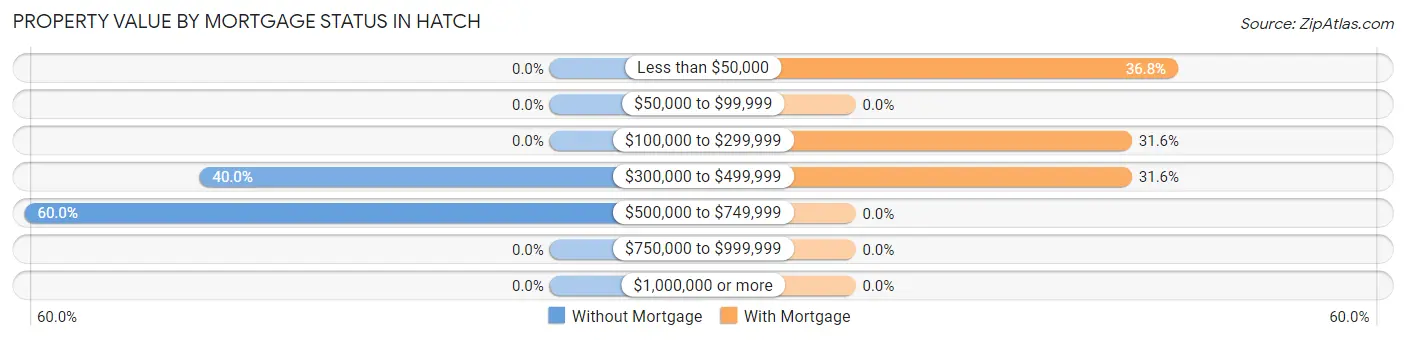
| Property Value | Without Mortgage | With Mortgage |
| Less than $50,000 | 0 (0.0%) | 7 (36.8%) |
| $50,000 to $99,999 | 0 (0.0%) | 0 (0.0%) |
| $100,000 to $299,999 | 0 (0.0%) | 6 (31.6%) |
| $300,000 to $499,999 | 2 (40.0%) | 6 (31.6%) |
| $500,000 to $749,999 | 3 (60.0%) | 0 (0.0%) |
| $750,000 to $999,999 | 0 (0.0%) | 0 (0.0%) |
| $1,000,000 or more | 0 (0.0%) | 0 (0.0%) |
| Total | 5 (100.0%) | 19 (100.0%) |
Household Income by Mortgage Status in Hatch
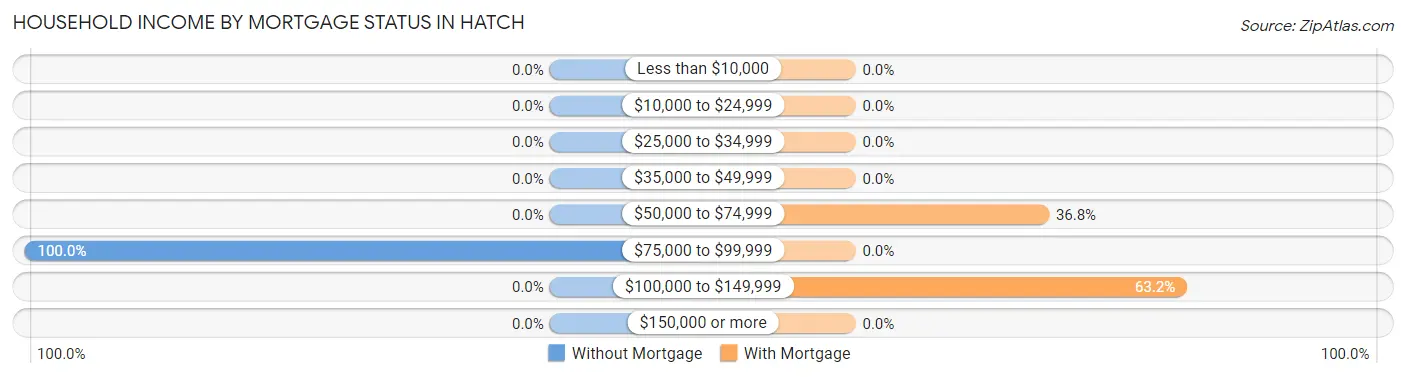
| Household Income | Without Mortgage | With Mortgage |
| Less than $10,000 | 0 (0.0%) | 0 (0.0%) |
| $10,000 to $24,999 | 0 (0.0%) | 0 (0.0%) |
| $25,000 to $34,999 | 0 (0.0%) | 0 (0.0%) |
| $35,000 to $49,999 | 0 (0.0%) | 0 (0.0%) |
| $50,000 to $74,999 | 0 (0.0%) | 7 (36.8%) |
| $75,000 to $99,999 | 5 (100.0%) | 0 (0.0%) |
| $100,000 to $149,999 | 0 (0.0%) | 12 (63.2%) |
| $150,000 or more | 0 (0.0%) | 0 (0.0%) |
| Total | 5 (100.0%) | 19 (100.0%) |
Property Value to Household Income Ratio in Hatch
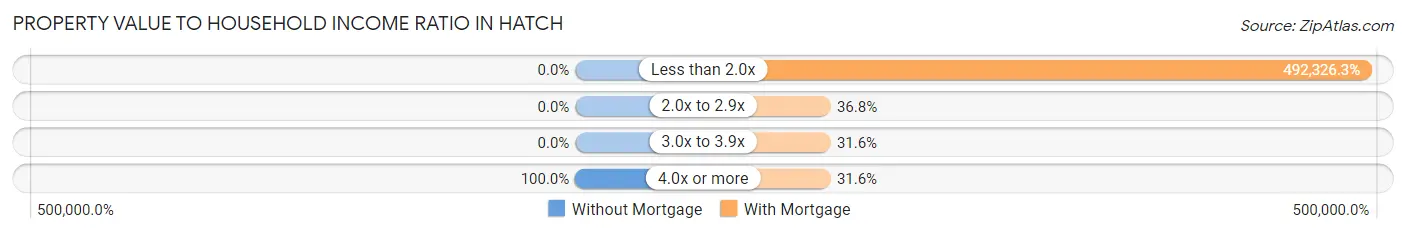
| Value-to-Income Ratio | Without Mortgage | With Mortgage |
| Less than 2.0x | 0 (0.0%) | 93,542 (492,326.3%) |
| 2.0x to 2.9x | 0 (0.0%) | 7 (36.8%) |
| 3.0x to 3.9x | 0 (0.0%) | 6 (31.6%) |
| 4.0x or more | 5 (100.0%) | 6 (31.6%) |
| Total | 5 (100.0%) | 19 (100.0%) |
Real Estate Taxes by Mortgage Status in Hatch
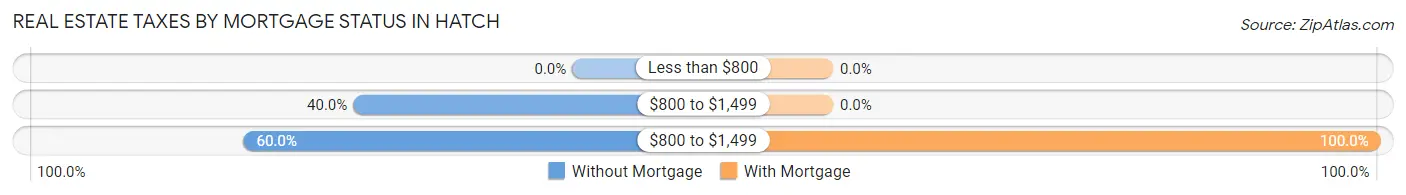
| Property Taxes | Without Mortgage | With Mortgage |
| Less than $800 | 0 (0.0%) | 0 (0.0%) |
| $800 to $1,499 | 2 (40.0%) | 0 (0.0%) |
| $800 to $1,499 | 3 (60.0%) | 19 (100.0%) |
| Total | 5 (100.0%) | 19 (100.0%) |
Health & Disability in Hatch
Health Insurance Coverage by Age in Hatch
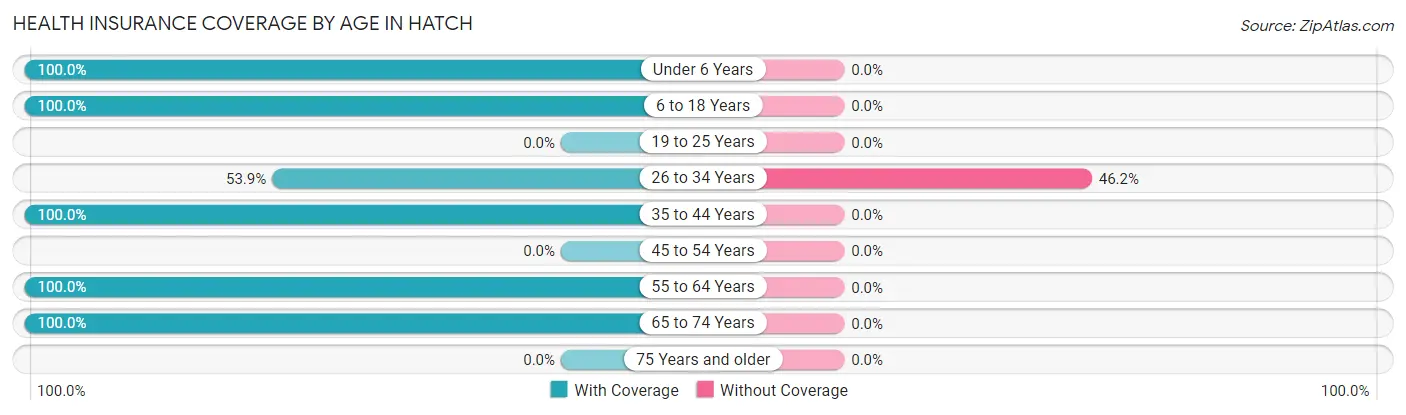
| Age Bracket | With Coverage | Without Coverage |
| Under 6 Years | 12 (100.0%) | 0 (0.0%) |
| 6 to 18 Years | 40 (100.0%) | 0 (0.0%) |
| 19 to 25 Years | 0 (0.0%) | 0 (0.0%) |
| 26 to 34 Years | 7 (53.8%) | 6 (46.2%) |
| 35 to 44 Years | 12 (100.0%) | 0 (0.0%) |
| 45 to 54 Years | 0 (0.0%) | 0 (0.0%) |
| 55 to 64 Years | 38 (100.0%) | 0 (0.0%) |
| 65 to 74 Years | 16 (100.0%) | 0 (0.0%) |
| 75 Years and older | 0 (0.0%) | 0 (0.0%) |
| Total | 125 (95.4%) | 6 (4.6%) |
Health Insurance Coverage by Citizenship Status in Hatch
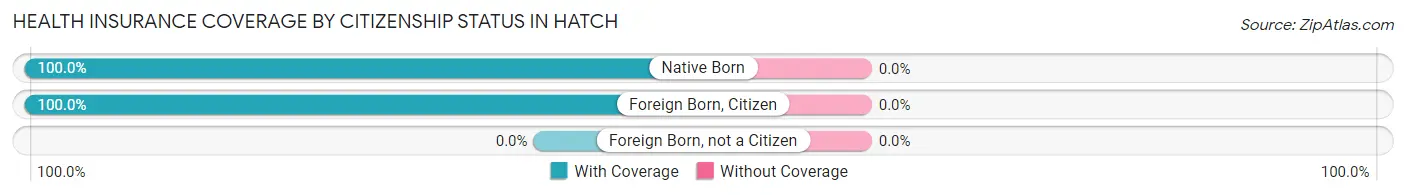
| Citizenship Status | With Coverage | Without Coverage |
| Native Born | 12 (100.0%) | 0 (0.0%) |
| Foreign Born, Citizen | 40 (100.0%) | 0 (0.0%) |
| Foreign Born, not a Citizen | 0 (0.0%) | 0 (0.0%) |
Health Insurance Coverage by Household Income in Hatch
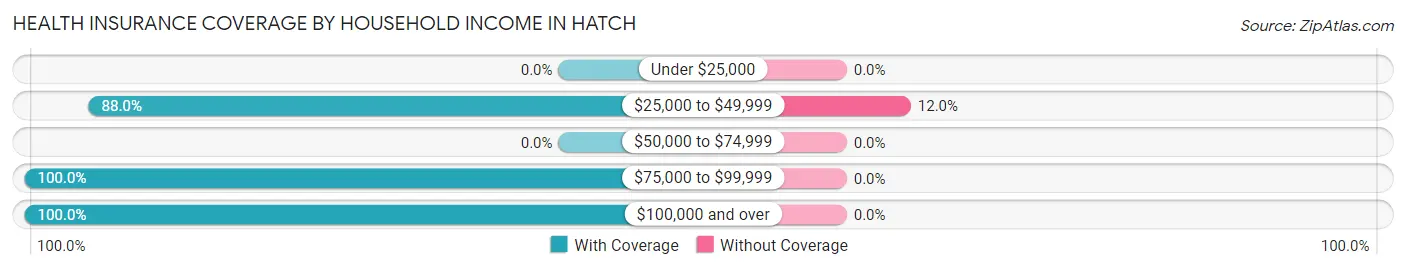
| Household Income | With Coverage | Without Coverage |
| Under $25,000 | 0 (0.0%) | 0 (0.0%) |
| $25,000 to $49,999 | 44 (88.0%) | 6 (12.0%) |
| $50,000 to $74,999 | 0 (0.0%) | 0 (0.0%) |
| $75,000 to $99,999 | 35 (100.0%) | 0 (0.0%) |
| $100,000 and over | 46 (100.0%) | 0 (0.0%) |
Public vs Private Health Insurance Coverage by Age in Hatch
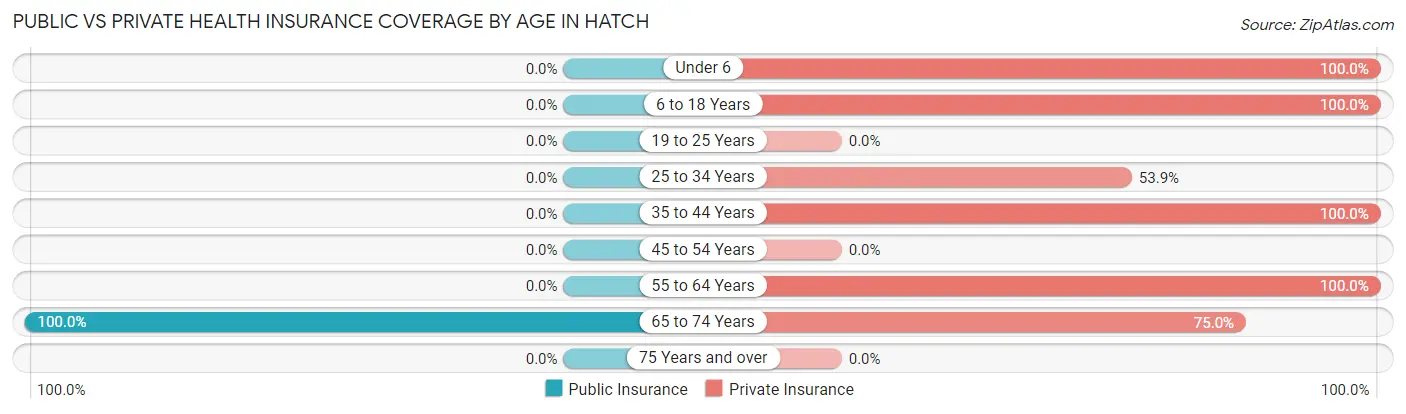
| Age Bracket | Public Insurance | Private Insurance |
| Under 6 | 0 (0.0%) | 12 (100.0%) |
| 6 to 18 Years | 0 (0.0%) | 40 (100.0%) |
| 19 to 25 Years | 0 (0.0%) | 0 (0.0%) |
| 25 to 34 Years | 0 (0.0%) | 7 (53.8%) |
| 35 to 44 Years | 0 (0.0%) | 12 (100.0%) |
| 45 to 54 Years | 0 (0.0%) | 0 (0.0%) |
| 55 to 64 Years | 0 (0.0%) | 38 (100.0%) |
| 65 to 74 Years | 16 (100.0%) | 12 (75.0%) |
| 75 Years and over | 0 (0.0%) | 0 (0.0%) |
| Total | 16 (12.2%) | 121 (92.4%) |
Disability Status by Sex by Age in Hatch
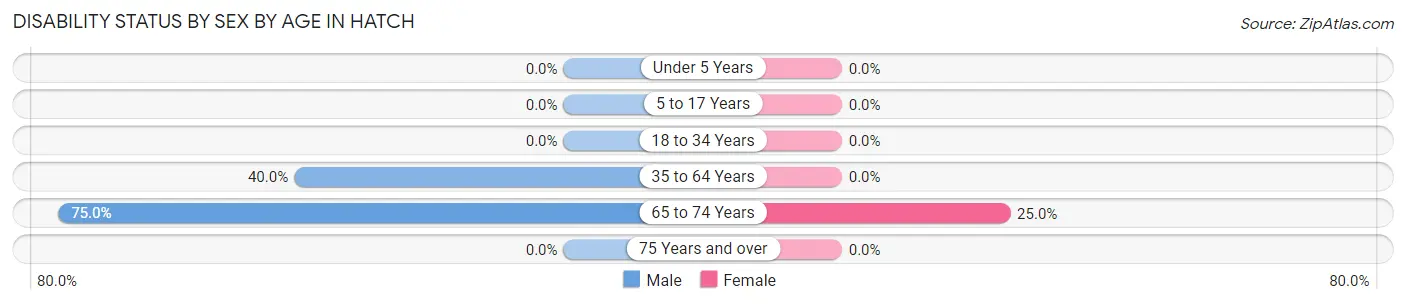
| Age Bracket | Male | Female |
| Under 5 Years | 0 (0.0%) | 0 (0.0%) |
| 5 to 17 Years | 0 (0.0%) | 0 (0.0%) |
| 18 to 34 Years | 0 (0.0%) | 0 (0.0%) |
| 35 to 64 Years | 10 (40.0%) | 0 (0.0%) |
| 65 to 74 Years | 6 (75.0%) | 2 (25.0%) |
| 75 Years and over | 0 (0.0%) | 0 (0.0%) |
Disability Class by Sex by Age in Hatch
Disability Class: Hearing Difficulty
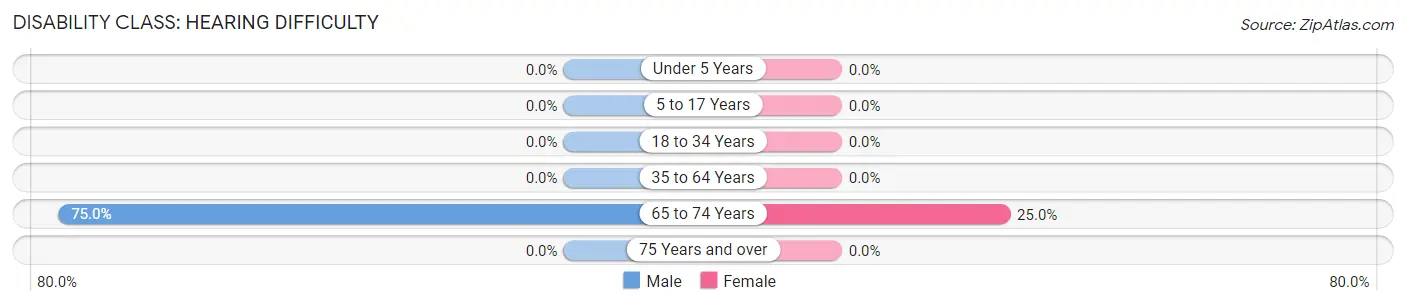
| Age Bracket | Male | Female |
| Under 5 Years | 0 (0.0%) | 0 (0.0%) |
| 5 to 17 Years | 0 (0.0%) | 0 (0.0%) |
| 18 to 34 Years | 0 (0.0%) | 0 (0.0%) |
| 35 to 64 Years | 0 (0.0%) | 0 (0.0%) |
| 65 to 74 Years | 6 (75.0%) | 2 (25.0%) |
| 75 Years and over | 0 (0.0%) | 0 (0.0%) |
Disability Class: Vision Difficulty
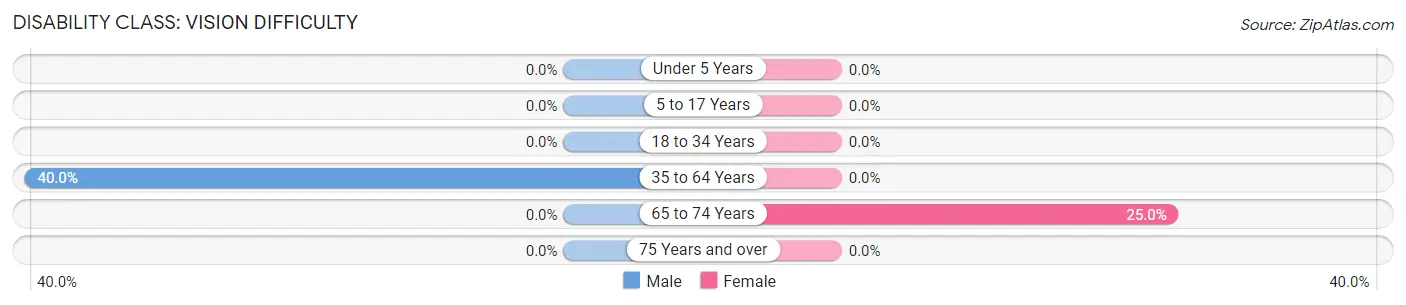
| Age Bracket | Male | Female |
| Under 5 Years | 0 (0.0%) | 0 (0.0%) |
| 5 to 17 Years | 0 (0.0%) | 0 (0.0%) |
| 18 to 34 Years | 0 (0.0%) | 0 (0.0%) |
| 35 to 64 Years | 10 (40.0%) | 0 (0.0%) |
| 65 to 74 Years | 0 (0.0%) | 2 (25.0%) |
| 75 Years and over | 0 (0.0%) | 0 (0.0%) |
Disability Class: Cognitive Difficulty
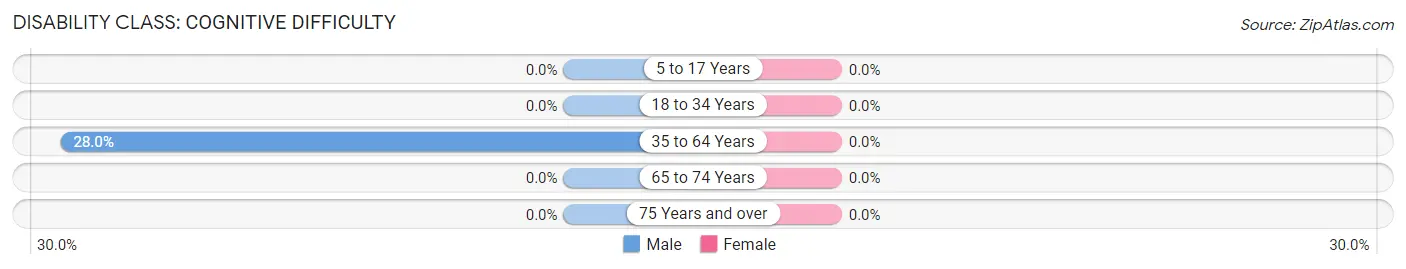
| Age Bracket | Male | Female |
| 5 to 17 Years | 0 (0.0%) | 0 (0.0%) |
| 18 to 34 Years | 0 (0.0%) | 0 (0.0%) |
| 35 to 64 Years | 7 (28.0%) | 0 (0.0%) |
| 65 to 74 Years | 0 (0.0%) | 0 (0.0%) |
| 75 Years and over | 0 (0.0%) | 0 (0.0%) |
Disability Class: Ambulatory Difficulty
| Age Bracket | Male | Female |
| 5 to 17 Years | 0 (0.0%) | 0 (0.0%) |
| 18 to 34 Years | 0 (0.0%) | 0 (0.0%) |
| 35 to 64 Years | 0 (0.0%) | 0 (0.0%) |
| 65 to 74 Years | 0 (0.0%) | 0 (0.0%) |
| 75 Years and over | 0 (0.0%) | 0 (0.0%) |
Disability Class: Self-Care Difficulty
| Age Bracket | Male | Female |
| 5 to 17 Years | 0 (0.0%) | 0 (0.0%) |
| 18 to 34 Years | 0 (0.0%) | 0 (0.0%) |
| 35 to 64 Years | 0 (0.0%) | 0 (0.0%) |
| 65 to 74 Years | 0 (0.0%) | 0 (0.0%) |
| 75 Years and over | 0 (0.0%) | 0 (0.0%) |
Technology Access in Hatch
Computing Device Access in Hatch
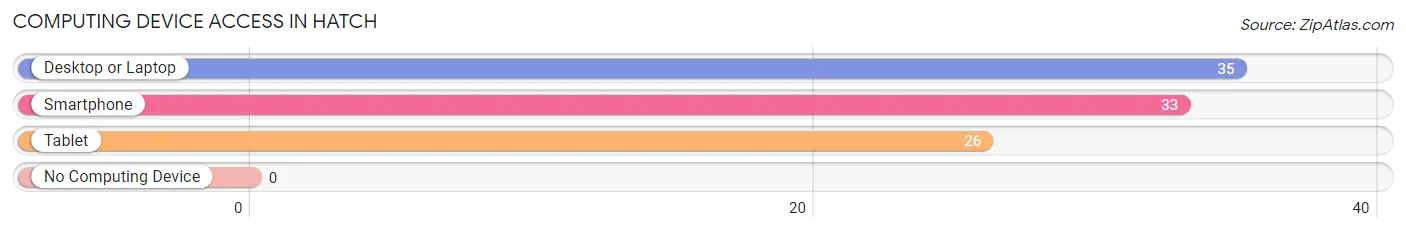
| Device Type | # Households | % Households |
| Desktop or Laptop | 35 | 100.0% |
| Smartphone | 33 | 94.3% |
| Tablet | 26 | 74.3% |
| No Computing Device | 0 | 0.0% |
| Total | 35 | 100.0% |
Internet Access in Hatch
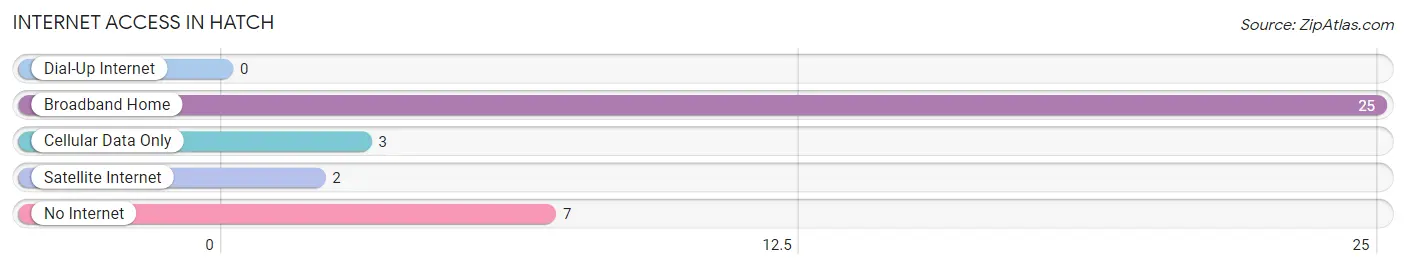
| Internet Type | # Households | % Households |
| Dial-Up Internet | 0 | 0.0% |
| Broadband Home | 25 | 71.4% |
| Cellular Data Only | 3 | 8.6% |
| Satellite Internet | 2 | 5.7% |
| No Internet | 7 | 20.0% |
| Total | 35 | 100.0% |
Hatch Summary
Hatch is a small town located in the southwestern part of Utah, in the county of Washington. It is situated in the heart of the Red Rock Desert, and is surrounded by the majestic red sandstone cliffs of Zion National Park. The town has a population of approximately 1,000 people, and is known for its agricultural production, particularly its melons.
Geography
Hatch is located in the Red Rock Desert, which is part of the Colorado Plateau. The town is situated at an elevation of 4,400 feet, and is surrounded by the majestic red sandstone cliffs of Zion National Park. The climate in Hatch is semi-arid, with hot summers and mild winters. The average annual precipitation is 8.5 inches, and the average annual temperature is 64 degrees Fahrenheit.
Economy
Hatch is known for its agricultural production, particularly its melons. The town is home to the world-famous Hatch Chile Festival, which is held every August. The festival celebrates the town’s agricultural heritage and features a variety of activities, including a chili cook-off, a parade, and a melon-eating contest.
In addition to agriculture, Hatch is also home to a number of small businesses, including restaurants, shops, and a few small manufacturing companies. The town is also home to a number of tourist attractions, including the Zion National Park, the Red Rock Desert, and the nearby Coral Pink Sand Dunes State Park.
Demographics
As of the 2010 census, the population of Hatch was 1,000 people. The racial makeup of the town was 95.2% White, 0.7% African American, 0.7% Native American, 0.7% Asian, 0.3% Pacific Islander, and 2.1% from two or more races. The median household income was $37,500, and the median family income was $41,250.
Conclusion
Hatch is a small town located in the southwestern part of Utah, in the county of Washington. It is situated in the heart of the Red Rock Desert, and is surrounded by the majestic red sandstone cliffs of Zion National Park. The town has a population of approximately 1,000 people, and is known for its agricultural production, particularly its melons. The town is also home to a number of small businesses, tourist attractions, and a variety of cultural events. The town has a diverse population, with a median household income of $37,500.
Common Questions
What is Per Capita Income in Hatch?
Per Capita income in Hatch is $21,305.
What is the Median Family Income in Hatch?
Median Family Income in Hatch is $93,125.
What is the Median Household income in Hatch?
Median Household Income in Hatch is $93,125.
What is Inequality or Gini Index in Hatch?
Inequality or Gini Index in Hatch is 0.21.
What is the Total Population of Hatch?
Total Population of Hatch is 131.
What is the Total Male Population of Hatch?
Total Male Population of Hatch is 63.
What is the Total Female Population of Hatch?
Total Female Population of Hatch is 68.
What is the Ratio of Males per 100 Females in Hatch?
There are 92.65 Males per 100 Females in Hatch.
What is the Ratio of Females per 100 Males in Hatch?
There are 107.94 Females per 100 Males in Hatch.
What is the Median Population Age in Hatch?
Median Population Age in Hatch is 36.1 Years.
What is the Average Family Size in Hatch
Average Family Size in Hatch is 3.7 People.
What is the Average Household Size in Hatch
Average Household Size in Hatch is 3.7 People.
How Large is the Labor Force in Hatch?
There are 43 People in the Labor Forcein in Hatch.
What is the Percentage of People in the Labor Force in Hatch?
54.4% of People are in the Labor Force in Hatch.
What is the Unemployment Rate in Hatch?
Unemployment Rate in Hatch is 16.3%.