Zip Codes with the Highest Percentage of Population Employed in Accommodation & Food Services in West Valley City, UT
RELATED REPORTS & OPTIONS
Accommodation & Food Services
West Valley City
Compare Zip Codes
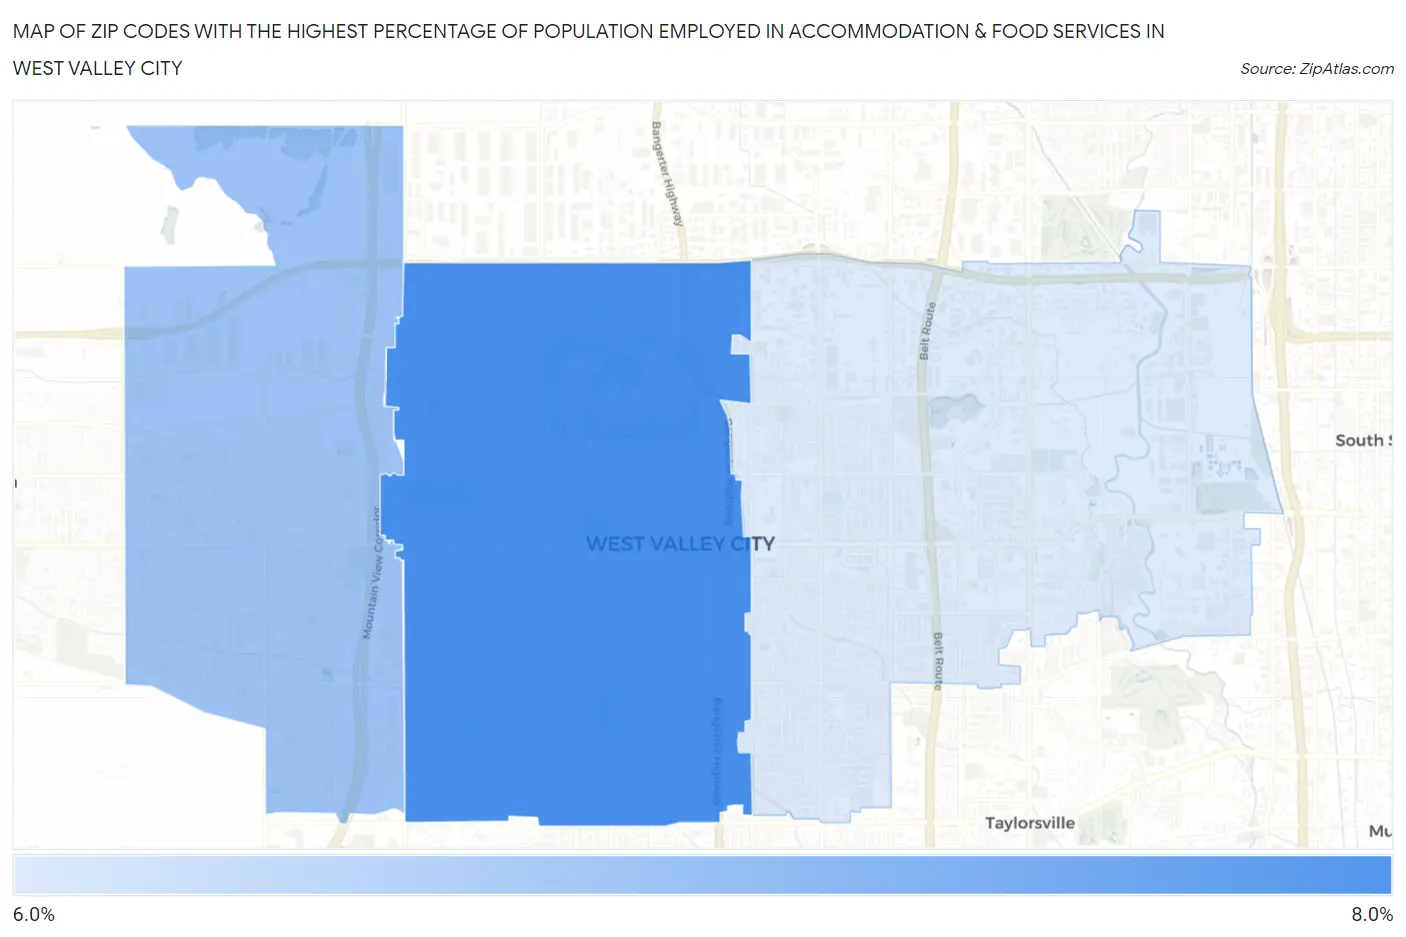
Map of Zip Codes with the Highest Percentage of Population Employed in Accommodation & Food Services in West Valley City
6.4%
7.7%
Zip Codes with the Highest Percentage of Population Employed in Accommodation & Food Services in West Valley City, UT
| Zip Code | % Employed | vs State | vs National | |
| 1. | 84120 | 7.7% | 6.1%(+1.62)#73 | 6.9%(+0.863)#8,388 |
| 2. | 84128 | 7.0% | 6.1%(+0.875)#89 | 6.9%(+0.114)#10,328 |
| 3. | 84119 | 6.4% | 6.1%(+0.329)#103 | 6.9%(-0.432)#12,005 |
1
Common Questions
What are the Top Zip Codes with the Highest Percentage of Population Employed in Accommodation & Food Services in West Valley City, UT?
Top Zip Codes with the Highest Percentage of Population Employed in Accommodation & Food Services in West Valley City, UT are:
What zip code has the Highest Percentage of Population Employed in Accommodation & Food Services in West Valley City, UT?
84120 has the Highest Percentage of Population Employed in Accommodation & Food Services in West Valley City, UT with 7.7%.
What is the Percentage of Population Employed in Accommodation & Food Services in West Valley City, UT?
Percentage of Population Employed in Accommodation & Food Services in West Valley City is 7.1%.
What is the Percentage of Population Employed in Accommodation & Food Services in Utah?
Percentage of Population Employed in Accommodation & Food Services in Utah is 6.1%.
What is the Percentage of Population Employed in Accommodation & Food Services in the United States?
Percentage of Population Employed in Accommodation & Food Services in the United States is 6.9%.