Zip Codes with the Highest Percentage of Population Employed in Accommodation & Food Services in Utah
RELATED REPORTS & OPTIONS
Accommodation & Food Services
Utah
Compare Zip Codes
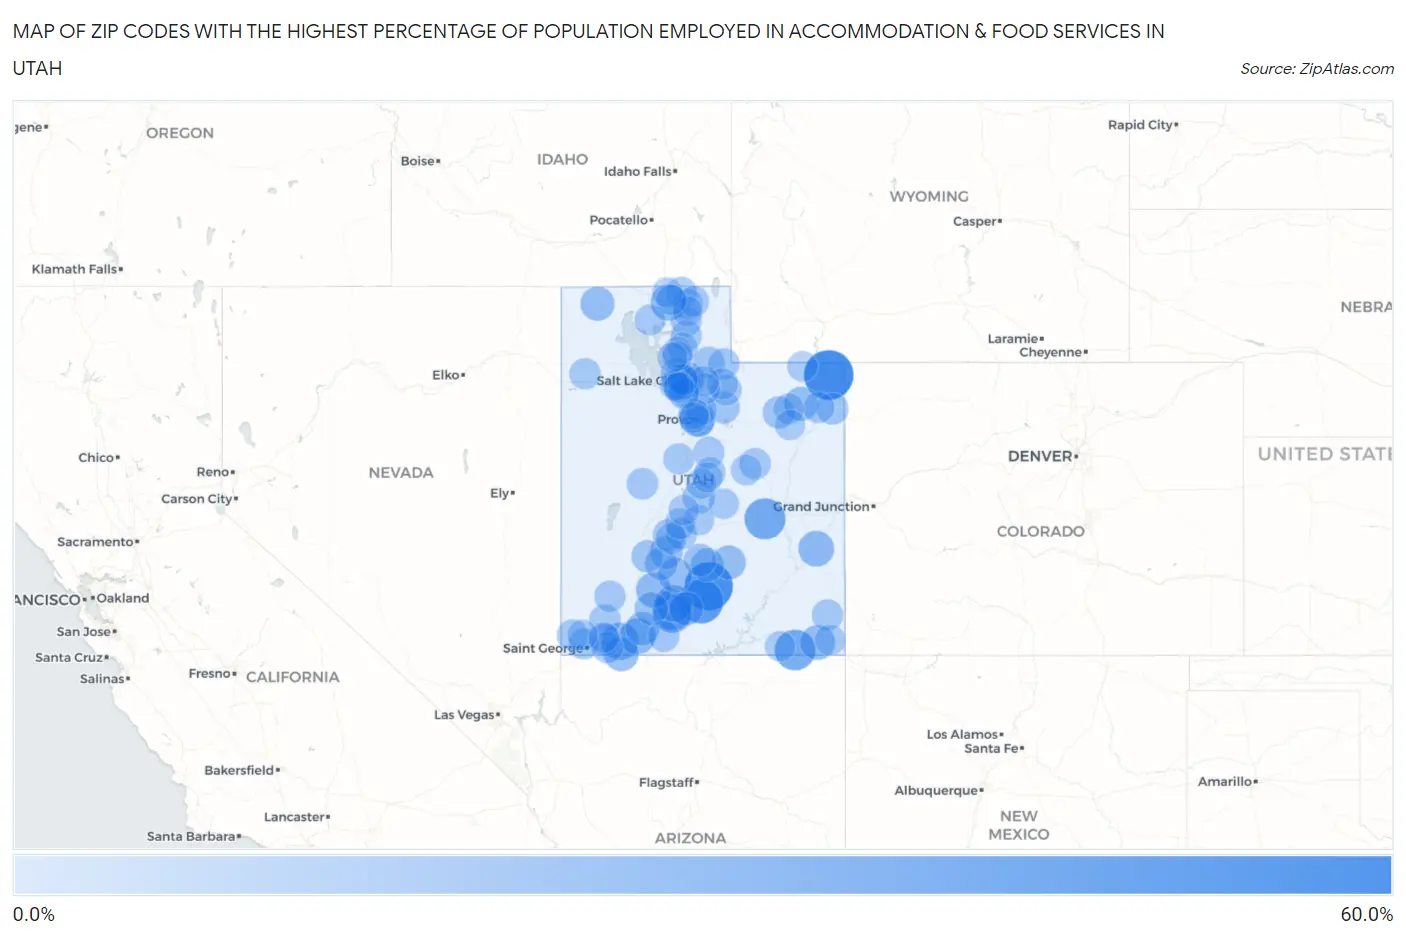
Map of Zip Codes with the Highest Percentage of Population Employed in Accommodation & Food Services in Utah
0.0%
60.0%
Zip Codes with the Highest Percentage of Population Employed in Accommodation & Food Services in Utah
| Zip Code | % Employed | vs State | vs National | |
| 1. | 84023 | 55.7% | 6.1%(+49.6)#1 | 6.9%(+48.9)#67 |
| 2. | 84716 | 52.3% | 6.1%(+46.2)#2 | 6.9%(+45.4)#83 |
| 3. | 84726 | 42.2% | 6.1%(+36.0)#3 | 6.9%(+35.3)#150 |
| 4. | 84525 | 33.6% | 6.1%(+27.5)#4 | 6.9%(+26.7)#251 |
| 5. | 84531 | 32.7% | 6.1%(+26.5)#5 | 6.9%(+25.8)#270 |
| 6. | 84776 | 30.6% | 6.1%(+24.4)#6 | 6.9%(+23.7)#313 |
| 7. | 84718 | 27.3% | 6.1%(+21.2)#7 | 6.9%(+20.5)#409 |
| 8. | 84767 | 24.0% | 6.1%(+17.8)#8 | 6.9%(+17.1)#560 |
| 9. | 84764 | 23.3% | 6.1%(+17.2)#9 | 6.9%(+16.5)#593 |
| 10. | 84113 | 21.9% | 6.1%(+15.8)#10 | 6.9%(+15.0)#681 |
| 11. | 84334 | 21.2% | 6.1%(+15.1)#11 | 6.9%(+14.4)#731 |
| 12. | 84758 | 20.9% | 6.1%(+14.8)#12 | 6.9%(+14.0)#754 |
| 13. | 84532 | 20.3% | 6.1%(+14.2)#13 | 6.9%(+13.5)#801 |
| 14. | 84759 | 19.4% | 6.1%(+13.3)#14 | 6.9%(+12.6)#886 |
| 15. | 84602 | 19.1% | 6.1%(+13.0)#15 | 6.9%(+12.3)#934 |
| 16. | 84784 | 18.2% | 6.1%(+12.1)#16 | 6.9%(+11.3)#1,058 |
| 17. | 84512 | 18.1% | 6.1%(+12.0)#17 | 6.9%(+11.2)#1,078 |
| 18. | 84712 | 16.3% | 6.1%(+10.2)#18 | 6.9%(+9.40)#1,395 |
| 19. | 84775 | 16.1% | 6.1%(+10.0)#19 | 6.9%(+9.25)#1,424 |
| 20. | 84039 | 16.1% | 6.1%(+9.99)#20 | 6.9%(+9.23)#1,428 |
| 21. | 84329 | 16.1% | 6.1%(+9.98)#21 | 6.9%(+9.22)#1,434 |
| 22. | 84736 | 15.2% | 6.1%(+9.05)#22 | 6.9%(+8.29)#1,631 |
| 23. | 84729 | 15.1% | 6.1%(+9.01)#23 | 6.9%(+8.25)#1,637 |
| 24. | 84773 | 14.0% | 6.1%(+7.85)#24 | 6.9%(+7.09)#1,982 |
| 25. | 84735 | 14.0% | 6.1%(+7.83)#25 | 6.9%(+7.07)#1,988 |
| 26. | 84750 | 13.7% | 6.1%(+7.58)#26 | 6.9%(+6.82)#2,053 |
| 27. | 84740 | 13.0% | 6.1%(+6.84)#27 | 6.9%(+6.08)#2,361 |
| 28. | 84112 | 12.3% | 6.1%(+6.13)#28 | 6.9%(+5.37)#2,686 |
| 29. | 84715 | 12.2% | 6.1%(+6.04)#29 | 6.9%(+5.28)#2,743 |
| 30. | 84642 | 11.6% | 6.1%(+5.53)#30 | 6.9%(+4.77)#3,055 |
| 31. | 84007 | 11.4% | 6.1%(+5.27)#31 | 6.9%(+4.51)#3,239 |
| 32. | 84713 | 11.3% | 6.1%(+5.19)#32 | 6.9%(+4.43)#3,313 |
| 33. | 84032 | 11.1% | 6.1%(+5.02)#33 | 6.9%(+4.26)#3,438 |
| 34. | 84724 | 11.1% | 6.1%(+4.99)#34 | 6.9%(+4.23)#3,457 |
| 35. | 84104 | 10.9% | 6.1%(+4.75)#35 | 6.9%(+3.99)#3,663 |
| 36. | 84115 | 10.7% | 6.1%(+4.56)#36 | 6.9%(+3.80)#3,817 |
| 37. | 84035 | 10.6% | 6.1%(+4.46)#37 | 6.9%(+3.70)#3,906 |
| 38. | 84745 | 10.3% | 6.1%(+4.15)#38 | 6.9%(+3.39)#4,221 |
| 39. | 84024 | 10.3% | 6.1%(+4.14)#39 | 6.9%(+3.38)#4,243 |
| 40. | 84116 | 10.2% | 6.1%(+4.05)#40 | 6.9%(+3.29)#4,338 |
| 41. | 84624 | 10.0% | 6.1%(+3.91)#41 | 6.9%(+3.15)#4,498 |
| 42. | 84542 | 9.9% | 6.1%(+3.83)#42 | 6.9%(+3.07)#4,604 |
| 43. | 84629 | 9.8% | 6.1%(+3.69)#43 | 6.9%(+2.93)#4,788 |
| 44. | 84720 | 9.5% | 6.1%(+3.34)#44 | 6.9%(+2.58)#5,257 |
| 45. | 84511 | 9.4% | 6.1%(+3.25)#45 | 6.9%(+2.49)#5,395 |
| 46. | 84741 | 9.3% | 6.1%(+3.22)#46 | 6.9%(+2.46)#5,442 |
| 47. | 84737 | 9.3% | 6.1%(+3.19)#47 | 6.9%(+2.43)#5,486 |
| 48. | 84111 | 9.3% | 6.1%(+3.17)#48 | 6.9%(+2.41)#5,519 |
| 49. | 84721 | 9.3% | 6.1%(+3.13)#49 | 6.9%(+2.37)#5,574 |
| 50. | 84017 | 9.1% | 6.1%(+3.02)#50 | 6.9%(+2.26)#5,743 |
| 51. | 84606 | 9.1% | 6.1%(+2.95)#51 | 6.9%(+2.18)#5,864 |
| 52. | 84078 | 9.0% | 6.1%(+2.90)#52 | 6.9%(+2.14)#5,923 |
| 53. | 84338 | 9.0% | 6.1%(+2.88)#53 | 6.9%(+2.12)#5,957 |
| 54. | 84701 | 9.0% | 6.1%(+2.88)#54 | 6.9%(+2.12)#5,959 |
| 55. | 84765 | 9.0% | 6.1%(+2.87)#55 | 6.9%(+2.10)#5,979 |
| 56. | 84770 | 8.8% | 6.1%(+2.71)#56 | 6.9%(+1.95)#6,224 |
| 57. | 84083 | 8.8% | 6.1%(+2.67)#57 | 6.9%(+1.91)#6,301 |
| 58. | 84102 | 8.8% | 6.1%(+2.67)#58 | 6.9%(+1.91)#6,305 |
| 59. | 84604 | 8.8% | 6.1%(+2.65)#59 | 6.9%(+1.89)#6,346 |
| 60. | 84754 | 8.6% | 6.1%(+2.45)#60 | 6.9%(+1.69)#6,685 |
| 61. | 84648 | 8.3% | 6.1%(+2.21)#61 | 6.9%(+1.45)#7,131 |
| 62. | 84310 | 8.3% | 6.1%(+2.14)#62 | 6.9%(+1.38)#7,310 |
| 63. | 84647 | 8.2% | 6.1%(+2.05)#63 | 6.9%(+1.29)#7,479 |
| 64. | 84047 | 8.2% | 6.1%(+2.05)#64 | 6.9%(+1.29)#7,483 |
| 65. | 84036 | 8.2% | 6.1%(+2.05)#65 | 6.9%(+1.29)#7,485 |
| 66. | 84654 | 8.1% | 6.1%(+2.03)#66 | 6.9%(+1.27)#7,543 |
| 67. | 84055 | 8.1% | 6.1%(+2.03)#67 | 6.9%(+1.27)#7,548 |
| 68. | 84307 | 8.1% | 6.1%(+1.99)#68 | 6.9%(+1.23)#7,605 |
| 69. | 84060 | 8.1% | 6.1%(+1.98)#69 | 6.9%(+1.22)#7,623 |
| 70. | 84341 | 8.0% | 6.1%(+1.86)#70 | 6.9%(+1.10)#7,866 |
| 71. | 84657 | 8.0% | 6.1%(+1.85)#71 | 6.9%(+1.09)#7,880 |
| 72. | 84328 | 7.8% | 6.1%(+1.69)#72 | 6.9%(+0.925)#8,248 |
| 73. | 84120 | 7.7% | 6.1%(+1.62)#73 | 6.9%(+0.863)#8,388 |
| 74. | 84098 | 7.7% | 6.1%(+1.59)#74 | 6.9%(+0.830)#8,469 |
| 75. | 84501 | 7.7% | 6.1%(+1.54)#75 | 6.9%(+0.777)#8,604 |
| 76. | 84321 | 7.6% | 6.1%(+1.51)#76 | 6.9%(+0.751)#8,674 |
| 77. | 84774 | 7.6% | 6.1%(+1.51)#77 | 6.9%(+0.744)#8,689 |
| 78. | 84057 | 7.6% | 6.1%(+1.44)#78 | 6.9%(+0.674)#8,848 |
| 79. | 84534 | 7.4% | 6.1%(+1.28)#79 | 6.9%(+0.521)#9,252 |
| 80. | 84070 | 7.4% | 6.1%(+1.27)#80 | 6.9%(+0.511)#9,278 |
| 81. | 84523 | 7.4% | 6.1%(+1.24)#81 | 6.9%(+0.474)#9,361 |
| 82. | 84652 | 7.3% | 6.1%(+1.18)#82 | 6.9%(+0.415)#9,537 |
| 83. | 84066 | 7.3% | 6.1%(+1.17)#83 | 6.9%(+0.407)#9,569 |
| 84. | 84058 | 7.2% | 6.1%(+1.11)#84 | 6.9%(+0.348)#9,724 |
| 85. | 84101 | 7.2% | 6.1%(+1.07)#85 | 6.9%(+0.306)#9,841 |
| 86. | 84627 | 7.2% | 6.1%(+1.04)#86 | 6.9%(+0.274)#9,907 |
| 87. | 84046 | 7.1% | 6.1%(+0.945)#87 | 6.9%(+0.184)#10,144 |
| 88. | 84056 | 7.0% | 6.1%(+0.885)#88 | 6.9%(+0.124)#10,284 |
| 89. | 84128 | 7.0% | 6.1%(+0.875)#89 | 6.9%(+0.114)#10,328 |
| 90. | 84783 | 6.9% | 6.1%(+0.793)#90 | 6.9%(+0.031)#10,566 |
| 91. | 84662 | 6.9% | 6.1%(+0.766)#91 | 6.9%(+0.005)#10,627 |
| 92. | 84052 | 6.9% | 6.1%(+0.756)#92 | 6.9%(-0.005)#10,646 |
| 93. | 84403 | 6.8% | 6.1%(+0.713)#93 | 6.9%(-0.048)#10,782 |
| 94. | 84536 | 6.8% | 6.1%(+0.646)#94 | 6.9%(-0.116)#11,001 |
| 95. | 84326 | 6.7% | 6.1%(+0.539)#95 | 6.9%(-0.222)#11,332 |
| 96. | 84129 | 6.6% | 6.1%(+0.521)#96 | 6.9%(-0.240)#11,389 |
| 97. | 84330 | 6.6% | 6.1%(+0.510)#97 | 6.9%(-0.251)#11,422 |
| 98. | 84041 | 6.6% | 6.1%(+0.507)#98 | 6.9%(-0.254)#11,427 |
| 99. | 84311 | 6.6% | 6.1%(+0.477)#99 | 6.9%(-0.284)#11,530 |
| 100. | 84075 | 6.6% | 6.1%(+0.474)#100 | 6.9%(-0.287)#11,539 |
Common Questions
What are the Top 10 Zip Codes with the Highest Percentage of Population Employed in Accommodation & Food Services in Utah?
Top 10 Zip Codes with the Highest Percentage of Population Employed in Accommodation & Food Services in Utah are:
What zip code has the Highest Percentage of Population Employed in Accommodation & Food Services in Utah?
84023 has the Highest Percentage of Population Employed in Accommodation & Food Services in Utah with 55.7%.
What is the Percentage of Population Employed in Accommodation & Food Services in the State of Utah?
Percentage of Population Employed in Accommodation & Food Services in Utah is 6.1%.
What is the Percentage of Population Employed in Accommodation & Food Services in the United States?
Percentage of Population Employed in Accommodation & Food Services in the United States is 6.9%.