Zip Codes with the Highest Percentage of Population Employed in Accommodation & Food Services in Saint George, UT
RELATED REPORTS & OPTIONS
Accommodation & Food Services
Saint George
Compare Zip Codes
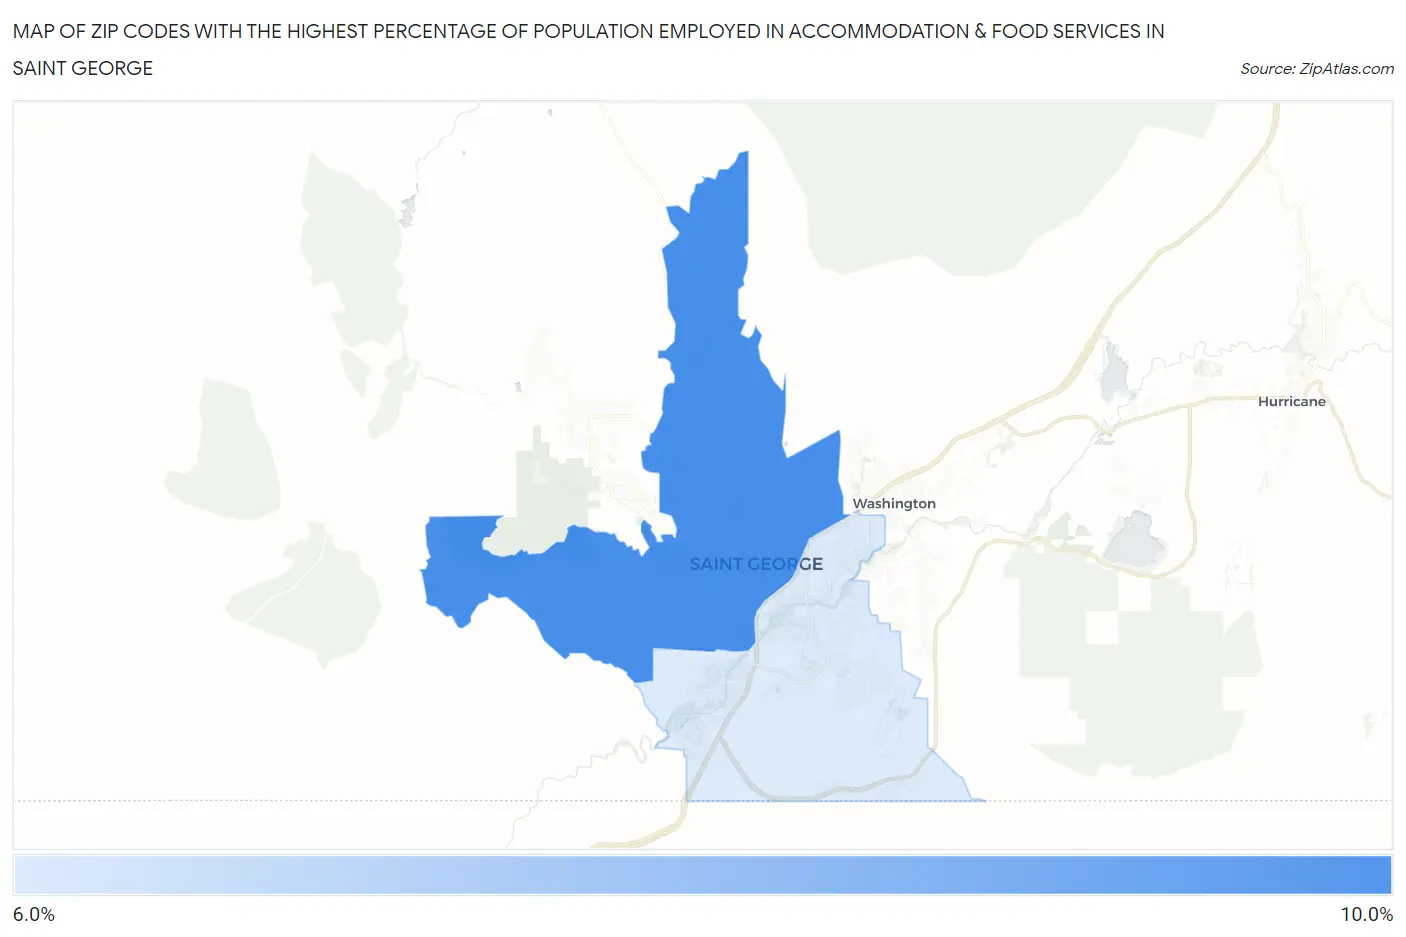
Map of Zip Codes with the Highest Percentage of Population Employed in Accommodation & Food Services in Saint George
6.5%
8.8%
Zip Codes with the Highest Percentage of Population Employed in Accommodation & Food Services in Saint George, UT
| Zip Code | % Employed | vs State | vs National | |
| 1. | 84770 | 8.8% | 6.1%(+2.71)#56 | 6.9%(+1.95)#6,224 |
| 2. | 84790 | 6.5% | 6.1%(+0.346)#102 | 6.9%(-0.415)#11,952 |
1
Common Questions
What are the Top Zip Codes with the Highest Percentage of Population Employed in Accommodation & Food Services in Saint George, UT?
Top Zip Codes with the Highest Percentage of Population Employed in Accommodation & Food Services in Saint George, UT are:
What zip code has the Highest Percentage of Population Employed in Accommodation & Food Services in Saint George, UT?
84770 has the Highest Percentage of Population Employed in Accommodation & Food Services in Saint George, UT with 8.8%.
What is the Percentage of Population Employed in Accommodation & Food Services in Utah?
Percentage of Population Employed in Accommodation & Food Services in Utah is 6.1%.
What is the Percentage of Population Employed in Accommodation & Food Services in the United States?
Percentage of Population Employed in Accommodation & Food Services in the United States is 6.9%.