Alta, UT Map & Demographics
Alta Map
Alta Overview
$41,716
PER CAPITA INCOME
$95,417
AVG FAMILY INCOME
0.78
INEQUALITY / GINI INDEX
376
TOTAL POPULATION
323
MALE POPULATION
53
FEMALE POPULATION
609.43
MALES / 100 FEMALES
16.41
FEMALES / 100 MALES
30.1
MEDIAN AGE
2.6
AVG FAMILY SIZE
1.8
AVG HOUSEHOLD SIZE
327
LABOR FORCE [ PEOPLE ]
90.6%
PERCENT IN LABOR FORCE
Alta Area Codes
Income in Alta
Income Overview in Alta
| Characteristic | Number | Measure |
| Per Capita Income | 376 | $41,716 |
| Median Family Income | 33 | $95,417 |
| Mean Family Income | 33 | $267,215 |
| Median Household Income | 70 | $0 |
| Mean Household Income | 70 | $173,549 |
| Income Deficit | 33 | $0 |
| Wage / Income Gap (%) | 376 | 0.00% |
| Wage / Income Gap ($) | 376 | 100.00¢ per $1 |
| Gini / Inequality Index | 376 | 0.78 |
Earnings by Sex in Alta
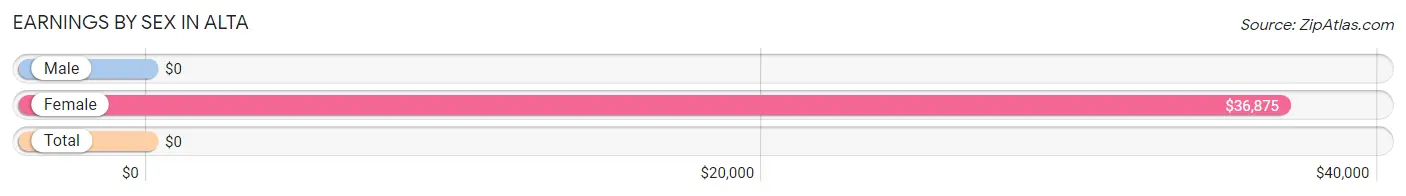
| Sex | Number | Average Earnings |
| Male | 304 (91.0%) | $0 |
| Female | 30 (9.0%) | $36,875 |
| Total | 334 (100.0%) | $0 |
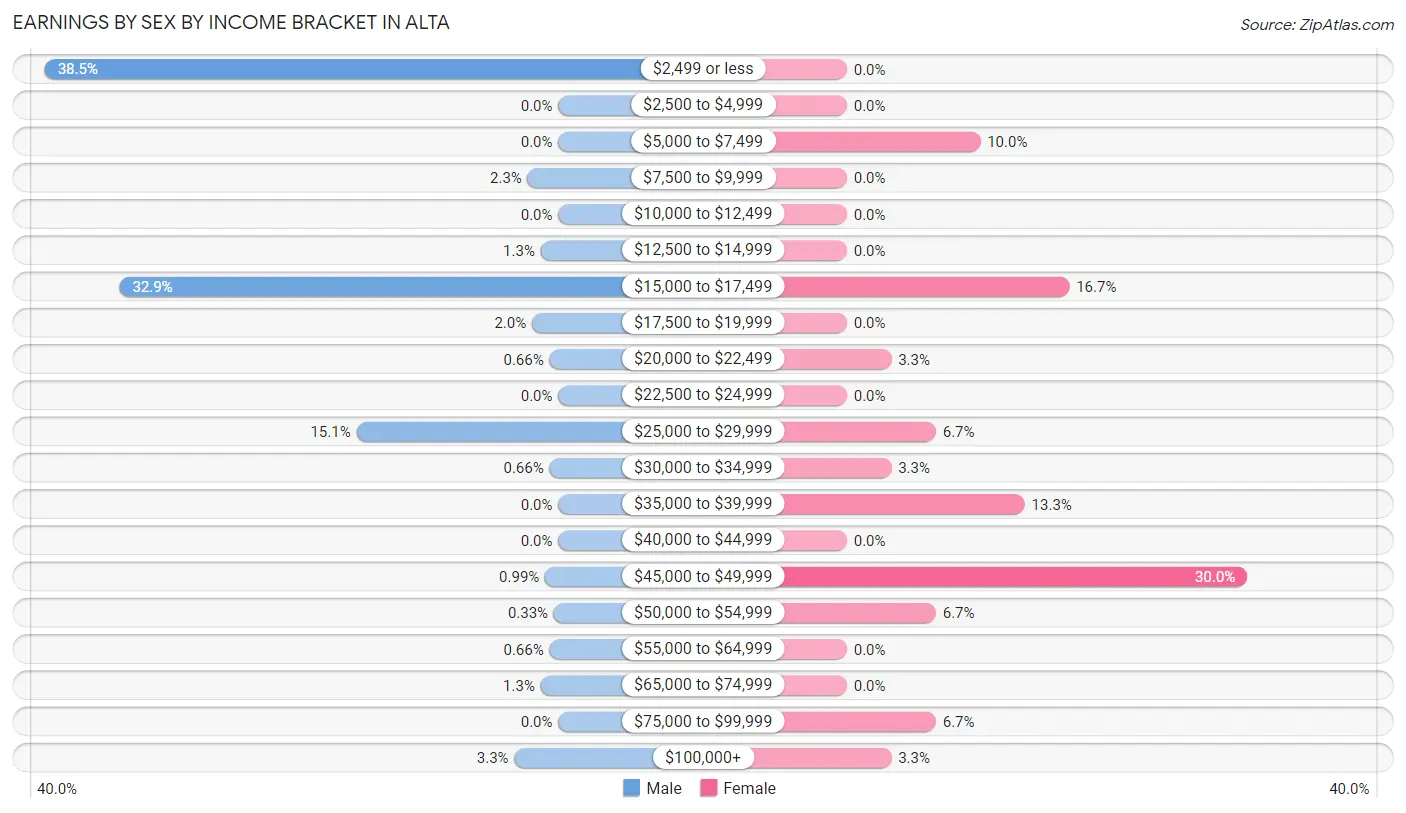
Earnings by Sex by Income Bracket in Alta
The most common earnings brackets in Alta are $2,499 or less for men (117 | 38.5%) and $45,000 to $49,999 for women (9 | 30.0%).
| Income | Male | Female |
| $2,499 or less | 117 (38.5%) | 0 (0.0%) |
| $2,500 to $4,999 | 0 (0.0%) | 0 (0.0%) |
| $5,000 to $7,499 | 0 (0.0%) | 3 (10.0%) |
| $7,500 to $9,999 | 7 (2.3%) | 0 (0.0%) |
| $10,000 to $12,499 | 0 (0.0%) | 0 (0.0%) |
| $12,500 to $14,999 | 4 (1.3%) | 0 (0.0%) |
| $15,000 to $17,499 | 100 (32.9%) | 5 (16.7%) |
| $17,500 to $19,999 | 6 (2.0%) | 0 (0.0%) |
| $20,000 to $22,499 | 2 (0.7%) | 1 (3.3%) |
| $22,500 to $24,999 | 0 (0.0%) | 0 (0.0%) |
| $25,000 to $29,999 | 46 (15.1%) | 2 (6.7%) |
| $30,000 to $34,999 | 2 (0.7%) | 1 (3.3%) |
| $35,000 to $39,999 | 0 (0.0%) | 4 (13.3%) |
| $40,000 to $44,999 | 0 (0.0%) | 0 (0.0%) |
| $45,000 to $49,999 | 3 (1.0%) | 9 (30.0%) |
| $50,000 to $54,999 | 1 (0.3%) | 2 (6.7%) |
| $55,000 to $64,999 | 2 (0.7%) | 0 (0.0%) |
| $65,000 to $74,999 | 4 (1.3%) | 0 (0.0%) |
| $75,000 to $99,999 | 0 (0.0%) | 2 (6.7%) |
| $100,000+ | 10 (3.3%) | 1 (3.3%) |
| Total | 304 (100.0%) | 30 (100.0%) |
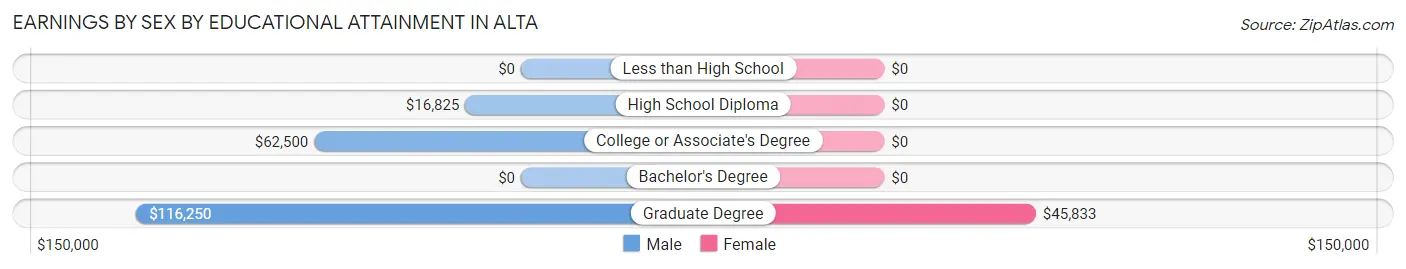
Earnings by Sex by Educational Attainment in Alta
Average earnings in Alta are $16,863 for men and $37,188 for women, a difference of 54.6%. Men with an educational attainment of graduate degree enjoy the highest average annual earnings of $116,250, while those with high school diploma education earn the least with $16,825. Women with an educational attainment of graduate degree earn the most with the average annual earnings of $45,833, while those with graduate degree education have the smallest earnings of $45,833.
| Educational Attainment | Male Income | Female Income |
| Less than High School | - | - |
| High School Diploma | $16,825 | $0 |
| College or Associate's Degree | $62,500 | $0 |
| Bachelor's Degree | - | - |
| Graduate Degree | $116,250 | $45,833 |
| Total | $16,863 | $37,188 |
Family Income in Alta
Family Income Brackets in Alta
According to the Alta family income data, there are 11 families falling into the $35,000 to $49,999 income range, which is the most common income bracket and makes up 33.3% of all families.
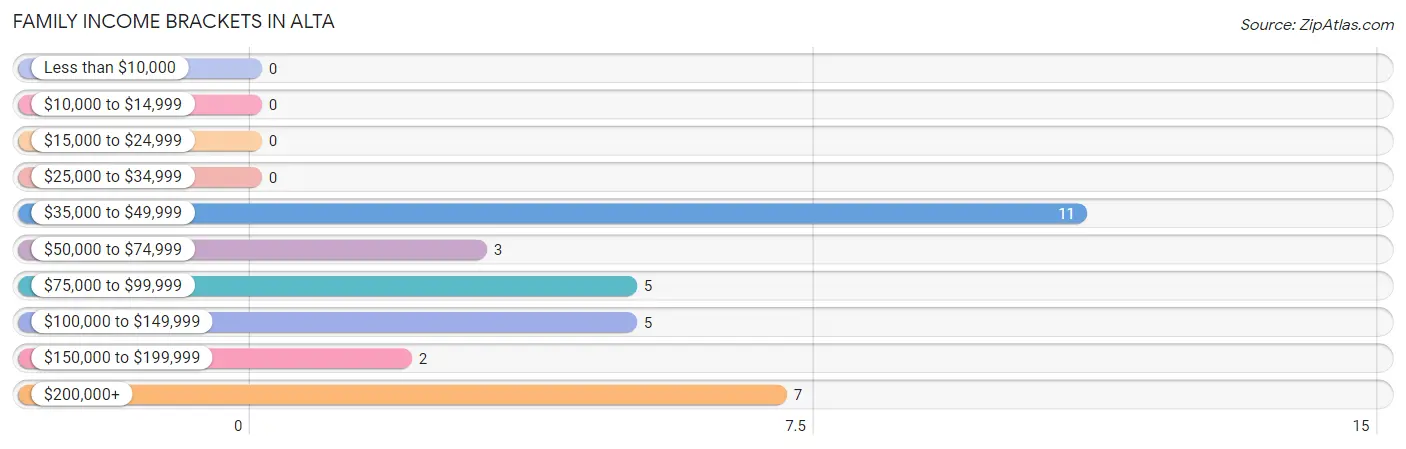
| Income Bracket | # Families | % Families |
| Less than $10,000 | 0 | 0.0% |
| $10,000 to $14,999 | 0 | 0.0% |
| $15,000 to $24,999 | 0 | 0.0% |
| $25,000 to $34,999 | 0 | 0.0% |
| $35,000 to $49,999 | 11 | 33.3% |
| $50,000 to $74,999 | 3 | 9.1% |
| $75,000 to $99,999 | 5 | 15.2% |
| $100,000 to $149,999 | 5 | 15.2% |
| $150,000 to $199,999 | 2 | 6.1% |
| $200,000+ | 7 | 21.2% |
Family Income by Famaliy Size in Alta
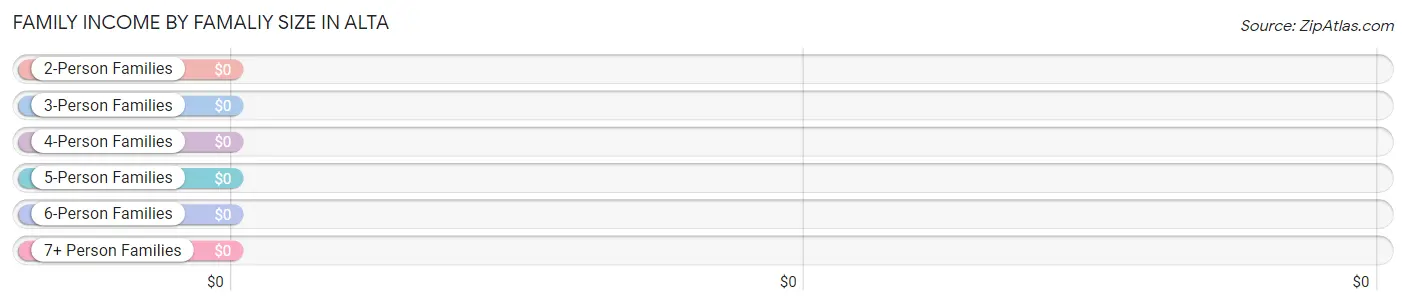
| Income Bracket | # Families | Median Income |
| 2-Person Families | 26 (78.8%) | $0 |
| 3-Person Families | 2 (6.1%) | $0 |
| 4-Person Families | 3 (9.1%) | $0 |
| 5-Person Families | 0 (0.0%) | $0 |
| 6-Person Families | 2 (6.1%) | $0 |
| 7+ Person Families | 0 (0.0%) | $0 |
| Total | 33 (100.0%) | $95,417 |
Family Income by Number of Earners in Alta
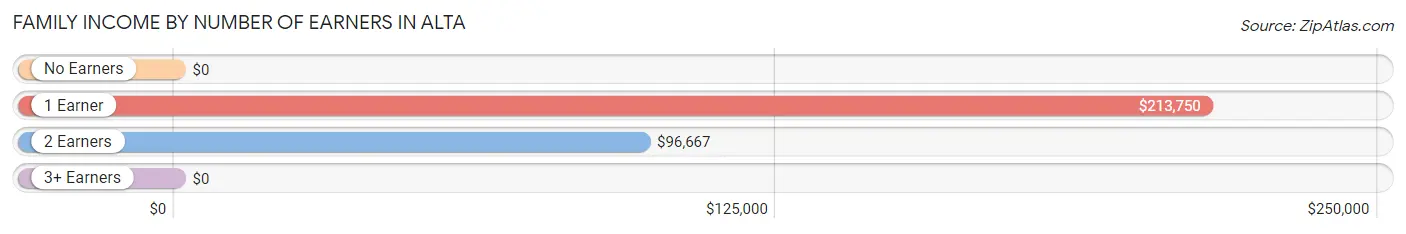
| Number of Earners | # Families | Median Income |
| No Earners | 8 (24.2%) | $0 |
| 1 Earner | 5 (15.1%) | $213,750 |
| 2 Earners | 20 (60.6%) | $96,667 |
| 3+ Earners | 0 (0.0%) | $0 |
| Total | 33 (100.0%) | $95,417 |
Household Income in Alta
Household Income Brackets in Alta
With 23 households falling in the category, the less than $10,000 income range is the most frequent in Alta, accounting for 32.9% of all households. In contrast, only 1 households (1.4%) fall into the $10,000 to $14,999 income bracket, making it the least populous group.
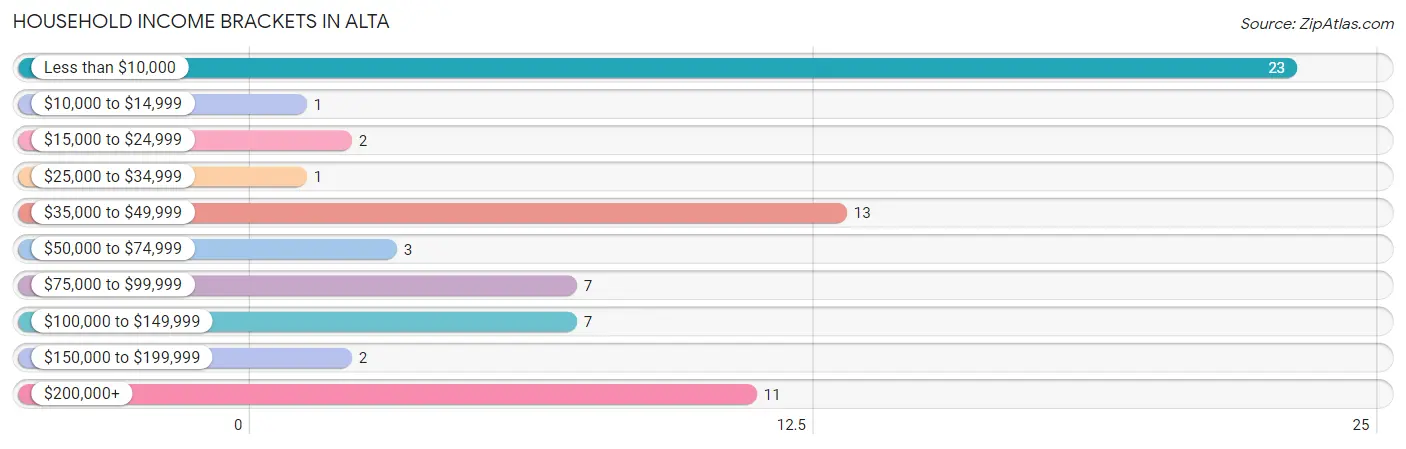
| Income Bracket | # Households | % Households |
| Less than $10,000 | 23 | 32.9% |
| $10,000 to $14,999 | 1 | 1.4% |
| $15,000 to $24,999 | 2 | 2.9% |
| $25,000 to $34,999 | 1 | 1.4% |
| $35,000 to $49,999 | 13 | 18.6% |
| $50,000 to $74,999 | 3 | 4.3% |
| $75,000 to $99,999 | 7 | 10.0% |
| $100,000 to $149,999 | 7 | 10.0% |
| $150,000 to $199,999 | 2 | 2.9% |
| $200,000+ | 11 | 15.7% |
Household Income by Householder Age in Alta
The median household income in Alta is $0, with the highest median household income of $203,750 found in the 65+ years age bracket for the primary householder. A total of 8 households (11.4%) fall into this category. Meanwhile, the 15 to 24 years age bracket for the primary householder has the lowest median household income of $0, with 1 households (1.4%) in this group.
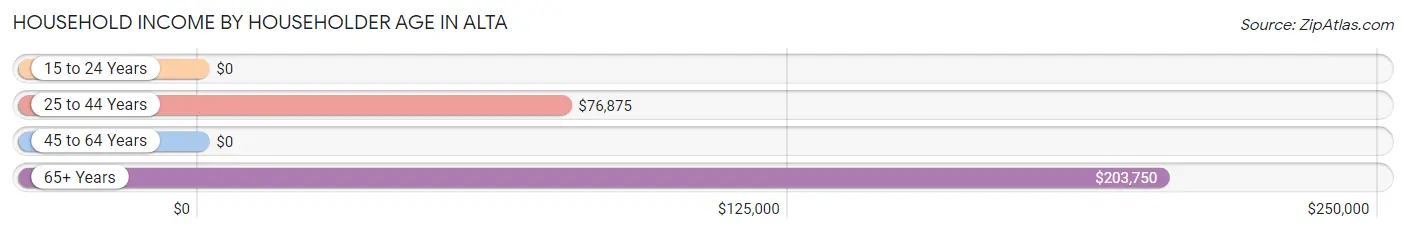
| Income Bracket | # Households | Median Income |
| 15 to 24 Years | 1 (1.4%) | $0 |
| 25 to 44 Years | 25 (35.7%) | $76,875 |
| 45 to 64 Years | 36 (51.4%) | $0 |
| 65+ Years | 8 (11.4%) | $203,750 |
| Total | 70 (100.0%) | $0 |
Poverty in Alta
Income Below Poverty by Sex and Age in Alta
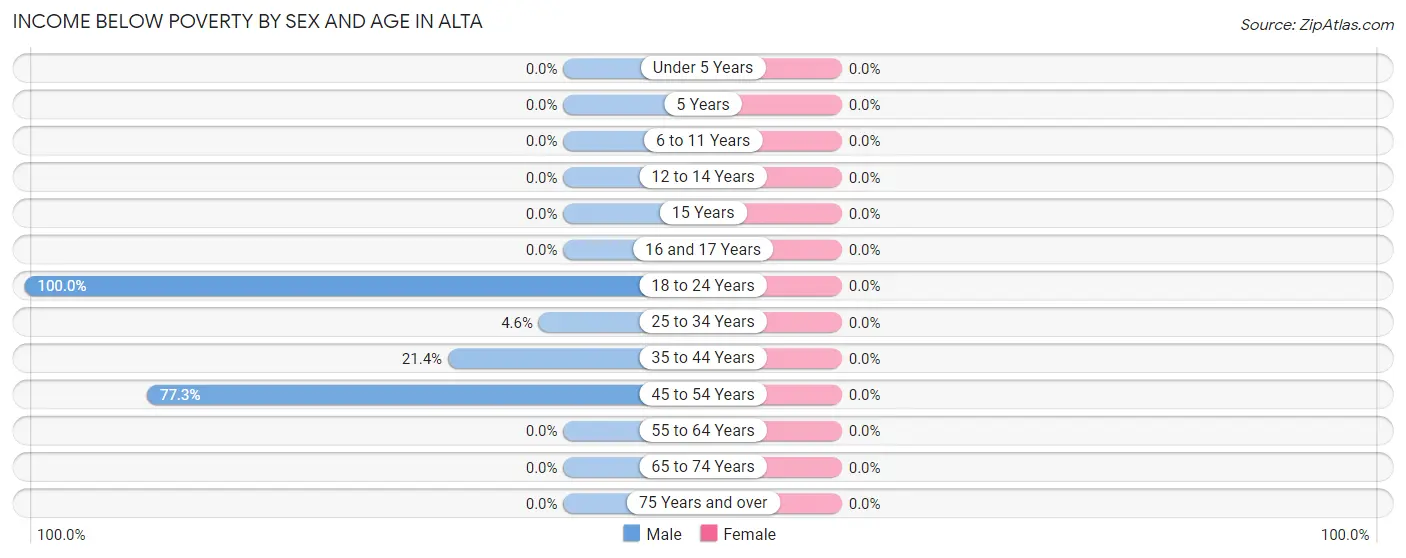
| Age Bracket | Male | Female |
| Under 5 Years | 0 (0.0%) | 0 (0.0%) |
| 5 Years | 0 (0.0%) | 0 (0.0%) |
| 6 to 11 Years | 0 (0.0%) | 0 (0.0%) |
| 12 to 14 Years | 0 (0.0%) | 0 (0.0%) |
| 15 Years | 0 (0.0%) | 0 (0.0%) |
| 16 and 17 Years | 0 (0.0%) | 0 (0.0%) |
| 18 to 24 Years | 101 (100.0%) | 0 (0.0%) |
| 25 to 34 Years | 7 (4.5%) | 0 (0.0%) |
| 35 to 44 Years | 3 (21.4%) | 0 (0.0%) |
| 45 to 54 Years | 17 (77.3%) | 0 (0.0%) |
| 55 to 64 Years | 0 (0.0%) | 0 (0.0%) |
| 65 to 74 Years | 0 (0.0%) | 0 (0.0%) |
| 75 Years and over | 0 (0.0%) | 0 (0.0%) |
| Total | 128 (39.6%) | 0 (0.0%) |
Income Above Poverty by Sex and Age in Alta
According to the poverty statistics in Alta, males aged under 5 years and females aged under 5 years are the age groups that are most secure financially, with 100.0% of males and 100.0% of females in these age groups living above the poverty line.
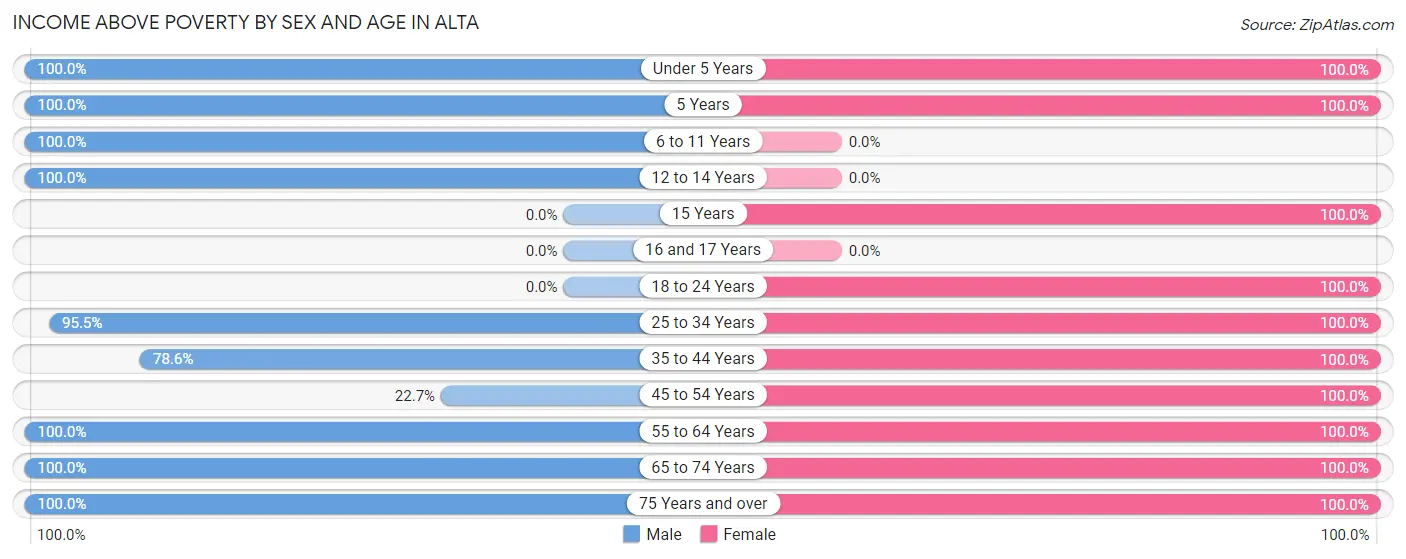
| Age Bracket | Male | Female |
| Under 5 Years | 3 (100.0%) | 3 (100.0%) |
| 5 Years | 3 (100.0%) | 2 (100.0%) |
| 6 to 11 Years | 2 (100.0%) | 0 (0.0%) |
| 12 to 14 Years | 1 (100.0%) | 0 (0.0%) |
| 15 Years | 0 (0.0%) | 1 (100.0%) |
| 16 and 17 Years | 0 (0.0%) | 0 (0.0%) |
| 18 to 24 Years | 0 (0.0%) | 4 (100.0%) |
| 25 to 34 Years | 147 (95.5%) | 3 (100.0%) |
| 35 to 44 Years | 11 (78.6%) | 12 (100.0%) |
| 45 to 54 Years | 5 (22.7%) | 9 (100.0%) |
| 55 to 64 Years | 15 (100.0%) | 13 (100.0%) |
| 65 to 74 Years | 3 (100.0%) | 2 (100.0%) |
| 75 Years and over | 5 (100.0%) | 4 (100.0%) |
| Total | 195 (60.4%) | 53 (100.0%) |
Income Below Poverty Among Married-Couple Families in Alta
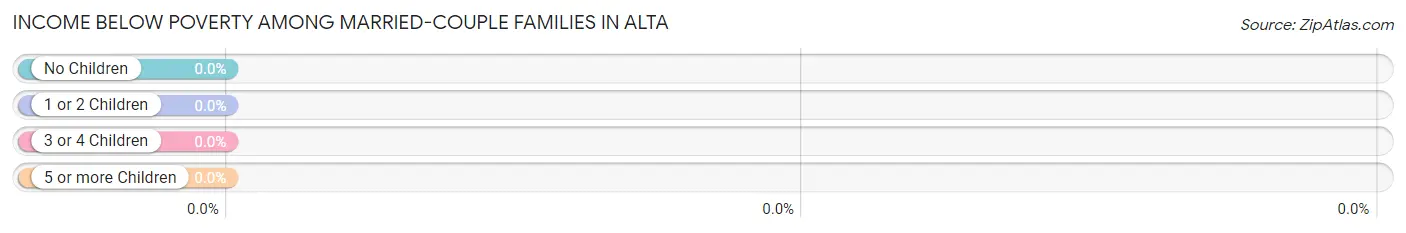
| Children | Above Poverty | Below Poverty |
| No Children | 24 (100.0%) | 0 (0.0%) |
| 1 or 2 Children | 5 (100.0%) | 0 (0.0%) |
| 3 or 4 Children | 0 (0.0%) | 0 (0.0%) |
| 5 or more Children | 0 (0.0%) | 0 (0.0%) |
| Total | 29 (100.0%) | 0 (0.0%) |
Income Below Poverty Among Single-Parent Households in Alta
| Children | Single Father | Single Mother |
| No Children | 0 (0.0%) | 0 (0.0%) |
| 1 or 2 Children | 0 (0.0%) | 0 (0.0%) |
| 3 or 4 Children | 0 (0.0%) | 0 (0.0%) |
| 5 or more Children | 0 (0.0%) | 0 (0.0%) |
| Total | 0 (0.0%) | 0 (0.0%) |
Income Below Poverty Among Married-Couple vs Single-Parent Households in Alta
| Children | Married-Couple Families | Single-Parent Households |
| No Children | 0 (0.0%) | 0 (0.0%) |
| 1 or 2 Children | 0 (0.0%) | 0 (0.0%) |
| 3 or 4 Children | 0 (0.0%) | 0 (0.0%) |
| 5 or more Children | 0 (0.0%) | 0 (0.0%) |
| Total | 0 (0.0%) | 0 (0.0%) |
Race in Alta
The most populous races in Alta are White / Caucasian (213 | 56.7%), Black / African American (100 | 26.6%), and Two or more Races (63 | 16.8%).
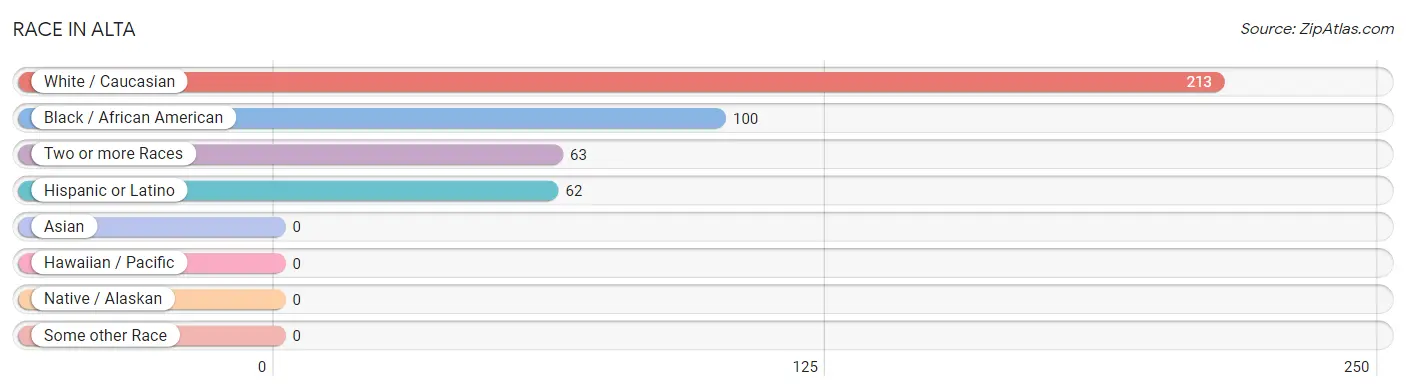
| Race | # Population | % Population |
| Asian | 0 | 0.0% |
| Black / African American | 100 | 26.6% |
| Hawaiian / Pacific | 0 | 0.0% |
| Hispanic or Latino | 62 | 16.5% |
| Native / Alaskan | 0 | 0.0% |
| White / Caucasian | 213 | 56.7% |
| Two or more Races | 63 | 16.8% |
| Some other Race | 0 | 0.0% |
| Total | 376 | 100.0% |
Ancestry in Alta
The most populous ancestries reported in Alta are Irish (71 | 18.9%), Mexican (62 | 16.5%), European (44 | 11.7%), English (42 | 11.2%), and German (19 | 5.1%), together accounting for 63.3% of all Alta residents.
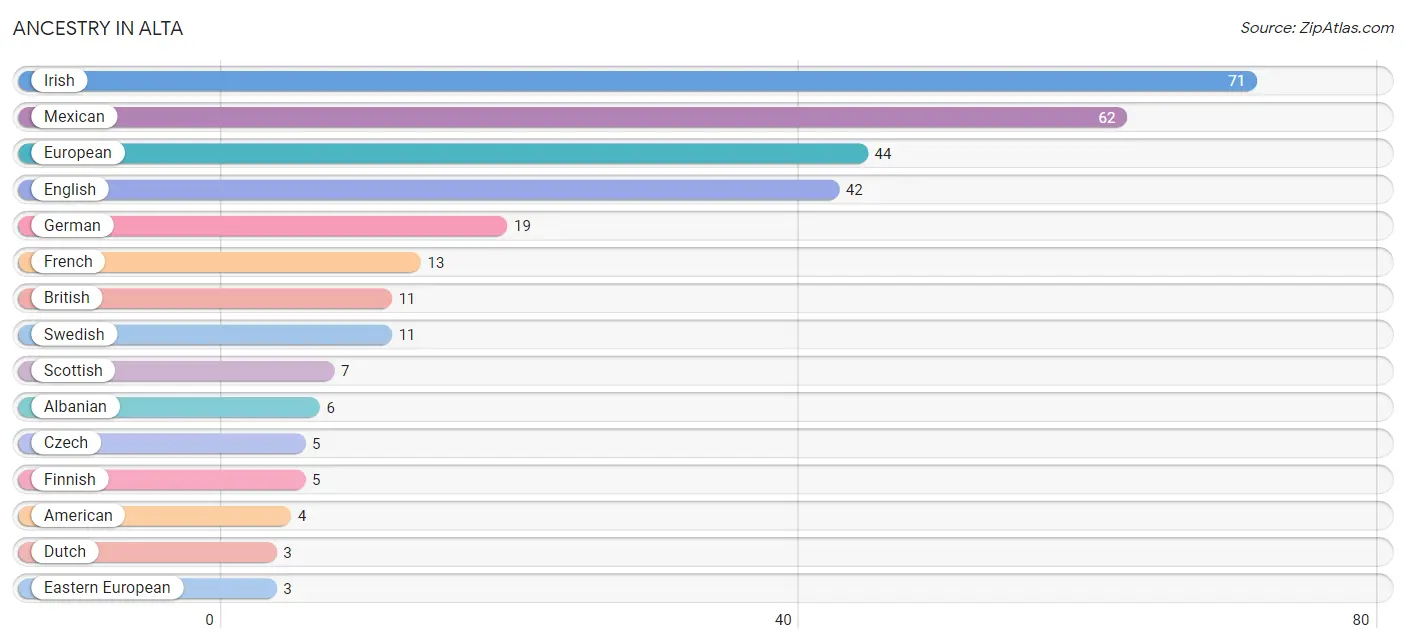
| Ancestry | # Population | % Population |
| Albanian | 6 | 1.6% |
| American | 4 | 1.1% |
| Austrian | 2 | 0.5% |
| British | 11 | 2.9% |
| Czech | 5 | 1.3% |
| Dutch | 3 | 0.8% |
| Eastern European | 3 | 0.8% |
| English | 42 | 11.2% |
| European | 44 | 11.7% |
| Finnish | 5 | 1.3% |
| French | 13 | 3.5% |
| French Canadian | 1 | 0.3% |
| German | 19 | 5.1% |
| Greek | 1 | 0.3% |
| Irish | 71 | 18.9% |
| Italian | 3 | 0.8% |
| Mexican | 62 | 16.5% |
| Polish | 2 | 0.5% |
| Scottish | 7 | 1.9% |
| Swedish | 11 | 2.9% | View All 20 Rows |
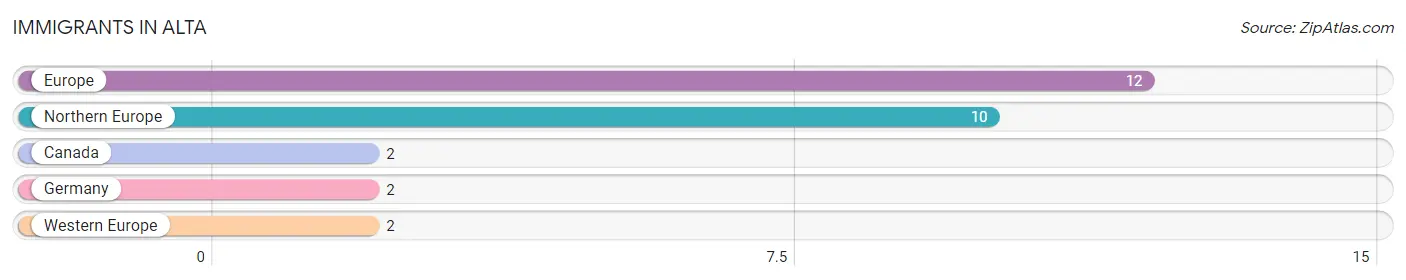
Immigrants in Alta
The most numerous immigrant groups reported in Alta came from Europe (12 | 3.2%), Northern Europe (10 | 2.7%), Canada (2 | 0.5%), Germany (2 | 0.5%), and Western Europe (2 | 0.5%), together accounting for 7.4% of all Alta residents.
| Immigration Origin | # Population | % Population |
| Canada | 2 | 0.5% |
| Europe | 12 | 3.2% |
| Germany | 2 | 0.5% |
| Northern Europe | 10 | 2.7% |
| Western Europe | 2 | 0.5% | View All 5 Rows |
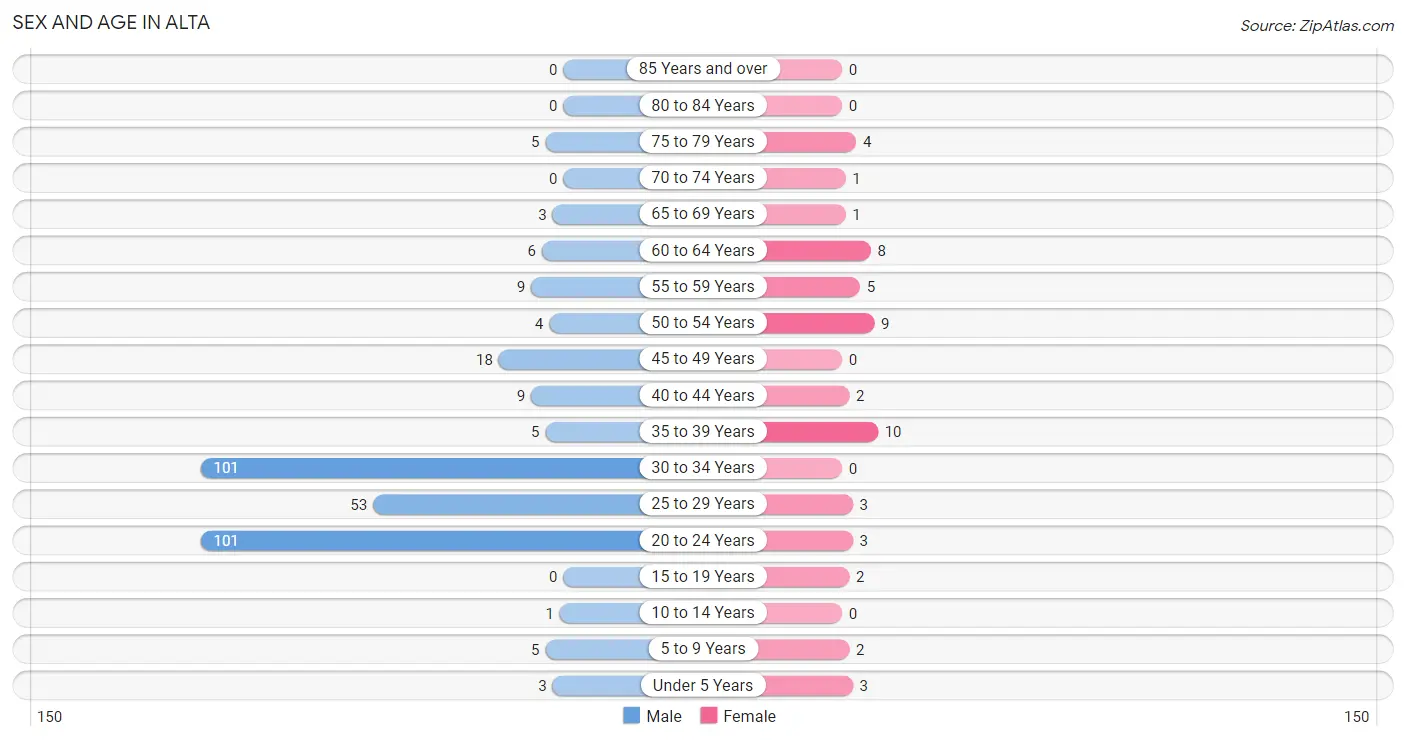
Sex and Age in Alta
Sex and Age in Alta
The most populous age groups in Alta are 20 to 24 Years (101 | 31.3%) for men and 35 to 39 Years (10 | 18.9%) for women.
| Age Bracket | Male | Female |
| Under 5 Years | 3 (0.9%) | 3 (5.7%) |
| 5 to 9 Years | 5 (1.5%) | 2 (3.8%) |
| 10 to 14 Years | 1 (0.3%) | 0 (0.0%) |
| 15 to 19 Years | 0 (0.0%) | 2 (3.8%) |
| 20 to 24 Years | 101 (31.3%) | 3 (5.7%) |
| 25 to 29 Years | 53 (16.4%) | 3 (5.7%) |
| 30 to 34 Years | 101 (31.3%) | 0 (0.0%) |
| 35 to 39 Years | 5 (1.5%) | 10 (18.9%) |
| 40 to 44 Years | 9 (2.8%) | 2 (3.8%) |
| 45 to 49 Years | 18 (5.6%) | 0 (0.0%) |
| 50 to 54 Years | 4 (1.2%) | 9 (17.0%) |
| 55 to 59 Years | 9 (2.8%) | 5 (9.4%) |
| 60 to 64 Years | 6 (1.9%) | 8 (15.1%) |
| 65 to 69 Years | 3 (0.9%) | 1 (1.9%) |
| 70 to 74 Years | 0 (0.0%) | 1 (1.9%) |
| 75 to 79 Years | 5 (1.5%) | 4 (7.5%) |
| 80 to 84 Years | 0 (0.0%) | 0 (0.0%) |
| 85 Years and over | 0 (0.0%) | 0 (0.0%) |
| Total | 323 (100.0%) | 53 (100.0%) |
Families and Households in Alta
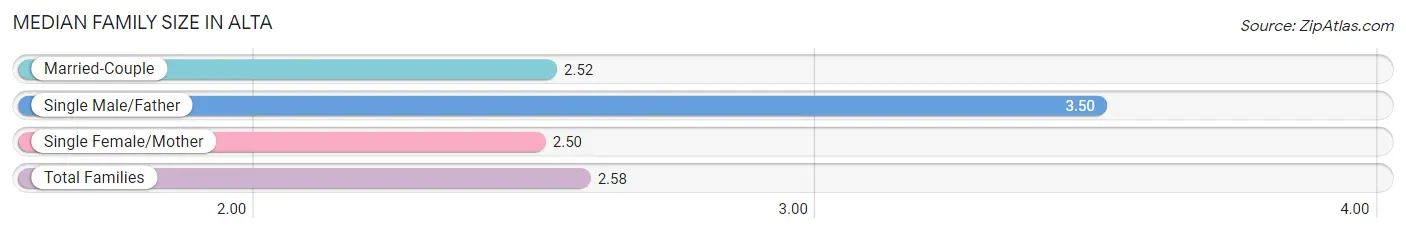
Median Family Size in Alta
The median family size in Alta is 2.58 persons per family, with single male/father families (2 | 6.1%) accounting for the largest median family size of 3.5 persons per family. On the other hand, single female/mother families (2 | 6.1%) represent the smallest median family size with 2.50 persons per family.
| Family Type | # Families | Family Size |
| Married-Couple | 29 (87.9%) | 2.52 |
| Single Male/Father | 2 (6.1%) | 3.50 |
| Single Female/Mother | 2 (6.1%) | 2.50 |
| Total Families | 33 (100.0%) | 2.58 |
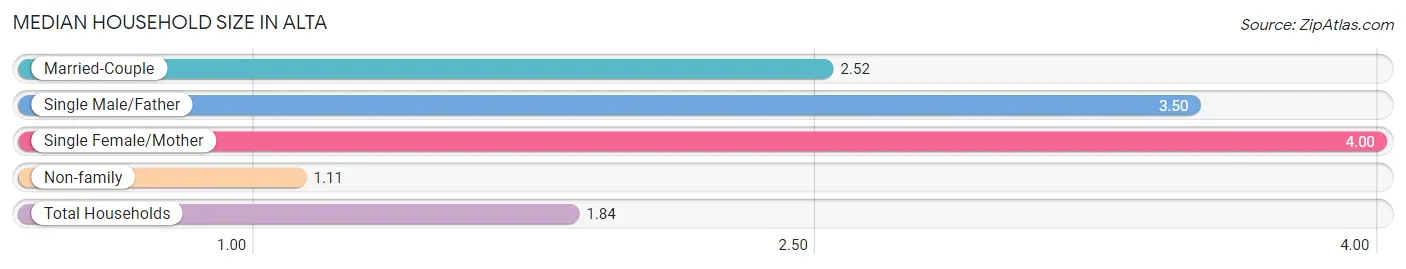
Median Household Size in Alta
The median household size in Alta is 1.84 persons per household, with single female/mother households (2 | 2.9%) accounting for the largest median household size of 4 persons per household. non-family households (37 | 52.9%) represent the smallest median household size with 1.11 persons per household.
| Household Type | # Households | Household Size |
| Married-Couple | 29 (41.4%) | 2.52 |
| Single Male/Father | 2 (2.9%) | 3.50 |
| Single Female/Mother | 2 (2.9%) | 4.00 |
| Non-family | 37 (52.9%) | 1.11 |
| Total Households | 70 (100.0%) | 1.84 |
Household Size by Marriage Status in Alta
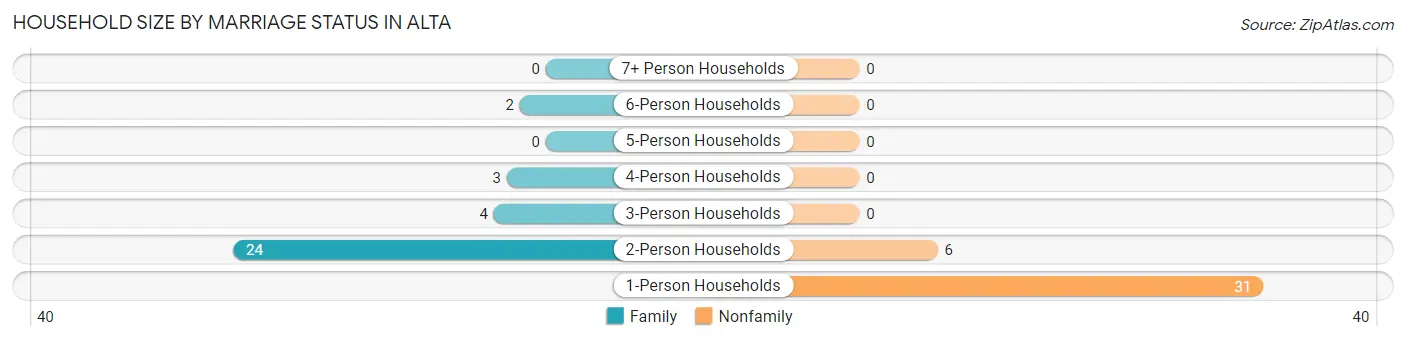
Out of a total of 70 households in Alta, 33 (47.1%) are family households, while 37 (52.9%) are nonfamily households. The most numerous type of family households are 2-person households, comprising 24, and the most common type of nonfamily households are 1-person households, comprising 31.
| Household Size | Family Households | Nonfamily Households |
| 1-Person Households | - | 31 (44.3%) |
| 2-Person Households | 24 (34.3%) | 6 (8.6%) |
| 3-Person Households | 4 (5.7%) | 0 (0.0%) |
| 4-Person Households | 3 (4.3%) | 0 (0.0%) |
| 5-Person Households | 0 (0.0%) | 0 (0.0%) |
| 6-Person Households | 2 (2.9%) | 0 (0.0%) |
| 7+ Person Households | 0 (0.0%) | 0 (0.0%) |
| Total | 33 (47.1%) | 37 (52.9%) |
Female Fertility in Alta
Fertility by Age in Alta
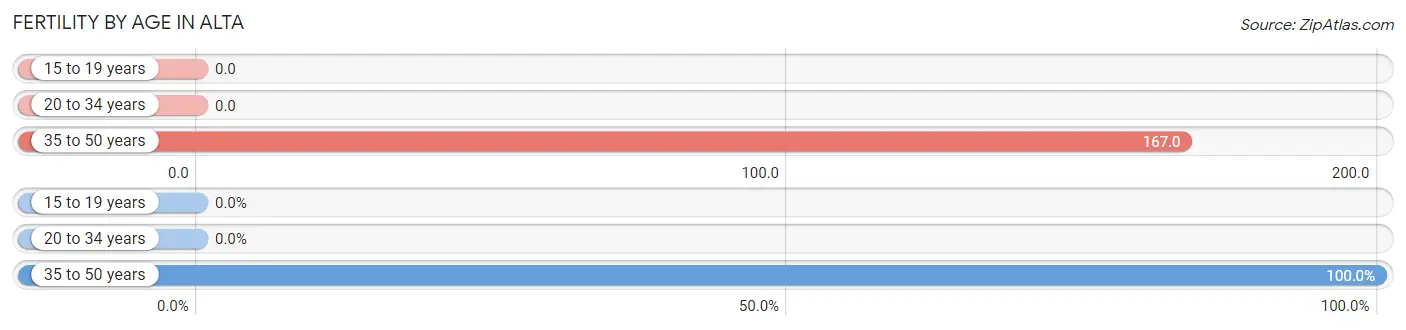
Average fertility rate in Alta is 100.0 births per 1,000 women. Women in the age bracket of 35 to 50 years have the highest fertility rate with 167.0 births per 1,000 women. Women in the age bracket of 35 to 50 years acount for 100.0% of all women with births.
| Age Bracket | Women with Births | Births / 1,000 Women |
| 15 to 19 years | 0 (0.0%) | 0.0 |
| 20 to 34 years | 0 (0.0%) | 0.0 |
| 35 to 50 years | 2 (100.0%) | 167.0 |
| Total | 2 (100.0%) | 100.0 |
Fertility by Age by Marriage Status in Alta
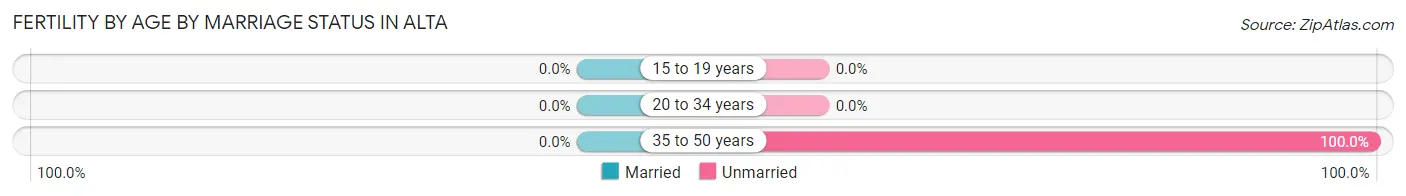
| Age Bracket | Married | Unmarried |
| 15 to 19 years | 0 (0.0%) | 0 (0.0%) |
| 20 to 34 years | 0 (0.0%) | 0 (0.0%) |
| 35 to 50 years | 0 (0.0%) | 2 (100.0%) |
| Total | 0 (0.0%) | 2 (100.0%) |
Fertility by Education in Alta
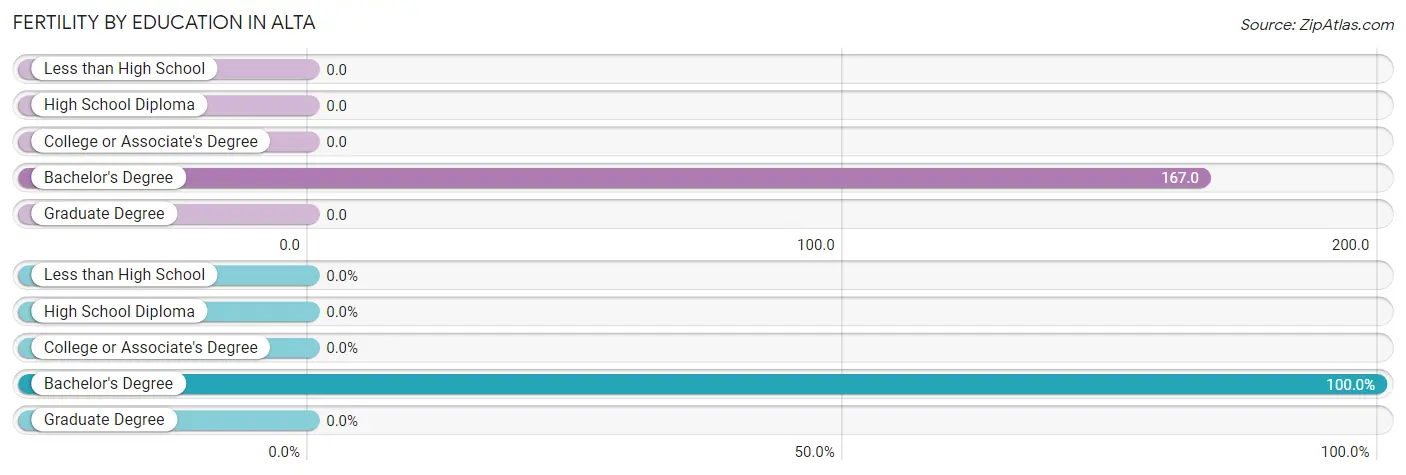
| Educational Attainment | Women with Births | Births / 1,000 Women |
| Less than High School | 0 (0.0%) | 0.0 |
| High School Diploma | 0 (0.0%) | 0.0 |
| College or Associate's Degree | 0 (0.0%) | 0.0 |
| Bachelor's Degree | 2 (100.0%) | 167.0 |
| Graduate Degree | 0 (0.0%) | 0.0 |
| Total | 2 (100.0%) | 100.0 |
Fertility by Education by Marriage Status in Alta
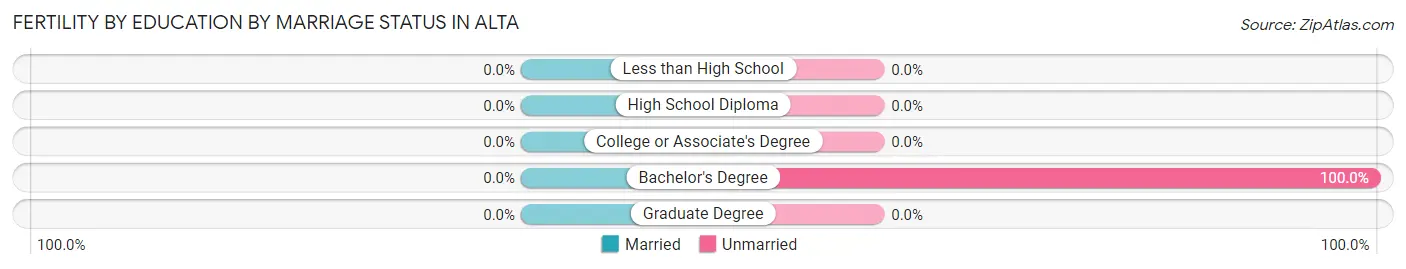
| Educational Attainment | Married | Unmarried |
| Less than High School | 0 (0.0%) | 0 (0.0%) |
| High School Diploma | 0 (0.0%) | 0 (0.0%) |
| College or Associate's Degree | 0 (0.0%) | 0 (0.0%) |
| Bachelor's Degree | 0 (0.0%) | 2 (100.0%) |
| Graduate Degree | 0 (0.0%) | 0 (0.0%) |
| Total | 0 (0.0%) | 2 (100.0%) |
Employment Characteristics in Alta
Employment by Class of Employer in Alta
Among the 222 employed individuals in Alta, private company employees (127 | 57.2%), federal government employees (59 | 26.6%), and self-employed (not incorporated) (26 | 11.7%) make up the most common classes of employment.
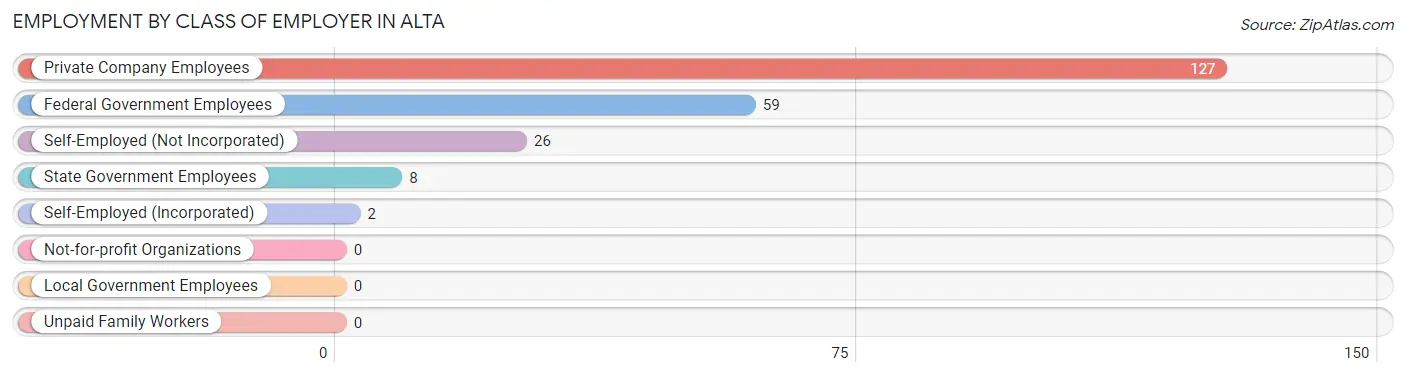
| Employer Class | # Employees | % Employees |
| Private Company Employees | 127 | 57.2% |
| Self-Employed (Incorporated) | 2 | 0.9% |
| Self-Employed (Not Incorporated) | 26 | 11.7% |
| Not-for-profit Organizations | 0 | 0.0% |
| Local Government Employees | 0 | 0.0% |
| State Government Employees | 8 | 3.6% |
| Federal Government Employees | 59 | 26.6% |
| Unpaid Family Workers | 0 | 0.0% |
| Total | 222 | 100.0% |
Employment Status by Age in Alta
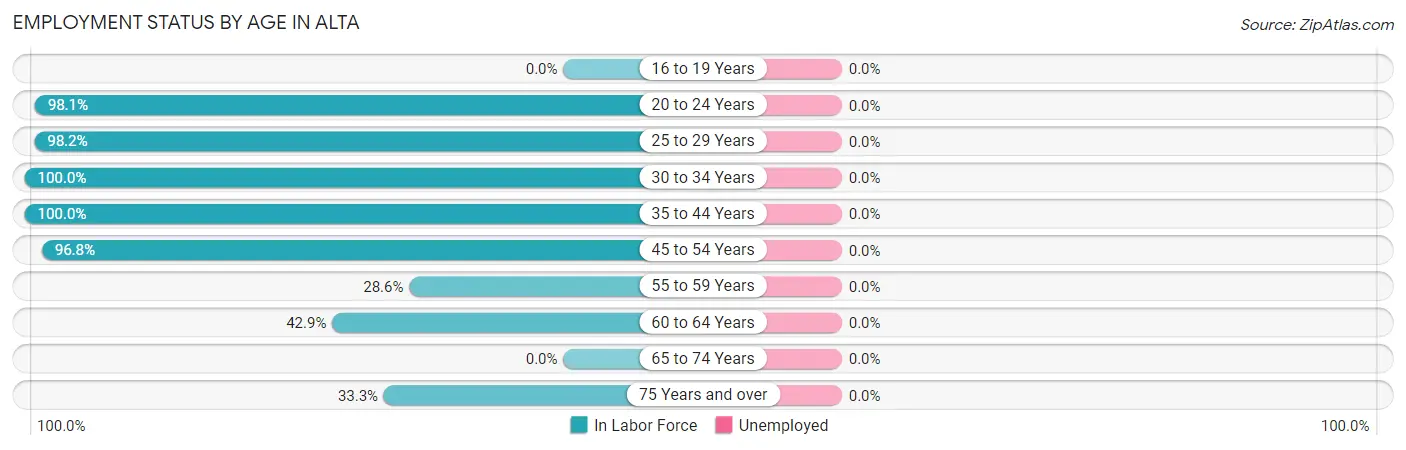
| Age Bracket | In Labor Force | Unemployed |
| 16 to 19 Years | 0 (0.0%) | 0 (0.0%) |
| 20 to 24 Years | 102 (98.1%) | 0 (0.0%) |
| 25 to 29 Years | 55 (98.2%) | 0 (0.0%) |
| 30 to 34 Years | 101 (100.0%) | 0 (0.0%) |
| 35 to 44 Years | 26 (100.0%) | 0 (0.0%) |
| 45 to 54 Years | 30 (96.8%) | 0 (0.0%) |
| 55 to 59 Years | 4 (28.6%) | 0 (0.0%) |
| 60 to 64 Years | 6 (42.9%) | 0 (0.0%) |
| 65 to 74 Years | 0 (0.0%) | 0 (0.0%) |
| 75 Years and over | 3 (33.3%) | 0 (0.0%) |
| Total | 327 (90.6%) | 0 (0.0%) |
Employment Status by Educational Attainment in Alta
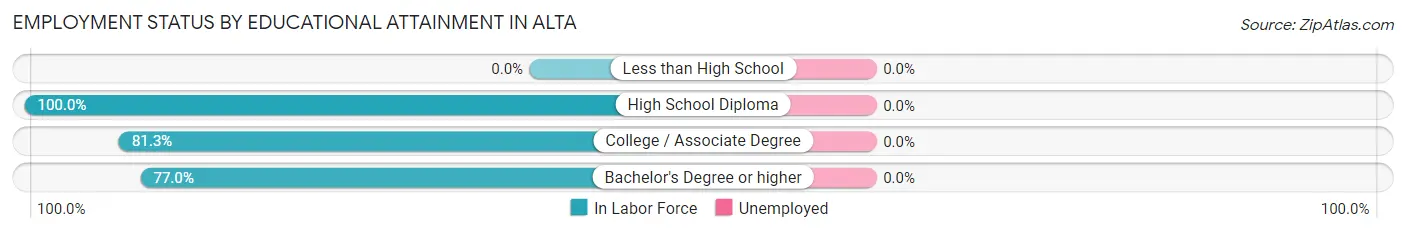
| Educational Attainment | In Labor Force | Unemployed |
| Less than High School | 0 (0.0%) | 0 (0.0%) |
| High School Diploma | 152 (100.0%) | 0 (0.0%) |
| College / Associate Degree | 13 (81.3%) | 0 (0.0%) |
| Bachelor's Degree or higher | 57 (77.0%) | 0 (0.0%) |
| Total | 222 (91.7%) | 0 (0.0%) |
Employment Occupations by Sex in Alta
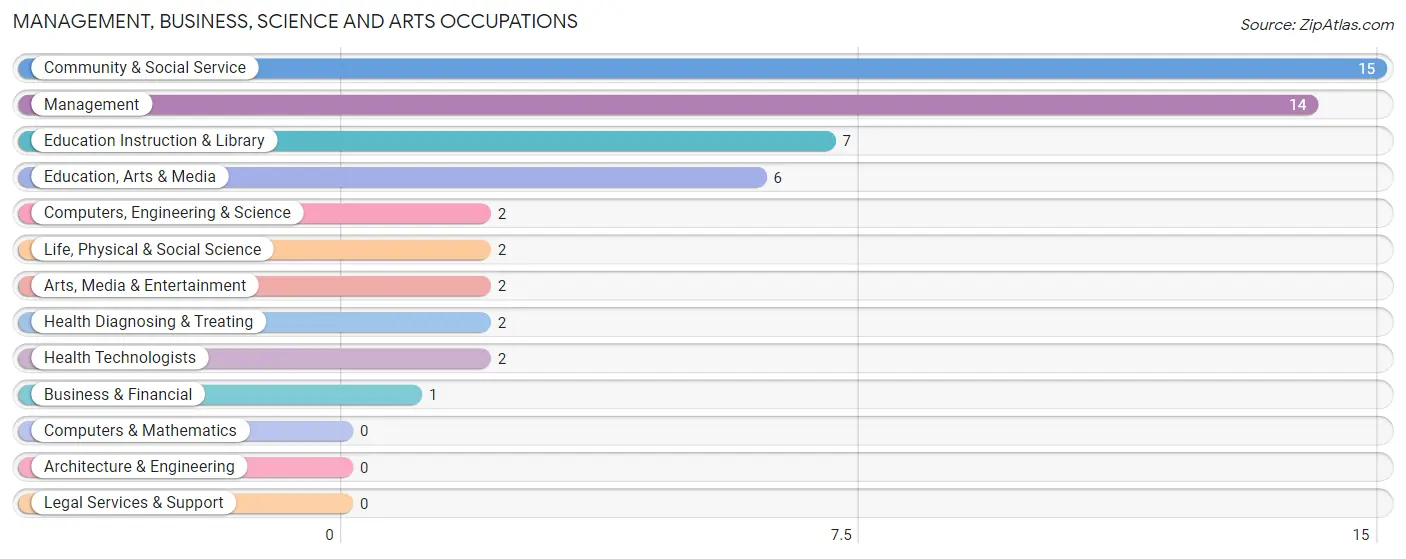
Management, Business, Science and Arts Occupations
The most common Management, Business, Science and Arts occupations in Alta are Community & Social Service (15 | 4.6%), Management (14 | 4.3%), Education Instruction & Library (7 | 2.1%), Education, Arts & Media (6 | 1.8%), and Computers, Engineering & Science (2 | 0.6%).
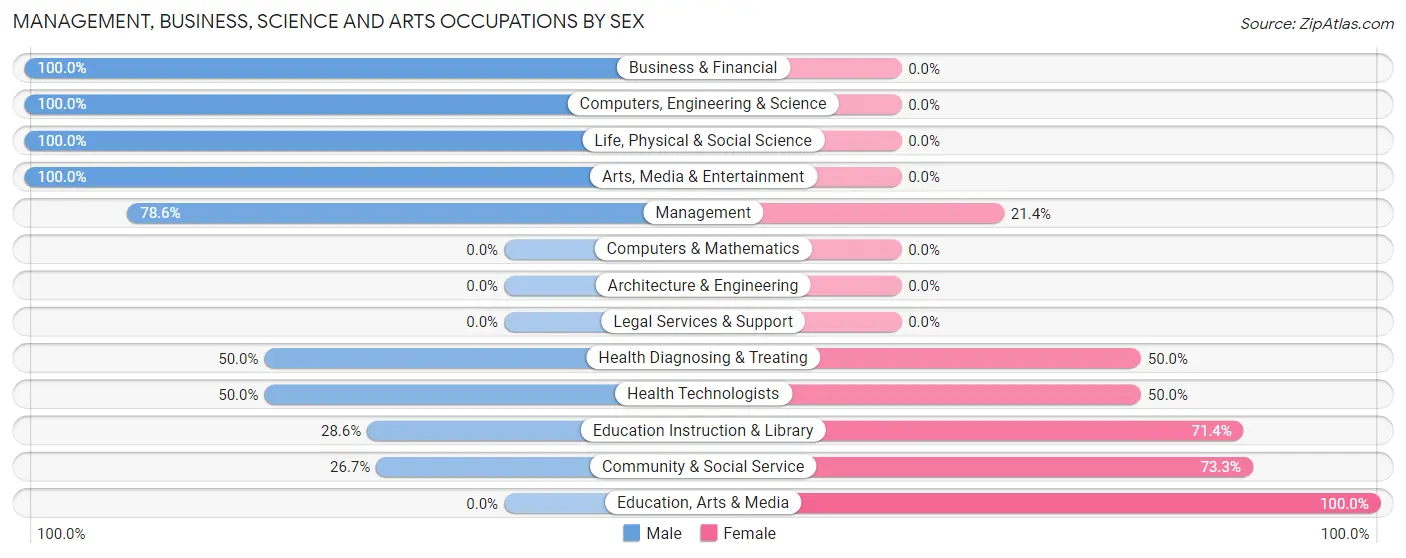
Management, Business, Science and Arts Occupations by Sex
Within the Management, Business, Science and Arts occupations in Alta, the most male-oriented occupations are Business & Financial (100.0%), Computers, Engineering & Science (100.0%), and Life, Physical & Social Science (100.0%), while the most female-oriented occupations are Education, Arts & Media (100.0%), Community & Social Service (73.3%), and Education Instruction & Library (71.4%).
| Occupation | Male | Female |
| Management | 11 (78.6%) | 3 (21.4%) |
| Business & Financial | 1 (100.0%) | 0 (0.0%) |
| Computers, Engineering & Science | 2 (100.0%) | 0 (0.0%) |
| Computers & Mathematics | 0 (0.0%) | 0 (0.0%) |
| Architecture & Engineering | 0 (0.0%) | 0 (0.0%) |
| Life, Physical & Social Science | 2 (100.0%) | 0 (0.0%) |
| Community & Social Service | 4 (26.7%) | 11 (73.3%) |
| Education, Arts & Media | 0 (0.0%) | 6 (100.0%) |
| Legal Services & Support | 0 (0.0%) | 0 (0.0%) |
| Education Instruction & Library | 2 (28.6%) | 5 (71.4%) |
| Arts, Media & Entertainment | 2 (100.0%) | 0 (0.0%) |
| Health Diagnosing & Treating | 1 (50.0%) | 1 (50.0%) |
| Health Technologists | 1 (50.0%) | 1 (50.0%) |
| Total (Category) | 19 (55.9%) | 15 (44.1%) |
| Total (Overall) | 303 (92.7%) | 24 (7.3%) |
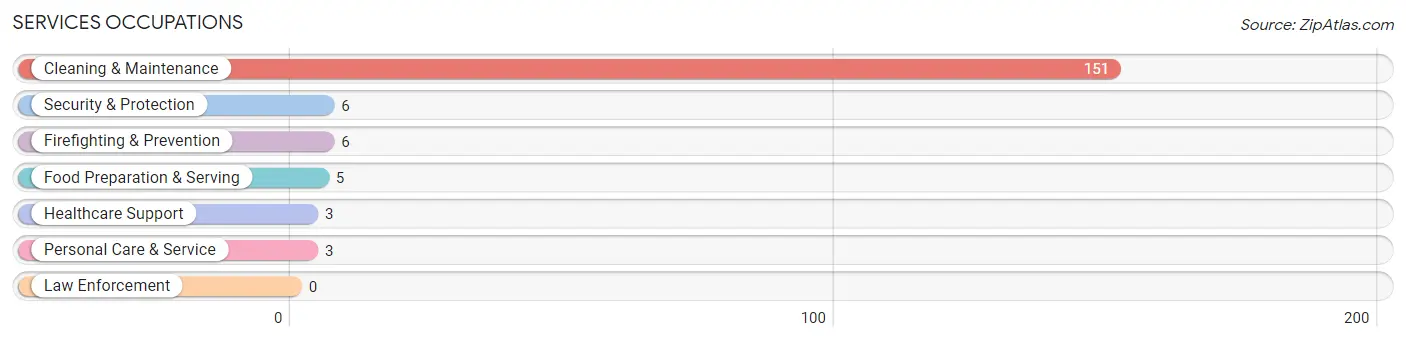
Services Occupations
The most common Services occupations in Alta are Cleaning & Maintenance (151 | 46.2%), Security & Protection (6 | 1.8%), Firefighting & Prevention (6 | 1.8%), Food Preparation & Serving (5 | 1.5%), and Healthcare Support (3 | 0.9%).
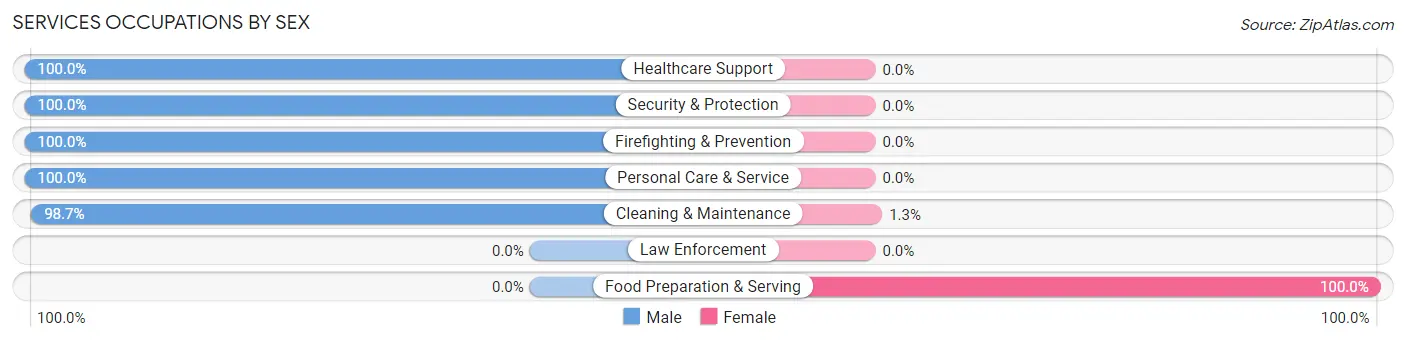
Services Occupations by Sex
Within the Services occupations in Alta, the most male-oriented occupations are Healthcare Support (100.0%), Security & Protection (100.0%), and Firefighting & Prevention (100.0%), while the most female-oriented occupations are Food Preparation & Serving (100.0%), and Cleaning & Maintenance (1.3%).
| Occupation | Male | Female |
| Healthcare Support | 3 (100.0%) | 0 (0.0%) |
| Security & Protection | 6 (100.0%) | 0 (0.0%) |
| Firefighting & Prevention | 6 (100.0%) | 0 (0.0%) |
| Law Enforcement | 0 (0.0%) | 0 (0.0%) |
| Food Preparation & Serving | 0 (0.0%) | 5 (100.0%) |
| Cleaning & Maintenance | 149 (98.7%) | 2 (1.3%) |
| Personal Care & Service | 3 (100.0%) | 0 (0.0%) |
| Total (Category) | 161 (95.8%) | 7 (4.2%) |
| Total (Overall) | 303 (92.7%) | 24 (7.3%) |
Sales and Office Occupations
The most common Sales and Office occupations in Alta are , and Office & Administration (2 | 0.6%).
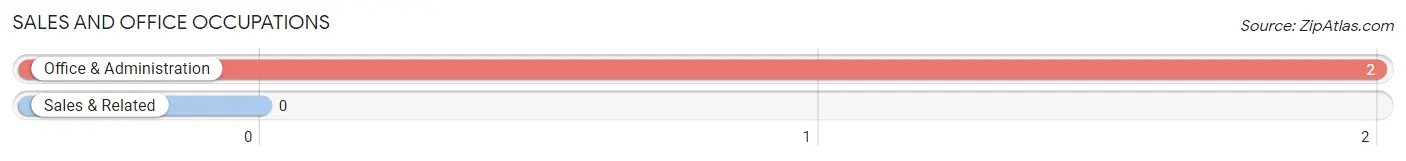
Sales and Office Occupations by Sex
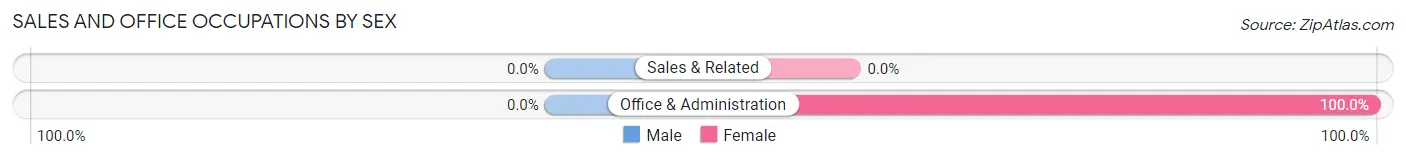
| Occupation | Male | Female |
| Sales & Related | 0 (0.0%) | 0 (0.0%) |
| Office & Administration | 0 (0.0%) | 2 (100.0%) |
| Total (Category) | 0 (0.0%) | 2 (100.0%) |
| Total (Overall) | 303 (92.7%) | 24 (7.3%) |
Natural Resources, Construction and Maintenance Occupations
The most common Natural Resources, Construction and Maintenance occupations in Alta are , and Installation, Maintenance & Repair (63 | 19.3%).
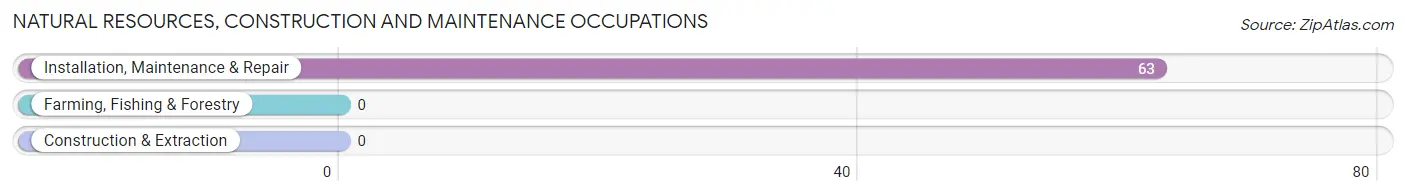
Natural Resources, Construction and Maintenance Occupations by Sex
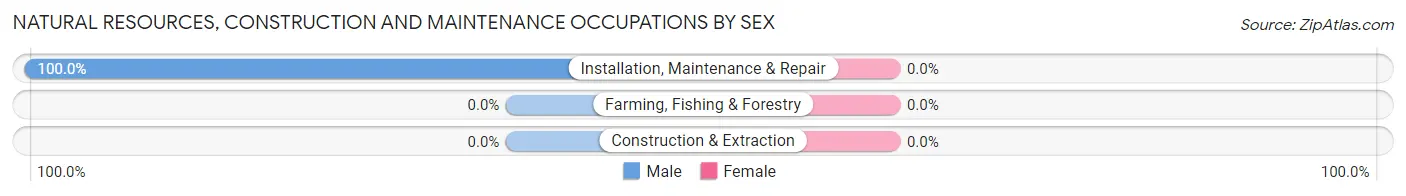
| Occupation | Male | Female |
| Farming, Fishing & Forestry | 0 (0.0%) | 0 (0.0%) |
| Construction & Extraction | 0 (0.0%) | 0 (0.0%) |
| Installation, Maintenance & Repair | 63 (100.0%) | 0 (0.0%) |
| Total (Category) | 63 (100.0%) | 0 (0.0%) |
| Total (Overall) | 303 (92.7%) | 24 (7.3%) |
Production, Transportation and Moving Occupations
The most common Production, Transportation and Moving occupations in Alta are Material Moving (59 | 18.0%), and Production (1 | 0.3%).
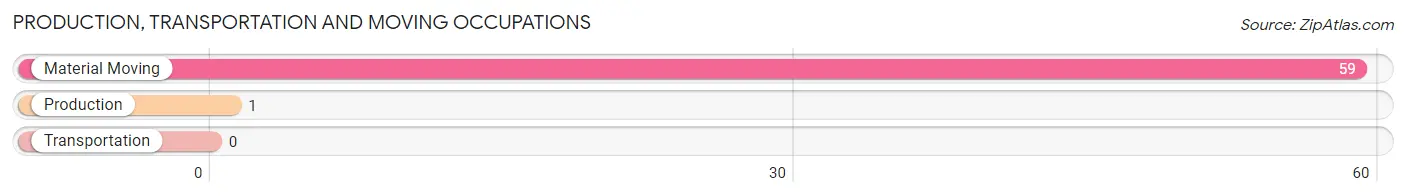
Production, Transportation and Moving Occupations by Sex
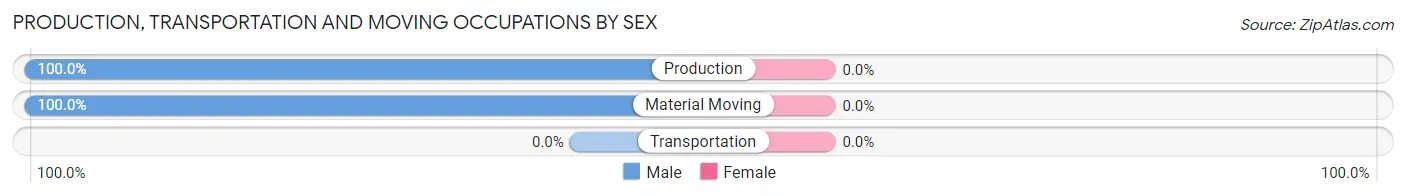
| Occupation | Male | Female |
| Production | 1 (100.0%) | 0 (0.0%) |
| Transportation | 0 (0.0%) | 0 (0.0%) |
| Material Moving | 59 (100.0%) | 0 (0.0%) |
| Total (Category) | 60 (100.0%) | 0 (0.0%) |
| Total (Overall) | 303 (92.7%) | 24 (7.3%) |
Employment Industries by Sex in Alta
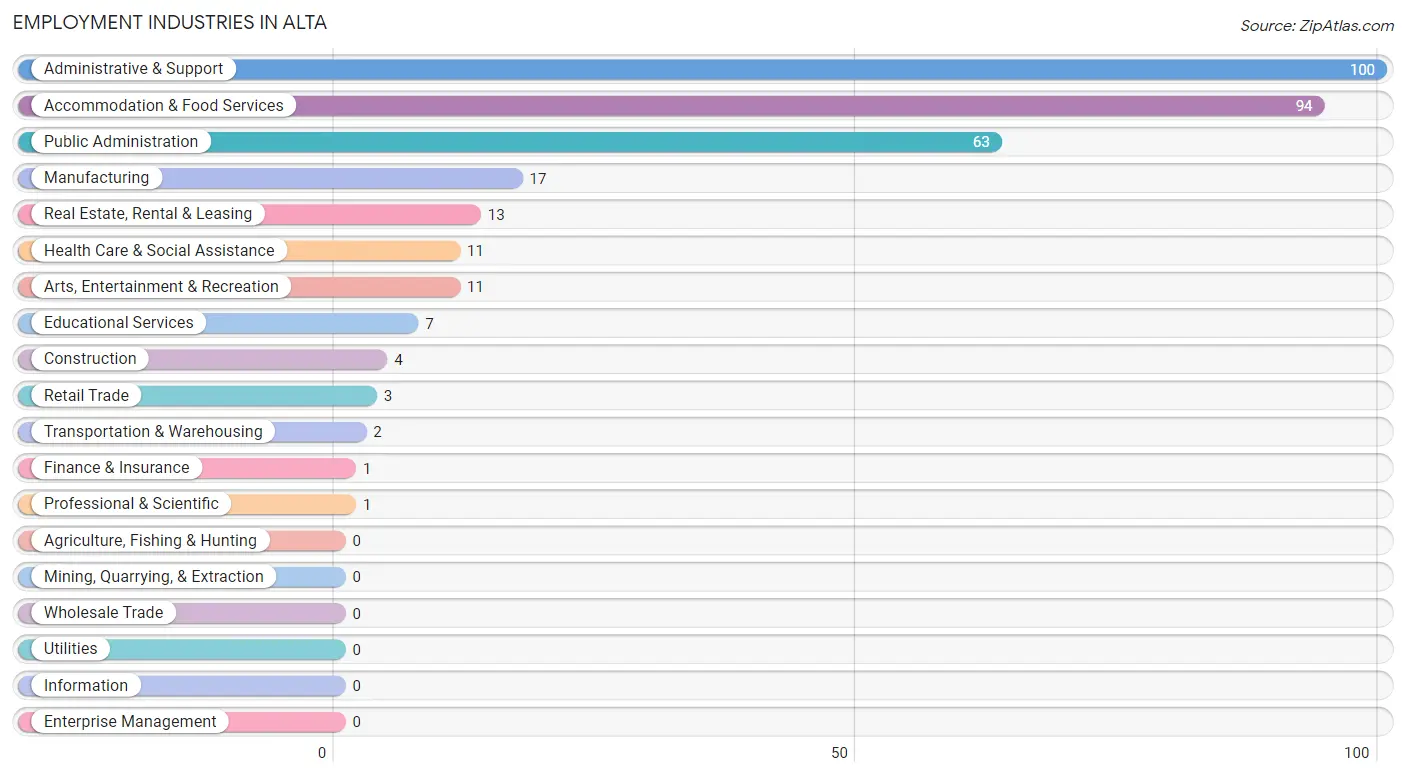
Employment Industries in Alta
The major employment industries in Alta include Administrative & Support (100 | 30.6%), Accommodation & Food Services (94 | 28.7%), Public Administration (63 | 19.3%), Manufacturing (17 | 5.2%), and Real Estate, Rental & Leasing (13 | 4.0%).
Employment Industries by Sex in Alta
The Alta industries that see more men than women are Construction (100.0%), Manufacturing (100.0%), and Transportation & Warehousing (100.0%), whereas the industries that tend to have a higher number of women are Retail Trade (100.0%), Educational Services (71.4%), and Health Care & Social Assistance (63.6%).
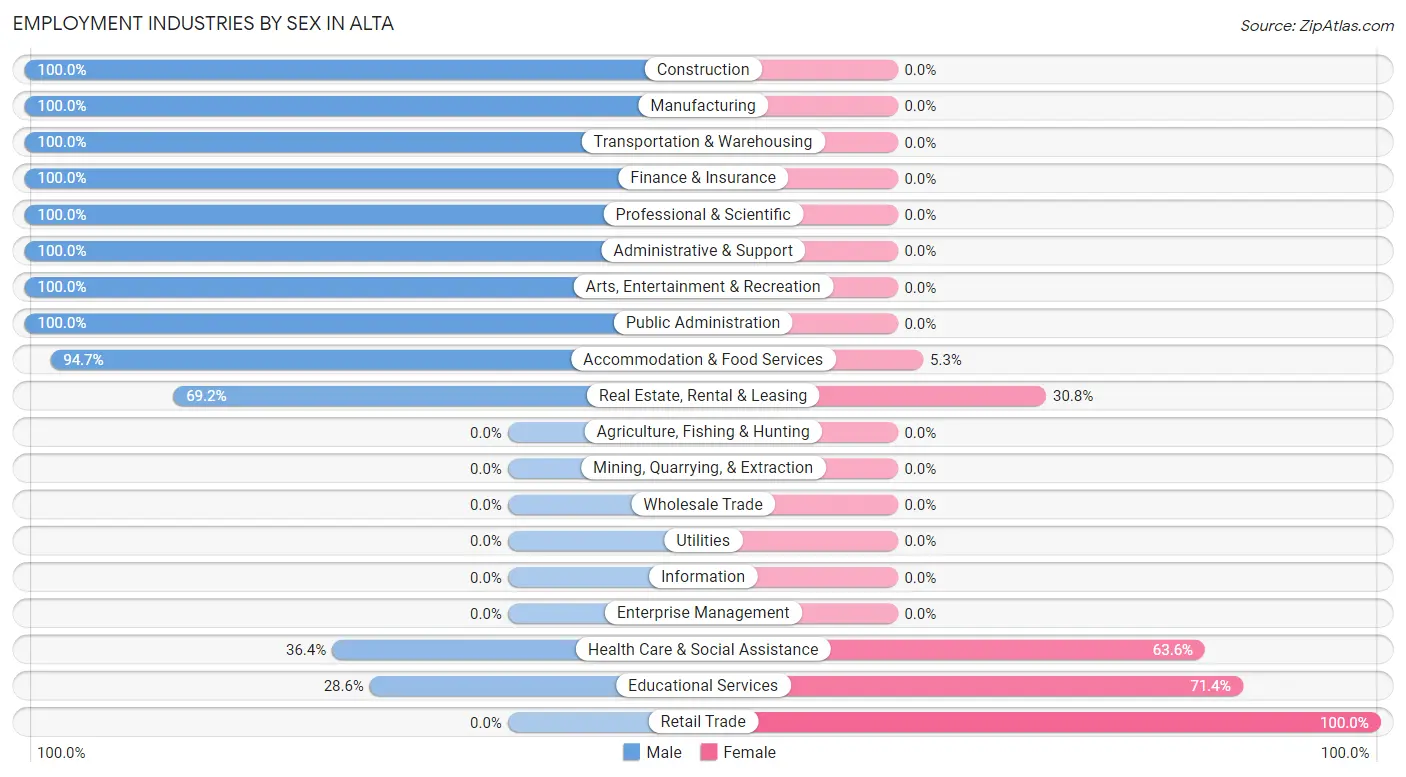
| Industry | Male | Female |
| Agriculture, Fishing & Hunting | 0 (0.0%) | 0 (0.0%) |
| Mining, Quarrying, & Extraction | 0 (0.0%) | 0 (0.0%) |
| Construction | 4 (100.0%) | 0 (0.0%) |
| Manufacturing | 17 (100.0%) | 0 (0.0%) |
| Wholesale Trade | 0 (0.0%) | 0 (0.0%) |
| Retail Trade | 0 (0.0%) | 3 (100.0%) |
| Transportation & Warehousing | 2 (100.0%) | 0 (0.0%) |
| Utilities | 0 (0.0%) | 0 (0.0%) |
| Information | 0 (0.0%) | 0 (0.0%) |
| Finance & Insurance | 1 (100.0%) | 0 (0.0%) |
| Real Estate, Rental & Leasing | 9 (69.2%) | 4 (30.8%) |
| Professional & Scientific | 1 (100.0%) | 0 (0.0%) |
| Enterprise Management | 0 (0.0%) | 0 (0.0%) |
| Administrative & Support | 100 (100.0%) | 0 (0.0%) |
| Educational Services | 2 (28.6%) | 5 (71.4%) |
| Health Care & Social Assistance | 4 (36.4%) | 7 (63.6%) |
| Arts, Entertainment & Recreation | 11 (100.0%) | 0 (0.0%) |
| Accommodation & Food Services | 89 (94.7%) | 5 (5.3%) |
| Public Administration | 63 (100.0%) | 0 (0.0%) |
| Total | 303 (92.7%) | 24 (7.3%) |
Education in Alta
School Enrollment in Alta
The most common levels of schooling among the 111 students in Alta are college / undergraduate (104 | 93.7%), nursery / preschool (3 | 2.7%), and elementary school (2 | 1.8%).
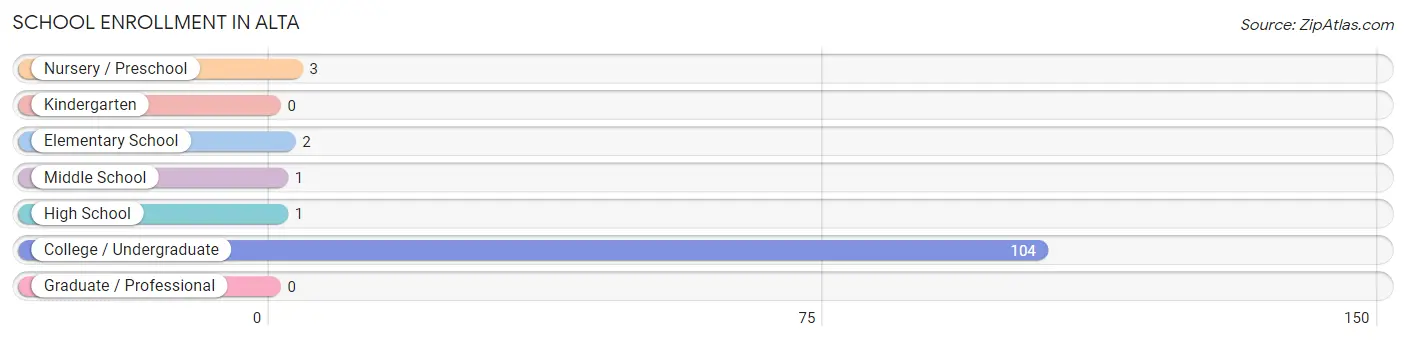
| School Level | # Students | % Students |
| Nursery / Preschool | 3 | 2.7% |
| Kindergarten | 0 | 0.0% |
| Elementary School | 2 | 1.8% |
| Middle School | 1 | 0.9% |
| High School | 1 | 0.9% |
| College / Undergraduate | 104 | 93.7% |
| Graduate / Professional | 0 | 0.0% |
| Total | 111 | 100.0% |
School Enrollment by Age by Funding Source in Alta
Out of a total of 111 students who are enrolled in schools in Alta, 49 (44.1%) attend a private institution, while the remaining 62 (55.9%) are enrolled in public schools. The age group of 3 to 4 year olds has the highest likelihood of being enrolled in private schools, with 3 (100.0% in the age bracket) enrolled. Conversely, the age group of 5 to 9 year old has the lowest likelihood of being enrolled in a private school, with 2 (100.0% in the age bracket) attending a public institution.
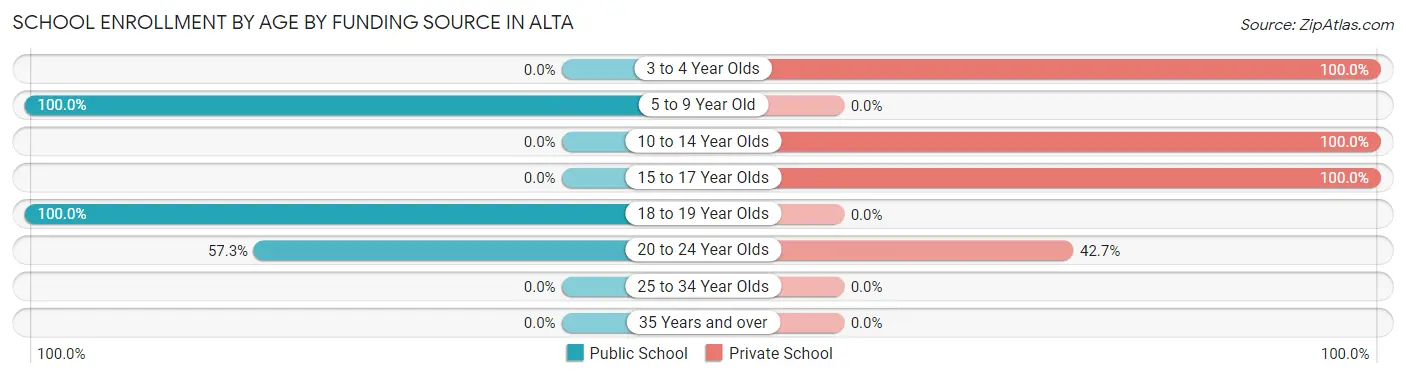
| Age Bracket | Public School | Private School |
| 3 to 4 Year Olds | 0 (0.0%) | 3 (100.0%) |
| 5 to 9 Year Old | 2 (100.0%) | 0 (0.0%) |
| 10 to 14 Year Olds | 0 (0.0%) | 1 (100.0%) |
| 15 to 17 Year Olds | 0 (0.0%) | 1 (100.0%) |
| 18 to 19 Year Olds | 1 (100.0%) | 0 (0.0%) |
| 20 to 24 Year Olds | 59 (57.3%) | 44 (42.7%) |
| 25 to 34 Year Olds | 0 (0.0%) | 0 (0.0%) |
| 35 Years and over | 0 (0.0%) | 0 (0.0%) |
| Total | 62 (55.9%) | 49 (44.1%) |
Educational Attainment by Field of Study in Alta
Bio, nature & agricultural (21 | 23.3%), social sciences (20 | 22.2%), psychology (14 | 15.6%), business (12 | 13.3%), and education (6 | 6.7%) are the most common fields of study among 90 individuals in Alta who have obtained a bachelor's degree or higher.
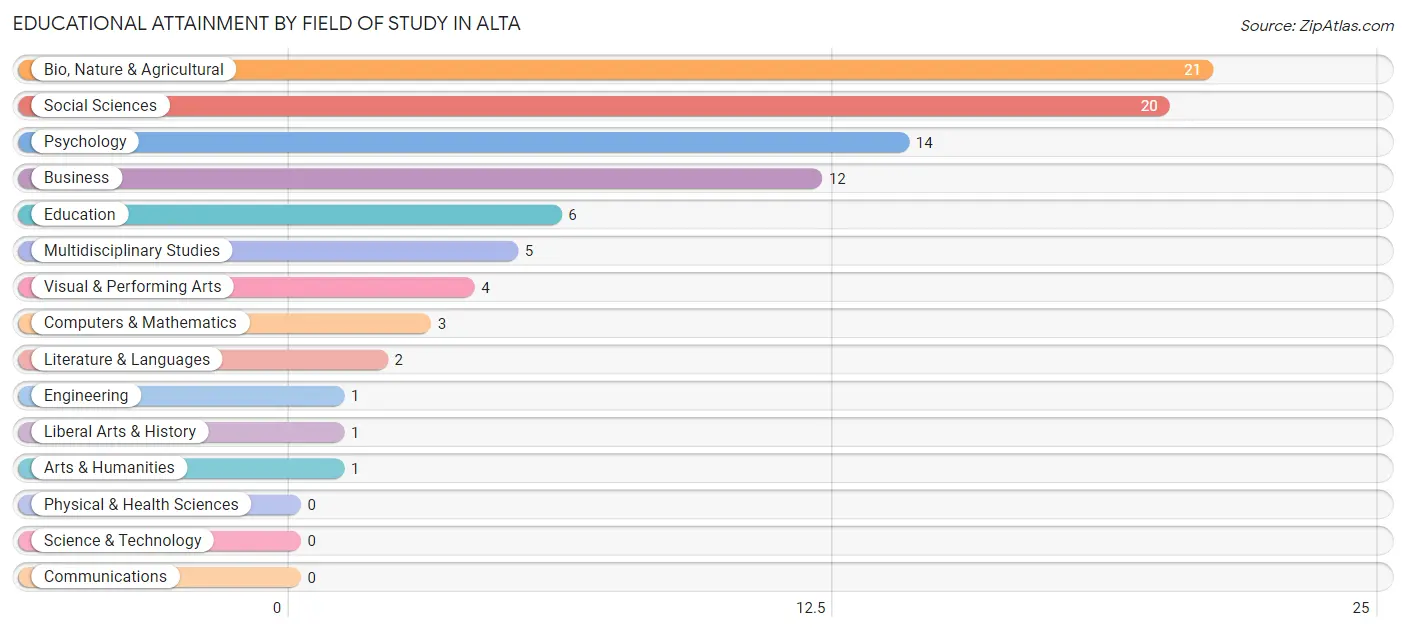
| Field of Study | # Graduates | % Graduates |
| Computers & Mathematics | 3 | 3.3% |
| Bio, Nature & Agricultural | 21 | 23.3% |
| Physical & Health Sciences | 0 | 0.0% |
| Psychology | 14 | 15.6% |
| Social Sciences | 20 | 22.2% |
| Engineering | 1 | 1.1% |
| Multidisciplinary Studies | 5 | 5.6% |
| Science & Technology | 0 | 0.0% |
| Business | 12 | 13.3% |
| Education | 6 | 6.7% |
| Literature & Languages | 2 | 2.2% |
| Liberal Arts & History | 1 | 1.1% |
| Visual & Performing Arts | 4 | 4.4% |
| Communications | 0 | 0.0% |
| Arts & Humanities | 1 | 1.1% |
| Total | 90 | 100.0% |
Transportation & Commute in Alta
Vehicle Availability by Sex in Alta
The most prevalent vehicle ownership categories in Alta are males with 1 vehicle (31, accounting for 55.4%) and females with 1 vehicle (2, making up 163.2%).
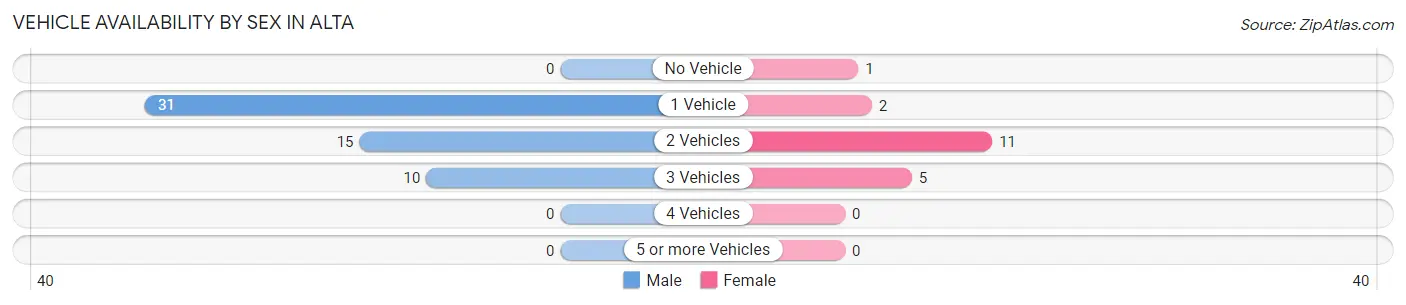
| Vehicles Available | Male | Female |
| No Vehicle | 0 (0.0%) | 1 (5.3%) |
| 1 Vehicle | 31 (55.4%) | 2 (10.5%) |
| 2 Vehicles | 15 (26.8%) | 11 (57.9%) |
| 3 Vehicles | 10 (17.9%) | 5 (26.3%) |
| 4 Vehicles | 0 (0.0%) | 0 (0.0%) |
| 5 or more Vehicles | 0 (0.0%) | 0 (0.0%) |
| Total | 56 (100.0%) | 19 (100.0%) |
Commute Time in Alta
The most frequently occuring commute durations in Alta are 5 to 9 minutes (68 commuters, 50.0%), less than 5 minutes (46 commuters, 33.8%), and 10 to 14 minutes (9 commuters, 6.6%).
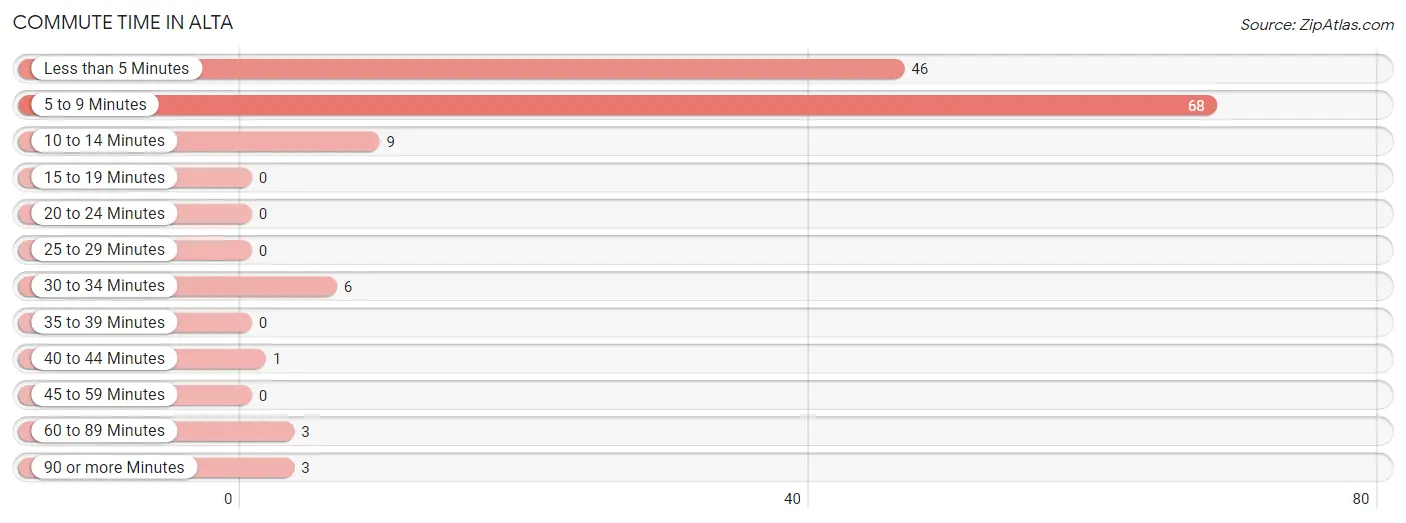
| Commute Time | # Commuters | % Commuters |
| Less than 5 Minutes | 46 | 33.8% |
| 5 to 9 Minutes | 68 | 50.0% |
| 10 to 14 Minutes | 9 | 6.6% |
| 15 to 19 Minutes | 0 | 0.0% |
| 20 to 24 Minutes | 0 | 0.0% |
| 25 to 29 Minutes | 0 | 0.0% |
| 30 to 34 Minutes | 6 | 4.4% |
| 35 to 39 Minutes | 0 | 0.0% |
| 40 to 44 Minutes | 1 | 0.7% |
| 45 to 59 Minutes | 0 | 0.0% |
| 60 to 89 Minutes | 3 | 2.2% |
| 90 or more Minutes | 3 | 2.2% |
Commute Time by Sex in Alta
The most common commute times in Alta are 5 to 9 minutes (64 commuters, 51.6%) for males and 5 to 9 minutes (4 commuters, 33.3%) for females.
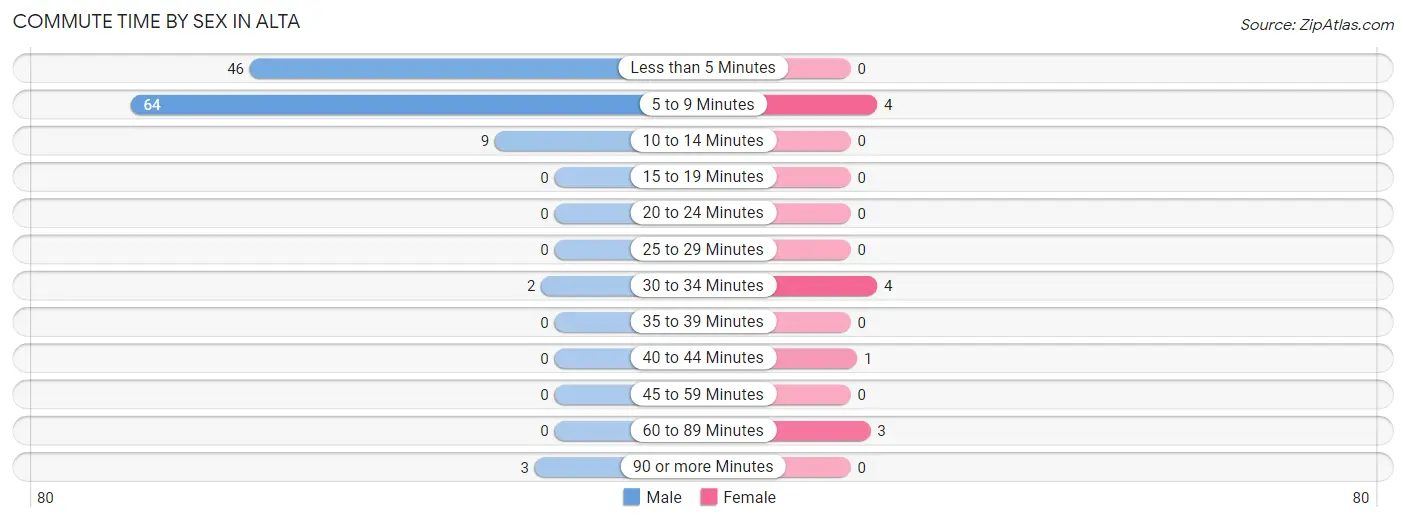
| Commute Time | Male | Female |
| Less than 5 Minutes | 46 (37.1%) | 0 (0.0%) |
| 5 to 9 Minutes | 64 (51.6%) | 4 (33.3%) |
| 10 to 14 Minutes | 9 (7.3%) | 0 (0.0%) |
| 15 to 19 Minutes | 0 (0.0%) | 0 (0.0%) |
| 20 to 24 Minutes | 0 (0.0%) | 0 (0.0%) |
| 25 to 29 Minutes | 0 (0.0%) | 0 (0.0%) |
| 30 to 34 Minutes | 2 (1.6%) | 4 (33.3%) |
| 35 to 39 Minutes | 0 (0.0%) | 0 (0.0%) |
| 40 to 44 Minutes | 0 (0.0%) | 1 (8.3%) |
| 45 to 59 Minutes | 0 (0.0%) | 0 (0.0%) |
| 60 to 89 Minutes | 0 (0.0%) | 3 (25.0%) |
| 90 or more Minutes | 3 (2.4%) | 0 (0.0%) |
Time of Departure to Work by Sex in Alta
The most frequent times of departure to work in Alta are 12:00 PM to 3:59 PM (63, 50.8%) for males and 12:00 PM to 3:59 PM (5, 41.7%) for females.
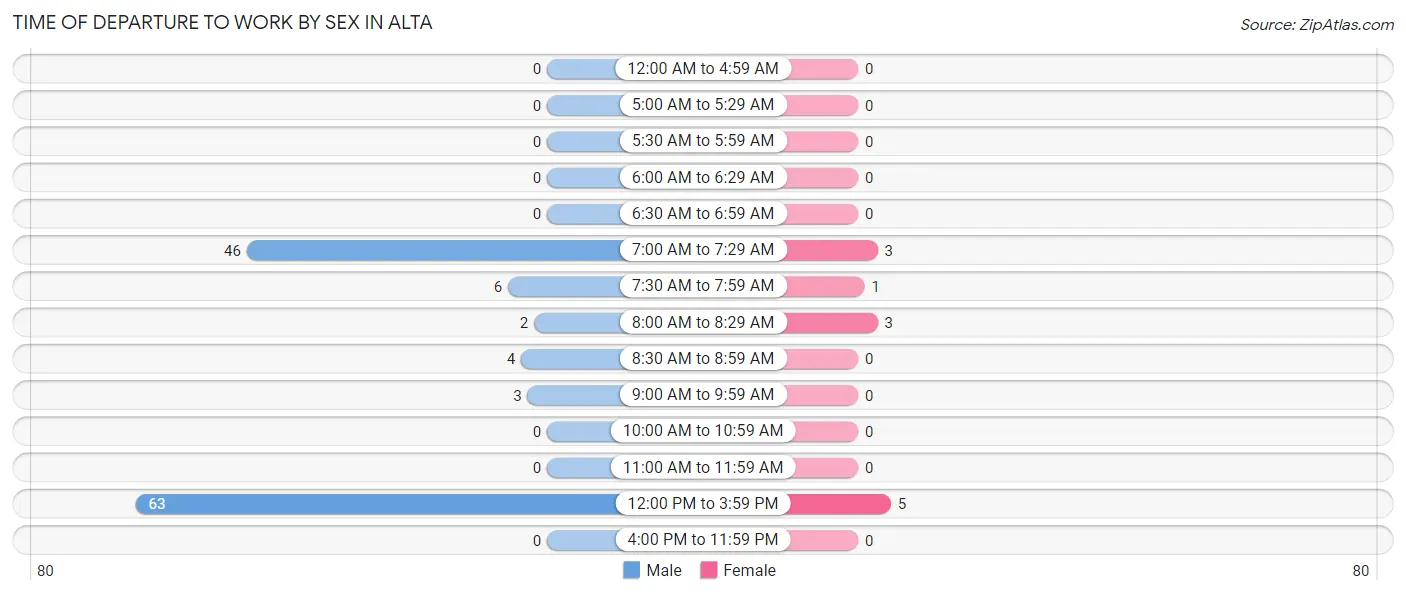
| Time of Departure | Male | Female |
| 12:00 AM to 4:59 AM | 0 (0.0%) | 0 (0.0%) |
| 5:00 AM to 5:29 AM | 0 (0.0%) | 0 (0.0%) |
| 5:30 AM to 5:59 AM | 0 (0.0%) | 0 (0.0%) |
| 6:00 AM to 6:29 AM | 0 (0.0%) | 0 (0.0%) |
| 6:30 AM to 6:59 AM | 0 (0.0%) | 0 (0.0%) |
| 7:00 AM to 7:29 AM | 46 (37.1%) | 3 (25.0%) |
| 7:30 AM to 7:59 AM | 6 (4.8%) | 1 (8.3%) |
| 8:00 AM to 8:29 AM | 2 (1.6%) | 3 (25.0%) |
| 8:30 AM to 8:59 AM | 4 (3.2%) | 0 (0.0%) |
| 9:00 AM to 9:59 AM | 3 (2.4%) | 0 (0.0%) |
| 10:00 AM to 10:59 AM | 0 (0.0%) | 0 (0.0%) |
| 11:00 AM to 11:59 AM | 0 (0.0%) | 0 (0.0%) |
| 12:00 PM to 3:59 PM | 63 (50.8%) | 5 (41.7%) |
| 4:00 PM to 11:59 PM | 0 (0.0%) | 0 (0.0%) |
| Total | 124 (100.0%) | 12 (100.0%) |
Housing Occupancy in Alta
Occupancy by Ownership in Alta
Of the total 70 dwellings in Alta, owner-occupied units account for 24 (34.3%), while renter-occupied units make up 46 (65.7%).
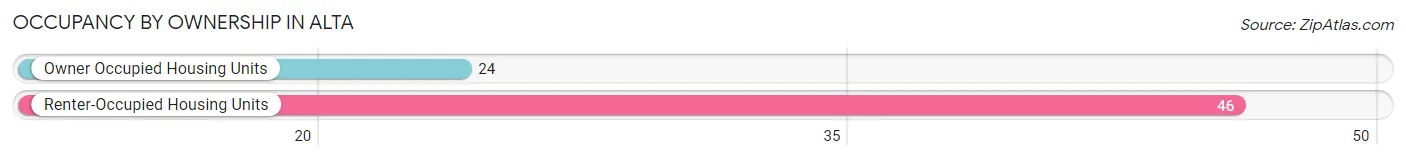
| Occupancy | # Housing Units | % Housing Units |
| Owner Occupied Housing Units | 24 | 34.3% |
| Renter-Occupied Housing Units | 46 | 65.7% |
| Total Occupied Housing Units | 70 | 100.0% |
Occupancy by Household Size in Alta
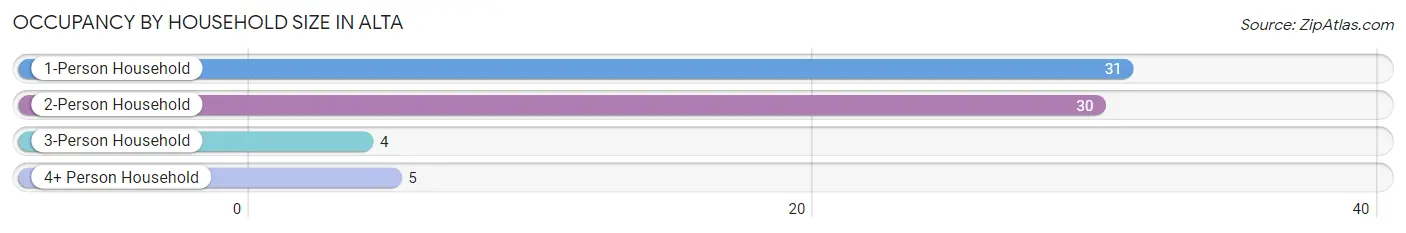
| Household Size | # Housing Units | % Housing Units |
| 1-Person Household | 31 | 44.3% |
| 2-Person Household | 30 | 42.9% |
| 3-Person Household | 4 | 5.7% |
| 4+ Person Household | 5 | 7.1% |
| Total Housing Units | 70 | 100.0% |
Occupancy by Ownership by Household Size in Alta
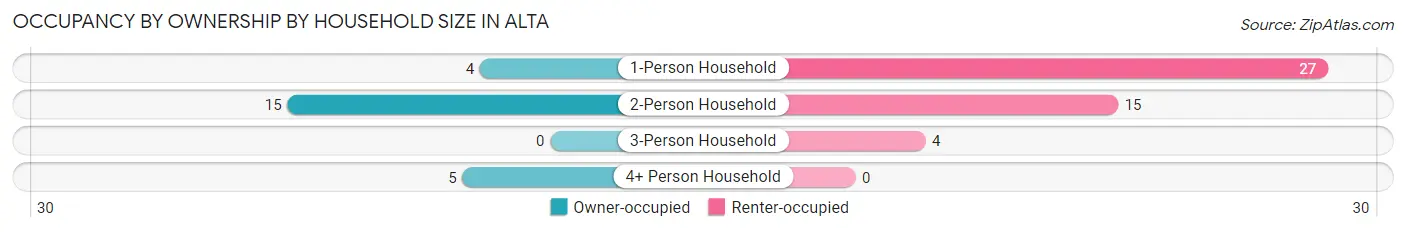
| Household Size | Owner-occupied | Renter-occupied |
| 1-Person Household | 4 (12.9%) | 27 (87.1%) |
| 2-Person Household | 15 (50.0%) | 15 (50.0%) |
| 3-Person Household | 0 (0.0%) | 4 (100.0%) |
| 4+ Person Household | 5 (100.0%) | 0 (0.0%) |
| Total Housing Units | 24 (34.3%) | 46 (65.7%) |
Occupancy by Educational Attainment in Alta
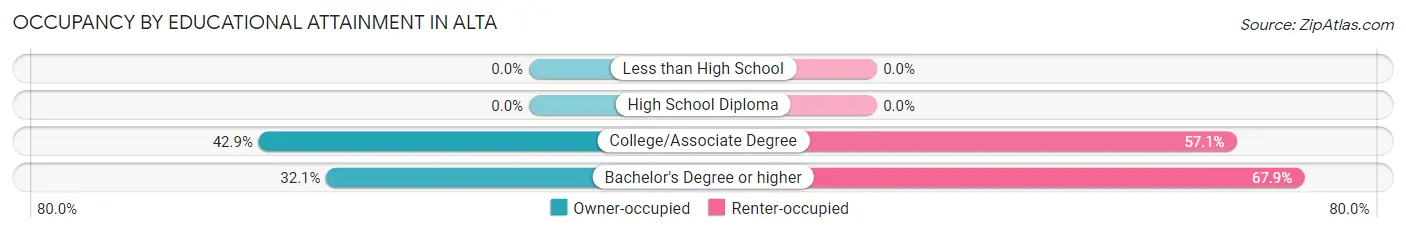
| Household Size | Owner-occupied | Renter-occupied |
| Less than High School | 0 (0.0%) | 0 (0.0%) |
| High School Diploma | 0 (0.0%) | 0 (0.0%) |
| College/Associate Degree | 6 (42.9%) | 8 (57.1%) |
| Bachelor's Degree or higher | 18 (32.1%) | 38 (67.9%) |
Occupancy by Age of Householder in Alta
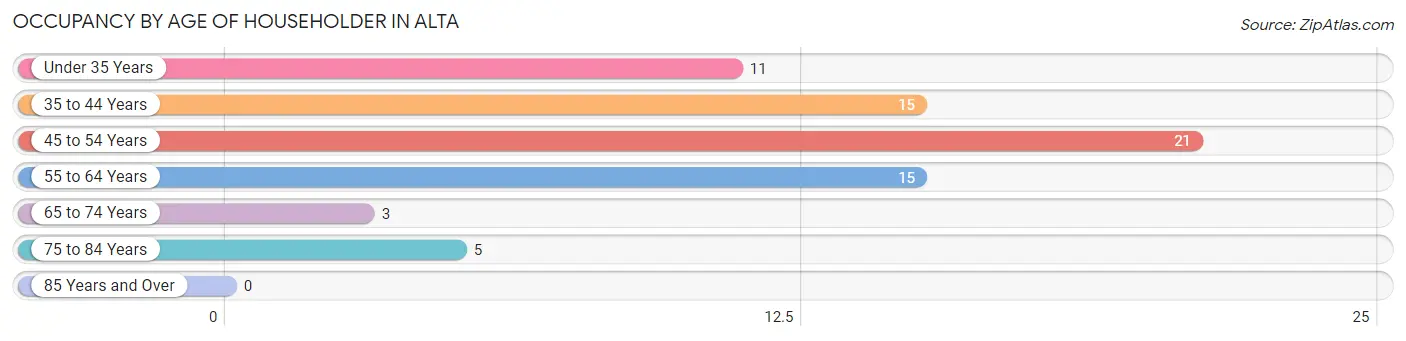
| Age Bracket | # Households | % Households |
| Under 35 Years | 11 | 15.7% |
| 35 to 44 Years | 15 | 21.4% |
| 45 to 54 Years | 21 | 30.0% |
| 55 to 64 Years | 15 | 21.4% |
| 65 to 74 Years | 3 | 4.3% |
| 75 to 84 Years | 5 | 7.1% |
| 85 Years and Over | 0 | 0.0% |
| Total | 70 | 100.0% |
Housing Finances in Alta
Median Income by Occupancy in Alta
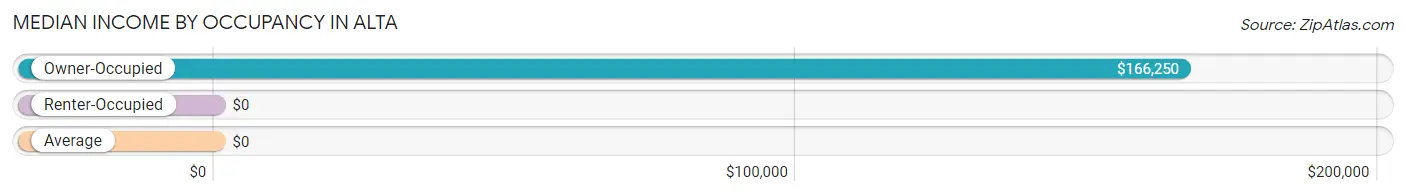
| Occupancy Type | # Households | Median Income |
| Owner-Occupied | 24 (34.3%) | $166,250 |
| Renter-Occupied | 46 (65.7%) | $0 |
| Average | 70 (100.0%) | $0 |
Occupancy by Householder Income Bracket in Alta
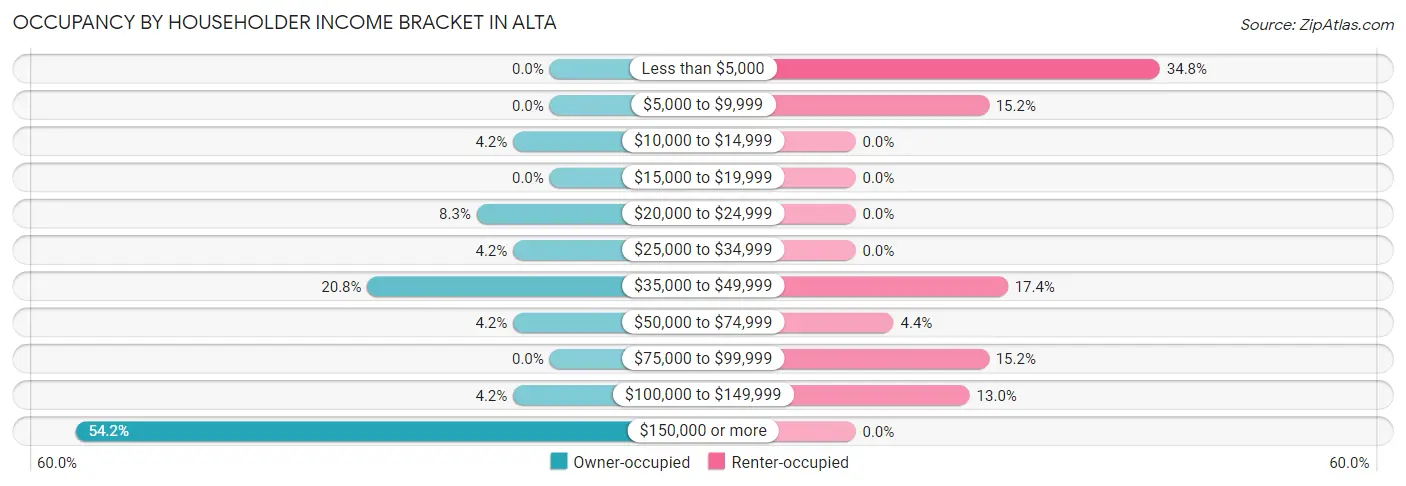
| Income Bracket | Owner-occupied | Renter-occupied |
| Less than $5,000 | 0 (0.0%) | 16 (34.8%) |
| $5,000 to $9,999 | 0 (0.0%) | 7 (15.2%) |
| $10,000 to $14,999 | 1 (4.2%) | 0 (0.0%) |
| $15,000 to $19,999 | 0 (0.0%) | 0 (0.0%) |
| $20,000 to $24,999 | 2 (8.3%) | 0 (0.0%) |
| $25,000 to $34,999 | 1 (4.2%) | 0 (0.0%) |
| $35,000 to $49,999 | 5 (20.8%) | 8 (17.4%) |
| $50,000 to $74,999 | 1 (4.2%) | 2 (4.3%) |
| $75,000 to $99,999 | 0 (0.0%) | 7 (15.2%) |
| $100,000 to $149,999 | 1 (4.2%) | 6 (13.0%) |
| $150,000 or more | 13 (54.2%) | 0 (0.0%) |
| Total | 24 (100.0%) | 46 (100.0%) |
Monthly Housing Cost Tiers in Alta
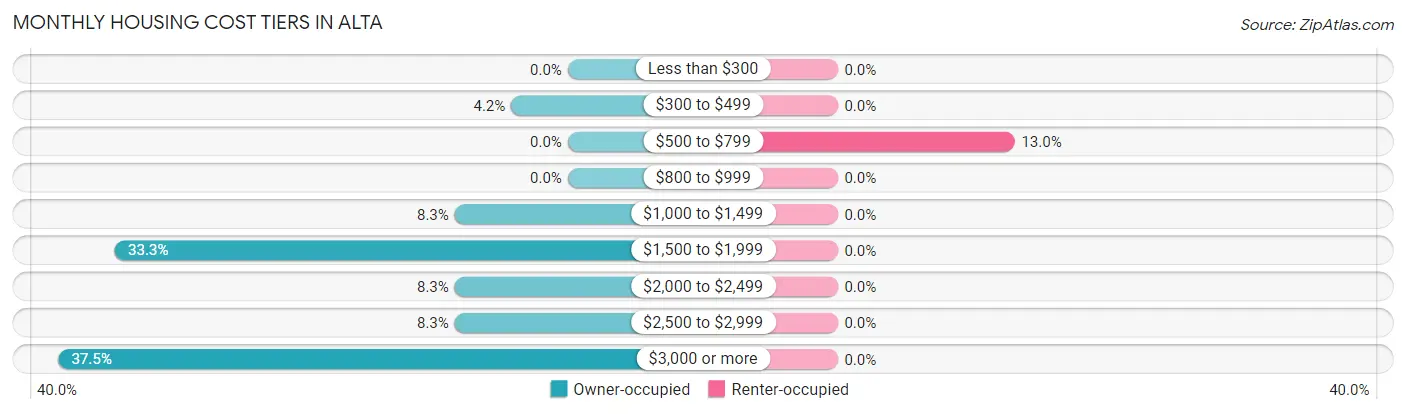
| Monthly Cost | Owner-occupied | Renter-occupied |
| Less than $300 | 0 (0.0%) | 0 (0.0%) |
| $300 to $499 | 1 (4.2%) | 0 (0.0%) |
| $500 to $799 | 0 (0.0%) | 6 (13.0%) |
| $800 to $999 | 0 (0.0%) | 0 (0.0%) |
| $1,000 to $1,499 | 2 (8.3%) | 0 (0.0%) |
| $1,500 to $1,999 | 8 (33.3%) | 0 (0.0%) |
| $2,000 to $2,499 | 2 (8.3%) | 0 (0.0%) |
| $2,500 to $2,999 | 2 (8.3%) | 0 (0.0%) |
| $3,000 or more | 9 (37.5%) | 0 (0.0%) |
| Total | 24 (100.0%) | 46 (100.0%) |
Physical Housing Characteristics in Alta
Housing Structures in Alta
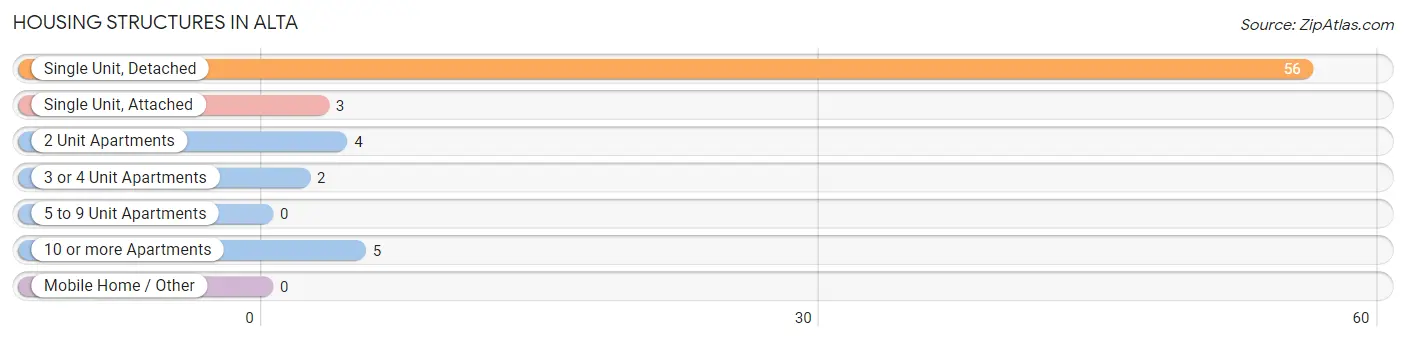
| Structure Type | # Housing Units | % Housing Units |
| Single Unit, Detached | 56 | 80.0% |
| Single Unit, Attached | 3 | 4.3% |
| 2 Unit Apartments | 4 | 5.7% |
| 3 or 4 Unit Apartments | 2 | 2.9% |
| 5 to 9 Unit Apartments | 0 | 0.0% |
| 10 or more Apartments | 5 | 7.1% |
| Mobile Home / Other | 0 | 0.0% |
| Total | 70 | 100.0% |
Housing Structures by Occupancy in Alta
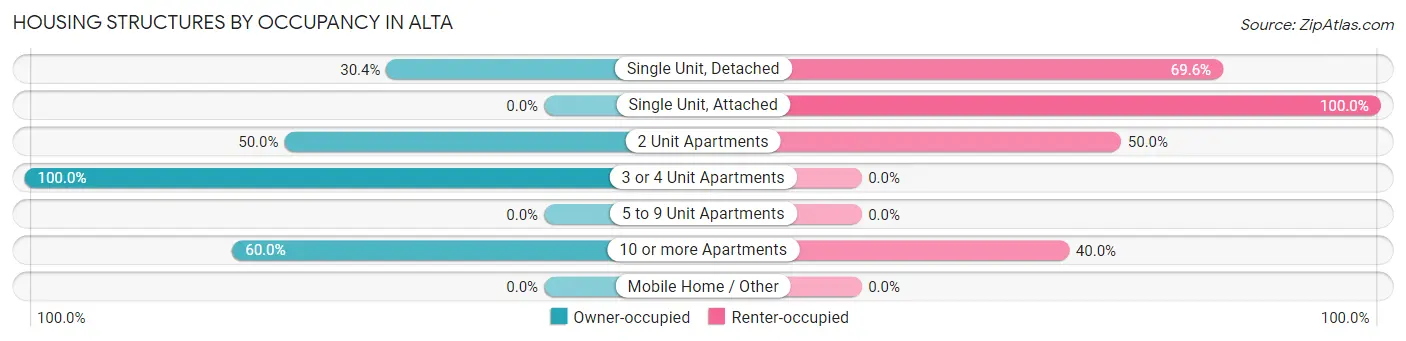
| Structure Type | Owner-occupied | Renter-occupied |
| Single Unit, Detached | 17 (30.4%) | 39 (69.6%) |
| Single Unit, Attached | 0 (0.0%) | 3 (100.0%) |
| 2 Unit Apartments | 2 (50.0%) | 2 (50.0%) |
| 3 or 4 Unit Apartments | 2 (100.0%) | 0 (0.0%) |
| 5 to 9 Unit Apartments | 0 (0.0%) | 0 (0.0%) |
| 10 or more Apartments | 3 (60.0%) | 2 (40.0%) |
| Mobile Home / Other | 0 (0.0%) | 0 (0.0%) |
| Total | 24 (34.3%) | 46 (65.7%) |
Housing Structures by Number of Rooms in Alta
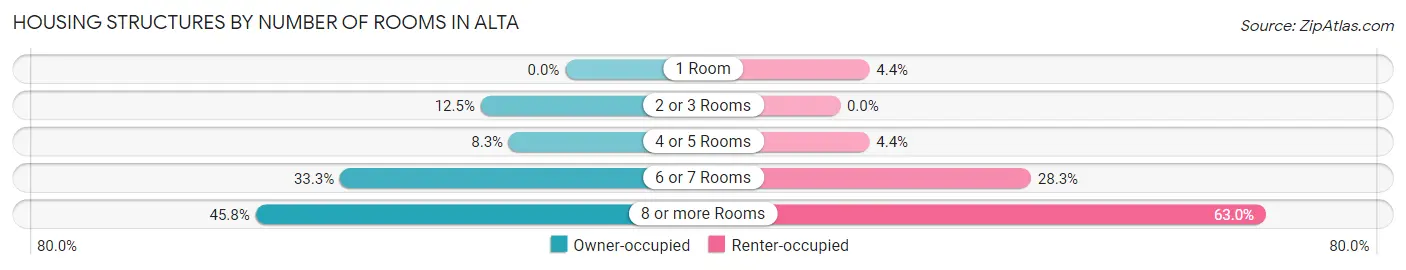
| Number of Rooms | Owner-occupied | Renter-occupied |
| 1 Room | 0 (0.0%) | 2 (4.3%) |
| 2 or 3 Rooms | 3 (12.5%) | 0 (0.0%) |
| 4 or 5 Rooms | 2 (8.3%) | 2 (4.3%) |
| 6 or 7 Rooms | 8 (33.3%) | 13 (28.3%) |
| 8 or more Rooms | 11 (45.8%) | 29 (63.0%) |
| Total | 24 (100.0%) | 46 (100.0%) |
Housing Structure by Heating Type in Alta
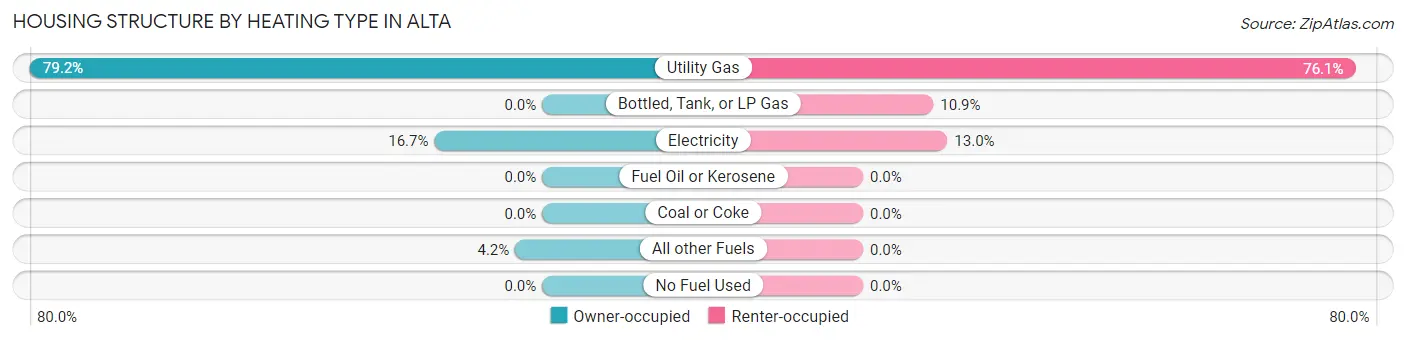
| Heating Type | Owner-occupied | Renter-occupied |
| Utility Gas | 19 (79.2%) | 35 (76.1%) |
| Bottled, Tank, or LP Gas | 0 (0.0%) | 5 (10.9%) |
| Electricity | 4 (16.7%) | 6 (13.0%) |
| Fuel Oil or Kerosene | 0 (0.0%) | 0 (0.0%) |
| Coal or Coke | 0 (0.0%) | 0 (0.0%) |
| All other Fuels | 1 (4.2%) | 0 (0.0%) |
| No Fuel Used | 0 (0.0%) | 0 (0.0%) |
| Total | 24 (100.0%) | 46 (100.0%) |
Household Vehicle Usage in Alta
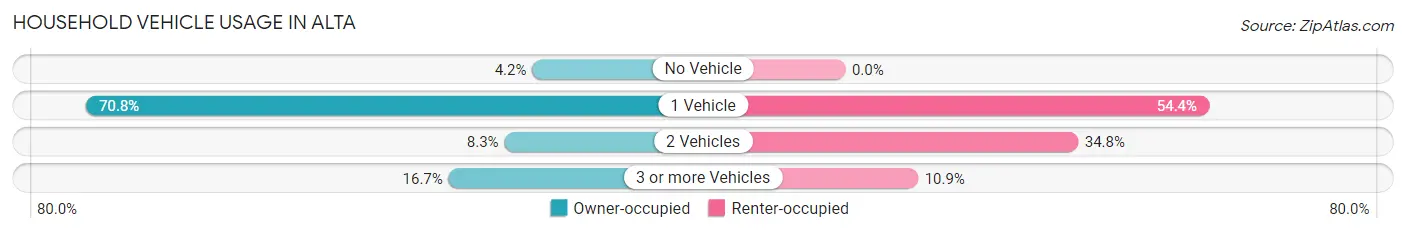
| Vehicles per Household | Owner-occupied | Renter-occupied |
| No Vehicle | 1 (4.2%) | 0 (0.0%) |
| 1 Vehicle | 17 (70.8%) | 25 (54.3%) |
| 2 Vehicles | 2 (8.3%) | 16 (34.8%) |
| 3 or more Vehicles | 4 (16.7%) | 5 (10.9%) |
| Total | 24 (100.0%) | 46 (100.0%) |
Real Estate & Mortgages in Alta
Real Estate and Mortgage Overview in Alta
| Characteristic | Without Mortgage | With Mortgage |
| Housing Units | 19 | 5 |
| Median Property Value | $2,000,001 | $2,000,001 |
| Median Household Income | - | - |
| Monthly Housing Costs | $1,501 | $3 |
| Real Estate Taxes | $9,844 | $0 |
Property Value by Mortgage Status in Alta
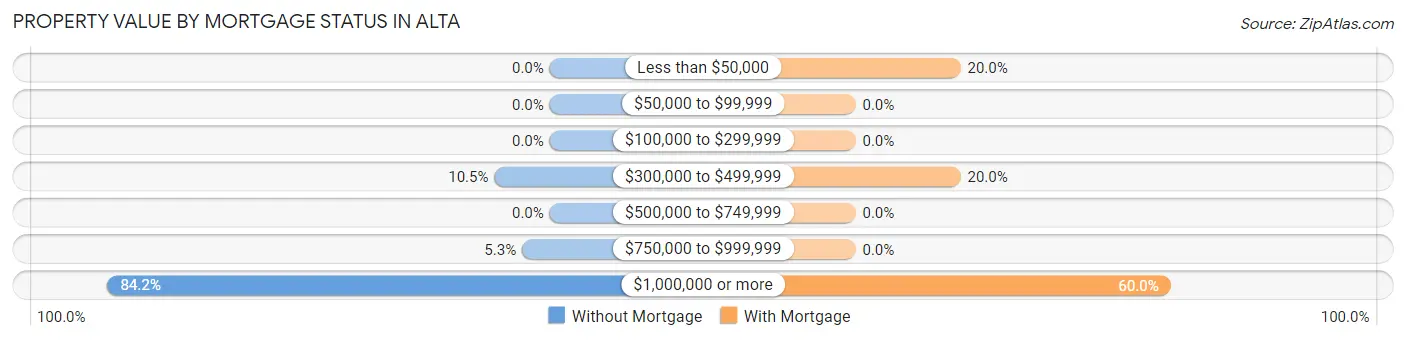
| Property Value | Without Mortgage | With Mortgage |
| Less than $50,000 | 0 (0.0%) | 1 (20.0%) |
| $50,000 to $99,999 | 0 (0.0%) | 0 (0.0%) |
| $100,000 to $299,999 | 0 (0.0%) | 0 (0.0%) |
| $300,000 to $499,999 | 2 (10.5%) | 1 (20.0%) |
| $500,000 to $749,999 | 0 (0.0%) | 0 (0.0%) |
| $750,000 to $999,999 | 1 (5.3%) | 0 (0.0%) |
| $1,000,000 or more | 16 (84.2%) | 3 (60.0%) |
| Total | 19 (100.0%) | 5 (100.0%) |
Household Income by Mortgage Status in Alta
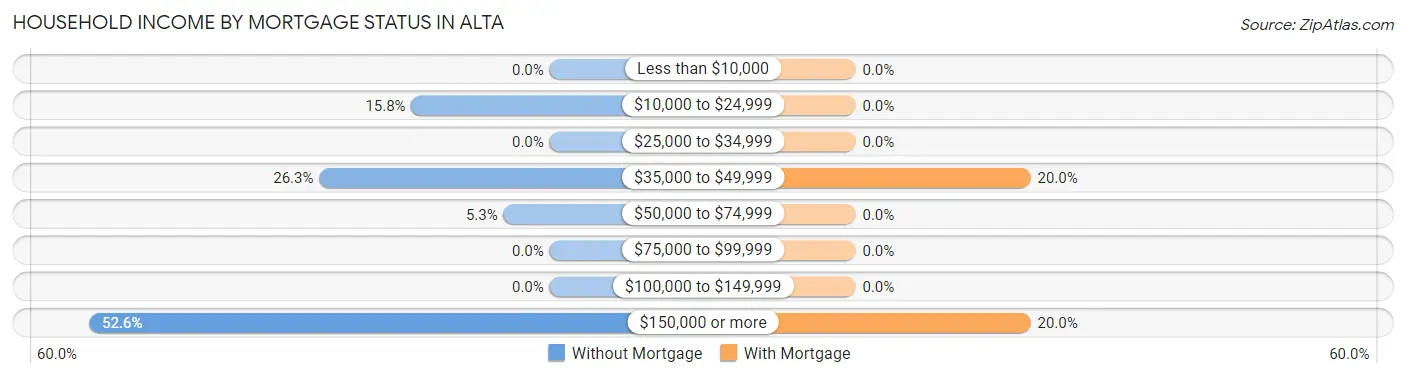
| Household Income | Without Mortgage | With Mortgage |
| Less than $10,000 | 0 (0.0%) | 0 (0.0%) |
| $10,000 to $24,999 | 3 (15.8%) | 0 (0.0%) |
| $25,000 to $34,999 | 0 (0.0%) | 0 (0.0%) |
| $35,000 to $49,999 | 5 (26.3%) | 1 (20.0%) |
| $50,000 to $74,999 | 1 (5.3%) | 0 (0.0%) |
| $75,000 to $99,999 | 0 (0.0%) | 0 (0.0%) |
| $100,000 to $149,999 | 0 (0.0%) | 0 (0.0%) |
| $150,000 or more | 10 (52.6%) | 1 (20.0%) |
| Total | 19 (100.0%) | 5 (100.0%) |
Property Value to Household Income Ratio in Alta
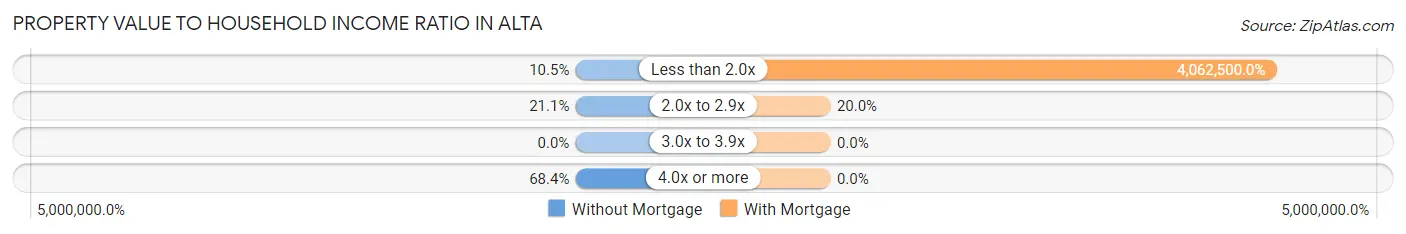
| Value-to-Income Ratio | Without Mortgage | With Mortgage |
| Less than 2.0x | 2 (10.5%) | 203,125 (4,062,500.0%) |
| 2.0x to 2.9x | 4 (21.0%) | 1 (20.0%) |
| 3.0x to 3.9x | 0 (0.0%) | 0 (0.0%) |
| 4.0x or more | 13 (68.4%) | 0 (0.0%) |
| Total | 19 (100.0%) | 5 (100.0%) |
Real Estate Taxes by Mortgage Status in Alta
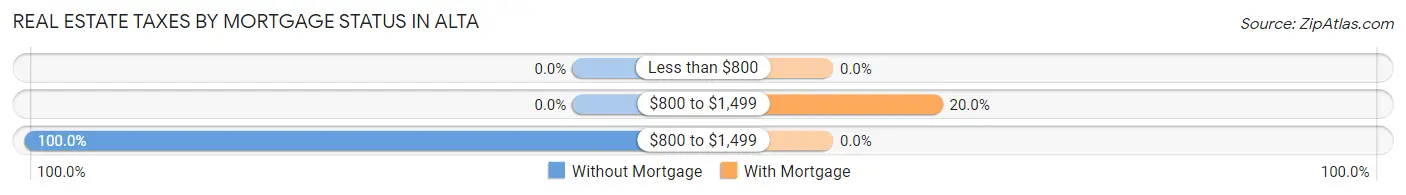
| Property Taxes | Without Mortgage | With Mortgage |
| Less than $800 | 0 (0.0%) | 0 (0.0%) |
| $800 to $1,499 | 0 (0.0%) | 1 (20.0%) |
| $800 to $1,499 | 19 (100.0%) | 0 (0.0%) |
| Total | 19 (100.0%) | 5 (100.0%) |
Health & Disability in Alta
Health Insurance Coverage by Age in Alta
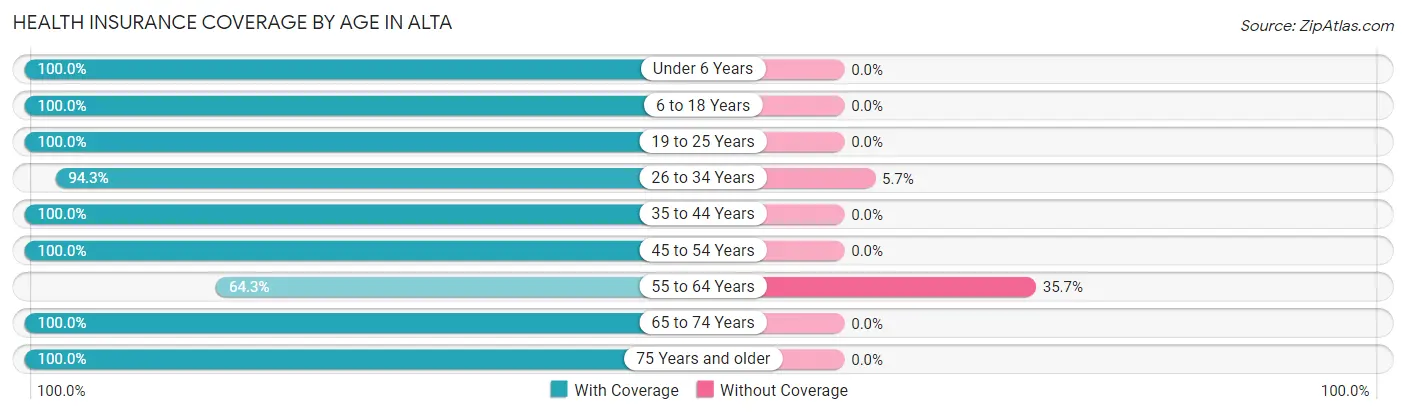
| Age Bracket | With Coverage | Without Coverage |
| Under 6 Years | 11 (100.0%) | 0 (0.0%) |
| 6 to 18 Years | 4 (100.0%) | 0 (0.0%) |
| 19 to 25 Years | 105 (100.0%) | 0 (0.0%) |
| 26 to 34 Years | 148 (94.3%) | 9 (5.7%) |
| 35 to 44 Years | 26 (100.0%) | 0 (0.0%) |
| 45 to 54 Years | 31 (100.0%) | 0 (0.0%) |
| 55 to 64 Years | 18 (64.3%) | 10 (35.7%) |
| 65 to 74 Years | 5 (100.0%) | 0 (0.0%) |
| 75 Years and older | 9 (100.0%) | 0 (0.0%) |
| Total | 357 (95.0%) | 19 (5.1%) |
Health Insurance Coverage by Citizenship Status in Alta
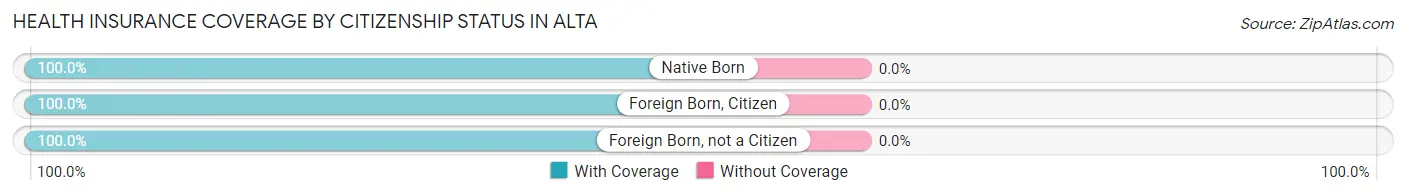
| Citizenship Status | With Coverage | Without Coverage |
| Native Born | 11 (100.0%) | 0 (0.0%) |
| Foreign Born, Citizen | 4 (100.0%) | 0 (0.0%) |
| Foreign Born, not a Citizen | 105 (100.0%) | 0 (0.0%) |
Health Insurance Coverage by Household Income in Alta
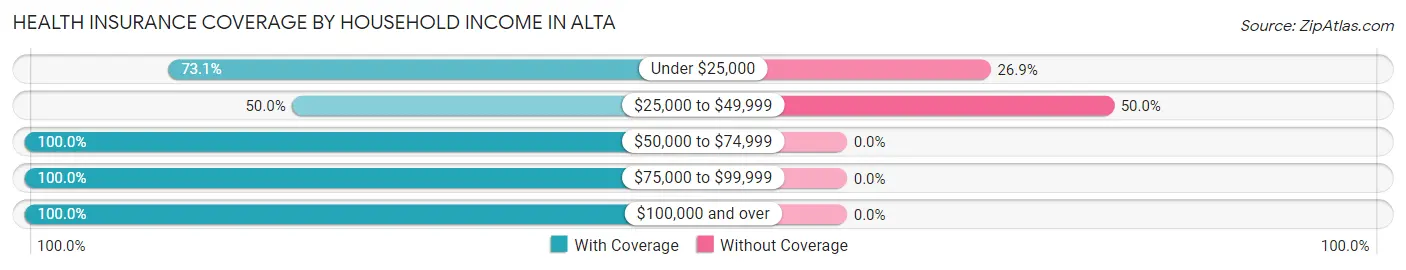
| Household Income | With Coverage | Without Coverage |
| Under $25,000 | 19 (73.1%) | 7 (26.9%) |
| $25,000 to $49,999 | 12 (50.0%) | 12 (50.0%) |
| $50,000 to $74,999 | 10 (100.0%) | 0 (0.0%) |
| $75,000 to $99,999 | 13 (100.0%) | 0 (0.0%) |
| $100,000 and over | 56 (100.0%) | 0 (0.0%) |
Public vs Private Health Insurance Coverage by Age in Alta
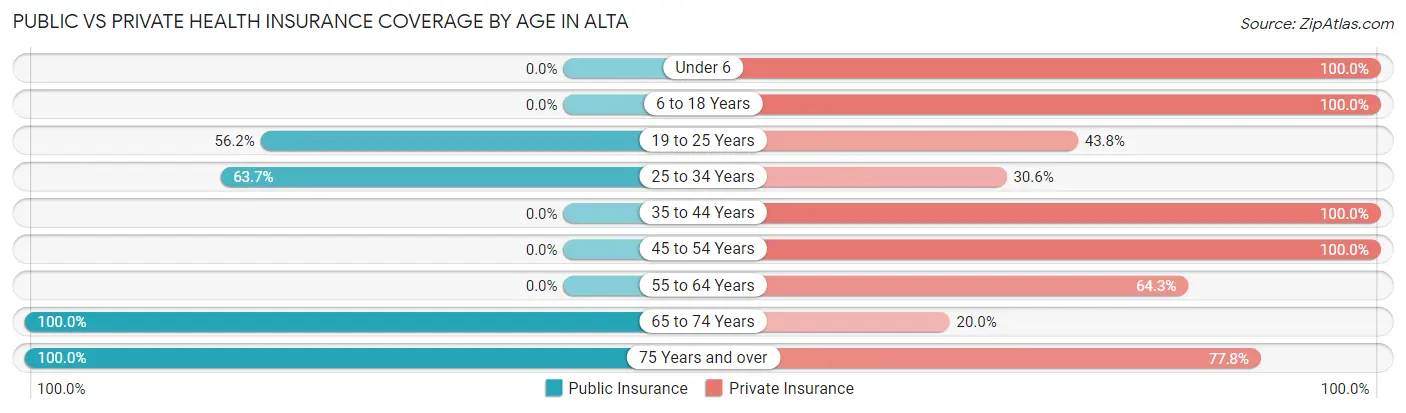
| Age Bracket | Public Insurance | Private Insurance |
| Under 6 | 0 (0.0%) | 11 (100.0%) |
| 6 to 18 Years | 0 (0.0%) | 4 (100.0%) |
| 19 to 25 Years | 59 (56.2%) | 46 (43.8%) |
| 25 to 34 Years | 100 (63.7%) | 48 (30.6%) |
| 35 to 44 Years | 0 (0.0%) | 26 (100.0%) |
| 45 to 54 Years | 0 (0.0%) | 31 (100.0%) |
| 55 to 64 Years | 0 (0.0%) | 18 (64.3%) |
| 65 to 74 Years | 5 (100.0%) | 1 (20.0%) |
| 75 Years and over | 9 (100.0%) | 7 (77.8%) |
| Total | 173 (46.0%) | 192 (51.1%) |
Disability Status by Sex by Age in Alta
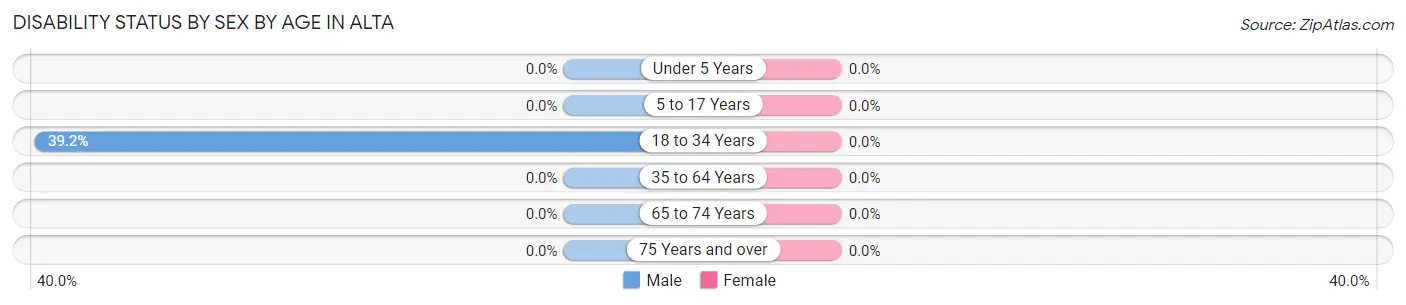
| Age Bracket | Male | Female |
| Under 5 Years | 0 (0.0%) | 0 (0.0%) |
| 5 to 17 Years | 0 (0.0%) | 0 (0.0%) |
| 18 to 34 Years | 100 (39.2%) | 0 (0.0%) |
| 35 to 64 Years | 0 (0.0%) | 0 (0.0%) |
| 65 to 74 Years | 0 (0.0%) | 0 (0.0%) |
| 75 Years and over | 0 (0.0%) | 0 (0.0%) |
Disability Class by Sex by Age in Alta
Disability Class: Hearing Difficulty
| Age Bracket | Male | Female |
| Under 5 Years | 0 (0.0%) | 0 (0.0%) |
| 5 to 17 Years | 0 (0.0%) | 0 (0.0%) |
| 18 to 34 Years | 0 (0.0%) | 0 (0.0%) |
| 35 to 64 Years | 0 (0.0%) | 0 (0.0%) |
| 65 to 74 Years | 0 (0.0%) | 0 (0.0%) |
| 75 Years and over | 0 (0.0%) | 0 (0.0%) |
Disability Class: Vision Difficulty
| Age Bracket | Male | Female |
| Under 5 Years | 0 (0.0%) | 0 (0.0%) |
| 5 to 17 Years | 0 (0.0%) | 0 (0.0%) |
| 18 to 34 Years | 0 (0.0%) | 0 (0.0%) |
| 35 to 64 Years | 0 (0.0%) | 0 (0.0%) |
| 65 to 74 Years | 0 (0.0%) | 0 (0.0%) |
| 75 Years and over | 0 (0.0%) | 0 (0.0%) |
Disability Class: Cognitive Difficulty
| Age Bracket | Male | Female |
| 5 to 17 Years | 0 (0.0%) | 0 (0.0%) |
| 18 to 34 Years | 0 (0.0%) | 0 (0.0%) |
| 35 to 64 Years | 0 (0.0%) | 0 (0.0%) |
| 65 to 74 Years | 0 (0.0%) | 0 (0.0%) |
| 75 Years and over | 0 (0.0%) | 0 (0.0%) |
Disability Class: Ambulatory Difficulty
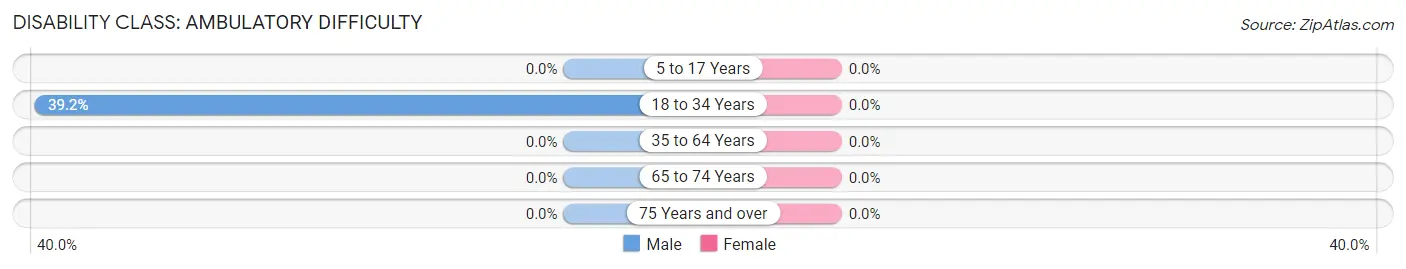
| Age Bracket | Male | Female |
| 5 to 17 Years | 0 (0.0%) | 0 (0.0%) |
| 18 to 34 Years | 100 (39.2%) | 0 (0.0%) |
| 35 to 64 Years | 0 (0.0%) | 0 (0.0%) |
| 65 to 74 Years | 0 (0.0%) | 0 (0.0%) |
| 75 Years and over | 0 (0.0%) | 0 (0.0%) |
Disability Class: Self-Care Difficulty
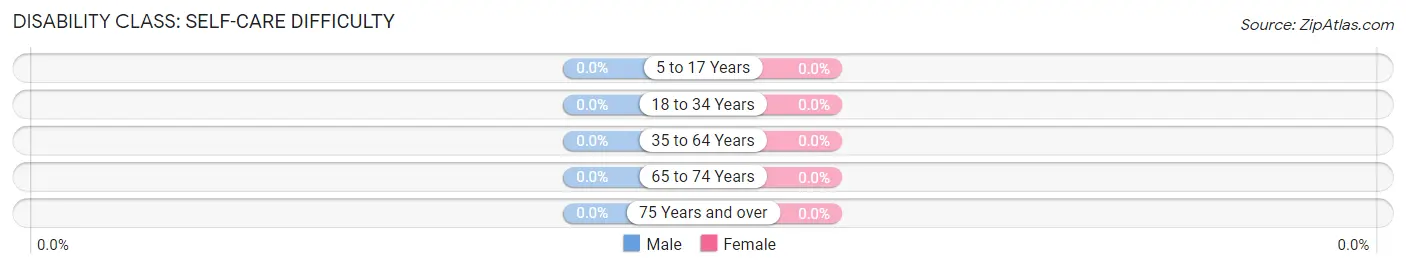
| Age Bracket | Male | Female |
| 5 to 17 Years | 0 (0.0%) | 0 (0.0%) |
| 18 to 34 Years | 0 (0.0%) | 0 (0.0%) |
| 35 to 64 Years | 0 (0.0%) | 0 (0.0%) |
| 65 to 74 Years | 0 (0.0%) | 0 (0.0%) |
| 75 Years and over | 0 (0.0%) | 0 (0.0%) |
Technology Access in Alta
Computing Device Access in Alta
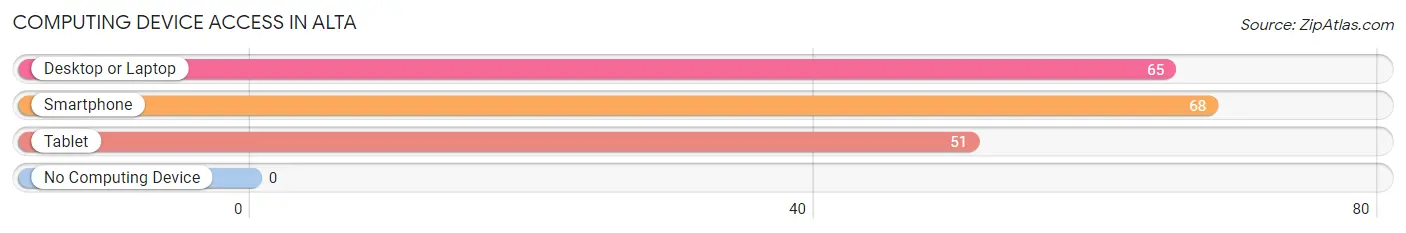
| Device Type | # Households | % Households |
| Desktop or Laptop | 65 | 92.9% |
| Smartphone | 68 | 97.1% |
| Tablet | 51 | 72.9% |
| No Computing Device | 0 | 0.0% |
| Total | 70 | 100.0% |
Internet Access in Alta
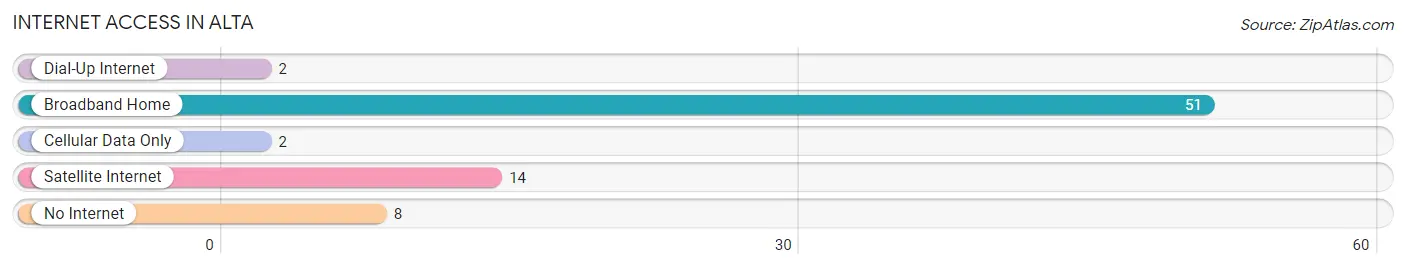
| Internet Type | # Households | % Households |
| Dial-Up Internet | 2 | 2.9% |
| Broadband Home | 51 | 72.9% |
| Cellular Data Only | 2 | 2.9% |
| Satellite Internet | 14 | 20.0% |
| No Internet | 8 | 11.4% |
| Total | 70 | 100.0% |
Alta Summary
Alta, Utah is a small town located in the Wasatch Mountains of Salt Lake County, Utah. It is situated in the Little Cottonwood Canyon, approximately 15 miles southeast of Salt Lake City. The town is known for its ski resorts, which attract visitors from all over the world. Alta is also home to a variety of outdoor activities, including hiking, biking, and camping.
Geography
Alta is located in the Wasatch Mountains of Salt Lake County, Utah. It is situated in the Little Cottonwood Canyon, approximately 15 miles southeast of Salt Lake City. The town is surrounded by the Wasatch National Forest and is bordered by the Uinta-Wasatch-Cache National Forest to the east. The town is situated at an elevation of 8,530 feet above sea level.
The town is located in a mountainous region, with the Wasatch Mountains to the east and the Oquirrh Mountains to the west. The area is known for its rugged terrain and is home to a variety of wildlife, including deer, elk, and moose. The area is also home to a variety of birds, including bald eagles, hawks, and owls.
Climate
Alta has a humid continental climate, with cold winters and warm summers. The average annual temperature is 37°F, with an average high of 54°F in the summer and an average low of 20°F in the winter. The average annual precipitation is 22 inches, with most of the precipitation falling in the form of snow.
Demographics
As of the 2010 census, Alta had a population of 590 people. The racial makeup of the town was 97.2% White, 0.2% African American, 0.2% Native American, 0.2% Asian, 0.2% Pacific Islander, 0.2% from other races, and 1.7% from two or more races. Hispanic or Latino of any race were 1.7% of the population.
Economy
Alta is primarily a tourist town, with the majority of its economy based on the ski resorts in the area. The town is home to two ski resorts, Alta Ski Area and Snowbird Ski and Summer Resort. The resorts attract visitors from all over the world and provide a variety of activities, including skiing, snowboarding, and snowshoeing.
The town is also home to a variety of restaurants, shops, and lodging. The town is also home to a variety of outdoor activities, including hiking, biking, and camping.
Conclusion
Alta, Utah is a small town located in the Wasatch Mountains of Salt Lake County, Utah. It is situated in the Little Cottonwood Canyon, approximately 15 miles southeast of Salt Lake City. The town is known for its ski resorts, which attract visitors from all over the world. Alta is also home to a variety of outdoor activities, including hiking, biking, and camping. The town has a humid continental climate, with cold winters and warm summers. As of the 2010 census, Alta had a population of 590 people. The town's economy is primarily based on the ski resorts in the area.
Common Questions
What is Per Capita Income in Alta?
Per Capita income in Alta is $41,716.
What is the Median Family Income in Alta?
Median Family Income in Alta is $95,417.
What is Inequality or Gini Index in Alta?
Inequality or Gini Index in Alta is 0.78.
What is the Total Population of Alta?
Total Population of Alta is 376.
What is the Total Male Population of Alta?
Total Male Population of Alta is 323.
What is the Total Female Population of Alta?
Total Female Population of Alta is 53.
What is the Ratio of Males per 100 Females in Alta?
There are 609.43 Males per 100 Females in Alta.
What is the Ratio of Females per 100 Males in Alta?
There are 16.41 Females per 100 Males in Alta.
What is the Median Population Age in Alta?
Median Population Age in Alta is 30.1 Years.
What is the Average Family Size in Alta
Average Family Size in Alta is 2.6 People.
What is the Average Household Size in Alta
Average Household Size in Alta is 1.8 People.
How Large is the Labor Force in Alta?
There are 327 People in the Labor Forcein in Alta.
What is the Percentage of People in the Labor Force in Alta?
90.6% of People are in the Labor Force in Alta.