Manila, UT Map & Demographics
Manila Map
Manila Overview
$26,322
PER CAPITA INCOME
$113,625
AVG FAMILY INCOME
$77,813
AVG HOUSEHOLD INCOME
0.34
INEQUALITY / GINI INDEX
330
TOTAL POPULATION
171
MALE POPULATION
159
FEMALE POPULATION
107.55
MALES / 100 FEMALES
92.98
FEMALES / 100 MALES
38.8
MEDIAN AGE
3.7
AVG FAMILY SIZE
2.8
AVG HOUSEHOLD SIZE
158
LABOR FORCE [ PEOPLE ]
69.6%
PERCENT IN LABOR FORCE
3.4%
UNEMPLOYMENT RATE
Manila Zip Codes
Manila Area Codes
Income in Manila
Income Overview in Manila
Per Capita Income in Manila is $26,322, while median incomes of families and households are $113,625 and $77,813 respectively.
| Characteristic | Number | Measure |
| Per Capita Income | 330 | $26,322 |
| Median Family Income | 77 | $113,625 |
| Mean Family Income | 77 | $99,232 |
| Median Household Income | 116 | $77,813 |
| Mean Household Income | 116 | $79,603 |
| Income Deficit | 77 | $0 |
| Wage / Income Gap (%) | 330 | 0.00% |
| Wage / Income Gap ($) | 330 | 100.00¢ per $1 |
| Gini / Inequality Index | 330 | 0.34 |
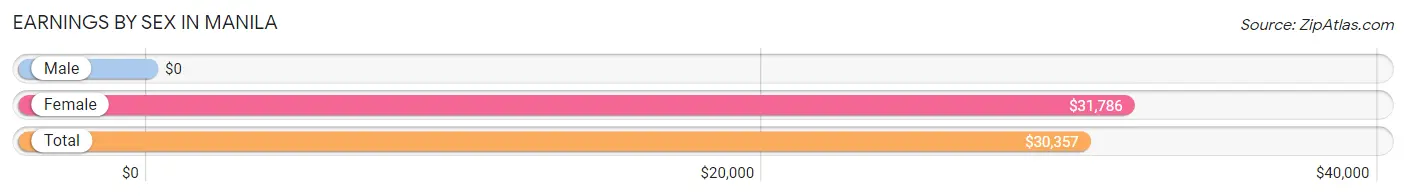
Earnings by Sex in Manila
| Sex | Number | Average Earnings |
| Male | 82 (50.6%) | $0 |
| Female | 80 (49.4%) | $31,786 |
| Total | 162 (100.0%) | $30,357 |
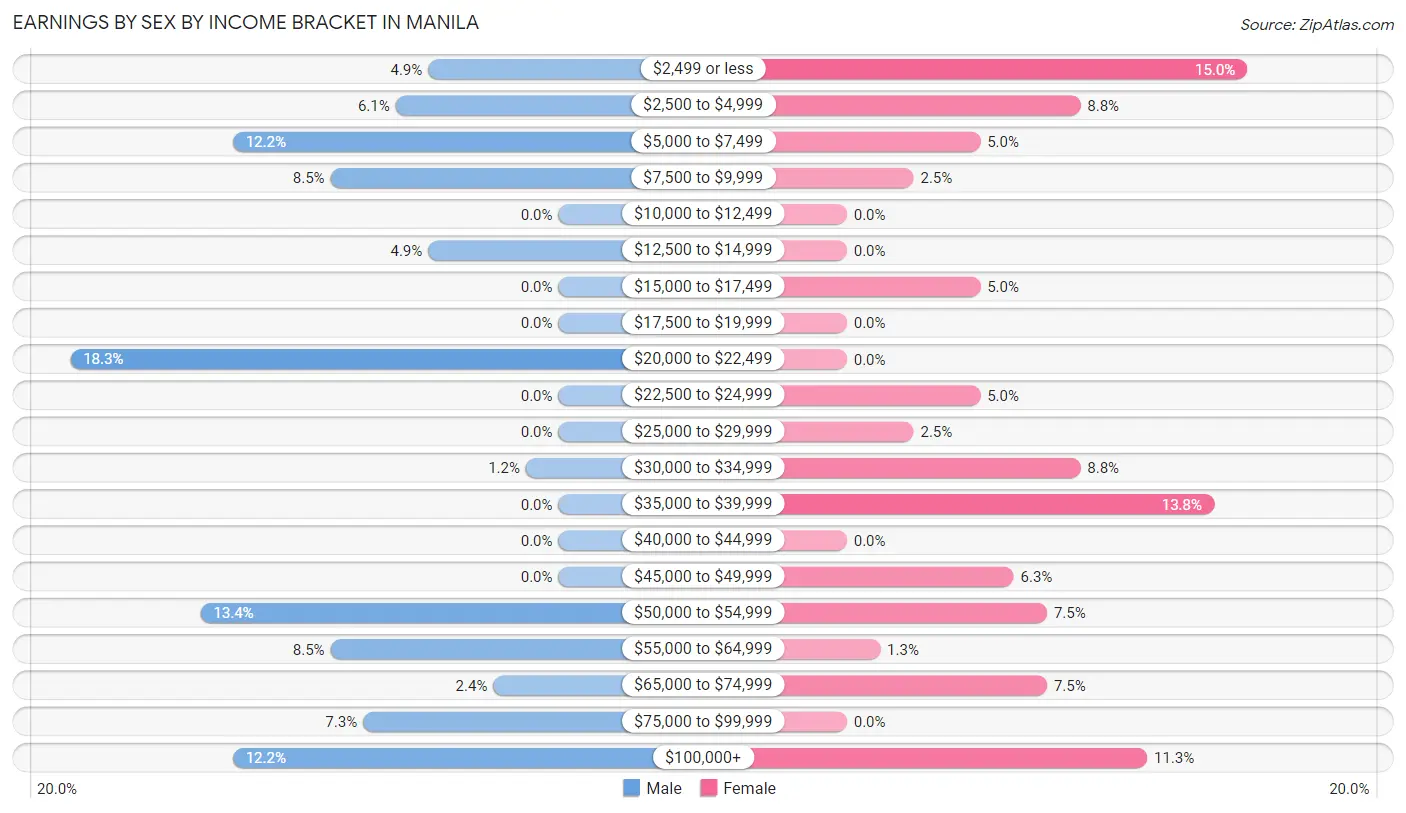
Earnings by Sex by Income Bracket in Manila
The most common earnings brackets in Manila are $20,000 to $22,499 for men (15 | 18.3%) and $2,499 or less for women (12 | 15.0%).
| Income | Male | Female |
| $2,499 or less | 4 (4.9%) | 12 (15.0%) |
| $2,500 to $4,999 | 5 (6.1%) | 7 (8.7%) |
| $5,000 to $7,499 | 10 (12.2%) | 4 (5.0%) |
| $7,500 to $9,999 | 7 (8.5%) | 2 (2.5%) |
| $10,000 to $12,499 | 0 (0.0%) | 0 (0.0%) |
| $12,500 to $14,999 | 4 (4.9%) | 0 (0.0%) |
| $15,000 to $17,499 | 0 (0.0%) | 4 (5.0%) |
| $17,500 to $19,999 | 0 (0.0%) | 0 (0.0%) |
| $20,000 to $22,499 | 15 (18.3%) | 0 (0.0%) |
| $22,500 to $24,999 | 0 (0.0%) | 4 (5.0%) |
| $25,000 to $29,999 | 0 (0.0%) | 2 (2.5%) |
| $30,000 to $34,999 | 1 (1.2%) | 7 (8.7%) |
| $35,000 to $39,999 | 0 (0.0%) | 11 (13.8%) |
| $40,000 to $44,999 | 0 (0.0%) | 0 (0.0%) |
| $45,000 to $49,999 | 0 (0.0%) | 5 (6.2%) |
| $50,000 to $54,999 | 11 (13.4%) | 6 (7.5%) |
| $55,000 to $64,999 | 7 (8.5%) | 1 (1.3%) |
| $65,000 to $74,999 | 2 (2.4%) | 6 (7.5%) |
| $75,000 to $99,999 | 6 (7.3%) | 0 (0.0%) |
| $100,000+ | 10 (12.2%) | 9 (11.3%) |
| Total | 82 (100.0%) | 80 (100.0%) |
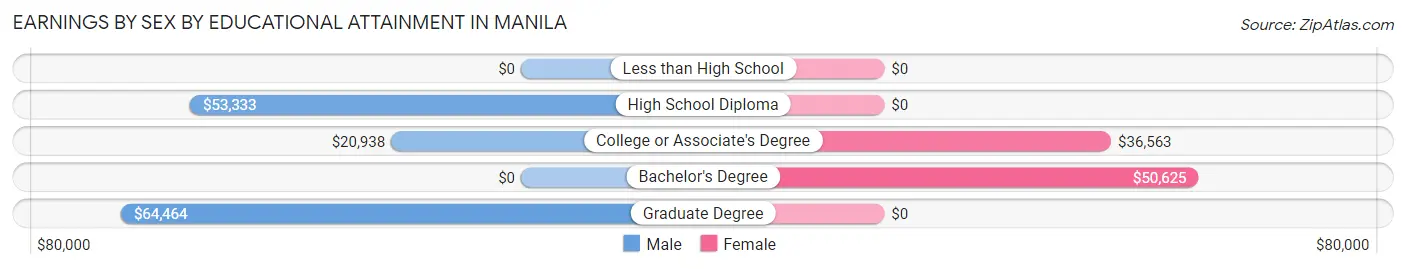
Earnings by Sex by Educational Attainment in Manila
| Educational Attainment | Male Income | Female Income |
| Less than High School | - | - |
| High School Diploma | $53,333 | $0 |
| College or Associate's Degree | $20,938 | $36,563 |
| Bachelor's Degree | - | - |
| Graduate Degree | $64,464 | $0 |
| Total | - | - |
Family Income in Manila
Family Income Brackets in Manila
According to the Manila family income data, there are 34 families falling into the $100,000 to $149,999 income range, which is the most common income bracket and makes up 44.2% of all families.
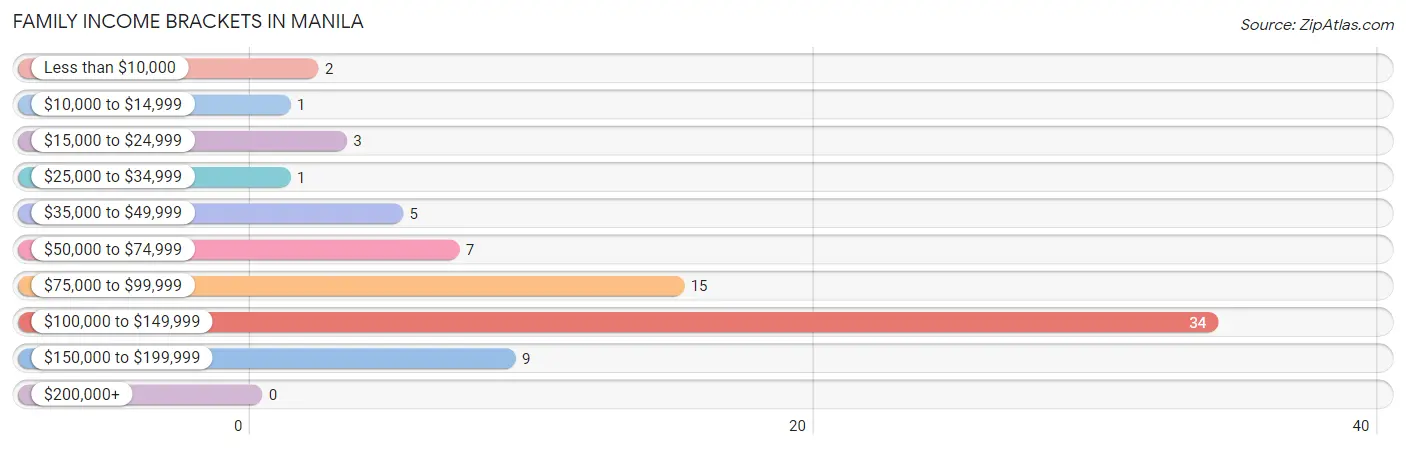
| Income Bracket | # Families | % Families |
| Less than $10,000 | 2 | 2.6% |
| $10,000 to $14,999 | 1 | 1.3% |
| $15,000 to $24,999 | 3 | 3.9% |
| $25,000 to $34,999 | 1 | 1.3% |
| $35,000 to $49,999 | 5 | 6.5% |
| $50,000 to $74,999 | 7 | 9.1% |
| $75,000 to $99,999 | 15 | 19.5% |
| $100,000 to $149,999 | 34 | 44.2% |
| $150,000 to $199,999 | 9 | 11.7% |
| $200,000+ | 0 | 0.0% |
Family Income by Famaliy Size in Manila
4-person families (15 | 19.5%) account for the highest median family income in Manila with $117,321 per family, while 2-person families (32 | 41.6%) have the highest median income of $31,875 per family member.
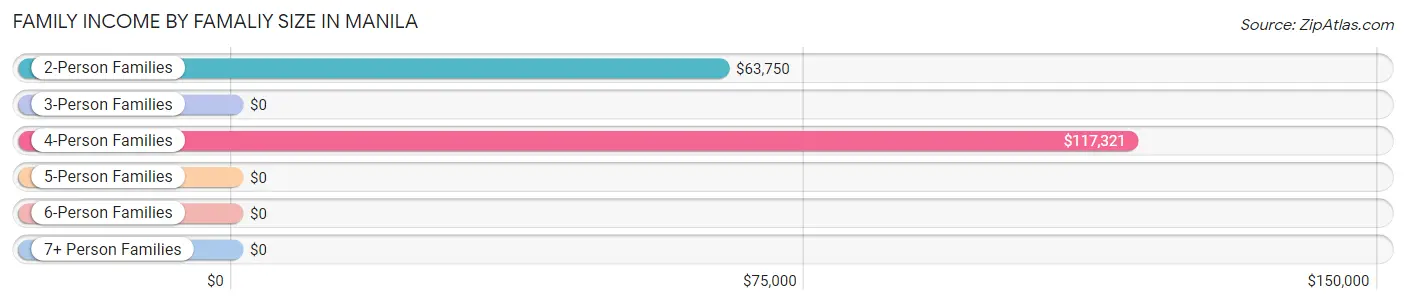
| Income Bracket | # Families | Median Income |
| 2-Person Families | 32 (41.6%) | $63,750 |
| 3-Person Families | 8 (10.4%) | $0 |
| 4-Person Families | 15 (19.5%) | $117,321 |
| 5-Person Families | 14 (18.2%) | $0 |
| 6-Person Families | 1 (1.3%) | $0 |
| 7+ Person Families | 7 (9.1%) | $0 |
| Total | 77 (100.0%) | $113,625 |
Family Income by Number of Earners in Manila
The median family income in Manila is $113,625, with families comprising 3+ earners (22) having the highest median family income of $126,071, while families with no earners (7) have the lowest median family income of $38,125, accounting for 28.6% and 9.1% of families, respectively.
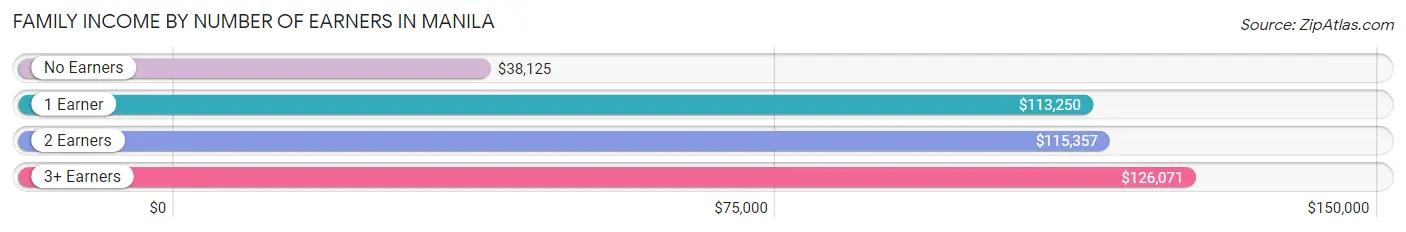
| Number of Earners | # Families | Median Income |
| No Earners | 7 (9.1%) | $38,125 |
| 1 Earner | 22 (28.6%) | $113,250 |
| 2 Earners | 26 (33.8%) | $115,357 |
| 3+ Earners | 22 (28.6%) | $126,071 |
| Total | 77 (100.0%) | $113,625 |
Household Income in Manila
Household Income Brackets in Manila
With 34 households falling in the category, the $100,000 to $149,999 income range is the most frequent in Manila, accounting for 29.3% of all households.
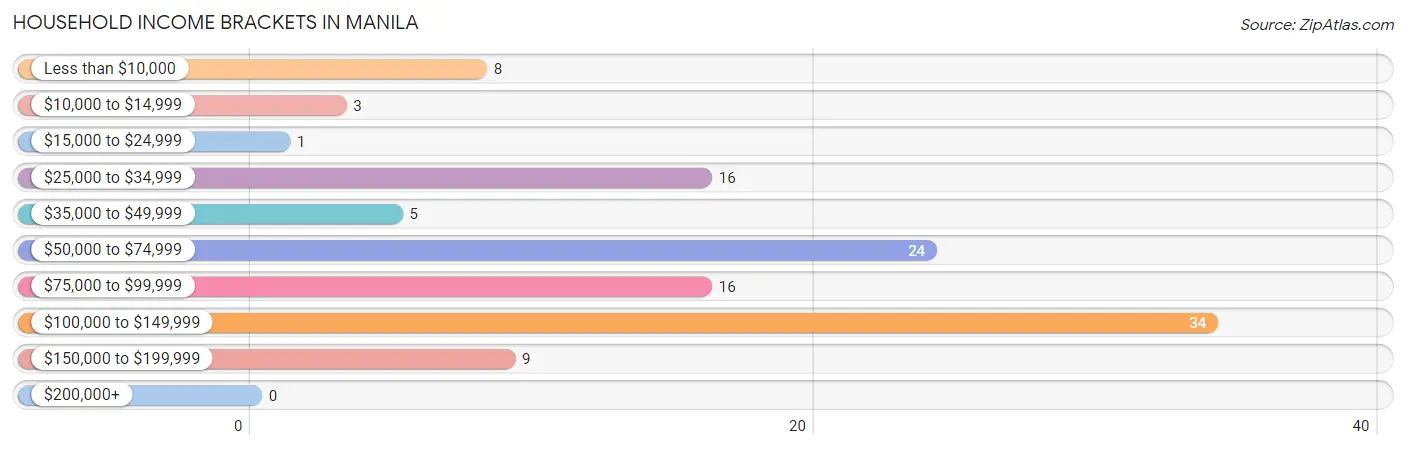
| Income Bracket | # Households | % Households |
| Less than $10,000 | 8 | 6.9% |
| $10,000 to $14,999 | 3 | 2.6% |
| $15,000 to $24,999 | 1 | 0.9% |
| $25,000 to $34,999 | 16 | 13.8% |
| $35,000 to $49,999 | 5 | 4.3% |
| $50,000 to $74,999 | 24 | 20.7% |
| $75,000 to $99,999 | 16 | 13.8% |
| $100,000 to $149,999 | 34 | 29.3% |
| $150,000 to $199,999 | 9 | 7.8% |
| $200,000+ | 0 | 0.0% |
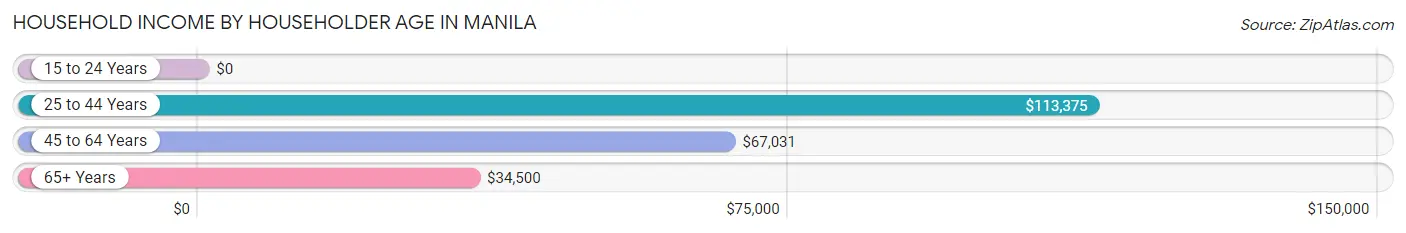
Household Income by Householder Age in Manila
The median household income in Manila is $77,813, with the highest median household income of $113,375 found in the 25 to 44 years age bracket for the primary householder. A total of 35 households (30.2%) fall into this category.
| Income Bracket | # Households | Median Income |
| 15 to 24 Years | 0 (0.0%) | $0 |
| 25 to 44 Years | 35 (30.2%) | $113,375 |
| 45 to 64 Years | 53 (45.7%) | $67,031 |
| 65+ Years | 28 (24.1%) | $34,500 |
| Total | 116 (100.0%) | $77,813 |
Poverty in Manila
Income Below Poverty by Sex and Age in Manila
With 5.9% poverty level for males and 3.1% for females among the residents of Manila, 55 to 64 year old males and 25 to 34 year old females are the most vulnerable to poverty, with 8 males (32.0%) and 2 females (33.3%) in their respective age groups living below the poverty level.
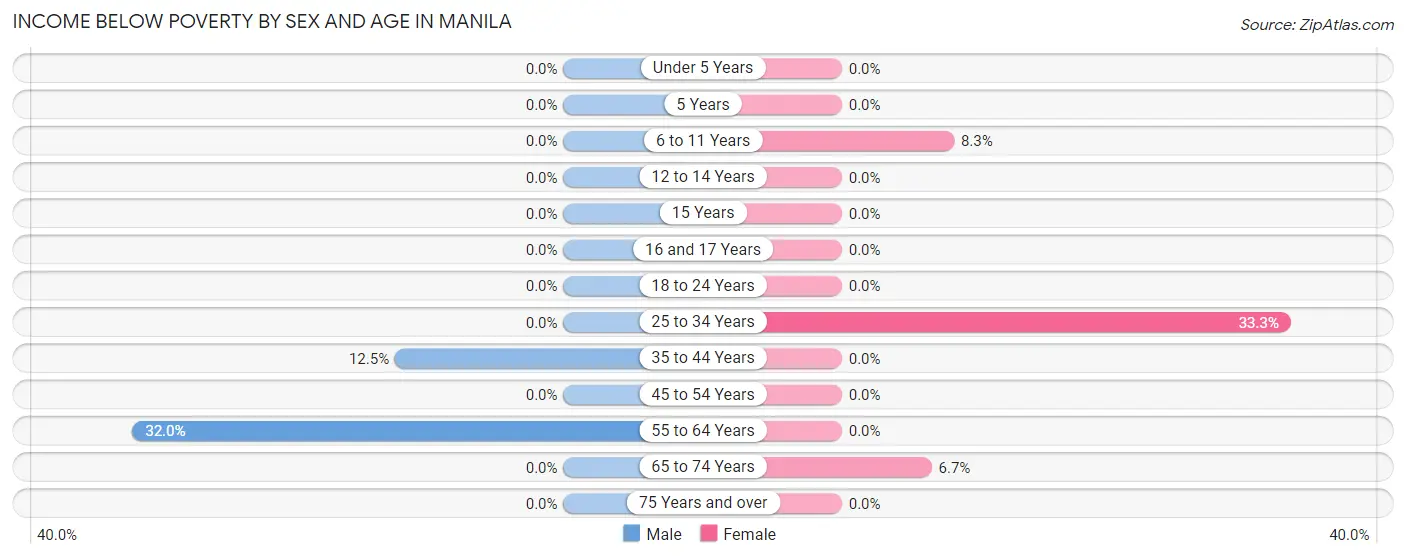
| Age Bracket | Male | Female |
| Under 5 Years | 0 (0.0%) | 0 (0.0%) |
| 5 Years | 0 (0.0%) | 0 (0.0%) |
| 6 to 11 Years | 0 (0.0%) | 2 (8.3%) |
| 12 to 14 Years | 0 (0.0%) | 0 (0.0%) |
| 15 Years | 0 (0.0%) | 0 (0.0%) |
| 16 and 17 Years | 0 (0.0%) | 0 (0.0%) |
| 18 to 24 Years | 0 (0.0%) | 0 (0.0%) |
| 25 to 34 Years | 0 (0.0%) | 2 (33.3%) |
| 35 to 44 Years | 2 (12.5%) | 0 (0.0%) |
| 45 to 54 Years | 0 (0.0%) | 0 (0.0%) |
| 55 to 64 Years | 8 (32.0%) | 0 (0.0%) |
| 65 to 74 Years | 0 (0.0%) | 1 (6.7%) |
| 75 Years and over | 0 (0.0%) | 0 (0.0%) |
| Total | 10 (5.9%) | 5 (3.1%) |
Income Above Poverty by Sex and Age in Manila
According to the poverty statistics in Manila, males aged under 5 years and females aged under 5 years are the age groups that are most secure financially, with 100.0% of males and 100.0% of females in these age groups living above the poverty line.
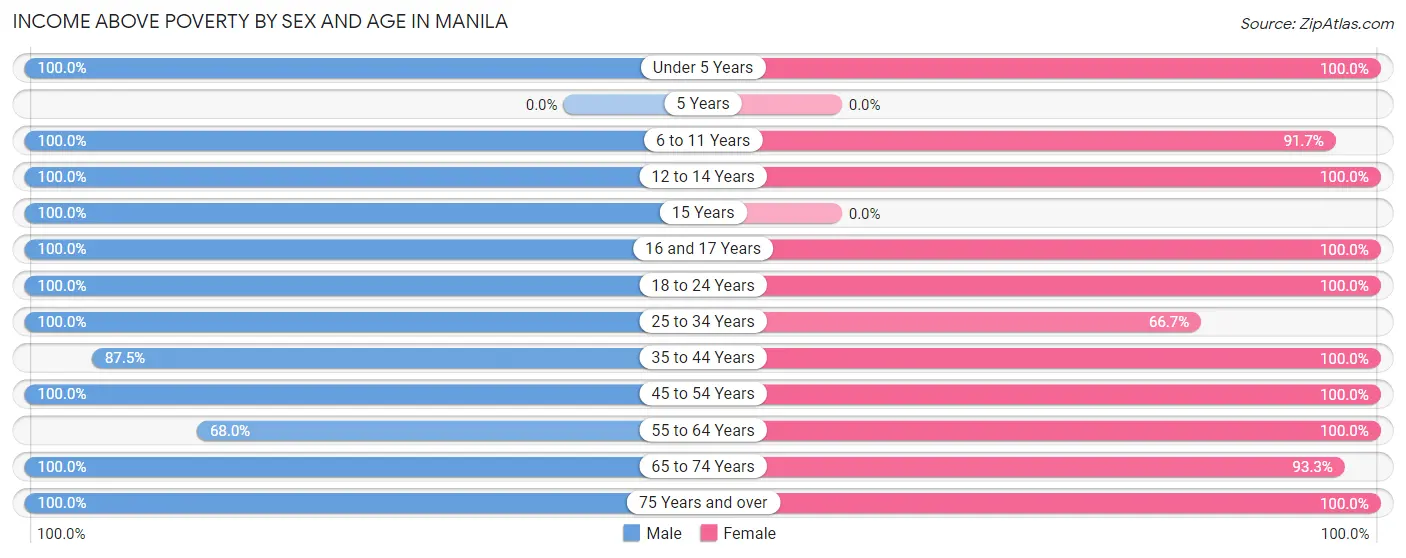
| Age Bracket | Male | Female |
| Under 5 Years | 10 (100.0%) | 11 (100.0%) |
| 5 Years | 0 (0.0%) | 0 (0.0%) |
| 6 to 11 Years | 8 (100.0%) | 22 (91.7%) |
| 12 to 14 Years | 9 (100.0%) | 21 (100.0%) |
| 15 Years | 20 (100.0%) | 0 (0.0%) |
| 16 and 17 Years | 6 (100.0%) | 4 (100.0%) |
| 18 to 24 Years | 9 (100.0%) | 12 (100.0%) |
| 25 to 34 Years | 3 (100.0%) | 4 (66.7%) |
| 35 to 44 Years | 14 (87.5%) | 34 (100.0%) |
| 45 to 54 Years | 42 (100.0%) | 29 (100.0%) |
| 55 to 64 Years | 17 (68.0%) | 1 (100.0%) |
| 65 to 74 Years | 17 (100.0%) | 14 (93.3%) |
| 75 Years and over | 6 (100.0%) | 2 (100.0%) |
| Total | 161 (94.2%) | 154 (96.9%) |
Income Below Poverty Among Married-Couple Families in Manila
The poverty statistics for married-couple families in Manila show that 1.4% or 1 of the total 70 families live below the poverty line. Families with no children have the highest poverty rate of 3.0%, comprising of 1 families. On the other hand, families with 1 or 2 children have the lowest poverty rate of 0.0%, which includes 0 families.
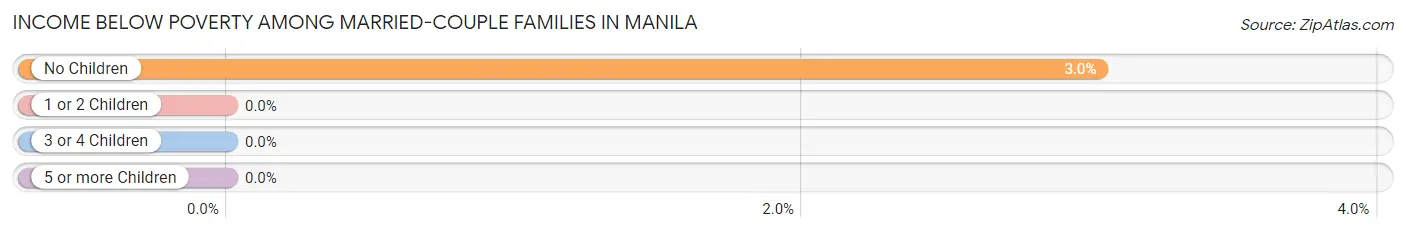
| Children | Above Poverty | Below Poverty |
| No Children | 32 (97.0%) | 1 (3.0%) |
| 1 or 2 Children | 15 (100.0%) | 0 (0.0%) |
| 3 or 4 Children | 22 (100.0%) | 0 (0.0%) |
| 5 or more Children | 0 (0.0%) | 0 (0.0%) |
| Total | 69 (98.6%) | 1 (1.4%) |
Income Below Poverty Among Single-Parent Households in Manila
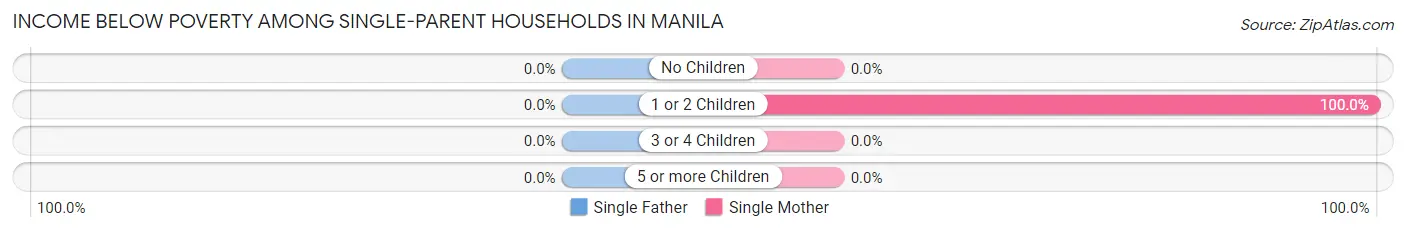
| Children | Single Father | Single Mother |
| No Children | 0 (0.0%) | 0 (0.0%) |
| 1 or 2 Children | 0 (0.0%) | 2 (100.0%) |
| 3 or 4 Children | 0 (0.0%) | 0 (0.0%) |
| 5 or more Children | 0 (0.0%) | 0 (0.0%) |
| Total | 0 (0.0%) | 2 (50.0%) |
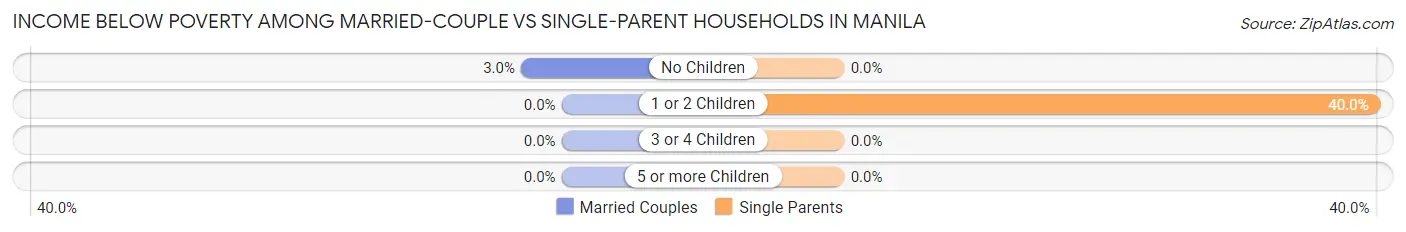
Income Below Poverty Among Married-Couple vs Single-Parent Households in Manila
The poverty data for Manila shows that 1 of the married-couple family households (1.4%) and 2 of the single-parent households (28.6%) are living below the poverty level. Within the married-couple family households, those with no children have the highest poverty rate, with 1 households (3.0%) falling below the poverty line. Among the single-parent households, those with 1 or 2 children have the highest poverty rate, with 2 household (40.0%) living below poverty.
| Children | Married-Couple Families | Single-Parent Households |
| No Children | 1 (3.0%) | 0 (0.0%) |
| 1 or 2 Children | 0 (0.0%) | 2 (40.0%) |
| 3 or 4 Children | 0 (0.0%) | 0 (0.0%) |
| 5 or more Children | 0 (0.0%) | 0 (0.0%) |
| Total | 1 (1.4%) | 2 (28.6%) |
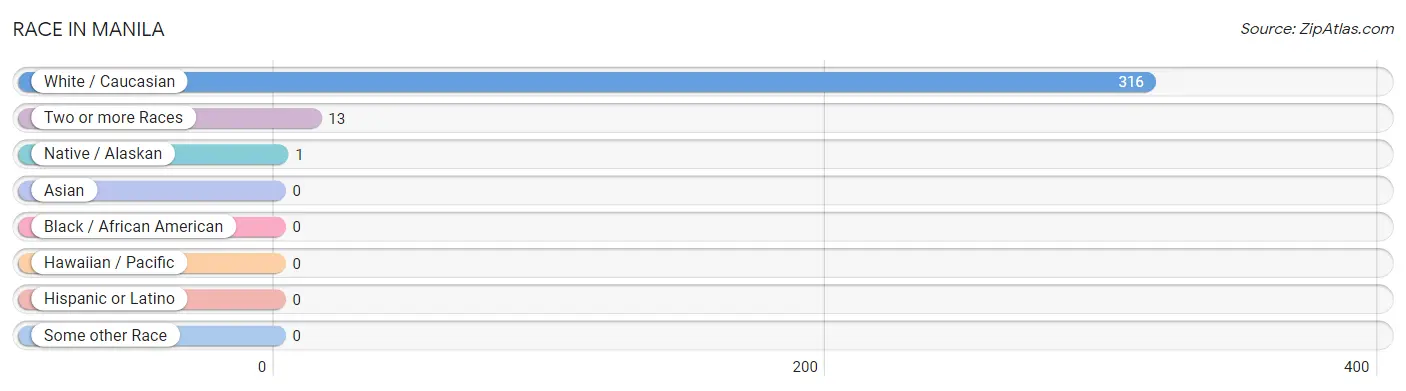
Race in Manila
The most populous races in Manila are White / Caucasian (316 | 95.8%), Two or more Races (13 | 3.9%), and Native / Alaskan (1 | 0.3%).
| Race | # Population | % Population |
| Asian | 0 | 0.0% |
| Black / African American | 0 | 0.0% |
| Hawaiian / Pacific | 0 | 0.0% |
| Hispanic or Latino | 0 | 0.0% |
| Native / Alaskan | 1 | 0.3% |
| White / Caucasian | 316 | 95.8% |
| Two or more Races | 13 | 3.9% |
| Some other Race | 0 | 0.0% |
| Total | 330 | 100.0% |
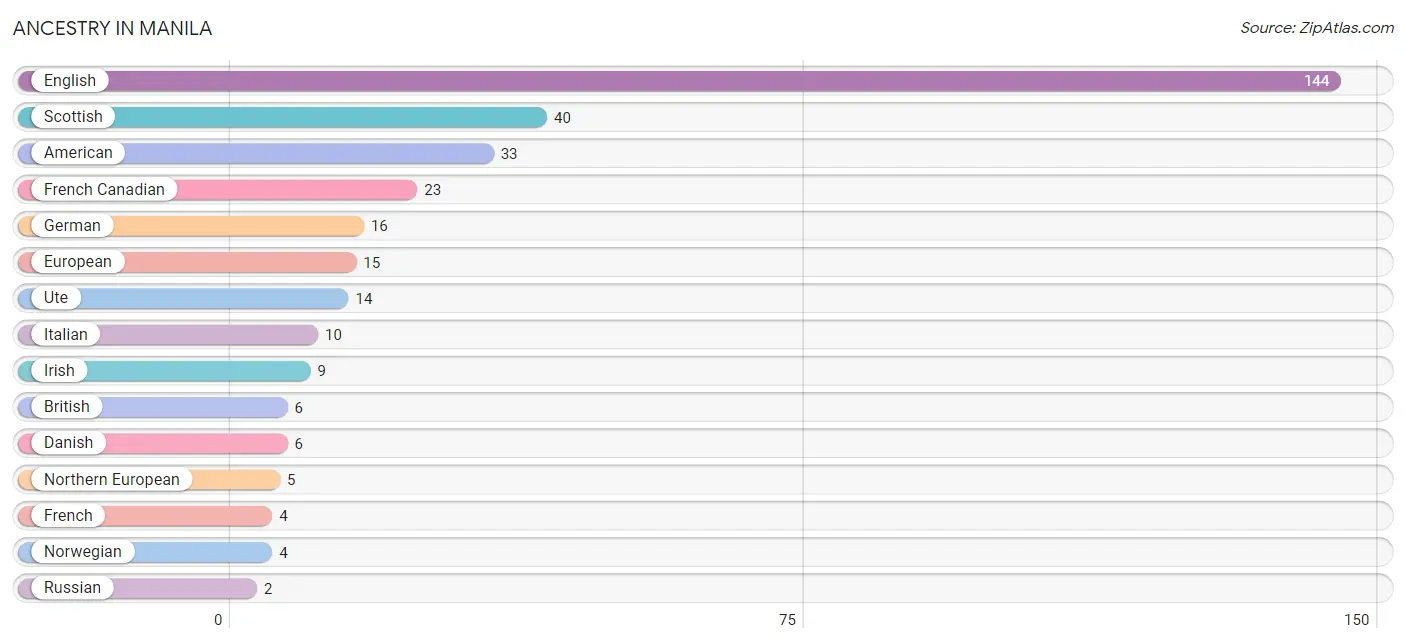
Ancestry in Manila
The most populous ancestries reported in Manila are English (144 | 43.6%), Scottish (40 | 12.1%), American (33 | 10.0%), French Canadian (23 | 7.0%), and German (16 | 4.9%), together accounting for 77.6% of all Manila residents.
| Ancestry | # Population | % Population |
| American | 33 | 10.0% |
| British | 6 | 1.8% |
| Danish | 6 | 1.8% |
| English | 144 | 43.6% |
| European | 15 | 4.5% |
| French | 4 | 1.2% |
| French Canadian | 23 | 7.0% |
| German | 16 | 4.9% |
| Irish | 9 | 2.7% |
| Italian | 10 | 3.0% |
| Northern European | 5 | 1.5% |
| Norwegian | 4 | 1.2% |
| Russian | 2 | 0.6% |
| Scottish | 40 | 12.1% |
| Swiss | 2 | 0.6% |
| Ute | 14 | 4.2% |
| Welsh | 1 | 0.3% | View All 17 Rows |
Immigrants in Manila

| Immigration Origin | # Population | % Population | View All 0 Rows |
Sex and Age in Manila
Sex and Age in Manila
The most populous age groups in Manila are 45 to 49 Years (36 | 21.0%) for men and 10 to 14 Years (28 | 17.6%) for women.
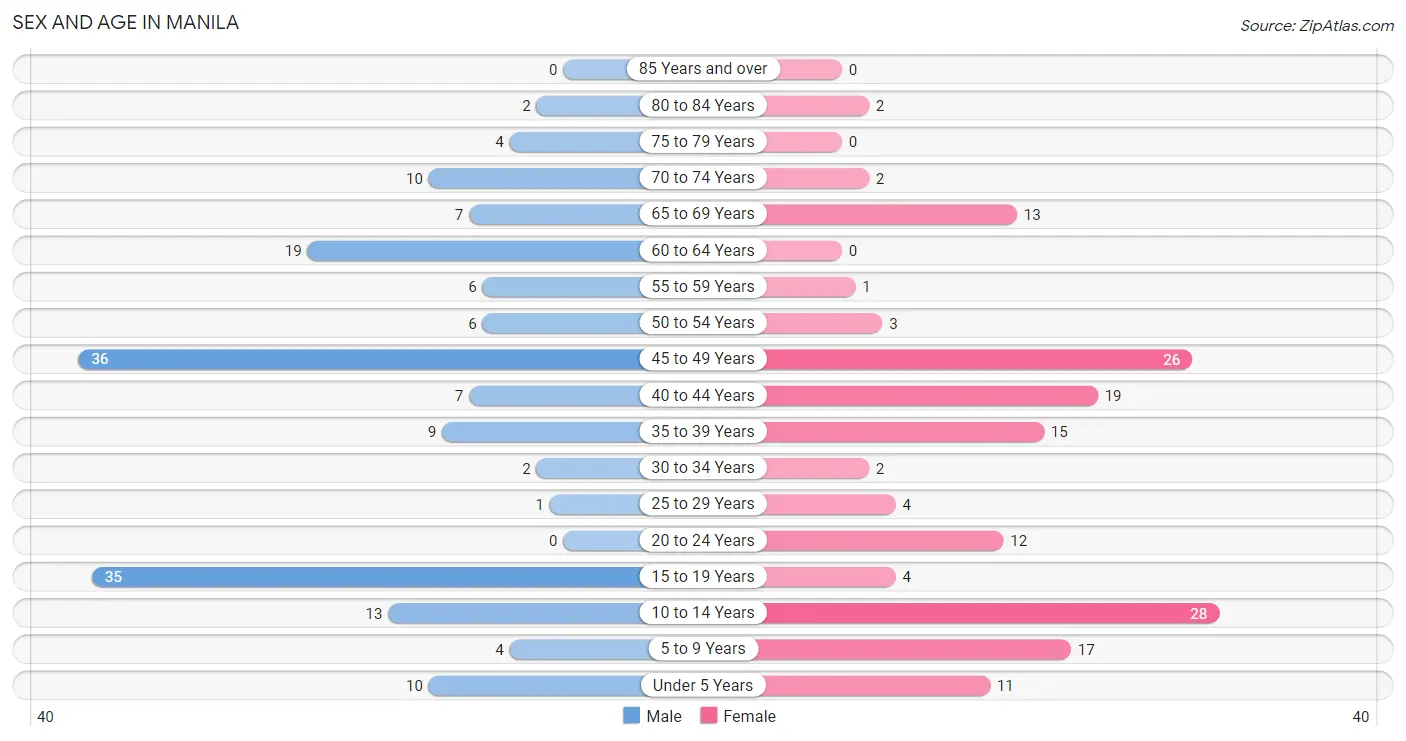
| Age Bracket | Male | Female |
| Under 5 Years | 10 (5.9%) | 11 (6.9%) |
| 5 to 9 Years | 4 (2.3%) | 17 (10.7%) |
| 10 to 14 Years | 13 (7.6%) | 28 (17.6%) |
| 15 to 19 Years | 35 (20.5%) | 4 (2.5%) |
| 20 to 24 Years | 0 (0.0%) | 12 (7.5%) |
| 25 to 29 Years | 1 (0.6%) | 4 (2.5%) |
| 30 to 34 Years | 2 (1.2%) | 2 (1.3%) |
| 35 to 39 Years | 9 (5.3%) | 15 (9.4%) |
| 40 to 44 Years | 7 (4.1%) | 19 (11.9%) |
| 45 to 49 Years | 36 (21.0%) | 26 (16.4%) |
| 50 to 54 Years | 6 (3.5%) | 3 (1.9%) |
| 55 to 59 Years | 6 (3.5%) | 1 (0.6%) |
| 60 to 64 Years | 19 (11.1%) | 0 (0.0%) |
| 65 to 69 Years | 7 (4.1%) | 13 (8.2%) |
| 70 to 74 Years | 10 (5.9%) | 2 (1.3%) |
| 75 to 79 Years | 4 (2.3%) | 0 (0.0%) |
| 80 to 84 Years | 2 (1.2%) | 2 (1.3%) |
| 85 Years and over | 0 (0.0%) | 0 (0.0%) |
| Total | 171 (100.0%) | 159 (100.0%) |
Families and Households in Manila
Median Family Size in Manila
The median family size in Manila is 3.71 persons per family, with married-couple families (70 | 90.9%) accounting for the largest median family size of 3.84 persons per family. On the other hand, single male/father families (3 | 3.9%) represent the smallest median family size with 2.00 persons per family.
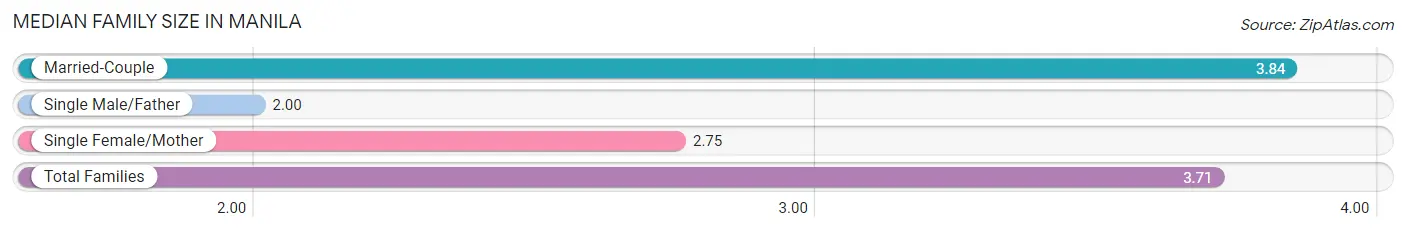
| Family Type | # Families | Family Size |
| Married-Couple | 70 (90.9%) | 3.84 |
| Single Male/Father | 3 (3.9%) | 2.00 |
| Single Female/Mother | 4 (5.2%) | 2.75 |
| Total Families | 77 (100.0%) | 3.71 |
Median Household Size in Manila
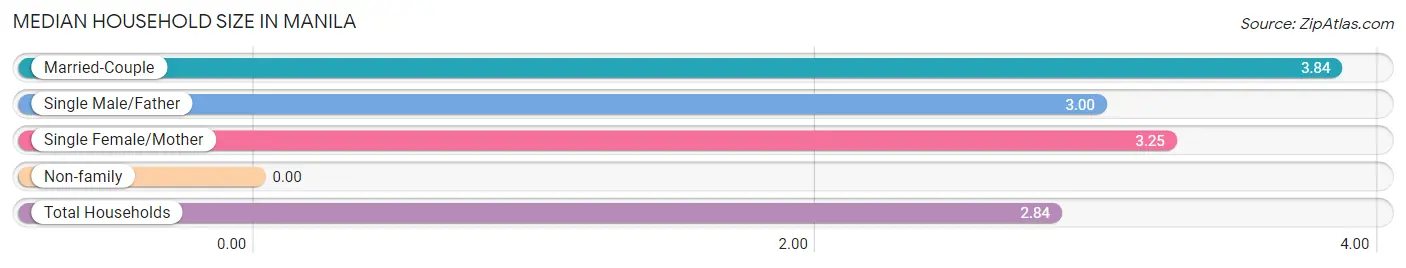
| Household Type | # Households | Household Size |
| Married-Couple | 70 (60.3%) | 3.84 |
| Single Male/Father | 3 (2.6%) | 3.00 |
| Single Female/Mother | 4 (3.5%) | 3.25 |
| Non-family | 39 (33.6%) | - |
| Total Households | 116 (100.0%) | 2.84 |
Household Size by Marriage Status in Manila
Out of a total of 116 households in Manila, 77 (66.4%) are family households, while 39 (33.6%) are nonfamily households. The most numerous type of family households are 2-person households, comprising 27, and the most common type of nonfamily households are 1-person households, comprising 39.
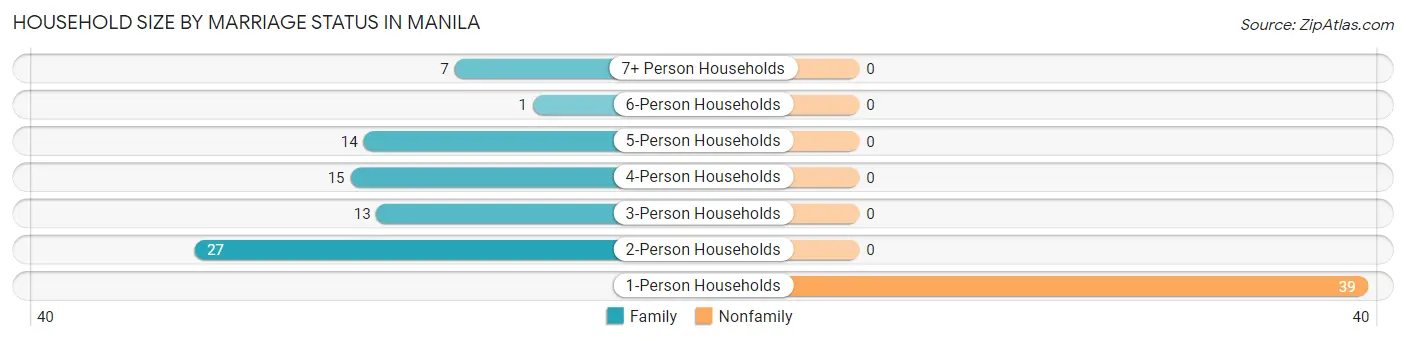
| Household Size | Family Households | Nonfamily Households |
| 1-Person Households | - | 39 (33.6%) |
| 2-Person Households | 27 (23.3%) | 0 (0.0%) |
| 3-Person Households | 13 (11.2%) | 0 (0.0%) |
| 4-Person Households | 15 (12.9%) | 0 (0.0%) |
| 5-Person Households | 14 (12.1%) | 0 (0.0%) |
| 6-Person Households | 1 (0.9%) | 0 (0.0%) |
| 7+ Person Households | 7 (6.0%) | 0 (0.0%) |
| Total | 77 (66.4%) | 39 (33.6%) |
Female Fertility in Manila
Fertility by Age in Manila
Average fertility rate in Manila is 134.0 births per 1,000 women. Women in the age bracket of 35 to 50 years have the highest fertility rate with 167.0 births per 1,000 women. Women in the age bracket of 35 to 50 years acount for 90.9% of all women with births.
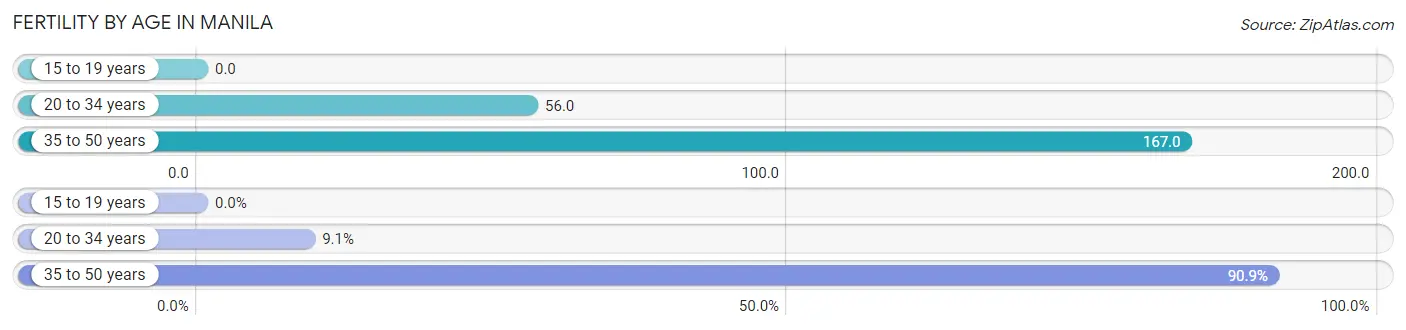
| Age Bracket | Women with Births | Births / 1,000 Women |
| 15 to 19 years | 0 (0.0%) | 0.0 |
| 20 to 34 years | 1 (9.1%) | 56.0 |
| 35 to 50 years | 10 (90.9%) | 167.0 |
| Total | 11 (100.0%) | 134.0 |
Fertility by Age by Marriage Status in Manila
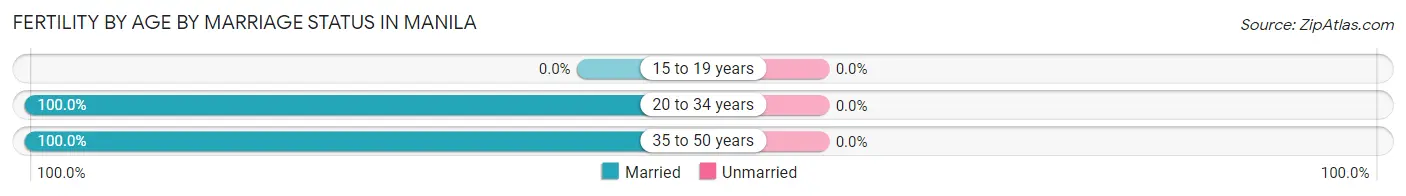
| Age Bracket | Married | Unmarried |
| 15 to 19 years | 0 (0.0%) | 0 (0.0%) |
| 20 to 34 years | 1 (100.0%) | 0 (0.0%) |
| 35 to 50 years | 10 (100.0%) | 0 (0.0%) |
| Total | 11 (100.0%) | 0 (0.0%) |
Fertility by Education in Manila
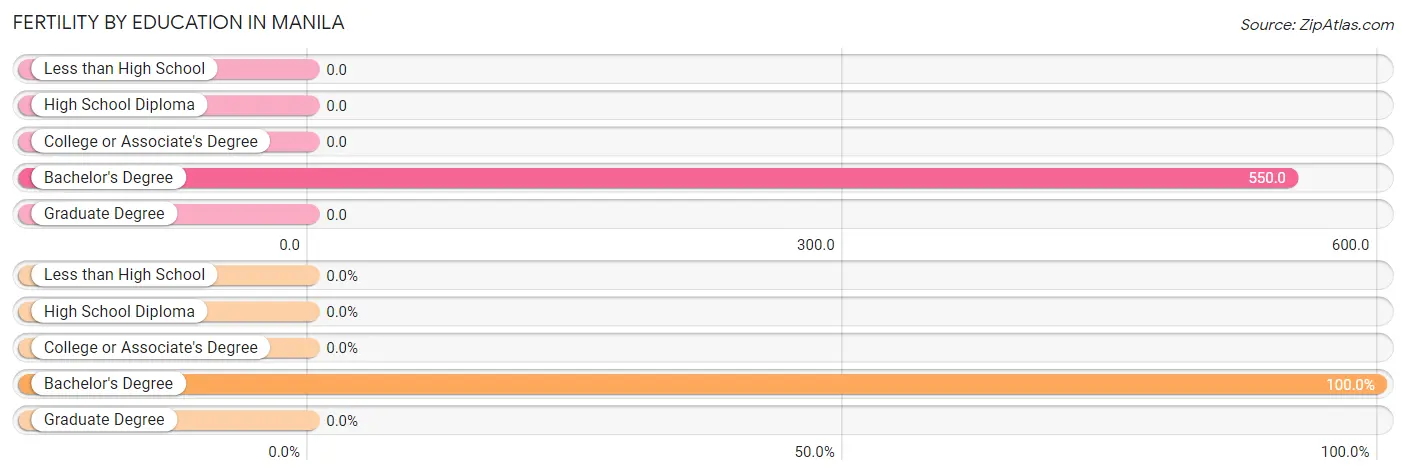
| Educational Attainment | Women with Births | Births / 1,000 Women |
| Less than High School | 0 (0.0%) | 0.0 |
| High School Diploma | 0 (0.0%) | 0.0 |
| College or Associate's Degree | 0 (0.0%) | 0.0 |
| Bachelor's Degree | 11 (100.0%) | 550.0 |
| Graduate Degree | 0 (0.0%) | 0.0 |
| Total | 11 (100.0%) | 134.0 |
Fertility by Education by Marriage Status in Manila
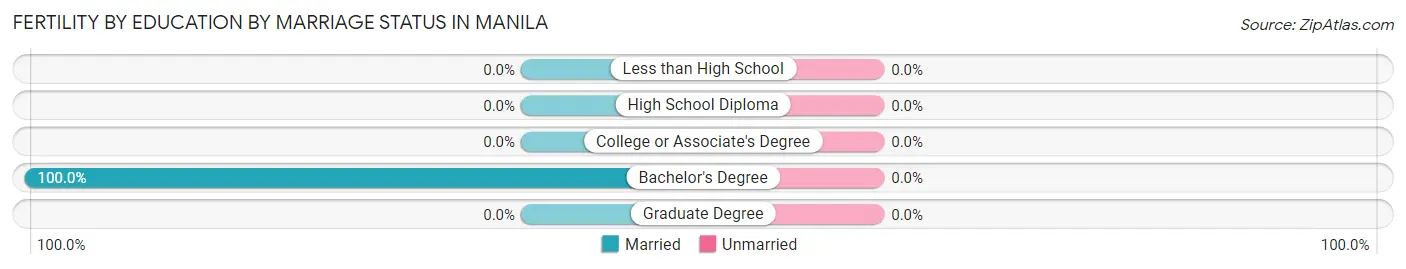
| Educational Attainment | Married | Unmarried |
| Less than High School | 0 (0.0%) | 0 (0.0%) |
| High School Diploma | 0 (0.0%) | 0 (0.0%) |
| College or Associate's Degree | 0 (0.0%) | 0 (0.0%) |
| Bachelor's Degree | 11 (100.0%) | 0 (0.0%) |
| Graduate Degree | 0 (0.0%) | 0 (0.0%) |
| Total | 11 (100.0%) | 0 (0.0%) |
Employment Characteristics in Manila
Employment by Class of Employer in Manila
Among the 153 employed individuals in Manila, self-employed (not incorporated) (43 | 28.1%), private company employees (40 | 26.1%), and local government employees (34 | 22.2%) make up the most common classes of employment.
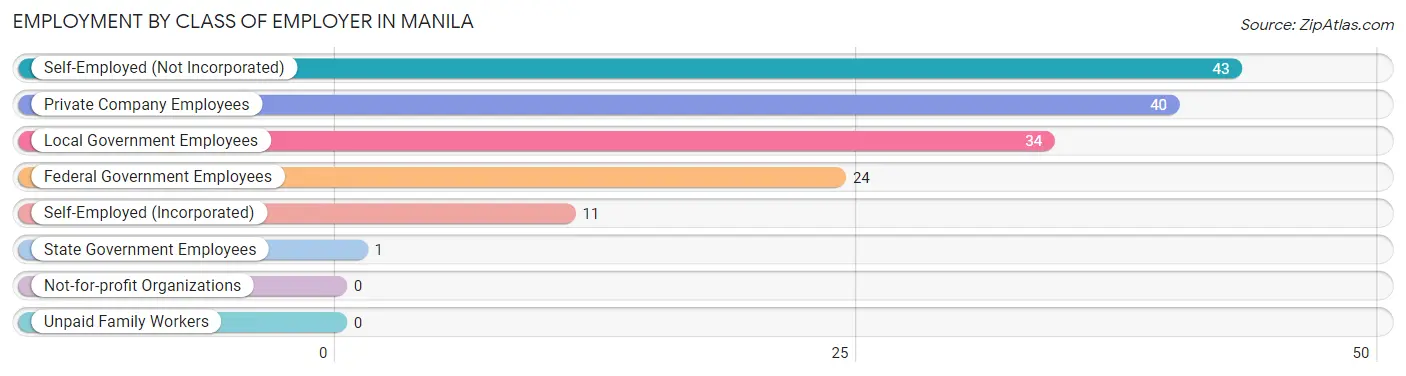
| Employer Class | # Employees | % Employees |
| Private Company Employees | 40 | 26.1% |
| Self-Employed (Incorporated) | 11 | 7.2% |
| Self-Employed (Not Incorporated) | 43 | 28.1% |
| Not-for-profit Organizations | 0 | 0.0% |
| Local Government Employees | 34 | 22.2% |
| State Government Employees | 1 | 0.6% |
| Federal Government Employees | 24 | 15.7% |
| Unpaid Family Workers | 0 | 0.0% |
| Total | 153 | 100.0% |
Employment Status by Age in Manila
According to the labor force statistics for Manila, out of the total population over 16 years of age (227), 69.6% or 158 individuals are in the labor force, with 3.4% or 5 of them unemployed. The age group with the highest labor force participation rate is 20 to 24 years, with 100.0% or 12 individuals in the labor force. Within the labor force, the 60 to 64 years age range has the highest percentage of unemployed individuals, with 100.0% or 5 of them being unemployed.
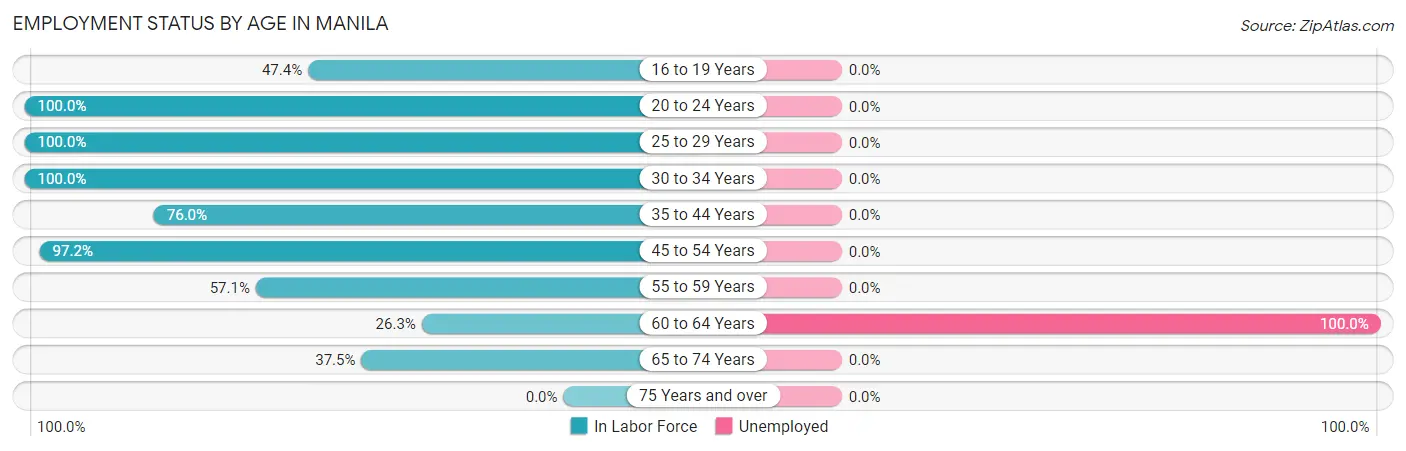
| Age Bracket | In Labor Force | Unemployed |
| 16 to 19 Years | 9 (47.4%) | 0 (0.0%) |
| 20 to 24 Years | 12 (100.0%) | 0 (0.0%) |
| 25 to 29 Years | 5 (100.0%) | 0 (0.0%) |
| 30 to 34 Years | 4 (100.0%) | 0 (0.0%) |
| 35 to 44 Years | 38 (76.0%) | 0 (0.0%) |
| 45 to 54 Years | 69 (97.2%) | 0 (0.0%) |
| 55 to 59 Years | 4 (57.1%) | 0 (0.0%) |
| 60 to 64 Years | 5 (26.3%) | 5 (100.0%) |
| 65 to 74 Years | 12 (37.5%) | 0 (0.0%) |
| 75 Years and over | 0 (0.0%) | 0 (0.0%) |
| Total | 158 (69.6%) | 5 (3.4%) |
Employment Status by Educational Attainment in Manila
According to labor force statistics for Manila, 80.1% of individuals (125) out of the total population between 25 and 64 years of age (156) are in the labor force, with 4.4% or 6 of them being unemployed. The group with the highest labor force participation rate are those with the educational attainment of high school diploma, with 86.5% or 32 individuals in the labor force. Within the labor force, individuals with high school diploma education have the highest percentage of unemployment, with 15.6% or 5 of them being unemployed.
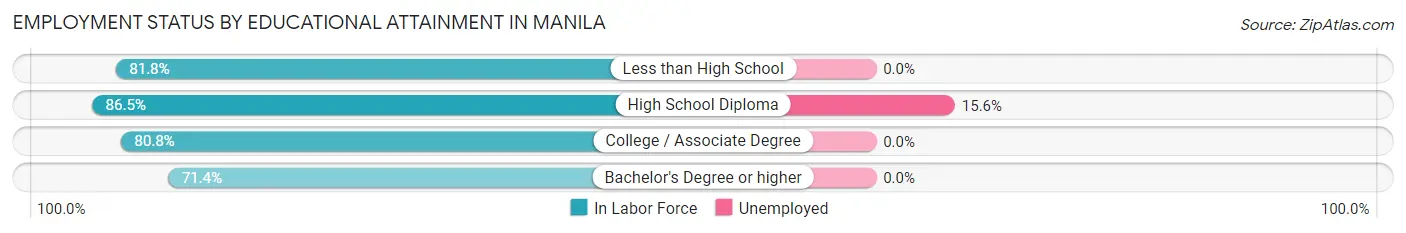
| Educational Attainment | In Labor Force | Unemployed |
| Less than High School | 9 (81.8%) | 0 (0.0%) |
| High School Diploma | 32 (86.5%) | 6 (15.6%) |
| College / Associate Degree | 59 (80.8%) | 0 (0.0%) |
| Bachelor's Degree or higher | 25 (71.4%) | 0 (0.0%) |
| Total | 125 (80.1%) | 7 (4.4%) |
Employment Occupations by Sex in Manila
Management, Business, Science and Arts Occupations
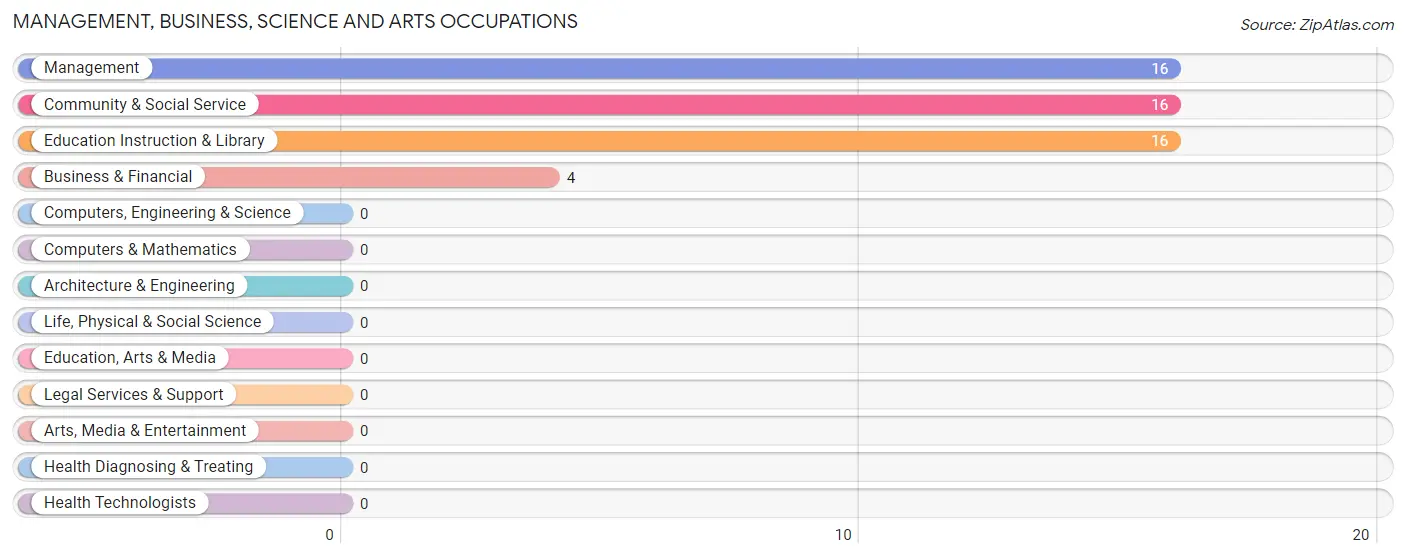
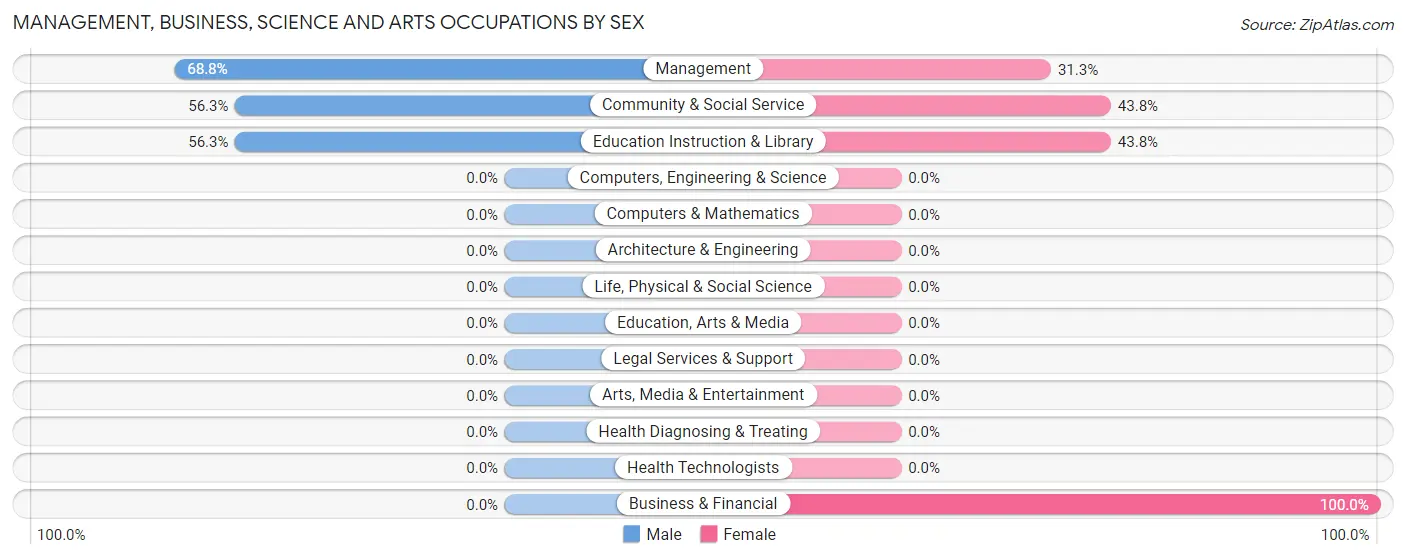
The most common Management, Business, Science and Arts occupations in Manila are Management (16 | 11.4%), Community & Social Service (16 | 11.4%), Education Instruction & Library (16 | 11.4%), and Business & Financial (4 | 2.8%).
Management, Business, Science and Arts Occupations by Sex
Within the Management, Business, Science and Arts occupations in Manila, the most male-oriented occupations are Management (68.8%), Community & Social Service (56.2%), and Education Instruction & Library (56.2%), while the most female-oriented occupations are Business & Financial (100.0%), Community & Social Service (43.8%), and Education Instruction & Library (43.8%).
| Occupation | Male | Female |
| Management | 11 (68.8%) | 5 (31.2%) |
| Business & Financial | 0 (0.0%) | 4 (100.0%) |
| Computers, Engineering & Science | 0 (0.0%) | 0 (0.0%) |
| Computers & Mathematics | 0 (0.0%) | 0 (0.0%) |
| Architecture & Engineering | 0 (0.0%) | 0 (0.0%) |
| Life, Physical & Social Science | 0 (0.0%) | 0 (0.0%) |
| Community & Social Service | 9 (56.2%) | 7 (43.8%) |
| Education, Arts & Media | 0 (0.0%) | 0 (0.0%) |
| Legal Services & Support | 0 (0.0%) | 0 (0.0%) |
| Education Instruction & Library | 9 (56.2%) | 7 (43.8%) |
| Arts, Media & Entertainment | 0 (0.0%) | 0 (0.0%) |
| Health Diagnosing & Treating | 0 (0.0%) | 0 (0.0%) |
| Health Technologists | 0 (0.0%) | 0 (0.0%) |
| Total (Category) | 20 (55.6%) | 16 (44.4%) |
| Total (Overall) | 65 (46.1%) | 76 (53.9%) |
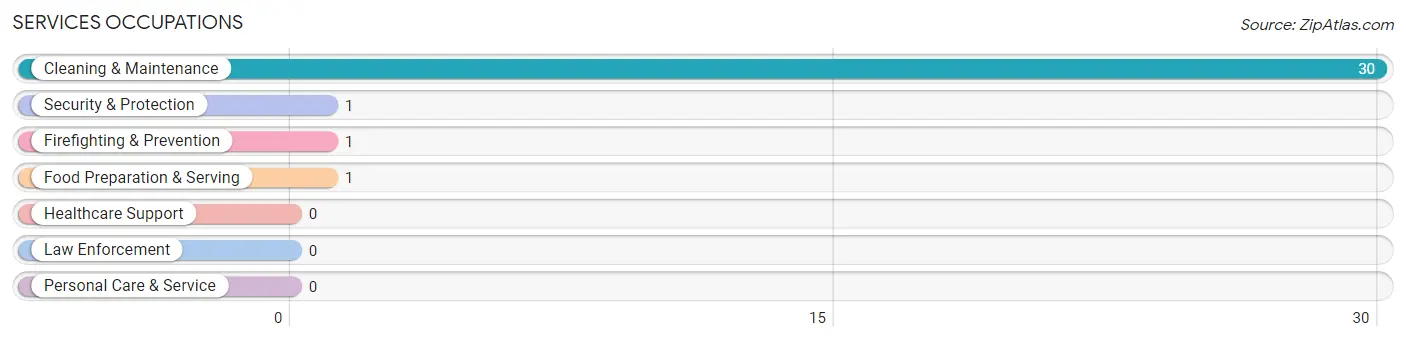
Services Occupations
The most common Services occupations in Manila are Cleaning & Maintenance (30 | 21.3%), Security & Protection (1 | 0.7%), Firefighting & Prevention (1 | 0.7%), and Food Preparation & Serving (1 | 0.7%).
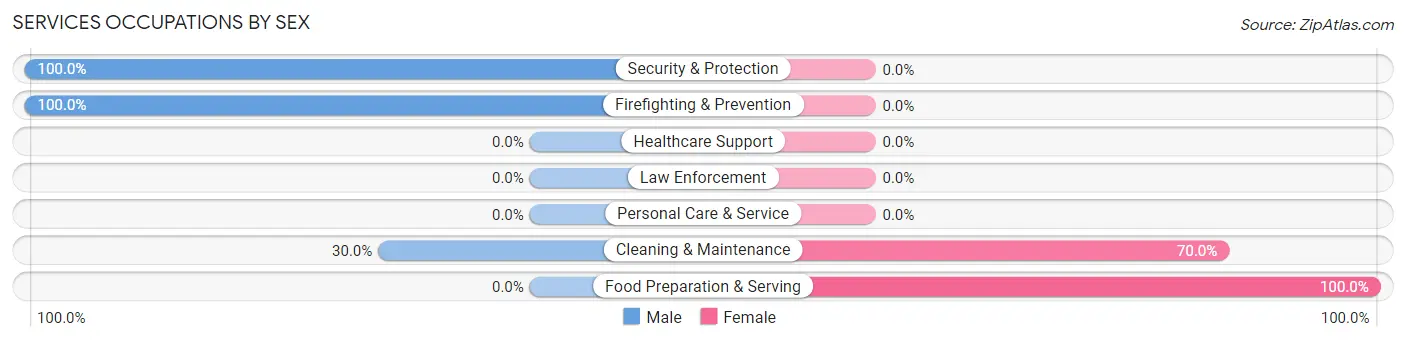
Services Occupations by Sex
Within the Services occupations in Manila, the most male-oriented occupations are Security & Protection (100.0%), Firefighting & Prevention (100.0%), and Cleaning & Maintenance (30.0%), while the most female-oriented occupations are Food Preparation & Serving (100.0%), and Cleaning & Maintenance (70.0%).
| Occupation | Male | Female |
| Healthcare Support | 0 (0.0%) | 0 (0.0%) |
| Security & Protection | 1 (100.0%) | 0 (0.0%) |
| Firefighting & Prevention | 1 (100.0%) | 0 (0.0%) |
| Law Enforcement | 0 (0.0%) | 0 (0.0%) |
| Food Preparation & Serving | 0 (0.0%) | 1 (100.0%) |
| Cleaning & Maintenance | 9 (30.0%) | 21 (70.0%) |
| Personal Care & Service | 0 (0.0%) | 0 (0.0%) |
| Total (Category) | 10 (31.2%) | 22 (68.8%) |
| Total (Overall) | 65 (46.1%) | 76 (53.9%) |
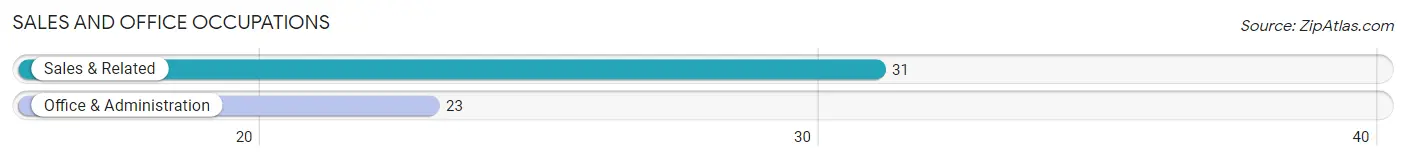
Sales and Office Occupations
The most common Sales and Office occupations in Manila are Sales & Related (31 | 22.0%), and Office & Administration (23 | 16.3%).
Sales and Office Occupations by Sex

| Occupation | Male | Female |
| Sales & Related | 16 (51.6%) | 15 (48.4%) |
| Office & Administration | 0 (0.0%) | 23 (100.0%) |
| Total (Category) | 16 (29.6%) | 38 (70.4%) |
| Total (Overall) | 65 (46.1%) | 76 (53.9%) |
Natural Resources, Construction and Maintenance Occupations
The most common Natural Resources, Construction and Maintenance occupations in Manila are Installation, Maintenance & Repair (9 | 6.4%), and Construction & Extraction (7 | 5.0%).
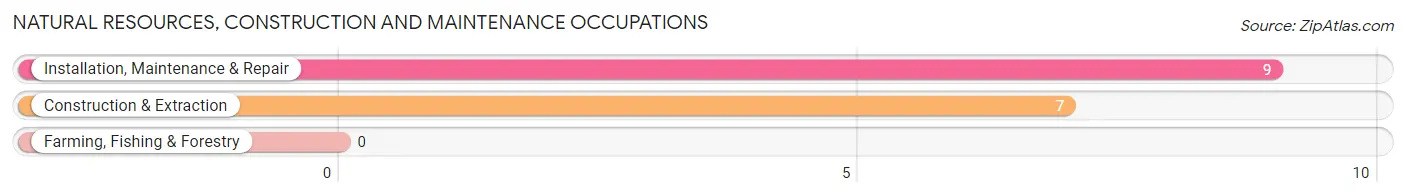
Natural Resources, Construction and Maintenance Occupations by Sex

| Occupation | Male | Female |
| Farming, Fishing & Forestry | 0 (0.0%) | 0 (0.0%) |
| Construction & Extraction | 7 (100.0%) | 0 (0.0%) |
| Installation, Maintenance & Repair | 9 (100.0%) | 0 (0.0%) |
| Total (Category) | 16 (100.0%) | 0 (0.0%) |
| Total (Overall) | 65 (46.1%) | 76 (53.9%) |
Production, Transportation and Moving Occupations
The most common Production, Transportation and Moving occupations in Manila are Material Moving (2 | 1.4%), and Production (1 | 0.7%).
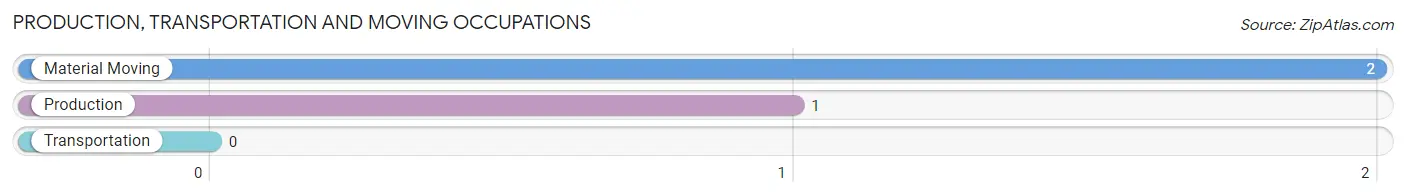
Production, Transportation and Moving Occupations by Sex
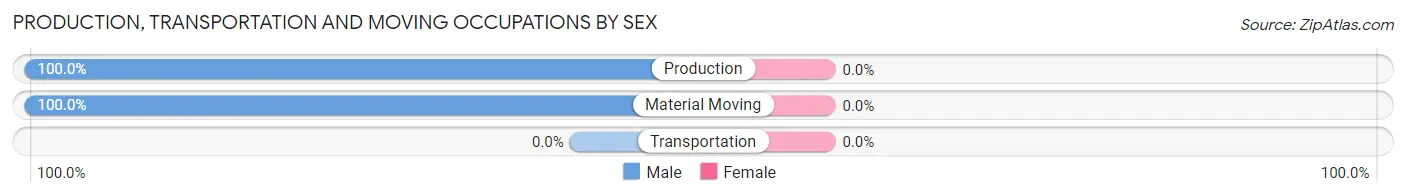
| Occupation | Male | Female |
| Production | 1 (100.0%) | 0 (0.0%) |
| Transportation | 0 (0.0%) | 0 (0.0%) |
| Material Moving | 2 (100.0%) | 0 (0.0%) |
| Total (Category) | 3 (100.0%) | 0 (0.0%) |
| Total (Overall) | 65 (46.1%) | 76 (53.9%) |
Employment Industries by Sex in Manila
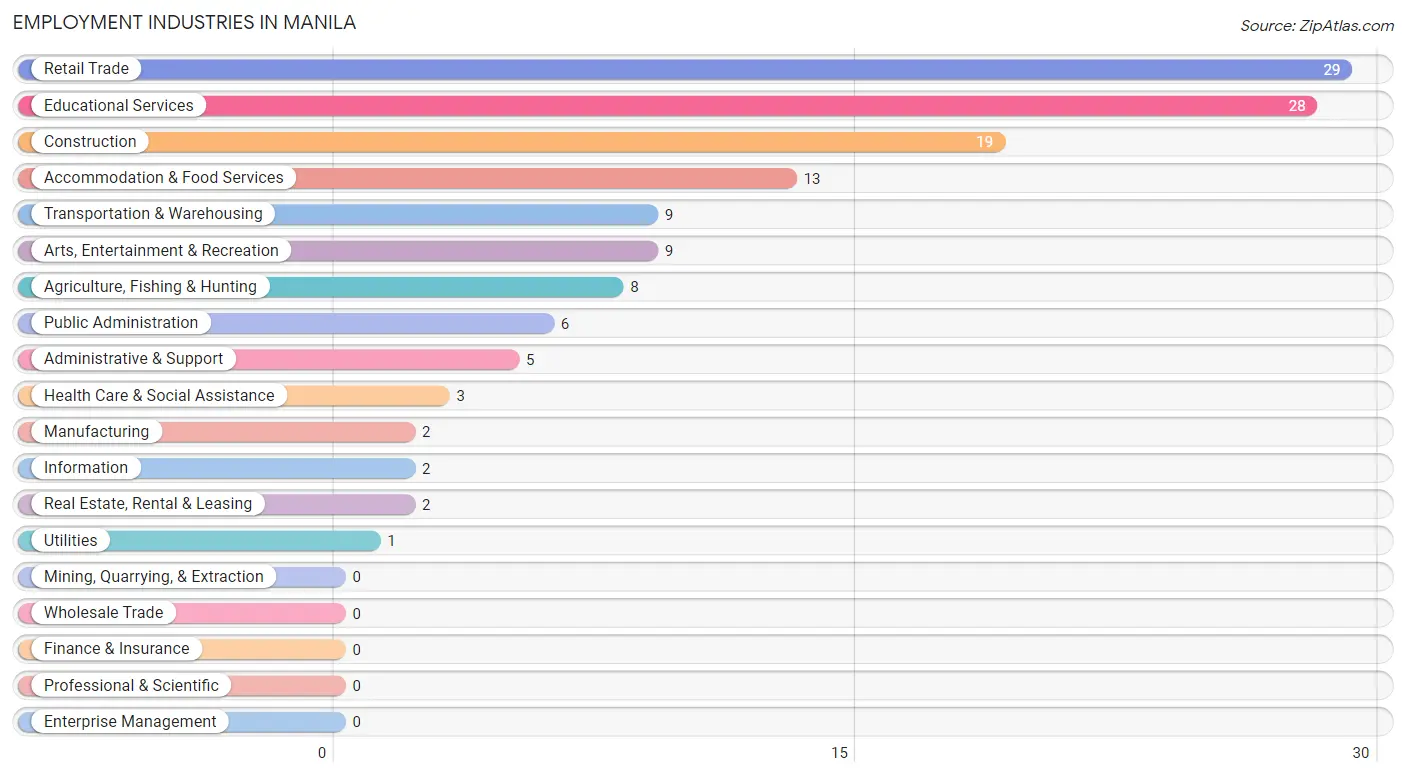
Employment Industries in Manila
The major employment industries in Manila include Retail Trade (29 | 20.6%), Educational Services (28 | 19.9%), Construction (19 | 13.5%), Accommodation & Food Services (13 | 9.2%), and Transportation & Warehousing (9 | 6.4%).
Employment Industries by Sex in Manila
The Manila industries that see more men than women are Manufacturing (100.0%), Utilities (100.0%), and Information (100.0%), whereas the industries that tend to have a higher number of women are Real Estate, Rental & Leasing (100.0%), Administrative & Support (100.0%), and Health Care & Social Assistance (100.0%).
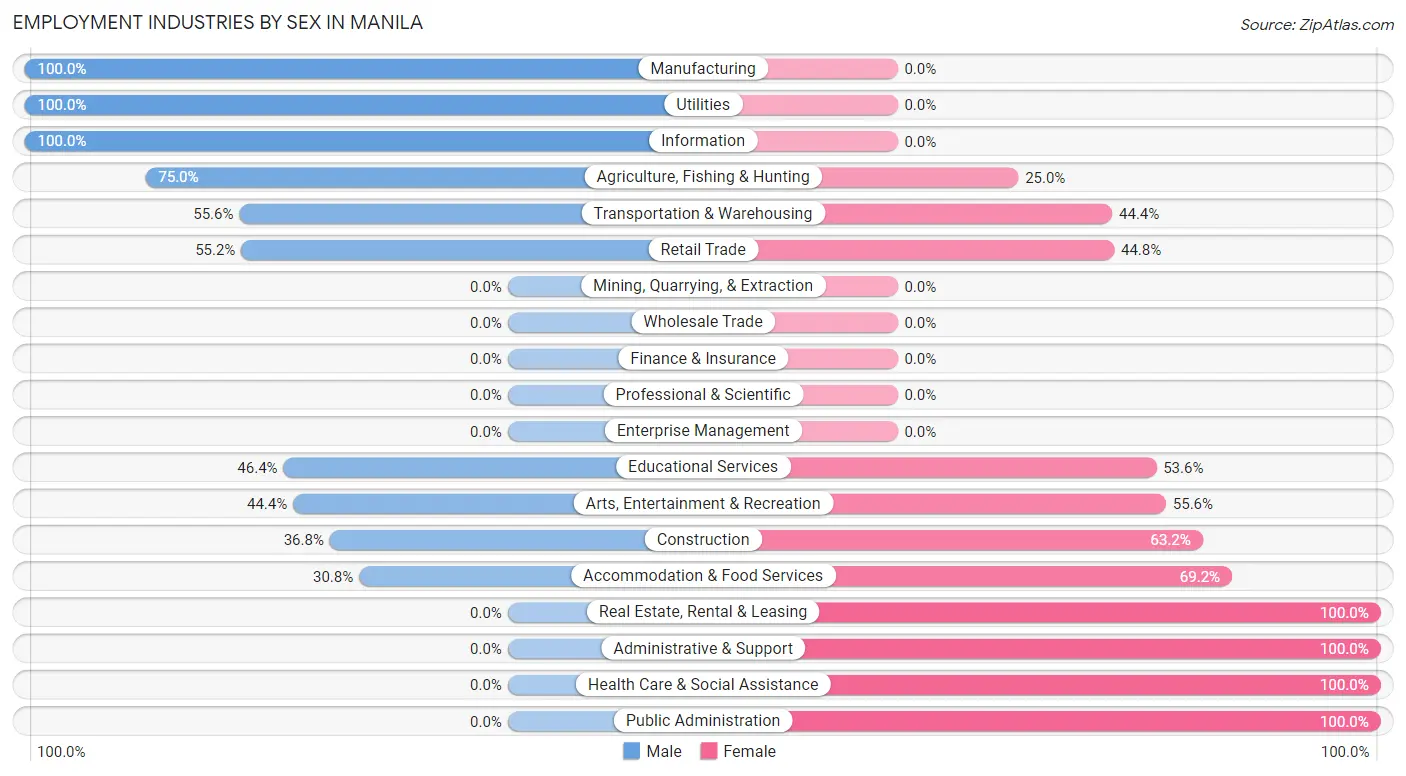
| Industry | Male | Female |
| Agriculture, Fishing & Hunting | 6 (75.0%) | 2 (25.0%) |
| Mining, Quarrying, & Extraction | 0 (0.0%) | 0 (0.0%) |
| Construction | 7 (36.8%) | 12 (63.2%) |
| Manufacturing | 2 (100.0%) | 0 (0.0%) |
| Wholesale Trade | 0 (0.0%) | 0 (0.0%) |
| Retail Trade | 16 (55.2%) | 13 (44.8%) |
| Transportation & Warehousing | 5 (55.6%) | 4 (44.4%) |
| Utilities | 1 (100.0%) | 0 (0.0%) |
| Information | 2 (100.0%) | 0 (0.0%) |
| Finance & Insurance | 0 (0.0%) | 0 (0.0%) |
| Real Estate, Rental & Leasing | 0 (0.0%) | 2 (100.0%) |
| Professional & Scientific | 0 (0.0%) | 0 (0.0%) |
| Enterprise Management | 0 (0.0%) | 0 (0.0%) |
| Administrative & Support | 0 (0.0%) | 5 (100.0%) |
| Educational Services | 13 (46.4%) | 15 (53.6%) |
| Health Care & Social Assistance | 0 (0.0%) | 3 (100.0%) |
| Arts, Entertainment & Recreation | 4 (44.4%) | 5 (55.6%) |
| Accommodation & Food Services | 4 (30.8%) | 9 (69.2%) |
| Public Administration | 0 (0.0%) | 6 (100.0%) |
| Total | 65 (46.1%) | 76 (53.9%) |
Education in Manila
School Enrollment in Manila
The most common levels of schooling among the 104 students in Manila are high school (37 | 35.6%), middle school (34 | 32.7%), and elementary school (12 | 11.5%).
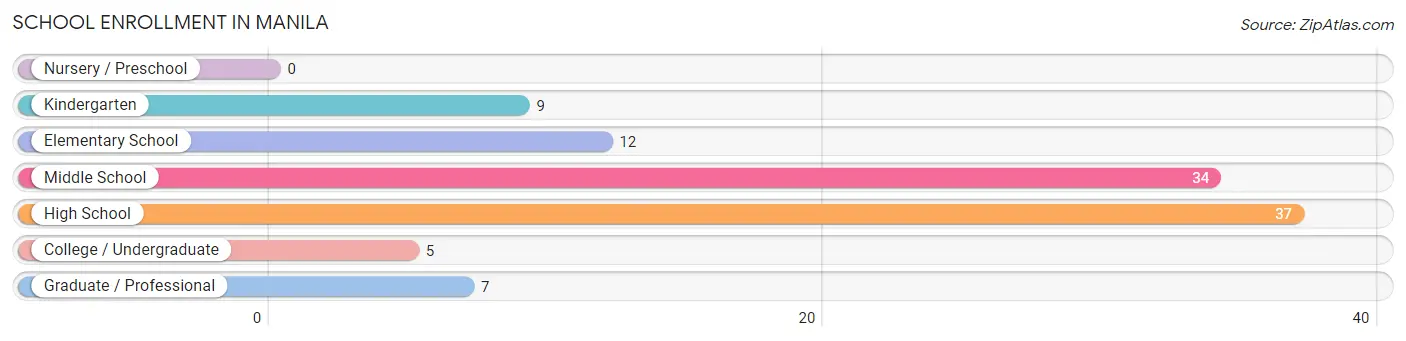
| School Level | # Students | % Students |
| Nursery / Preschool | 0 | 0.0% |
| Kindergarten | 9 | 8.6% |
| Elementary School | 12 | 11.5% |
| Middle School | 34 | 32.7% |
| High School | 37 | 35.6% |
| College / Undergraduate | 5 | 4.8% |
| Graduate / Professional | 7 | 6.7% |
| Total | 104 | 100.0% |
School Enrollment by Age by Funding Source in Manila
Out of a total of 104 students who are enrolled in schools in Manila, 2 (1.9%) attend a private institution, while the remaining 102 (98.1%) are enrolled in public schools. The age group of 10 to 14 year olds has the highest likelihood of being enrolled in private schools, with 2 (4.9% in the age bracket) enrolled. Conversely, the age group of 5 to 9 year old has the lowest likelihood of being enrolled in a private school, with 21 (100.0% in the age bracket) attending a public institution.
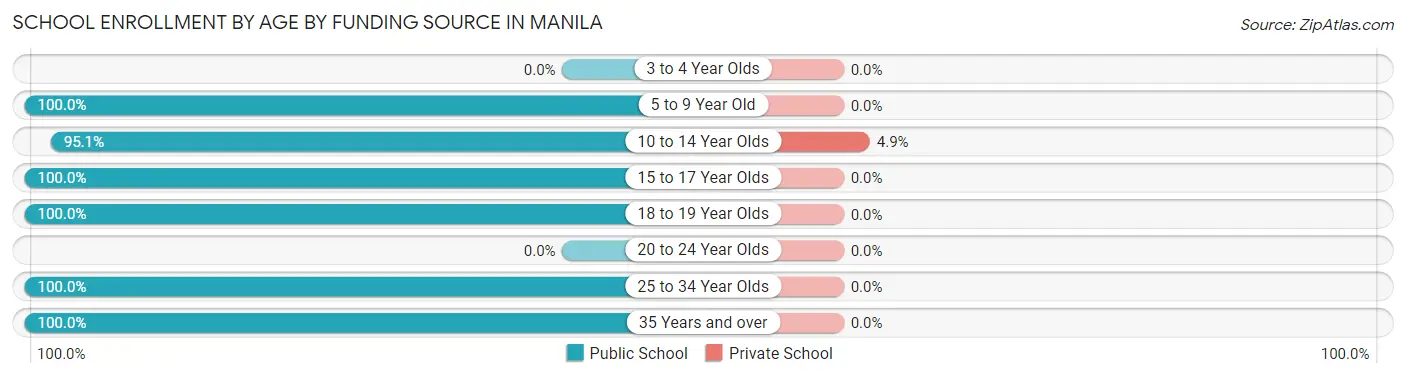
| Age Bracket | Public School | Private School |
| 3 to 4 Year Olds | 0 (0.0%) | 0 (0.0%) |
| 5 to 9 Year Old | 21 (100.0%) | 0 (0.0%) |
| 10 to 14 Year Olds | 39 (95.1%) | 2 (4.9%) |
| 15 to 17 Year Olds | 30 (100.0%) | 0 (0.0%) |
| 18 to 19 Year Olds | 4 (100.0%) | 0 (0.0%) |
| 20 to 24 Year Olds | 0 (0.0%) | 0 (0.0%) |
| 25 to 34 Year Olds | 1 (100.0%) | 0 (0.0%) |
| 35 Years and over | 7 (100.0%) | 0 (0.0%) |
| Total | 102 (98.1%) | 2 (1.9%) |
Educational Attainment by Field of Study in Manila
Education (20 | 40.8%), science & technology (7 | 14.3%), communications (7 | 14.3%), literature & languages (3 | 6.1%), and arts & humanities (3 | 6.1%) are the most common fields of study among 49 individuals in Manila who have obtained a bachelor's degree or higher.
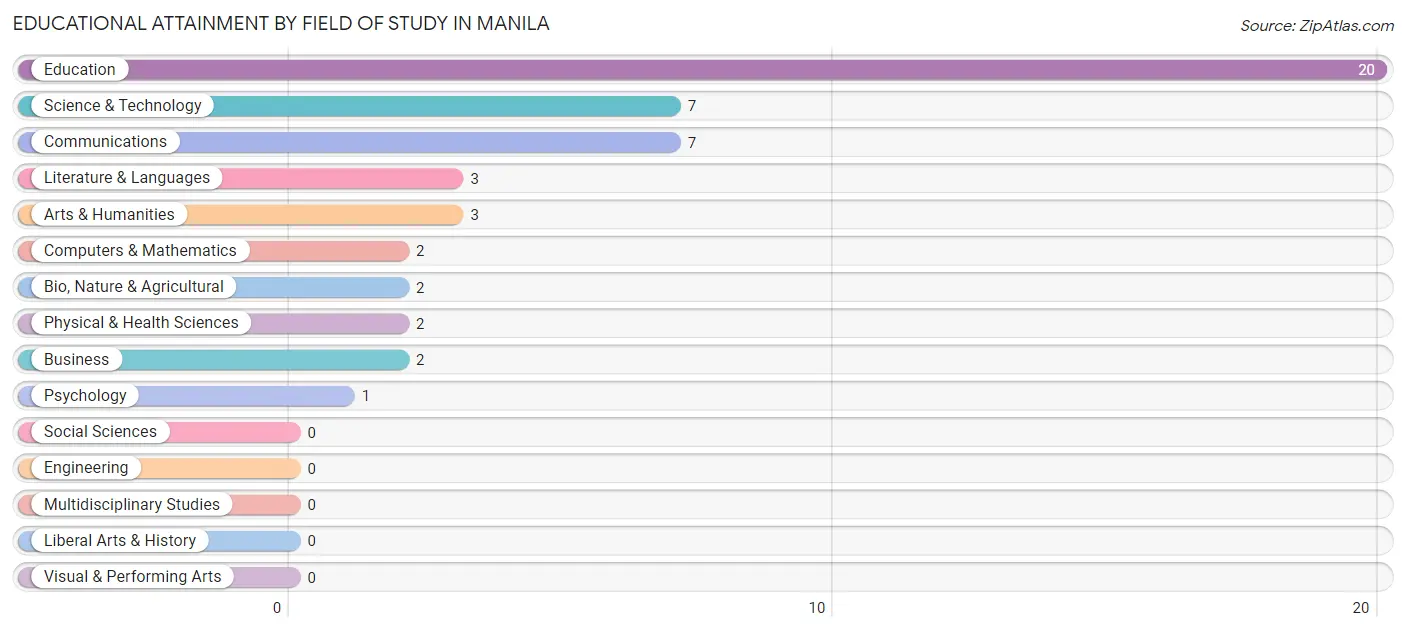
| Field of Study | # Graduates | % Graduates |
| Computers & Mathematics | 2 | 4.1% |
| Bio, Nature & Agricultural | 2 | 4.1% |
| Physical & Health Sciences | 2 | 4.1% |
| Psychology | 1 | 2.0% |
| Social Sciences | 0 | 0.0% |
| Engineering | 0 | 0.0% |
| Multidisciplinary Studies | 0 | 0.0% |
| Science & Technology | 7 | 14.3% |
| Business | 2 | 4.1% |
| Education | 20 | 40.8% |
| Literature & Languages | 3 | 6.1% |
| Liberal Arts & History | 0 | 0.0% |
| Visual & Performing Arts | 0 | 0.0% |
| Communications | 7 | 14.3% |
| Arts & Humanities | 3 | 6.1% |
| Total | 49 | 100.0% |
Transportation & Commute in Manila
Vehicle Availability by Sex in Manila
The most prevalent vehicle ownership categories in Manila are males with 3 vehicles (44, accounting for 57.1%) and females with 3 vehicles (43, making up 57.9%).
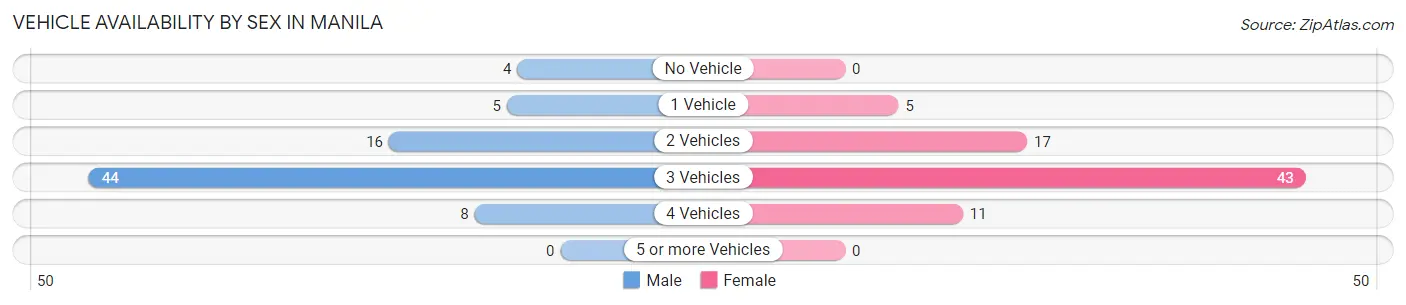
| Vehicles Available | Male | Female |
| No Vehicle | 4 (5.2%) | 0 (0.0%) |
| 1 Vehicle | 5 (6.5%) | 5 (6.6%) |
| 2 Vehicles | 16 (20.8%) | 17 (22.4%) |
| 3 Vehicles | 44 (57.1%) | 43 (56.6%) |
| 4 Vehicles | 8 (10.4%) | 11 (14.5%) |
| 5 or more Vehicles | 0 (0.0%) | 0 (0.0%) |
| Total | 77 (100.0%) | 76 (100.0%) |
Commute Time in Manila
The most frequently occuring commute durations in Manila are 5 to 9 minutes (79 commuters, 56.8%), less than 5 minutes (19 commuters, 13.7%), and 10 to 14 minutes (12 commuters, 8.6%).
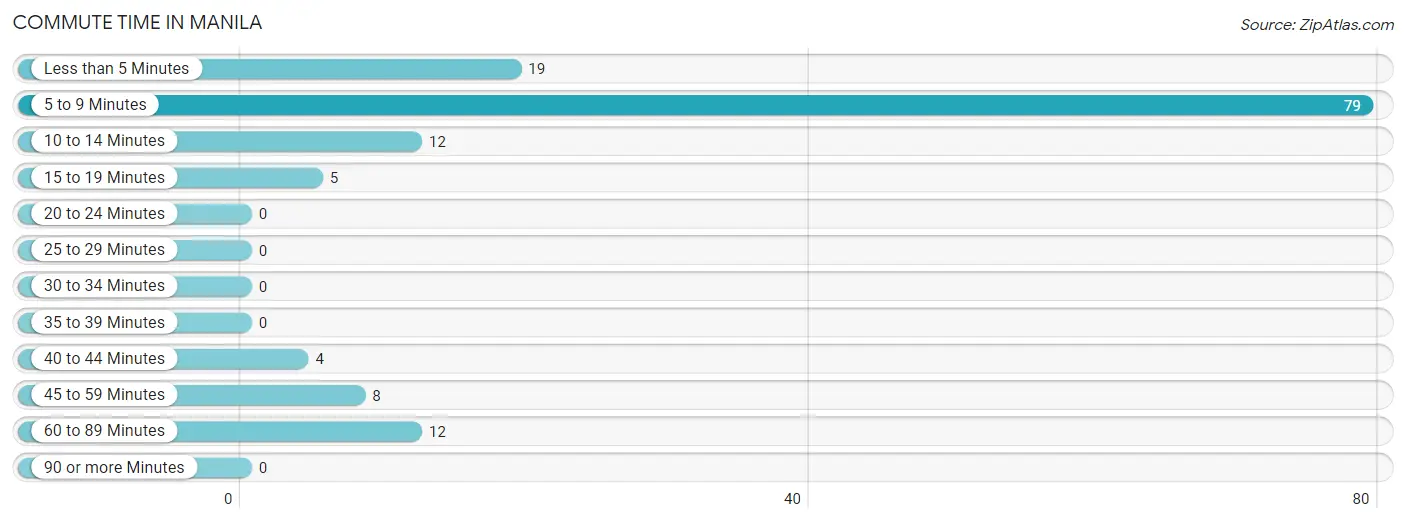
| Commute Time | # Commuters | % Commuters |
| Less than 5 Minutes | 19 | 13.7% |
| 5 to 9 Minutes | 79 | 56.8% |
| 10 to 14 Minutes | 12 | 8.6% |
| 15 to 19 Minutes | 5 | 3.6% |
| 20 to 24 Minutes | 0 | 0.0% |
| 25 to 29 Minutes | 0 | 0.0% |
| 30 to 34 Minutes | 0 | 0.0% |
| 35 to 39 Minutes | 0 | 0.0% |
| 40 to 44 Minutes | 4 | 2.9% |
| 45 to 59 Minutes | 8 | 5.8% |
| 60 to 89 Minutes | 12 | 8.6% |
| 90 or more Minutes | 0 | 0.0% |
Commute Time by Sex in Manila
The most common commute times in Manila are 5 to 9 minutes (41 commuters, 53.9%) for males and 5 to 9 minutes (38 commuters, 60.3%) for females.
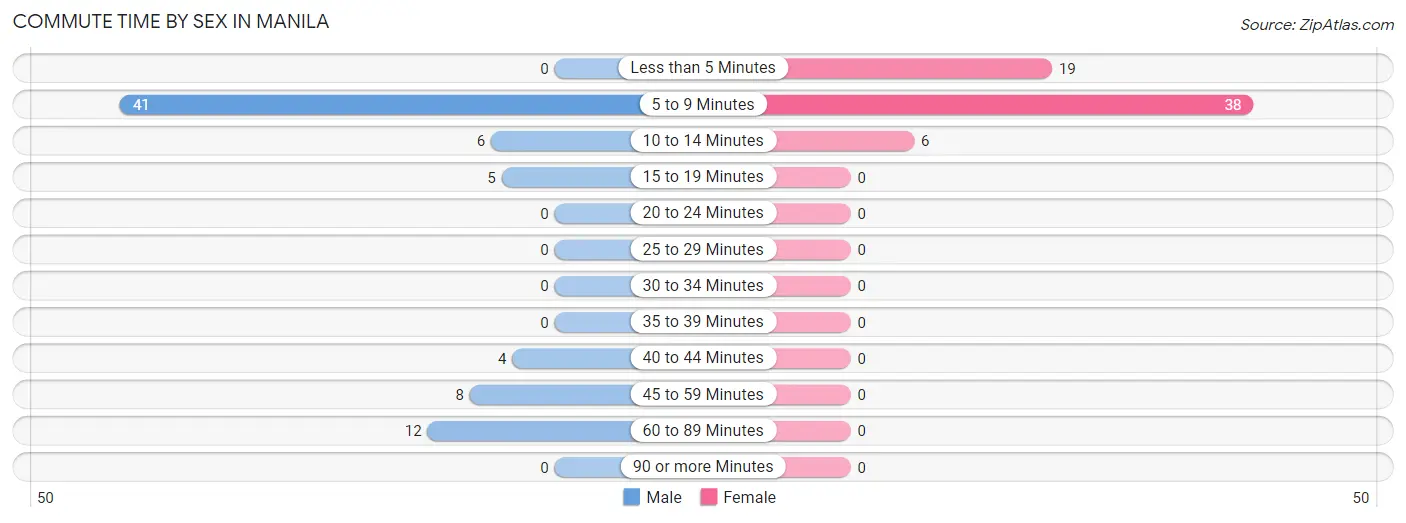
| Commute Time | Male | Female |
| Less than 5 Minutes | 0 (0.0%) | 19 (30.2%) |
| 5 to 9 Minutes | 41 (53.9%) | 38 (60.3%) |
| 10 to 14 Minutes | 6 (7.9%) | 6 (9.5%) |
| 15 to 19 Minutes | 5 (6.6%) | 0 (0.0%) |
| 20 to 24 Minutes | 0 (0.0%) | 0 (0.0%) |
| 25 to 29 Minutes | 0 (0.0%) | 0 (0.0%) |
| 30 to 34 Minutes | 0 (0.0%) | 0 (0.0%) |
| 35 to 39 Minutes | 0 (0.0%) | 0 (0.0%) |
| 40 to 44 Minutes | 4 (5.3%) | 0 (0.0%) |
| 45 to 59 Minutes | 8 (10.5%) | 0 (0.0%) |
| 60 to 89 Minutes | 12 (15.8%) | 0 (0.0%) |
| 90 or more Minutes | 0 (0.0%) | 0 (0.0%) |
Time of Departure to Work by Sex in Manila
The most frequent times of departure to work in Manila are 5:00 AM to 5:29 AM (23, 30.3%) for males and 7:30 AM to 7:59 AM (18, 28.6%) for females.
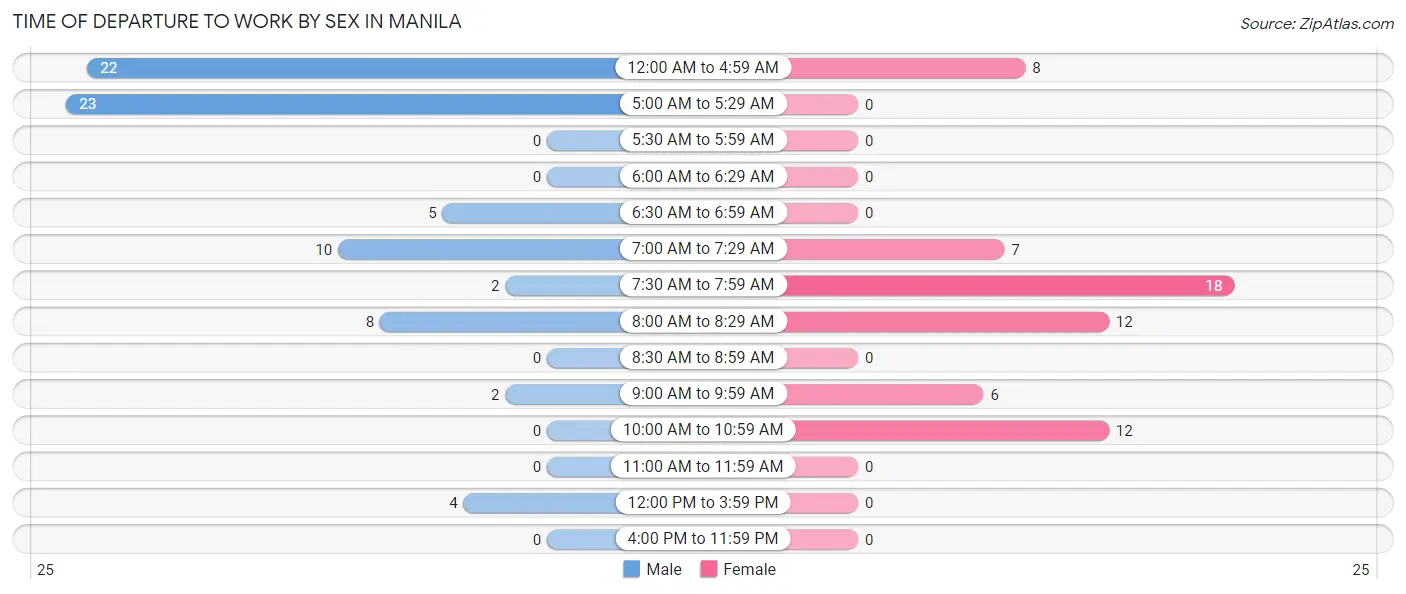
| Time of Departure | Male | Female |
| 12:00 AM to 4:59 AM | 22 (28.9%) | 8 (12.7%) |
| 5:00 AM to 5:29 AM | 23 (30.3%) | 0 (0.0%) |
| 5:30 AM to 5:59 AM | 0 (0.0%) | 0 (0.0%) |
| 6:00 AM to 6:29 AM | 0 (0.0%) | 0 (0.0%) |
| 6:30 AM to 6:59 AM | 5 (6.6%) | 0 (0.0%) |
| 7:00 AM to 7:29 AM | 10 (13.2%) | 7 (11.1%) |
| 7:30 AM to 7:59 AM | 2 (2.6%) | 18 (28.6%) |
| 8:00 AM to 8:29 AM | 8 (10.5%) | 12 (19.1%) |
| 8:30 AM to 8:59 AM | 0 (0.0%) | 0 (0.0%) |
| 9:00 AM to 9:59 AM | 2 (2.6%) | 6 (9.5%) |
| 10:00 AM to 10:59 AM | 0 (0.0%) | 12 (19.1%) |
| 11:00 AM to 11:59 AM | 0 (0.0%) | 0 (0.0%) |
| 12:00 PM to 3:59 PM | 4 (5.3%) | 0 (0.0%) |
| 4:00 PM to 11:59 PM | 0 (0.0%) | 0 (0.0%) |
| Total | 76 (100.0%) | 63 (100.0%) |
Housing Occupancy in Manila
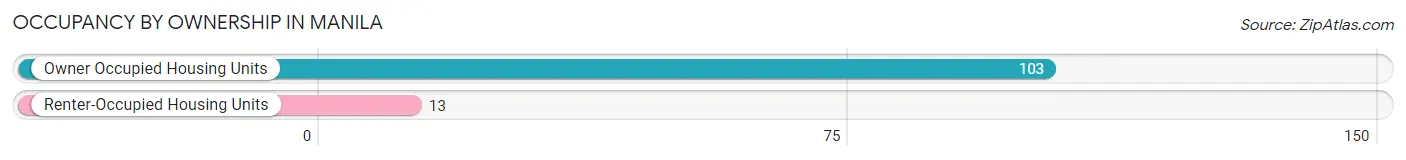
Occupancy by Ownership in Manila
Of the total 116 dwellings in Manila, owner-occupied units account for 103 (88.8%), while renter-occupied units make up 13 (11.2%).
| Occupancy | # Housing Units | % Housing Units |
| Owner Occupied Housing Units | 103 | 88.8% |
| Renter-Occupied Housing Units | 13 | 11.2% |
| Total Occupied Housing Units | 116 | 100.0% |
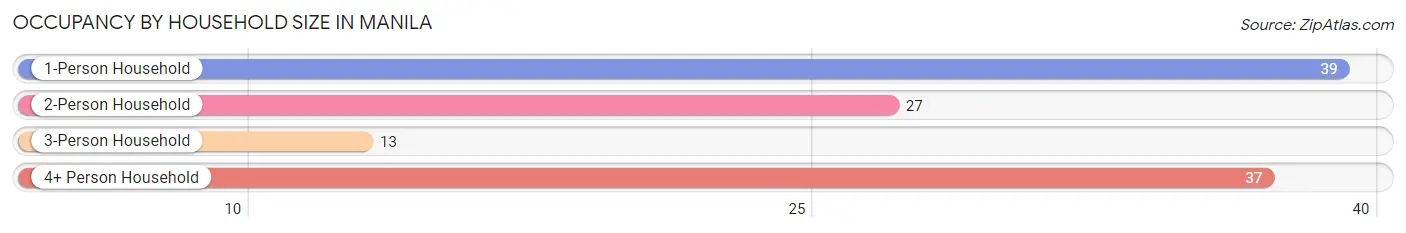
Occupancy by Household Size in Manila
| Household Size | # Housing Units | % Housing Units |
| 1-Person Household | 39 | 33.6% |
| 2-Person Household | 27 | 23.3% |
| 3-Person Household | 13 | 11.2% |
| 4+ Person Household | 37 | 31.9% |
| Total Housing Units | 116 | 100.0% |
Occupancy by Ownership by Household Size in Manila
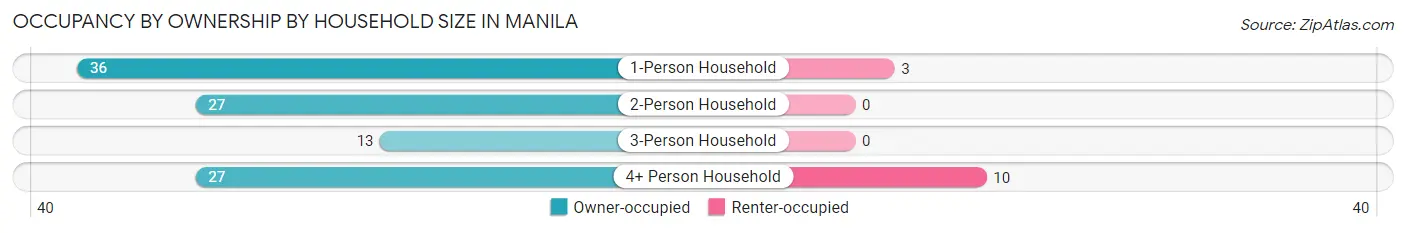
| Household Size | Owner-occupied | Renter-occupied |
| 1-Person Household | 36 (92.3%) | 3 (7.7%) |
| 2-Person Household | 27 (100.0%) | 0 (0.0%) |
| 3-Person Household | 13 (100.0%) | 0 (0.0%) |
| 4+ Person Household | 27 (73.0%) | 10 (27.0%) |
| Total Housing Units | 103 (88.8%) | 13 (11.2%) |
Occupancy by Educational Attainment in Manila
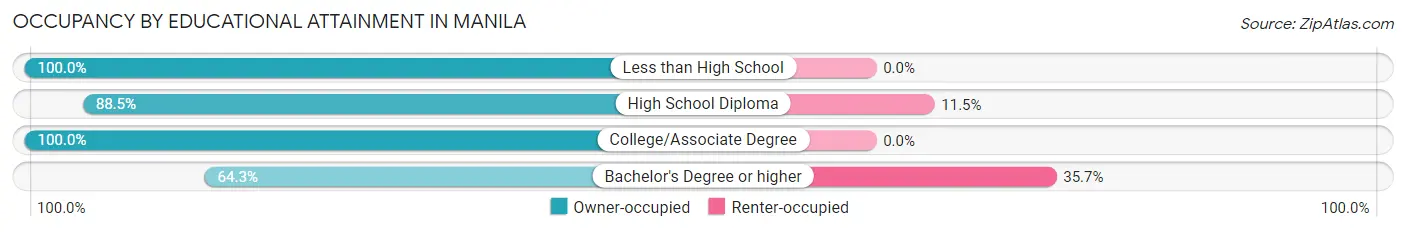
| Household Size | Owner-occupied | Renter-occupied |
| Less than High School | 4 (100.0%) | 0 (0.0%) |
| High School Diploma | 23 (88.5%) | 3 (11.5%) |
| College/Associate Degree | 58 (100.0%) | 0 (0.0%) |
| Bachelor's Degree or higher | 18 (64.3%) | 10 (35.7%) |
Occupancy by Age of Householder in Manila
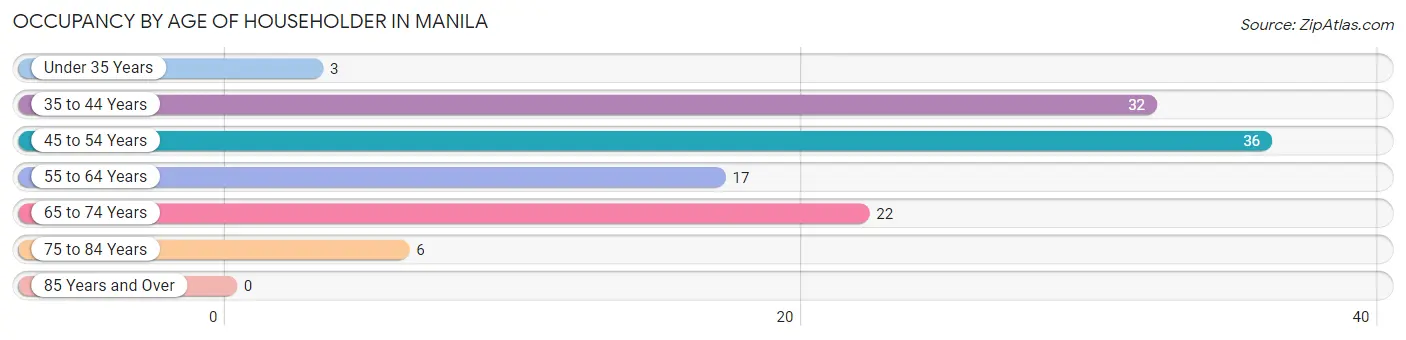
| Age Bracket | # Households | % Households |
| Under 35 Years | 3 | 2.6% |
| 35 to 44 Years | 32 | 27.6% |
| 45 to 54 Years | 36 | 31.0% |
| 55 to 64 Years | 17 | 14.7% |
| 65 to 74 Years | 22 | 19.0% |
| 75 to 84 Years | 6 | 5.2% |
| 85 Years and Over | 0 | 0.0% |
| Total | 116 | 100.0% |
Housing Finances in Manila
Median Income by Occupancy in Manila
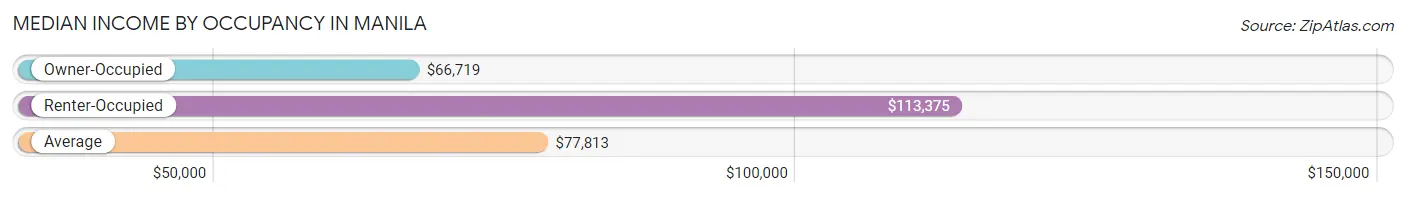
| Occupancy Type | # Households | Median Income |
| Owner-Occupied | 103 (88.8%) | $66,719 |
| Renter-Occupied | 13 (11.2%) | $113,375 |
| Average | 116 (100.0%) | $77,813 |
Occupancy by Householder Income Bracket in Manila
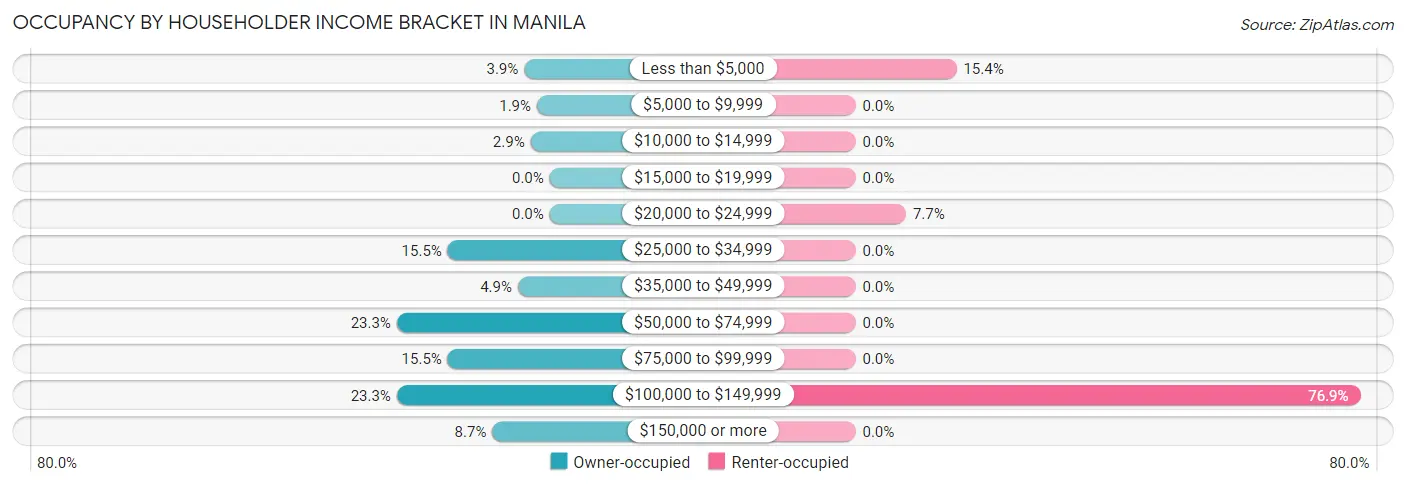
| Income Bracket | Owner-occupied | Renter-occupied |
| Less than $5,000 | 4 (3.9%) | 2 (15.4%) |
| $5,000 to $9,999 | 2 (1.9%) | 0 (0.0%) |
| $10,000 to $14,999 | 3 (2.9%) | 0 (0.0%) |
| $15,000 to $19,999 | 0 (0.0%) | 0 (0.0%) |
| $20,000 to $24,999 | 0 (0.0%) | 1 (7.7%) |
| $25,000 to $34,999 | 16 (15.5%) | 0 (0.0%) |
| $35,000 to $49,999 | 5 (4.9%) | 0 (0.0%) |
| $50,000 to $74,999 | 24 (23.3%) | 0 (0.0%) |
| $75,000 to $99,999 | 16 (15.5%) | 0 (0.0%) |
| $100,000 to $149,999 | 24 (23.3%) | 10 (76.9%) |
| $150,000 or more | 9 (8.7%) | 0 (0.0%) |
| Total | 103 (100.0%) | 13 (100.0%) |
Monthly Housing Cost Tiers in Manila
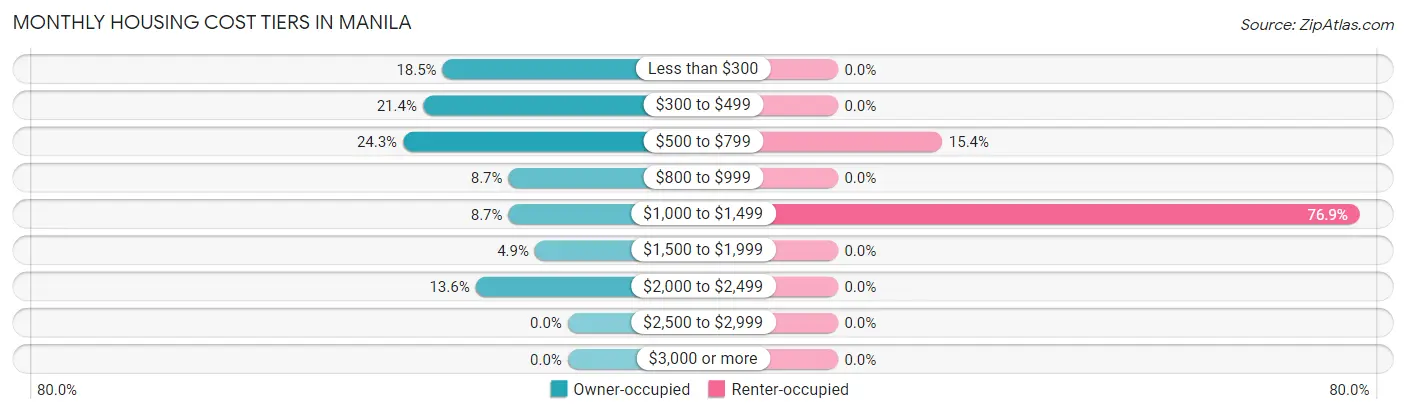
| Monthly Cost | Owner-occupied | Renter-occupied |
| Less than $300 | 19 (18.4%) | 0 (0.0%) |
| $300 to $499 | 22 (21.4%) | 0 (0.0%) |
| $500 to $799 | 25 (24.3%) | 2 (15.4%) |
| $800 to $999 | 9 (8.7%) | 0 (0.0%) |
| $1,000 to $1,499 | 9 (8.7%) | 10 (76.9%) |
| $1,500 to $1,999 | 5 (4.9%) | 0 (0.0%) |
| $2,000 to $2,499 | 14 (13.6%) | 0 (0.0%) |
| $2,500 to $2,999 | 0 (0.0%) | 0 (0.0%) |
| $3,000 or more | 0 (0.0%) | 0 (0.0%) |
| Total | 103 (100.0%) | 13 (100.0%) |
Physical Housing Characteristics in Manila
Housing Structures in Manila
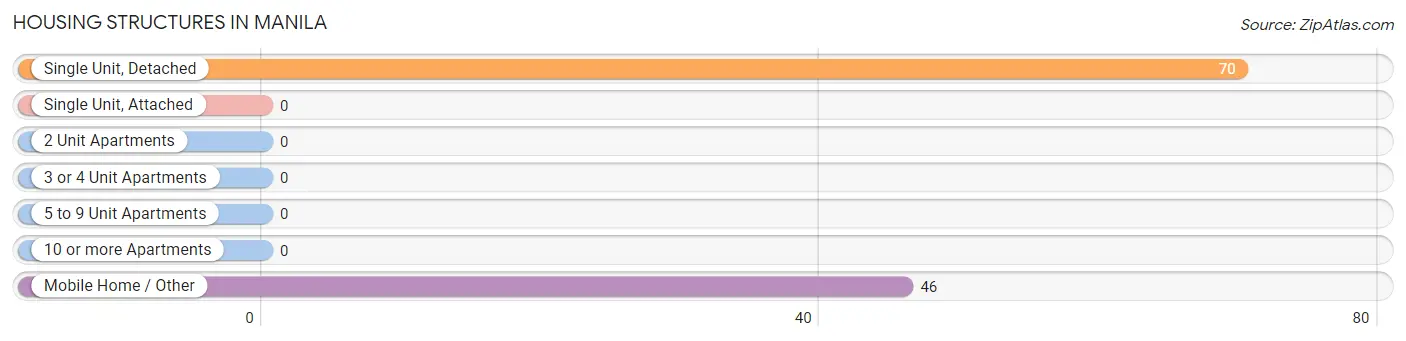
| Structure Type | # Housing Units | % Housing Units |
| Single Unit, Detached | 70 | 60.3% |
| Single Unit, Attached | 0 | 0.0% |
| 2 Unit Apartments | 0 | 0.0% |
| 3 or 4 Unit Apartments | 0 | 0.0% |
| 5 to 9 Unit Apartments | 0 | 0.0% |
| 10 or more Apartments | 0 | 0.0% |
| Mobile Home / Other | 46 | 39.7% |
| Total | 116 | 100.0% |
Housing Structures by Occupancy in Manila
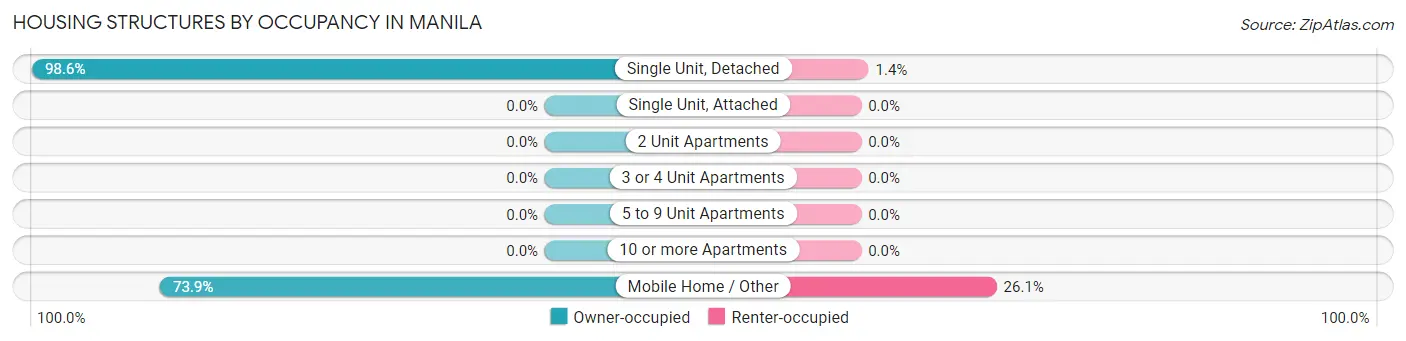
| Structure Type | Owner-occupied | Renter-occupied |
| Single Unit, Detached | 69 (98.6%) | 1 (1.4%) |
| Single Unit, Attached | 0 (0.0%) | 0 (0.0%) |
| 2 Unit Apartments | 0 (0.0%) | 0 (0.0%) |
| 3 or 4 Unit Apartments | 0 (0.0%) | 0 (0.0%) |
| 5 to 9 Unit Apartments | 0 (0.0%) | 0 (0.0%) |
| 10 or more Apartments | 0 (0.0%) | 0 (0.0%) |
| Mobile Home / Other | 34 (73.9%) | 12 (26.1%) |
| Total | 103 (88.8%) | 13 (11.2%) |
Housing Structures by Number of Rooms in Manila
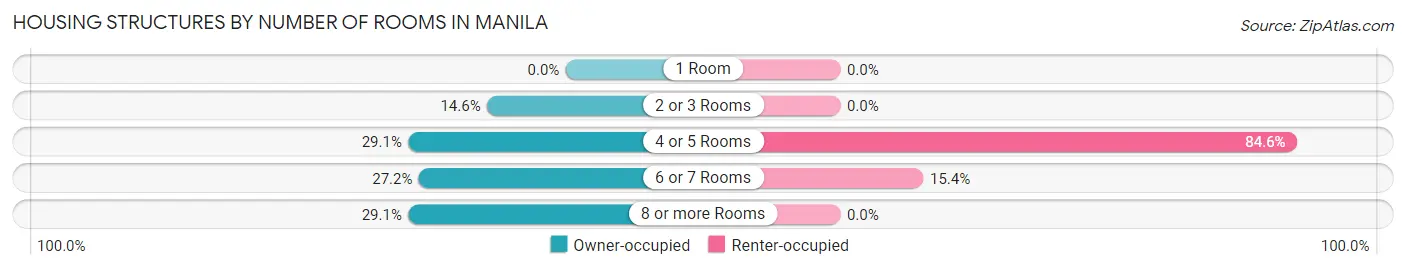
| Number of Rooms | Owner-occupied | Renter-occupied |
| 1 Room | 0 (0.0%) | 0 (0.0%) |
| 2 or 3 Rooms | 15 (14.6%) | 0 (0.0%) |
| 4 or 5 Rooms | 30 (29.1%) | 11 (84.6%) |
| 6 or 7 Rooms | 28 (27.2%) | 2 (15.4%) |
| 8 or more Rooms | 30 (29.1%) | 0 (0.0%) |
| Total | 103 (100.0%) | 13 (100.0%) |
Housing Structure by Heating Type in Manila
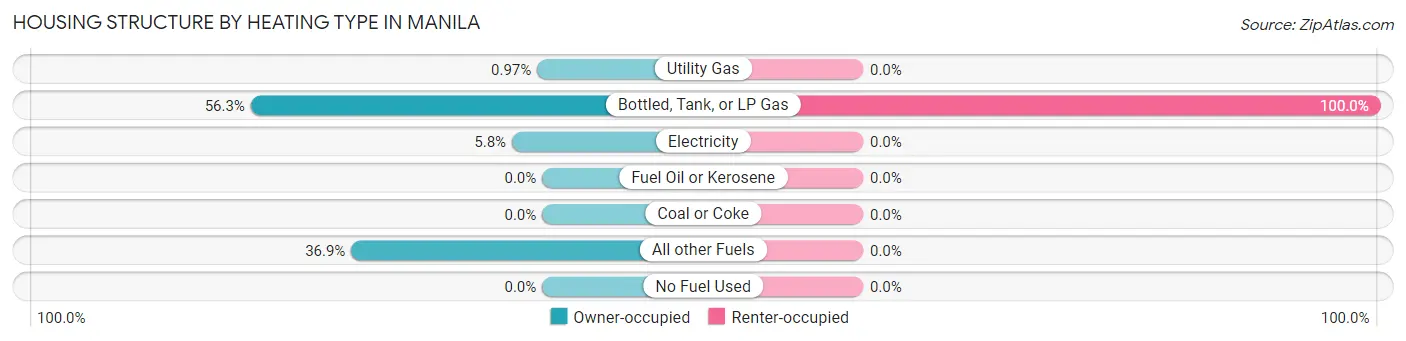
| Heating Type | Owner-occupied | Renter-occupied |
| Utility Gas | 1 (1.0%) | 0 (0.0%) |
| Bottled, Tank, or LP Gas | 58 (56.3%) | 13 (100.0%) |
| Electricity | 6 (5.8%) | 0 (0.0%) |
| Fuel Oil or Kerosene | 0 (0.0%) | 0 (0.0%) |
| Coal or Coke | 0 (0.0%) | 0 (0.0%) |
| All other Fuels | 38 (36.9%) | 0 (0.0%) |
| No Fuel Used | 0 (0.0%) | 0 (0.0%) |
| Total | 103 (100.0%) | 13 (100.0%) |
Household Vehicle Usage in Manila
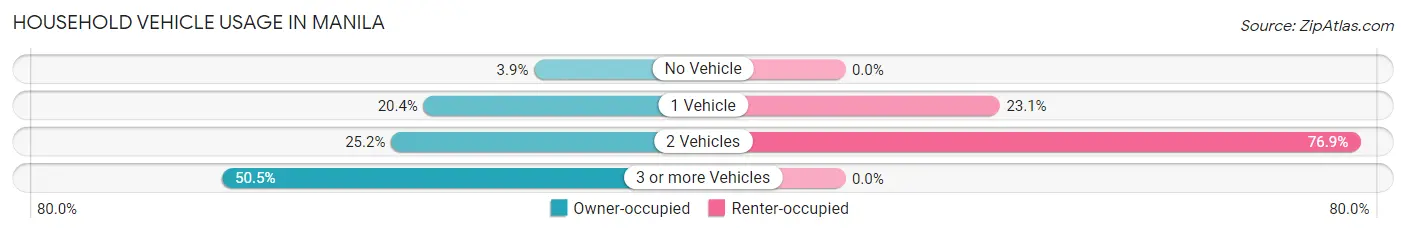
| Vehicles per Household | Owner-occupied | Renter-occupied |
| No Vehicle | 4 (3.9%) | 0 (0.0%) |
| 1 Vehicle | 21 (20.4%) | 3 (23.1%) |
| 2 Vehicles | 26 (25.2%) | 10 (76.9%) |
| 3 or more Vehicles | 52 (50.5%) | 0 (0.0%) |
| Total | 103 (100.0%) | 13 (100.0%) |
Real Estate & Mortgages in Manila
Real Estate and Mortgage Overview in Manila
| Characteristic | Without Mortgage | With Mortgage |
| Housing Units | 71 | 32 |
| Median Property Value | $191,900 | $362,500 |
| Median Household Income | $62,813 | $6 |
| Monthly Housing Costs | $468 | $0 |
| Real Estate Taxes | $955 | $4 |
Property Value by Mortgage Status in Manila
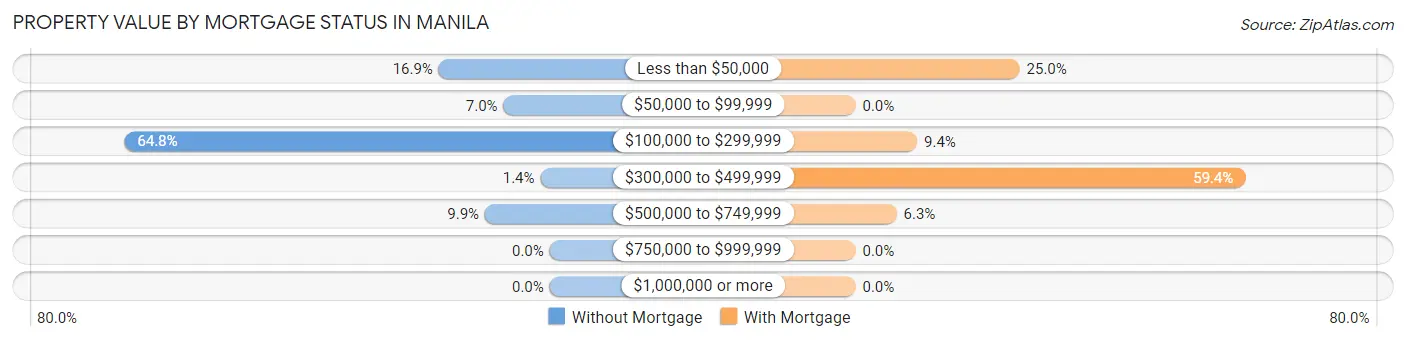
| Property Value | Without Mortgage | With Mortgage |
| Less than $50,000 | 12 (16.9%) | 8 (25.0%) |
| $50,000 to $99,999 | 5 (7.0%) | 0 (0.0%) |
| $100,000 to $299,999 | 46 (64.8%) | 3 (9.4%) |
| $300,000 to $499,999 | 1 (1.4%) | 19 (59.4%) |
| $500,000 to $749,999 | 7 (9.9%) | 2 (6.2%) |
| $750,000 to $999,999 | 0 (0.0%) | 0 (0.0%) |
| $1,000,000 or more | 0 (0.0%) | 0 (0.0%) |
| Total | 71 (100.0%) | 32 (100.0%) |
Household Income by Mortgage Status in Manila
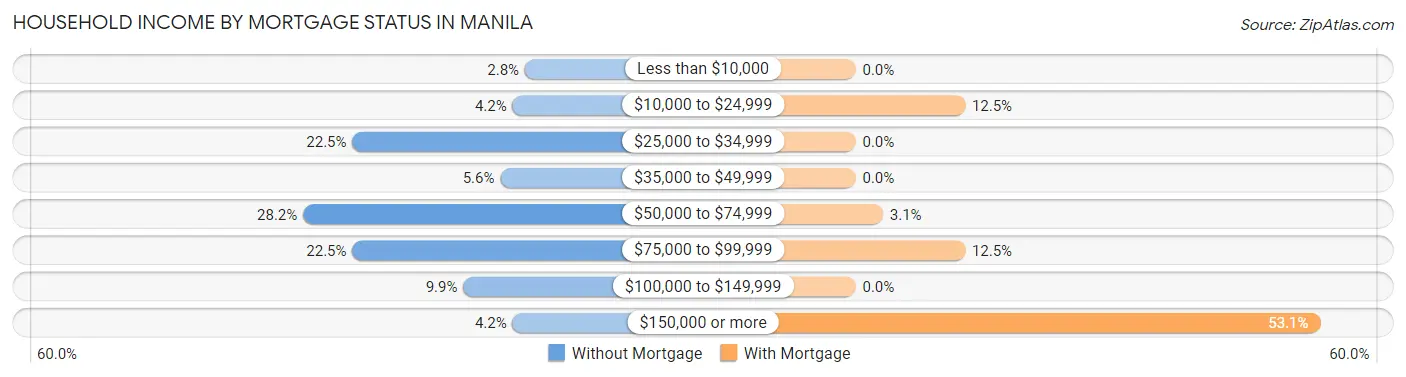
| Household Income | Without Mortgage | With Mortgage |
| Less than $10,000 | 2 (2.8%) | 0 (0.0%) |
| $10,000 to $24,999 | 3 (4.2%) | 4 (12.5%) |
| $25,000 to $34,999 | 16 (22.5%) | 0 (0.0%) |
| $35,000 to $49,999 | 4 (5.6%) | 0 (0.0%) |
| $50,000 to $74,999 | 20 (28.2%) | 1 (3.1%) |
| $75,000 to $99,999 | 16 (22.5%) | 4 (12.5%) |
| $100,000 to $149,999 | 7 (9.9%) | 0 (0.0%) |
| $150,000 or more | 3 (4.2%) | 17 (53.1%) |
| Total | 71 (100.0%) | 32 (100.0%) |
Property Value to Household Income Ratio in Manila
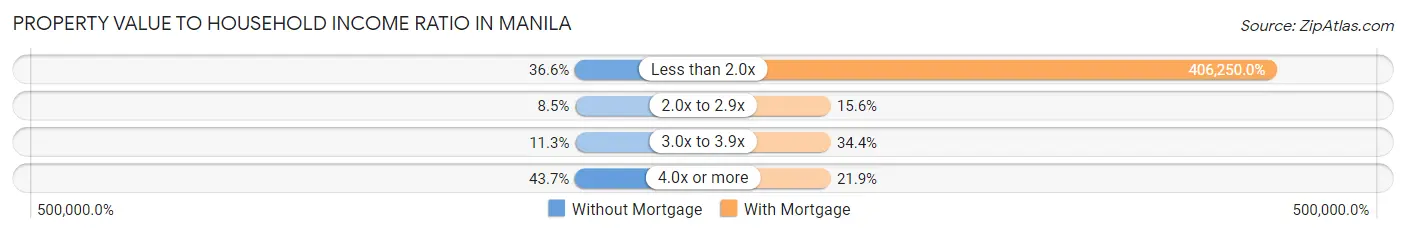
| Value-to-Income Ratio | Without Mortgage | With Mortgage |
| Less than 2.0x | 26 (36.6%) | 130,000 (406,250.0%) |
| 2.0x to 2.9x | 6 (8.5%) | 5 (15.6%) |
| 3.0x to 3.9x | 8 (11.3%) | 11 (34.4%) |
| 4.0x or more | 31 (43.7%) | 7 (21.9%) |
| Total | 71 (100.0%) | 32 (100.0%) |
Real Estate Taxes by Mortgage Status in Manila
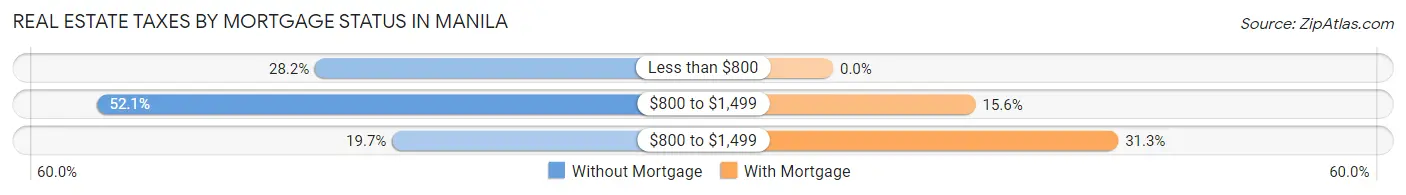
| Property Taxes | Without Mortgage | With Mortgage |
| Less than $800 | 20 (28.2%) | 0 (0.0%) |
| $800 to $1,499 | 37 (52.1%) | 5 (15.6%) |
| $800 to $1,499 | 14 (19.7%) | 10 (31.2%) |
| Total | 71 (100.0%) | 32 (100.0%) |
Health & Disability in Manila
Health Insurance Coverage by Age in Manila
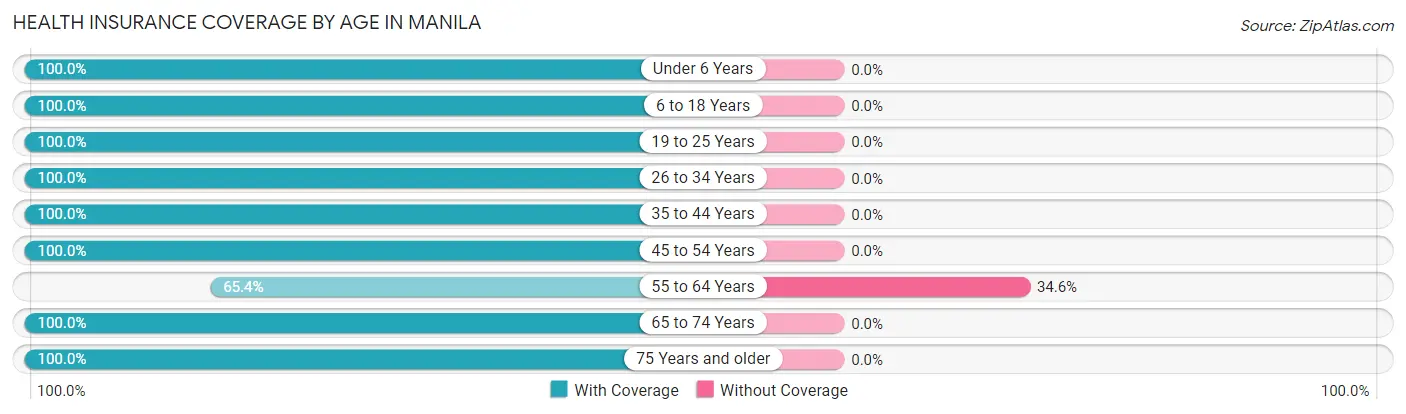
| Age Bracket | With Coverage | Without Coverage |
| Under 6 Years | 21 (100.0%) | 0 (0.0%) |
| 6 to 18 Years | 92 (100.0%) | 0 (0.0%) |
| 19 to 25 Years | 21 (100.0%) | 0 (0.0%) |
| 26 to 34 Years | 9 (100.0%) | 0 (0.0%) |
| 35 to 44 Years | 50 (100.0%) | 0 (0.0%) |
| 45 to 54 Years | 59 (100.0%) | 0 (0.0%) |
| 55 to 64 Years | 17 (65.4%) | 9 (34.6%) |
| 65 to 74 Years | 32 (100.0%) | 0 (0.0%) |
| 75 Years and older | 8 (100.0%) | 0 (0.0%) |
| Total | 309 (97.2%) | 9 (2.8%) |
Health Insurance Coverage by Citizenship Status in Manila
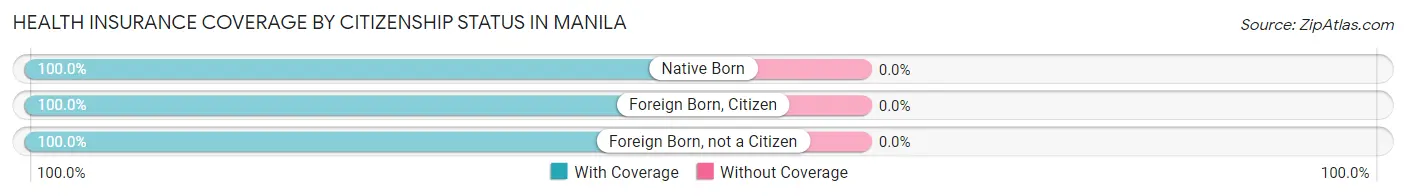
| Citizenship Status | With Coverage | Without Coverage |
| Native Born | 21 (100.0%) | 0 (0.0%) |
| Foreign Born, Citizen | 92 (100.0%) | 0 (0.0%) |
| Foreign Born, not a Citizen | 21 (100.0%) | 0 (0.0%) |
Health Insurance Coverage by Household Income in Manila
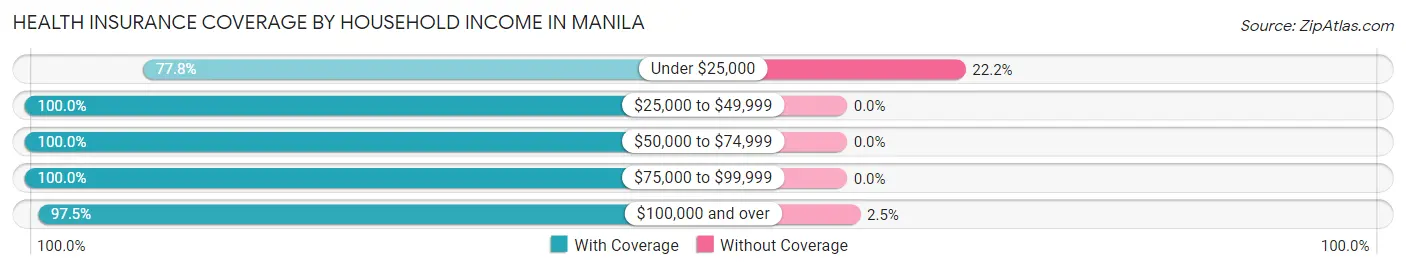
| Household Income | With Coverage | Without Coverage |
| Under $25,000 | 14 (77.8%) | 4 (22.2%) |
| $25,000 to $49,999 | 30 (100.0%) | 0 (0.0%) |
| $50,000 to $74,999 | 39 (100.0%) | 0 (0.0%) |
| $75,000 to $99,999 | 30 (100.0%) | 0 (0.0%) |
| $100,000 and over | 196 (97.5%) | 5 (2.5%) |
Public vs Private Health Insurance Coverage by Age in Manila
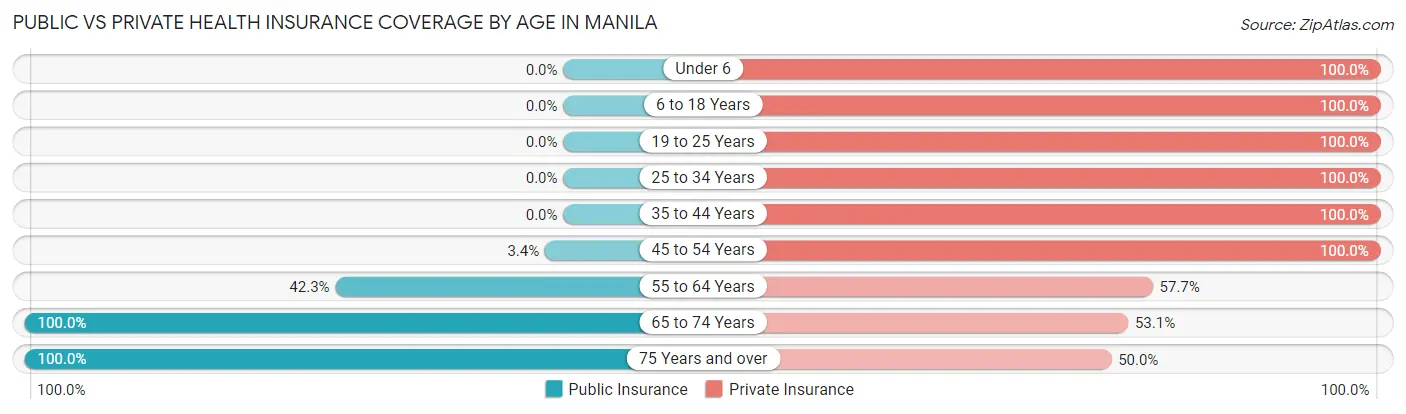
| Age Bracket | Public Insurance | Private Insurance |
| Under 6 | 0 (0.0%) | 21 (100.0%) |
| 6 to 18 Years | 0 (0.0%) | 92 (100.0%) |
| 19 to 25 Years | 0 (0.0%) | 21 (100.0%) |
| 25 to 34 Years | 0 (0.0%) | 9 (100.0%) |
| 35 to 44 Years | 0 (0.0%) | 50 (100.0%) |
| 45 to 54 Years | 2 (3.4%) | 59 (100.0%) |
| 55 to 64 Years | 11 (42.3%) | 15 (57.7%) |
| 65 to 74 Years | 32 (100.0%) | 17 (53.1%) |
| 75 Years and over | 8 (100.0%) | 4 (50.0%) |
| Total | 53 (16.7%) | 288 (90.6%) |
Disability Status by Sex by Age in Manila
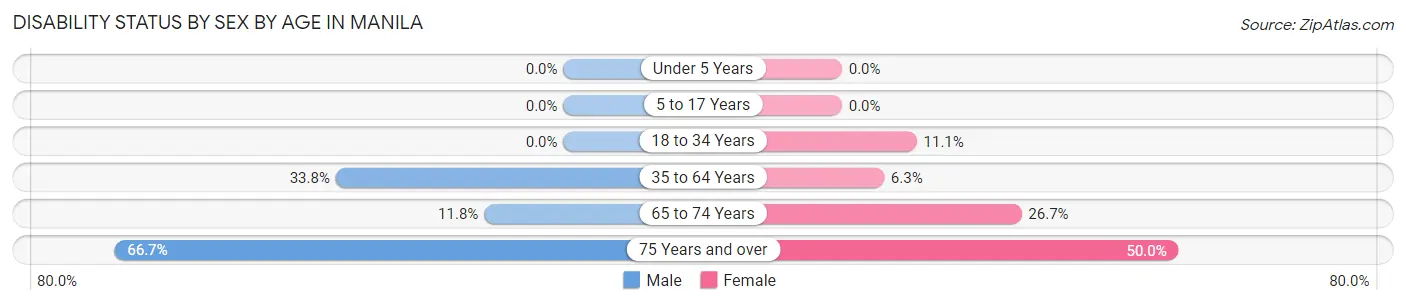
| Age Bracket | Male | Female |
| Under 5 Years | 0 (0.0%) | 0 (0.0%) |
| 5 to 17 Years | 0 (0.0%) | 0 (0.0%) |
| 18 to 34 Years | 0 (0.0%) | 2 (11.1%) |
| 35 to 64 Years | 24 (33.8%) | 4 (6.2%) |
| 65 to 74 Years | 2 (11.8%) | 4 (26.7%) |
| 75 Years and over | 4 (66.7%) | 1 (50.0%) |
Disability Class by Sex by Age in Manila
Disability Class: Hearing Difficulty
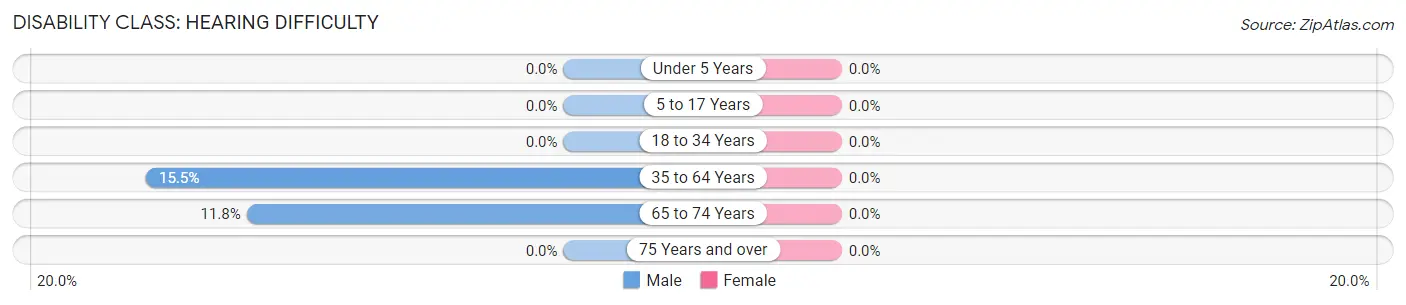
| Age Bracket | Male | Female |
| Under 5 Years | 0 (0.0%) | 0 (0.0%) |
| 5 to 17 Years | 0 (0.0%) | 0 (0.0%) |
| 18 to 34 Years | 0 (0.0%) | 0 (0.0%) |
| 35 to 64 Years | 11 (15.5%) | 0 (0.0%) |
| 65 to 74 Years | 2 (11.8%) | 0 (0.0%) |
| 75 Years and over | 0 (0.0%) | 0 (0.0%) |
Disability Class: Vision Difficulty
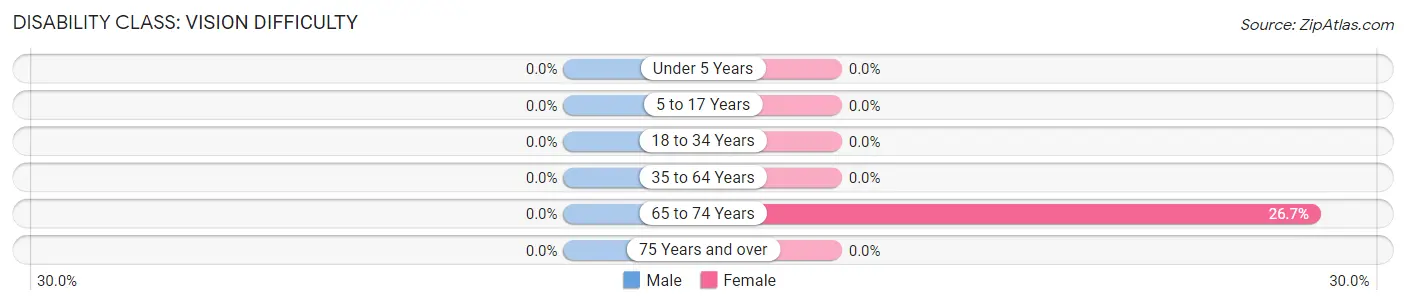
| Age Bracket | Male | Female |
| Under 5 Years | 0 (0.0%) | 0 (0.0%) |
| 5 to 17 Years | 0 (0.0%) | 0 (0.0%) |
| 18 to 34 Years | 0 (0.0%) | 0 (0.0%) |
| 35 to 64 Years | 0 (0.0%) | 0 (0.0%) |
| 65 to 74 Years | 0 (0.0%) | 4 (26.7%) |
| 75 Years and over | 0 (0.0%) | 0 (0.0%) |
Disability Class: Cognitive Difficulty
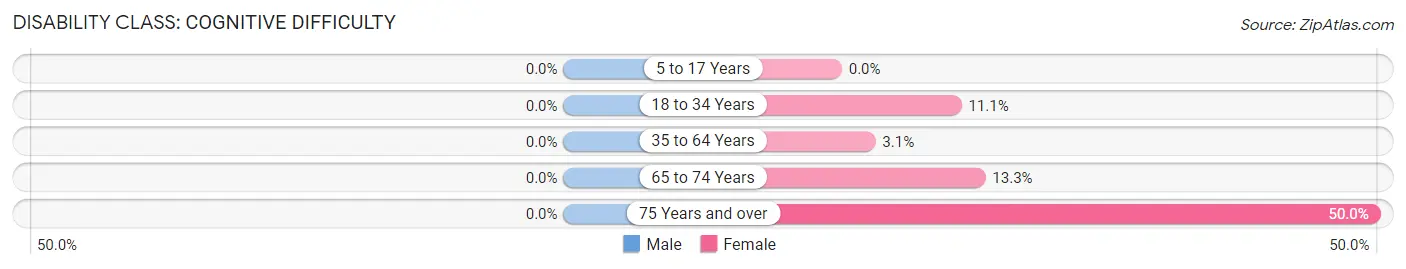
| Age Bracket | Male | Female |
| 5 to 17 Years | 0 (0.0%) | 0 (0.0%) |
| 18 to 34 Years | 0 (0.0%) | 2 (11.1%) |
| 35 to 64 Years | 0 (0.0%) | 2 (3.1%) |
| 65 to 74 Years | 0 (0.0%) | 2 (13.3%) |
| 75 Years and over | 0 (0.0%) | 1 (50.0%) |
Disability Class: Ambulatory Difficulty
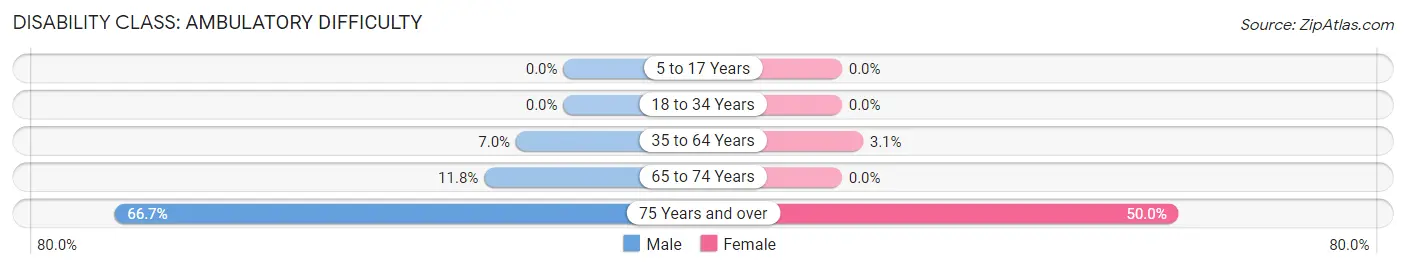
| Age Bracket | Male | Female |
| 5 to 17 Years | 0 (0.0%) | 0 (0.0%) |
| 18 to 34 Years | 0 (0.0%) | 0 (0.0%) |
| 35 to 64 Years | 5 (7.0%) | 2 (3.1%) |
| 65 to 74 Years | 2 (11.8%) | 0 (0.0%) |
| 75 Years and over | 4 (66.7%) | 1 (50.0%) |
Disability Class: Self-Care Difficulty
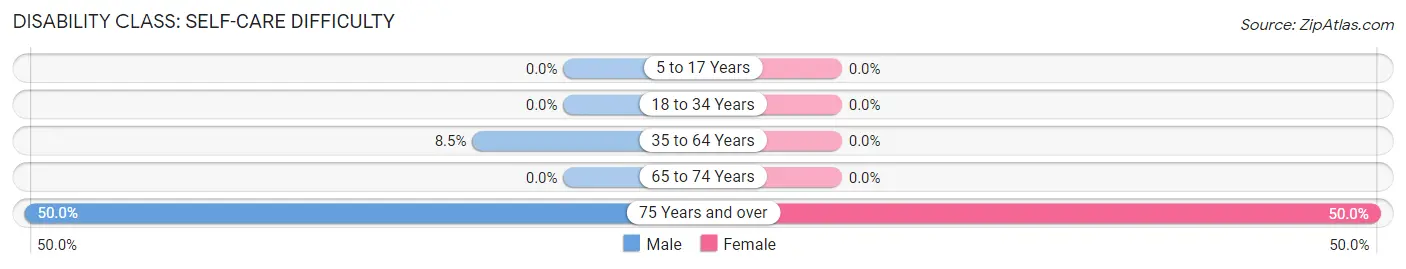
| Age Bracket | Male | Female |
| 5 to 17 Years | 0 (0.0%) | 0 (0.0%) |
| 18 to 34 Years | 0 (0.0%) | 0 (0.0%) |
| 35 to 64 Years | 6 (8.5%) | 0 (0.0%) |
| 65 to 74 Years | 0 (0.0%) | 0 (0.0%) |
| 75 Years and over | 3 (50.0%) | 1 (50.0%) |
Technology Access in Manila
Computing Device Access in Manila
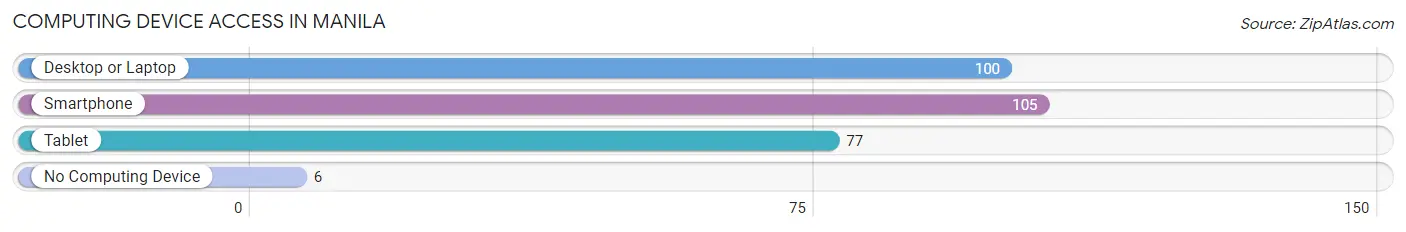
| Device Type | # Households | % Households |
| Desktop or Laptop | 100 | 86.2% |
| Smartphone | 105 | 90.5% |
| Tablet | 77 | 66.4% |
| No Computing Device | 6 | 5.2% |
| Total | 116 | 100.0% |
Internet Access in Manila
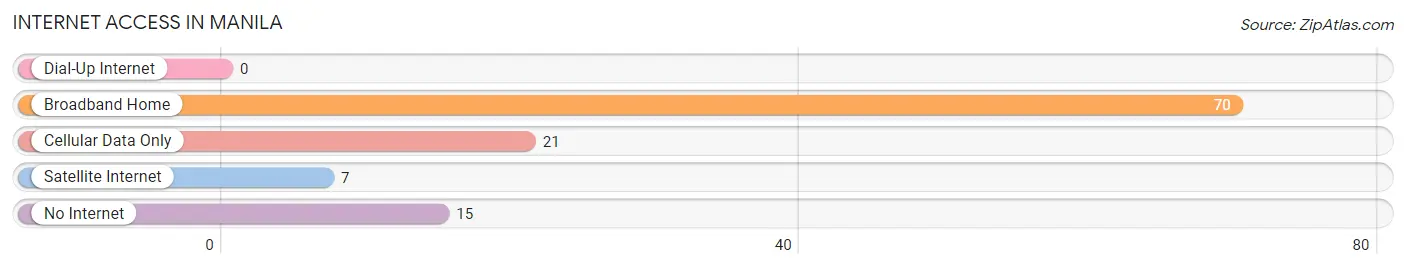
| Internet Type | # Households | % Households |
| Dial-Up Internet | 0 | 0.0% |
| Broadband Home | 70 | 60.3% |
| Cellular Data Only | 21 | 18.1% |
| Satellite Internet | 7 | 6.0% |
| No Internet | 15 | 12.9% |
| Total | 116 | 100.0% |
Manila Summary
Manila is a city located in Daggett County, Utah, United States. The population was 1,120 at the 2010 census. It is the county seat of Daggett County.
History
Manila was first settled in 1879 by a group of Mormon pioneers led by John W. Van Cott. The town was named after Manila, the capital of the Philippines, by Van Cott's son, who had served in the Spanish–American War.
The town was incorporated in 1909. In the early 20th century, Manila was a center of coal mining in the area. The coal mines were closed in the 1950s, and the town's economy shifted to ranching and tourism.
Geography
Manila is located at 40 45 25 North 109 45 25 West 40 756944 109 756944
According to the United States Census Bureau, the city has a total area of 0.9 square miles (2.3 km2), all of it land.
Economy
Manila's economy is largely based on ranching and tourism. The town is home to several guest ranches, which offer horseback riding, fishing, and other outdoor activities. The town is also a popular destination for hunters, who come to hunt deer, elk, and other game in the nearby mountains.
Demographics
As of the census of 2000, there were 1,072 people, 431 households, and 287 families residing in the city. The population density was 1,179.2 people per square mile (456.2/km2). There were 486 housing units at an average density of 535.2 per square mile (206.7/km2). The racial makeup of the city was 97.45% White, 0.09% African American, 0.09% Native American, 0.09% Asian, 0.09% Pacific Islander, 0.93% from other races, and 1.25% from two or more races. Hispanic or Latino of any race were 2.45% of the population.
There were 431 households, out of which 28.2% had children under the age of 18 living with them, 56.2% were married couples living together, 8.4% had a female householder with no husband present, and 32.2% were non-families. 28.2% of all households were made up of individuals, and 14.2% had someone living alone who was 65 years of age or older. The average household size was 2.48 and the average family size was 3.05.
In the city, the population was spread out, with 25.7% under the age of 18, 8.2% from 18 to 24, 24.2% from 25 to 44, 24.2% from 45 to 64, and 17.7% who were 65 years of age or older. The median age was 39 years. For every 100 females, there were 97.2 males. For every 100 females age 18 and over, there were 94.2 males.
The median income for a household in the city was $30,000, and the median income for a family was $35,000. Males had a median income of $30,000 versus $20,000 for females. The per capita income for the city was $14,845. About 8.2% of families and 11.2% of the population were below the poverty line, including 14.3% of those under age 18 and 8.2% of those age 65 or over.
Common Questions
What is Per Capita Income in Manila?
Per Capita income in Manila is $26,322.
What is the Median Family Income in Manila?
Median Family Income in Manila is $113,625.
What is the Median Household income in Manila?
Median Household Income in Manila is $77,813.
What is Inequality or Gini Index in Manila?
Inequality or Gini Index in Manila is 0.34.
What is the Total Population of Manila?
Total Population of Manila is 330.
What is the Total Male Population of Manila?
Total Male Population of Manila is 171.
What is the Total Female Population of Manila?
Total Female Population of Manila is 159.
What is the Ratio of Males per 100 Females in Manila?
There are 107.55 Males per 100 Females in Manila.
What is the Ratio of Females per 100 Males in Manila?
There are 92.98 Females per 100 Males in Manila.
What is the Median Population Age in Manila?
Median Population Age in Manila is 38.8 Years.
What is the Average Family Size in Manila
Average Family Size in Manila is 3.7 People.
What is the Average Household Size in Manila
Average Household Size in Manila is 2.8 People.
How Large is the Labor Force in Manila?
There are 158 People in the Labor Forcein in Manila.
What is the Percentage of People in the Labor Force in Manila?
69.6% of People are in the Labor Force in Manila.
What is the Unemployment Rate in Manila?
Unemployment Rate in Manila is 3.4%.