Elsinore, UT Map & Demographics
Elsinore Map
Elsinore Overview
$24,696
PER CAPITA INCOME
$62,917
AVG FAMILY INCOME
$53,929
AVG HOUSEHOLD INCOME
43.1%
WAGE / INCOME GAP [ % ]
56.9¢/ $1
WAGE / INCOME GAP [ $ ]
0.34
INEQUALITY / GINI INDEX
788
TOTAL POPULATION
323
MALE POPULATION
465
FEMALE POPULATION
69.46
MALES / 100 FEMALES
143.96
FEMALES / 100 MALES
50.4
MEDIAN AGE
2.9
AVG FAMILY SIZE
2.6
AVG HOUSEHOLD SIZE
281
LABOR FORCE [ PEOPLE ]
46.2%
PERCENT IN LABOR FORCE
10.6%
UNEMPLOYMENT RATE
Elsinore Zip Codes
Elsinore Area Codes
Income in Elsinore
Income Overview in Elsinore
Per Capita Income in Elsinore is $24,696, while median incomes of families and households are $62,917 and $53,929 respectively.
| Characteristic | Number | Measure |
| Per Capita Income | 788 | $24,696 |
| Median Family Income | 236 | $62,917 |
| Mean Family Income | 236 | $70,701 |
| Median Household Income | 308 | $53,929 |
| Mean Household Income | 308 | $64,427 |
| Income Deficit | 236 | $0 |
| Wage / Income Gap (%) | 788 | 43.12% |
| Wage / Income Gap ($) | 788 | 56.88¢ per $1 |
| Gini / Inequality Index | 788 | 0.34 |
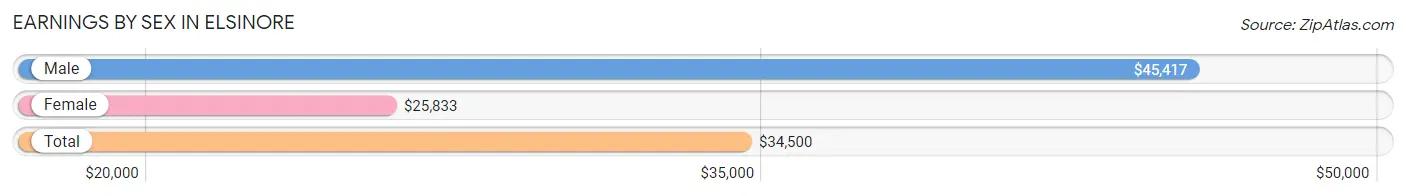
Earnings by Sex in Elsinore
Average Earnings in Elsinore are $34,500, $45,417 for men and $25,833 for women, a difference of 43.1%.
| Sex | Number | Average Earnings |
| Male | 128 (47.1%) | $45,417 |
| Female | 144 (52.9%) | $25,833 |
| Total | 272 (100.0%) | $34,500 |
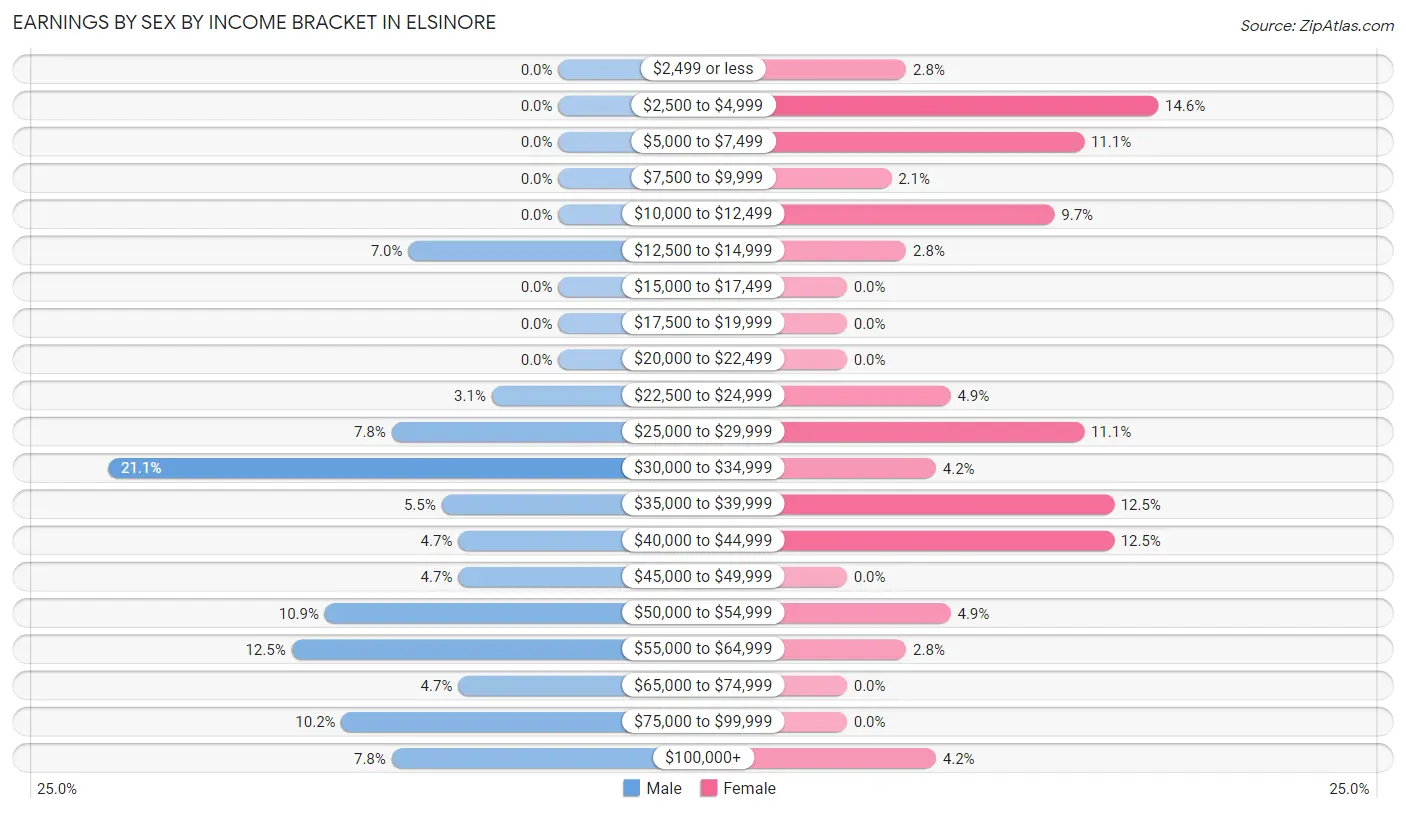
Earnings by Sex by Income Bracket in Elsinore
The most common earnings brackets in Elsinore are $30,000 to $34,999 for men (27 | 21.1%) and $2,500 to $4,999 for women (21 | 14.6%).
| Income | Male | Female |
| $2,499 or less | 0 (0.0%) | 4 (2.8%) |
| $2,500 to $4,999 | 0 (0.0%) | 21 (14.6%) |
| $5,000 to $7,499 | 0 (0.0%) | 16 (11.1%) |
| $7,500 to $9,999 | 0 (0.0%) | 3 (2.1%) |
| $10,000 to $12,499 | 0 (0.0%) | 14 (9.7%) |
| $12,500 to $14,999 | 9 (7.0%) | 4 (2.8%) |
| $15,000 to $17,499 | 0 (0.0%) | 0 (0.0%) |
| $17,500 to $19,999 | 0 (0.0%) | 0 (0.0%) |
| $20,000 to $22,499 | 0 (0.0%) | 0 (0.0%) |
| $22,500 to $24,999 | 4 (3.1%) | 7 (4.9%) |
| $25,000 to $29,999 | 10 (7.8%) | 16 (11.1%) |
| $30,000 to $34,999 | 27 (21.1%) | 6 (4.2%) |
| $35,000 to $39,999 | 7 (5.5%) | 18 (12.5%) |
| $40,000 to $44,999 | 6 (4.7%) | 18 (12.5%) |
| $45,000 to $49,999 | 6 (4.7%) | 0 (0.0%) |
| $50,000 to $54,999 | 14 (10.9%) | 7 (4.9%) |
| $55,000 to $64,999 | 16 (12.5%) | 4 (2.8%) |
| $65,000 to $74,999 | 6 (4.7%) | 0 (0.0%) |
| $75,000 to $99,999 | 13 (10.2%) | 0 (0.0%) |
| $100,000+ | 10 (7.8%) | 6 (4.2%) |
| Total | 128 (100.0%) | 144 (100.0%) |
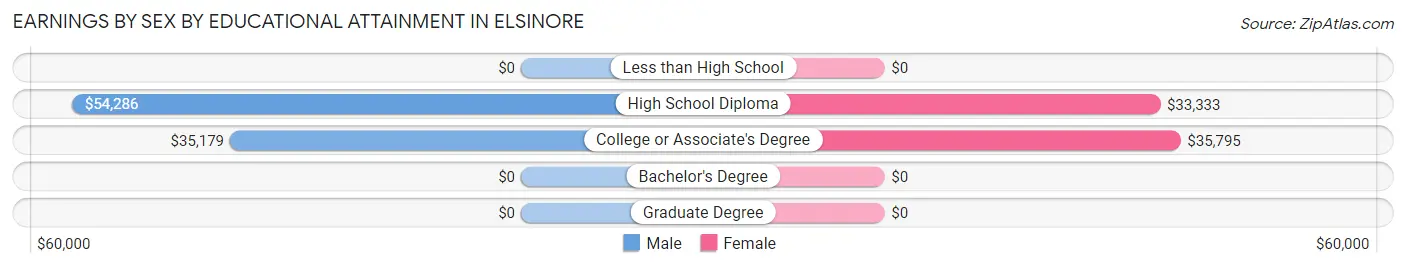
Earnings by Sex by Educational Attainment in Elsinore
Average earnings in Elsinore are $52,589 for men and $29,464 for women, a difference of 44.0%. Men with an educational attainment of high school diploma enjoy the highest average annual earnings of $54,286, while those with college or associate's degree education earn the least with $35,179. Women with an educational attainment of college or associate's degree earn the most with the average annual earnings of $35,795, while those with high school diploma education have the smallest earnings of $33,333.
| Educational Attainment | Male Income | Female Income |
| Less than High School | - | - |
| High School Diploma | $54,286 | $33,333 |
| College or Associate's Degree | $35,179 | $35,795 |
| Bachelor's Degree | - | - |
| Graduate Degree | - | - |
| Total | $52,589 | $29,464 |
Family Income in Elsinore
Family Income Brackets in Elsinore
According to the Elsinore family income data, there are 59 families falling into the $35,000 to $49,999 income range, which is the most common income bracket and makes up 25.0% of all families.
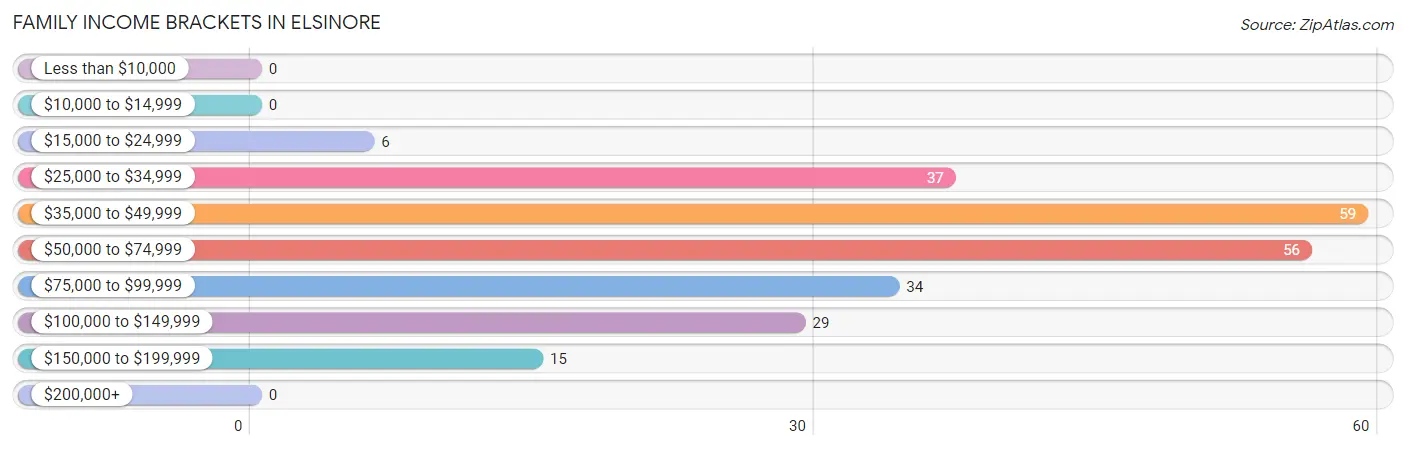
| Income Bracket | # Families | % Families |
| Less than $10,000 | 0 | 0.0% |
| $10,000 to $14,999 | 0 | 0.0% |
| $15,000 to $24,999 | 6 | 2.5% |
| $25,000 to $34,999 | 37 | 15.7% |
| $35,000 to $49,999 | 59 | 25.0% |
| $50,000 to $74,999 | 56 | 23.7% |
| $75,000 to $99,999 | 34 | 14.4% |
| $100,000 to $149,999 | 29 | 12.3% |
| $150,000 to $199,999 | 15 | 6.4% |
| $200,000+ | 0 | 0.0% |
Family Income by Famaliy Size in Elsinore
4-person families (30 | 12.7%) account for the highest median family income in Elsinore with $82,857 per family, while 2-person families (167 | 70.8%) have the highest median income of $22,009 per family member.
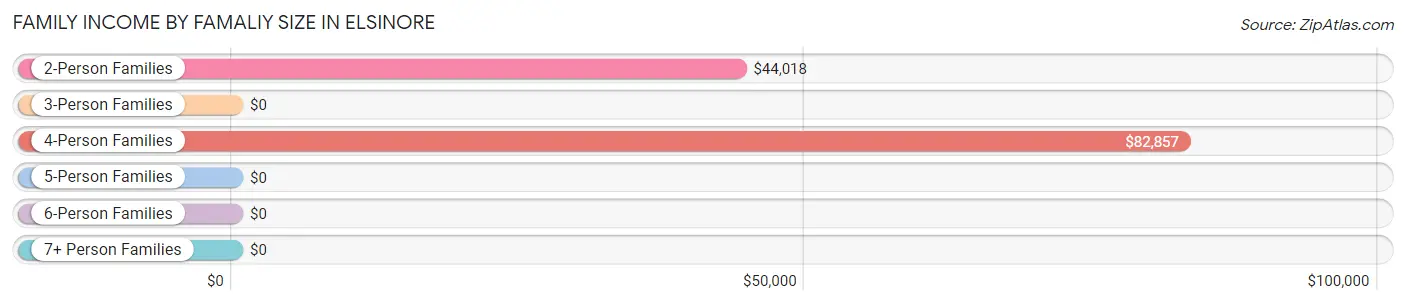
| Income Bracket | # Families | Median Income |
| 2-Person Families | 167 (70.8%) | $44,018 |
| 3-Person Families | 9 (3.8%) | $0 |
| 4-Person Families | 30 (12.7%) | $82,857 |
| 5-Person Families | 11 (4.7%) | $0 |
| 6-Person Families | 6 (2.5%) | $0 |
| 7+ Person Families | 13 (5.5%) | $0 |
| Total | 236 (100.0%) | $62,917 |
Family Income by Number of Earners in Elsinore
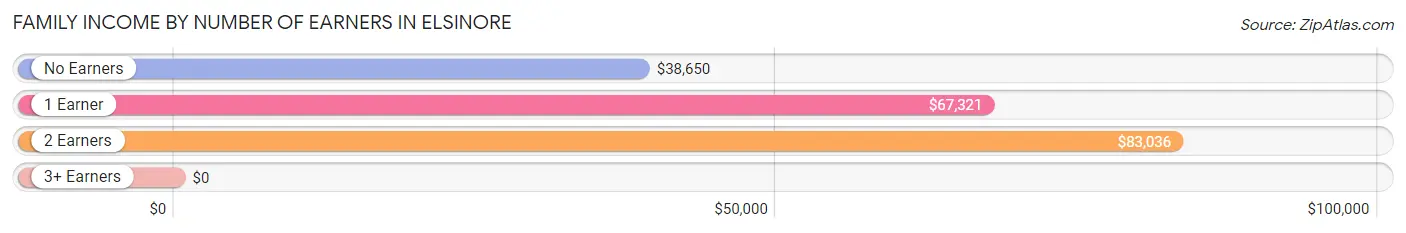
| Number of Earners | # Families | Median Income |
| No Earners | 101 (42.8%) | $38,650 |
| 1 Earner | 69 (29.2%) | $67,321 |
| 2 Earners | 51 (21.6%) | $83,036 |
| 3+ Earners | 15 (6.4%) | $0 |
| Total | 236 (100.0%) | $62,917 |
Household Income in Elsinore
Household Income Brackets in Elsinore
With 70 households falling in the category, the $35,000 to $49,999 income range is the most frequent in Elsinore, accounting for 22.7% of all households.
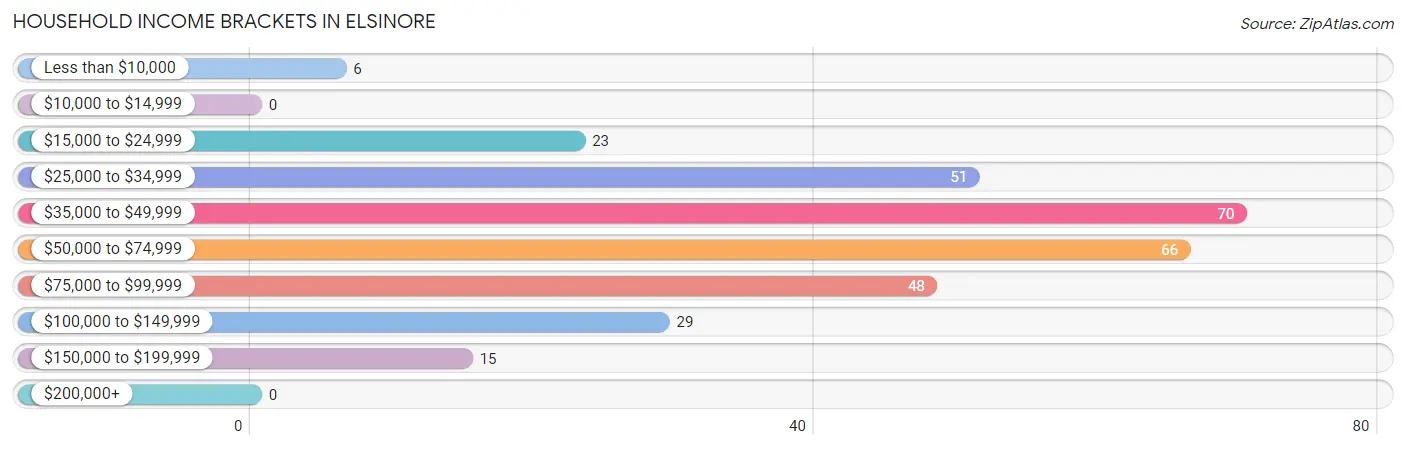
| Income Bracket | # Households | % Households |
| Less than $10,000 | 6 | 1.9% |
| $10,000 to $14,999 | 0 | 0.0% |
| $15,000 to $24,999 | 23 | 7.5% |
| $25,000 to $34,999 | 51 | 16.6% |
| $35,000 to $49,999 | 70 | 22.7% |
| $50,000 to $74,999 | 66 | 21.4% |
| $75,000 to $99,999 | 48 | 15.6% |
| $100,000 to $149,999 | 29 | 9.4% |
| $150,000 to $199,999 | 15 | 4.9% |
| $200,000+ | 0 | 0.0% |
Household Income by Householder Age in Elsinore
The median household income in Elsinore is $53,929, with the highest median household income of $81,250 found in the 25 to 44 years age bracket for the primary householder. A total of 56 households (18.2%) fall into this category. Meanwhile, the 15 to 24 years age bracket for the primary householder has the lowest median household income of $0, with 9 households (2.9%) in this group.
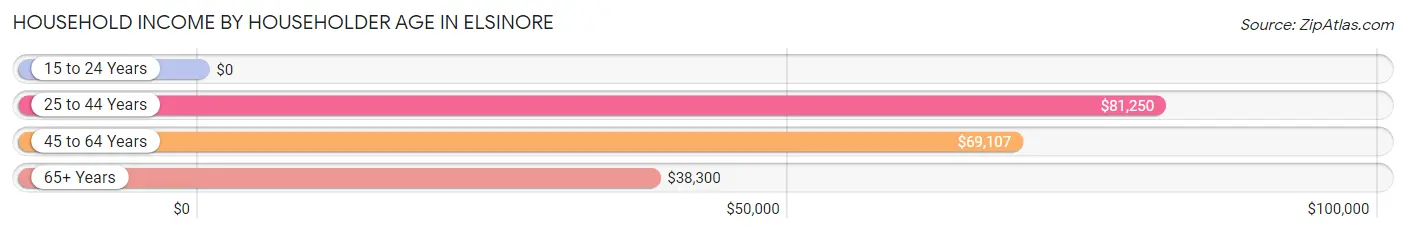
| Income Bracket | # Households | Median Income |
| 15 to 24 Years | 9 (2.9%) | $0 |
| 25 to 44 Years | 56 (18.2%) | $81,250 |
| 45 to 64 Years | 89 (28.9%) | $69,107 |
| 65+ Years | 154 (50.0%) | $38,300 |
| Total | 308 (100.0%) | $53,929 |
Poverty in Elsinore
Income Below Poverty by Sex and Age in Elsinore
With 6.9% poverty level for males and 12.6% for females among the residents of Elsinore, under 5 year old males and 12 to 14 year old females are the most vulnerable to poverty, with 9 males (100.0%) and 16 females (69.6%) in their respective age groups living below the poverty level.
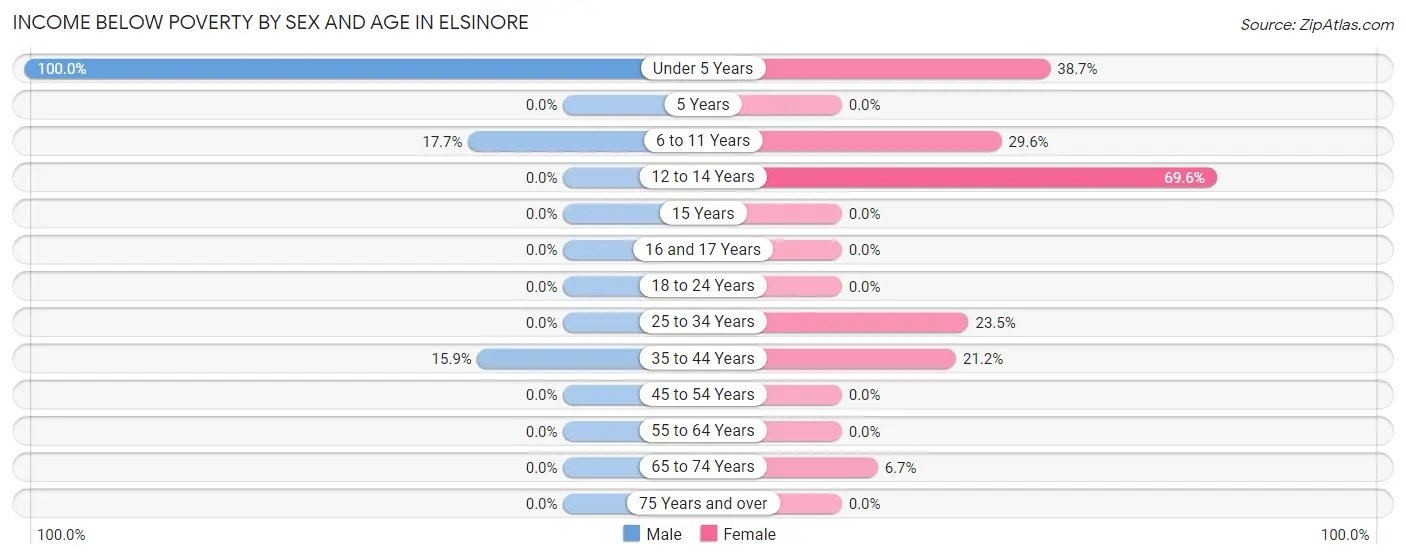
| Age Bracket | Male | Female |
| Under 5 Years | 9 (100.0%) | 12 (38.7%) |
| 5 Years | 0 (0.0%) | 0 (0.0%) |
| 6 to 11 Years | 6 (17.6%) | 8 (29.6%) |
| 12 to 14 Years | 0 (0.0%) | 16 (69.6%) |
| 15 Years | 0 (0.0%) | 0 (0.0%) |
| 16 and 17 Years | 0 (0.0%) | 0 (0.0%) |
| 18 to 24 Years | 0 (0.0%) | 0 (0.0%) |
| 25 to 34 Years | 0 (0.0%) | 8 (23.5%) |
| 35 to 44 Years | 7 (15.9%) | 7 (21.2%) |
| 45 to 54 Years | 0 (0.0%) | 0 (0.0%) |
| 55 to 64 Years | 0 (0.0%) | 0 (0.0%) |
| 65 to 74 Years | 0 (0.0%) | 6 (6.7%) |
| 75 Years and over | 0 (0.0%) | 0 (0.0%) |
| Total | 22 (6.9%) | 57 (12.6%) |
Income Above Poverty by Sex and Age in Elsinore
According to the poverty statistics in Elsinore, males aged 12 to 14 years and females aged 5 years are the age groups that are most secure financially, with 100.0% of males and 100.0% of females in these age groups living above the poverty line.
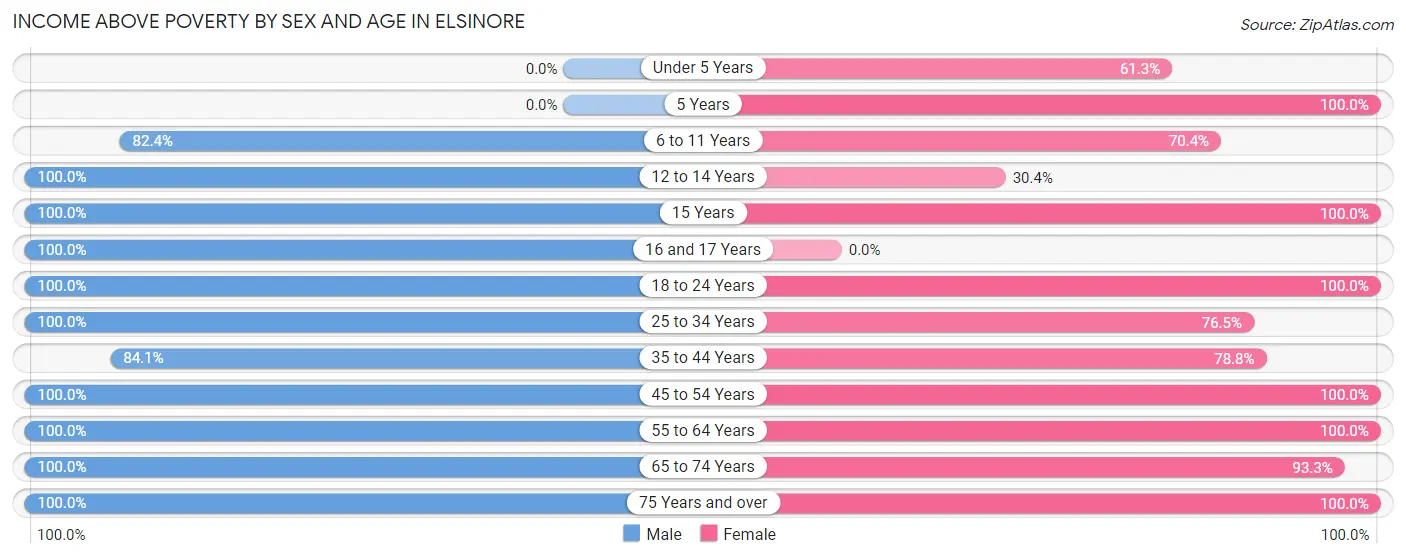
| Age Bracket | Male | Female |
| Under 5 Years | 0 (0.0%) | 19 (61.3%) |
| 5 Years | 0 (0.0%) | 7 (100.0%) |
| 6 to 11 Years | 28 (82.4%) | 19 (70.4%) |
| 12 to 14 Years | 5 (100.0%) | 7 (30.4%) |
| 15 Years | 11 (100.0%) | 17 (100.0%) |
| 16 and 17 Years | 3 (100.0%) | 0 (0.0%) |
| 18 to 24 Years | 11 (100.0%) | 23 (100.0%) |
| 25 to 34 Years | 24 (100.0%) | 26 (76.5%) |
| 35 to 44 Years | 37 (84.1%) | 26 (78.8%) |
| 45 to 54 Years | 56 (100.0%) | 29 (100.0%) |
| 55 to 64 Years | 34 (100.0%) | 54 (100.0%) |
| 65 to 74 Years | 42 (100.0%) | 84 (93.3%) |
| 75 Years and over | 45 (100.0%) | 86 (100.0%) |
| Total | 296 (93.1%) | 397 (87.4%) |
Income Below Poverty Among Married-Couple Families in Elsinore
The poverty statistics for married-couple families in Elsinore show that 3.6% or 7 of the total 194 families live below the poverty line. Families with 5 or more children have the highest poverty rate of 100.0%, comprising of 7 families. On the other hand, families with no children have the lowest poverty rate of 0.0%, which includes 0 families.
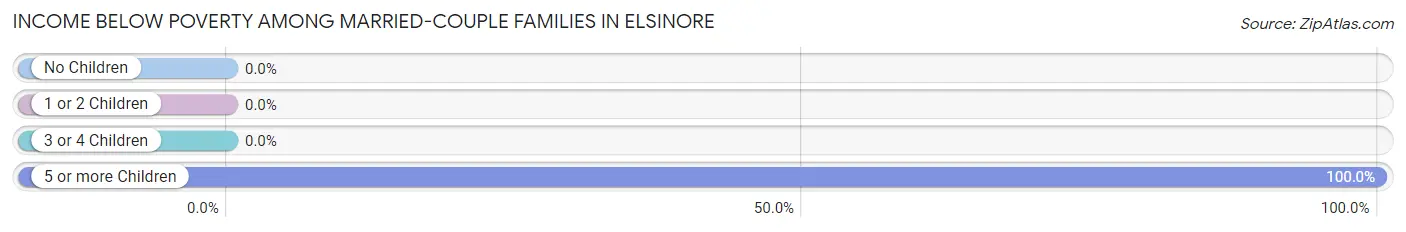
| Children | Above Poverty | Below Poverty |
| No Children | 125 (100.0%) | 0 (0.0%) |
| 1 or 2 Children | 44 (100.0%) | 0 (0.0%) |
| 3 or 4 Children | 18 (100.0%) | 0 (0.0%) |
| 5 or more Children | 0 (0.0%) | 7 (100.0%) |
| Total | 187 (96.4%) | 7 (3.6%) |
Income Below Poverty Among Single-Parent Households in Elsinore
| Children | Single Father | Single Mother |
| No Children | 0 (0.0%) | 0 (0.0%) |
| 1 or 2 Children | 0 (0.0%) | 0 (0.0%) |
| 3 or 4 Children | 0 (0.0%) | 0 (0.0%) |
| 5 or more Children | 0 (0.0%) | 0 (0.0%) |
| Total | 0 (0.0%) | 0 (0.0%) |
Income Below Poverty Among Married-Couple vs Single-Parent Households in Elsinore
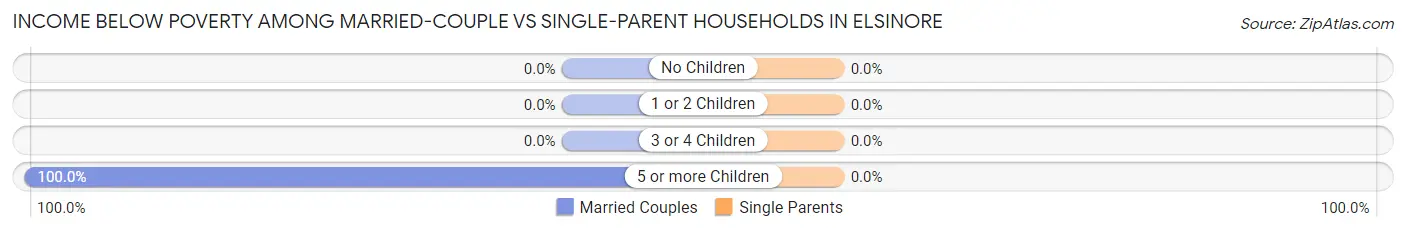
| Children | Married-Couple Families | Single-Parent Households |
| No Children | 0 (0.0%) | 0 (0.0%) |
| 1 or 2 Children | 0 (0.0%) | 0 (0.0%) |
| 3 or 4 Children | 0 (0.0%) | 0 (0.0%) |
| 5 or more Children | 7 (100.0%) | 0 (0.0%) |
| Total | 7 (3.6%) | 0 (0.0%) |
Race in Elsinore
The most populous races in Elsinore are White / Caucasian (650 | 82.5%), Hispanic or Latino (83 | 10.5%), and Some other Race (55 | 7.0%).
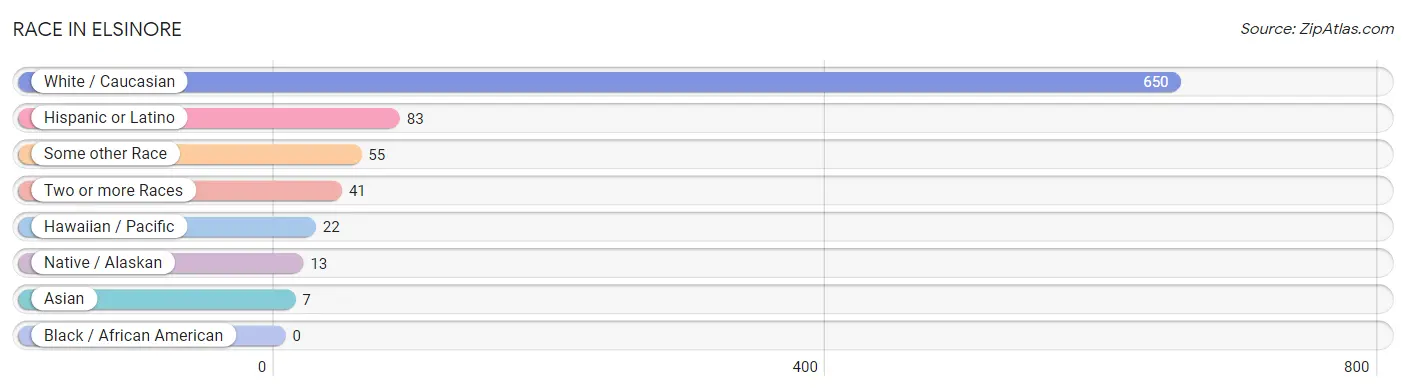
| Race | # Population | % Population |
| Asian | 7 | 0.9% |
| Black / African American | 0 | 0.0% |
| Hawaiian / Pacific | 22 | 2.8% |
| Hispanic or Latino | 83 | 10.5% |
| Native / Alaskan | 13 | 1.7% |
| White / Caucasian | 650 | 82.5% |
| Two or more Races | 41 | 5.2% |
| Some other Race | 55 | 7.0% |
| Total | 788 | 100.0% |
Ancestry in Elsinore
The most populous ancestries reported in Elsinore are English (247 | 31.4%), Danish (160 | 20.3%), German (110 | 14.0%), Irish (72 | 9.1%), and Mexican (62 | 7.9%), together accounting for 82.6% of all Elsinore residents.
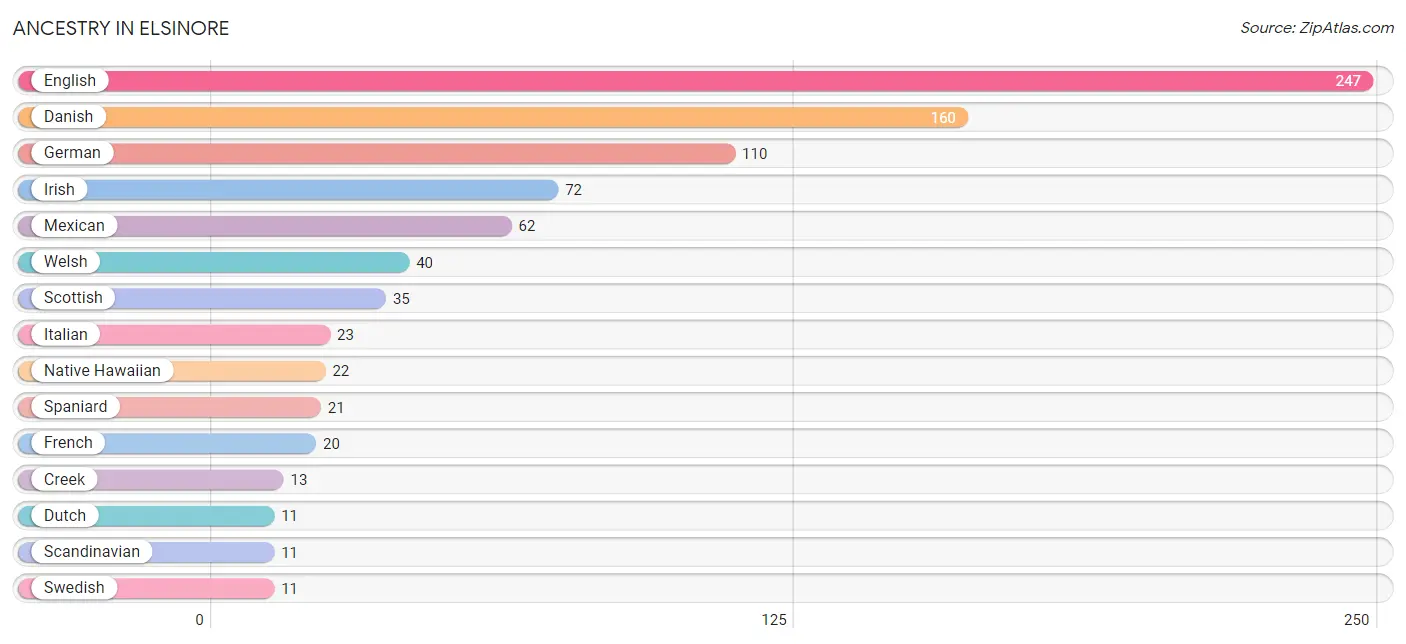
| Ancestry | # Population | % Population |
| British | 9 | 1.1% |
| Burmese | 7 | 0.9% |
| Creek | 13 | 1.7% |
| Danish | 160 | 20.3% |
| Dutch | 11 | 1.4% |
| English | 247 | 31.4% |
| French | 20 | 2.5% |
| German | 110 | 14.0% |
| Irish | 72 | 9.1% |
| Italian | 23 | 2.9% |
| Mexican | 62 | 7.9% |
| Native Hawaiian | 22 | 2.8% |
| Norwegian | 7 | 0.9% |
| Scandinavian | 11 | 1.4% |
| Scottish | 35 | 4.4% |
| Spaniard | 21 | 2.7% |
| Swedish | 11 | 1.4% |
| Tongan | 6 | 0.8% |
| Welsh | 40 | 5.1% | View All 19 Rows |
Immigrants in Elsinore
The most numerous immigrant groups reported in Elsinore came from Central America (26 | 3.3%), Latin America (26 | 3.3%), Mexico (26 | 3.3%), Asia (7 | 0.9%), and Eastern Asia (7 | 0.9%), together accounting for 11.7% of all Elsinore residents.
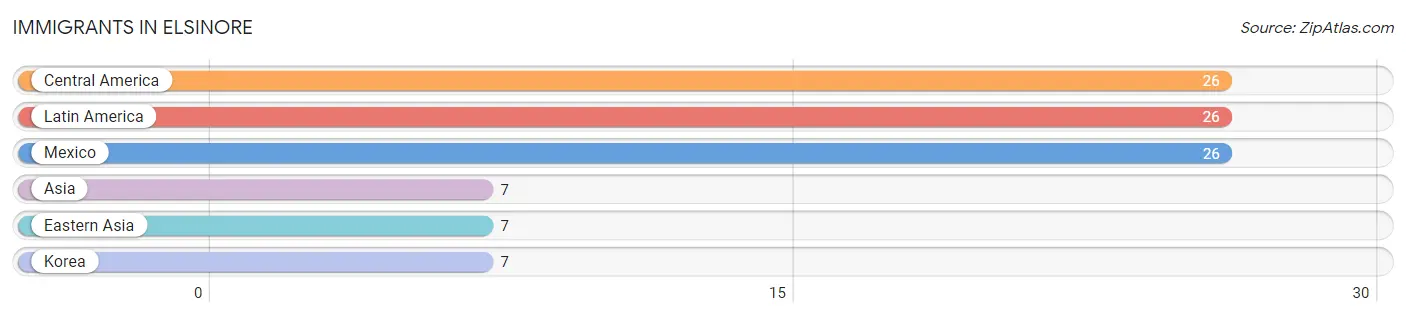
| Immigration Origin | # Population | % Population |
| Asia | 7 | 0.9% |
| Central America | 26 | 3.3% |
| Eastern Asia | 7 | 0.9% |
| Korea | 7 | 0.9% |
| Latin America | 26 | 3.3% |
| Mexico | 26 | 3.3% | View All 6 Rows |
Sex and Age in Elsinore
Sex and Age in Elsinore
The most populous age groups in Elsinore are 35 to 39 Years (44 | 13.6%) for men and 75 to 79 Years (72 | 15.5%) for women.
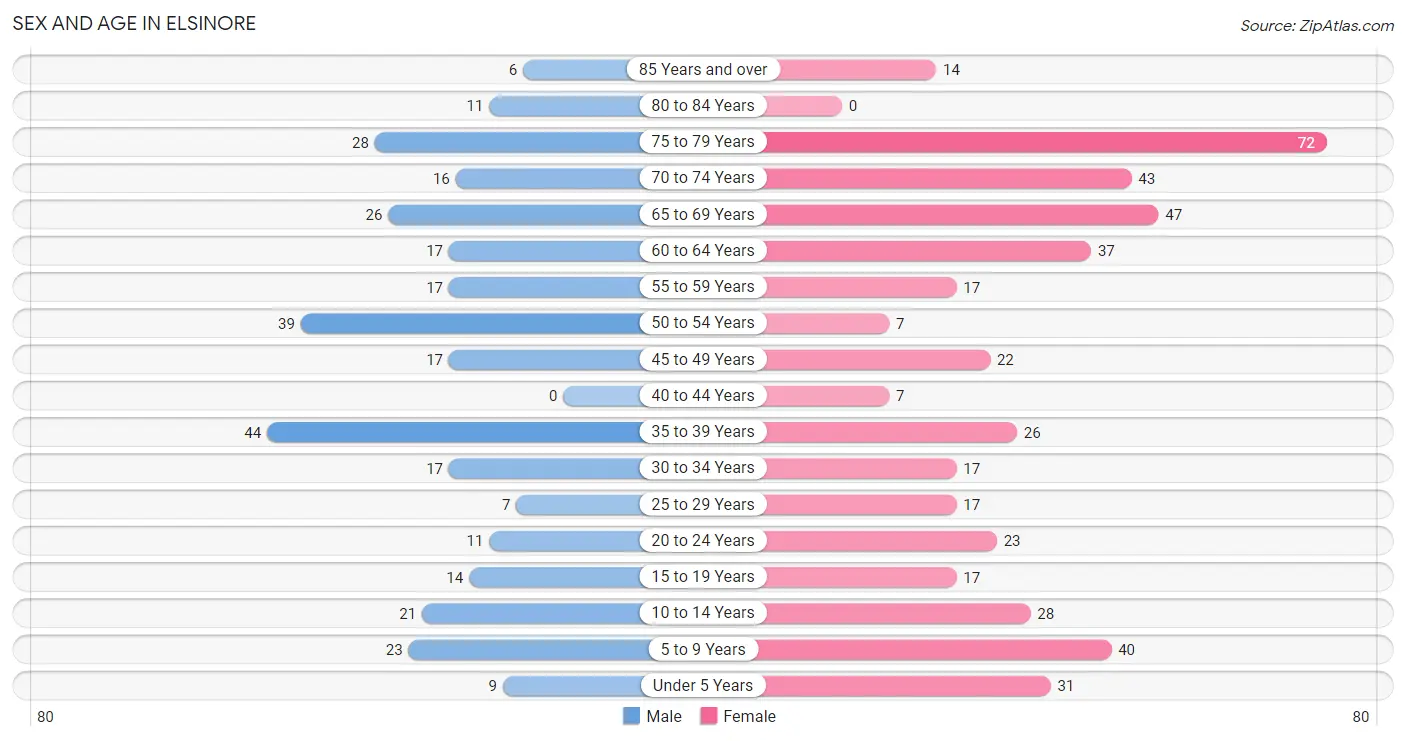
| Age Bracket | Male | Female |
| Under 5 Years | 9 (2.8%) | 31 (6.7%) |
| 5 to 9 Years | 23 (7.1%) | 40 (8.6%) |
| 10 to 14 Years | 21 (6.5%) | 28 (6.0%) |
| 15 to 19 Years | 14 (4.3%) | 17 (3.7%) |
| 20 to 24 Years | 11 (3.4%) | 23 (5.0%) |
| 25 to 29 Years | 7 (2.2%) | 17 (3.7%) |
| 30 to 34 Years | 17 (5.3%) | 17 (3.7%) |
| 35 to 39 Years | 44 (13.6%) | 26 (5.6%) |
| 40 to 44 Years | 0 (0.0%) | 7 (1.5%) |
| 45 to 49 Years | 17 (5.3%) | 22 (4.7%) |
| 50 to 54 Years | 39 (12.1%) | 7 (1.5%) |
| 55 to 59 Years | 17 (5.3%) | 17 (3.7%) |
| 60 to 64 Years | 17 (5.3%) | 37 (8.0%) |
| 65 to 69 Years | 26 (8.1%) | 47 (10.1%) |
| 70 to 74 Years | 16 (5.0%) | 43 (9.2%) |
| 75 to 79 Years | 28 (8.7%) | 72 (15.5%) |
| 80 to 84 Years | 11 (3.4%) | 0 (0.0%) |
| 85 Years and over | 6 (1.9%) | 14 (3.0%) |
| Total | 323 (100.0%) | 465 (100.0%) |
Families and Households in Elsinore
Median Family Size in Elsinore
The median family size in Elsinore is 2.88 persons per family, with married-couple families (194 | 82.2%) accounting for the largest median family size of 3.04 persons per family. On the other hand, single male/father families (7 | 3.0%) represent the smallest median family size with 1.71 persons per family.
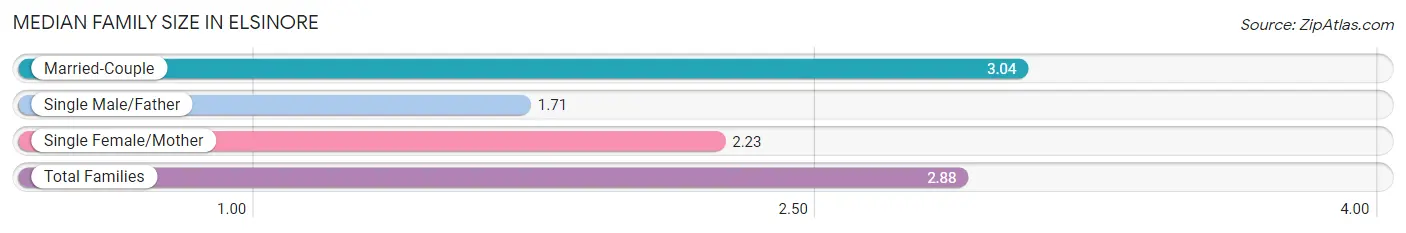
| Family Type | # Families | Family Size |
| Married-Couple | 194 (82.2%) | 3.04 |
| Single Male/Father | 7 (3.0%) | 1.71 |
| Single Female/Mother | 35 (14.8%) | 2.23 |
| Total Families | 236 (100.0%) | 2.88 |
Median Household Size in Elsinore
The median household size in Elsinore is 2.56 persons per household, with married-couple households (194 | 63.0%) accounting for the largest median household size of 3.08 persons per household. non-family households (72 | 23.4%) represent the smallest median household size with 1.40 persons per household.
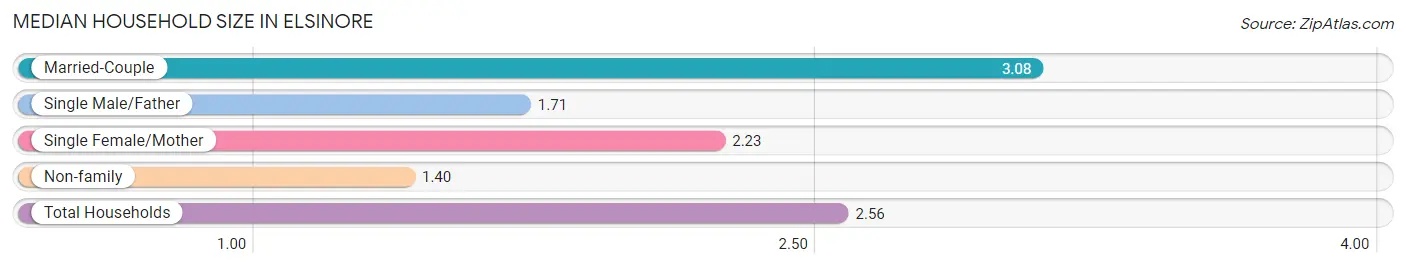
| Household Type | # Households | Household Size |
| Married-Couple | 194 (63.0%) | 3.08 |
| Single Male/Father | 7 (2.3%) | 1.71 |
| Single Female/Mother | 35 (11.4%) | 2.23 |
| Non-family | 72 (23.4%) | 1.40 |
| Total Households | 308 (100.0%) | 2.56 |
Household Size by Marriage Status in Elsinore
Out of a total of 308 households in Elsinore, 236 (76.6%) are family households, while 72 (23.4%) are nonfamily households. The most numerous type of family households are 2-person households, comprising 167, and the most common type of nonfamily households are 1-person households, comprising 58.
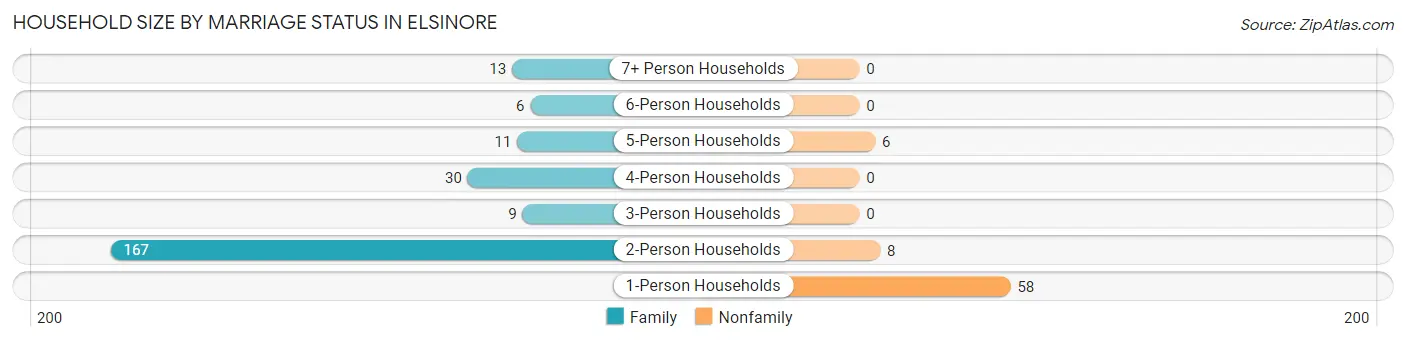
| Household Size | Family Households | Nonfamily Households |
| 1-Person Households | - | 58 (18.8%) |
| 2-Person Households | 167 (54.2%) | 8 (2.6%) |
| 3-Person Households | 9 (2.9%) | 0 (0.0%) |
| 4-Person Households | 30 (9.7%) | 0 (0.0%) |
| 5-Person Households | 11 (3.6%) | 6 (1.9%) |
| 6-Person Households | 6 (1.9%) | 0 (0.0%) |
| 7+ Person Households | 13 (4.2%) | 0 (0.0%) |
| Total | 236 (76.6%) | 72 (23.4%) |
Female Fertility in Elsinore
Fertility by Age in Elsinore
Average fertility rate in Elsinore is 118.0 births per 1,000 women. Women in the age bracket of 20 to 34 years have the highest fertility rate with 158.0 births per 1,000 women. Women in the age bracket of 20 to 34 years acount for 56.2% of all women with births.
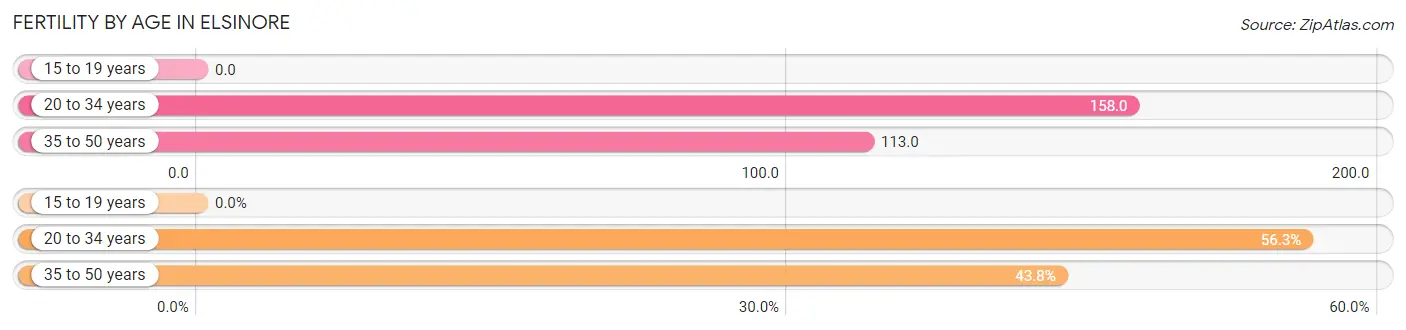
| Age Bracket | Women with Births | Births / 1,000 Women |
| 15 to 19 years | 0 (0.0%) | 0.0 |
| 20 to 34 years | 9 (56.2%) | 158.0 |
| 35 to 50 years | 7 (43.8%) | 113.0 |
| Total | 16 (100.0%) | 118.0 |
Fertility by Age by Marriage Status in Elsinore
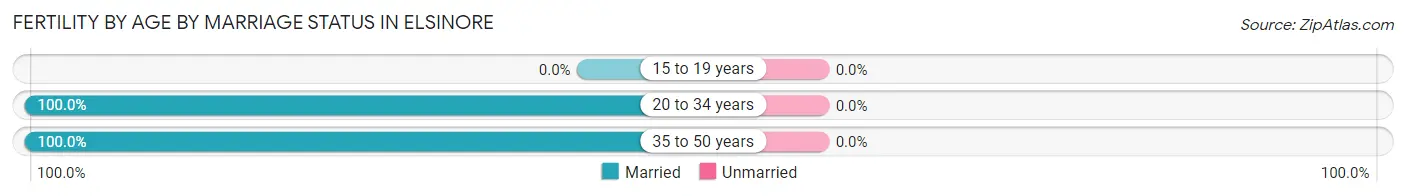
| Age Bracket | Married | Unmarried |
| 15 to 19 years | 0 (0.0%) | 0 (0.0%) |
| 20 to 34 years | 9 (100.0%) | 0 (0.0%) |
| 35 to 50 years | 7 (100.0%) | 0 (0.0%) |
| Total | 16 (100.0%) | 0 (0.0%) |
Fertility by Education in Elsinore
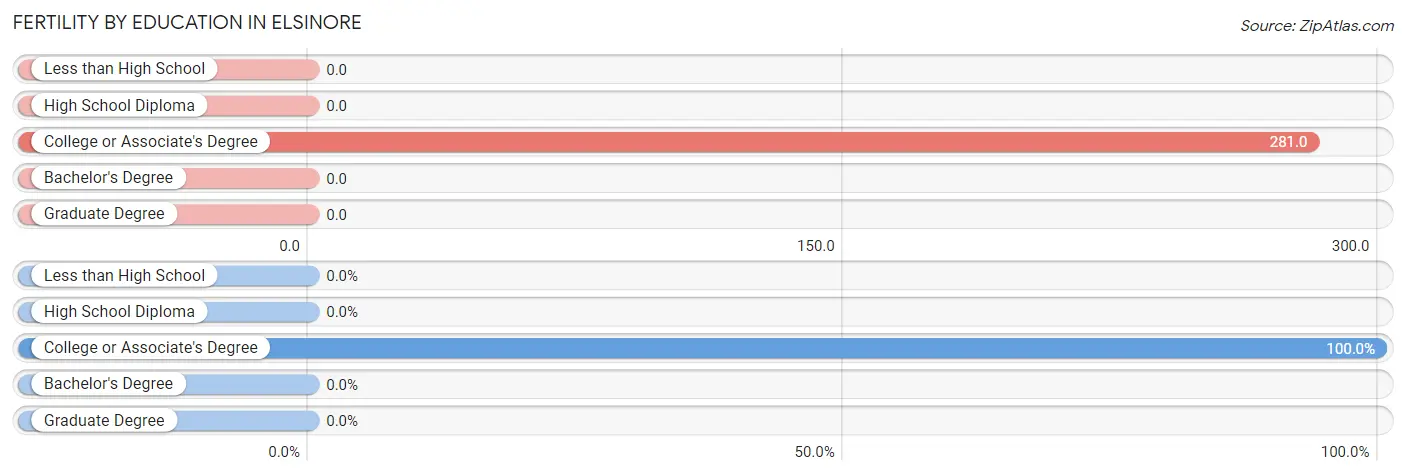
| Educational Attainment | Women with Births | Births / 1,000 Women |
| Less than High School | 0 (0.0%) | 0.0 |
| High School Diploma | 0 (0.0%) | 0.0 |
| College or Associate's Degree | 16 (100.0%) | 281.0 |
| Bachelor's Degree | 0 (0.0%) | 0.0 |
| Graduate Degree | 0 (0.0%) | 0.0 |
| Total | 16 (100.0%) | 118.0 |
Fertility by Education by Marriage Status in Elsinore
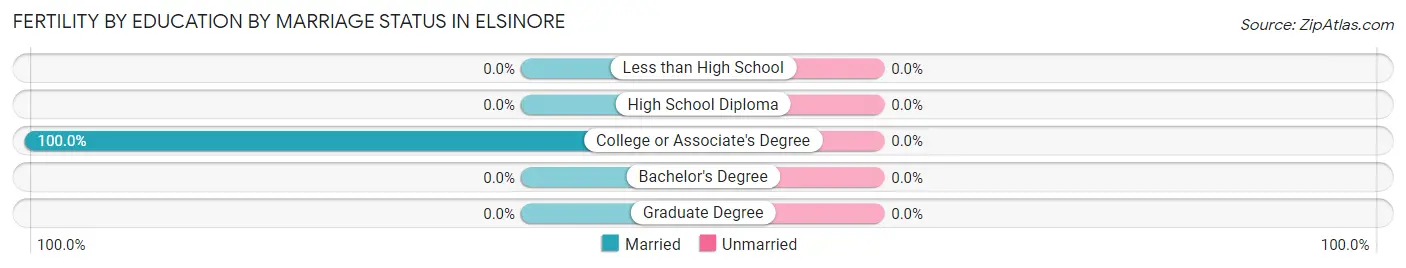
| Educational Attainment | Married | Unmarried |
| Less than High School | 0 (0.0%) | 0 (0.0%) |
| High School Diploma | 0 (0.0%) | 0 (0.0%) |
| College or Associate's Degree | 16 (100.0%) | 0 (0.0%) |
| Bachelor's Degree | 0 (0.0%) | 0 (0.0%) |
| Graduate Degree | 0 (0.0%) | 0 (0.0%) |
| Total | 16 (100.0%) | 0 (0.0%) |
Employment Characteristics in Elsinore
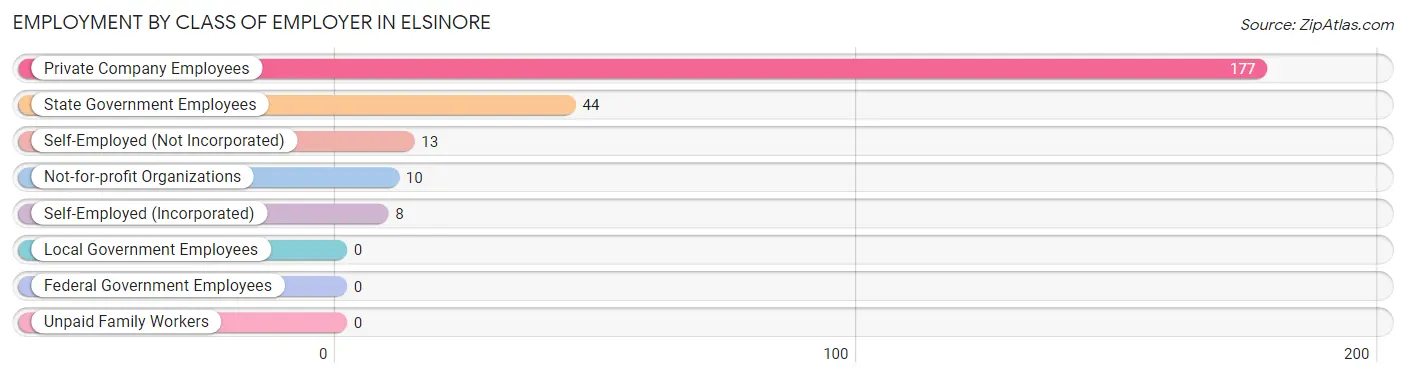
Employment by Class of Employer in Elsinore
Among the 252 employed individuals in Elsinore, private company employees (177 | 70.2%), state government employees (44 | 17.5%), and self-employed (not incorporated) (13 | 5.2%) make up the most common classes of employment.
| Employer Class | # Employees | % Employees |
| Private Company Employees | 177 | 70.2% |
| Self-Employed (Incorporated) | 8 | 3.2% |
| Self-Employed (Not Incorporated) | 13 | 5.2% |
| Not-for-profit Organizations | 10 | 4.0% |
| Local Government Employees | 0 | 0.0% |
| State Government Employees | 44 | 17.5% |
| Federal Government Employees | 0 | 0.0% |
| Unpaid Family Workers | 0 | 0.0% |
| Total | 252 | 100.0% |
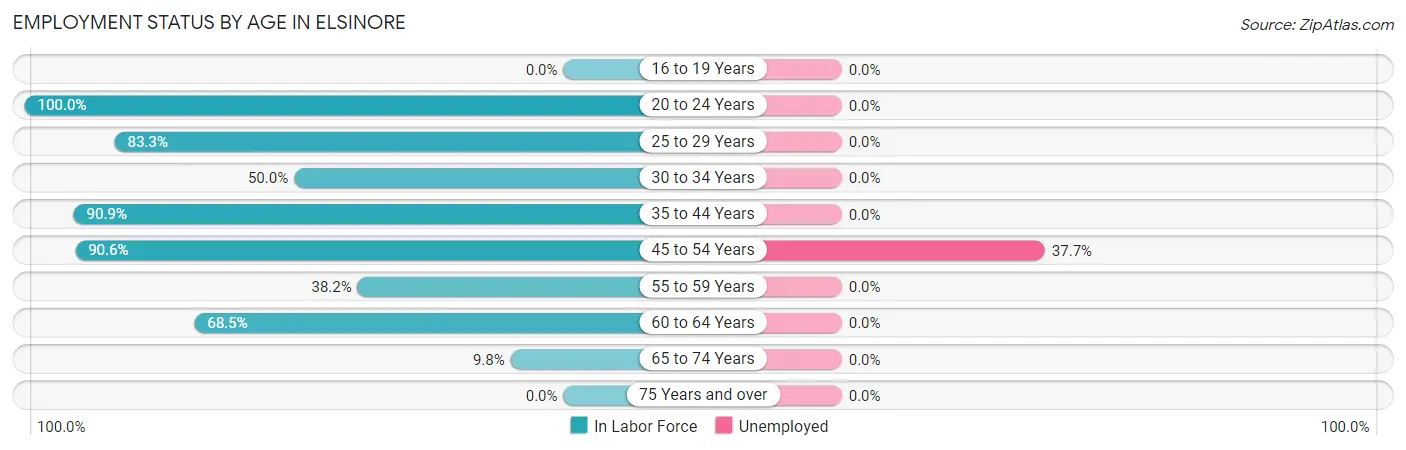
Employment Status by Age in Elsinore
According to the labor force statistics for Elsinore, out of the total population over 16 years of age (608), 46.2% or 281 individuals are in the labor force, with 10.6% or 30 of them unemployed. The age group with the highest labor force participation rate is 20 to 24 years, with 100.0% or 34 individuals in the labor force. Within the labor force, the 45 to 54 years age range has the highest percentage of unemployed individuals, with 37.7% or 29 of them being unemployed.
| Age Bracket | In Labor Force | Unemployed |
| 16 to 19 Years | 0 (0.0%) | 0 (0.0%) |
| 20 to 24 Years | 34 (100.0%) | 0 (0.0%) |
| 25 to 29 Years | 20 (83.3%) | 0 (0.0%) |
| 30 to 34 Years | 17 (50.0%) | 0 (0.0%) |
| 35 to 44 Years | 70 (90.9%) | 0 (0.0%) |
| 45 to 54 Years | 77 (90.6%) | 29 (37.7%) |
| 55 to 59 Years | 13 (38.2%) | 0 (0.0%) |
| 60 to 64 Years | 37 (68.5%) | 0 (0.0%) |
| 65 to 74 Years | 13 (9.8%) | 0 (0.0%) |
| 75 Years and over | 0 (0.0%) | 0 (0.0%) |
| Total | 281 (46.2%) | 30 (10.6%) |
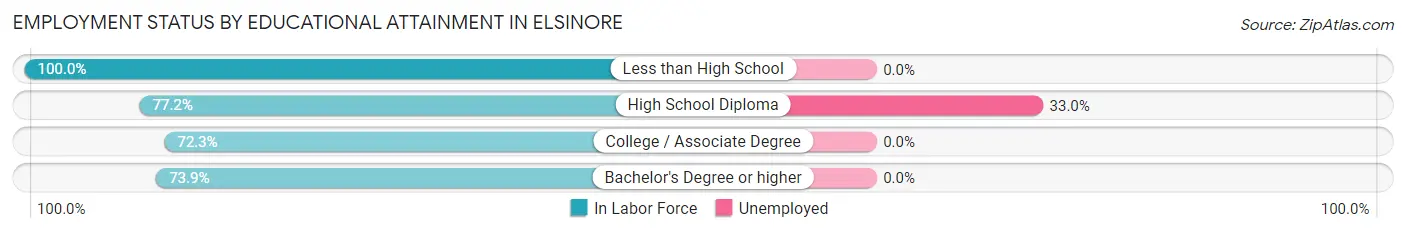
Employment Status by Educational Attainment in Elsinore
According to labor force statistics for Elsinore, 76.0% of individuals (234) out of the total population between 25 and 64 years of age (308) are in the labor force, with 12.8% or 30 of them being unemployed. The group with the highest labor force participation rate are those with the educational attainment of less than high school, with 100.0% or 15 individuals in the labor force. Within the labor force, individuals with high school diploma education have the highest percentage of unemployment, with 33.0% or 31 of them being unemployed.
| Educational Attainment | In Labor Force | Unemployed |
| Less than High School | 15 (100.0%) | 0 (0.0%) |
| High School Diploma | 95 (77.2%) | 41 (33.0%) |
| College / Associate Degree | 73 (72.3%) | 0 (0.0%) |
| Bachelor's Degree or higher | 51 (73.9%) | 0 (0.0%) |
| Total | 234 (76.0%) | 39 (12.8%) |
Employment Occupations by Sex in Elsinore
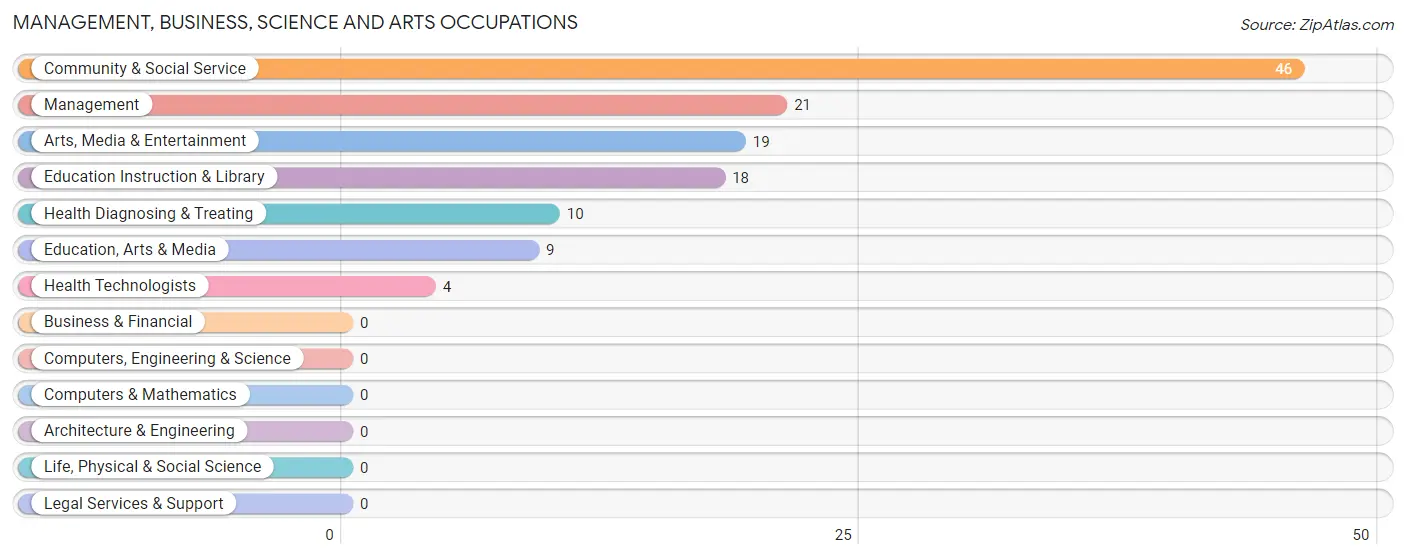
Management, Business, Science and Arts Occupations
The most common Management, Business, Science and Arts occupations in Elsinore are Community & Social Service (46 | 18.8%), Management (21 | 8.6%), Arts, Media & Entertainment (19 | 7.8%), Education Instruction & Library (18 | 7.3%), and Health Diagnosing & Treating (10 | 4.1%).
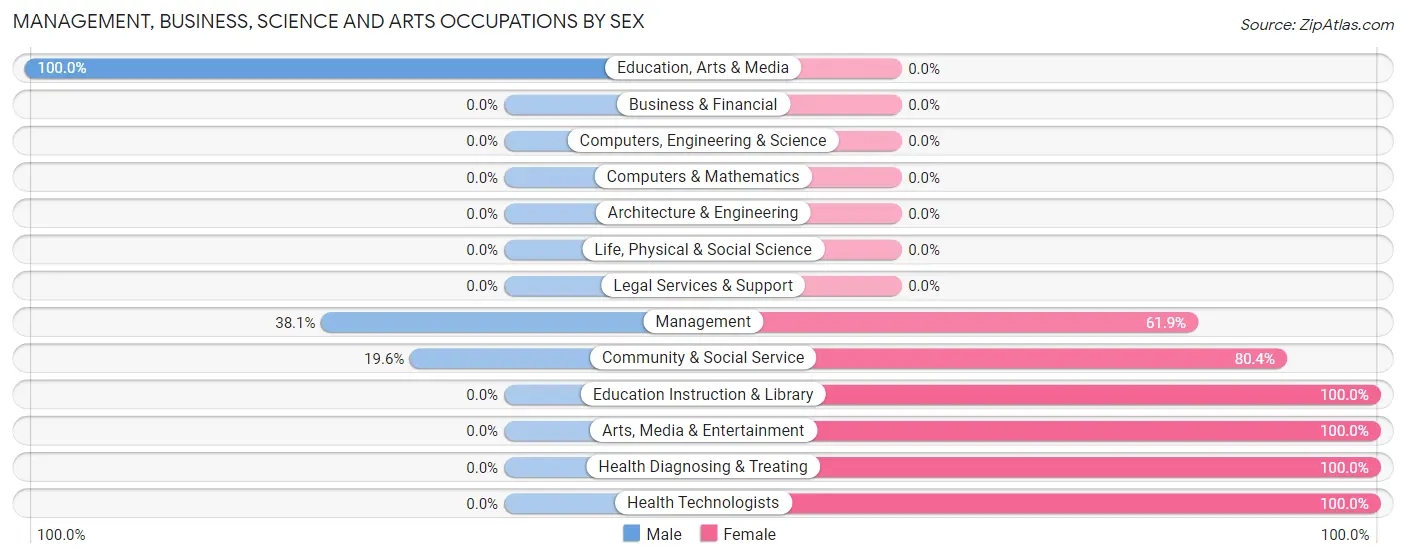
Management, Business, Science and Arts Occupations by Sex
Within the Management, Business, Science and Arts occupations in Elsinore, the most male-oriented occupations are Education, Arts & Media (100.0%), Management (38.1%), and Community & Social Service (19.6%), while the most female-oriented occupations are Education Instruction & Library (100.0%), Arts, Media & Entertainment (100.0%), and Health Diagnosing & Treating (100.0%).
| Occupation | Male | Female |
| Management | 8 (38.1%) | 13 (61.9%) |
| Business & Financial | 0 (0.0%) | 0 (0.0%) |
| Computers, Engineering & Science | 0 (0.0%) | 0 (0.0%) |
| Computers & Mathematics | 0 (0.0%) | 0 (0.0%) |
| Architecture & Engineering | 0 (0.0%) | 0 (0.0%) |
| Life, Physical & Social Science | 0 (0.0%) | 0 (0.0%) |
| Community & Social Service | 9 (19.6%) | 37 (80.4%) |
| Education, Arts & Media | 9 (100.0%) | 0 (0.0%) |
| Legal Services & Support | 0 (0.0%) | 0 (0.0%) |
| Education Instruction & Library | 0 (0.0%) | 18 (100.0%) |
| Arts, Media & Entertainment | 0 (0.0%) | 19 (100.0%) |
| Health Diagnosing & Treating | 0 (0.0%) | 10 (100.0%) |
| Health Technologists | 0 (0.0%) | 4 (100.0%) |
| Total (Category) | 17 (22.1%) | 60 (77.9%) |
| Total (Overall) | 112 (45.7%) | 133 (54.3%) |
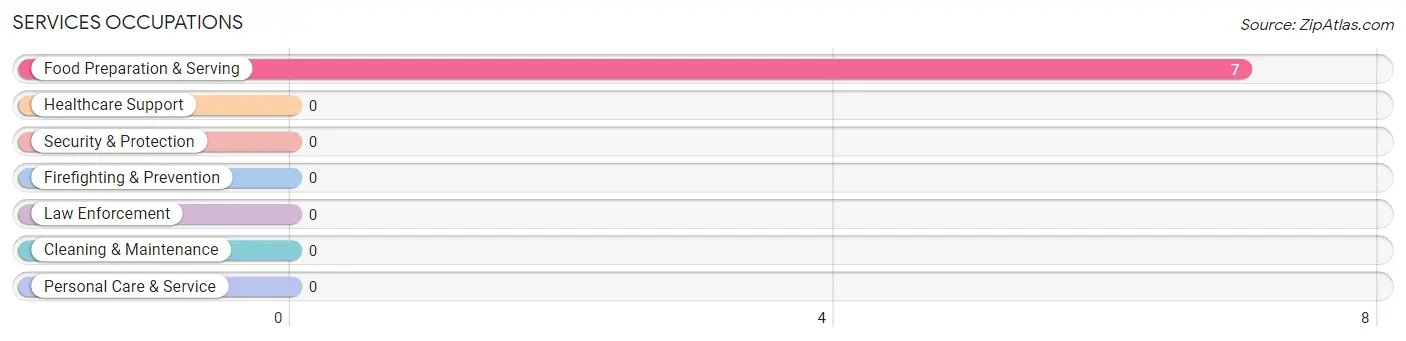
Services Occupations
The most common Services occupations in Elsinore are , and Food Preparation & Serving (7 | 2.9%).
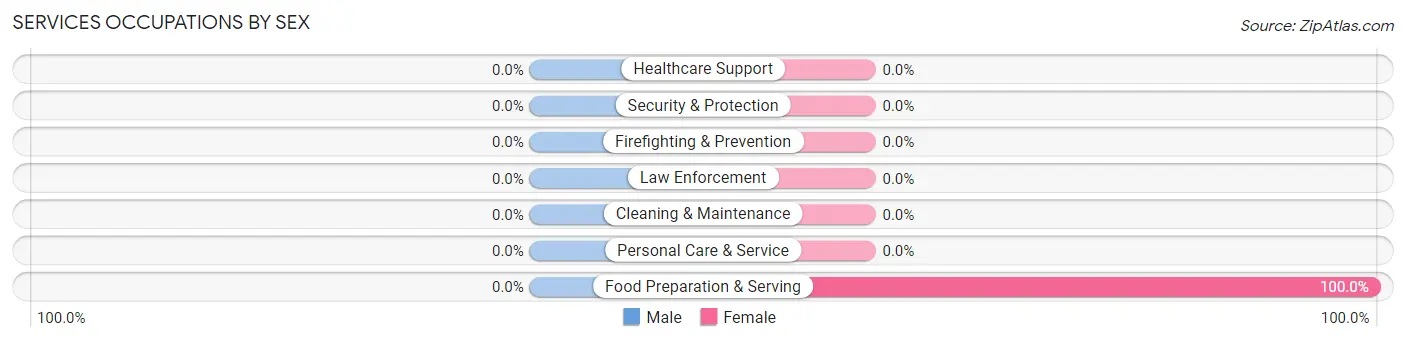
Services Occupations by Sex
| Occupation | Male | Female |
| Healthcare Support | 0 (0.0%) | 0 (0.0%) |
| Security & Protection | 0 (0.0%) | 0 (0.0%) |
| Firefighting & Prevention | 0 (0.0%) | 0 (0.0%) |
| Law Enforcement | 0 (0.0%) | 0 (0.0%) |
| Food Preparation & Serving | 0 (0.0%) | 7 (100.0%) |
| Cleaning & Maintenance | 0 (0.0%) | 0 (0.0%) |
| Personal Care & Service | 0 (0.0%) | 0 (0.0%) |
| Total (Category) | 0 (0.0%) | 7 (100.0%) |
| Total (Overall) | 112 (45.7%) | 133 (54.3%) |
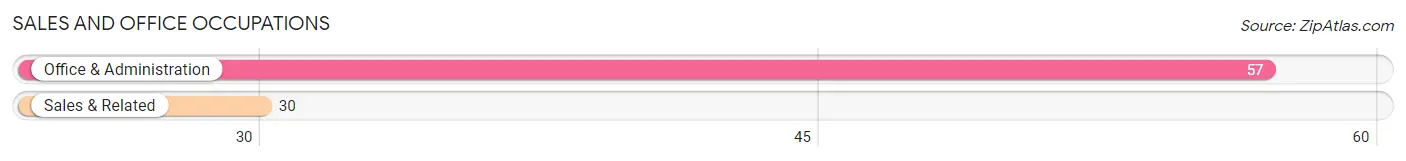
Sales and Office Occupations
The most common Sales and Office occupations in Elsinore are Office & Administration (57 | 23.3%), and Sales & Related (30 | 12.2%).
Sales and Office Occupations by Sex
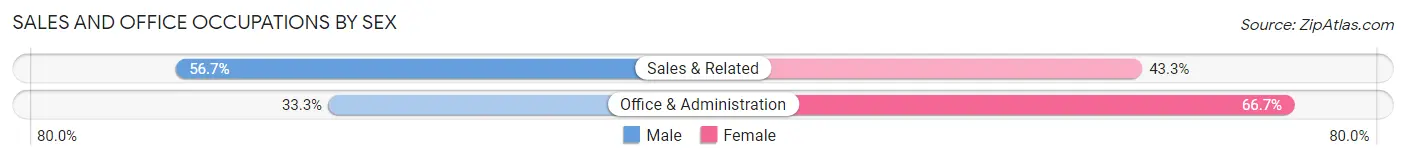
| Occupation | Male | Female |
| Sales & Related | 17 (56.7%) | 13 (43.3%) |
| Office & Administration | 19 (33.3%) | 38 (66.7%) |
| Total (Category) | 36 (41.4%) | 51 (58.6%) |
| Total (Overall) | 112 (45.7%) | 133 (54.3%) |
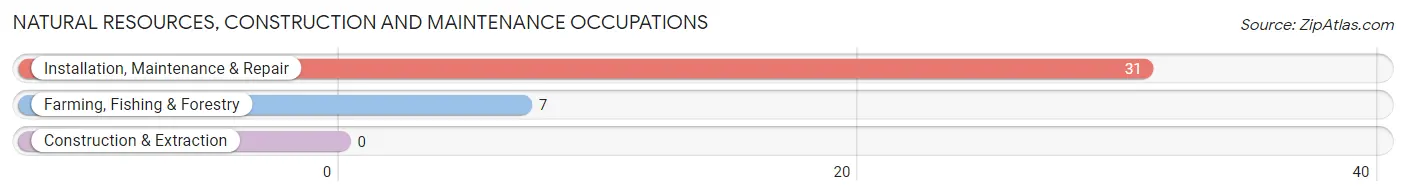
Natural Resources, Construction and Maintenance Occupations
The most common Natural Resources, Construction and Maintenance occupations in Elsinore are Installation, Maintenance & Repair (31 | 12.7%), and Farming, Fishing & Forestry (7 | 2.9%).
Natural Resources, Construction and Maintenance Occupations by Sex
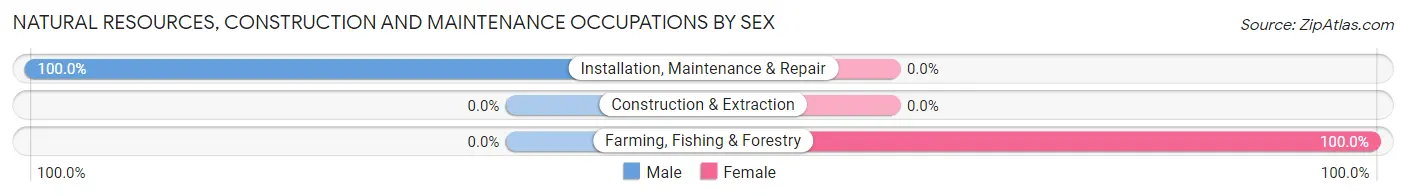
| Occupation | Male | Female |
| Farming, Fishing & Forestry | 0 (0.0%) | 7 (100.0%) |
| Construction & Extraction | 0 (0.0%) | 0 (0.0%) |
| Installation, Maintenance & Repair | 31 (100.0%) | 0 (0.0%) |
| Total (Category) | 31 (81.6%) | 7 (18.4%) |
| Total (Overall) | 112 (45.7%) | 133 (54.3%) |
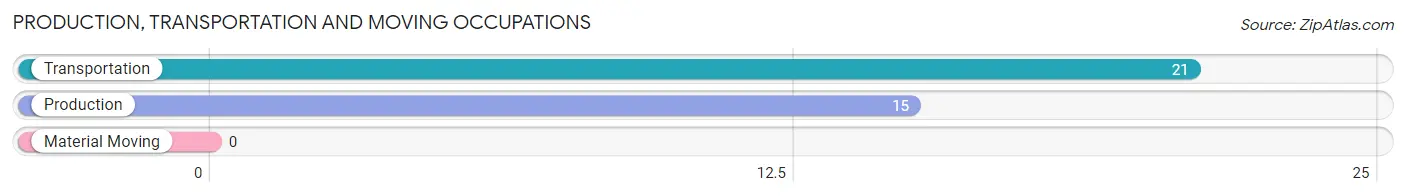
Production, Transportation and Moving Occupations
The most common Production, Transportation and Moving occupations in Elsinore are Transportation (21 | 8.6%), and Production (15 | 6.1%).
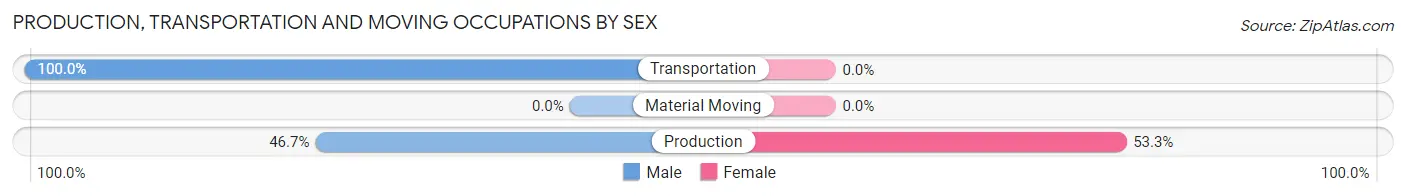
Production, Transportation and Moving Occupations by Sex
| Occupation | Male | Female |
| Production | 7 (46.7%) | 8 (53.3%) |
| Transportation | 21 (100.0%) | 0 (0.0%) |
| Material Moving | 0 (0.0%) | 0 (0.0%) |
| Total (Category) | 28 (77.8%) | 8 (22.2%) |
| Total (Overall) | 112 (45.7%) | 133 (54.3%) |
Employment Industries by Sex in Elsinore
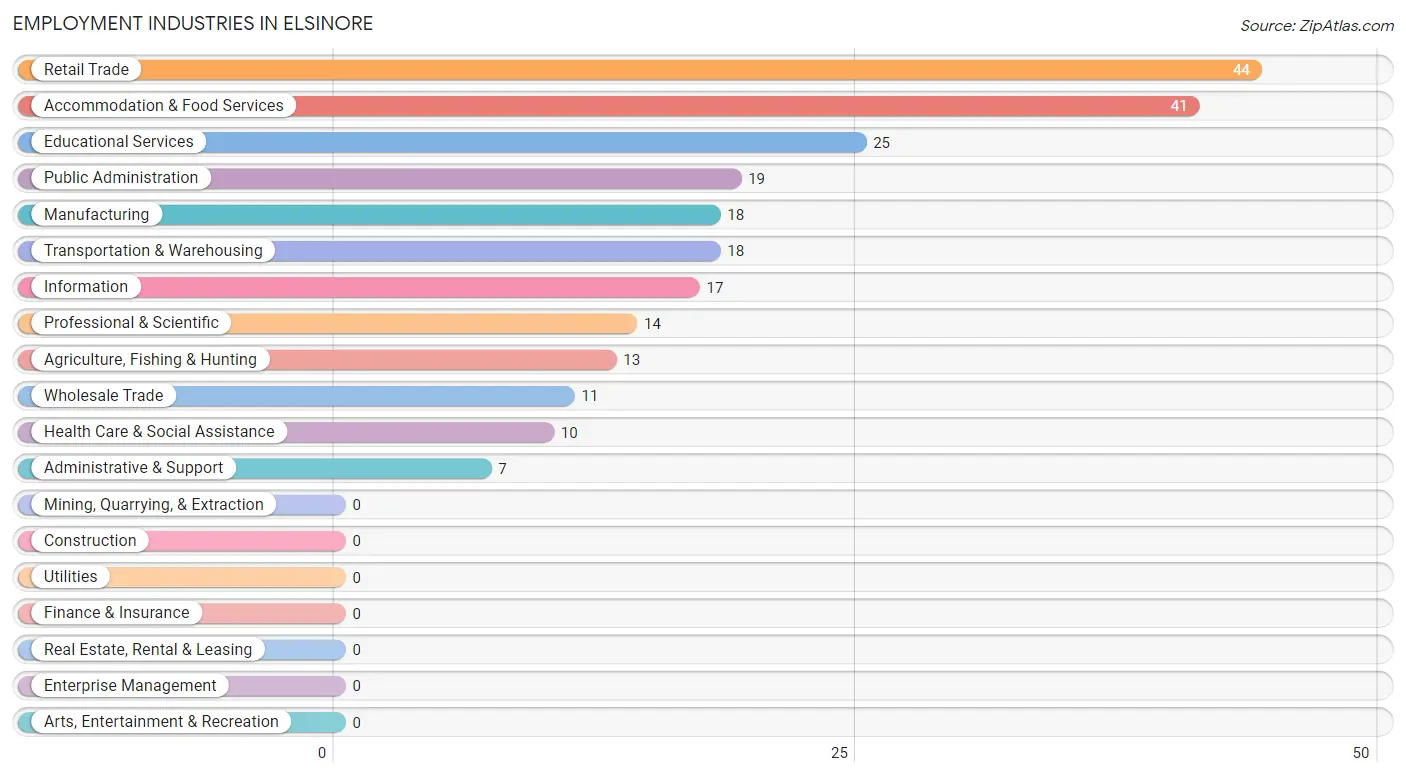
Employment Industries in Elsinore
The major employment industries in Elsinore include Retail Trade (44 | 18.0%), Accommodation & Food Services (41 | 16.7%), Educational Services (25 | 10.2%), Public Administration (19 | 7.8%), and Manufacturing (18 | 7.3%).
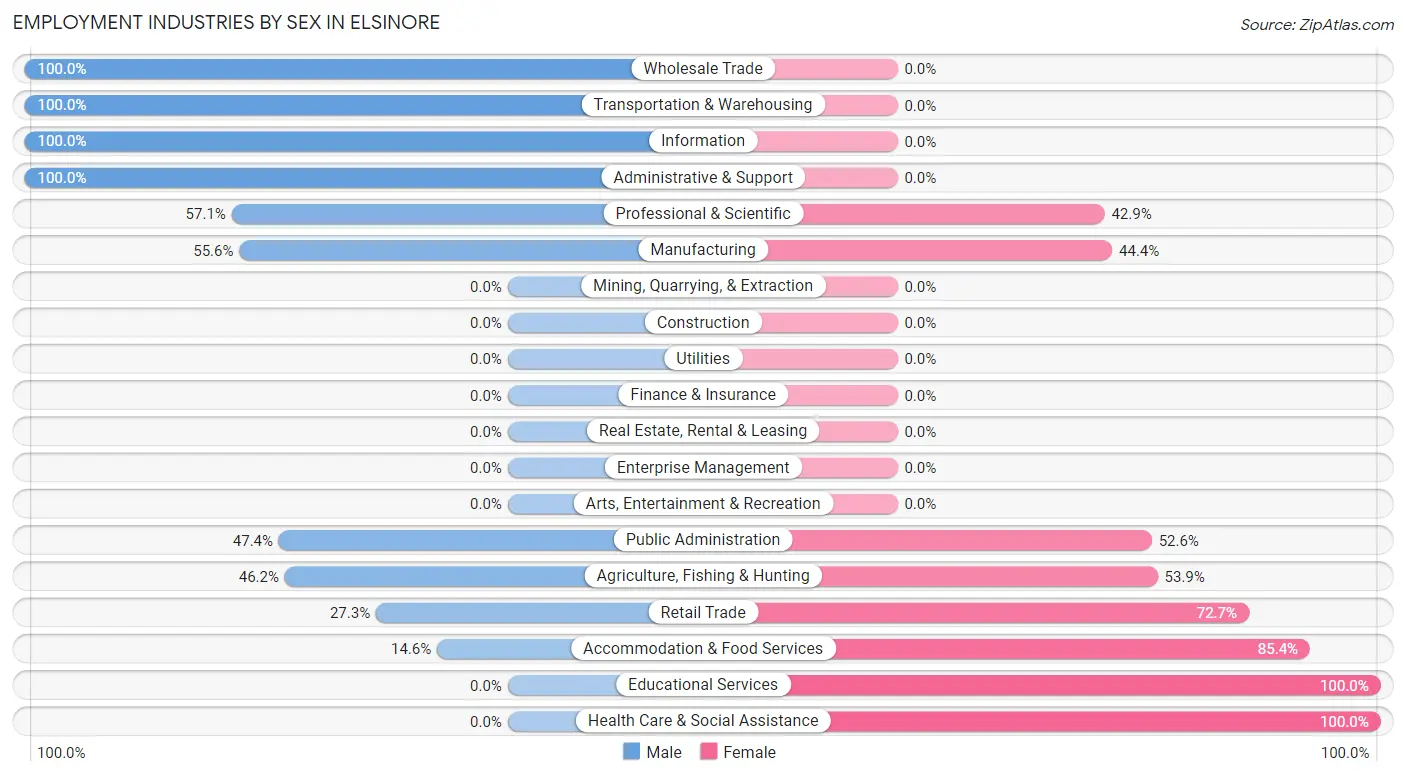
Employment Industries by Sex in Elsinore
The Elsinore industries that see more men than women are Wholesale Trade (100.0%), Transportation & Warehousing (100.0%), and Information (100.0%), whereas the industries that tend to have a higher number of women are Educational Services (100.0%), Health Care & Social Assistance (100.0%), and Accommodation & Food Services (85.4%).
| Industry | Male | Female |
| Agriculture, Fishing & Hunting | 6 (46.2%) | 7 (53.8%) |
| Mining, Quarrying, & Extraction | 0 (0.0%) | 0 (0.0%) |
| Construction | 0 (0.0%) | 0 (0.0%) |
| Manufacturing | 10 (55.6%) | 8 (44.4%) |
| Wholesale Trade | 11 (100.0%) | 0 (0.0%) |
| Retail Trade | 12 (27.3%) | 32 (72.7%) |
| Transportation & Warehousing | 18 (100.0%) | 0 (0.0%) |
| Utilities | 0 (0.0%) | 0 (0.0%) |
| Information | 17 (100.0%) | 0 (0.0%) |
| Finance & Insurance | 0 (0.0%) | 0 (0.0%) |
| Real Estate, Rental & Leasing | 0 (0.0%) | 0 (0.0%) |
| Professional & Scientific | 8 (57.1%) | 6 (42.9%) |
| Enterprise Management | 0 (0.0%) | 0 (0.0%) |
| Administrative & Support | 7 (100.0%) | 0 (0.0%) |
| Educational Services | 0 (0.0%) | 25 (100.0%) |
| Health Care & Social Assistance | 0 (0.0%) | 10 (100.0%) |
| Arts, Entertainment & Recreation | 0 (0.0%) | 0 (0.0%) |
| Accommodation & Food Services | 6 (14.6%) | 35 (85.4%) |
| Public Administration | 9 (47.4%) | 10 (52.6%) |
| Total | 112 (45.7%) | 133 (54.3%) |
Education in Elsinore
School Enrollment in Elsinore
The most common levels of schooling among the 154 students in Elsinore are middle school (49 | 31.8%), elementary school (36 | 23.4%), and high school (31 | 20.1%).
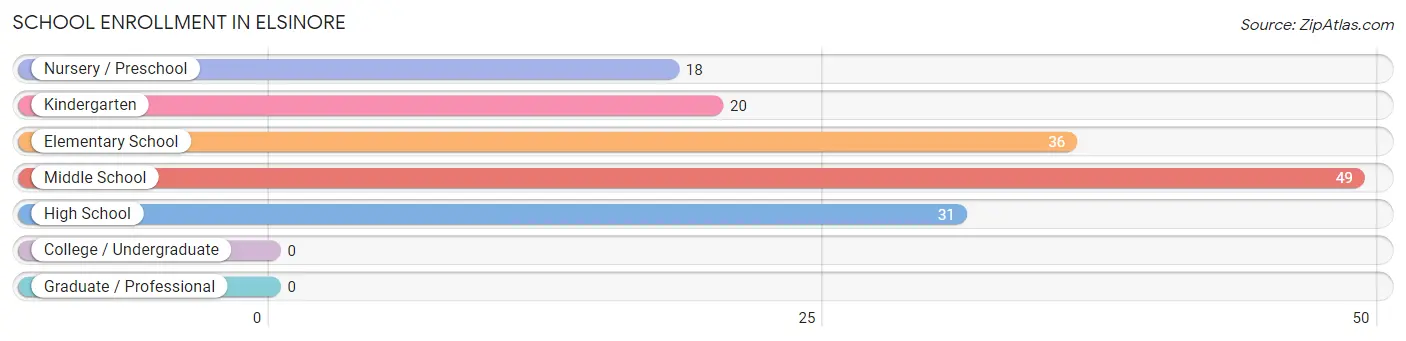
| School Level | # Students | % Students |
| Nursery / Preschool | 18 | 11.7% |
| Kindergarten | 20 | 13.0% |
| Elementary School | 36 | 23.4% |
| Middle School | 49 | 31.8% |
| High School | 31 | 20.1% |
| College / Undergraduate | 0 | 0.0% |
| Graduate / Professional | 0 | 0.0% |
| Total | 154 | 100.0% |
School Enrollment by Age by Funding Source in Elsinore
Out of a total of 154 students who are enrolled in schools in Elsinore, 40 (26.0%) attend a private institution, while the remaining 114 (74.0%) are enrolled in public schools. The age group of 10 to 14 year olds has the highest likelihood of being enrolled in private schools, with 26 (53.1% in the age bracket) enrolled. Conversely, the age group of 3 to 4 year olds has the lowest likelihood of being enrolled in a private school, with 11 (100.0% in the age bracket) attending a public institution.
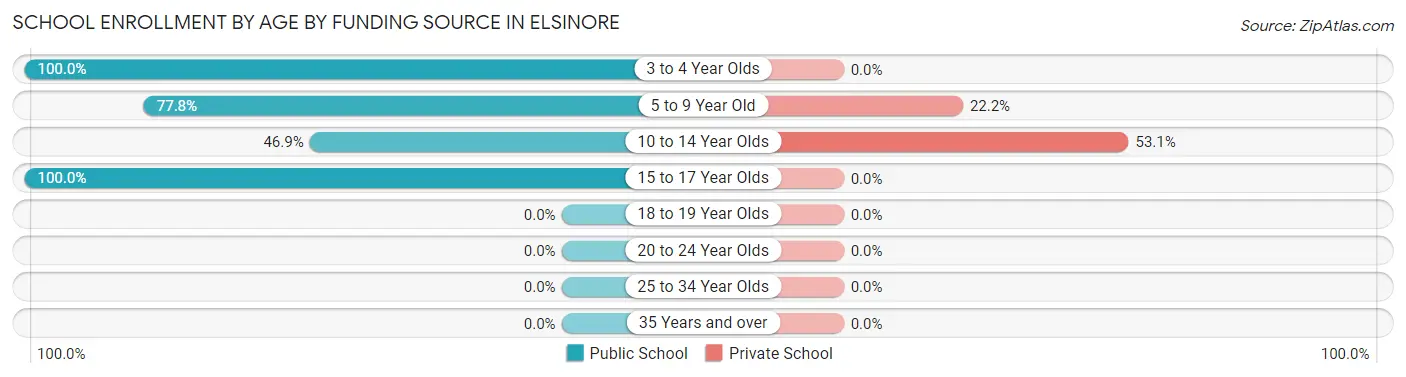
| Age Bracket | Public School | Private School |
| 3 to 4 Year Olds | 11 (100.0%) | 0 (0.0%) |
| 5 to 9 Year Old | 49 (77.8%) | 14 (22.2%) |
| 10 to 14 Year Olds | 23 (46.9%) | 26 (53.1%) |
| 15 to 17 Year Olds | 31 (100.0%) | 0 (0.0%) |
| 18 to 19 Year Olds | 0 (0.0%) | 0 (0.0%) |
| 20 to 24 Year Olds | 0 (0.0%) | 0 (0.0%) |
| 25 to 34 Year Olds | 0 (0.0%) | 0 (0.0%) |
| 35 Years and over | 0 (0.0%) | 0 (0.0%) |
| Total | 114 (74.0%) | 40 (26.0%) |
Educational Attainment by Field of Study in Elsinore
Education (45 | 50.6%), arts & humanities (13 | 14.6%), computers & mathematics (10 | 11.2%), literature & languages (9 | 10.1%), and psychology (7 | 7.9%) are the most common fields of study among 89 individuals in Elsinore who have obtained a bachelor's degree or higher.
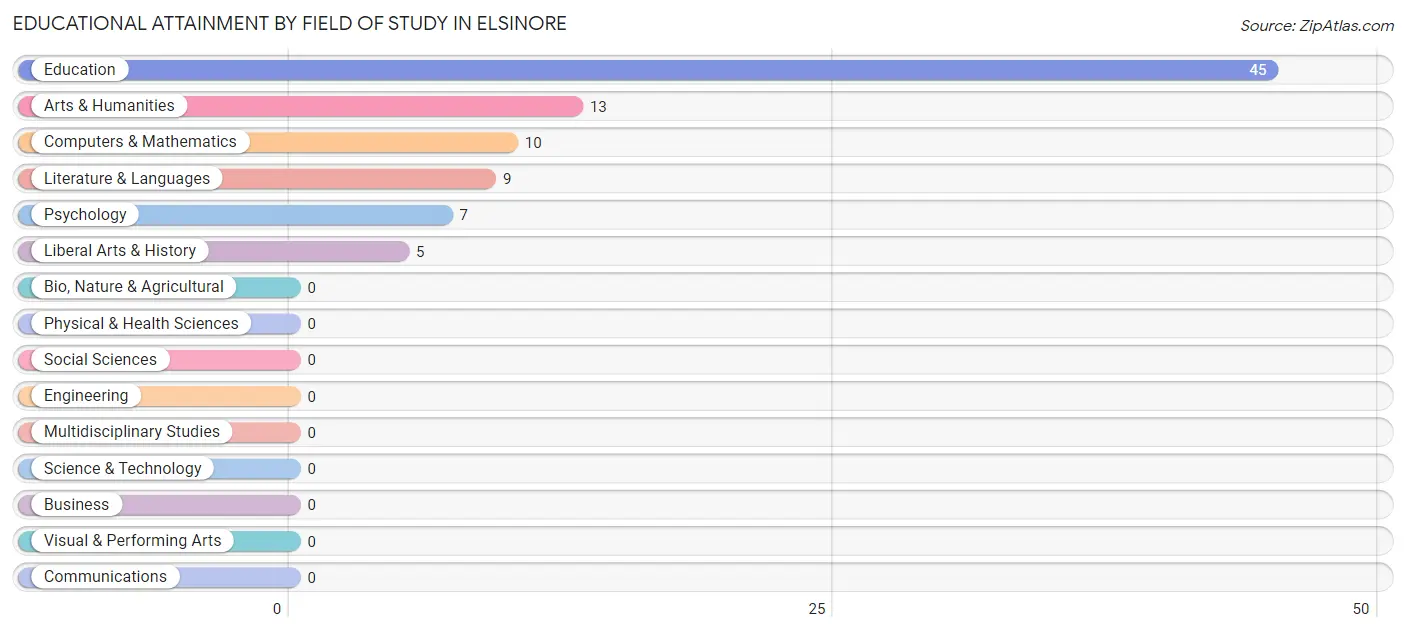
| Field of Study | # Graduates | % Graduates |
| Computers & Mathematics | 10 | 11.2% |
| Bio, Nature & Agricultural | 0 | 0.0% |
| Physical & Health Sciences | 0 | 0.0% |
| Psychology | 7 | 7.9% |
| Social Sciences | 0 | 0.0% |
| Engineering | 0 | 0.0% |
| Multidisciplinary Studies | 0 | 0.0% |
| Science & Technology | 0 | 0.0% |
| Business | 0 | 0.0% |
| Education | 45 | 50.6% |
| Literature & Languages | 9 | 10.1% |
| Liberal Arts & History | 5 | 5.6% |
| Visual & Performing Arts | 0 | 0.0% |
| Communications | 0 | 0.0% |
| Arts & Humanities | 13 | 14.6% |
| Total | 89 | 100.0% |
Transportation & Commute in Elsinore
Vehicle Availability by Sex in Elsinore
The most prevalent vehicle ownership categories in Elsinore are males with 3 vehicles (52, accounting for 43.7%) and females with 3 vehicles (31, making up 39.1%).
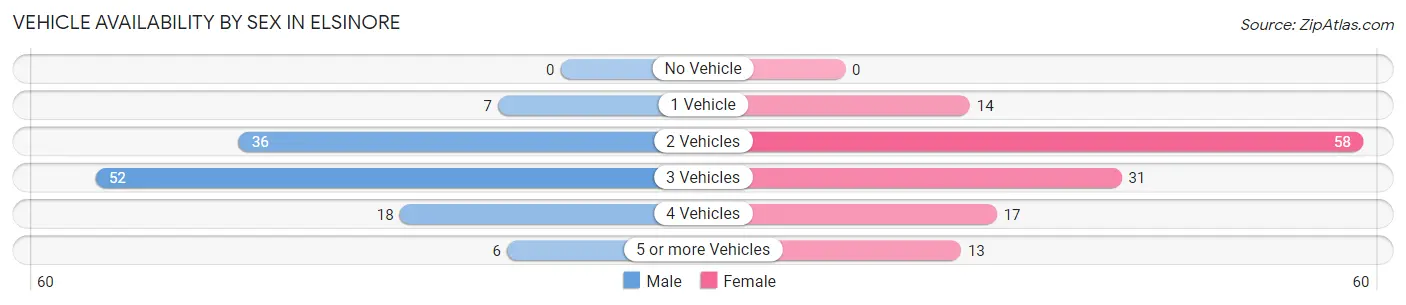
| Vehicles Available | Male | Female |
| No Vehicle | 0 (0.0%) | 0 (0.0%) |
| 1 Vehicle | 7 (5.9%) | 14 (10.5%) |
| 2 Vehicles | 36 (30.2%) | 58 (43.6%) |
| 3 Vehicles | 52 (43.7%) | 31 (23.3%) |
| 4 Vehicles | 18 (15.1%) | 17 (12.8%) |
| 5 or more Vehicles | 6 (5.0%) | 13 (9.8%) |
| Total | 119 (100.0%) | 133 (100.0%) |
Commute Time in Elsinore
The most frequently occuring commute durations in Elsinore are 10 to 14 minutes (96 commuters, 40.2%), 5 to 9 minutes (45 commuters, 18.8%), and 15 to 19 minutes (19 commuters, 8.0%).
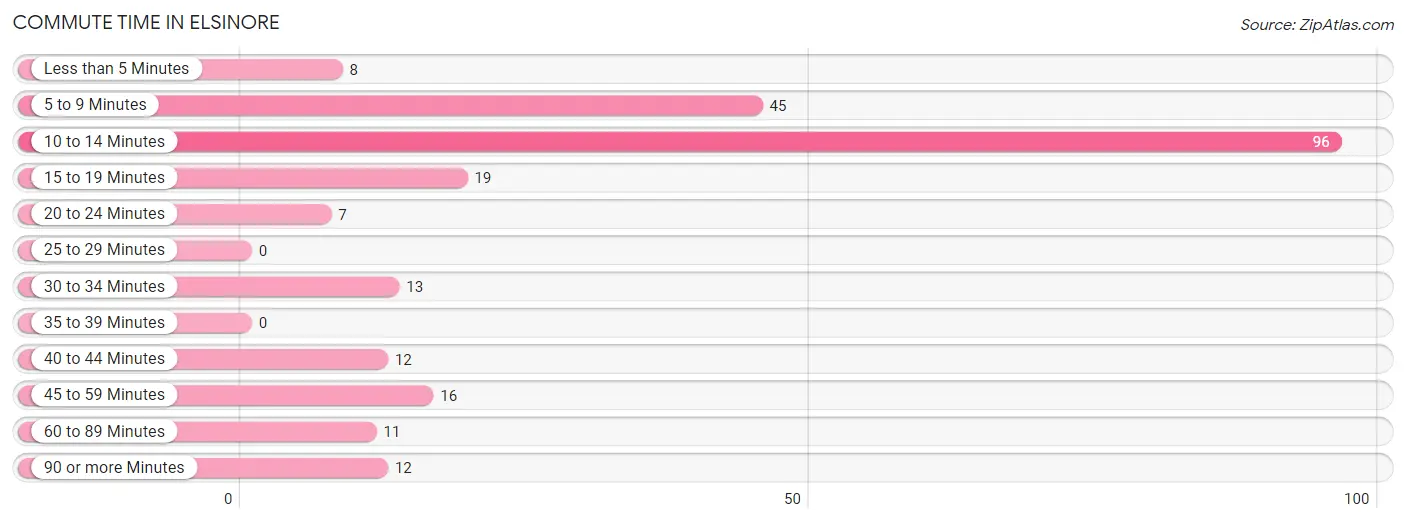
| Commute Time | # Commuters | % Commuters |
| Less than 5 Minutes | 8 | 3.4% |
| 5 to 9 Minutes | 45 | 18.8% |
| 10 to 14 Minutes | 96 | 40.2% |
| 15 to 19 Minutes | 19 | 8.0% |
| 20 to 24 Minutes | 7 | 2.9% |
| 25 to 29 Minutes | 0 | 0.0% |
| 30 to 34 Minutes | 13 | 5.4% |
| 35 to 39 Minutes | 0 | 0.0% |
| 40 to 44 Minutes | 12 | 5.0% |
| 45 to 59 Minutes | 16 | 6.7% |
| 60 to 89 Minutes | 11 | 4.6% |
| 90 or more Minutes | 12 | 5.0% |
Commute Time by Sex in Elsinore
The most common commute times in Elsinore are 10 to 14 minutes (26 commuters, 23.2%) for males and 10 to 14 minutes (70 commuters, 55.1%) for females.
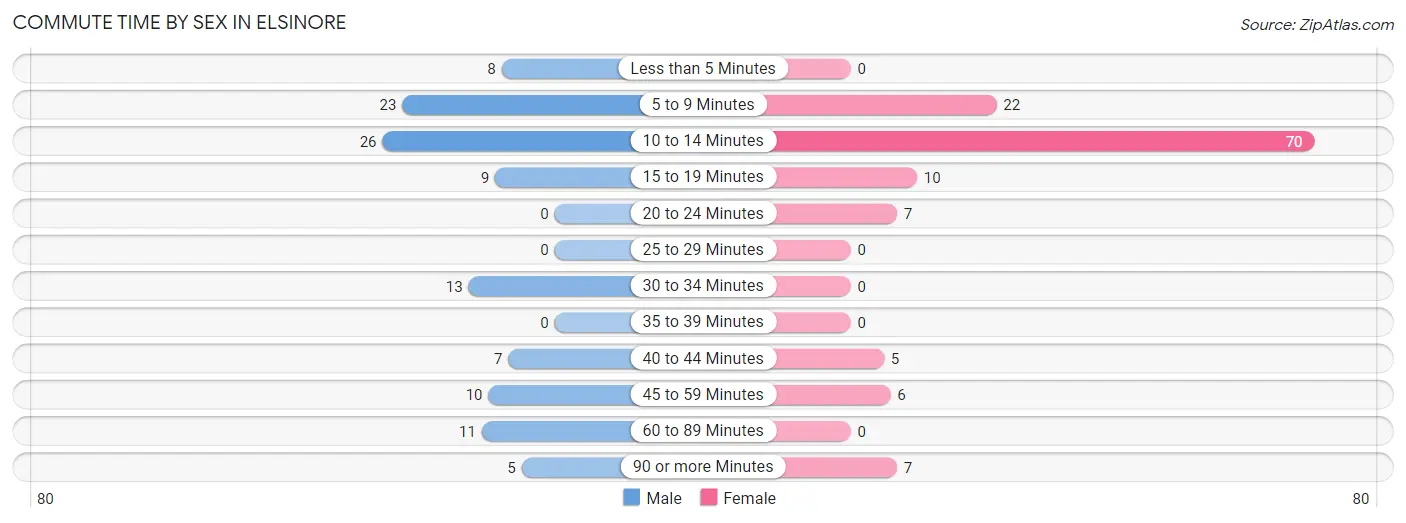
| Commute Time | Male | Female |
| Less than 5 Minutes | 8 (7.1%) | 0 (0.0%) |
| 5 to 9 Minutes | 23 (20.5%) | 22 (17.3%) |
| 10 to 14 Minutes | 26 (23.2%) | 70 (55.1%) |
| 15 to 19 Minutes | 9 (8.0%) | 10 (7.9%) |
| 20 to 24 Minutes | 0 (0.0%) | 7 (5.5%) |
| 25 to 29 Minutes | 0 (0.0%) | 0 (0.0%) |
| 30 to 34 Minutes | 13 (11.6%) | 0 (0.0%) |
| 35 to 39 Minutes | 0 (0.0%) | 0 (0.0%) |
| 40 to 44 Minutes | 7 (6.2%) | 5 (3.9%) |
| 45 to 59 Minutes | 10 (8.9%) | 6 (4.7%) |
| 60 to 89 Minutes | 11 (9.8%) | 0 (0.0%) |
| 90 or more Minutes | 5 (4.5%) | 7 (5.5%) |
Time of Departure to Work by Sex in Elsinore
The most frequent times of departure to work in Elsinore are 5:30 AM to 5:59 AM (19, 17.0%) for males and 4:00 PM to 11:59 PM (22, 17.3%) for females.
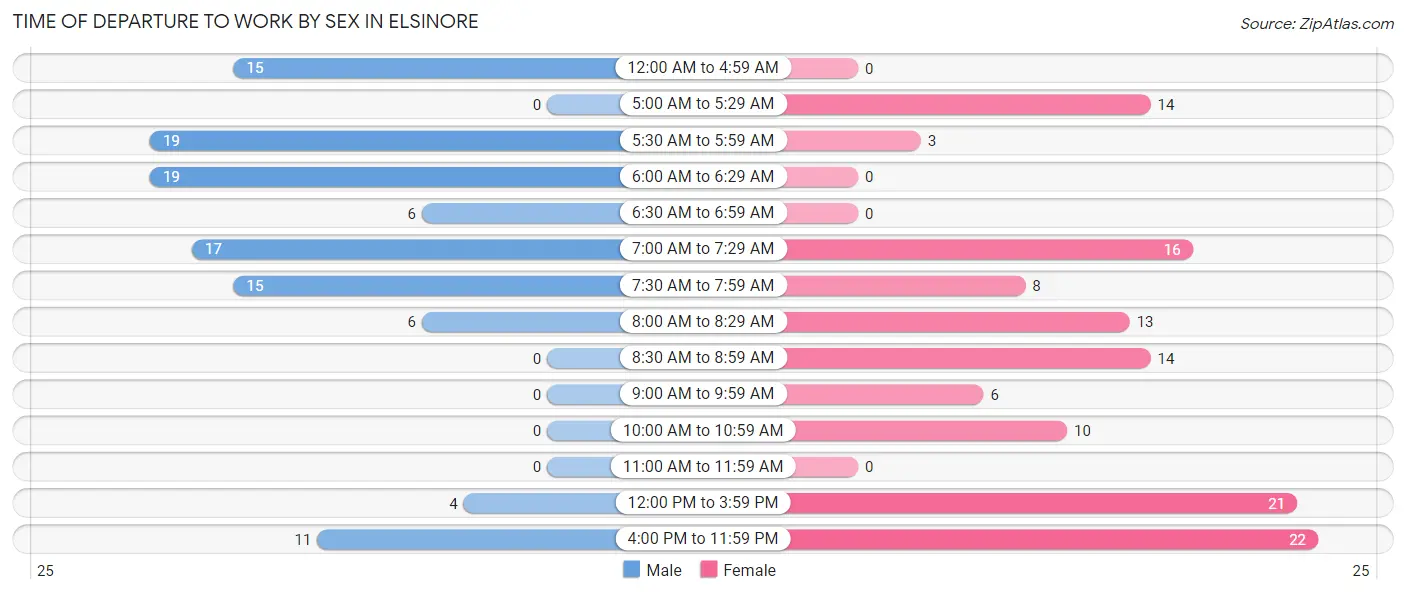
| Time of Departure | Male | Female |
| 12:00 AM to 4:59 AM | 15 (13.4%) | 0 (0.0%) |
| 5:00 AM to 5:29 AM | 0 (0.0%) | 14 (11.0%) |
| 5:30 AM to 5:59 AM | 19 (17.0%) | 3 (2.4%) |
| 6:00 AM to 6:29 AM | 19 (17.0%) | 0 (0.0%) |
| 6:30 AM to 6:59 AM | 6 (5.4%) | 0 (0.0%) |
| 7:00 AM to 7:29 AM | 17 (15.2%) | 16 (12.6%) |
| 7:30 AM to 7:59 AM | 15 (13.4%) | 8 (6.3%) |
| 8:00 AM to 8:29 AM | 6 (5.4%) | 13 (10.2%) |
| 8:30 AM to 8:59 AM | 0 (0.0%) | 14 (11.0%) |
| 9:00 AM to 9:59 AM | 0 (0.0%) | 6 (4.7%) |
| 10:00 AM to 10:59 AM | 0 (0.0%) | 10 (7.9%) |
| 11:00 AM to 11:59 AM | 0 (0.0%) | 0 (0.0%) |
| 12:00 PM to 3:59 PM | 4 (3.6%) | 21 (16.5%) |
| 4:00 PM to 11:59 PM | 11 (9.8%) | 22 (17.3%) |
| Total | 112 (100.0%) | 127 (100.0%) |
Housing Occupancy in Elsinore
Occupancy by Ownership in Elsinore
Of the total 308 dwellings in Elsinore, owner-occupied units account for 261 (84.7%), while renter-occupied units make up 47 (15.3%).
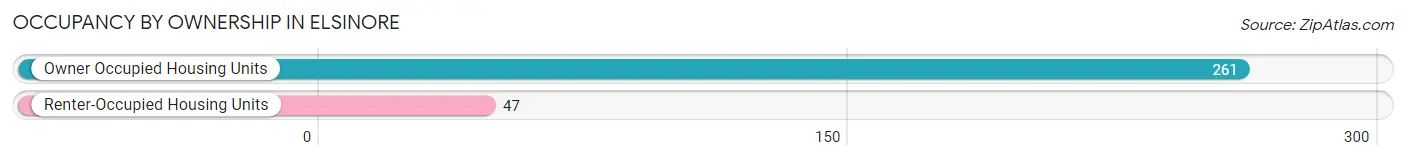
| Occupancy | # Housing Units | % Housing Units |
| Owner Occupied Housing Units | 261 | 84.7% |
| Renter-Occupied Housing Units | 47 | 15.3% |
| Total Occupied Housing Units | 308 | 100.0% |
Occupancy by Household Size in Elsinore
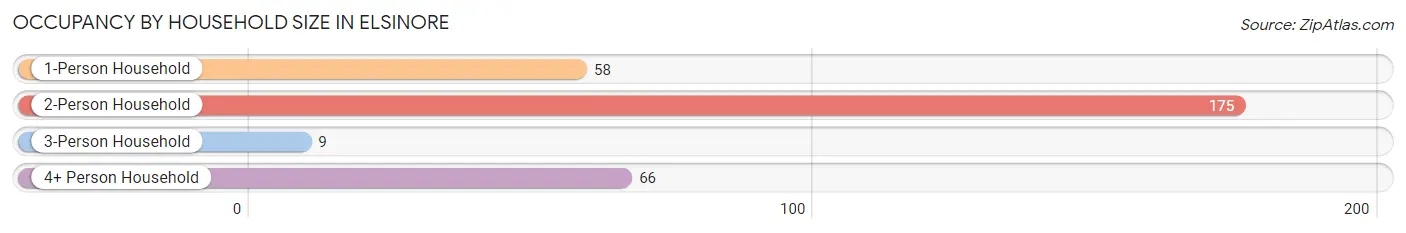
| Household Size | # Housing Units | % Housing Units |
| 1-Person Household | 58 | 18.8% |
| 2-Person Household | 175 | 56.8% |
| 3-Person Household | 9 | 2.9% |
| 4+ Person Household | 66 | 21.4% |
| Total Housing Units | 308 | 100.0% |
Occupancy by Ownership by Household Size in Elsinore
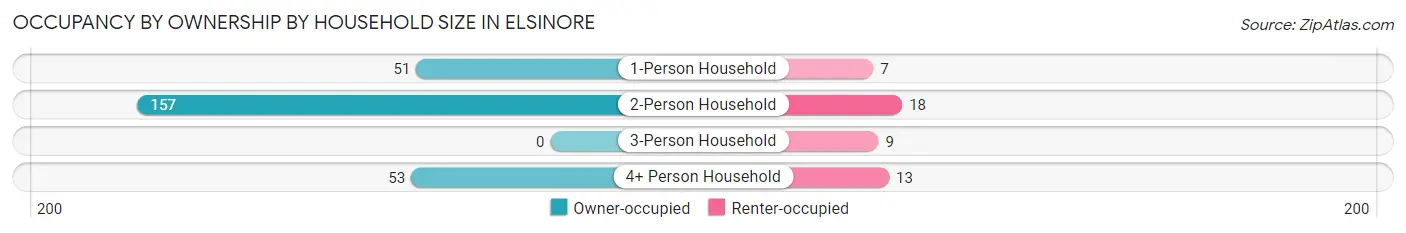
| Household Size | Owner-occupied | Renter-occupied |
| 1-Person Household | 51 (87.9%) | 7 (12.1%) |
| 2-Person Household | 157 (89.7%) | 18 (10.3%) |
| 3-Person Household | 0 (0.0%) | 9 (100.0%) |
| 4+ Person Household | 53 (80.3%) | 13 (19.7%) |
| Total Housing Units | 261 (84.7%) | 47 (15.3%) |
Occupancy by Educational Attainment in Elsinore
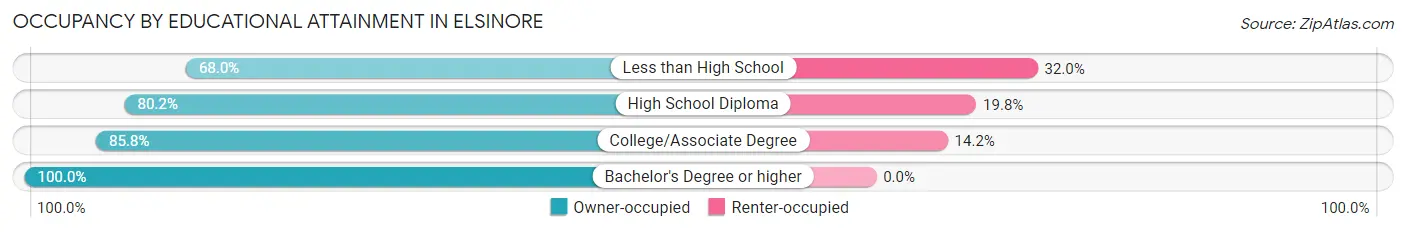
| Household Size | Owner-occupied | Renter-occupied |
| Less than High School | 17 (68.0%) | 8 (32.0%) |
| High School Diploma | 89 (80.2%) | 22 (19.8%) |
| College/Associate Degree | 103 (85.8%) | 17 (14.2%) |
| Bachelor's Degree or higher | 52 (100.0%) | 0 (0.0%) |
Occupancy by Age of Householder in Elsinore
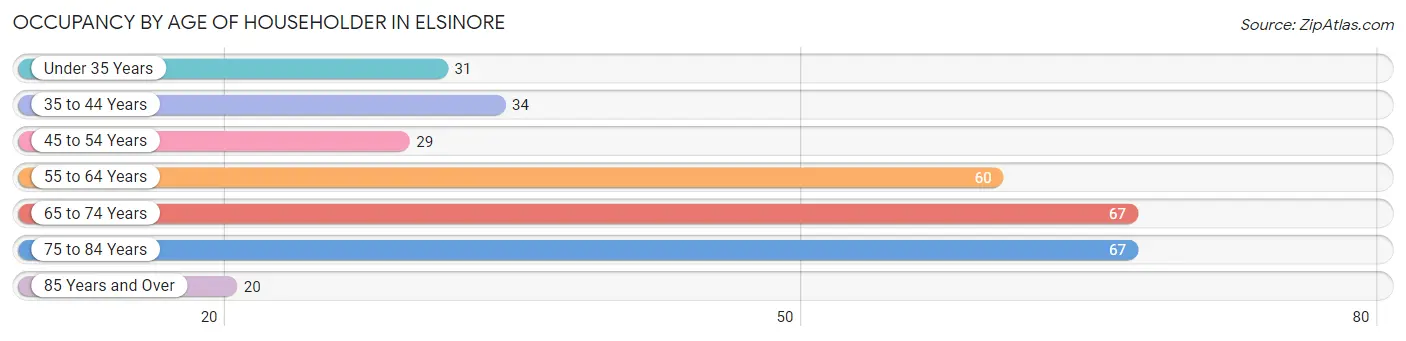
| Age Bracket | # Households | % Households |
| Under 35 Years | 31 | 10.1% |
| 35 to 44 Years | 34 | 11.0% |
| 45 to 54 Years | 29 | 9.4% |
| 55 to 64 Years | 60 | 19.5% |
| 65 to 74 Years | 67 | 21.7% |
| 75 to 84 Years | 67 | 21.7% |
| 85 Years and Over | 20 | 6.5% |
| Total | 308 | 100.0% |
Housing Finances in Elsinore
Median Income by Occupancy in Elsinore
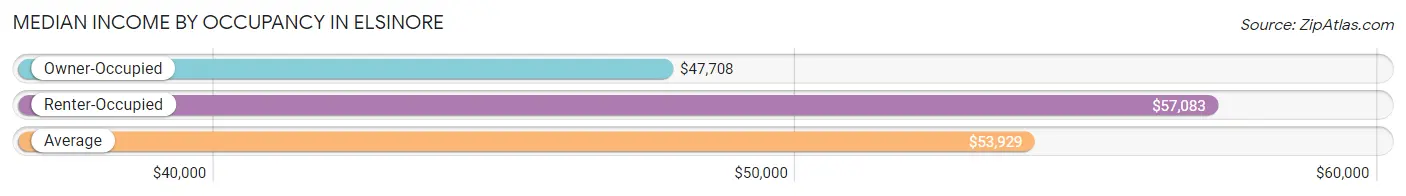
| Occupancy Type | # Households | Median Income |
| Owner-Occupied | 261 (84.7%) | $47,708 |
| Renter-Occupied | 47 (15.3%) | $57,083 |
| Average | 308 (100.0%) | $53,929 |
Occupancy by Householder Income Bracket in Elsinore
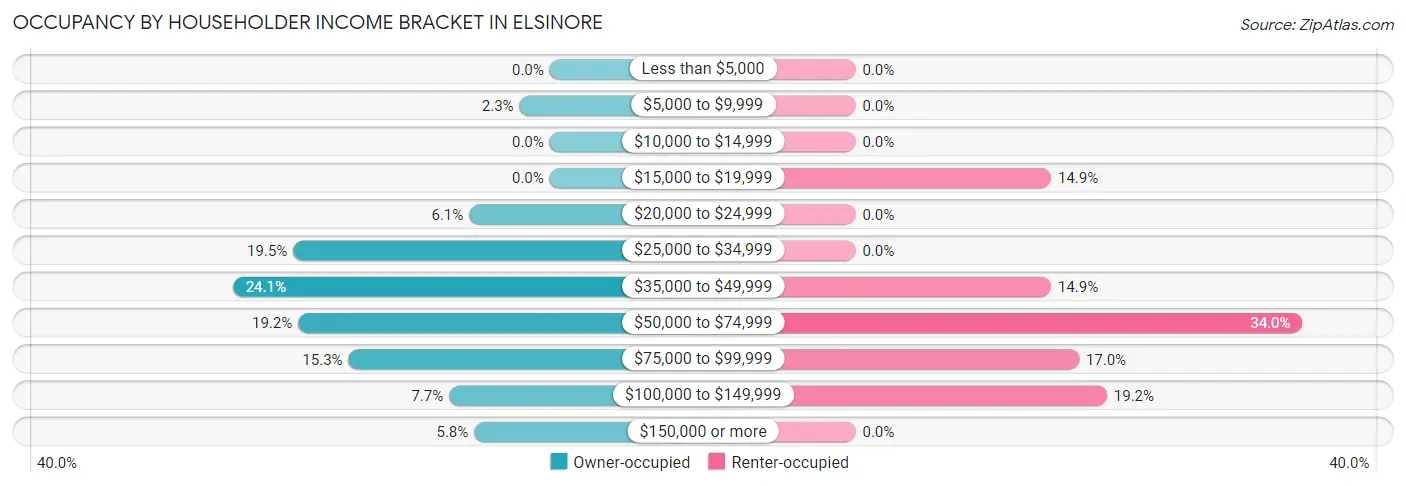
| Income Bracket | Owner-occupied | Renter-occupied |
| Less than $5,000 | 0 (0.0%) | 0 (0.0%) |
| $5,000 to $9,999 | 6 (2.3%) | 0 (0.0%) |
| $10,000 to $14,999 | 0 (0.0%) | 0 (0.0%) |
| $15,000 to $19,999 | 0 (0.0%) | 7 (14.9%) |
| $20,000 to $24,999 | 16 (6.1%) | 0 (0.0%) |
| $25,000 to $34,999 | 51 (19.5%) | 0 (0.0%) |
| $35,000 to $49,999 | 63 (24.1%) | 7 (14.9%) |
| $50,000 to $74,999 | 50 (19.2%) | 16 (34.0%) |
| $75,000 to $99,999 | 40 (15.3%) | 8 (17.0%) |
| $100,000 to $149,999 | 20 (7.7%) | 9 (19.2%) |
| $150,000 or more | 15 (5.8%) | 0 (0.0%) |
| Total | 261 (100.0%) | 47 (100.0%) |
Monthly Housing Cost Tiers in Elsinore
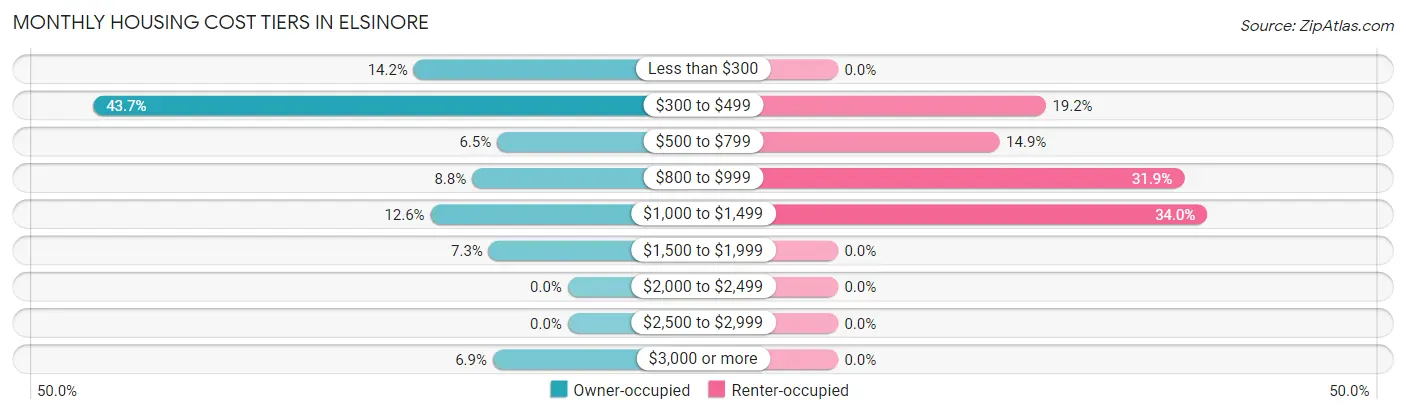
| Monthly Cost | Owner-occupied | Renter-occupied |
| Less than $300 | 37 (14.2%) | 0 (0.0%) |
| $300 to $499 | 114 (43.7%) | 9 (19.2%) |
| $500 to $799 | 17 (6.5%) | 7 (14.9%) |
| $800 to $999 | 23 (8.8%) | 15 (31.9%) |
| $1,000 to $1,499 | 33 (12.6%) | 16 (34.0%) |
| $1,500 to $1,999 | 19 (7.3%) | 0 (0.0%) |
| $2,000 to $2,499 | 0 (0.0%) | 0 (0.0%) |
| $2,500 to $2,999 | 0 (0.0%) | 0 (0.0%) |
| $3,000 or more | 18 (6.9%) | 0 (0.0%) |
| Total | 261 (100.0%) | 47 (100.0%) |
Physical Housing Characteristics in Elsinore
Housing Structures in Elsinore
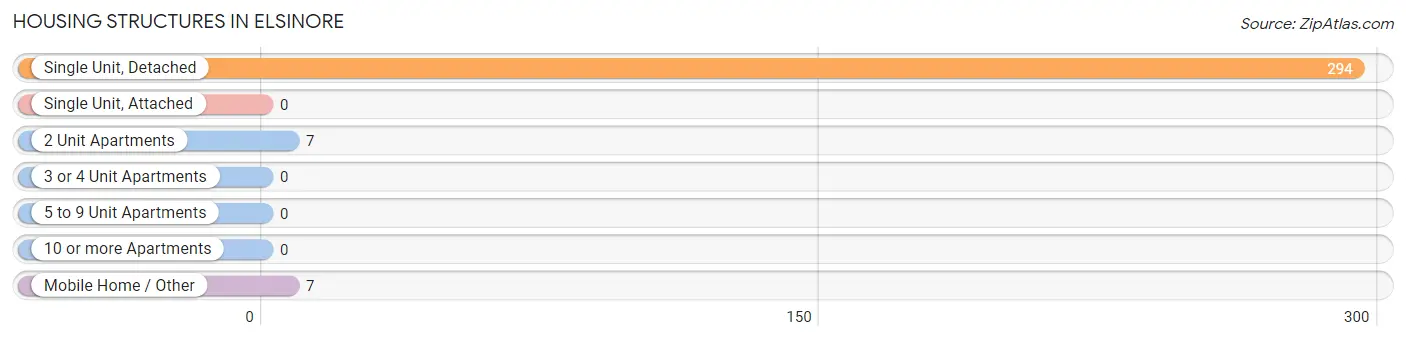
| Structure Type | # Housing Units | % Housing Units |
| Single Unit, Detached | 294 | 95.5% |
| Single Unit, Attached | 0 | 0.0% |
| 2 Unit Apartments | 7 | 2.3% |
| 3 or 4 Unit Apartments | 0 | 0.0% |
| 5 to 9 Unit Apartments | 0 | 0.0% |
| 10 or more Apartments | 0 | 0.0% |
| Mobile Home / Other | 7 | 2.3% |
| Total | 308 | 100.0% |
Housing Structures by Occupancy in Elsinore
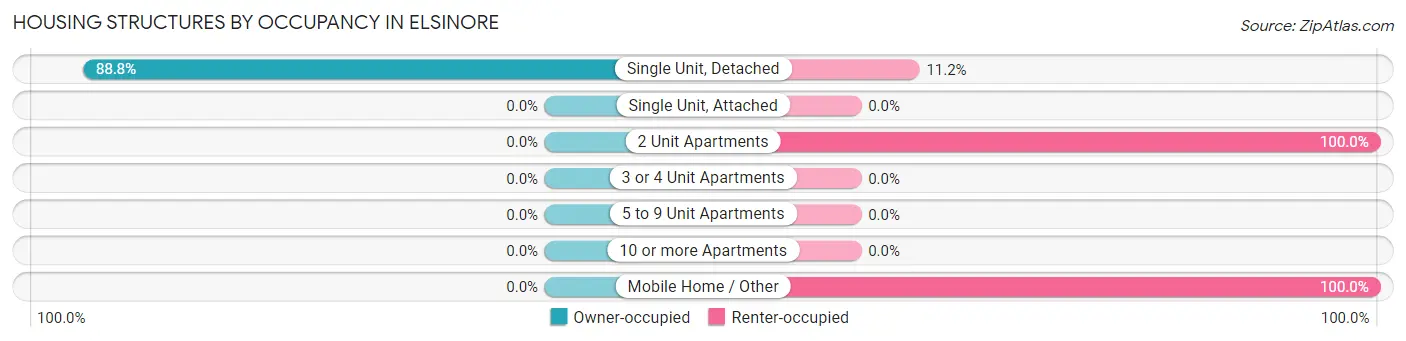
| Structure Type | Owner-occupied | Renter-occupied |
| Single Unit, Detached | 261 (88.8%) | 33 (11.2%) |
| Single Unit, Attached | 0 (0.0%) | 0 (0.0%) |
| 2 Unit Apartments | 0 (0.0%) | 7 (100.0%) |
| 3 or 4 Unit Apartments | 0 (0.0%) | 0 (0.0%) |
| 5 to 9 Unit Apartments | 0 (0.0%) | 0 (0.0%) |
| 10 or more Apartments | 0 (0.0%) | 0 (0.0%) |
| Mobile Home / Other | 0 (0.0%) | 7 (100.0%) |
| Total | 261 (84.7%) | 47 (15.3%) |
Housing Structures by Number of Rooms in Elsinore
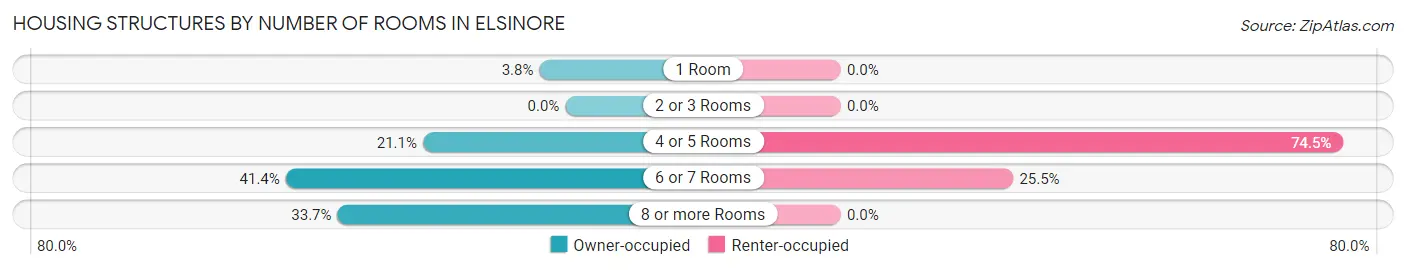
| Number of Rooms | Owner-occupied | Renter-occupied |
| 1 Room | 10 (3.8%) | 0 (0.0%) |
| 2 or 3 Rooms | 0 (0.0%) | 0 (0.0%) |
| 4 or 5 Rooms | 55 (21.1%) | 35 (74.5%) |
| 6 or 7 Rooms | 108 (41.4%) | 12 (25.5%) |
| 8 or more Rooms | 88 (33.7%) | 0 (0.0%) |
| Total | 261 (100.0%) | 47 (100.0%) |
Housing Structure by Heating Type in Elsinore
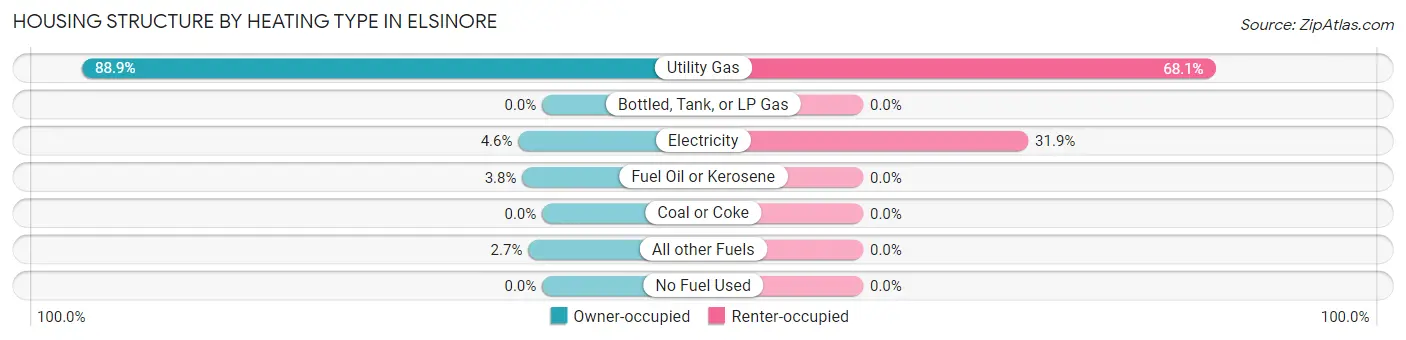
| Heating Type | Owner-occupied | Renter-occupied |
| Utility Gas | 232 (88.9%) | 32 (68.1%) |
| Bottled, Tank, or LP Gas | 0 (0.0%) | 0 (0.0%) |
| Electricity | 12 (4.6%) | 15 (31.9%) |
| Fuel Oil or Kerosene | 10 (3.8%) | 0 (0.0%) |
| Coal or Coke | 0 (0.0%) | 0 (0.0%) |
| All other Fuels | 7 (2.7%) | 0 (0.0%) |
| No Fuel Used | 0 (0.0%) | 0 (0.0%) |
| Total | 261 (100.0%) | 47 (100.0%) |
Household Vehicle Usage in Elsinore
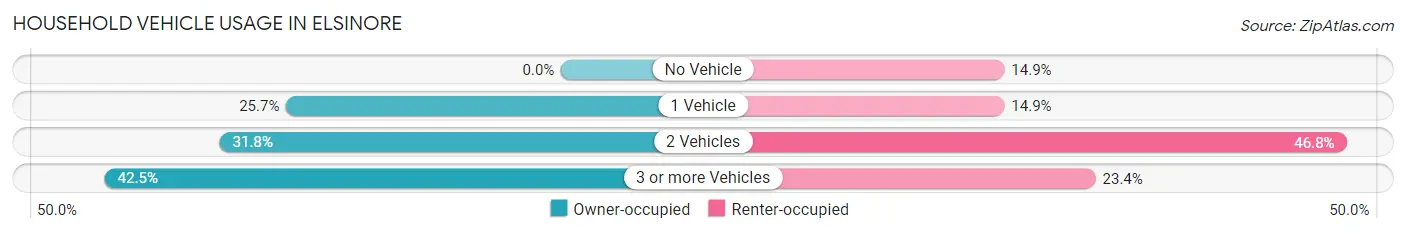
| Vehicles per Household | Owner-occupied | Renter-occupied |
| No Vehicle | 0 (0.0%) | 7 (14.9%) |
| 1 Vehicle | 67 (25.7%) | 7 (14.9%) |
| 2 Vehicles | 83 (31.8%) | 22 (46.8%) |
| 3 or more Vehicles | 111 (42.5%) | 11 (23.4%) |
| Total | 261 (100.0%) | 47 (100.0%) |
Real Estate & Mortgages in Elsinore
Real Estate and Mortgage Overview in Elsinore
| Characteristic | Without Mortgage | With Mortgage |
| Housing Units | 156 | 105 |
| Median Property Value | $223,900 | $208,300 |
| Median Household Income | $44,545 | $0 |
| Monthly Housing Costs | $332 | $18 |
| Real Estate Taxes | $1,245 | $0 |
Property Value by Mortgage Status in Elsinore
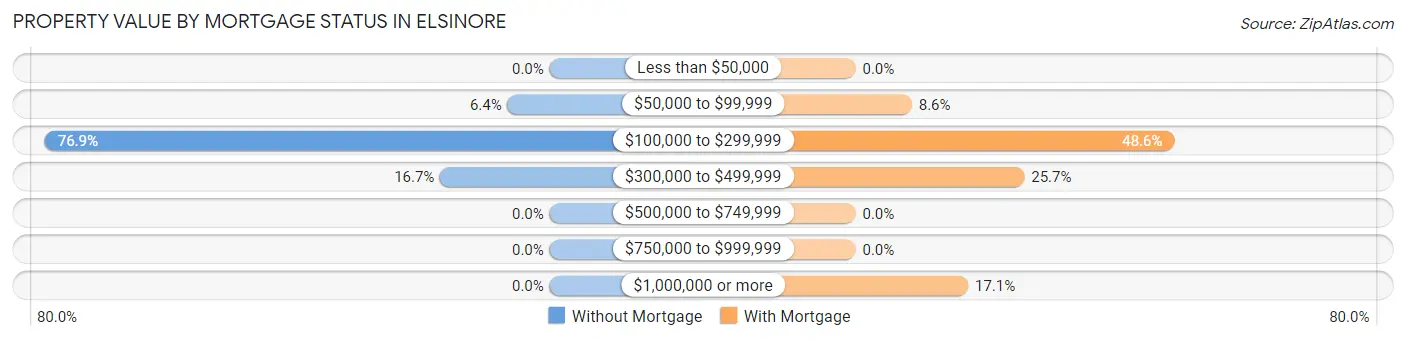
| Property Value | Without Mortgage | With Mortgage |
| Less than $50,000 | 0 (0.0%) | 0 (0.0%) |
| $50,000 to $99,999 | 10 (6.4%) | 9 (8.6%) |
| $100,000 to $299,999 | 120 (76.9%) | 51 (48.6%) |
| $300,000 to $499,999 | 26 (16.7%) | 27 (25.7%) |
| $500,000 to $749,999 | 0 (0.0%) | 0 (0.0%) |
| $750,000 to $999,999 | 0 (0.0%) | 0 (0.0%) |
| $1,000,000 or more | 0 (0.0%) | 18 (17.1%) |
| Total | 156 (100.0%) | 105 (100.0%) |
Household Income by Mortgage Status in Elsinore
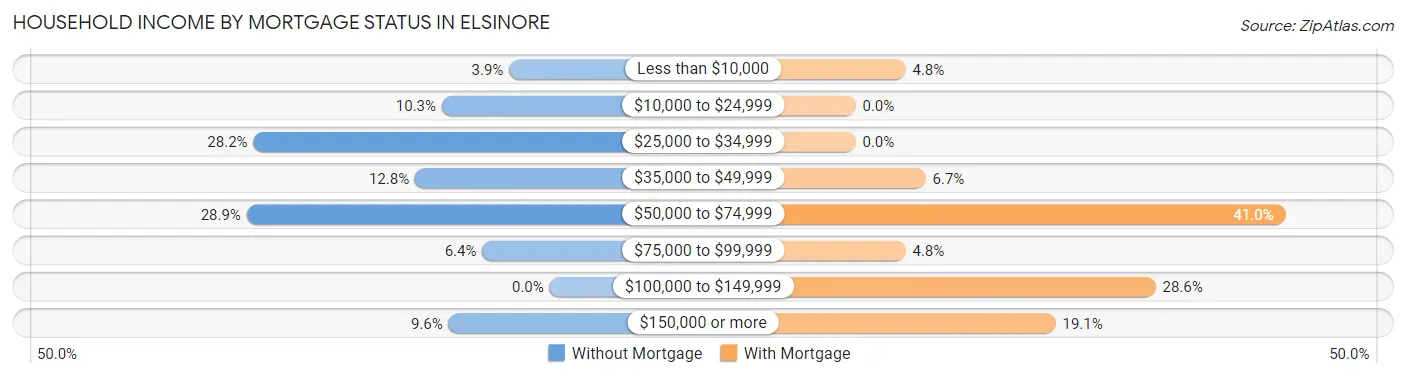
| Household Income | Without Mortgage | With Mortgage |
| Less than $10,000 | 6 (3.8%) | 5 (4.8%) |
| $10,000 to $24,999 | 16 (10.3%) | 0 (0.0%) |
| $25,000 to $34,999 | 44 (28.2%) | 0 (0.0%) |
| $35,000 to $49,999 | 20 (12.8%) | 7 (6.7%) |
| $50,000 to $74,999 | 45 (28.8%) | 43 (40.9%) |
| $75,000 to $99,999 | 10 (6.4%) | 5 (4.8%) |
| $100,000 to $149,999 | 0 (0.0%) | 30 (28.6%) |
| $150,000 or more | 15 (9.6%) | 20 (19.1%) |
| Total | 156 (100.0%) | 105 (100.0%) |
Property Value to Household Income Ratio in Elsinore
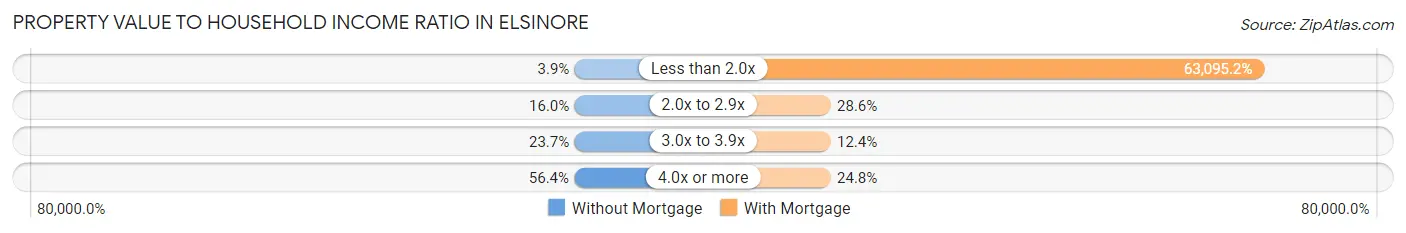
| Value-to-Income Ratio | Without Mortgage | With Mortgage |
| Less than 2.0x | 6 (3.8%) | 66,250 (63,095.2%) |
| 2.0x to 2.9x | 25 (16.0%) | 30 (28.6%) |
| 3.0x to 3.9x | 37 (23.7%) | 13 (12.4%) |
| 4.0x or more | 88 (56.4%) | 26 (24.8%) |
| Total | 156 (100.0%) | 105 (100.0%) |
Real Estate Taxes by Mortgage Status in Elsinore
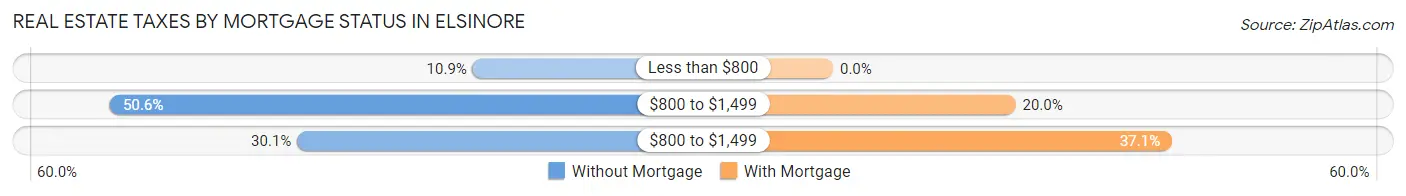
| Property Taxes | Without Mortgage | With Mortgage |
| Less than $800 | 17 (10.9%) | 0 (0.0%) |
| $800 to $1,499 | 79 (50.6%) | 21 (20.0%) |
| $800 to $1,499 | 47 (30.1%) | 39 (37.1%) |
| Total | 156 (100.0%) | 105 (100.0%) |
Health & Disability in Elsinore
Health Insurance Coverage by Age in Elsinore
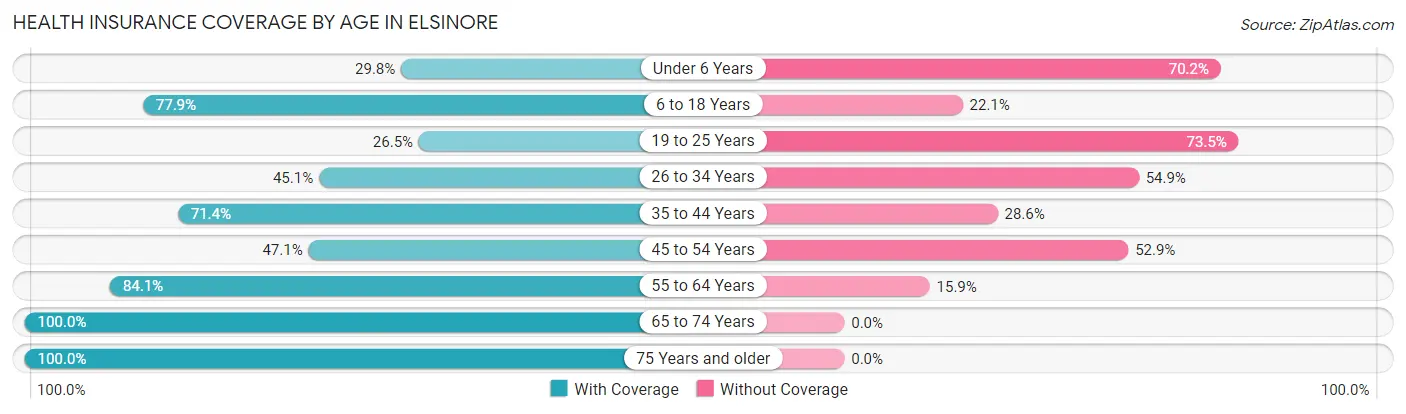
| Age Bracket | With Coverage | Without Coverage |
| Under 6 Years | 14 (29.8%) | 33 (70.2%) |
| 6 to 18 Years | 106 (77.9%) | 30 (22.1%) |
| 19 to 25 Years | 9 (26.5%) | 25 (73.5%) |
| 26 to 34 Years | 23 (45.1%) | 28 (54.9%) |
| 35 to 44 Years | 55 (71.4%) | 22 (28.6%) |
| 45 to 54 Years | 40 (47.1%) | 45 (52.9%) |
| 55 to 64 Years | 74 (84.1%) | 14 (15.9%) |
| 65 to 74 Years | 132 (100.0%) | 0 (0.0%) |
| 75 Years and older | 131 (100.0%) | 0 (0.0%) |
| Total | 584 (74.8%) | 197 (25.2%) |
Health Insurance Coverage by Citizenship Status in Elsinore
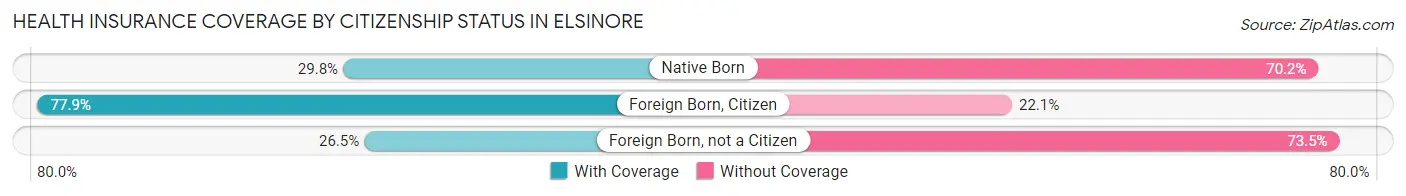
| Citizenship Status | With Coverage | Without Coverage |
| Native Born | 14 (29.8%) | 33 (70.2%) |
| Foreign Born, Citizen | 106 (77.9%) | 30 (22.1%) |
| Foreign Born, not a Citizen | 9 (26.5%) | 25 (73.5%) |
Health Insurance Coverage by Household Income in Elsinore
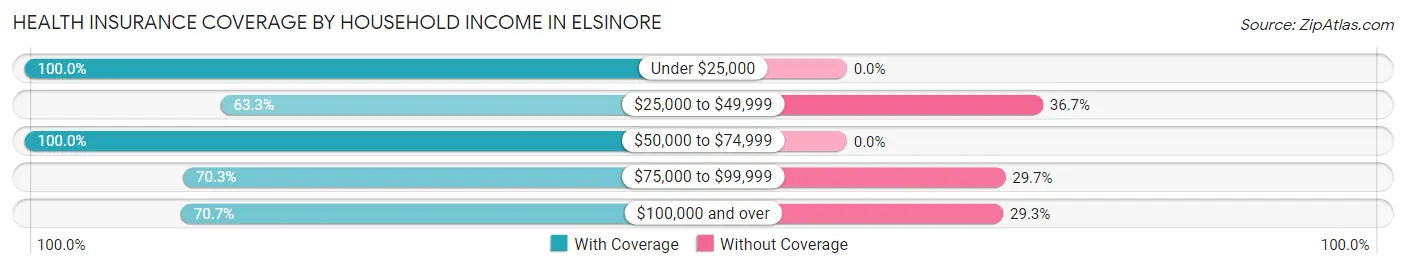
| Household Income | With Coverage | Without Coverage |
| Under $25,000 | 42 (100.0%) | 0 (0.0%) |
| $25,000 to $49,999 | 174 (63.3%) | 101 (36.7%) |
| $50,000 to $74,999 | 138 (100.0%) | 0 (0.0%) |
| $75,000 to $99,999 | 90 (70.3%) | 38 (29.7%) |
| $100,000 and over | 140 (70.7%) | 58 (29.3%) |
Public vs Private Health Insurance Coverage by Age in Elsinore
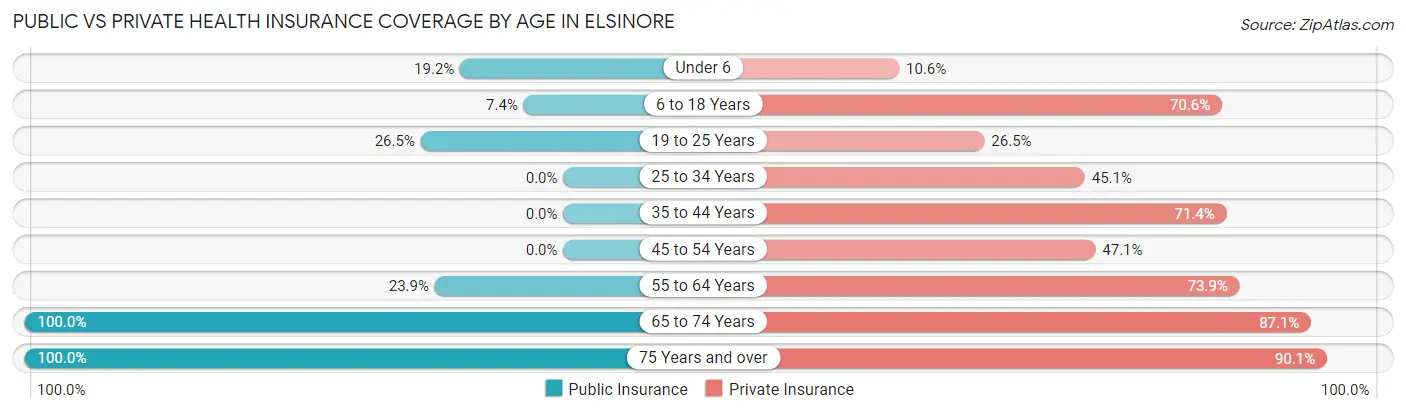
| Age Bracket | Public Insurance | Private Insurance |
| Under 6 | 9 (19.2%) | 5 (10.6%) |
| 6 to 18 Years | 10 (7.3%) | 96 (70.6%) |
| 19 to 25 Years | 9 (26.5%) | 9 (26.5%) |
| 25 to 34 Years | 0 (0.0%) | 23 (45.1%) |
| 35 to 44 Years | 0 (0.0%) | 55 (71.4%) |
| 45 to 54 Years | 0 (0.0%) | 40 (47.1%) |
| 55 to 64 Years | 21 (23.9%) | 65 (73.9%) |
| 65 to 74 Years | 132 (100.0%) | 115 (87.1%) |
| 75 Years and over | 131 (100.0%) | 118 (90.1%) |
| Total | 312 (40.0%) | 526 (67.3%) |
Disability Status by Sex by Age in Elsinore
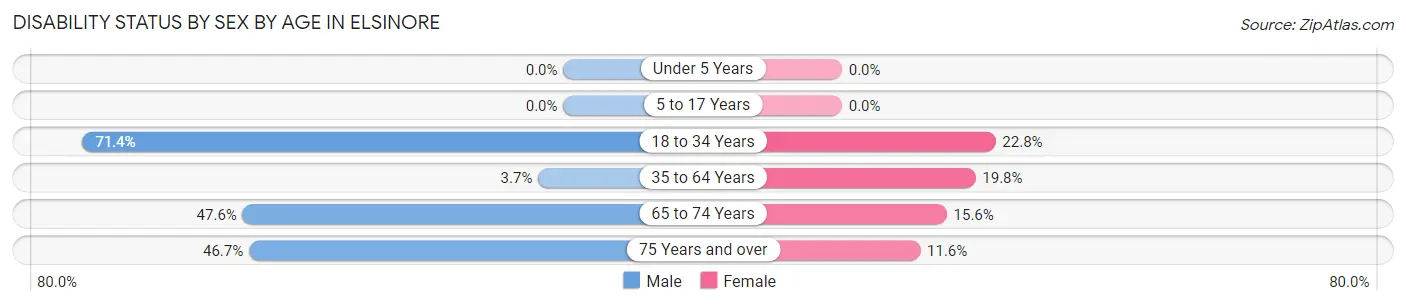
| Age Bracket | Male | Female |
| Under 5 Years | 0 (0.0%) | 0 (0.0%) |
| 5 to 17 Years | 0 (0.0%) | 0 (0.0%) |
| 18 to 34 Years | 20 (71.4%) | 13 (22.8%) |
| 35 to 64 Years | 5 (3.7%) | 23 (19.8%) |
| 65 to 74 Years | 20 (47.6%) | 14 (15.6%) |
| 75 Years and over | 21 (46.7%) | 10 (11.6%) |
Disability Class by Sex by Age in Elsinore
Disability Class: Hearing Difficulty
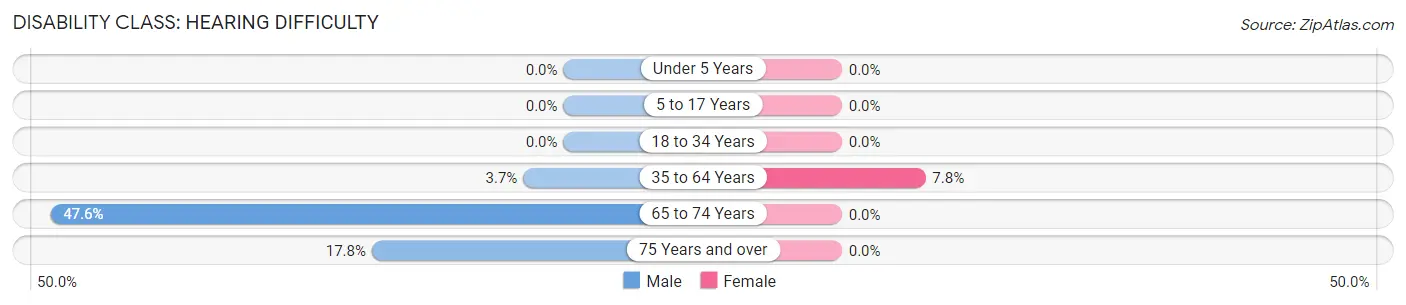
| Age Bracket | Male | Female |
| Under 5 Years | 0 (0.0%) | 0 (0.0%) |
| 5 to 17 Years | 0 (0.0%) | 0 (0.0%) |
| 18 to 34 Years | 0 (0.0%) | 0 (0.0%) |
| 35 to 64 Years | 5 (3.7%) | 9 (7.8%) |
| 65 to 74 Years | 20 (47.6%) | 0 (0.0%) |
| 75 Years and over | 8 (17.8%) | 0 (0.0%) |
Disability Class: Vision Difficulty
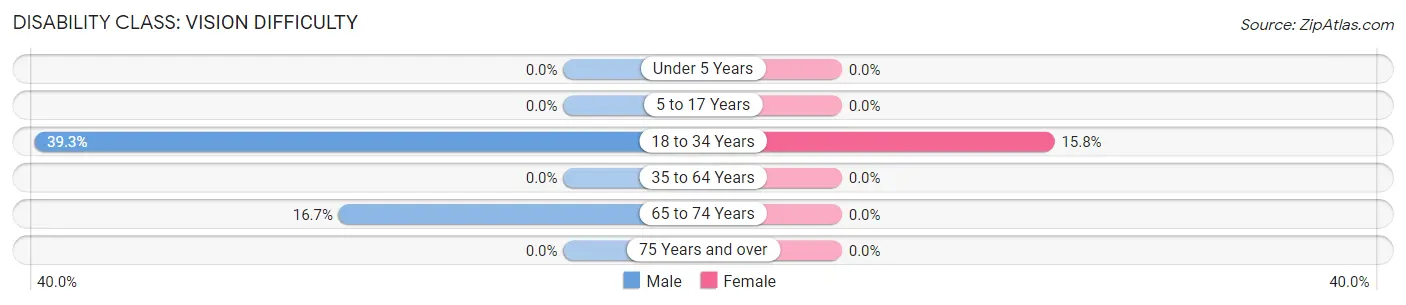
| Age Bracket | Male | Female |
| Under 5 Years | 0 (0.0%) | 0 (0.0%) |
| 5 to 17 Years | 0 (0.0%) | 0 (0.0%) |
| 18 to 34 Years | 11 (39.3%) | 9 (15.8%) |
| 35 to 64 Years | 0 (0.0%) | 0 (0.0%) |
| 65 to 74 Years | 7 (16.7%) | 0 (0.0%) |
| 75 Years and over | 0 (0.0%) | 0 (0.0%) |
Disability Class: Cognitive Difficulty
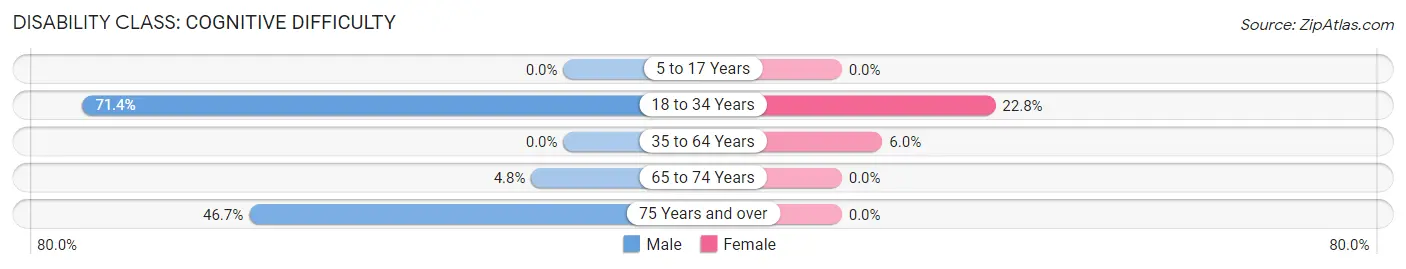
| Age Bracket | Male | Female |
| 5 to 17 Years | 0 (0.0%) | 0 (0.0%) |
| 18 to 34 Years | 20 (71.4%) | 13 (22.8%) |
| 35 to 64 Years | 0 (0.0%) | 7 (6.0%) |
| 65 to 74 Years | 2 (4.8%) | 0 (0.0%) |
| 75 Years and over | 21 (46.7%) | 0 (0.0%) |
Disability Class: Ambulatory Difficulty
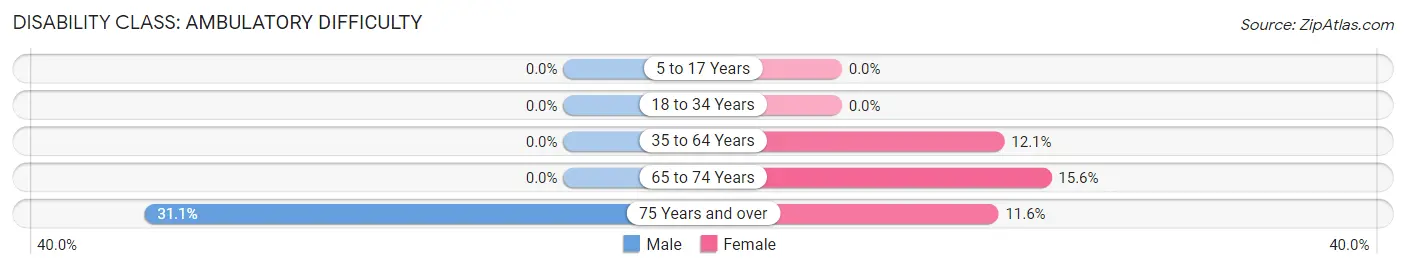
| Age Bracket | Male | Female |
| 5 to 17 Years | 0 (0.0%) | 0 (0.0%) |
| 18 to 34 Years | 0 (0.0%) | 0 (0.0%) |
| 35 to 64 Years | 0 (0.0%) | 14 (12.1%) |
| 65 to 74 Years | 0 (0.0%) | 14 (15.6%) |
| 75 Years and over | 14 (31.1%) | 10 (11.6%) |
Disability Class: Self-Care Difficulty
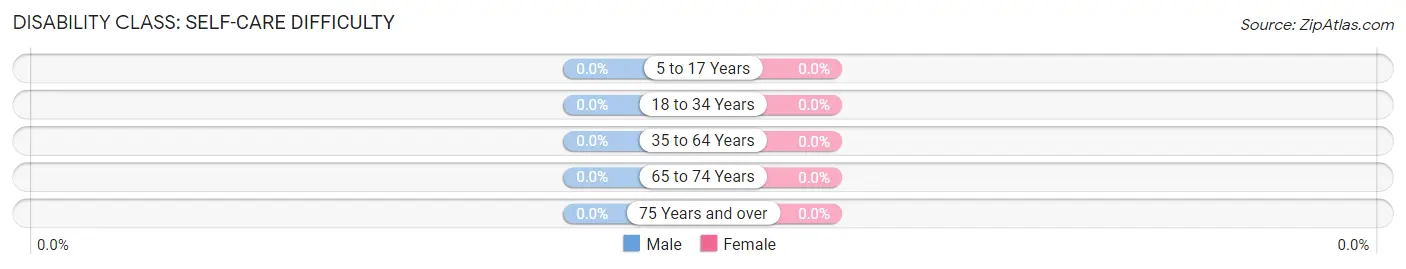
| Age Bracket | Male | Female |
| 5 to 17 Years | 0 (0.0%) | 0 (0.0%) |
| 18 to 34 Years | 0 (0.0%) | 0 (0.0%) |
| 35 to 64 Years | 0 (0.0%) | 0 (0.0%) |
| 65 to 74 Years | 0 (0.0%) | 0 (0.0%) |
| 75 Years and over | 0 (0.0%) | 0 (0.0%) |
Technology Access in Elsinore
Computing Device Access in Elsinore
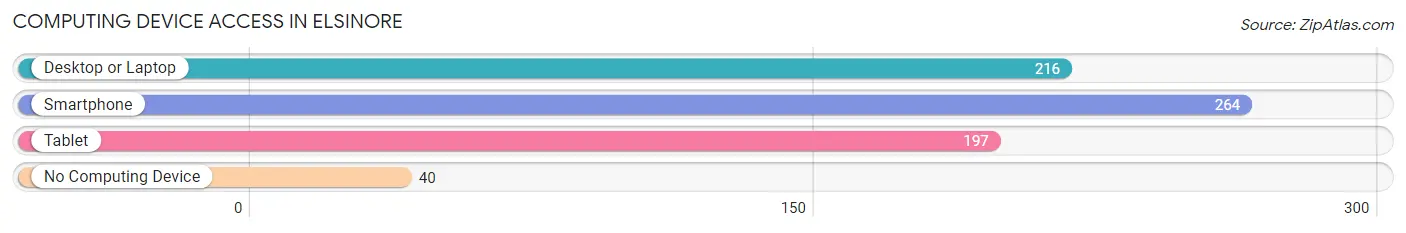
| Device Type | # Households | % Households |
| Desktop or Laptop | 216 | 70.1% |
| Smartphone | 264 | 85.7% |
| Tablet | 197 | 64.0% |
| No Computing Device | 40 | 13.0% |
| Total | 308 | 100.0% |
Internet Access in Elsinore
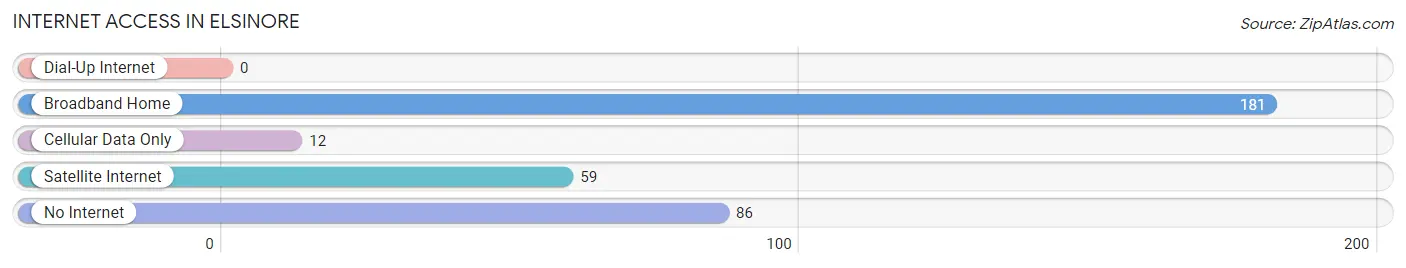
| Internet Type | # Households | % Households |
| Dial-Up Internet | 0 | 0.0% |
| Broadband Home | 181 | 58.8% |
| Cellular Data Only | 12 | 3.9% |
| Satellite Internet | 59 | 19.2% |
| No Internet | 86 | 27.9% |
| Total | 308 | 100.0% |
Elsinore Summary
Elsinore, Utah is a small town located in the south-central part of the state, in the Sevier County. It is situated at the base of the Wasatch Mountains, and is surrounded by the towns of Richfield, Monroe, and Salina. The town has a population of approximately 1,000 people, and is known for its rural atmosphere and small-town charm.
History
Elsinore was first settled in 1876 by a group of Mormon pioneers led by John W. Young. The town was named after the castle in William Shakespeare’s play, Hamlet. The town was originally a farming community, and the settlers grew wheat, corn, and other crops. In the early 1900s, the town began to grow and develop, and the first school was built in 1910.
In the 1920s, the town began to experience a population boom, and the population grew to over 1,000 people. During this time, the town was home to several businesses, including a bank, a hotel, a movie theater, and a general store. The town also had a post office, a library, and a newspaper.
In the 1950s, the town began to decline, and the population dropped to around 500 people. The decline was due to the closure of the railroad, which had been the main source of transportation for the town. In the 1970s, the town began to experience a resurgence, and the population began to grow again.
Geography
Elsinore is located in the south-central part of Utah, in the Sevier County. It is situated at the base of the Wasatch Mountains, and is surrounded by the towns of Richfield, Monroe, and Salina. The town is located at an elevation of 5,000 feet, and has a total area of 1.2 square miles.
The town is located in a semi-arid climate, and experiences hot summers and cold winters. The average temperature in the summer is around 80 degrees Fahrenheit, and the average temperature in the winter is around 30 degrees Fahrenheit. The town receives an average of 12 inches of precipitation per year.
Economy
The economy of Elsinore is largely based on agriculture and tourism. The town is home to several farms, which produce a variety of crops, including wheat, corn, and hay. The town is also home to several tourist attractions, including the Elsinore Valley Museum, the Elsinore Valley Golf Course, and the Elsinore Valley Wildlife Refuge.
The town is also home to several businesses, including a bank, a hotel, a movie theater, and a general store. The town also has a post office, a library, and a newspaper.
Demographics
As of the 2010 census, the population of Elsinore was 1,000 people. The racial makeup of the town was 97.2% White, 0.7% Native American, 0.3% Asian, 0.2% from other races, and 1.6% from two or more races. The median household income was $37,500, and the median family income was $41,250.
The town is home to several churches, including the Church of Jesus Christ of Latter-day Saints, the United Methodist Church, and the Church of the Nazarene. The town also has a public library, a post office, and a newspaper.
Conclusion
Elsinore, Utah is a small town located in the south-central part of the state, in the Sevier County. It is situated at the base of the Wasatch Mountains, and is surrounded by the towns of Richfield, Monroe, and Salina. The town has a population of approximately 1,000 people, and is known for its rural atmosphere and small-town charm. The economy of Elsinore is largely based on agriculture and tourism, and the town is home to several businesses, churches, and tourist attractions. The racial makeup of the town is 97.2% White, 0.7% Native American, 0.3% Asian, 0.2% from other races, and 1.6% from two or more races. The median household income was $37,500, and the median family income was $41,250.
Common Questions
What is Per Capita Income in Elsinore?
Per Capita income in Elsinore is $24,696.
What is the Median Family Income in Elsinore?
Median Family Income in Elsinore is $62,917.
What is the Median Household income in Elsinore?
Median Household Income in Elsinore is $53,929.
What is Income or Wage Gap in Elsinore?
Income or Wage Gap in Elsinore is 43.1%.
Women in Elsinore earn 56.9 cents for every dollar earned by a man.
What is Inequality or Gini Index in Elsinore?
Inequality or Gini Index in Elsinore is 0.34.
What is the Total Population of Elsinore?
Total Population of Elsinore is 788.
What is the Total Male Population of Elsinore?
Total Male Population of Elsinore is 323.
What is the Total Female Population of Elsinore?
Total Female Population of Elsinore is 465.
What is the Ratio of Males per 100 Females in Elsinore?
There are 69.46 Males per 100 Females in Elsinore.
What is the Ratio of Females per 100 Males in Elsinore?
There are 143.96 Females per 100 Males in Elsinore.
What is the Median Population Age in Elsinore?
Median Population Age in Elsinore is 50.4 Years.
What is the Average Family Size in Elsinore
Average Family Size in Elsinore is 2.9 People.
What is the Average Household Size in Elsinore
Average Household Size in Elsinore is 2.6 People.
How Large is the Labor Force in Elsinore?
There are 281 People in the Labor Forcein in Elsinore.
What is the Percentage of People in the Labor Force in Elsinore?
46.2% of People are in the Labor Force in Elsinore.
What is the Unemployment Rate in Elsinore?
Unemployment Rate in Elsinore is 10.6%.