Marion, SC Map & Demographics
Marion Map
Marion Overview
$20,851
PER CAPITA INCOME
$30,714
AVG FAMILY INCOME
$28,551
AVG HOUSEHOLD INCOME
5.0%
WAGE / INCOME GAP [ % ]
95.0¢/ $1
WAGE / INCOME GAP [ $ ]
0.53
INEQUALITY / GINI INDEX
6,402
TOTAL POPULATION
2,937
MALE POPULATION
3,465
FEMALE POPULATION
84.76
MALES / 100 FEMALES
117.98
FEMALES / 100 MALES
44.6
MEDIAN AGE
2.9
AVG FAMILY SIZE
2.5
AVG HOUSEHOLD SIZE
2,407
LABOR FORCE [ PEOPLE ]
45.6%
PERCENT IN LABOR FORCE
5.6%
UNEMPLOYMENT RATE
Marion Zip Codes
Marion Area Codes
Income in Marion
Income Overview in Marion
Per Capita Income in Marion is $20,851, while median incomes of families and households are $30,714 and $28,551 respectively.
| Characteristic | Number | Measure |
| Per Capita Income | 6,402 | $20,851 |
| Median Family Income | 1,602 | $30,714 |
| Mean Family Income | 1,602 | $59,622 |
| Median Household Income | 2,573 | $28,551 |
| Mean Household Income | 2,573 | $48,819 |
| Income Deficit | 1,602 | $0 |
| Wage / Income Gap (%) | 6,402 | 5.00% |
| Wage / Income Gap ($) | 6,402 | 95.00¢ per $1 |
| Gini / Inequality Index | 6,402 | 0.53 |
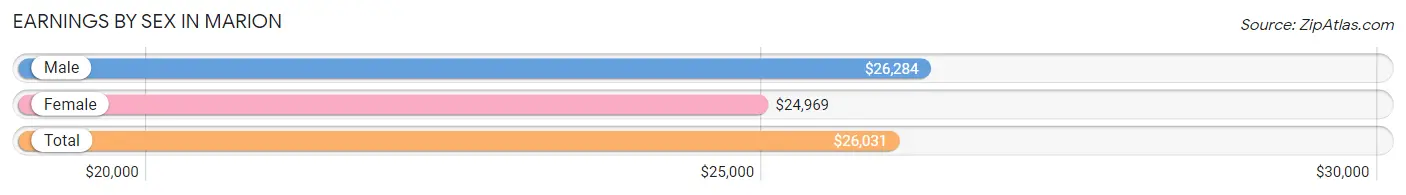
Earnings by Sex in Marion
Average Earnings in Marion are $26,031, $26,284 for men and $24,969 for women, a difference of 5.0%.
| Sex | Number | Average Earnings |
| Male | 1,326 (53.5%) | $26,284 |
| Female | 1,151 (46.5%) | $24,969 |
| Total | 2,477 (100.0%) | $26,031 |
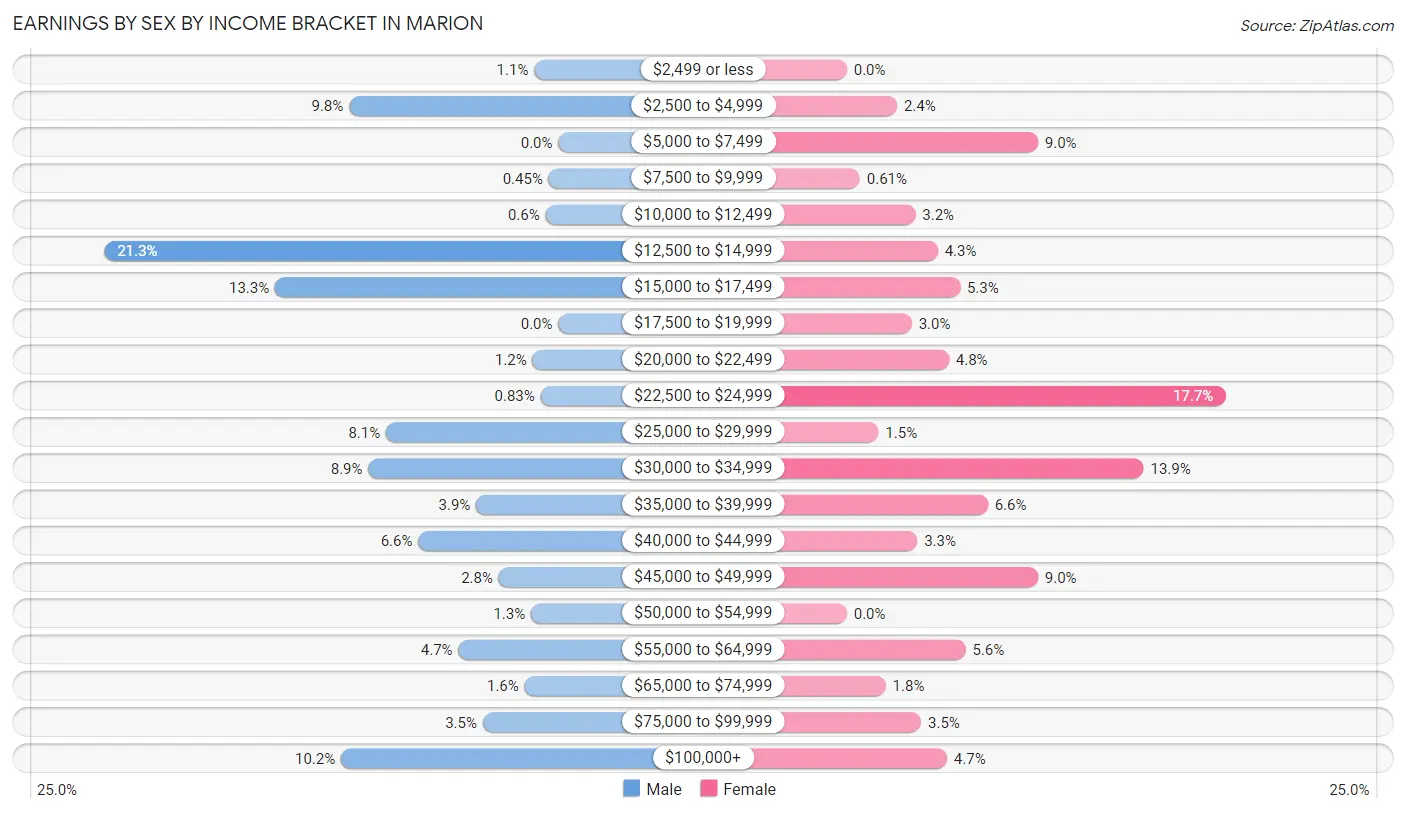
Earnings by Sex by Income Bracket in Marion
The most common earnings brackets in Marion are $12,500 to $14,999 for men (282 | 21.3%) and $22,500 to $24,999 for women (204 | 17.7%).
| Income | Male | Female |
| $2,499 or less | 15 (1.1%) | 0 (0.0%) |
| $2,500 to $4,999 | 130 (9.8%) | 27 (2.4%) |
| $5,000 to $7,499 | 0 (0.0%) | 103 (8.9%) |
| $7,500 to $9,999 | 6 (0.4%) | 7 (0.6%) |
| $10,000 to $12,499 | 8 (0.6%) | 37 (3.2%) |
| $12,500 to $14,999 | 282 (21.3%) | 49 (4.3%) |
| $15,000 to $17,499 | 176 (13.3%) | 61 (5.3%) |
| $17,500 to $19,999 | 0 (0.0%) | 35 (3.0%) |
| $20,000 to $22,499 | 16 (1.2%) | 55 (4.8%) |
| $22,500 to $24,999 | 11 (0.8%) | 204 (17.7%) |
| $25,000 to $29,999 | 107 (8.1%) | 17 (1.5%) |
| $30,000 to $34,999 | 118 (8.9%) | 160 (13.9%) |
| $35,000 to $39,999 | 51 (3.8%) | 76 (6.6%) |
| $40,000 to $44,999 | 87 (6.6%) | 38 (3.3%) |
| $45,000 to $49,999 | 37 (2.8%) | 103 (8.9%) |
| $50,000 to $54,999 | 17 (1.3%) | 0 (0.0%) |
| $55,000 to $64,999 | 62 (4.7%) | 64 (5.6%) |
| $65,000 to $74,999 | 21 (1.6%) | 21 (1.8%) |
| $75,000 to $99,999 | 47 (3.5%) | 40 (3.5%) |
| $100,000+ | 135 (10.2%) | 54 (4.7%) |
| Total | 1,326 (100.0%) | 1,151 (100.0%) |
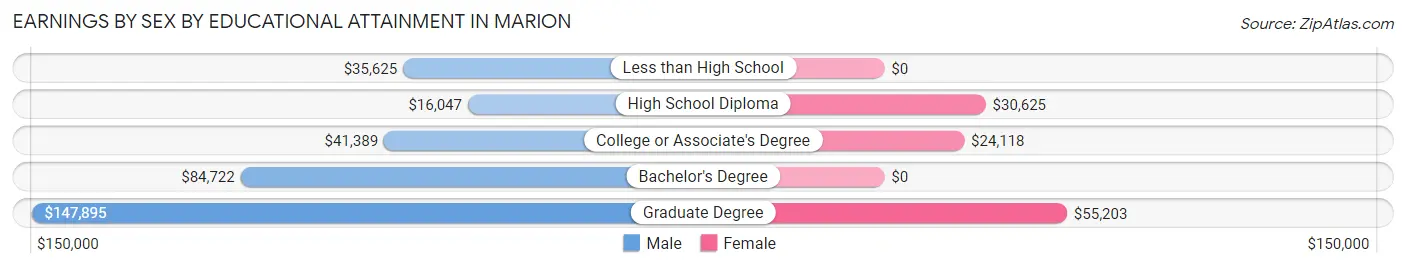
Earnings by Sex by Educational Attainment in Marion
Average earnings in Marion are $26,959 for men and $30,502 for women, a difference of 11.6%. Men with an educational attainment of graduate degree enjoy the highest average annual earnings of $147,895, while those with high school diploma education earn the least with $16,047. Women with an educational attainment of graduate degree earn the most with the average annual earnings of $55,203, while those with college or associate's degree education have the smallest earnings of $24,118.
| Educational Attainment | Male Income | Female Income |
| Less than High School | $35,625 | $0 |
| High School Diploma | $16,047 | $30,625 |
| College or Associate's Degree | $41,389 | $24,118 |
| Bachelor's Degree | $84,722 | $0 |
| Graduate Degree | $147,895 | $55,203 |
| Total | $26,959 | $30,502 |
Family Income in Marion
Family Income Brackets in Marion
According to the Marion family income data, there are 335 families falling into the $15,000 to $24,999 income range, which is the most common income bracket and makes up 20.9% of all families. Conversely, the $150,000 to $199,999 income bracket is the least frequent group with only 35 families (2.2%) belonging to this category.
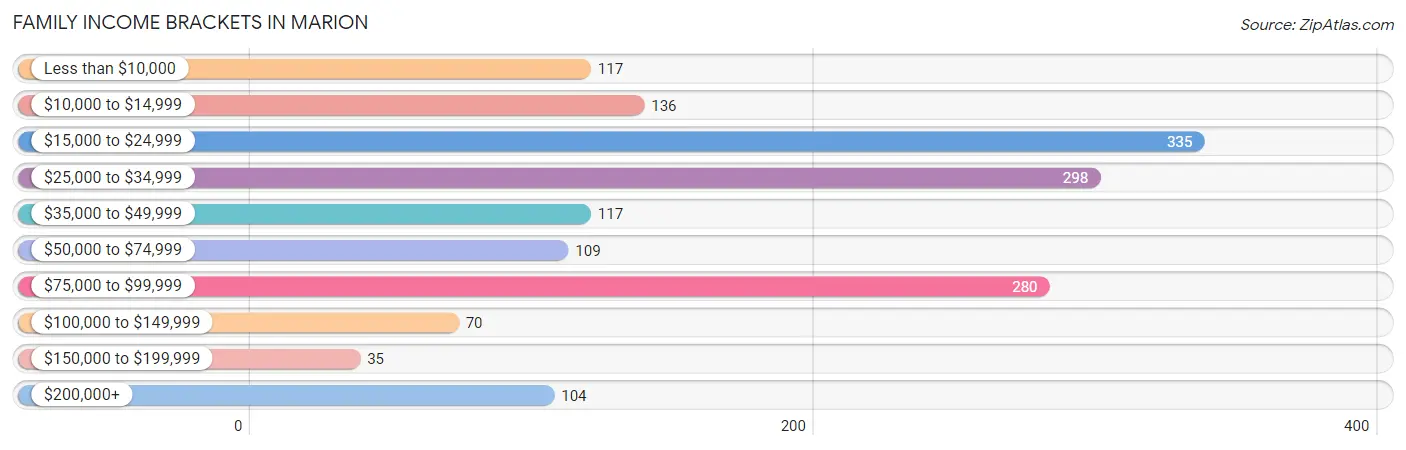
| Income Bracket | # Families | % Families |
| Less than $10,000 | 117 | 7.3% |
| $10,000 to $14,999 | 136 | 8.5% |
| $15,000 to $24,999 | 335 | 20.9% |
| $25,000 to $34,999 | 298 | 18.6% |
| $35,000 to $49,999 | 117 | 7.3% |
| $50,000 to $74,999 | 109 | 6.8% |
| $75,000 to $99,999 | 280 | 17.5% |
| $100,000 to $149,999 | 70 | 4.4% |
| $150,000 to $199,999 | 35 | 2.2% |
| $200,000+ | 104 | 6.5% |
Family Income by Famaliy Size in Marion
5-person families (53 | 3.3%) account for the highest median family income in Marion with $238,487 per family, while 5-person families (53 | 3.3%) have the highest median income of $47,697 per family member.
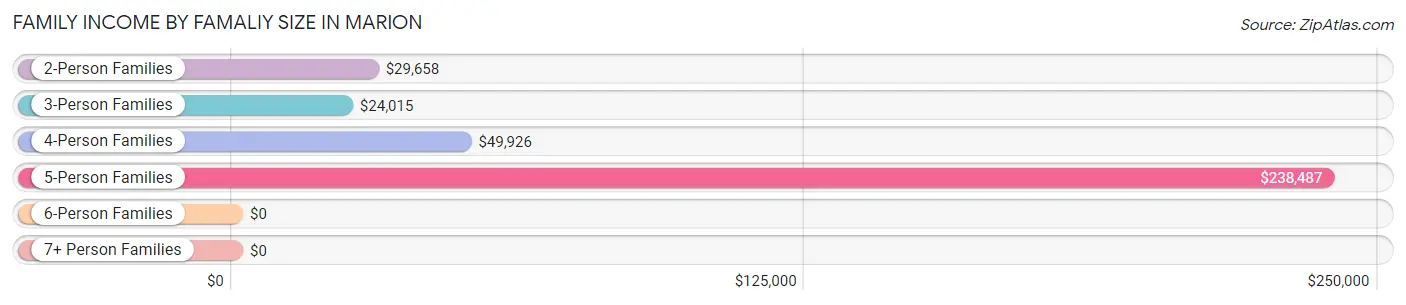
| Income Bracket | # Families | Median Income |
| 2-Person Families | 1,086 (67.8%) | $29,658 |
| 3-Person Families | 254 (15.9%) | $24,015 |
| 4-Person Families | 209 (13.1%) | $49,926 |
| 5-Person Families | 53 (3.3%) | $238,487 |
| 6-Person Families | 0 (0.0%) | $0 |
| 7+ Person Families | 0 (0.0%) | $0 |
| Total | 1,602 (100.0%) | $30,714 |
Family Income by Number of Earners in Marion
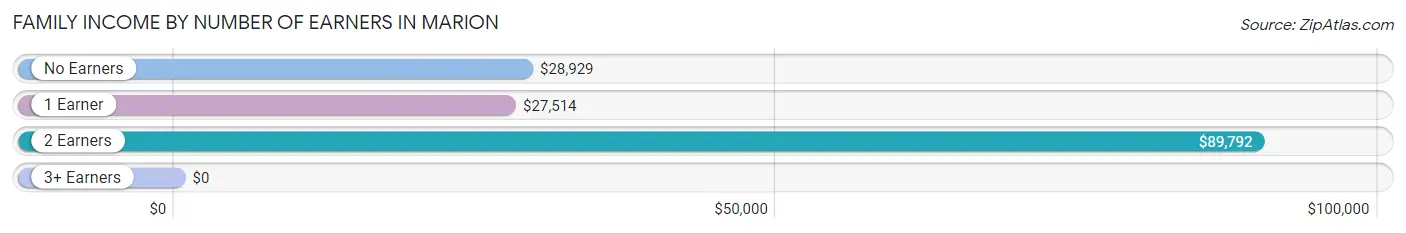
| Number of Earners | # Families | Median Income |
| No Earners | 402 (25.1%) | $28,929 |
| 1 Earner | 784 (48.9%) | $27,514 |
| 2 Earners | 397 (24.8%) | $89,792 |
| 3+ Earners | 19 (1.2%) | $0 |
| Total | 1,602 (100.0%) | $30,714 |
Household Income in Marion
Household Income Brackets in Marion
With 600 households falling in the category, the $15,000 to $24,999 income range is the most frequent in Marion, accounting for 23.3% of all households. In contrast, only 36 households (1.4%) fall into the $150,000 to $199,999 income bracket, making it the least populous group.
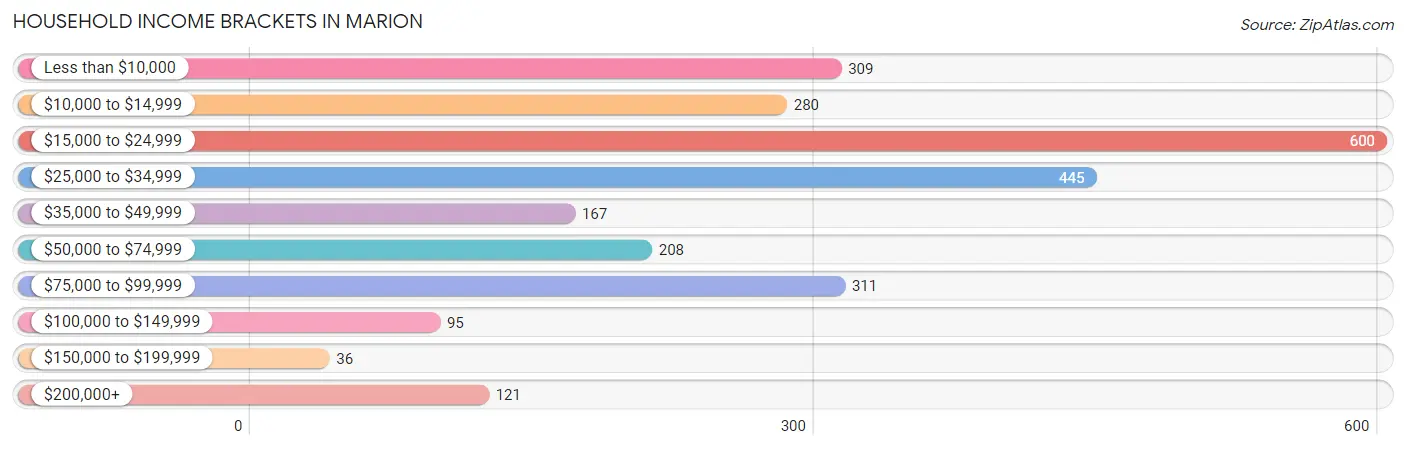
| Income Bracket | # Households | % Households |
| Less than $10,000 | 309 | 12.0% |
| $10,000 to $14,999 | 280 | 10.9% |
| $15,000 to $24,999 | 600 | 23.3% |
| $25,000 to $34,999 | 445 | 17.3% |
| $35,000 to $49,999 | 167 | 6.5% |
| $50,000 to $74,999 | 208 | 8.1% |
| $75,000 to $99,999 | 311 | 12.1% |
| $100,000 to $149,999 | 95 | 3.7% |
| $150,000 to $199,999 | 36 | 1.4% |
| $200,000+ | 121 | 4.7% |
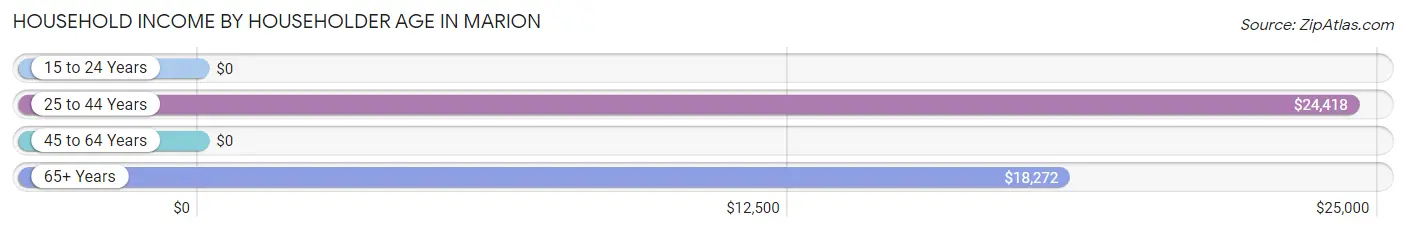
Household Income by Householder Age in Marion
The median household income in Marion is $28,551, with the highest median household income of $24,418 found in the 25 to 44 years age bracket for the primary householder. A total of 595 households (23.1%) fall into this category.
| Income Bracket | # Households | Median Income |
| 15 to 24 Years | 0 (0.0%) | $0 |
| 25 to 44 Years | 595 (23.1%) | $24,418 |
| 45 to 64 Years | 965 (37.5%) | $0 |
| 65+ Years | 1,013 (39.4%) | $18,272 |
| Total | 2,573 (100.0%) | $28,551 |
Poverty in Marion
Income Below Poverty by Sex and Age in Marion
With 30.9% poverty level for males and 30.5% for females among the residents of Marion, under 5 year old males and 25 to 34 year old females are the most vulnerable to poverty, with 130 males (60.2%) and 393 females (61.5%) in their respective age groups living below the poverty level.
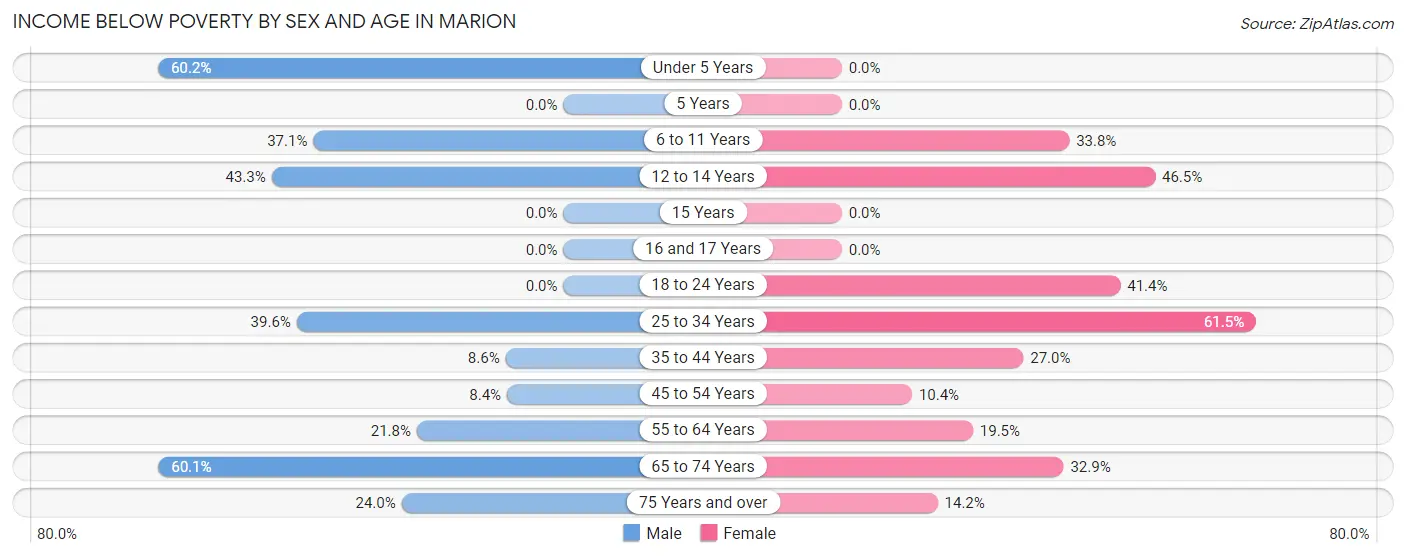
| Age Bracket | Male | Female |
| Under 5 Years | 130 (60.2%) | 0 (0.0%) |
| 5 Years | 0 (0.0%) | 0 (0.0%) |
| 6 to 11 Years | 78 (37.1%) | 103 (33.8%) |
| 12 to 14 Years | 52 (43.3%) | 60 (46.5%) |
| 15 Years | 0 (0.0%) | 0 (0.0%) |
| 16 and 17 Years | 0 (0.0%) | 0 (0.0%) |
| 18 to 24 Years | 0 (0.0%) | 55 (41.3%) |
| 25 to 34 Years | 158 (39.6%) | 393 (61.5%) |
| 35 to 44 Years | 42 (8.6%) | 76 (27.0%) |
| 45 to 54 Years | 31 (8.4%) | 57 (10.4%) |
| 55 to 64 Years | 84 (21.8%) | 87 (19.5%) |
| 65 to 74 Years | 267 (60.1%) | 188 (32.9%) |
| 75 Years and over | 31 (24.0%) | 35 (14.2%) |
| Total | 873 (30.9%) | 1,054 (30.5%) |
Income Above Poverty by Sex and Age in Marion
According to the poverty statistics in Marion, males aged 15 years and females aged under 5 years are the age groups that are most secure financially, with 100.0% of males and 100.0% of females in these age groups living above the poverty line.
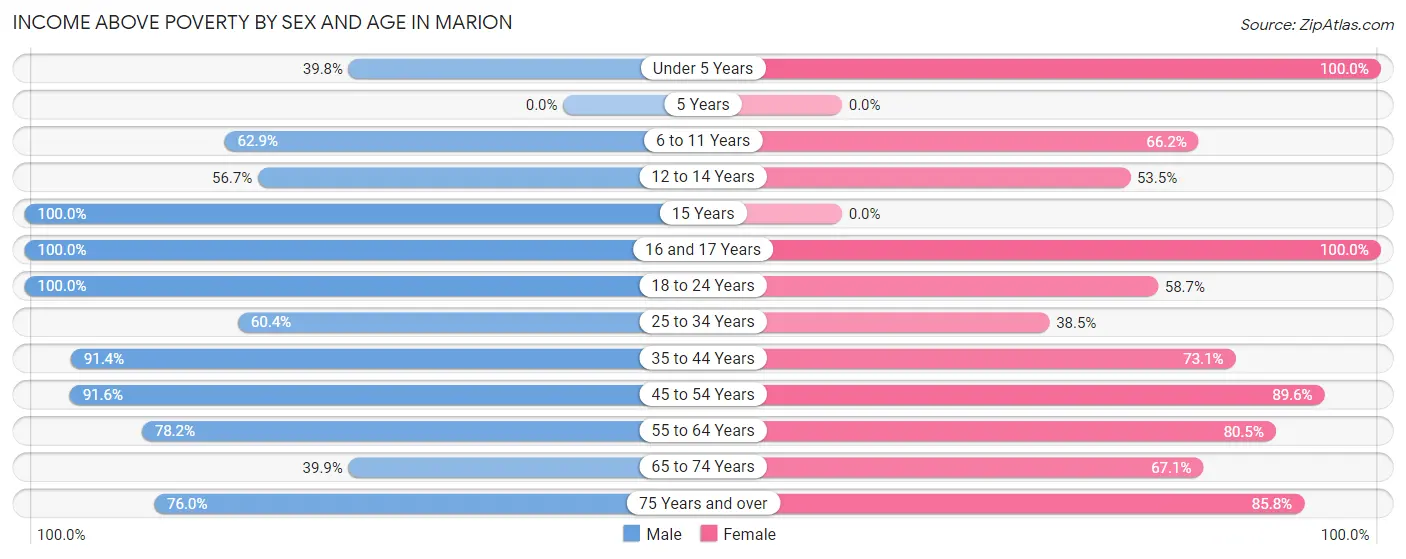
| Age Bracket | Male | Female |
| Under 5 Years | 86 (39.8%) | 14 (100.0%) |
| 5 Years | 0 (0.0%) | 0 (0.0%) |
| 6 to 11 Years | 132 (62.9%) | 202 (66.2%) |
| 12 to 14 Years | 68 (56.7%) | 69 (53.5%) |
| 15 Years | 27 (100.0%) | 0 (0.0%) |
| 16 and 17 Years | 11 (100.0%) | 144 (100.0%) |
| 18 to 24 Years | 20 (100.0%) | 78 (58.7%) |
| 25 to 34 Years | 241 (60.4%) | 246 (38.5%) |
| 35 to 44 Years | 447 (91.4%) | 206 (73.1%) |
| 45 to 54 Years | 339 (91.6%) | 490 (89.6%) |
| 55 to 64 Years | 302 (78.2%) | 360 (80.5%) |
| 65 to 74 Years | 177 (39.9%) | 383 (67.1%) |
| 75 Years and over | 98 (76.0%) | 211 (85.8%) |
| Total | 1,948 (69.1%) | 2,403 (69.5%) |
Income Below Poverty Among Married-Couple Families in Marion
The poverty statistics for married-couple families in Marion show that 14.0% or 86 of the total 614 families live below the poverty line. Families with no children have the highest poverty rate of 18.2%, comprising of 86 families. On the other hand, families with 1 or 2 children have the lowest poverty rate of 0.0%, which includes 0 families.
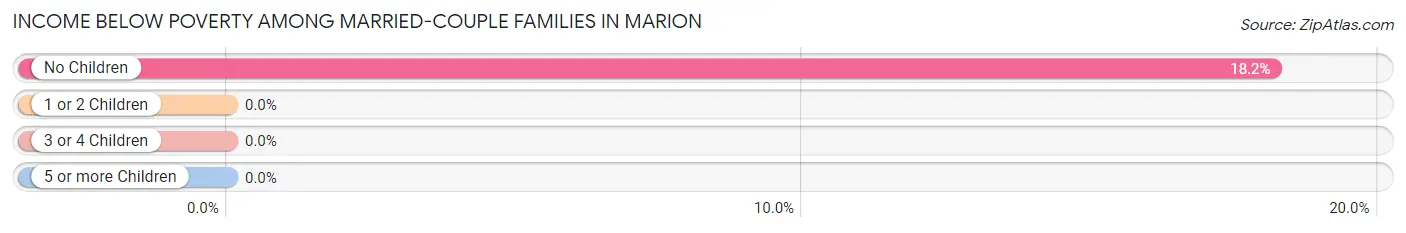
| Children | Above Poverty | Below Poverty |
| No Children | 387 (81.8%) | 86 (18.2%) |
| 1 or 2 Children | 109 (100.0%) | 0 (0.0%) |
| 3 or 4 Children | 32 (100.0%) | 0 (0.0%) |
| 5 or more Children | 0 (0.0%) | 0 (0.0%) |
| Total | 528 (86.0%) | 86 (14.0%) |
Income Below Poverty Among Single-Parent Households in Marion
According to the poverty data in Marion, 74.6% or 50 single-father households and 29.6% or 273 single-mother households are living below the poverty line. Among single-father households, those with 1 or 2 children have the highest poverty rate, with 50 households (74.6%) experiencing poverty. Likewise, among single-mother households, those with 1 or 2 children have the highest poverty rate, with 208 households (56.7%) falling below the poverty line.
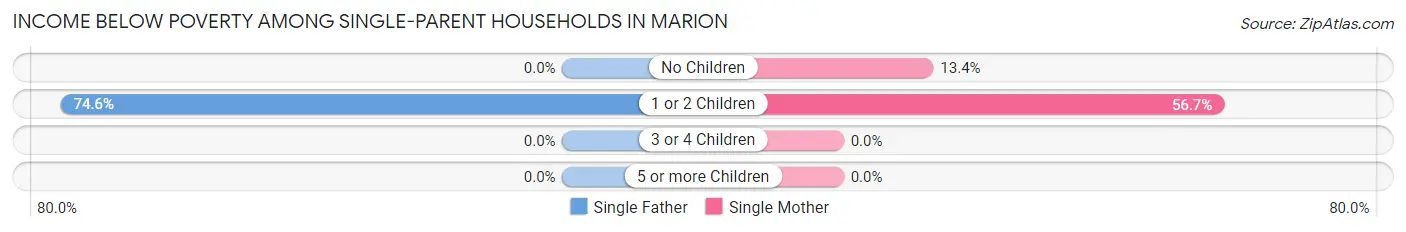
| Children | Single Father | Single Mother |
| No Children | 0 (0.0%) | 65 (13.4%) |
| 1 or 2 Children | 50 (74.6%) | 208 (56.7%) |
| 3 or 4 Children | 0 (0.0%) | 0 (0.0%) |
| 5 or more Children | 0 (0.0%) | 0 (0.0%) |
| Total | 50 (74.6%) | 273 (29.6%) |
Income Below Poverty Among Married-Couple vs Single-Parent Households in Marion
The poverty data for Marion shows that 86 of the married-couple family households (14.0%) and 323 of the single-parent households (32.7%) are living below the poverty level. Within the married-couple family households, those with no children have the highest poverty rate, with 86 households (18.2%) falling below the poverty line. Among the single-parent households, those with 1 or 2 children have the highest poverty rate, with 258 household (59.5%) living below poverty.
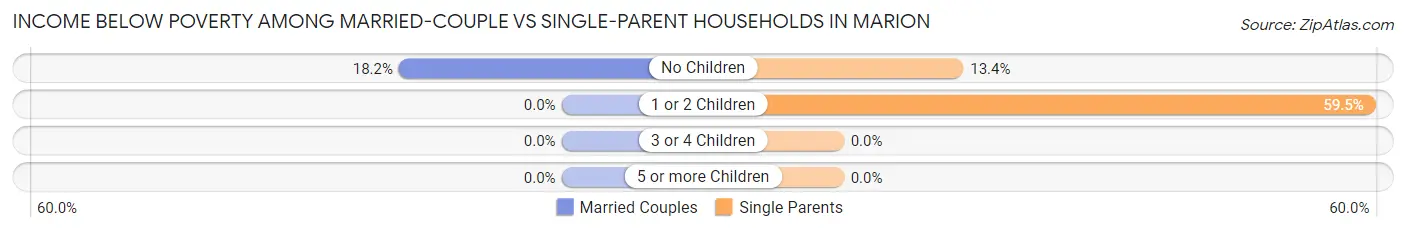
| Children | Married-Couple Families | Single-Parent Households |
| No Children | 86 (18.2%) | 65 (13.4%) |
| 1 or 2 Children | 0 (0.0%) | 258 (59.5%) |
| 3 or 4 Children | 0 (0.0%) | 0 (0.0%) |
| 5 or more Children | 0 (0.0%) | 0 (0.0%) |
| Total | 86 (14.0%) | 323 (32.7%) |
Race in Marion
The most populous races in Marion are Black / African American (4,732 | 73.9%), White / Caucasian (1,534 | 24.0%), and Asian (61 | 0.9%).
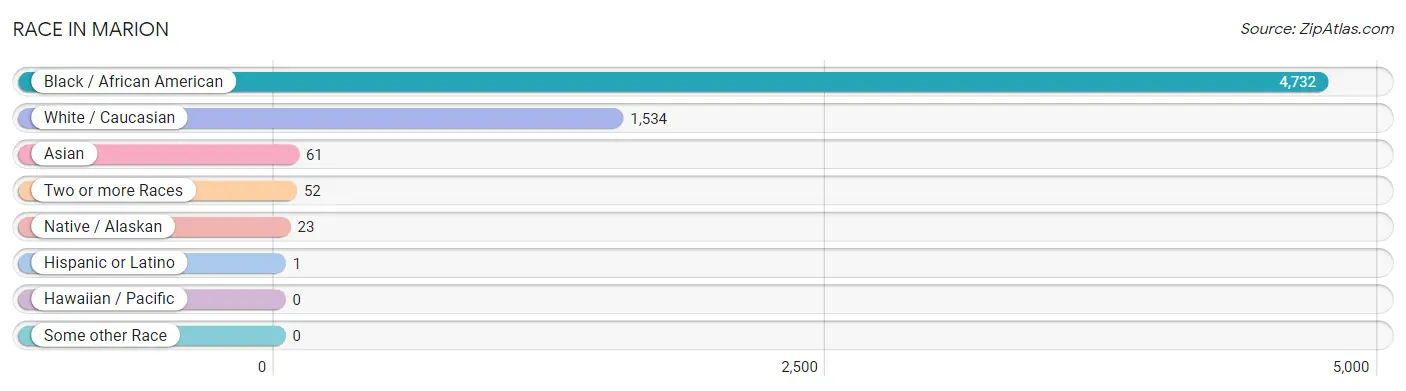
| Race | # Population | % Population |
| Asian | 61 | 0.9% |
| Black / African American | 4,732 | 73.9% |
| Hawaiian / Pacific | 0 | 0.0% |
| Hispanic or Latino | 1 | 0.0% |
| Native / Alaskan | 23 | 0.4% |
| White / Caucasian | 1,534 | 24.0% |
| Two or more Races | 52 | 0.8% |
| Some other Race | 0 | 0.0% |
| Total | 6,402 | 100.0% |
Ancestry in Marion
The most populous ancestries reported in Marion are American (329 | 5.1%), English (267 | 4.2%), Scotch-Irish (103 | 1.6%), German (89 | 1.4%), and Sri Lankan (61 | 0.9%), together accounting for 13.3% of all Marion residents.
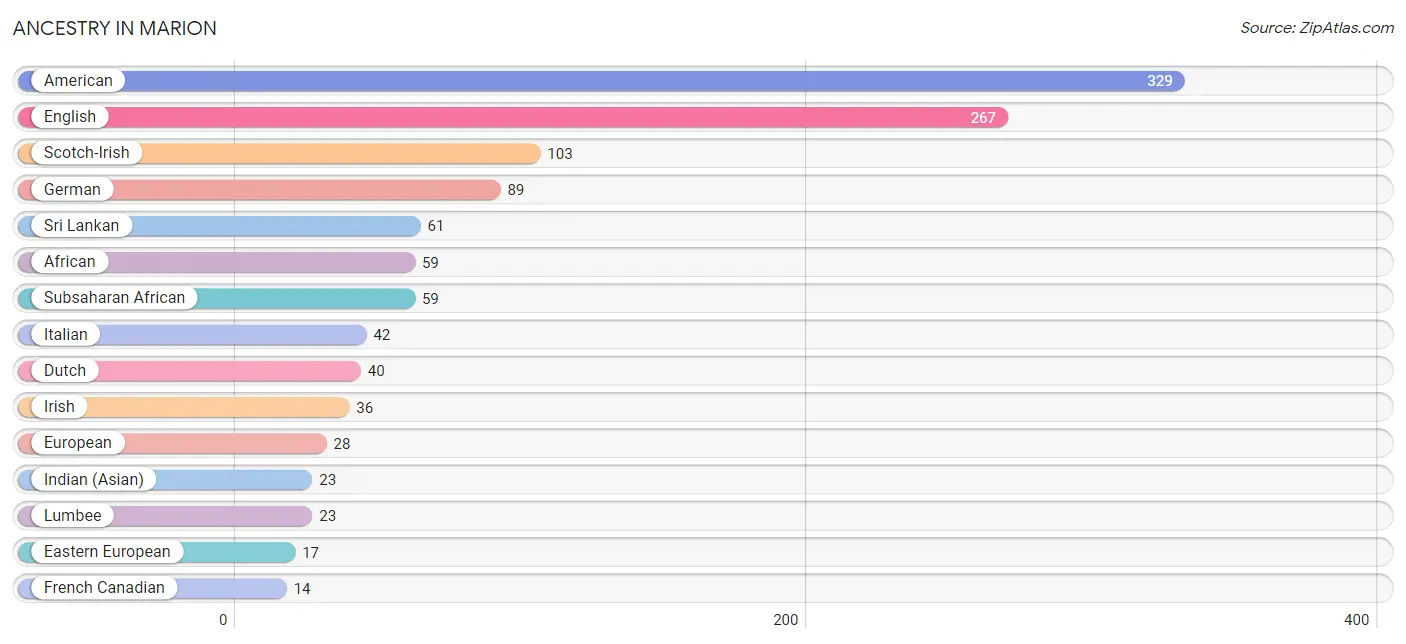
| Ancestry | # Population | % Population |
| African | 59 | 0.9% |
| American | 329 | 5.1% |
| Danish | 3 | 0.1% |
| Dutch | 40 | 0.6% |
| Eastern European | 17 | 0.3% |
| English | 267 | 4.2% |
| European | 28 | 0.4% |
| French Canadian | 14 | 0.2% |
| German | 89 | 1.4% |
| Indian (Asian) | 23 | 0.4% |
| Irish | 36 | 0.6% |
| Italian | 42 | 0.7% |
| Lumbee | 23 | 0.4% |
| Norwegian | 14 | 0.2% |
| Polish | 14 | 0.2% |
| Scotch-Irish | 103 | 1.6% |
| Sri Lankan | 61 | 0.9% |
| Subsaharan African | 59 | 0.9% |
| Swedish | 9 | 0.1% | View All 19 Rows |
Immigrants in Marion
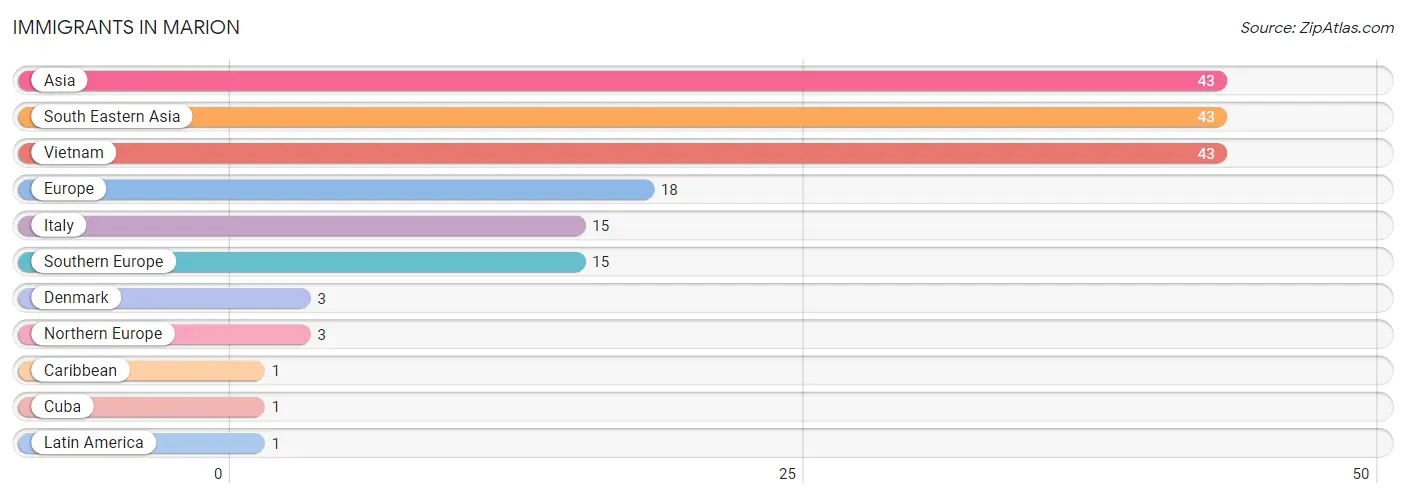
The most numerous immigrant groups reported in Marion came from Asia (43 | 0.7%), South Eastern Asia (43 | 0.7%), Vietnam (43 | 0.7%), Europe (18 | 0.3%), and Italy (15 | 0.2%), together accounting for 2.5% of all Marion residents.
| Immigration Origin | # Population | % Population |
| Asia | 43 | 0.7% |
| Caribbean | 1 | 0.0% |
| Cuba | 1 | 0.0% |
| Denmark | 3 | 0.1% |
| Europe | 18 | 0.3% |
| Italy | 15 | 0.2% |
| Latin America | 1 | 0.0% |
| Northern Europe | 3 | 0.1% |
| South Eastern Asia | 43 | 0.7% |
| Southern Europe | 15 | 0.2% |
| Vietnam | 43 | 0.7% | View All 11 Rows |
Sex and Age in Marion
Sex and Age in Marion
The most populous age groups in Marion are 35 to 39 Years (325 | 11.1%) for men and 25 to 29 Years (426 | 12.3%) for women.
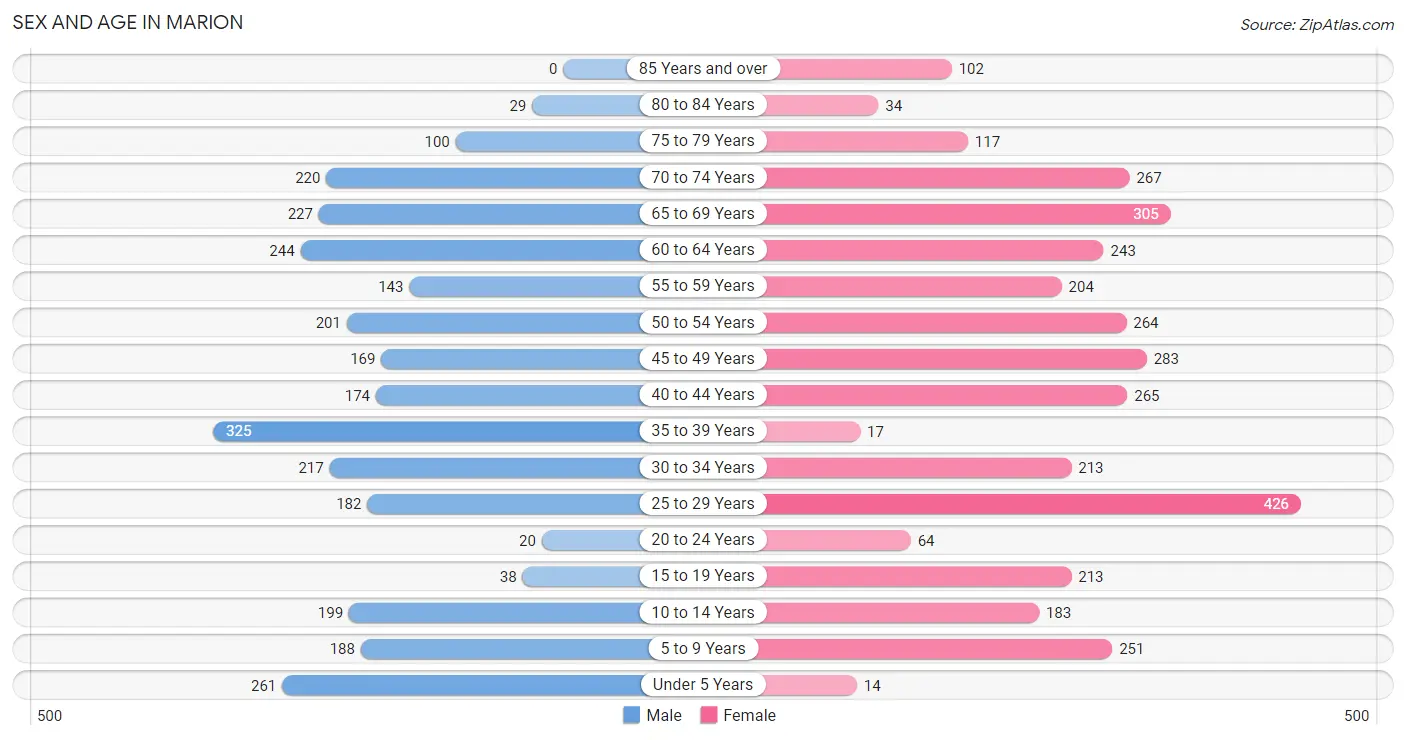
| Age Bracket | Male | Female |
| Under 5 Years | 261 (8.9%) | 14 (0.4%) |
| 5 to 9 Years | 188 (6.4%) | 251 (7.2%) |
| 10 to 14 Years | 199 (6.8%) | 183 (5.3%) |
| 15 to 19 Years | 38 (1.3%) | 213 (6.1%) |
| 20 to 24 Years | 20 (0.7%) | 64 (1.8%) |
| 25 to 29 Years | 182 (6.2%) | 426 (12.3%) |
| 30 to 34 Years | 217 (7.4%) | 213 (6.1%) |
| 35 to 39 Years | 325 (11.1%) | 17 (0.5%) |
| 40 to 44 Years | 174 (5.9%) | 265 (7.6%) |
| 45 to 49 Years | 169 (5.8%) | 283 (8.2%) |
| 50 to 54 Years | 201 (6.8%) | 264 (7.6%) |
| 55 to 59 Years | 143 (4.9%) | 204 (5.9%) |
| 60 to 64 Years | 244 (8.3%) | 243 (7.0%) |
| 65 to 69 Years | 227 (7.7%) | 305 (8.8%) |
| 70 to 74 Years | 220 (7.5%) | 267 (7.7%) |
| 75 to 79 Years | 100 (3.4%) | 117 (3.4%) |
| 80 to 84 Years | 29 (1.0%) | 34 (1.0%) |
| 85 Years and over | 0 (0.0%) | 102 (2.9%) |
| Total | 2,937 (100.0%) | 3,465 (100.0%) |
Families and Households in Marion
Median Family Size in Marion
The median family size in Marion is 2.89 persons per family, with single male/father families (67 | 4.2%) accounting for the largest median family size of 6.34 persons per family. On the other hand, married-couple families (614 | 38.3%) represent the smallest median family size with 2.62 persons per family.
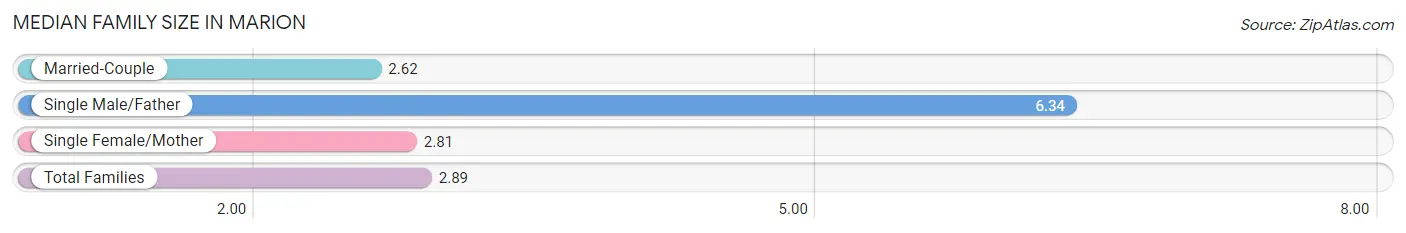
| Family Type | # Families | Family Size |
| Married-Couple | 614 (38.3%) | 2.62 |
| Single Male/Father | 67 (4.2%) | 6.34 |
| Single Female/Mother | 921 (57.5%) | 2.81 |
| Total Families | 1,602 (100.0%) | 2.89 |
Median Household Size in Marion
The median household size in Marion is 2.47 persons per household, with single male/father households (67 | 2.6%) accounting for the largest median household size of 10 persons per household. non-family households (971 | 37.7%) represent the smallest median household size with 1.23 persons per household.
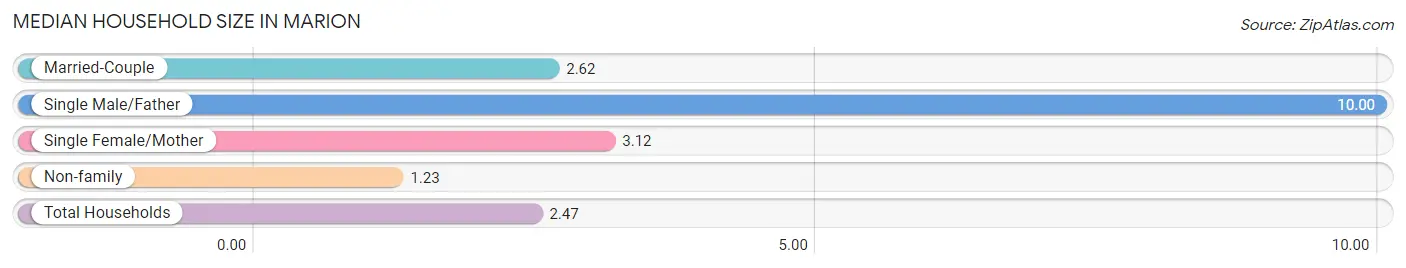
| Household Type | # Households | Household Size |
| Married-Couple | 614 (23.9%) | 2.62 |
| Single Male/Father | 67 (2.6%) | 10.00 |
| Single Female/Mother | 921 (35.8%) | 3.12 |
| Non-family | 971 (37.7%) | 1.23 |
| Total Households | 2,573 (100.0%) | 2.47 |
Household Size by Marriage Status in Marion
Out of a total of 2,573 households in Marion, 1,602 (62.3%) are family households, while 971 (37.7%) are nonfamily households. The most numerous type of family households are 2-person households, comprising 947, and the most common type of nonfamily households are 1-person households, comprising 891.
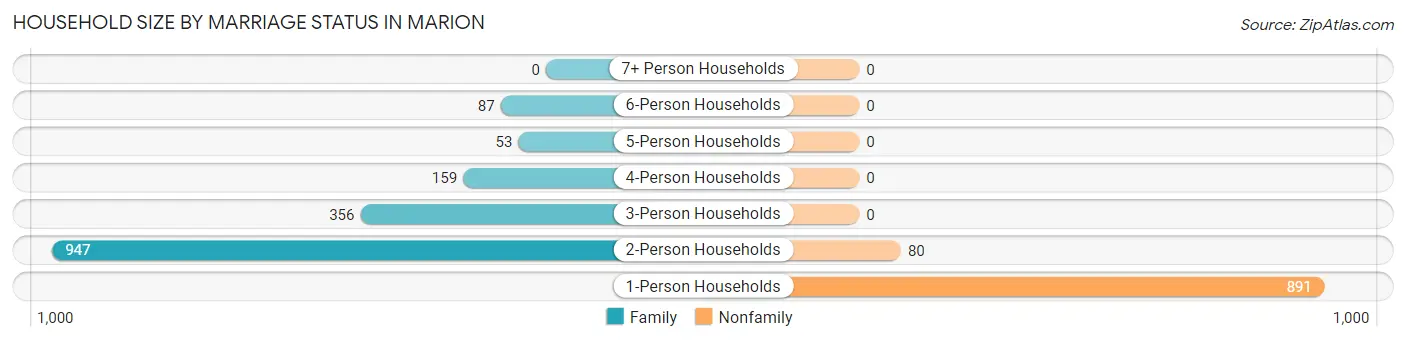
| Household Size | Family Households | Nonfamily Households |
| 1-Person Households | - | 891 (34.6%) |
| 2-Person Households | 947 (36.8%) | 80 (3.1%) |
| 3-Person Households | 356 (13.8%) | 0 (0.0%) |
| 4-Person Households | 159 (6.2%) | 0 (0.0%) |
| 5-Person Households | 53 (2.1%) | 0 (0.0%) |
| 6-Person Households | 87 (3.4%) | 0 (0.0%) |
| 7+ Person Households | 0 (0.0%) | 0 (0.0%) |
| Total | 1,602 (62.3%) | 971 (37.7%) |
Female Fertility in Marion
Fertility by Age in Marion
| Age Bracket | Women with Births | Births / 1,000 Women |
| 15 to 19 years | 0 (0.0%) | 0.0 |
| 20 to 34 years | 0 (0.0%) | 0.0 |
| 35 to 50 years | 0 (0.0%) | 0.0 |
| Total | 0 (0.0%) | 0.0 |
Fertility by Age by Marriage Status in Marion
| Age Bracket | Married | Unmarried |
| 15 to 19 years | 0 (0.0%) | 0 (0.0%) |
| 20 to 34 years | 0 (0.0%) | 0 (0.0%) |
| 35 to 50 years | 0 (0.0%) | 0 (0.0%) |
| Total | 0 (0.0%) | 0 (0.0%) |
Fertility by Education in Marion
| Educational Attainment | Women with Births | Births / 1,000 Women |
| Less than High School | 0 (0.0%) | 0.0 |
| High School Diploma | 0 (0.0%) | 0.0 |
| College or Associate's Degree | 0 (0.0%) | 0.0 |
| Bachelor's Degree | 0 (0.0%) | 0.0 |
| Graduate Degree | 0 (0.0%) | 0.0 |
| Total | 0 (0.0%) | 0.0 |
Fertility by Education by Marriage Status in Marion
| Educational Attainment | Married | Unmarried |
| Less than High School | 0 (0.0%) | 0 (0.0%) |
| High School Diploma | 0 (0.0%) | 0 (0.0%) |
| College or Associate's Degree | 0 (0.0%) | 0 (0.0%) |
| Bachelor's Degree | 0 (0.0%) | 0 (0.0%) |
| Graduate Degree | 0 (0.0%) | 0 (0.0%) |
| Total | 0 (0.0%) | 0 (0.0%) |
Employment Characteristics in Marion
Employment by Class of Employer in Marion
Among the 2,228 employed individuals in Marion, private company employees (1,292 | 58.0%), state government employees (263 | 11.8%), and not-for-profit organizations (222 | 10.0%) make up the most common classes of employment.
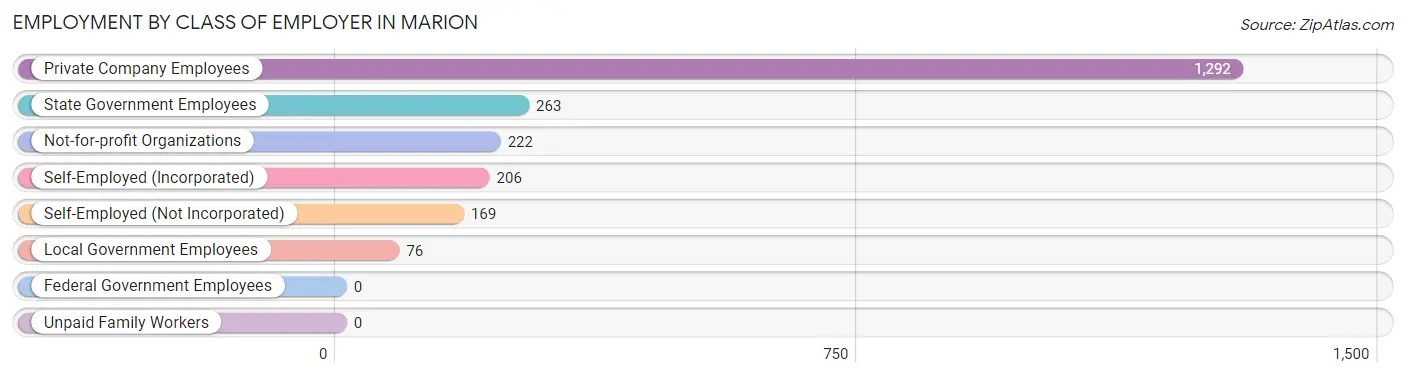
| Employer Class | # Employees | % Employees |
| Private Company Employees | 1,292 | 58.0% |
| Self-Employed (Incorporated) | 206 | 9.2% |
| Self-Employed (Not Incorporated) | 169 | 7.6% |
| Not-for-profit Organizations | 222 | 10.0% |
| Local Government Employees | 76 | 3.4% |
| State Government Employees | 263 | 11.8% |
| Federal Government Employees | 0 | 0.0% |
| Unpaid Family Workers | 0 | 0.0% |
| Total | 2,228 | 100.0% |
Employment Status by Age in Marion
According to the labor force statistics for Marion, out of the total population over 16 years of age (5,279), 45.6% or 2,407 individuals are in the labor force, with 5.6% or 135 of them unemployed. The age group with the highest labor force participation rate is 20 to 24 years, with 100.0% or 84 individuals in the labor force. Within the labor force, the 16 to 19 years age range has the highest percentage of unemployed individuals, with 11.1% or 3 of them being unemployed.
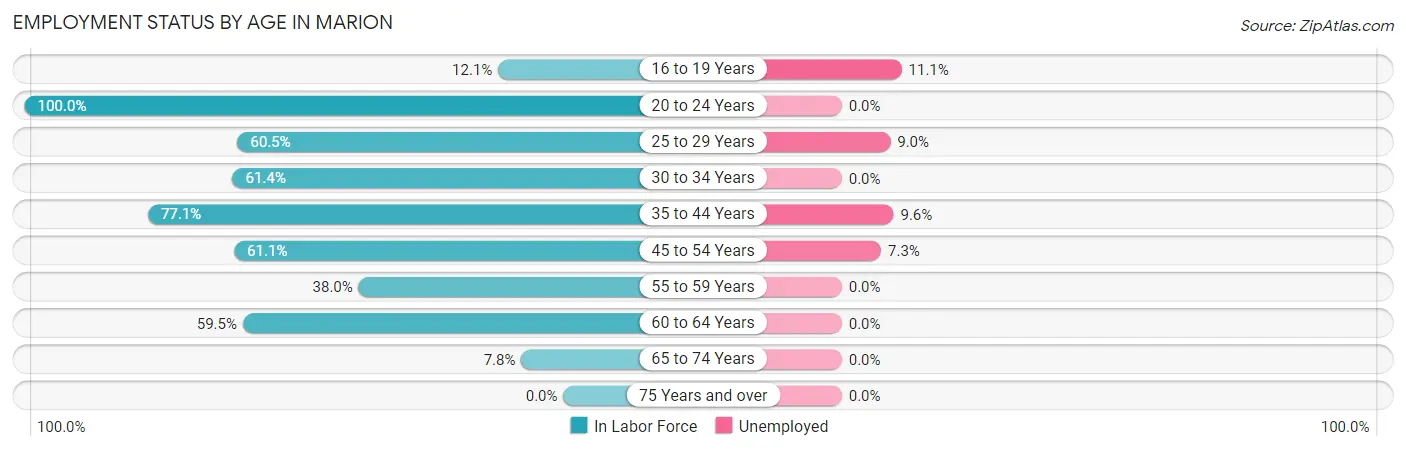
| Age Bracket | In Labor Force | Unemployed |
| 16 to 19 Years | 27 (12.1%) | 3 (11.1%) |
| 20 to 24 Years | 84 (100.0%) | 0 (0.0%) |
| 25 to 29 Years | 368 (60.5%) | 33 (9.0%) |
| 30 to 34 Years | 264 (61.4%) | 0 (0.0%) |
| 35 to 44 Years | 602 (77.1%) | 58 (9.6%) |
| 45 to 54 Years | 560 (61.1%) | 41 (7.3%) |
| 55 to 59 Years | 132 (38.0%) | 0 (0.0%) |
| 60 to 64 Years | 290 (59.5%) | 0 (0.0%) |
| 65 to 74 Years | 79 (7.8%) | 0 (0.0%) |
| 75 Years and over | 0 (0.0%) | 0 (0.0%) |
| Total | 2,407 (45.6%) | 135 (5.6%) |
Employment Status by Educational Attainment in Marion
According to labor force statistics for Marion, 62.1% of individuals (2,217) out of the total population between 25 and 64 years of age (3,570) are in the labor force, with 6.0% or 133 of them being unemployed. The group with the highest labor force participation rate are those with the educational attainment of high school diploma, with 69.1% or 1,310 individuals in the labor force. Within the labor force, individuals with less than high school education have the highest percentage of unemployment, with 32.8% or 21 of them being unemployed.
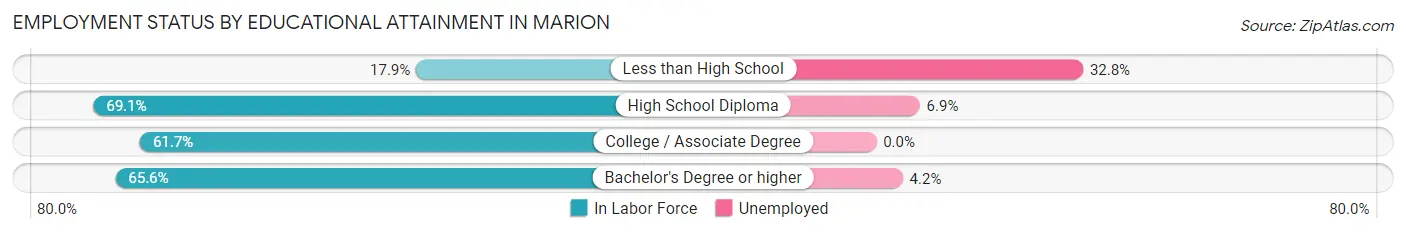
| Educational Attainment | In Labor Force | Unemployed |
| Less than High School | 64 (17.9%) | 117 (32.8%) |
| High School Diploma | 1,310 (69.1%) | 131 (6.9%) |
| College / Associate Degree | 343 (61.7%) | 0 (0.0%) |
| Bachelor's Degree or higher | 499 (65.6%) | 32 (4.2%) |
| Total | 2,217 (62.1%) | 214 (6.0%) |
Employment Occupations by Sex in Marion
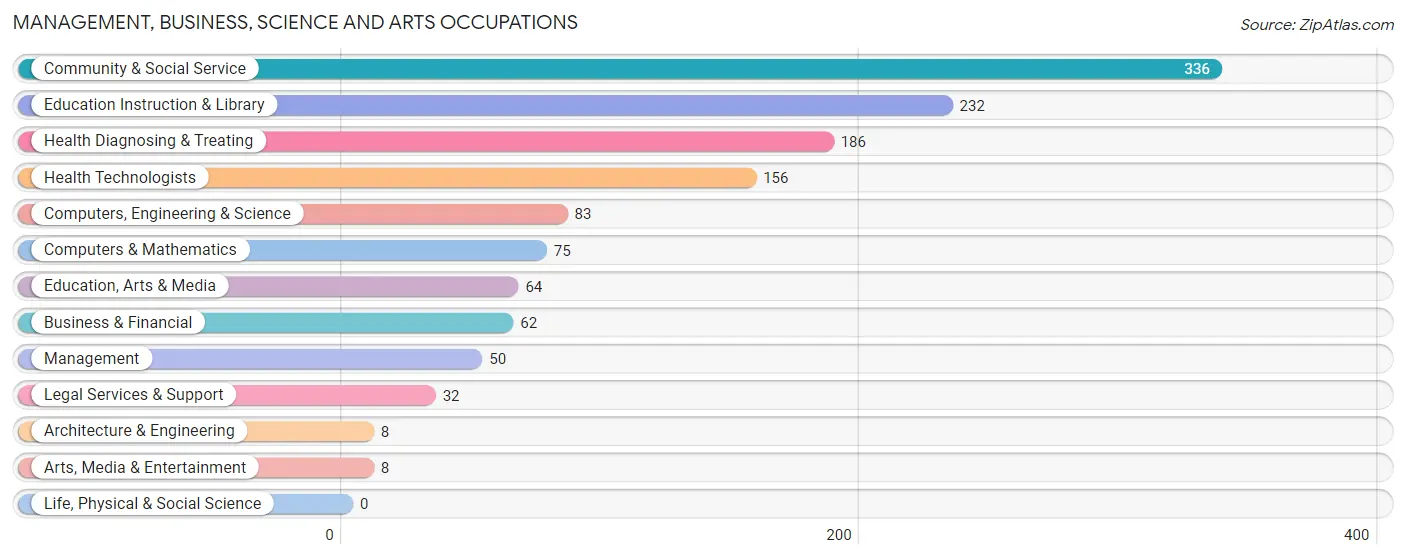
Management, Business, Science and Arts Occupations
The most common Management, Business, Science and Arts occupations in Marion are Community & Social Service (336 | 14.8%), Education Instruction & Library (232 | 10.2%), Health Diagnosing & Treating (186 | 8.2%), Health Technologists (156 | 6.9%), and Computers, Engineering & Science (83 | 3.6%).
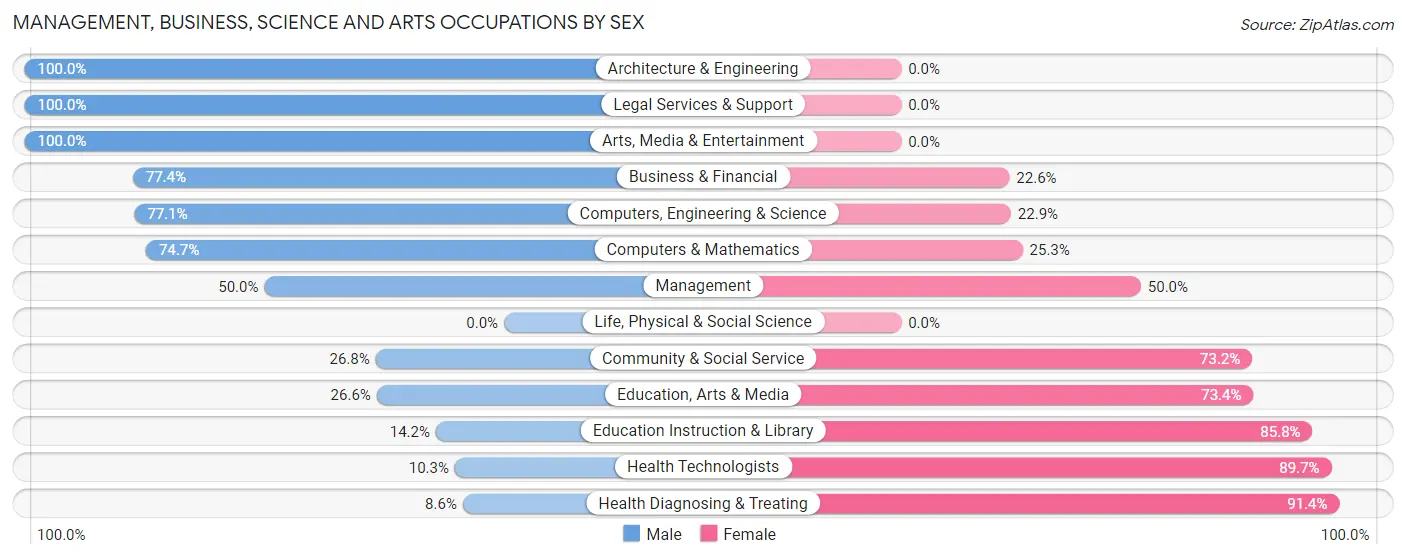
Management, Business, Science and Arts Occupations by Sex
Within the Management, Business, Science and Arts occupations in Marion, the most male-oriented occupations are Architecture & Engineering (100.0%), Legal Services & Support (100.0%), and Arts, Media & Entertainment (100.0%), while the most female-oriented occupations are Health Diagnosing & Treating (91.4%), Health Technologists (89.7%), and Education Instruction & Library (85.8%).
| Occupation | Male | Female |
| Management | 25 (50.0%) | 25 (50.0%) |
| Business & Financial | 48 (77.4%) | 14 (22.6%) |
| Computers, Engineering & Science | 64 (77.1%) | 19 (22.9%) |
| Computers & Mathematics | 56 (74.7%) | 19 (25.3%) |
| Architecture & Engineering | 8 (100.0%) | 0 (0.0%) |
| Life, Physical & Social Science | 0 (0.0%) | 0 (0.0%) |
| Community & Social Service | 90 (26.8%) | 246 (73.2%) |
| Education, Arts & Media | 17 (26.6%) | 47 (73.4%) |
| Legal Services & Support | 32 (100.0%) | 0 (0.0%) |
| Education Instruction & Library | 33 (14.2%) | 199 (85.8%) |
| Arts, Media & Entertainment | 8 (100.0%) | 0 (0.0%) |
| Health Diagnosing & Treating | 16 (8.6%) | 170 (91.4%) |
| Health Technologists | 16 (10.3%) | 140 (89.7%) |
| Total (Category) | 243 (33.9%) | 474 (66.1%) |
| Total (Overall) | 1,202 (52.9%) | 1,069 (47.1%) |
Services Occupations
The most common Services occupations in Marion are Food Preparation & Serving (331 | 14.6%), Healthcare Support (57 | 2.5%), Personal Care & Service (40 | 1.8%), Cleaning & Maintenance (25 | 1.1%), and Security & Protection (1 | 0.0%).

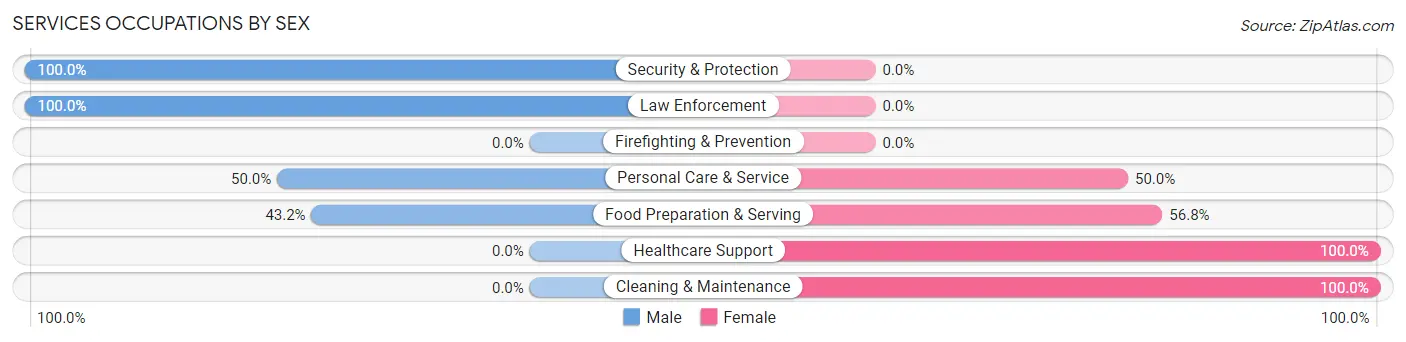
Services Occupations by Sex
Within the Services occupations in Marion, the most male-oriented occupations are Security & Protection (100.0%), Law Enforcement (100.0%), and Personal Care & Service (50.0%), while the most female-oriented occupations are Healthcare Support (100.0%), Cleaning & Maintenance (100.0%), and Food Preparation & Serving (56.8%).
| Occupation | Male | Female |
| Healthcare Support | 0 (0.0%) | 57 (100.0%) |
| Security & Protection | 1 (100.0%) | 0 (0.0%) |
| Firefighting & Prevention | 0 (0.0%) | 0 (0.0%) |
| Law Enforcement | 1 (100.0%) | 0 (0.0%) |
| Food Preparation & Serving | 143 (43.2%) | 188 (56.8%) |
| Cleaning & Maintenance | 0 (0.0%) | 25 (100.0%) |
| Personal Care & Service | 20 (50.0%) | 20 (50.0%) |
| Total (Category) | 164 (36.1%) | 290 (63.9%) |
| Total (Overall) | 1,202 (52.9%) | 1,069 (47.1%) |
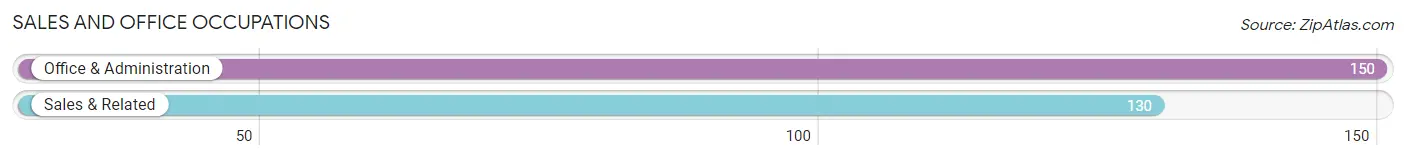
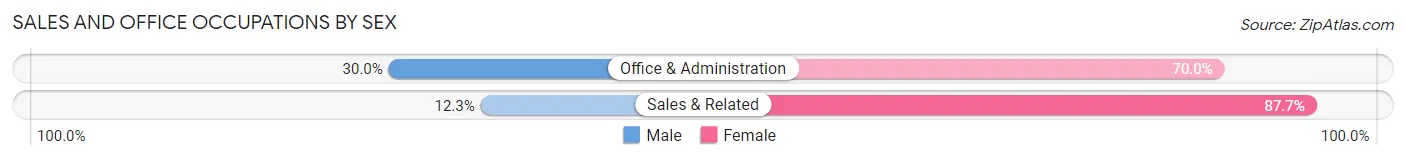
Sales and Office Occupations
The most common Sales and Office occupations in Marion are Office & Administration (150 | 6.6%), and Sales & Related (130 | 5.7%).
Sales and Office Occupations by Sex
| Occupation | Male | Female |
| Sales & Related | 16 (12.3%) | 114 (87.7%) |
| Office & Administration | 45 (30.0%) | 105 (70.0%) |
| Total (Category) | 61 (21.8%) | 219 (78.2%) |
| Total (Overall) | 1,202 (52.9%) | 1,069 (47.1%) |
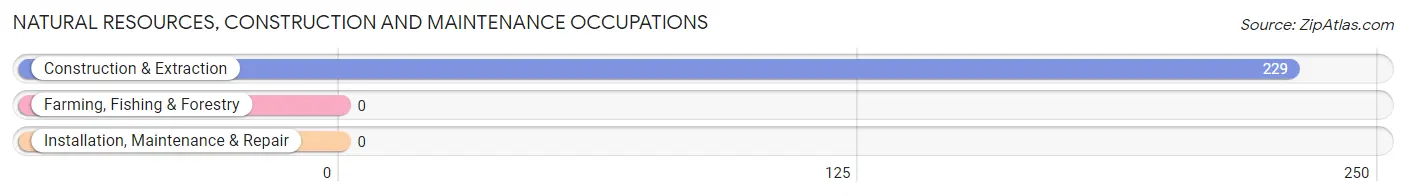
Natural Resources, Construction and Maintenance Occupations
The most common Natural Resources, Construction and Maintenance occupations in Marion are , and Construction & Extraction (229 | 10.1%).
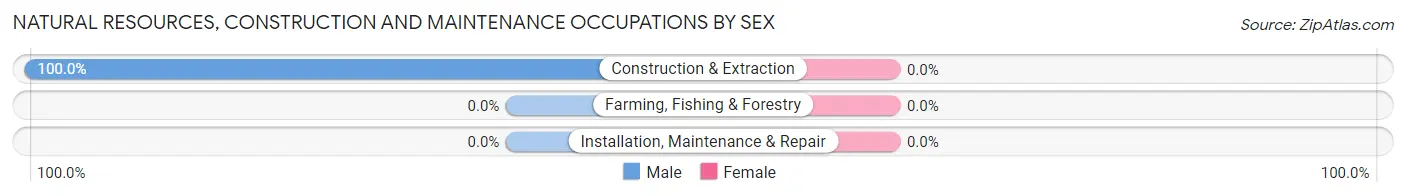
Natural Resources, Construction and Maintenance Occupations by Sex
| Occupation | Male | Female |
| Farming, Fishing & Forestry | 0 (0.0%) | 0 (0.0%) |
| Construction & Extraction | 229 (100.0%) | 0 (0.0%) |
| Installation, Maintenance & Repair | 0 (0.0%) | 0 (0.0%) |
| Total (Category) | 229 (100.0%) | 0 (0.0%) |
| Total (Overall) | 1,202 (52.9%) | 1,069 (47.1%) |
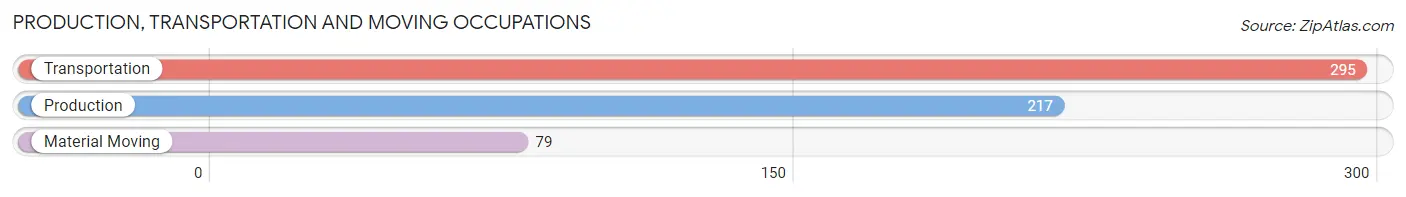
Production, Transportation and Moving Occupations
The most common Production, Transportation and Moving occupations in Marion are Transportation (295 | 13.0%), Production (217 | 9.6%), and Material Moving (79 | 3.5%).
Production, Transportation and Moving Occupations by Sex
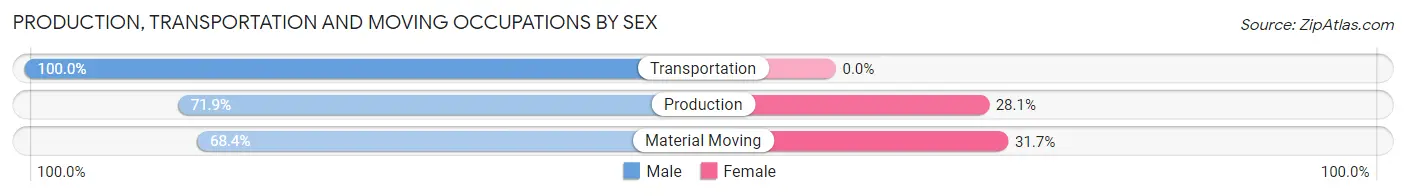
| Occupation | Male | Female |
| Production | 156 (71.9%) | 61 (28.1%) |
| Transportation | 295 (100.0%) | 0 (0.0%) |
| Material Moving | 54 (68.3%) | 25 (31.7%) |
| Total (Category) | 505 (85.5%) | 86 (14.5%) |
| Total (Overall) | 1,202 (52.9%) | 1,069 (47.1%) |
Employment Industries by Sex in Marion
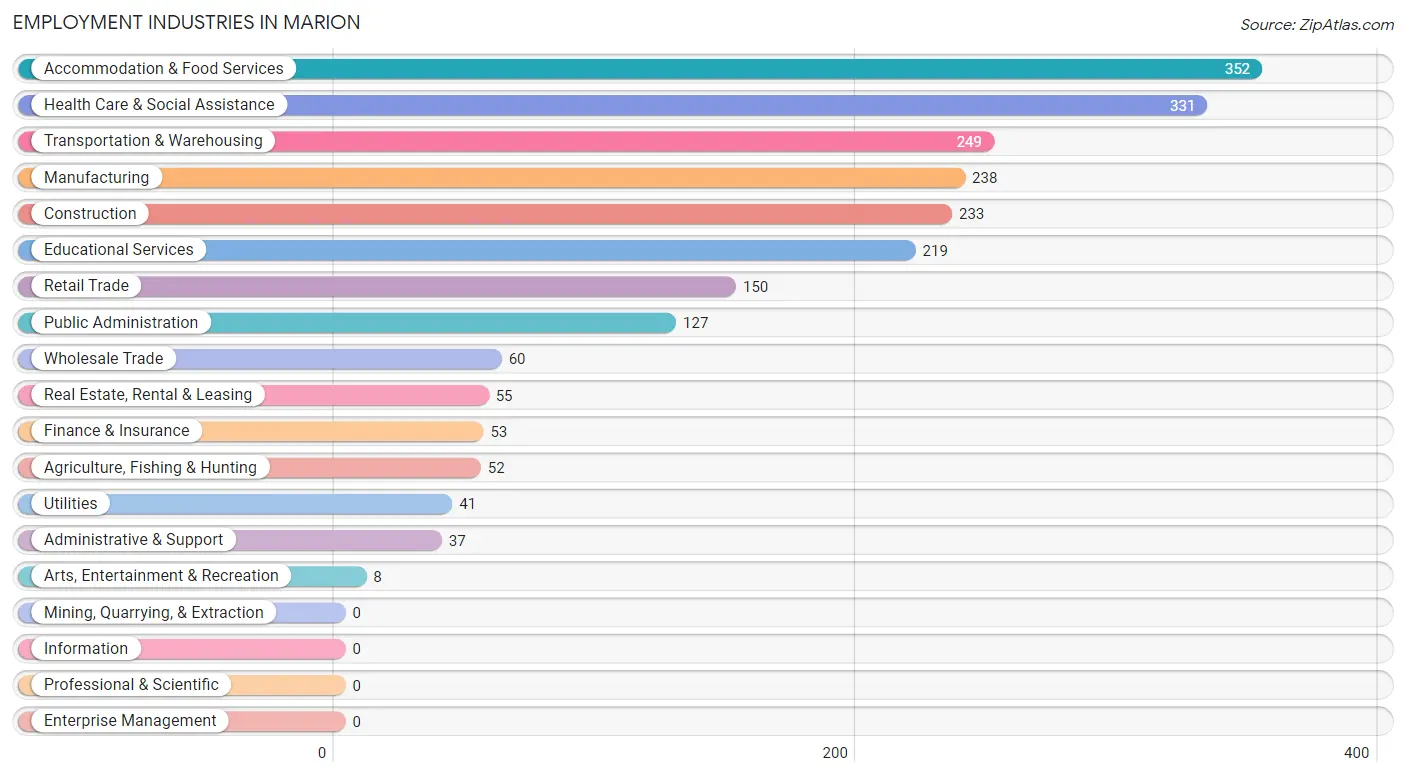
Employment Industries in Marion
The major employment industries in Marion include Accommodation & Food Services (352 | 15.5%), Health Care & Social Assistance (331 | 14.6%), Transportation & Warehousing (249 | 11.0%), Manufacturing (238 | 10.5%), and Construction (233 | 10.3%).
Employment Industries by Sex in Marion
The Marion industries that see more men than women are Agriculture, Fishing & Hunting (100.0%), Construction (100.0%), and Transportation & Warehousing (100.0%), whereas the industries that tend to have a higher number of women are Administrative & Support (100.0%), Health Care & Social Assistance (96.1%), and Public Administration (74.0%).
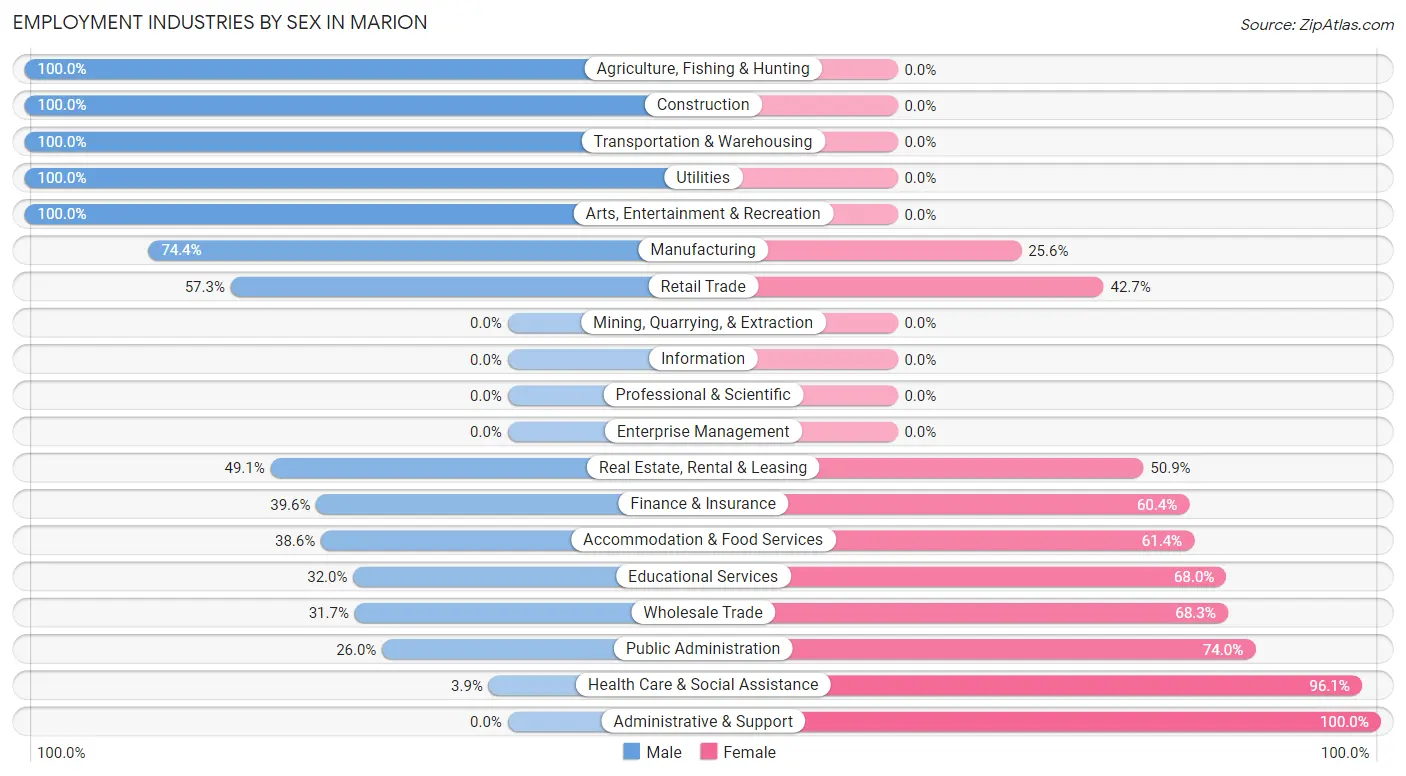
| Industry | Male | Female |
| Agriculture, Fishing & Hunting | 52 (100.0%) | 0 (0.0%) |
| Mining, Quarrying, & Extraction | 0 (0.0%) | 0 (0.0%) |
| Construction | 233 (100.0%) | 0 (0.0%) |
| Manufacturing | 177 (74.4%) | 61 (25.6%) |
| Wholesale Trade | 19 (31.7%) | 41 (68.3%) |
| Retail Trade | 86 (57.3%) | 64 (42.7%) |
| Transportation & Warehousing | 249 (100.0%) | 0 (0.0%) |
| Utilities | 41 (100.0%) | 0 (0.0%) |
| Information | 0 (0.0%) | 0 (0.0%) |
| Finance & Insurance | 21 (39.6%) | 32 (60.4%) |
| Real Estate, Rental & Leasing | 27 (49.1%) | 28 (50.9%) |
| Professional & Scientific | 0 (0.0%) | 0 (0.0%) |
| Enterprise Management | 0 (0.0%) | 0 (0.0%) |
| Administrative & Support | 0 (0.0%) | 37 (100.0%) |
| Educational Services | 70 (32.0%) | 149 (68.0%) |
| Health Care & Social Assistance | 13 (3.9%) | 318 (96.1%) |
| Arts, Entertainment & Recreation | 8 (100.0%) | 0 (0.0%) |
| Accommodation & Food Services | 136 (38.6%) | 216 (61.4%) |
| Public Administration | 33 (26.0%) | 94 (74.0%) |
| Total | 1,202 (52.9%) | 1,069 (47.1%) |
Education in Marion
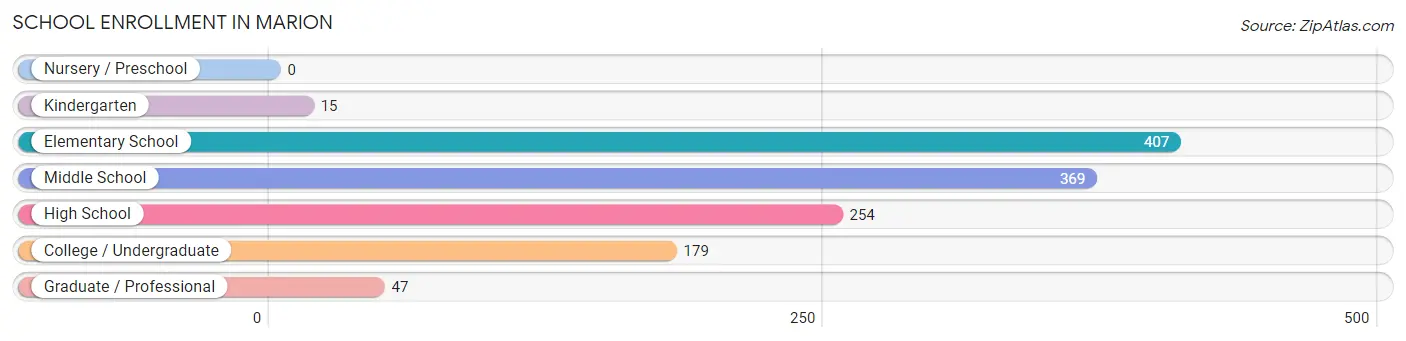
School Enrollment in Marion
The most common levels of schooling among the 1,271 students in Marion are elementary school (407 | 32.0%), middle school (369 | 29.0%), and high school (254 | 20.0%).
| School Level | # Students | % Students |
| Nursery / Preschool | 0 | 0.0% |
| Kindergarten | 15 | 1.2% |
| Elementary School | 407 | 32.0% |
| Middle School | 369 | 29.0% |
| High School | 254 | 20.0% |
| College / Undergraduate | 179 | 14.1% |
| Graduate / Professional | 47 | 3.7% |
| Total | 1,271 | 100.0% |
School Enrollment by Age by Funding Source in Marion
Out of a total of 1,271 students who are enrolled in schools in Marion, 105 (8.3%) attend a private institution, while the remaining 1,166 (91.7%) are enrolled in public schools. The age group of 35 years and over has the highest likelihood of being enrolled in private schools, with 14 (45.2% in the age bracket) enrolled. Conversely, the age group of 25 to 34 year olds has the lowest likelihood of being enrolled in a private school, with 168 (100.0% in the age bracket) attending a public institution.
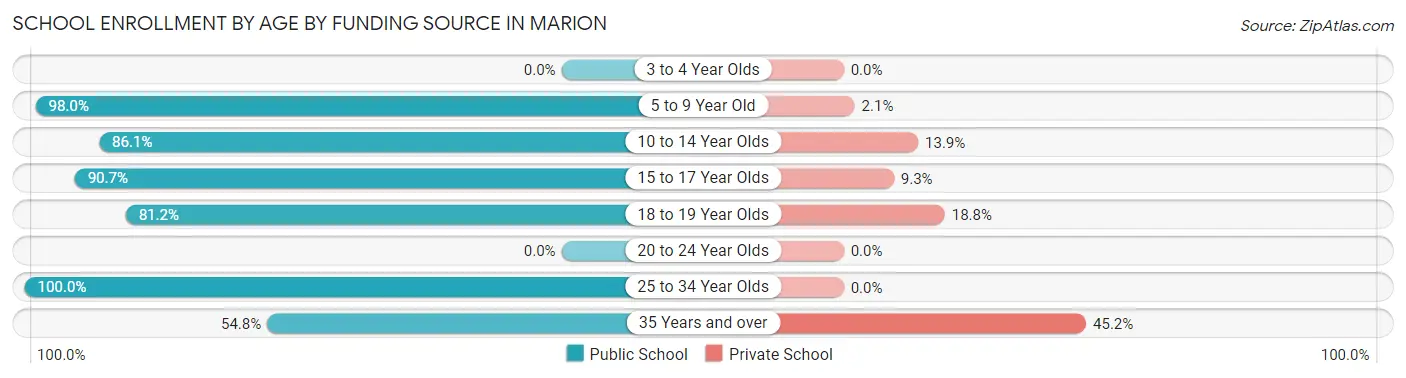
| Age Bracket | Public School | Private School |
| 3 to 4 Year Olds | 0 (0.0%) | 0 (0.0%) |
| 5 to 9 Year Old | 430 (98.0%) | 9 (2.1%) |
| 10 to 14 Year Olds | 329 (86.1%) | 53 (13.9%) |
| 15 to 17 Year Olds | 165 (90.7%) | 17 (9.3%) |
| 18 to 19 Year Olds | 56 (81.2%) | 13 (18.8%) |
| 20 to 24 Year Olds | 0 (0.0%) | 0 (0.0%) |
| 25 to 34 Year Olds | 168 (100.0%) | 0 (0.0%) |
| 35 Years and over | 17 (54.8%) | 14 (45.2%) |
| Total | 1,166 (91.7%) | 105 (8.3%) |
Educational Attainment by Field of Study in Marion
Arts & humanities (279 | 27.4%), business (218 | 21.4%), education (148 | 14.5%), science & technology (113 | 11.1%), and social sciences (81 | 7.9%) are the most common fields of study among 1,020 individuals in Marion who have obtained a bachelor's degree or higher.
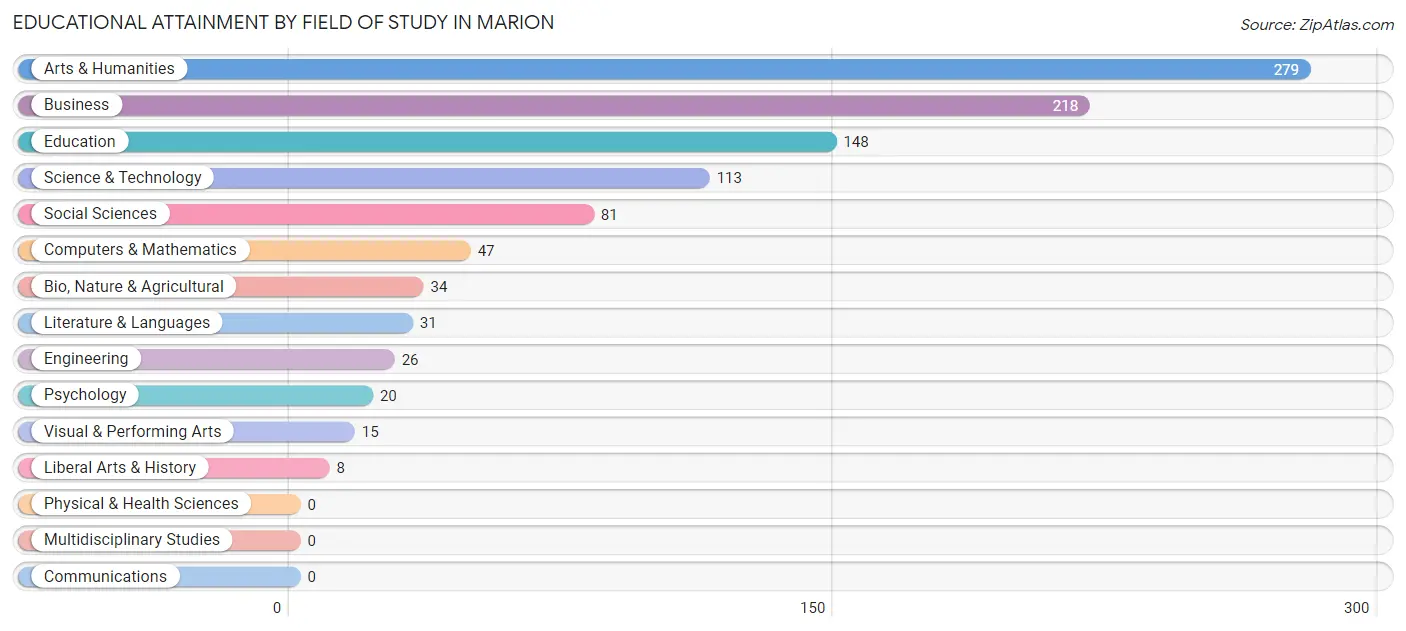
| Field of Study | # Graduates | % Graduates |
| Computers & Mathematics | 47 | 4.6% |
| Bio, Nature & Agricultural | 34 | 3.3% |
| Physical & Health Sciences | 0 | 0.0% |
| Psychology | 20 | 2.0% |
| Social Sciences | 81 | 7.9% |
| Engineering | 26 | 2.5% |
| Multidisciplinary Studies | 0 | 0.0% |
| Science & Technology | 113 | 11.1% |
| Business | 218 | 21.4% |
| Education | 148 | 14.5% |
| Literature & Languages | 31 | 3.0% |
| Liberal Arts & History | 8 | 0.8% |
| Visual & Performing Arts | 15 | 1.5% |
| Communications | 0 | 0.0% |
| Arts & Humanities | 279 | 27.4% |
| Total | 1,020 | 100.0% |
Transportation & Commute in Marion
Vehicle Availability by Sex in Marion
The most prevalent vehicle ownership categories in Marion are males with 2 vehicles (580, accounting for 48.8%) and females with 2 vehicles (321, making up 56.5%).
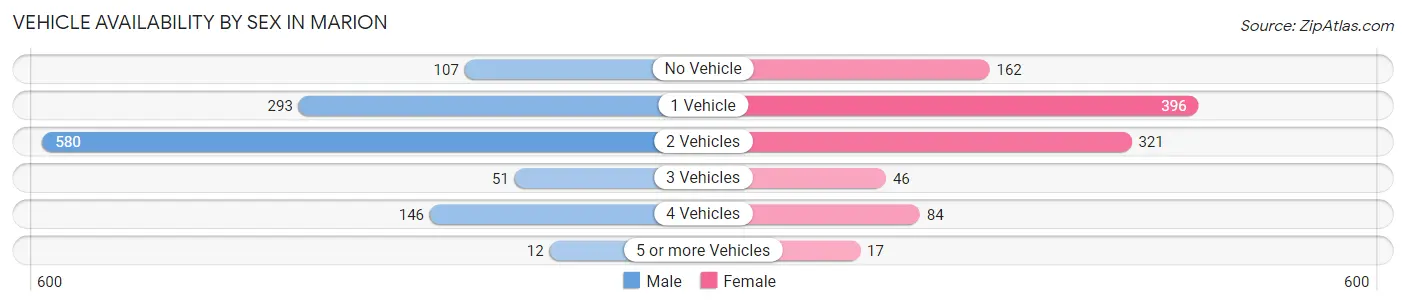
| Vehicles Available | Male | Female |
| No Vehicle | 107 (9.0%) | 162 (15.8%) |
| 1 Vehicle | 293 (24.6%) | 396 (38.6%) |
| 2 Vehicles | 580 (48.8%) | 321 (31.3%) |
| 3 Vehicles | 51 (4.3%) | 46 (4.5%) |
| 4 Vehicles | 146 (12.3%) | 84 (8.2%) |
| 5 or more Vehicles | 12 (1.0%) | 17 (1.7%) |
| Total | 1,189 (100.0%) | 1,026 (100.0%) |
Commute Time in Marion
The most frequently occuring commute durations in Marion are 30 to 34 minutes (510 commuters, 23.5%), 35 to 39 minutes (487 commuters, 22.5%), and 5 to 9 minutes (279 commuters, 12.9%).
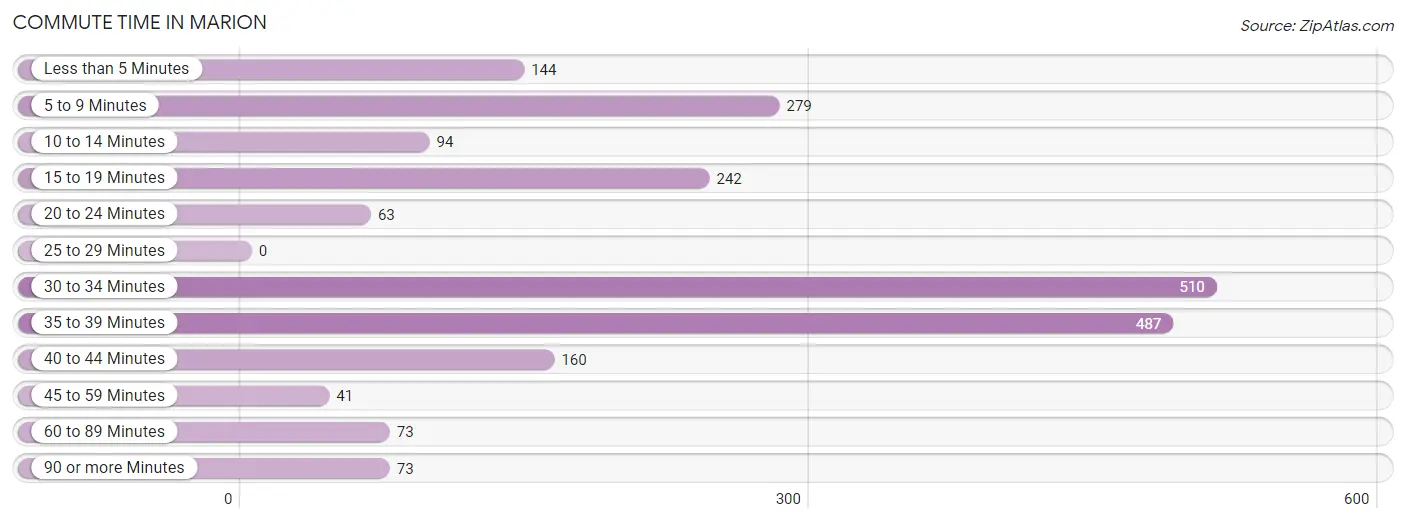
| Commute Time | # Commuters | % Commuters |
| Less than 5 Minutes | 144 | 6.7% |
| 5 to 9 Minutes | 279 | 12.9% |
| 10 to 14 Minutes | 94 | 4.3% |
| 15 to 19 Minutes | 242 | 11.2% |
| 20 to 24 Minutes | 63 | 2.9% |
| 25 to 29 Minutes | 0 | 0.0% |
| 30 to 34 Minutes | 510 | 23.5% |
| 35 to 39 Minutes | 487 | 22.5% |
| 40 to 44 Minutes | 160 | 7.4% |
| 45 to 59 Minutes | 41 | 1.9% |
| 60 to 89 Minutes | 73 | 3.4% |
| 90 or more Minutes | 73 | 3.4% |
Commute Time by Sex in Marion
The most common commute times in Marion are 30 to 34 minutes (407 commuters, 35.0%) for males and 35 to 39 minutes (224 commuters, 22.3%) for females.
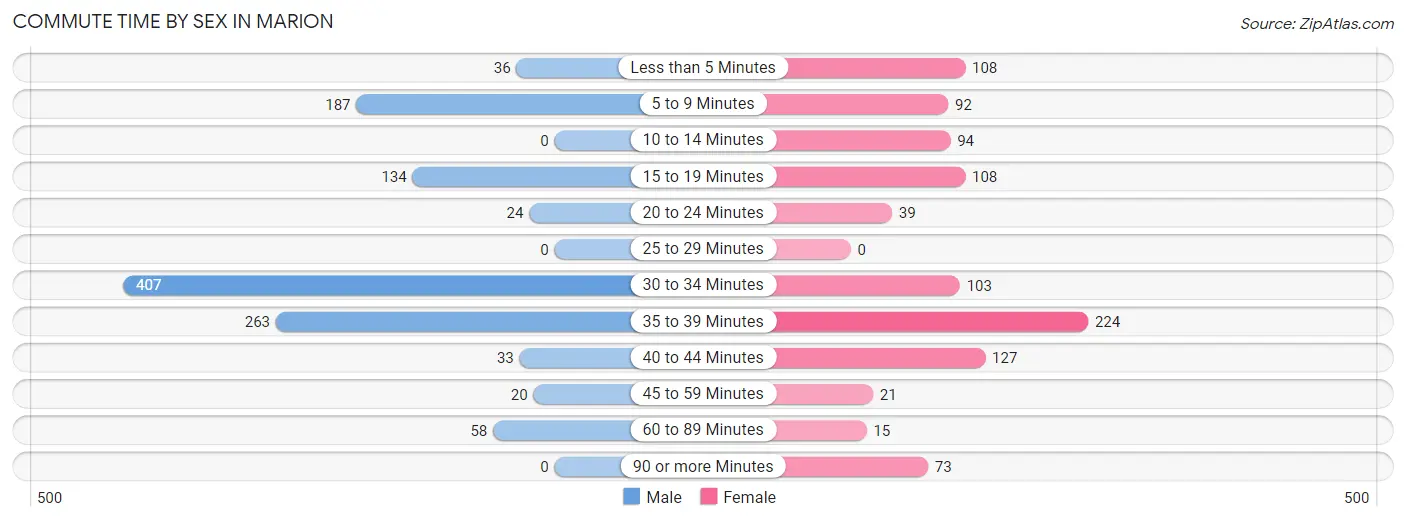
| Commute Time | Male | Female |
| Less than 5 Minutes | 36 (3.1%) | 108 (10.8%) |
| 5 to 9 Minutes | 187 (16.1%) | 92 (9.2%) |
| 10 to 14 Minutes | 0 (0.0%) | 94 (9.4%) |
| 15 to 19 Minutes | 134 (11.5%) | 108 (10.8%) |
| 20 to 24 Minutes | 24 (2.1%) | 39 (3.9%) |
| 25 to 29 Minutes | 0 (0.0%) | 0 (0.0%) |
| 30 to 34 Minutes | 407 (35.0%) | 103 (10.3%) |
| 35 to 39 Minutes | 263 (22.6%) | 224 (22.3%) |
| 40 to 44 Minutes | 33 (2.8%) | 127 (12.7%) |
| 45 to 59 Minutes | 20 (1.7%) | 21 (2.1%) |
| 60 to 89 Minutes | 58 (5.0%) | 15 (1.5%) |
| 90 or more Minutes | 0 (0.0%) | 73 (7.3%) |
Time of Departure to Work by Sex in Marion
The most frequent times of departure to work in Marion are 12:00 AM to 4:59 AM (261, 22.5%) for males and 6:00 AM to 6:29 AM (208, 20.7%) for females.
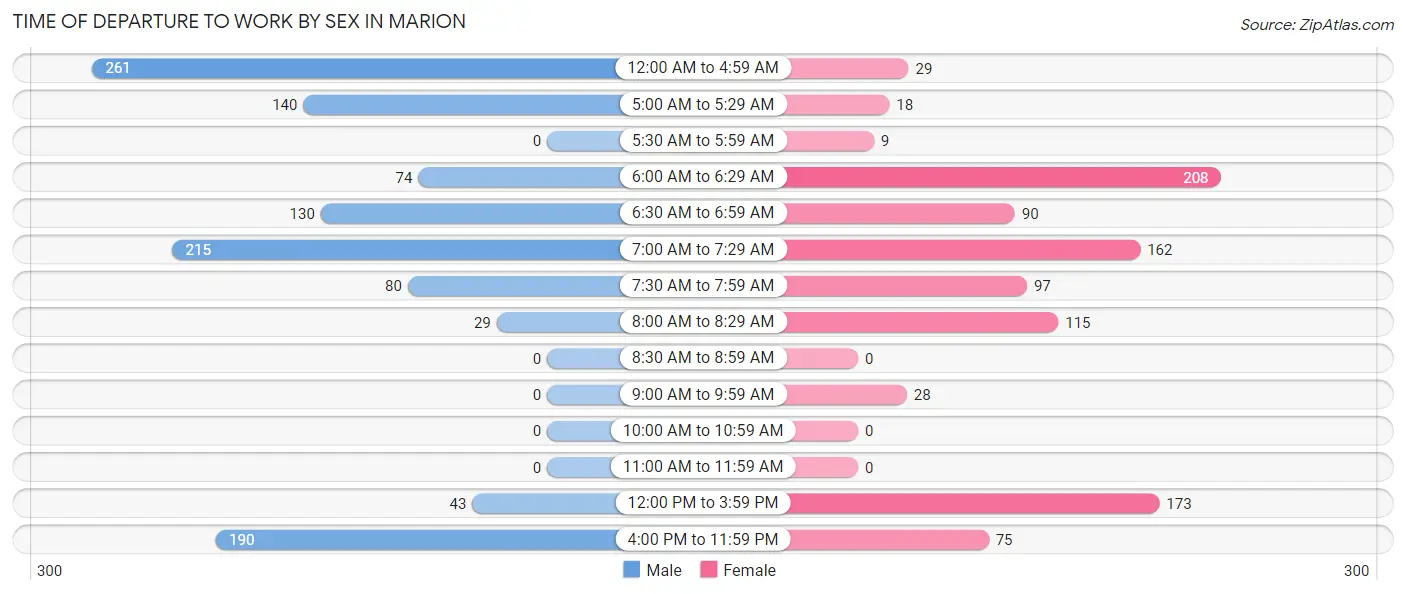
| Time of Departure | Male | Female |
| 12:00 AM to 4:59 AM | 261 (22.5%) | 29 (2.9%) |
| 5:00 AM to 5:29 AM | 140 (12.0%) | 18 (1.8%) |
| 5:30 AM to 5:59 AM | 0 (0.0%) | 9 (0.9%) |
| 6:00 AM to 6:29 AM | 74 (6.4%) | 208 (20.7%) |
| 6:30 AM to 6:59 AM | 130 (11.2%) | 90 (9.0%) |
| 7:00 AM to 7:29 AM | 215 (18.5%) | 162 (16.1%) |
| 7:30 AM to 7:59 AM | 80 (6.9%) | 97 (9.7%) |
| 8:00 AM to 8:29 AM | 29 (2.5%) | 115 (11.5%) |
| 8:30 AM to 8:59 AM | 0 (0.0%) | 0 (0.0%) |
| 9:00 AM to 9:59 AM | 0 (0.0%) | 28 (2.8%) |
| 10:00 AM to 10:59 AM | 0 (0.0%) | 0 (0.0%) |
| 11:00 AM to 11:59 AM | 0 (0.0%) | 0 (0.0%) |
| 12:00 PM to 3:59 PM | 43 (3.7%) | 173 (17.2%) |
| 4:00 PM to 11:59 PM | 190 (16.4%) | 75 (7.5%) |
| Total | 1,162 (100.0%) | 1,004 (100.0%) |
Housing Occupancy in Marion
Occupancy by Ownership in Marion
Of the total 2,573 dwellings in Marion, owner-occupied units account for 1,014 (39.4%), while renter-occupied units make up 1,559 (60.6%).
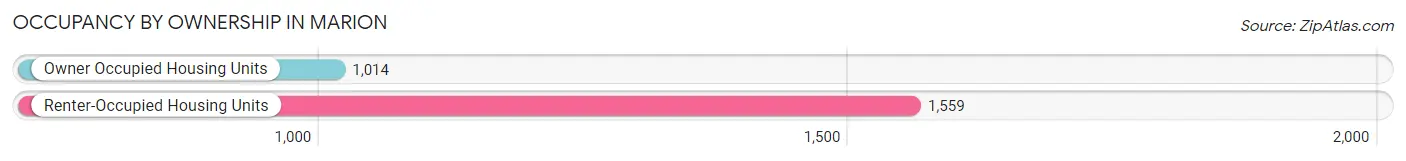
| Occupancy | # Housing Units | % Housing Units |
| Owner Occupied Housing Units | 1,014 | 39.4% |
| Renter-Occupied Housing Units | 1,559 | 60.6% |
| Total Occupied Housing Units | 2,573 | 100.0% |
Occupancy by Household Size in Marion
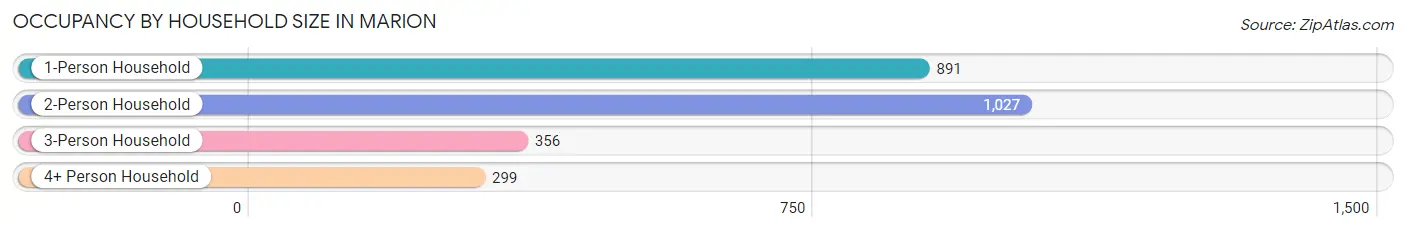
| Household Size | # Housing Units | % Housing Units |
| 1-Person Household | 891 | 34.6% |
| 2-Person Household | 1,027 | 39.9% |
| 3-Person Household | 356 | 13.8% |
| 4+ Person Household | 299 | 11.6% |
| Total Housing Units | 2,573 | 100.0% |
Occupancy by Ownership by Household Size in Marion
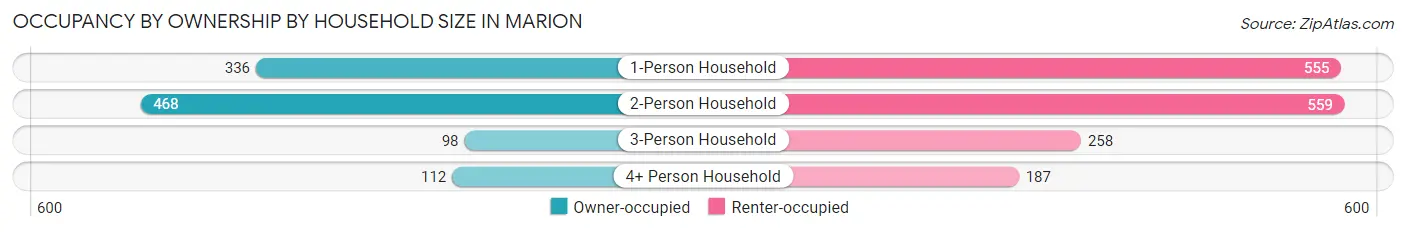
| Household Size | Owner-occupied | Renter-occupied |
| 1-Person Household | 336 (37.7%) | 555 (62.3%) |
| 2-Person Household | 468 (45.6%) | 559 (54.4%) |
| 3-Person Household | 98 (27.5%) | 258 (72.5%) |
| 4+ Person Household | 112 (37.5%) | 187 (62.5%) |
| Total Housing Units | 1,014 (39.4%) | 1,559 (60.6%) |
Occupancy by Educational Attainment in Marion
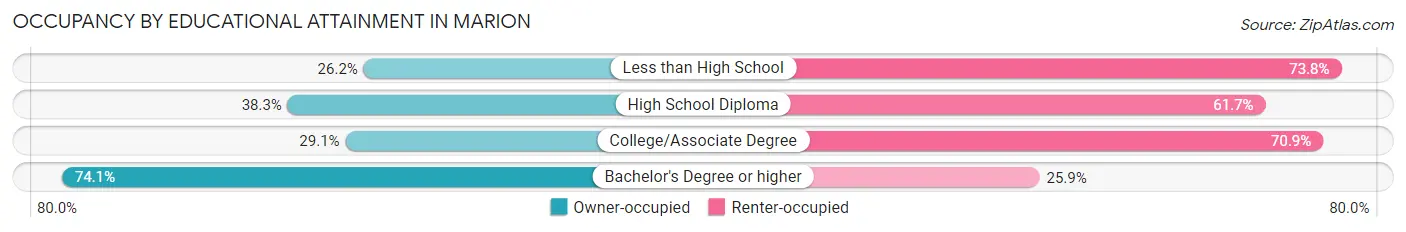
| Household Size | Owner-occupied | Renter-occupied |
| Less than High School | 118 (26.2%) | 332 (73.8%) |
| High School Diploma | 385 (38.3%) | 621 (61.7%) |
| College/Associate Degree | 205 (29.1%) | 499 (70.9%) |
| Bachelor's Degree or higher | 306 (74.1%) | 107 (25.9%) |
Occupancy by Age of Householder in Marion
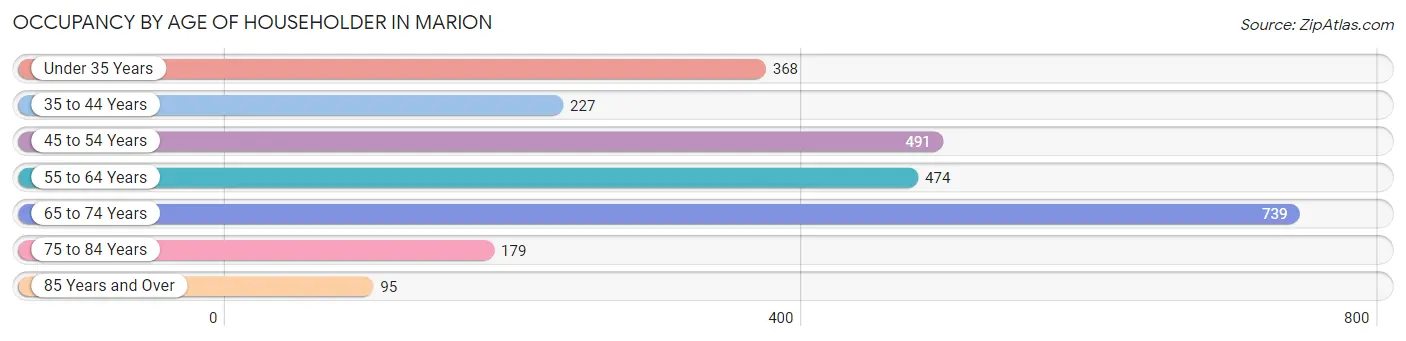
| Age Bracket | # Households | % Households |
| Under 35 Years | 368 | 14.3% |
| 35 to 44 Years | 227 | 8.8% |
| 45 to 54 Years | 491 | 19.1% |
| 55 to 64 Years | 474 | 18.4% |
| 65 to 74 Years | 739 | 28.7% |
| 75 to 84 Years | 179 | 7.0% |
| 85 Years and Over | 95 | 3.7% |
| Total | 2,573 | 100.0% |
Housing Finances in Marion
Median Income by Occupancy in Marion
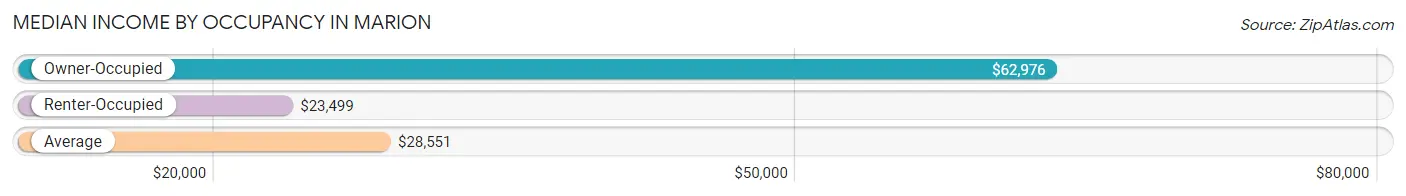
| Occupancy Type | # Households | Median Income |
| Owner-Occupied | 1,014 (39.4%) | $62,976 |
| Renter-Occupied | 1,559 (60.6%) | $23,499 |
| Average | 2,573 (100.0%) | $28,551 |
Occupancy by Householder Income Bracket in Marion
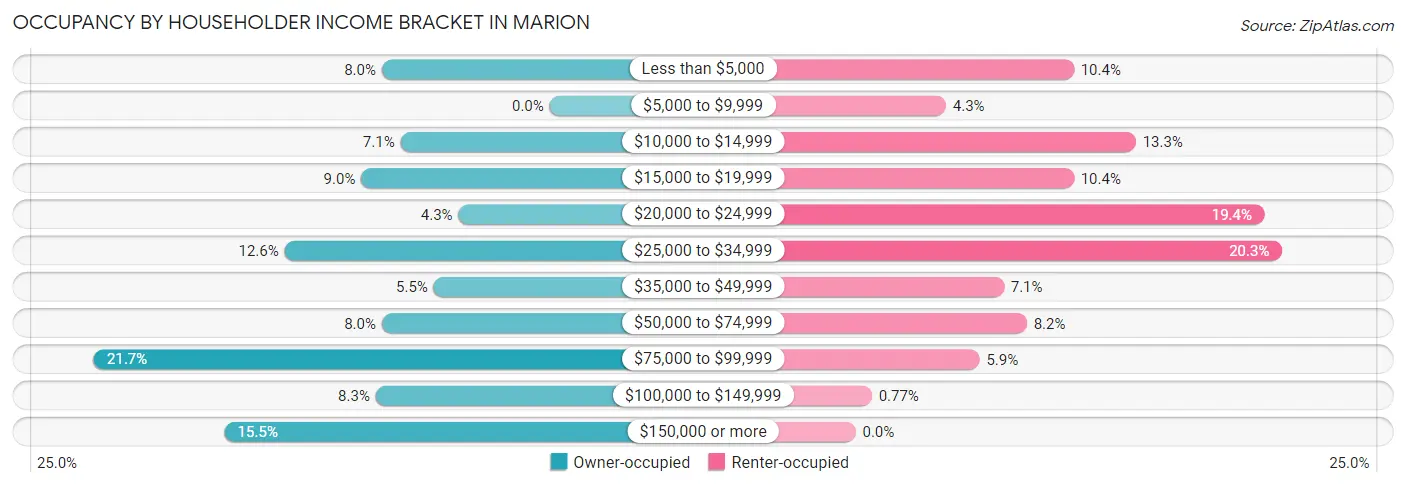
| Income Bracket | Owner-occupied | Renter-occupied |
| Less than $5,000 | 81 (8.0%) | 162 (10.4%) |
| $5,000 to $9,999 | 0 (0.0%) | 67 (4.3%) |
| $10,000 to $14,999 | 72 (7.1%) | 208 (13.3%) |
| $15,000 to $19,999 | 91 (9.0%) | 162 (10.4%) |
| $20,000 to $24,999 | 44 (4.3%) | 303 (19.4%) |
| $25,000 to $34,999 | 128 (12.6%) | 316 (20.3%) |
| $35,000 to $49,999 | 56 (5.5%) | 110 (7.1%) |
| $50,000 to $74,999 | 81 (8.0%) | 127 (8.2%) |
| $75,000 to $99,999 | 220 (21.7%) | 92 (5.9%) |
| $100,000 to $149,999 | 84 (8.3%) | 12 (0.8%) |
| $150,000 or more | 157 (15.5%) | 0 (0.0%) |
| Total | 1,014 (100.0%) | 1,559 (100.0%) |
Monthly Housing Cost Tiers in Marion
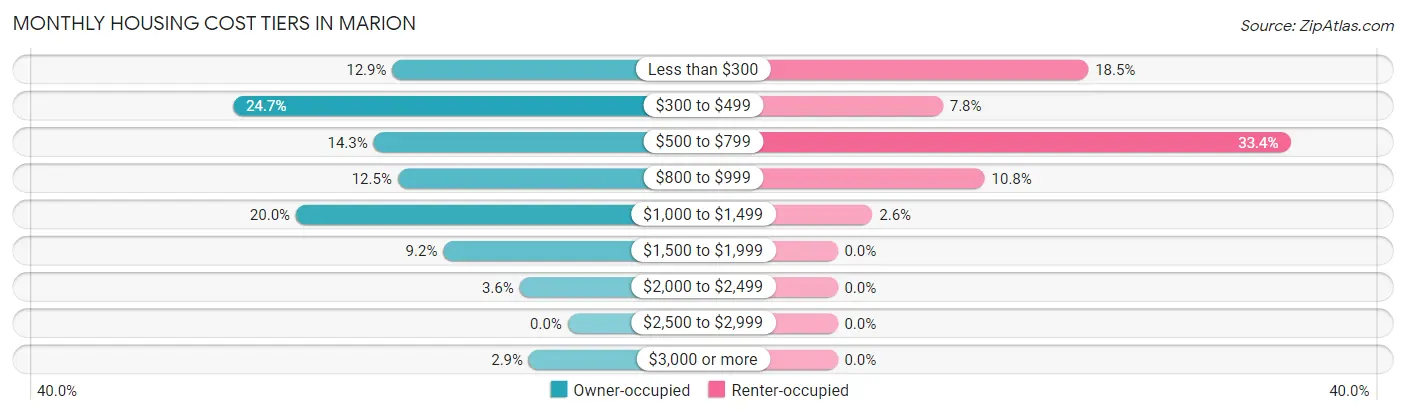
| Monthly Cost | Owner-occupied | Renter-occupied |
| Less than $300 | 131 (12.9%) | 288 (18.5%) |
| $300 to $499 | 250 (24.6%) | 121 (7.8%) |
| $500 to $799 | 145 (14.3%) | 520 (33.4%) |
| $800 to $999 | 127 (12.5%) | 169 (10.8%) |
| $1,000 to $1,499 | 203 (20.0%) | 40 (2.6%) |
| $1,500 to $1,999 | 93 (9.2%) | 0 (0.0%) |
| $2,000 to $2,499 | 36 (3.5%) | 0 (0.0%) |
| $2,500 to $2,999 | 0 (0.0%) | 0 (0.0%) |
| $3,000 or more | 29 (2.9%) | 0 (0.0%) |
| Total | 1,014 (100.0%) | 1,559 (100.0%) |
Physical Housing Characteristics in Marion
Housing Structures in Marion
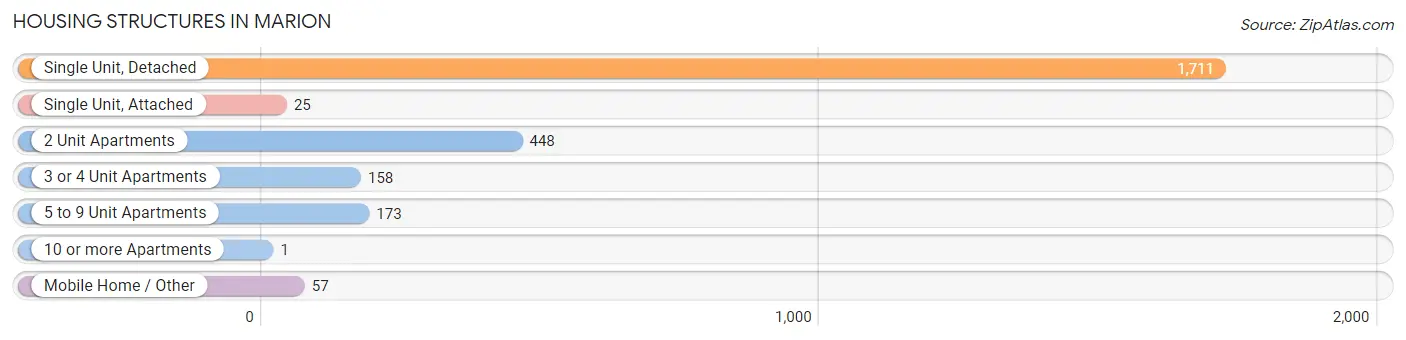
| Structure Type | # Housing Units | % Housing Units |
| Single Unit, Detached | 1,711 | 66.5% |
| Single Unit, Attached | 25 | 1.0% |
| 2 Unit Apartments | 448 | 17.4% |
| 3 or 4 Unit Apartments | 158 | 6.1% |
| 5 to 9 Unit Apartments | 173 | 6.7% |
| 10 or more Apartments | 1 | 0.0% |
| Mobile Home / Other | 57 | 2.2% |
| Total | 2,573 | 100.0% |
Housing Structures by Occupancy in Marion
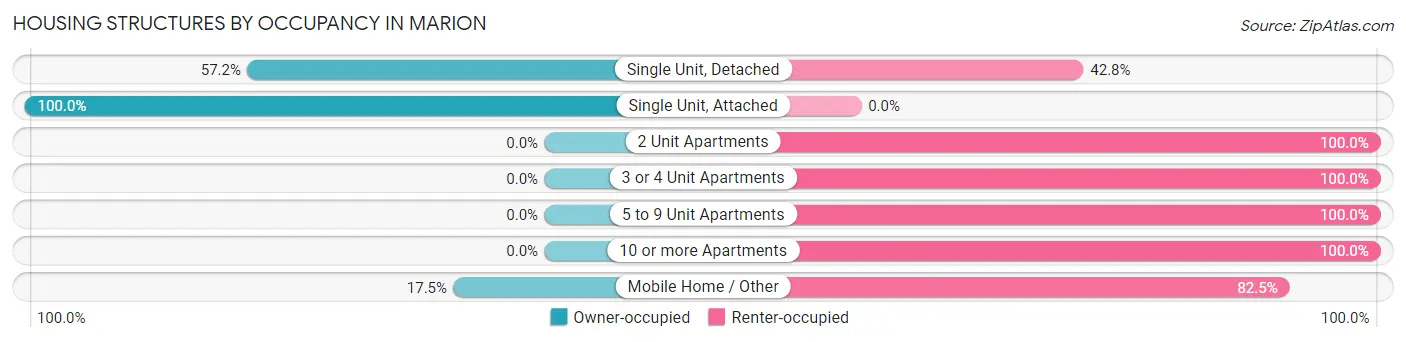
| Structure Type | Owner-occupied | Renter-occupied |
| Single Unit, Detached | 979 (57.2%) | 732 (42.8%) |
| Single Unit, Attached | 25 (100.0%) | 0 (0.0%) |
| 2 Unit Apartments | 0 (0.0%) | 448 (100.0%) |
| 3 or 4 Unit Apartments | 0 (0.0%) | 158 (100.0%) |
| 5 to 9 Unit Apartments | 0 (0.0%) | 173 (100.0%) |
| 10 or more Apartments | 0 (0.0%) | 1 (100.0%) |
| Mobile Home / Other | 10 (17.5%) | 47 (82.5%) |
| Total | 1,014 (39.4%) | 1,559 (60.6%) |
Housing Structures by Number of Rooms in Marion
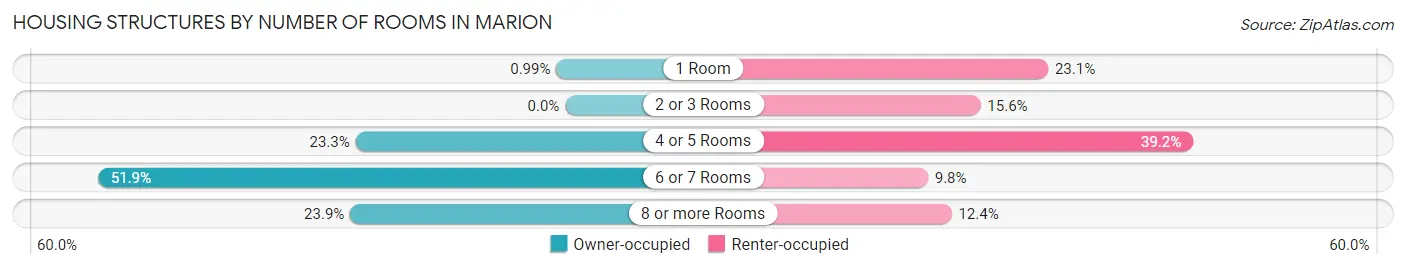
| Number of Rooms | Owner-occupied | Renter-occupied |
| 1 Room | 10 (1.0%) | 360 (23.1%) |
| 2 or 3 Rooms | 0 (0.0%) | 243 (15.6%) |
| 4 or 5 Rooms | 236 (23.3%) | 611 (39.2%) |
| 6 or 7 Rooms | 526 (51.9%) | 152 (9.8%) |
| 8 or more Rooms | 242 (23.9%) | 193 (12.4%) |
| Total | 1,014 (100.0%) | 1,559 (100.0%) |
Housing Structure by Heating Type in Marion
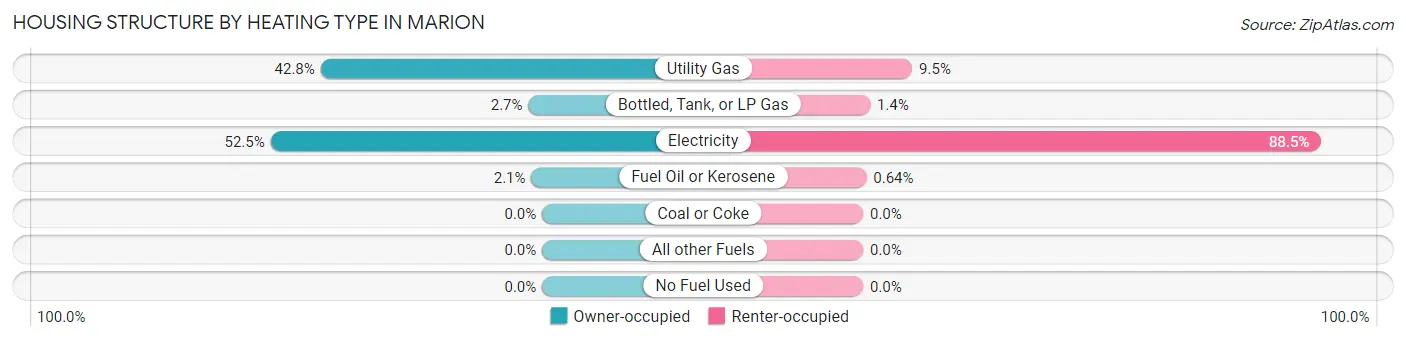
| Heating Type | Owner-occupied | Renter-occupied |
| Utility Gas | 434 (42.8%) | 148 (9.5%) |
| Bottled, Tank, or LP Gas | 27 (2.7%) | 21 (1.3%) |
| Electricity | 532 (52.5%) | 1,380 (88.5%) |
| Fuel Oil or Kerosene | 21 (2.1%) | 10 (0.6%) |
| Coal or Coke | 0 (0.0%) | 0 (0.0%) |
| All other Fuels | 0 (0.0%) | 0 (0.0%) |
| No Fuel Used | 0 (0.0%) | 0 (0.0%) |
| Total | 1,014 (100.0%) | 1,559 (100.0%) |
Household Vehicle Usage in Marion
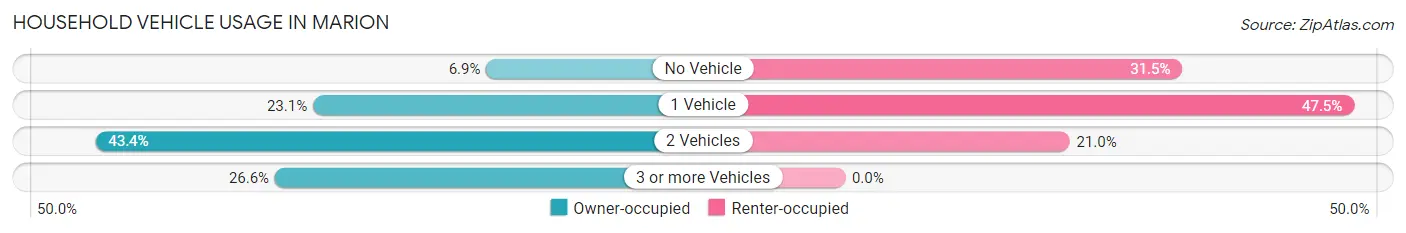
| Vehicles per Household | Owner-occupied | Renter-occupied |
| No Vehicle | 70 (6.9%) | 491 (31.5%) |
| 1 Vehicle | 234 (23.1%) | 741 (47.5%) |
| 2 Vehicles | 440 (43.4%) | 327 (21.0%) |
| 3 or more Vehicles | 270 (26.6%) | 0 (0.0%) |
| Total | 1,014 (100.0%) | 1,559 (100.0%) |
Real Estate & Mortgages in Marion
Real Estate and Mortgage Overview in Marion
| Characteristic | Without Mortgage | With Mortgage |
| Housing Units | 508 | 506 |
| Median Property Value | $115,500 | $139,600 |
| Median Household Income | $32,353 | $91 |
| Monthly Housing Costs | $364 | $16 |
| Real Estate Taxes | $509 | $15 |
Property Value by Mortgage Status in Marion
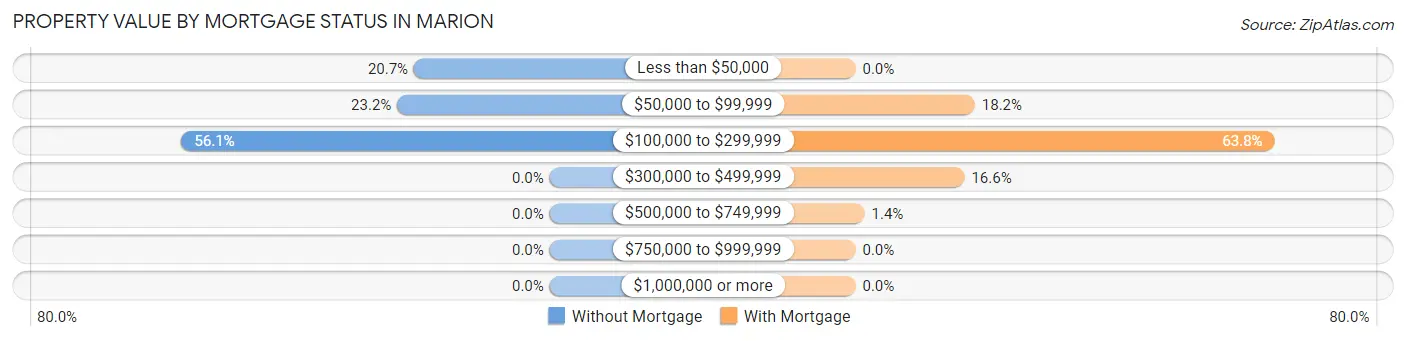
| Property Value | Without Mortgage | With Mortgage |
| Less than $50,000 | 105 (20.7%) | 0 (0.0%) |
| $50,000 to $99,999 | 118 (23.2%) | 92 (18.2%) |
| $100,000 to $299,999 | 285 (56.1%) | 323 (63.8%) |
| $300,000 to $499,999 | 0 (0.0%) | 84 (16.6%) |
| $500,000 to $749,999 | 0 (0.0%) | 7 (1.4%) |
| $750,000 to $999,999 | 0 (0.0%) | 0 (0.0%) |
| $1,000,000 or more | 0 (0.0%) | 0 (0.0%) |
| Total | 508 (100.0%) | 506 (100.0%) |
Household Income by Mortgage Status in Marion
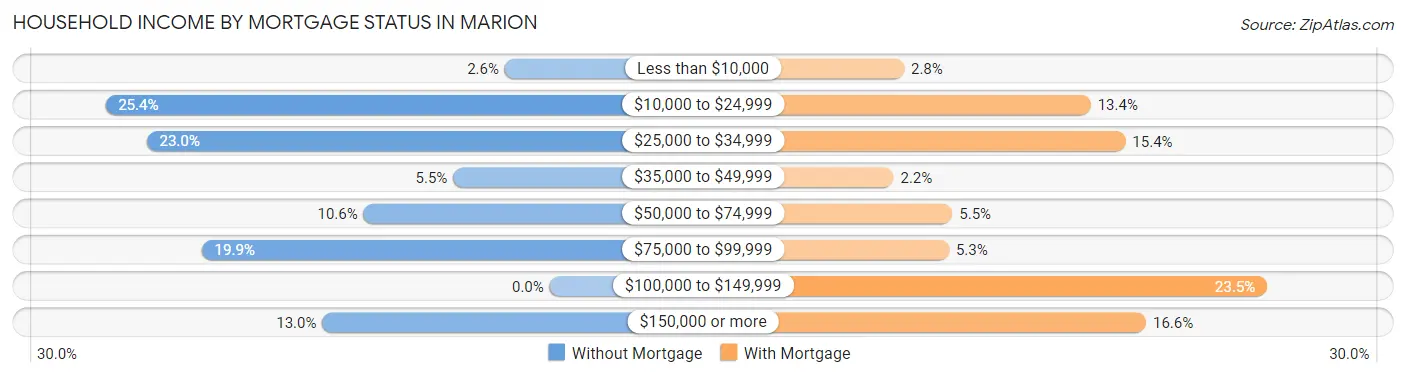
| Household Income | Without Mortgage | With Mortgage |
| Less than $10,000 | 13 (2.6%) | 14 (2.8%) |
| $10,000 to $24,999 | 129 (25.4%) | 68 (13.4%) |
| $25,000 to $34,999 | 117 (23.0%) | 78 (15.4%) |
| $35,000 to $49,999 | 28 (5.5%) | 11 (2.2%) |
| $50,000 to $74,999 | 54 (10.6%) | 28 (5.5%) |
| $75,000 to $99,999 | 101 (19.9%) | 27 (5.3%) |
| $100,000 to $149,999 | 0 (0.0%) | 119 (23.5%) |
| $150,000 or more | 66 (13.0%) | 84 (16.6%) |
| Total | 508 (100.0%) | 506 (100.0%) |
Property Value to Household Income Ratio in Marion
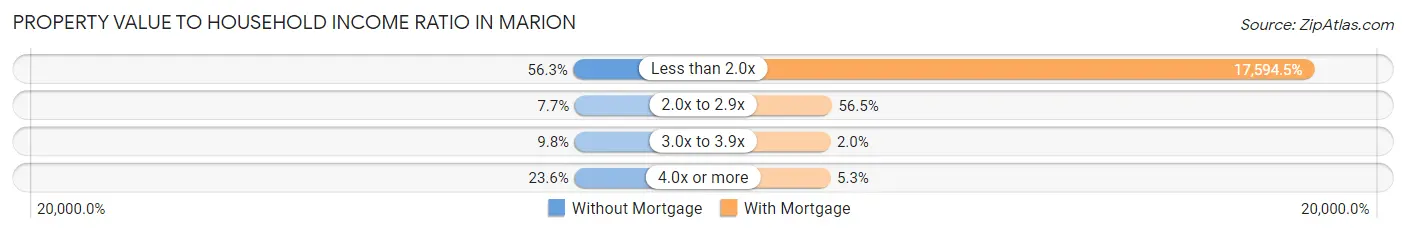
| Value-to-Income Ratio | Without Mortgage | With Mortgage |
| Less than 2.0x | 286 (56.3%) | 89,028 (17,594.5%) |
| 2.0x to 2.9x | 39 (7.7%) | 286 (56.5%) |
| 3.0x to 3.9x | 50 (9.8%) | 10 (2.0%) |
| 4.0x or more | 120 (23.6%) | 27 (5.3%) |
| Total | 508 (100.0%) | 506 (100.0%) |
Real Estate Taxes by Mortgage Status in Marion
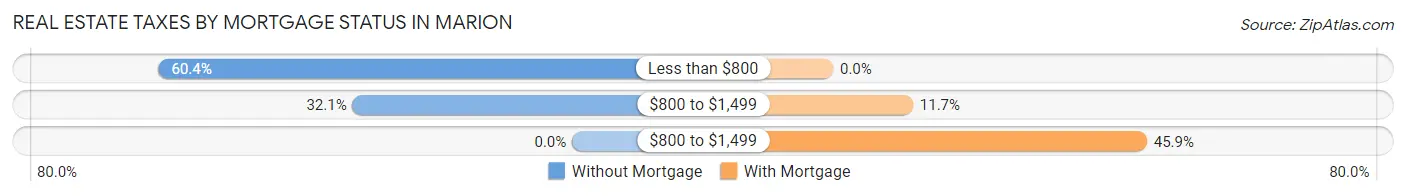
| Property Taxes | Without Mortgage | With Mortgage |
| Less than $800 | 307 (60.4%) | 0 (0.0%) |
| $800 to $1,499 | 163 (32.1%) | 59 (11.7%) |
| $800 to $1,499 | 0 (0.0%) | 232 (45.9%) |
| Total | 508 (100.0%) | 506 (100.0%) |
Health & Disability in Marion
Health Insurance Coverage by Age in Marion
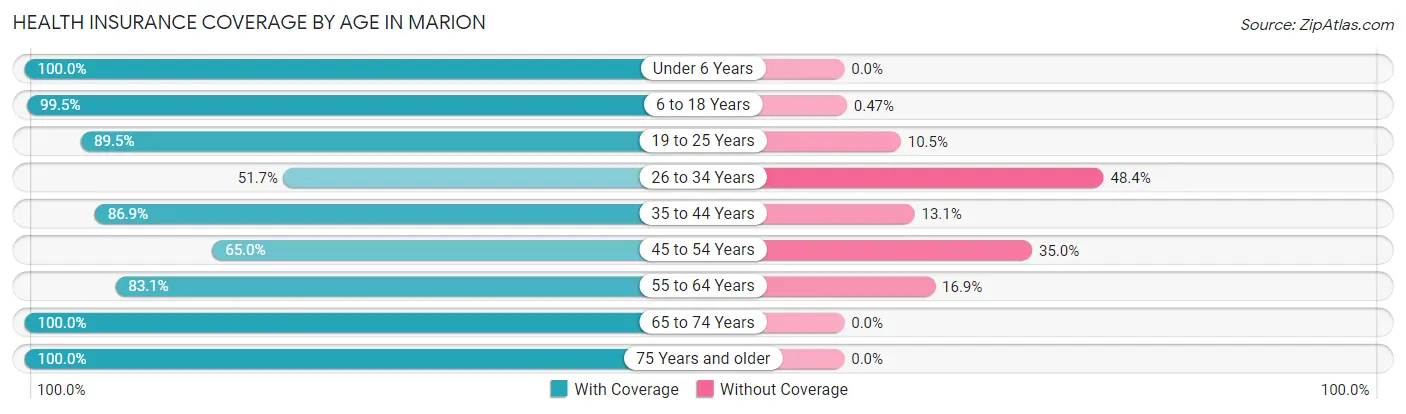
| Age Bracket | With Coverage | Without Coverage |
| Under 6 Years | 275 (100.0%) | 0 (0.0%) |
| 6 to 18 Years | 1,067 (99.5%) | 5 (0.5%) |
| 19 to 25 Years | 136 (89.5%) | 16 (10.5%) |
| 26 to 34 Years | 501 (51.6%) | 469 (48.3%) |
| 35 to 44 Years | 670 (86.9%) | 101 (13.1%) |
| 45 to 54 Years | 596 (65.0%) | 321 (35.0%) |
| 55 to 64 Years | 692 (83.1%) | 141 (16.9%) |
| 65 to 74 Years | 1,015 (100.0%) | 0 (0.0%) |
| 75 Years and older | 375 (100.0%) | 0 (0.0%) |
| Total | 5,327 (83.5%) | 1,053 (16.5%) |
Health Insurance Coverage by Citizenship Status in Marion
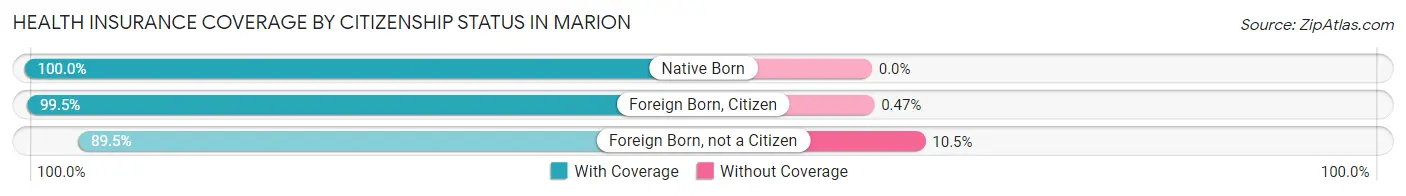
| Citizenship Status | With Coverage | Without Coverage |
| Native Born | 275 (100.0%) | 0 (0.0%) |
| Foreign Born, Citizen | 1,067 (99.5%) | 5 (0.5%) |
| Foreign Born, not a Citizen | 136 (89.5%) | 16 (10.5%) |
Health Insurance Coverage by Household Income in Marion
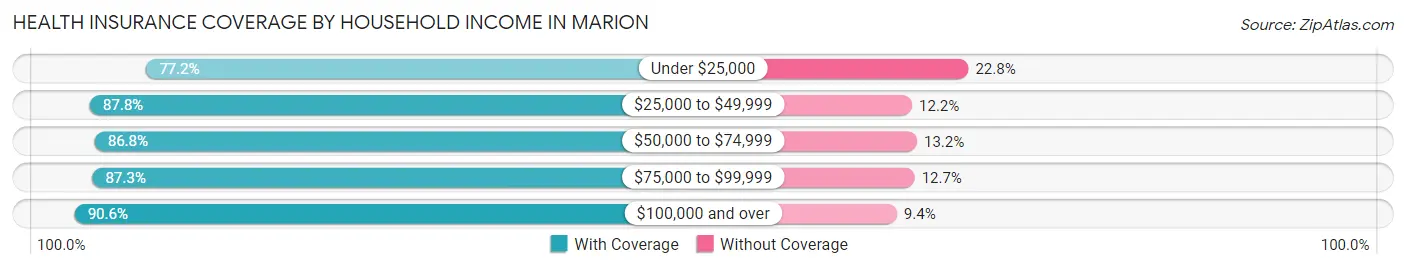
| Household Income | With Coverage | Without Coverage |
| Under $25,000 | 2,008 (77.2%) | 593 (22.8%) |
| $25,000 to $49,999 | 1,333 (87.8%) | 186 (12.2%) |
| $50,000 to $74,999 | 686 (86.8%) | 104 (13.2%) |
| $75,000 to $99,999 | 583 (87.3%) | 85 (12.7%) |
| $100,000 and over | 695 (90.6%) | 72 (9.4%) |
Public vs Private Health Insurance Coverage by Age in Marion
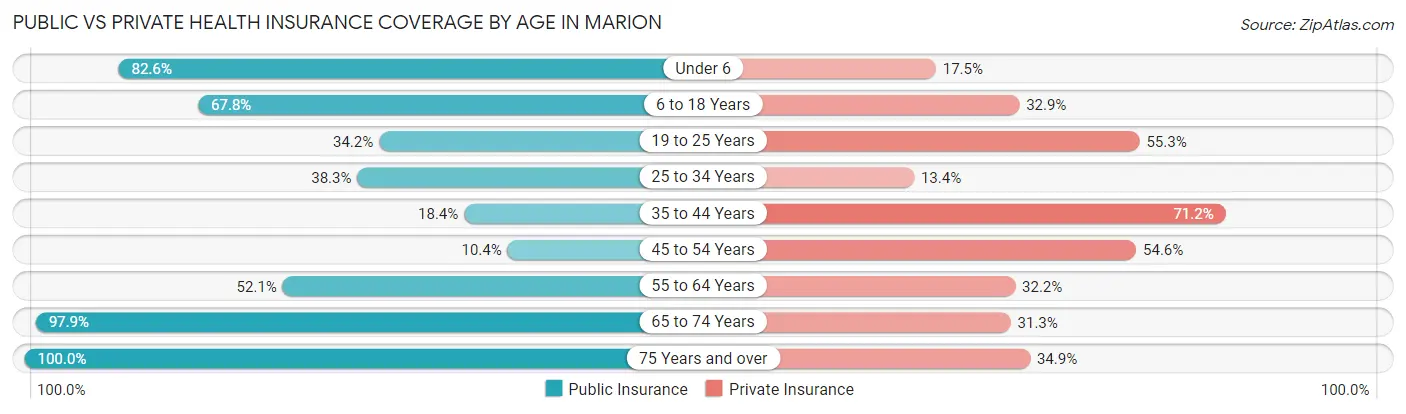
| Age Bracket | Public Insurance | Private Insurance |
| Under 6 | 227 (82.6%) | 48 (17.4%) |
| 6 to 18 Years | 727 (67.8%) | 353 (32.9%) |
| 19 to 25 Years | 52 (34.2%) | 84 (55.3%) |
| 25 to 34 Years | 371 (38.3%) | 130 (13.4%) |
| 35 to 44 Years | 142 (18.4%) | 549 (71.2%) |
| 45 to 54 Years | 95 (10.4%) | 501 (54.6%) |
| 55 to 64 Years | 434 (52.1%) | 268 (32.2%) |
| 65 to 74 Years | 994 (97.9%) | 318 (31.3%) |
| 75 Years and over | 375 (100.0%) | 131 (34.9%) |
| Total | 3,417 (53.6%) | 2,382 (37.3%) |
Disability Status by Sex by Age in Marion
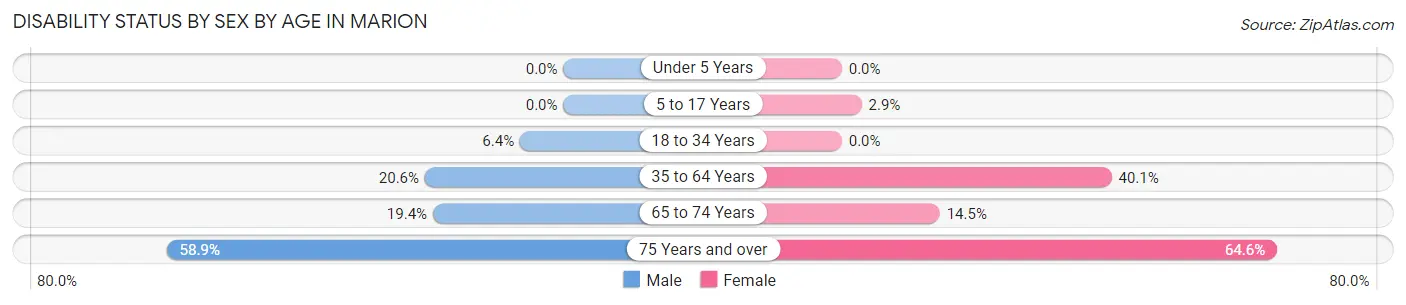
| Age Bracket | Male | Female |
| Under 5 Years | 0 (0.0%) | 0 (0.0%) |
| 5 to 17 Years | 0 (0.0%) | 17 (2.9%) |
| 18 to 34 Years | 27 (6.4%) | 0 (0.0%) |
| 35 to 64 Years | 256 (20.6%) | 511 (40.1%) |
| 65 to 74 Years | 86 (19.4%) | 83 (14.5%) |
| 75 Years and over | 76 (58.9%) | 159 (64.6%) |
Disability Class by Sex by Age in Marion
Disability Class: Hearing Difficulty
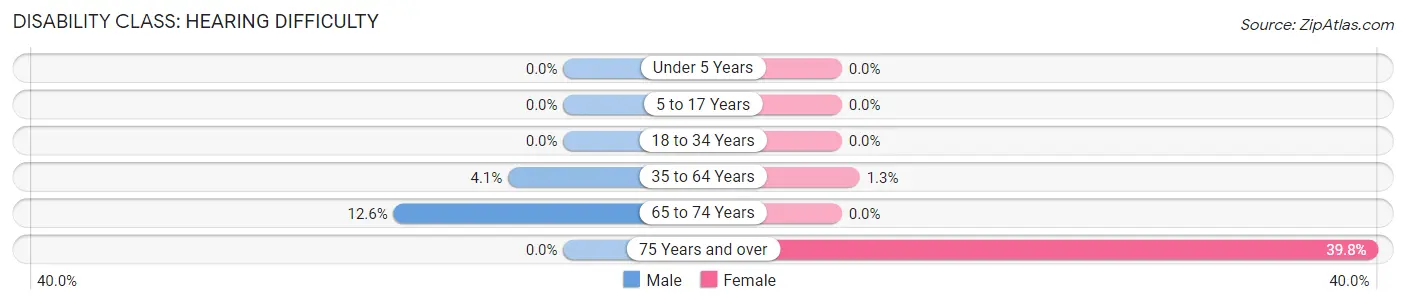
| Age Bracket | Male | Female |
| Under 5 Years | 0 (0.0%) | 0 (0.0%) |
| 5 to 17 Years | 0 (0.0%) | 0 (0.0%) |
| 18 to 34 Years | 0 (0.0%) | 0 (0.0%) |
| 35 to 64 Years | 51 (4.1%) | 17 (1.3%) |
| 65 to 74 Years | 56 (12.6%) | 0 (0.0%) |
| 75 Years and over | 0 (0.0%) | 98 (39.8%) |
Disability Class: Vision Difficulty
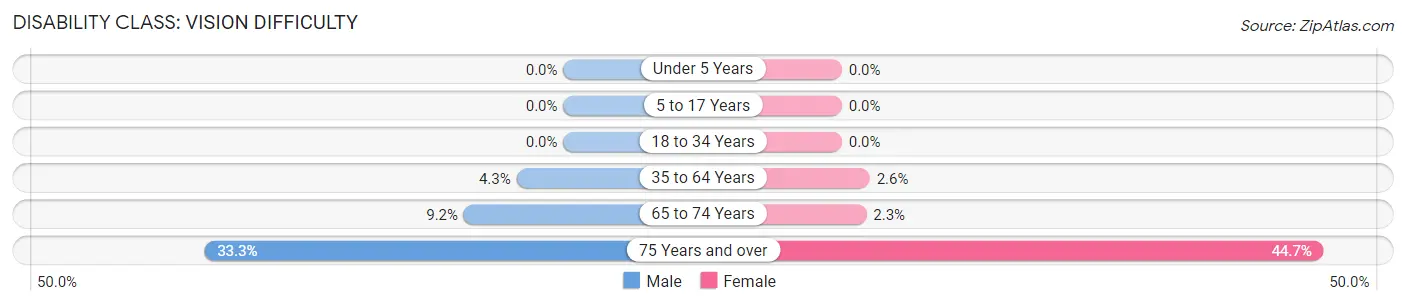
| Age Bracket | Male | Female |
| Under 5 Years | 0 (0.0%) | 0 (0.0%) |
| 5 to 17 Years | 0 (0.0%) | 0 (0.0%) |
| 18 to 34 Years | 0 (0.0%) | 0 (0.0%) |
| 35 to 64 Years | 54 (4.3%) | 33 (2.6%) |
| 65 to 74 Years | 41 (9.2%) | 13 (2.3%) |
| 75 Years and over | 43 (33.3%) | 110 (44.7%) |
Disability Class: Cognitive Difficulty
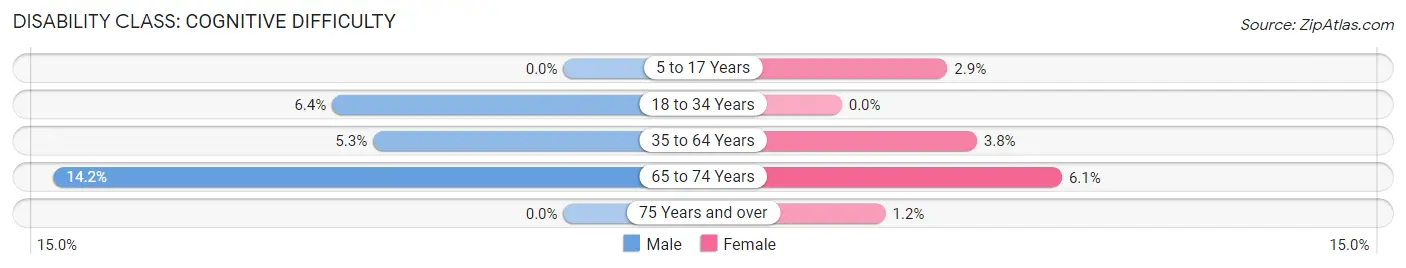
| Age Bracket | Male | Female |
| 5 to 17 Years | 0 (0.0%) | 17 (2.9%) |
| 18 to 34 Years | 27 (6.4%) | 0 (0.0%) |
| 35 to 64 Years | 66 (5.3%) | 48 (3.8%) |
| 65 to 74 Years | 63 (14.2%) | 35 (6.1%) |
| 75 Years and over | 0 (0.0%) | 3 (1.2%) |
Disability Class: Ambulatory Difficulty
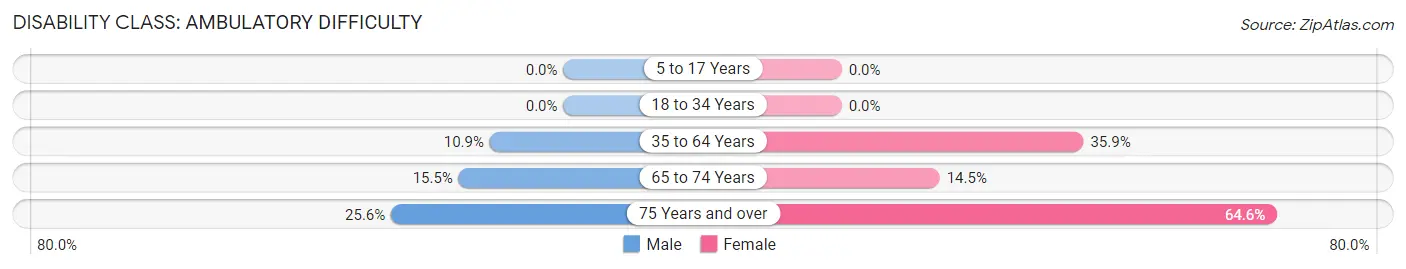
| Age Bracket | Male | Female |
| 5 to 17 Years | 0 (0.0%) | 0 (0.0%) |
| 18 to 34 Years | 0 (0.0%) | 0 (0.0%) |
| 35 to 64 Years | 136 (10.9%) | 458 (35.9%) |
| 65 to 74 Years | 69 (15.5%) | 83 (14.5%) |
| 75 Years and over | 33 (25.6%) | 159 (64.6%) |
Disability Class: Self-Care Difficulty
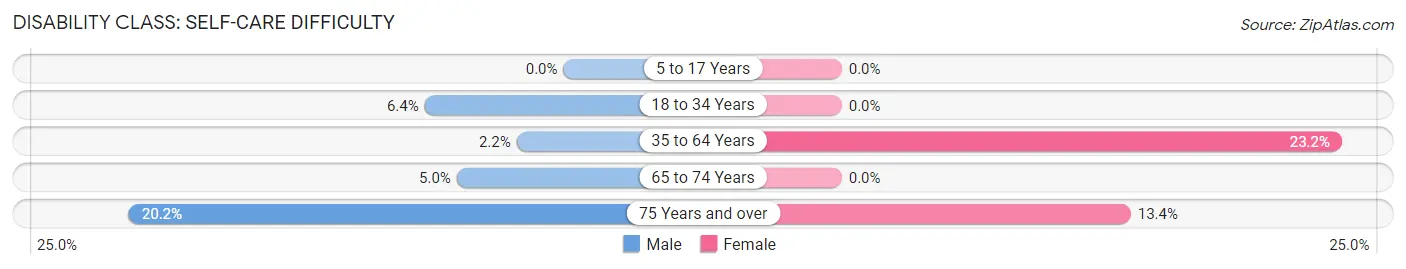
| Age Bracket | Male | Female |
| 5 to 17 Years | 0 (0.0%) | 0 (0.0%) |
| 18 to 34 Years | 27 (6.4%) | 0 (0.0%) |
| 35 to 64 Years | 27 (2.2%) | 296 (23.2%) |
| 65 to 74 Years | 22 (5.0%) | 0 (0.0%) |
| 75 Years and over | 26 (20.2%) | 33 (13.4%) |
Technology Access in Marion
Computing Device Access in Marion
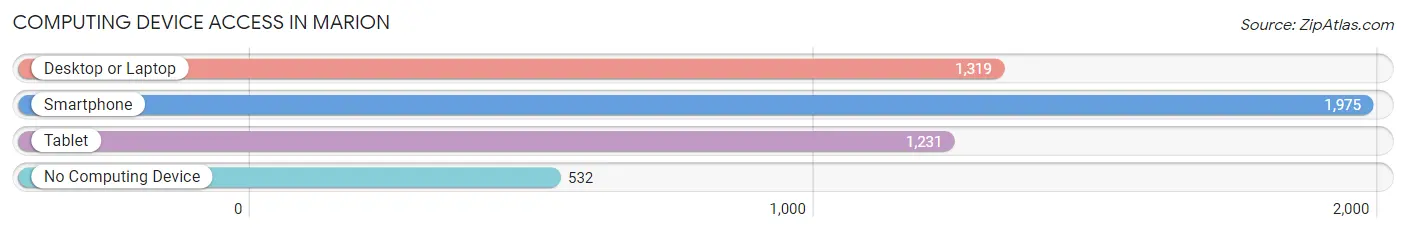
| Device Type | # Households | % Households |
| Desktop or Laptop | 1,319 | 51.3% |
| Smartphone | 1,975 | 76.8% |
| Tablet | 1,231 | 47.8% |
| No Computing Device | 532 | 20.7% |
| Total | 2,573 | 100.0% |
Internet Access in Marion
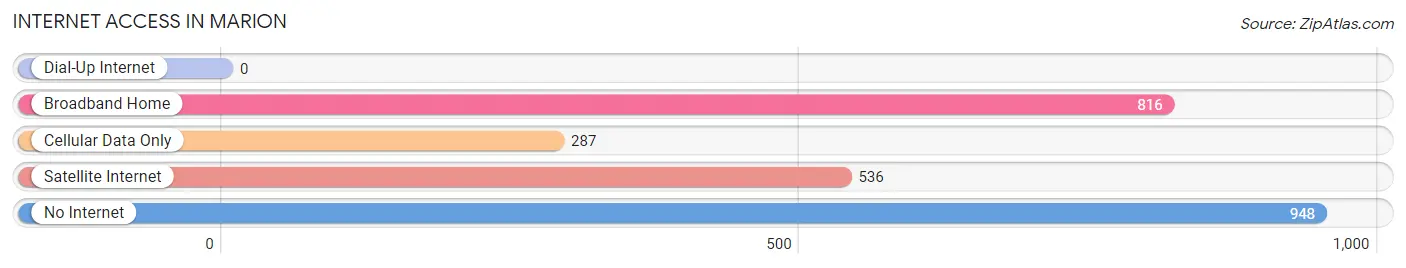
| Internet Type | # Households | % Households |
| Dial-Up Internet | 0 | 0.0% |
| Broadband Home | 816 | 31.7% |
| Cellular Data Only | 287 | 11.2% |
| Satellite Internet | 536 | 20.8% |
| No Internet | 948 | 36.8% |
| Total | 2,573 | 100.0% |
Marion Summary
Marion, South Carolina is a small town located in Marion County, South Carolina. It is the county seat of Marion County and is located in the northeastern part of the state. The town has a population of approximately 6,000 people and is located about 50 miles from the state capital of Columbia.
Geography
Marion is located in the northeastern part of South Carolina, in the Pee Dee region. It is situated on the banks of the Little Pee Dee River, which is a tributary of the Pee Dee River. The town is surrounded by rural farmland and is located about 50 miles from the state capital of Columbia. The town is located at an elevation of about 200 feet above sea level.
The climate in Marion is humid subtropical, with hot, humid summers and mild winters. The average annual temperature is around 70 degrees Fahrenheit, with an average high of around 90 degrees in the summer and an average low of around 50 degrees in the winter. The town receives an average of around 50 inches of precipitation per year, with most of it falling in the summer months.
Economy
Marion’s economy is largely based on agriculture and manufacturing. The town is home to several large agricultural operations, including poultry farms, hog farms, and cotton farms. The town is also home to several manufacturing companies, including a paper mill, a furniture factory, and a plastics factory.
The town is also home to several retail stores, including a Walmart Supercenter, a Lowe’s Home Improvement store, and several other smaller stores. The town also has several restaurants, including several fast food restaurants, a few sit-down restaurants, and several local eateries.
Demographics
As of the 2010 census, the population of Marion was 6,039. The racial makeup of the town was 57.3% White, 37.2% African American, 0.3% Native American, 0.7% Asian, 0.1% Pacific Islander, and 4.4% from other races. Hispanic or Latino of any race were 2.2% of the population.
The median household income in Marion was $30,945, and the median family income was $37,917. The per capita income for the town was $15,945. About 22.2% of the population was below the poverty line.
Marion is served by the Marion County School District, which consists of four elementary schools, one middle school, and one high school. The town is also home to several churches, including Baptist, Methodist, and Presbyterian churches.
Marion is a small town with a rich history and a strong sense of community. The town is home to several large agricultural operations and manufacturing companies, and is served by the Marion County School District. The town has a diverse population and a median household income of around $30,000. Marion is a great place to live and work, and is a great place to call home.
Common Questions
What is Per Capita Income in Marion?
Per Capita income in Marion is $20,851.
What is the Median Family Income in Marion?
Median Family Income in Marion is $30,714.
What is the Median Household income in Marion?
Median Household Income in Marion is $28,551.
What is Income or Wage Gap in Marion?
Income or Wage Gap in Marion is 5.0%.
Women in Marion earn 95.0 cents for every dollar earned by a man.
What is Inequality or Gini Index in Marion?
Inequality or Gini Index in Marion is 0.53.
What is the Total Population of Marion?
Total Population of Marion is 6,402.
What is the Total Male Population of Marion?
Total Male Population of Marion is 2,937.
What is the Total Female Population of Marion?
Total Female Population of Marion is 3,465.
What is the Ratio of Males per 100 Females in Marion?
There are 84.76 Males per 100 Females in Marion.
What is the Ratio of Females per 100 Males in Marion?
There are 117.98 Females per 100 Males in Marion.
What is the Median Population Age in Marion?
Median Population Age in Marion is 44.6 Years.
What is the Average Family Size in Marion
Average Family Size in Marion is 2.9 People.
What is the Average Household Size in Marion
Average Household Size in Marion is 2.5 People.
How Large is the Labor Force in Marion?
There are 2,407 People in the Labor Forcein in Marion.
What is the Percentage of People in the Labor Force in Marion?
45.6% of People are in the Labor Force in Marion.
What is the Unemployment Rate in Marion?
Unemployment Rate in Marion is 5.6%.