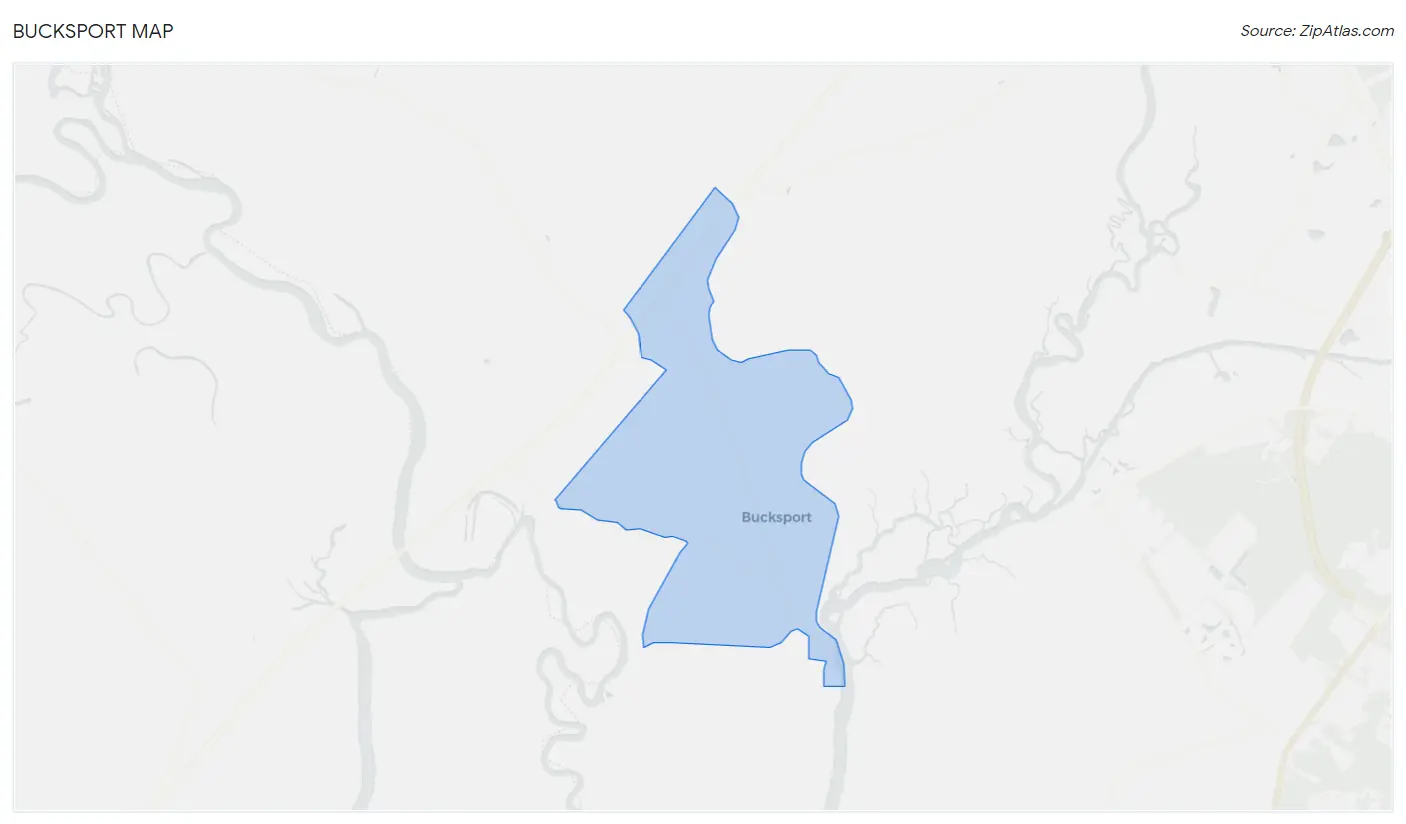
Bucksport, SC Map & Demographics
Bucksport Map
Bucksport Overview
$31,146
PER CAPITA INCOME
$85,236
AVG FAMILY INCOME
$53,438
AVG HOUSEHOLD INCOME
34.9%
WAGE / INCOME GAP [ % ]
65.1¢/ $1
WAGE / INCOME GAP [ $ ]
0.44
INEQUALITY / GINI INDEX
744
TOTAL POPULATION
290
MALE POPULATION
454
FEMALE POPULATION
63.88
MALES / 100 FEMALES
156.55
FEMALES / 100 MALES
50.1
MEDIAN AGE
4.0
AVG FAMILY SIZE
2.5
AVG HOUSEHOLD SIZE
421
LABOR FORCE [ PEOPLE ]
67.5%
PERCENT IN LABOR FORCE
8.6%
UNEMPLOYMENT RATE
Bucksport Area Codes
Income in Bucksport
Income Overview in Bucksport
Per Capita Income in Bucksport is $31,146, while median incomes of families and households are $85,236 and $53,438 respectively.
| Characteristic | Number | Measure |
| Per Capita Income | 744 | $31,146 |
| Median Family Income | 137 | $85,236 |
| Mean Family Income | 137 | $99,495 |
| Median Household Income | 293 | $53,438 |
| Mean Household Income | 293 | $65,151 |
| Income Deficit | 137 | $0 |
| Wage / Income Gap (%) | 744 | 34.91% |
| Wage / Income Gap ($) | 744 | 65.09¢ per $1 |
| Gini / Inequality Index | 744 | 0.44 |
Earnings by Sex in Bucksport
Average Earnings in Bucksport are $34,435, $52,585 for men and $34,230 for women, a difference of 34.9%.
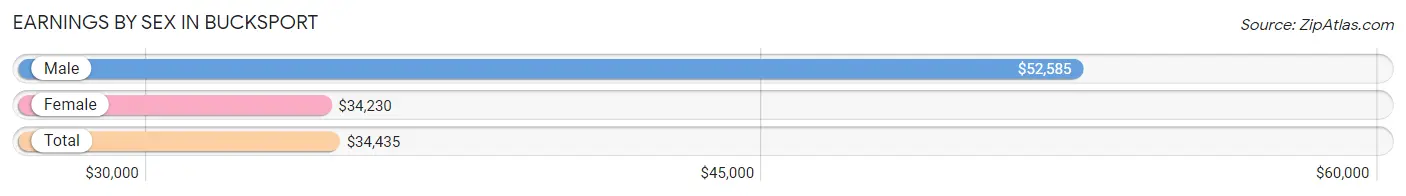
| Sex | Number | Average Earnings |
| Male | 157 (35.7%) | $52,585 |
| Female | 283 (64.3%) | $34,230 |
| Total | 440 (100.0%) | $34,435 |
Earnings by Sex by Income Bracket in Bucksport
The most common earnings brackets in Bucksport are $50,000 to $54,999 for men (44 | 28.0%) and $30,000 to $34,999 for women (112 | 39.6%).
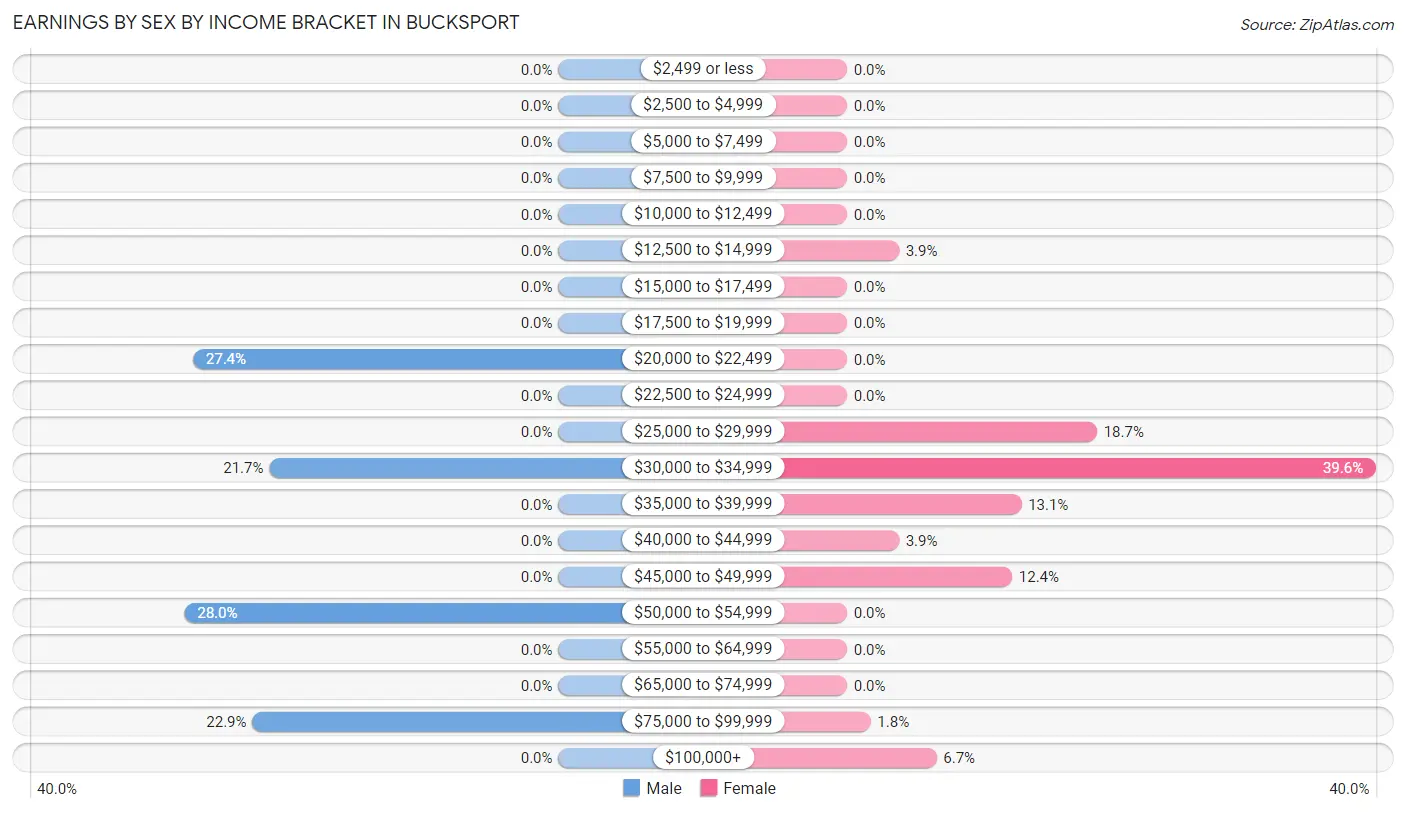
| Income | Male | Female |
| $2,499 or less | 0 (0.0%) | 0 (0.0%) |
| $2,500 to $4,999 | 0 (0.0%) | 0 (0.0%) |
| $5,000 to $7,499 | 0 (0.0%) | 0 (0.0%) |
| $7,500 to $9,999 | 0 (0.0%) | 0 (0.0%) |
| $10,000 to $12,499 | 0 (0.0%) | 0 (0.0%) |
| $12,500 to $14,999 | 0 (0.0%) | 11 (3.9%) |
| $15,000 to $17,499 | 0 (0.0%) | 0 (0.0%) |
| $17,500 to $19,999 | 0 (0.0%) | 0 (0.0%) |
| $20,000 to $22,499 | 43 (27.4%) | 0 (0.0%) |
| $22,500 to $24,999 | 0 (0.0%) | 0 (0.0%) |
| $25,000 to $29,999 | 0 (0.0%) | 53 (18.7%) |
| $30,000 to $34,999 | 34 (21.7%) | 112 (39.6%) |
| $35,000 to $39,999 | 0 (0.0%) | 37 (13.1%) |
| $40,000 to $44,999 | 0 (0.0%) | 11 (3.9%) |
| $45,000 to $49,999 | 0 (0.0%) | 35 (12.4%) |
| $50,000 to $54,999 | 44 (28.0%) | 0 (0.0%) |
| $55,000 to $64,999 | 0 (0.0%) | 0 (0.0%) |
| $65,000 to $74,999 | 0 (0.0%) | 0 (0.0%) |
| $75,000 to $99,999 | 36 (22.9%) | 5 (1.8%) |
| $100,000+ | 0 (0.0%) | 19 (6.7%) |
| Total | 157 (100.0%) | 283 (100.0%) |
Earnings by Sex by Educational Attainment in Bucksport
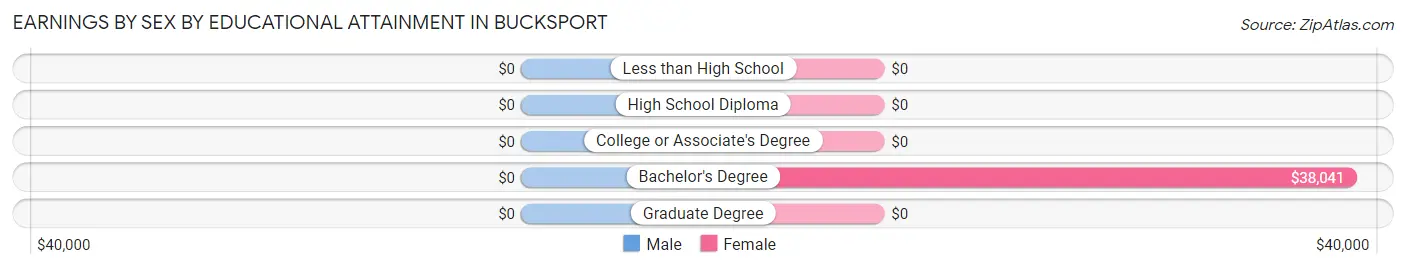
| Educational Attainment | Male Income | Female Income |
| Less than High School | - | - |
| High School Diploma | - | - |
| College or Associate's Degree | - | - |
| Bachelor's Degree | - | - |
| Graduate Degree | - | - |
| Total | $52,756 | $34,841 |
Family Income in Bucksport
Family Income Brackets in Bucksport
According to the Bucksport family income data, there are 37 families falling into the $75,000 to $99,999 income range, which is the most common income bracket and makes up 27.0% of all families.
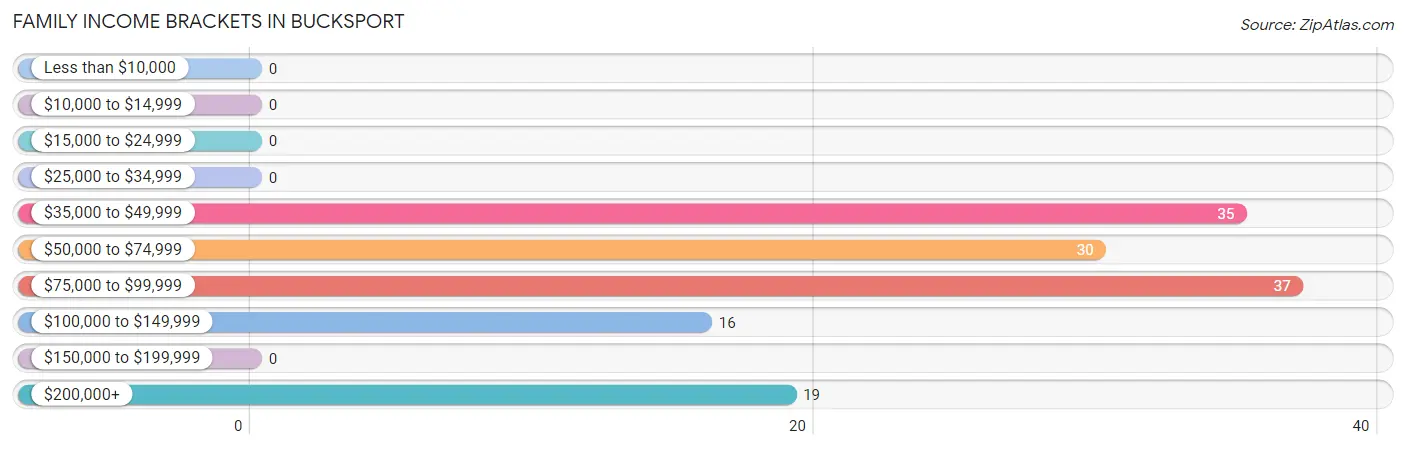
| Income Bracket | # Families | % Families |
| Less than $10,000 | 0 | 0.0% |
| $10,000 to $14,999 | 0 | 0.0% |
| $15,000 to $24,999 | 0 | 0.0% |
| $25,000 to $34,999 | 0 | 0.0% |
| $35,000 to $49,999 | 35 | 25.5% |
| $50,000 to $74,999 | 30 | 21.9% |
| $75,000 to $99,999 | 37 | 27.0% |
| $100,000 to $149,999 | 16 | 11.7% |
| $150,000 to $199,999 | 0 | 0.0% |
| $200,000+ | 19 | 13.9% |
Family Income by Famaliy Size in Bucksport
2-person families (67 | 48.9%) account for the highest median family income in Bucksport with $85,236 per family, while 2-person families (67 | 48.9%) have the highest median income of $42,618 per family member.
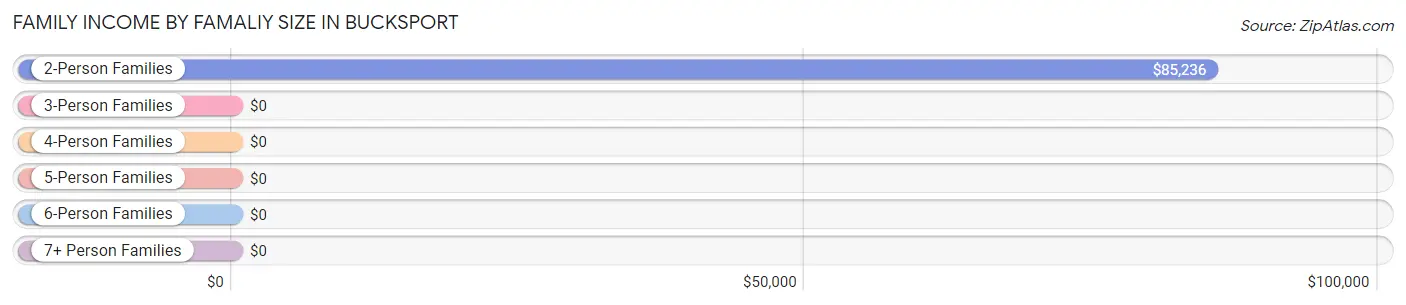
| Income Bracket | # Families | Median Income |
| 2-Person Families | 67 (48.9%) | $85,236 |
| 3-Person Families | 0 (0.0%) | $0 |
| 4-Person Families | 54 (39.4%) | $0 |
| 5-Person Families | 16 (11.7%) | $0 |
| 6-Person Families | 0 (0.0%) | $0 |
| 7+ Person Families | 0 (0.0%) | $0 |
| Total | 137 (100.0%) | $85,236 |
Family Income by Number of Earners in Bucksport
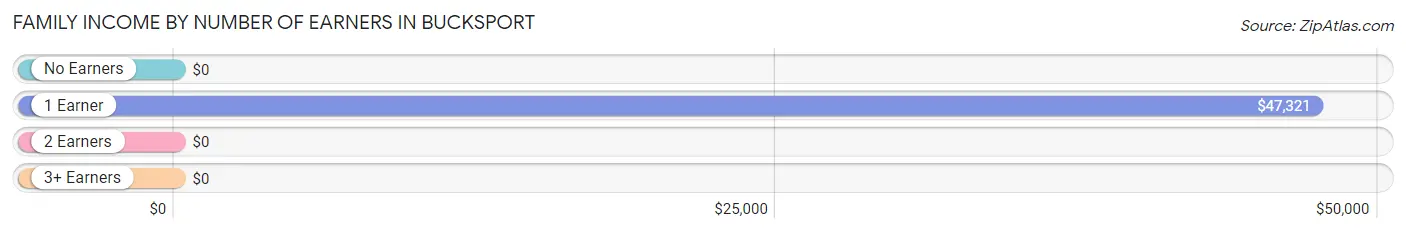
| Number of Earners | # Families | Median Income |
| No Earners | 0 (0.0%) | $0 |
| 1 Earner | 65 (47.4%) | $47,321 |
| 2 Earners | 48 (35.0%) | $0 |
| 3+ Earners | 24 (17.5%) | $0 |
| Total | 137 (100.0%) | $85,236 |
Household Income in Bucksport
Household Income Brackets in Bucksport
With 109 households falling in the category, the $50,000 to $74,999 income range is the most frequent in Bucksport, accounting for 37.2% of all households.
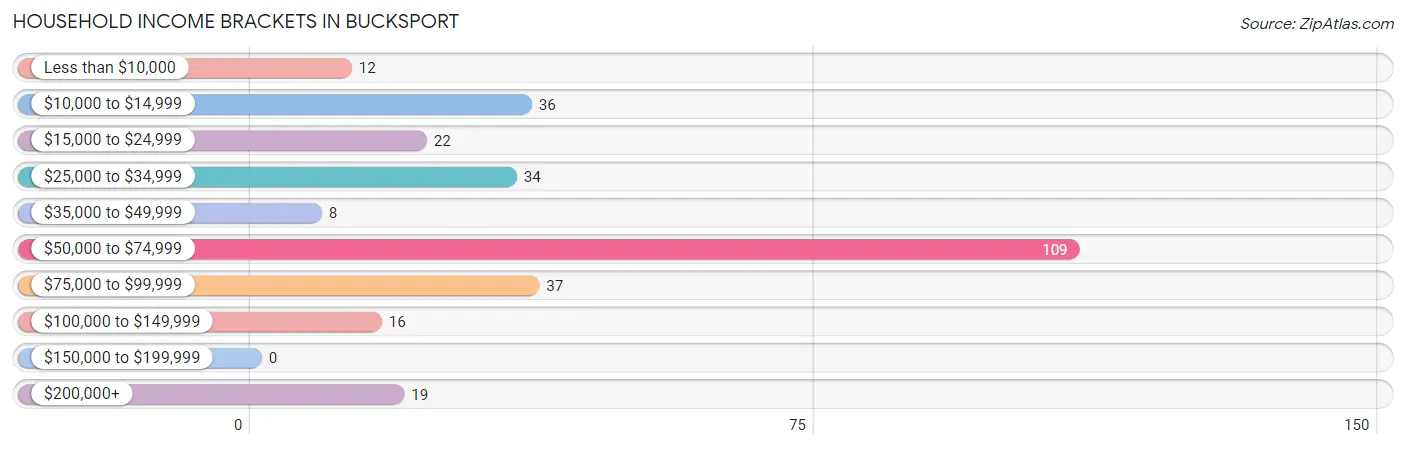
| Income Bracket | # Households | % Households |
| Less than $10,000 | 12 | 4.1% |
| $10,000 to $14,999 | 36 | 12.3% |
| $15,000 to $24,999 | 22 | 7.5% |
| $25,000 to $34,999 | 34 | 11.6% |
| $35,000 to $49,999 | 8 | 2.7% |
| $50,000 to $74,999 | 109 | 37.2% |
| $75,000 to $99,999 | 37 | 12.6% |
| $100,000 to $149,999 | 16 | 5.5% |
| $150,000 to $199,999 | 0 | 0.0% |
| $200,000+ | 19 | 6.5% |
Household Income by Householder Age in Bucksport
The median household income in Bucksport is $53,438, with the highest median household income of $43,750 found in the 45 to 64 years age bracket for the primary householder. A total of 186 households (63.5%) fall into this category. Meanwhile, the 15 to 24 years age bracket for the primary householder has the lowest median household income of $0, with 35 households (11.9%) in this group.
| Income Bracket | # Households | Median Income |
| 15 to 24 Years | 35 (11.9%) | $0 |
| 25 to 44 Years | 5 (1.7%) | $0 |
| 45 to 64 Years | 186 (63.5%) | $43,750 |
| 65+ Years | 67 (22.9%) | $0 |
| Total | 293 (100.0%) | $53,438 |
Poverty in Bucksport
Income Below Poverty by Sex and Age in Bucksport
With 4.1% poverty level for males and 10.6% for females among the residents of Bucksport, 55 to 64 year old males and 55 to 64 year old females are the most vulnerable to poverty, with 12 males (20.0%) and 48 females (44.0%) in their respective age groups living below the poverty level.
| Age Bracket | Male | Female |
| Under 5 Years | 0 (0.0%) | 0 (0.0%) |
| 5 Years | 0 (0.0%) | 0 (0.0%) |
| 6 to 11 Years | 0 (0.0%) | 0 (0.0%) |
| 12 to 14 Years | 0 (0.0%) | 0 (0.0%) |
| 15 Years | 0 (0.0%) | 0 (0.0%) |
| 16 and 17 Years | 0 (0.0%) | 0 (0.0%) |
| 18 to 24 Years | 0 (0.0%) | 0 (0.0%) |
| 25 to 34 Years | 0 (0.0%) | 0 (0.0%) |
| 35 to 44 Years | 0 (0.0%) | 0 (0.0%) |
| 45 to 54 Years | 0 (0.0%) | 0 (0.0%) |
| 55 to 64 Years | 12 (20.0%) | 48 (44.0%) |
| 65 to 74 Years | 0 (0.0%) | 0 (0.0%) |
| 75 Years and over | 0 (0.0%) | 0 (0.0%) |
| Total | 12 (4.1%) | 48 (10.6%) |
Income Above Poverty by Sex and Age in Bucksport
According to the poverty statistics in Bucksport, males aged under 5 years and females aged under 5 years are the age groups that are most secure financially, with 100.0% of males and 100.0% of females in these age groups living above the poverty line.
| Age Bracket | Male | Female |
| Under 5 Years | 31 (100.0%) | 48 (100.0%) |
| 5 Years | 0 (0.0%) | 0 (0.0%) |
| 6 to 11 Years | 0 (0.0%) | 36 (100.0%) |
| 12 to 14 Years | 0 (0.0%) | 5 (100.0%) |
| 15 Years | 0 (0.0%) | 0 (0.0%) |
| 16 and 17 Years | 0 (0.0%) | 0 (0.0%) |
| 18 to 24 Years | 6 (100.0%) | 132 (100.0%) |
| 25 to 34 Years | 33 (100.0%) | 19 (100.0%) |
| 35 to 44 Years | 4 (100.0%) | 5 (100.0%) |
| 45 to 54 Years | 138 (100.0%) | 47 (100.0%) |
| 55 to 64 Years | 48 (80.0%) | 61 (56.0%) |
| 65 to 74 Years | 18 (100.0%) | 45 (100.0%) |
| 75 Years and over | 0 (0.0%) | 8 (100.0%) |
| Total | 278 (95.9%) | 406 (89.4%) |
Income Below Poverty Among Married-Couple Families in Bucksport
| Children | Above Poverty | Below Poverty |
| No Children | 12 (100.0%) | 0 (0.0%) |
| 1 or 2 Children | 16 (100.0%) | 0 (0.0%) |
| 3 or 4 Children | 0 (0.0%) | 0 (0.0%) |
| 5 or more Children | 0 (0.0%) | 0 (0.0%) |
| Total | 28 (100.0%) | 0 (0.0%) |
Income Below Poverty Among Single-Parent Households in Bucksport
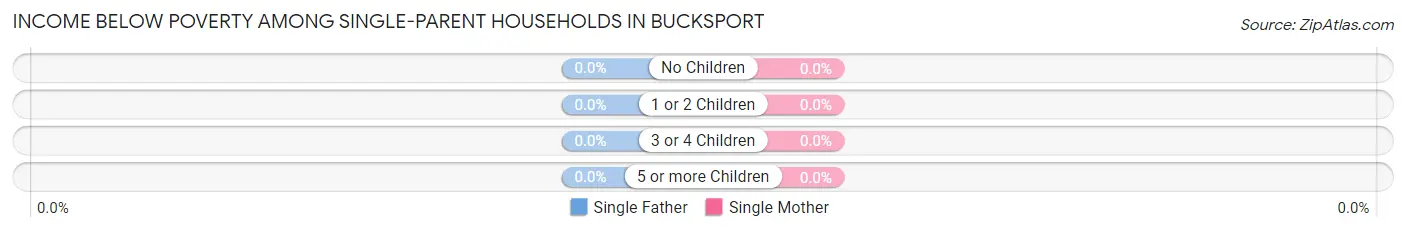
| Children | Single Father | Single Mother |
| No Children | 0 (0.0%) | 0 (0.0%) |
| 1 or 2 Children | 0 (0.0%) | 0 (0.0%) |
| 3 or 4 Children | 0 (0.0%) | 0 (0.0%) |
| 5 or more Children | 0 (0.0%) | 0 (0.0%) |
| Total | 0 (0.0%) | 0 (0.0%) |
Income Below Poverty Among Married-Couple vs Single-Parent Households in Bucksport
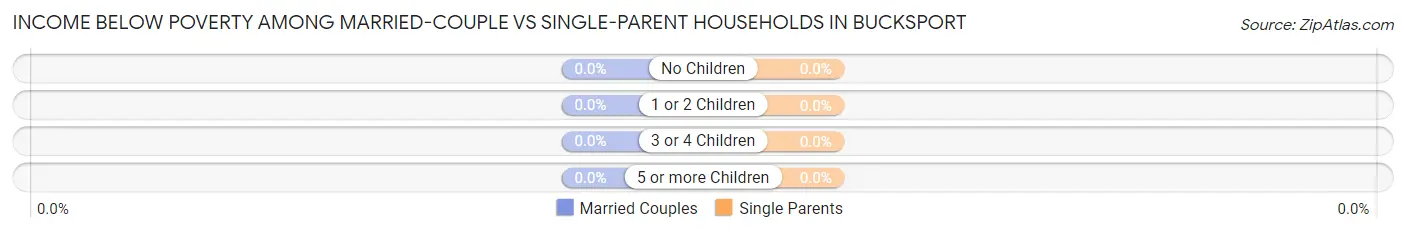
| Children | Married-Couple Families | Single-Parent Households |
| No Children | 0 (0.0%) | 0 (0.0%) |
| 1 or 2 Children | 0 (0.0%) | 0 (0.0%) |
| 3 or 4 Children | 0 (0.0%) | 0 (0.0%) |
| 5 or more Children | 0 (0.0%) | 0 (0.0%) |
| Total | 0 (0.0%) | 0 (0.0%) |
Race in Bucksport
The most populous races in Bucksport are Black / African American (650 | 87.4%), and Asian (94 | 12.6%).
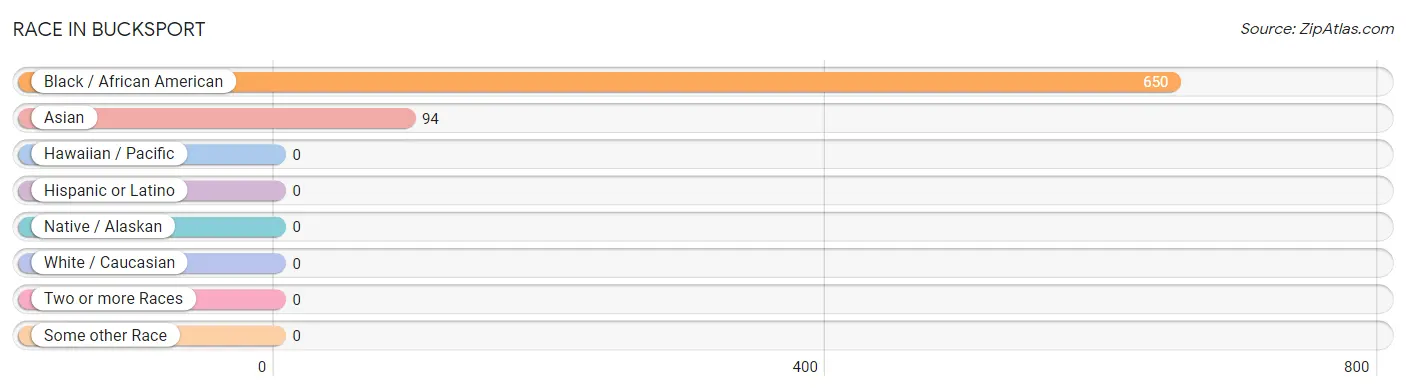
| Race | # Population | % Population |
| Asian | 94 | 12.6% |
| Black / African American | 650 | 87.4% |
| Hawaiian / Pacific | 0 | 0.0% |
| Hispanic or Latino | 0 | 0.0% |
| Native / Alaskan | 0 | 0.0% |
| White / Caucasian | 0 | 0.0% |
| Two or more Races | 0 | 0.0% |
| Some other Race | 0 | 0.0% |
| Total | 744 | 100.0% |
Ancestry in Bucksport
The most populous ancestries reported in Bucksport are , and Korean (94 | 12.6%), together accounting for 12.6% of all Bucksport residents.

| Ancestry | # Population | % Population |
| Korean | 94 | 12.6% | View All 1 Rows |
Immigrants in Bucksport
The most numerous immigrant groups reported in Bucksport came from Asia (94 | 12.6%), Philippines (94 | 12.6%), and South Eastern Asia (94 | 12.6%), together accounting for 37.9% of all Bucksport residents.
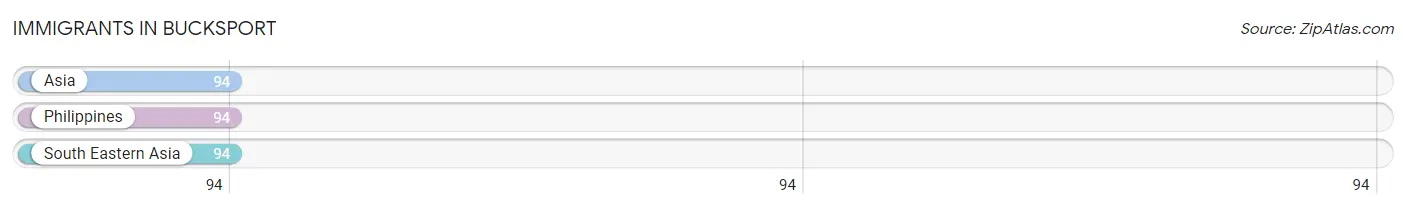
| Immigration Origin | # Population | % Population |
| Asia | 94 | 12.6% |
| Philippines | 94 | 12.6% |
| South Eastern Asia | 94 | 12.6% | View All 3 Rows |
Sex and Age in Bucksport
Sex and Age in Bucksport
The most populous age groups in Bucksport are 50 to 54 Years (138 | 47.6%) for men and 20 to 24 Years (132 | 29.1%) for women.
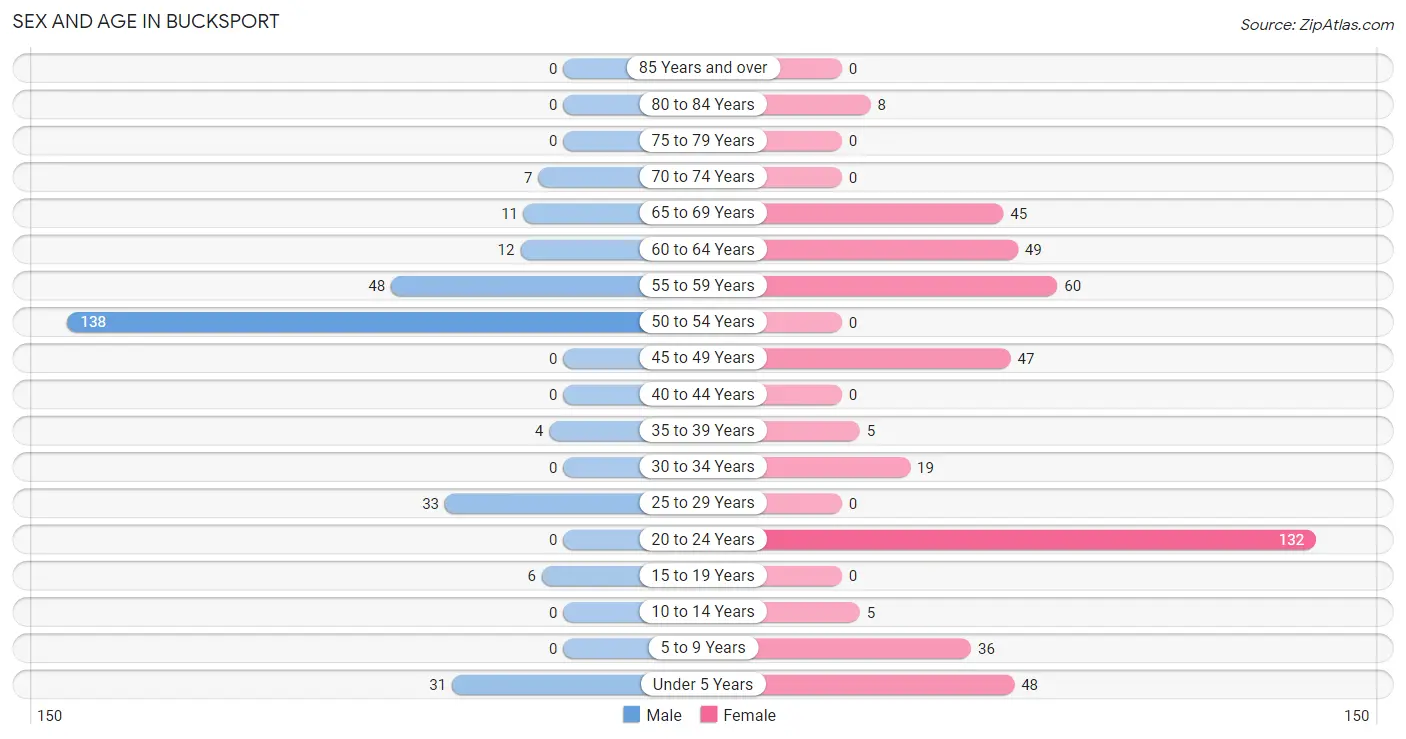
| Age Bracket | Male | Female |
| Under 5 Years | 31 (10.7%) | 48 (10.6%) |
| 5 to 9 Years | 0 (0.0%) | 36 (7.9%) |
| 10 to 14 Years | 0 (0.0%) | 5 (1.1%) |
| 15 to 19 Years | 6 (2.1%) | 0 (0.0%) |
| 20 to 24 Years | 0 (0.0%) | 132 (29.1%) |
| 25 to 29 Years | 33 (11.4%) | 0 (0.0%) |
| 30 to 34 Years | 0 (0.0%) | 19 (4.2%) |
| 35 to 39 Years | 4 (1.4%) | 5 (1.1%) |
| 40 to 44 Years | 0 (0.0%) | 0 (0.0%) |
| 45 to 49 Years | 0 (0.0%) | 47 (10.3%) |
| 50 to 54 Years | 138 (47.6%) | 0 (0.0%) |
| 55 to 59 Years | 48 (16.6%) | 60 (13.2%) |
| 60 to 64 Years | 12 (4.1%) | 49 (10.8%) |
| 65 to 69 Years | 11 (3.8%) | 45 (9.9%) |
| 70 to 74 Years | 7 (2.4%) | 0 (0.0%) |
| 75 to 79 Years | 0 (0.0%) | 0 (0.0%) |
| 80 to 84 Years | 0 (0.0%) | 8 (1.8%) |
| 85 Years and over | 0 (0.0%) | 0 (0.0%) |
| Total | 290 (100.0%) | 454 (100.0%) |
Families and Households in Bucksport
Median Family Size in Bucksport
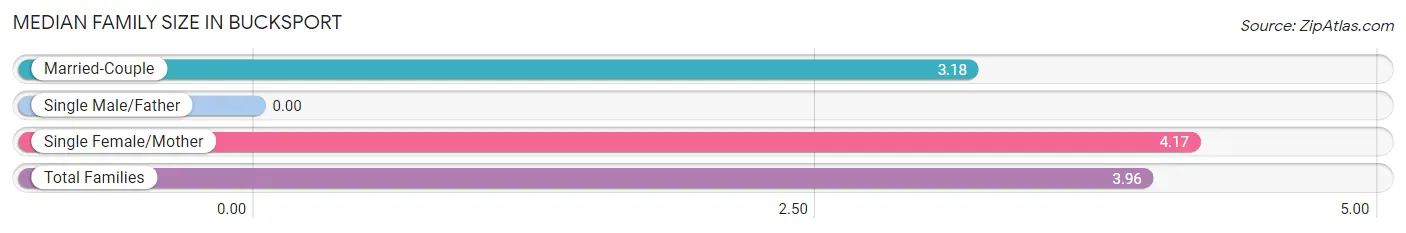
| Family Type | # Families | Family Size |
| Married-Couple | 28 (20.4%) | 3.18 |
| Single Male/Father | 0 (0.0%) | - |
| Single Female/Mother | 109 (79.6%) | 4.17 |
| Total Families | 137 (100.0%) | 3.96 |
Median Household Size in Bucksport
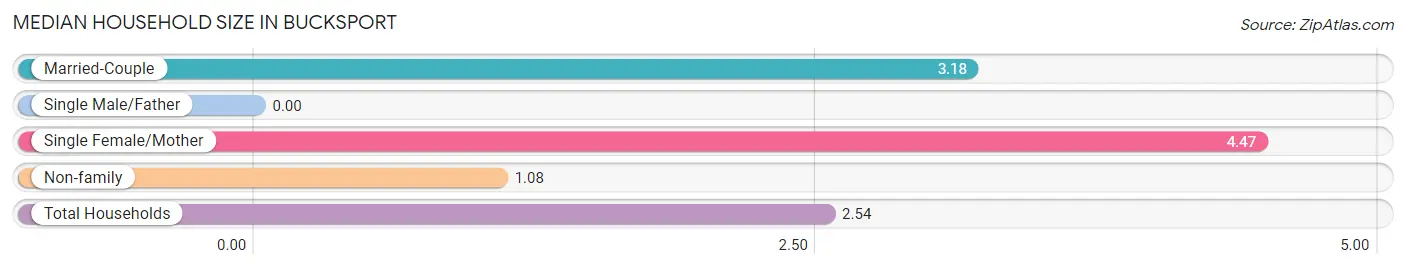
| Household Type | # Households | Household Size |
| Married-Couple | 28 (9.6%) | 3.18 |
| Single Male/Father | 0 (0.0%) | - |
| Single Female/Mother | 109 (37.2%) | 4.47 |
| Non-family | 156 (53.2%) | 1.08 |
| Total Households | 293 (100.0%) | 2.54 |
Household Size by Marriage Status in Bucksport
Out of a total of 293 households in Bucksport, 137 (46.8%) are family households, while 156 (53.2%) are nonfamily households. The most numerous type of family households are 2-person households, comprising 67, and the most common type of nonfamily households are 1-person households, comprising 144.
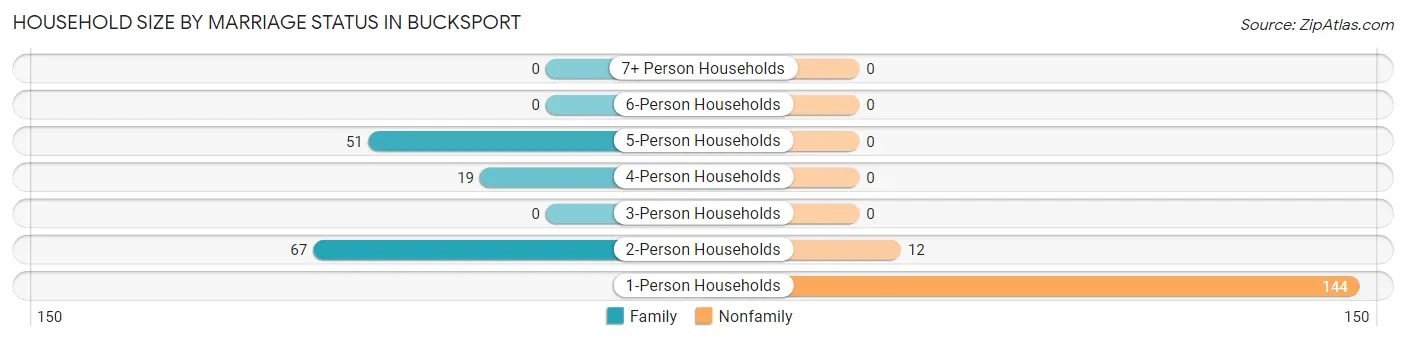
| Household Size | Family Households | Nonfamily Households |
| 1-Person Households | - | 144 (49.1%) |
| 2-Person Households | 67 (22.9%) | 12 (4.1%) |
| 3-Person Households | 0 (0.0%) | 0 (0.0%) |
| 4-Person Households | 19 (6.5%) | 0 (0.0%) |
| 5-Person Households | 51 (17.4%) | 0 (0.0%) |
| 6-Person Households | 0 (0.0%) | 0 (0.0%) |
| 7+ Person Households | 0 (0.0%) | 0 (0.0%) |
| Total | 137 (46.8%) | 156 (53.2%) |
Female Fertility in Bucksport
Fertility by Age in Bucksport
Average fertility rate in Bucksport is 25.0 births per 1,000 women. Women in the age bracket of 35 to 50 years have the highest fertility rate with 96.0 births per 1,000 women. Women in the age bracket of 35 to 50 years acount for 100.0% of all women with births.
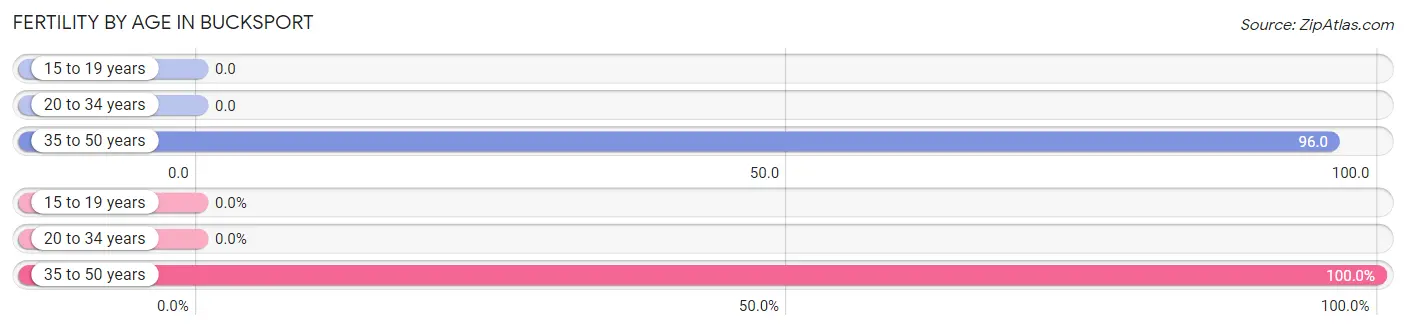
| Age Bracket | Women with Births | Births / 1,000 Women |
| 15 to 19 years | 0 (0.0%) | 0.0 |
| 20 to 34 years | 0 (0.0%) | 0.0 |
| 35 to 50 years | 5 (100.0%) | 96.0 |
| Total | 5 (100.0%) | 25.0 |
Fertility by Age by Marriage Status in Bucksport
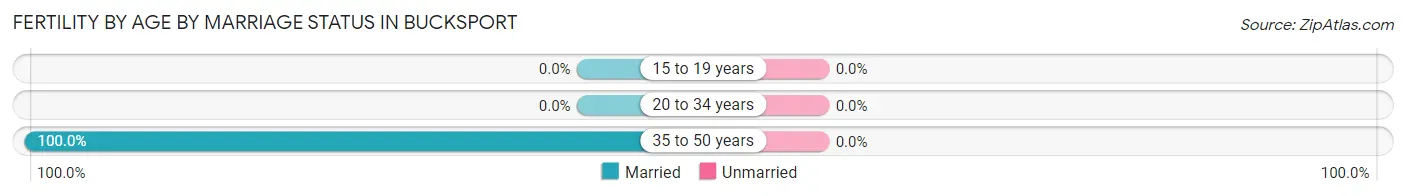
| Age Bracket | Married | Unmarried |
| 15 to 19 years | 0 (0.0%) | 0 (0.0%) |
| 20 to 34 years | 0 (0.0%) | 0 (0.0%) |
| 35 to 50 years | 5 (100.0%) | 0 (0.0%) |
| Total | 5 (100.0%) | 0 (0.0%) |
Fertility by Education in Bucksport
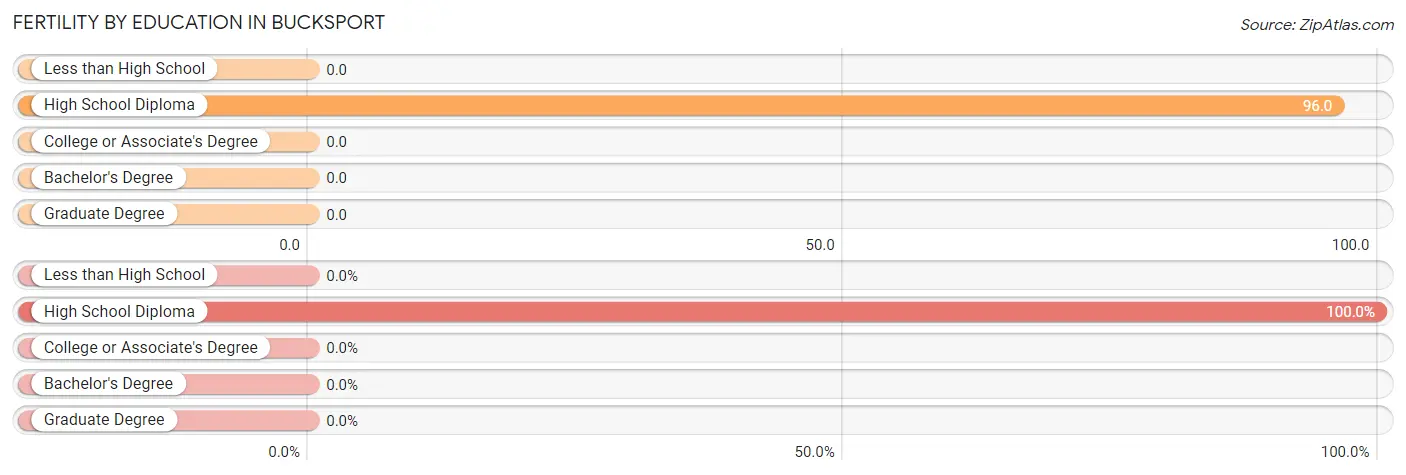
| Educational Attainment | Women with Births | Births / 1,000 Women |
| Less than High School | 0 (0.0%) | 0.0 |
| High School Diploma | 5 (100.0%) | 96.0 |
| College or Associate's Degree | 0 (0.0%) | 0.0 |
| Bachelor's Degree | 0 (0.0%) | 0.0 |
| Graduate Degree | 0 (0.0%) | 0.0 |
| Total | 5 (100.0%) | 25.0 |
Fertility by Education by Marriage Status in Bucksport
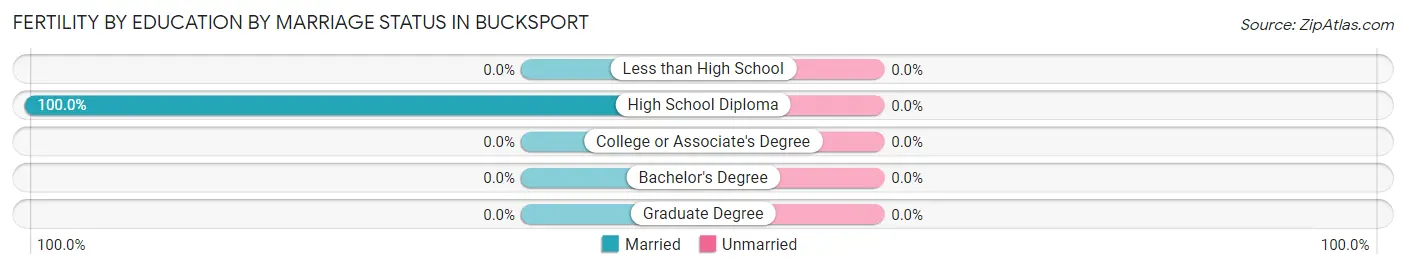
| Educational Attainment | Married | Unmarried |
| Less than High School | 0 (0.0%) | 0 (0.0%) |
| High School Diploma | 5 (100.0%) | 0 (0.0%) |
| College or Associate's Degree | 0 (0.0%) | 0 (0.0%) |
| Bachelor's Degree | 0 (0.0%) | 0 (0.0%) |
| Graduate Degree | 0 (0.0%) | 0 (0.0%) |
| Total | 5 (100.0%) | 0 (0.0%) |
Employment Characteristics in Bucksport
Employment by Class of Employer in Bucksport
Among the 374 employed individuals in Bucksport, private company employees (302 | 80.7%), state government employees (61 | 16.3%), and local government employees (11 | 2.9%) make up the most common classes of employment.
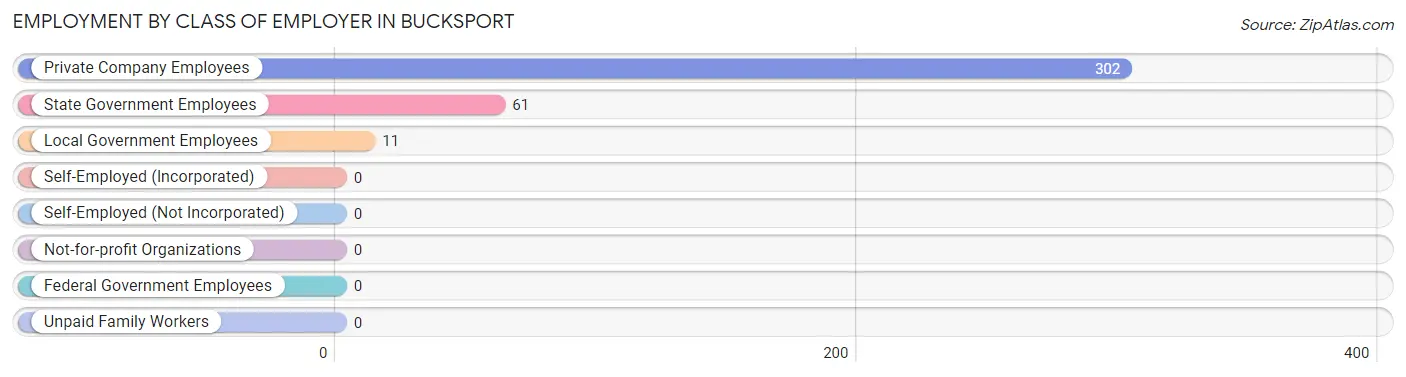
| Employer Class | # Employees | % Employees |
| Private Company Employees | 302 | 80.7% |
| Self-Employed (Incorporated) | 0 | 0.0% |
| Self-Employed (Not Incorporated) | 0 | 0.0% |
| Not-for-profit Organizations | 0 | 0.0% |
| Local Government Employees | 11 | 2.9% |
| State Government Employees | 61 | 16.3% |
| Federal Government Employees | 0 | 0.0% |
| Unpaid Family Workers | 0 | 0.0% |
| Total | 374 | 100.0% |
Employment Status by Age in Bucksport
According to the labor force statistics for Bucksport, out of the total population over 16 years of age (624), 67.5% or 421 individuals are in the labor force, with 8.6% or 36 of them unemployed. The age group with the highest labor force participation rate is 16 to 19 years, with 100.0% or 6 individuals in the labor force. Within the labor force, the 55 to 59 years age range has the highest percentage of unemployed individuals, with 42.9% or 36 of them being unemployed.
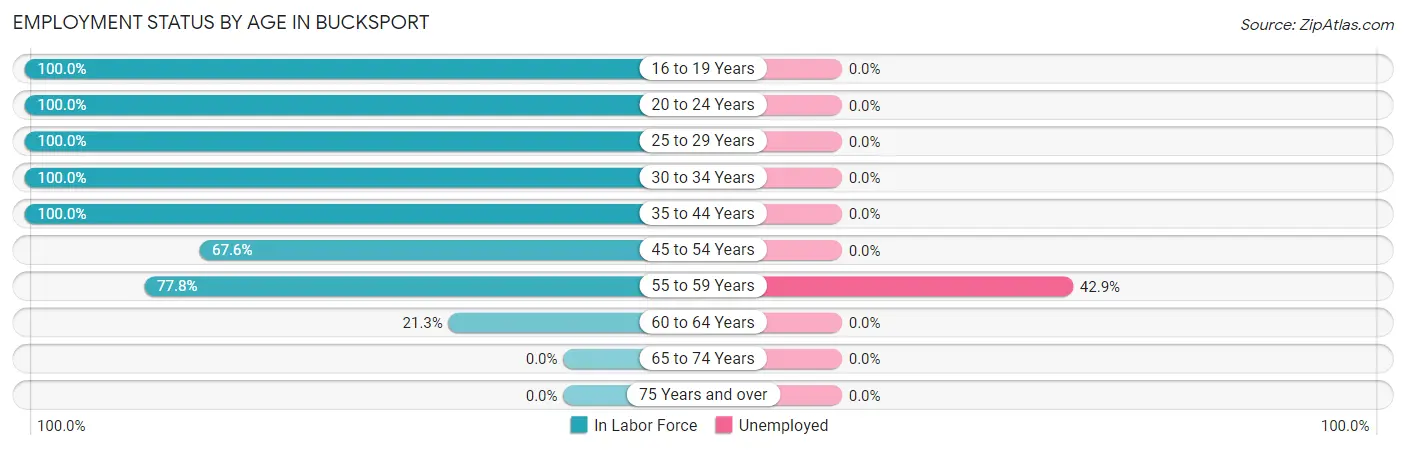
| Age Bracket | In Labor Force | Unemployed |
| 16 to 19 Years | 6 (100.0%) | 0 (0.0%) |
| 20 to 24 Years | 132 (100.0%) | 0 (0.0%) |
| 25 to 29 Years | 33 (100.0%) | 0 (0.0%) |
| 30 to 34 Years | 19 (100.0%) | 0 (0.0%) |
| 35 to 44 Years | 9 (100.0%) | 0 (0.0%) |
| 45 to 54 Years | 125 (67.6%) | 0 (0.0%) |
| 55 to 59 Years | 84 (77.8%) | 36 (42.9%) |
| 60 to 64 Years | 13 (21.3%) | 0 (0.0%) |
| 65 to 74 Years | 0 (0.0%) | 0 (0.0%) |
| 75 Years and over | 0 (0.0%) | 0 (0.0%) |
| Total | 421 (67.5%) | 36 (8.6%) |
Employment Status by Educational Attainment in Bucksport
According to labor force statistics for Bucksport, 68.2% of individuals (283) out of the total population between 25 and 64 years of age (415) are in the labor force, with 12.7% or 36 of them being unemployed. The group with the highest labor force participation rate are those with the educational attainment of less than high school, with 100.0% or 4 individuals in the labor force. Within the labor force, individuals with college / associate degree education have the highest percentage of unemployment, with 44.4% or 36 of them being unemployed.
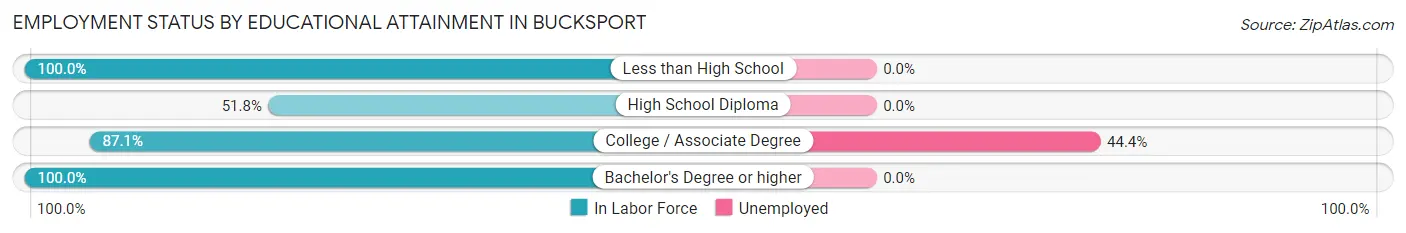
| Educational Attainment | In Labor Force | Unemployed |
| Less than High School | 4 (100.0%) | 0 (0.0%) |
| High School Diploma | 129 (51.8%) | 0 (0.0%) |
| College / Associate Degree | 81 (87.1%) | 41 (44.4%) |
| Bachelor's Degree or higher | 69 (100.0%) | 0 (0.0%) |
| Total | 283 (68.2%) | 53 (12.7%) |
Employment Occupations by Sex in Bucksport
Management, Business, Science and Arts Occupations
The most common Management, Business, Science and Arts occupations in Bucksport are Management (45 | 11.7%), Business & Financial (37 | 9.6%), Computers, Engineering & Science (35 | 9.1%), Computers & Mathematics (35 | 9.1%), and Community & Social Service (32 | 8.3%).
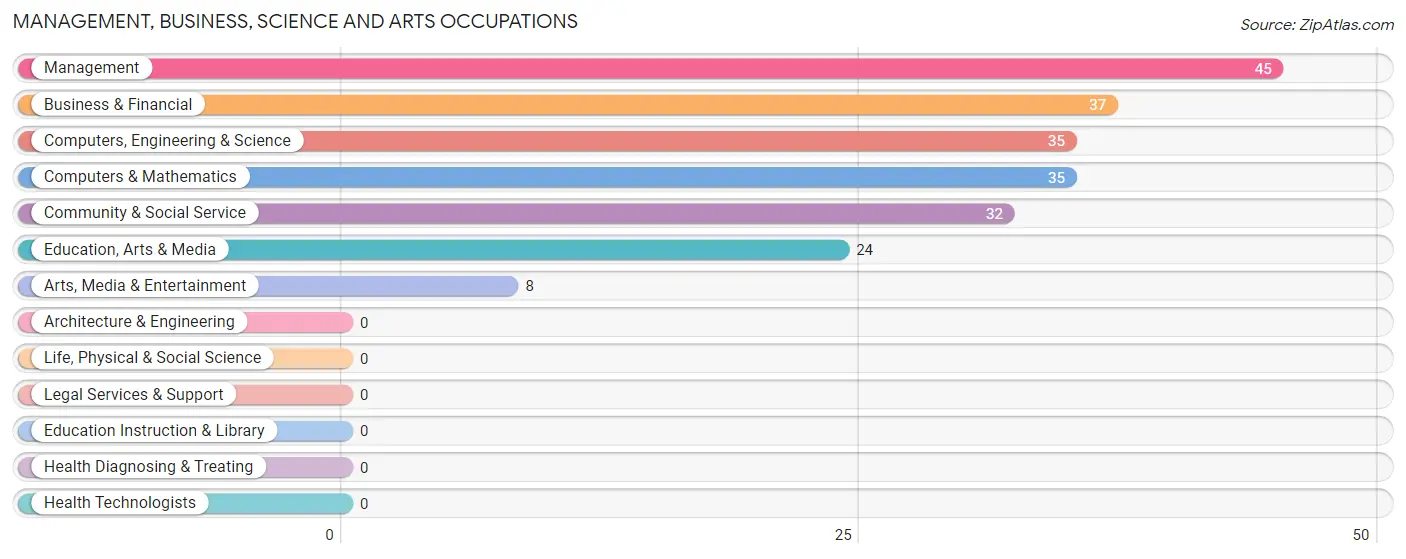
Management, Business, Science and Arts Occupations by Sex
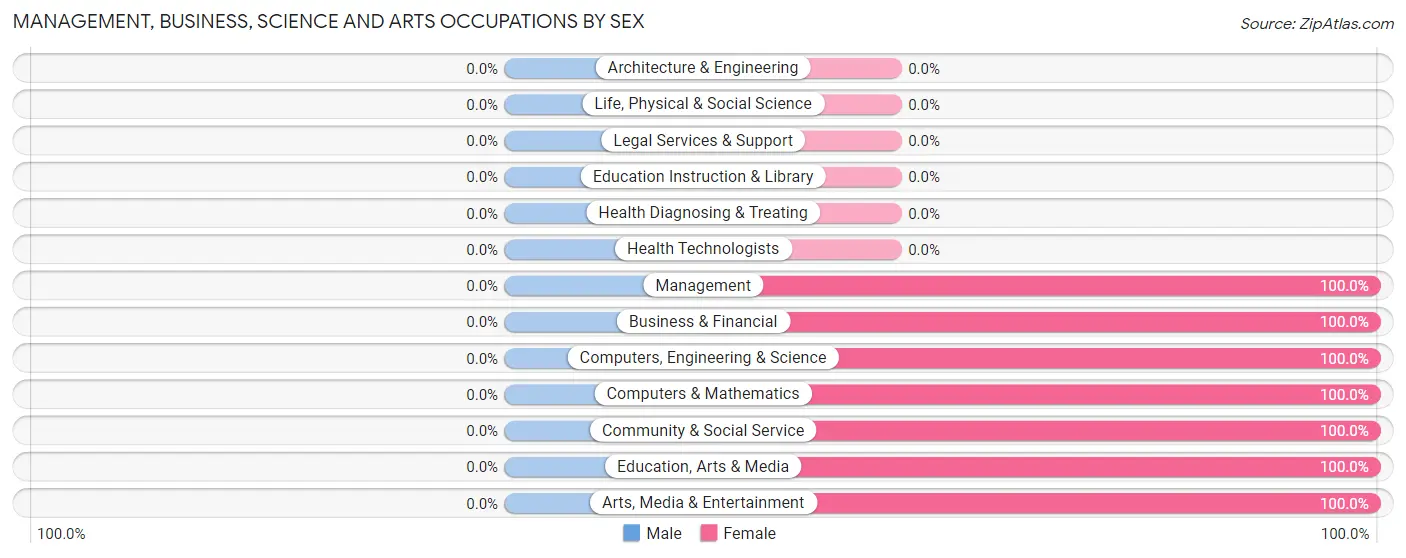
| Occupation | Male | Female |
| Management | 0 (0.0%) | 45 (100.0%) |
| Business & Financial | 0 (0.0%) | 37 (100.0%) |
| Computers, Engineering & Science | 0 (0.0%) | 35 (100.0%) |
| Computers & Mathematics | 0 (0.0%) | 35 (100.0%) |
| Architecture & Engineering | 0 (0.0%) | 0 (0.0%) |
| Life, Physical & Social Science | 0 (0.0%) | 0 (0.0%) |
| Community & Social Service | 0 (0.0%) | 32 (100.0%) |
| Education, Arts & Media | 0 (0.0%) | 24 (100.0%) |
| Legal Services & Support | 0 (0.0%) | 0 (0.0%) |
| Education Instruction & Library | 0 (0.0%) | 0 (0.0%) |
| Arts, Media & Entertainment | 0 (0.0%) | 8 (100.0%) |
| Health Diagnosing & Treating | 0 (0.0%) | 0 (0.0%) |
| Health Technologists | 0 (0.0%) | 0 (0.0%) |
| Total (Category) | 0 (0.0%) | 149 (100.0%) |
| Total (Overall) | 121 (31.4%) | 264 (68.6%) |
Services Occupations
The most common Services occupations in Bucksport are Food Preparation & Serving (48 | 12.5%), and Personal Care & Service (11 | 2.9%).
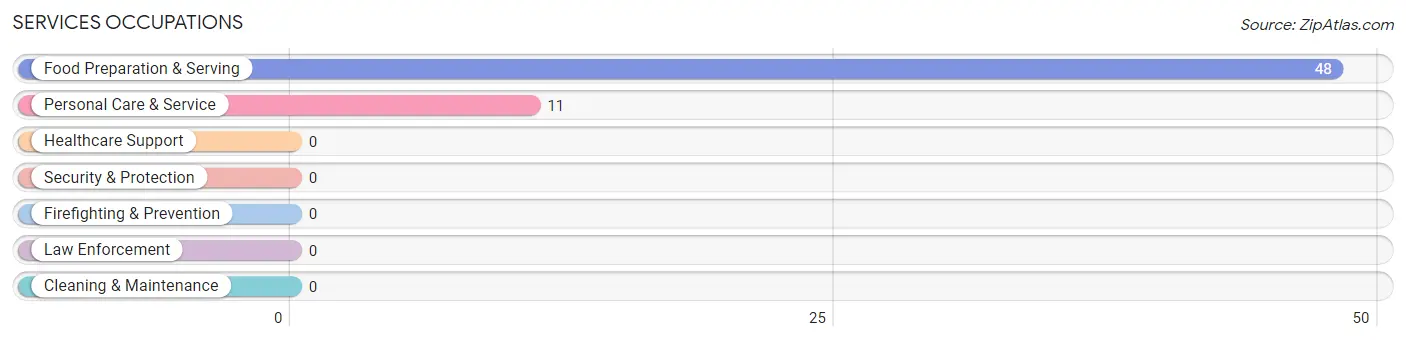
Services Occupations by Sex
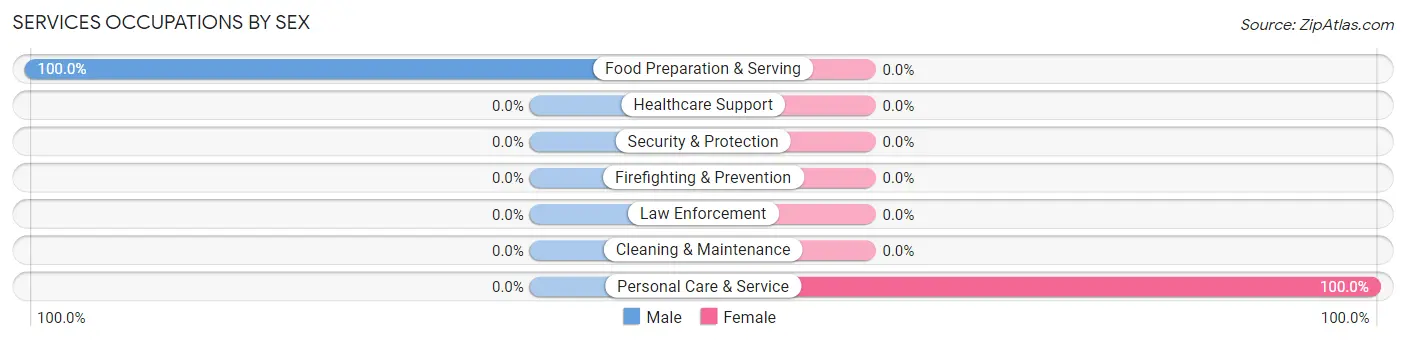
| Occupation | Male | Female |
| Healthcare Support | 0 (0.0%) | 0 (0.0%) |
| Security & Protection | 0 (0.0%) | 0 (0.0%) |
| Firefighting & Prevention | 0 (0.0%) | 0 (0.0%) |
| Law Enforcement | 0 (0.0%) | 0 (0.0%) |
| Food Preparation & Serving | 48 (100.0%) | 0 (0.0%) |
| Cleaning & Maintenance | 0 (0.0%) | 0 (0.0%) |
| Personal Care & Service | 0 (0.0%) | 11 (100.0%) |
| Total (Category) | 48 (81.4%) | 11 (18.6%) |
| Total (Overall) | 121 (31.4%) | 264 (68.6%) |
Sales and Office Occupations
The most common Sales and Office occupations in Bucksport are , and Sales & Related (57 | 14.8%).
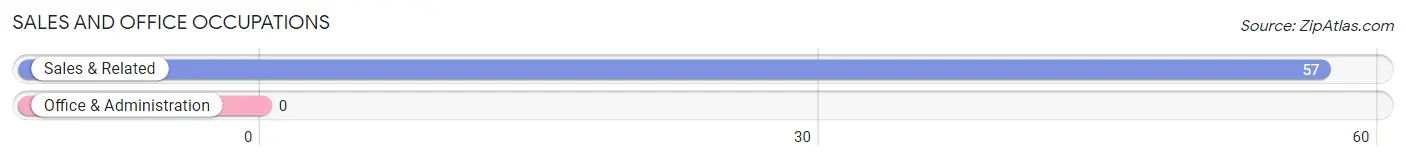
Sales and Office Occupations by Sex
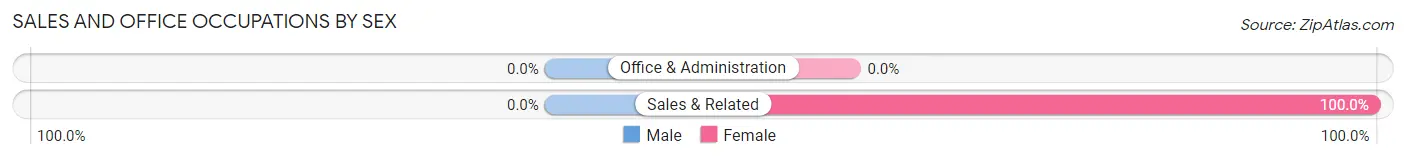
| Occupation | Male | Female |
| Sales & Related | 0 (0.0%) | 57 (100.0%) |
| Office & Administration | 0 (0.0%) | 0 (0.0%) |
| Total (Category) | 0 (0.0%) | 57 (100.0%) |
| Total (Overall) | 121 (31.4%) | 264 (68.6%) |
Natural Resources, Construction and Maintenance Occupations
Natural Resources, Construction and Maintenance Occupations by Sex
| Occupation | Male | Female |
| Farming, Fishing & Forestry | 0 (0.0%) | 0 (0.0%) |
| Construction & Extraction | 0 (0.0%) | 0 (0.0%) |
| Installation, Maintenance & Repair | 0 (0.0%) | 0 (0.0%) |
| Total (Category) | 0 (0.0%) | 0 (0.0%) |
| Total (Overall) | 121 (31.4%) | 264 (68.6%) |
Production, Transportation and Moving Occupations
The most common Production, Transportation and Moving occupations in Bucksport are Transportation (80 | 20.8%), Production (34 | 8.8%), and Material Moving (6 | 1.6%).
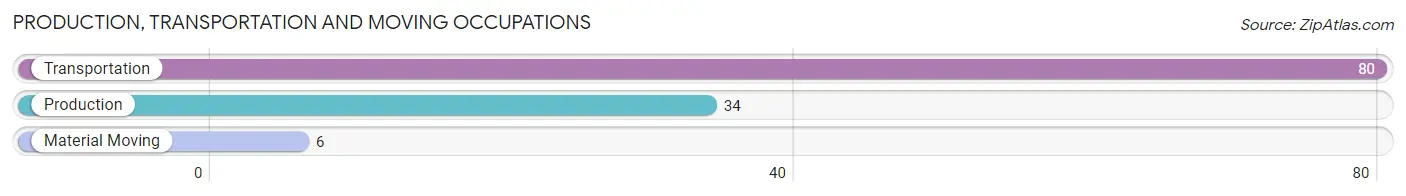
Production, Transportation and Moving Occupations by Sex
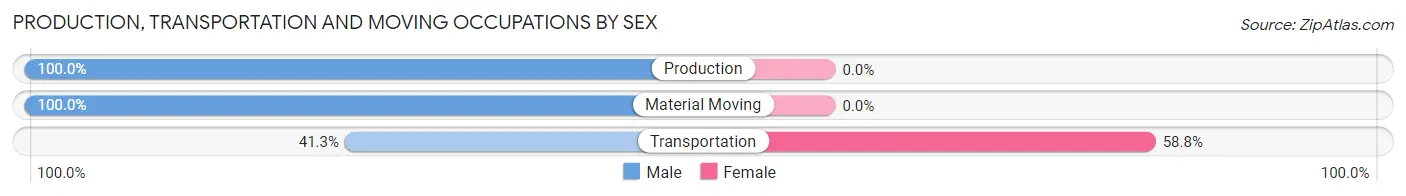
| Occupation | Male | Female |
| Production | 34 (100.0%) | 0 (0.0%) |
| Transportation | 33 (41.2%) | 47 (58.8%) |
| Material Moving | 6 (100.0%) | 0 (0.0%) |
| Total (Category) | 73 (60.8%) | 47 (39.2%) |
| Total (Overall) | 121 (31.4%) | 264 (68.6%) |
Employment Industries by Sex in Bucksport
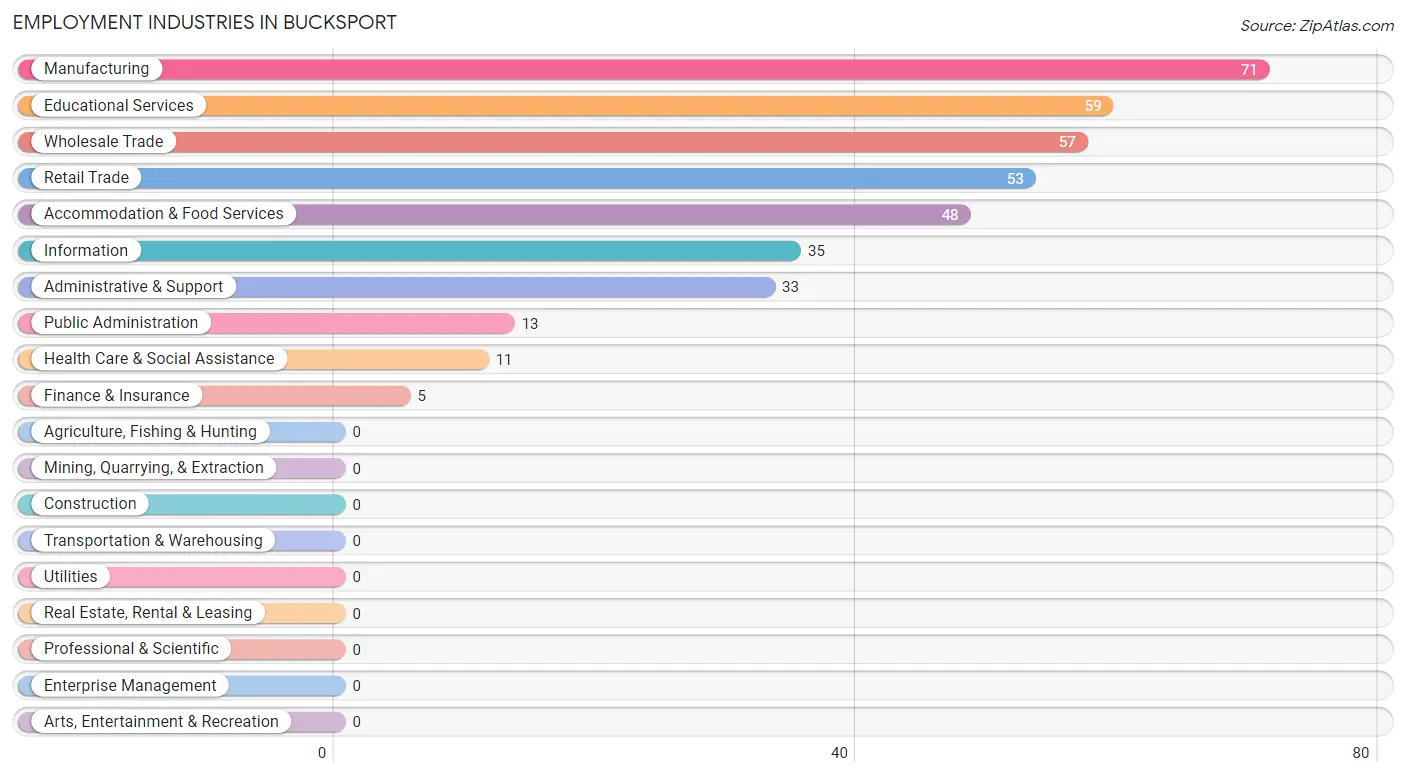
Employment Industries in Bucksport
The major employment industries in Bucksport include Manufacturing (71 | 18.4%), Educational Services (59 | 15.3%), Wholesale Trade (57 | 14.8%), Retail Trade (53 | 13.8%), and Accommodation & Food Services (48 | 12.5%).
Employment Industries by Sex in Bucksport
The Bucksport industries that see more men than women are Administrative & Support (100.0%), Accommodation & Food Services (100.0%), and Manufacturing (47.9%), whereas the industries that tend to have a higher number of women are Wholesale Trade (100.0%), Information (100.0%), and Finance & Insurance (100.0%).
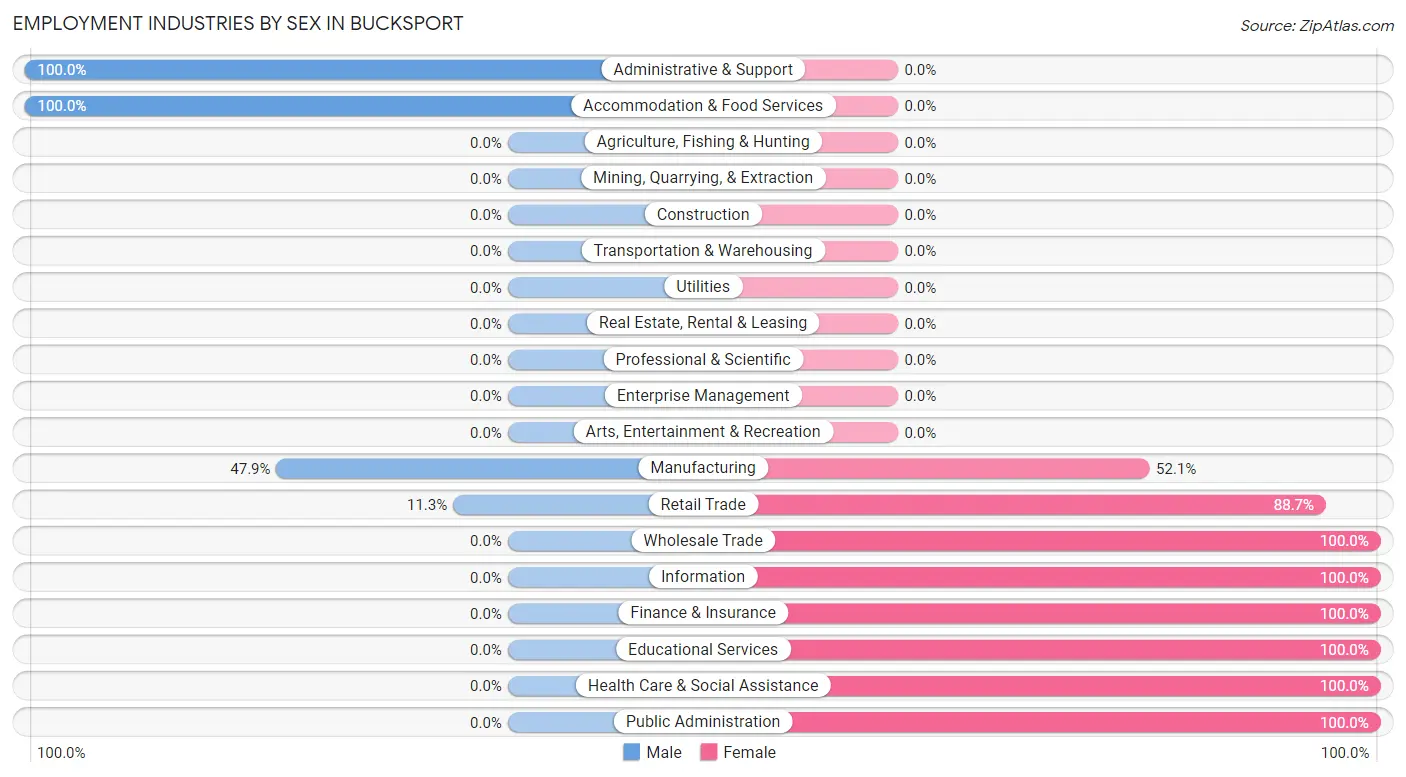
| Industry | Male | Female |
| Agriculture, Fishing & Hunting | 0 (0.0%) | 0 (0.0%) |
| Mining, Quarrying, & Extraction | 0 (0.0%) | 0 (0.0%) |
| Construction | 0 (0.0%) | 0 (0.0%) |
| Manufacturing | 34 (47.9%) | 37 (52.1%) |
| Wholesale Trade | 0 (0.0%) | 57 (100.0%) |
| Retail Trade | 6 (11.3%) | 47 (88.7%) |
| Transportation & Warehousing | 0 (0.0%) | 0 (0.0%) |
| Utilities | 0 (0.0%) | 0 (0.0%) |
| Information | 0 (0.0%) | 35 (100.0%) |
| Finance & Insurance | 0 (0.0%) | 5 (100.0%) |
| Real Estate, Rental & Leasing | 0 (0.0%) | 0 (0.0%) |
| Professional & Scientific | 0 (0.0%) | 0 (0.0%) |
| Enterprise Management | 0 (0.0%) | 0 (0.0%) |
| Administrative & Support | 33 (100.0%) | 0 (0.0%) |
| Educational Services | 0 (0.0%) | 59 (100.0%) |
| Health Care & Social Assistance | 0 (0.0%) | 11 (100.0%) |
| Arts, Entertainment & Recreation | 0 (0.0%) | 0 (0.0%) |
| Accommodation & Food Services | 48 (100.0%) | 0 (0.0%) |
| Public Administration | 0 (0.0%) | 13 (100.0%) |
| Total | 121 (31.4%) | 264 (68.6%) |
Education in Bucksport
School Enrollment in Bucksport
The most common levels of schooling among the 41 students in Bucksport are elementary school (36 | 87.8%), and middle school (5 | 12.2%).
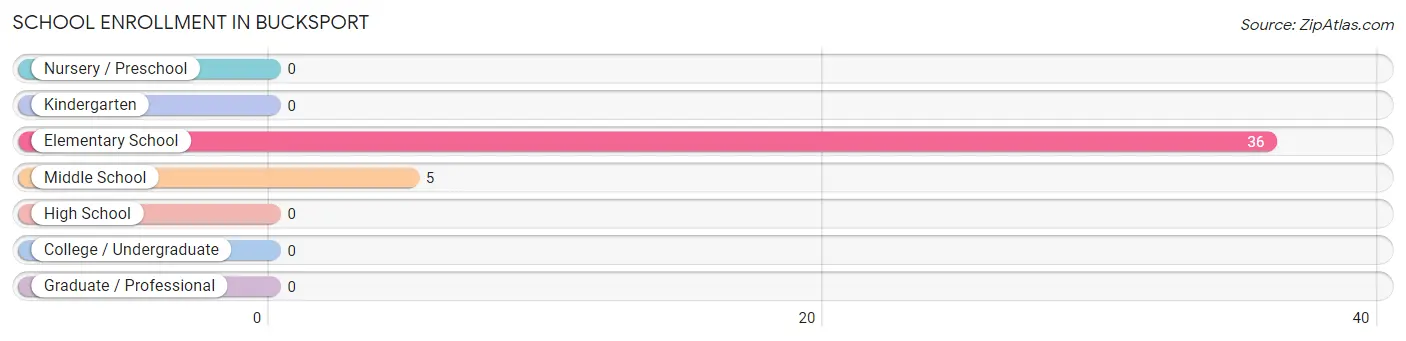
| School Level | # Students | % Students |
| Nursery / Preschool | 0 | 0.0% |
| Kindergarten | 0 | 0.0% |
| Elementary School | 36 | 87.8% |
| Middle School | 5 | 12.2% |
| High School | 0 | 0.0% |
| College / Undergraduate | 0 | 0.0% |
| Graduate / Professional | 0 | 0.0% |
| Total | 41 | 100.0% |
School Enrollment by Age by Funding Source in Bucksport
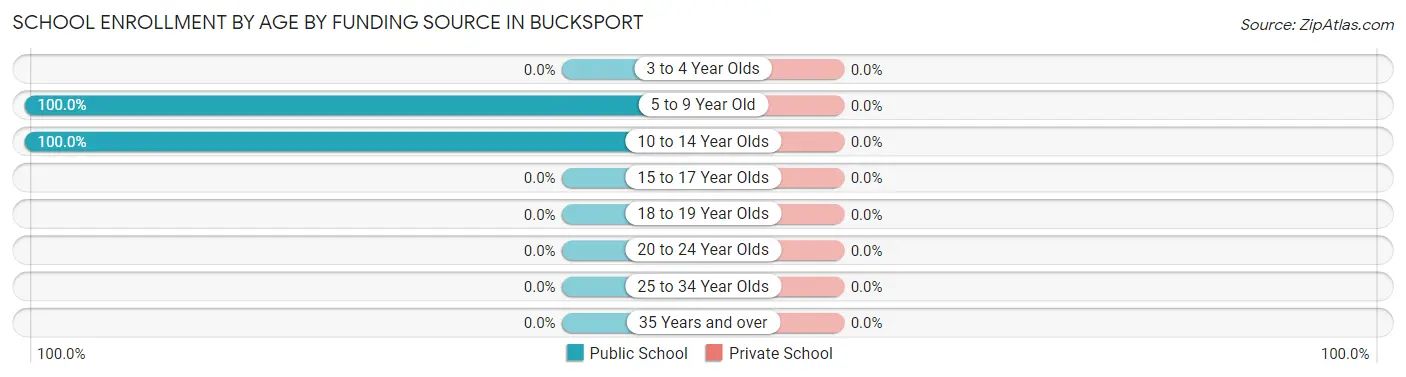
| Age Bracket | Public School | Private School |
| 3 to 4 Year Olds | 0 (0.0%) | 0 (0.0%) |
| 5 to 9 Year Old | 36 (100.0%) | 0 (0.0%) |
| 10 to 14 Year Olds | 5 (100.0%) | 0 (0.0%) |
| 15 to 17 Year Olds | 0 (0.0%) | 0 (0.0%) |
| 18 to 19 Year Olds | 0 (0.0%) | 0 (0.0%) |
| 20 to 24 Year Olds | 0 (0.0%) | 0 (0.0%) |
| 25 to 34 Year Olds | 0 (0.0%) | 0 (0.0%) |
| 35 Years and over | 0 (0.0%) | 0 (0.0%) |
| Total | 41 (100.0%) | 0 (0.0%) |
Educational Attainment by Field of Study in Bucksport
Business (37 | 42.5%), psychology (19 | 21.8%), arts & humanities (18 | 20.7%), and multidisciplinary studies (13 | 14.9%) are the most common fields of study among 87 individuals in Bucksport who have obtained a bachelor's degree or higher.
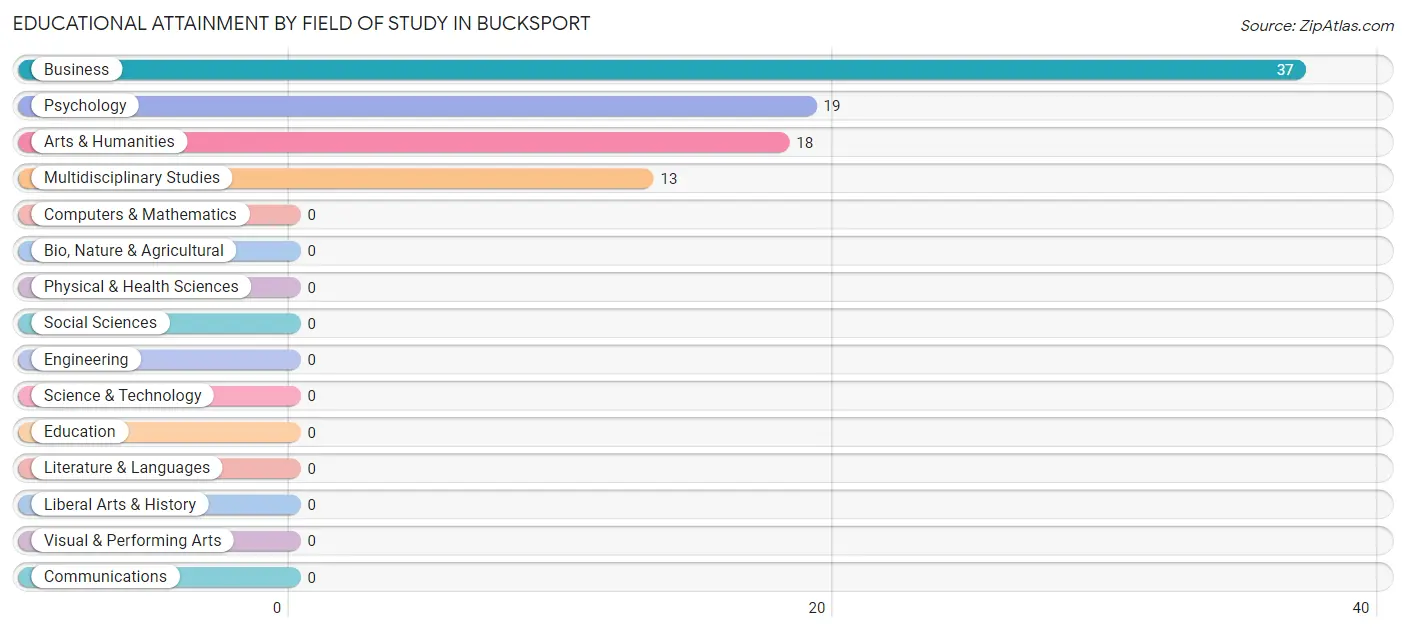
| Field of Study | # Graduates | % Graduates |
| Computers & Mathematics | 0 | 0.0% |
| Bio, Nature & Agricultural | 0 | 0.0% |
| Physical & Health Sciences | 0 | 0.0% |
| Psychology | 19 | 21.8% |
| Social Sciences | 0 | 0.0% |
| Engineering | 0 | 0.0% |
| Multidisciplinary Studies | 13 | 14.9% |
| Science & Technology | 0 | 0.0% |
| Business | 37 | 42.5% |
| Education | 0 | 0.0% |
| Literature & Languages | 0 | 0.0% |
| Liberal Arts & History | 0 | 0.0% |
| Visual & Performing Arts | 0 | 0.0% |
| Communications | 0 | 0.0% |
| Arts & Humanities | 18 | 20.7% |
| Total | 87 | 100.0% |
Transportation & Commute in Bucksport
Vehicle Availability by Sex in Bucksport
The most prevalent vehicle ownership categories in Bucksport are males with 1 vehicle (78, accounting for 64.5%) and females with 1 vehicle (0, making up 30.8%).
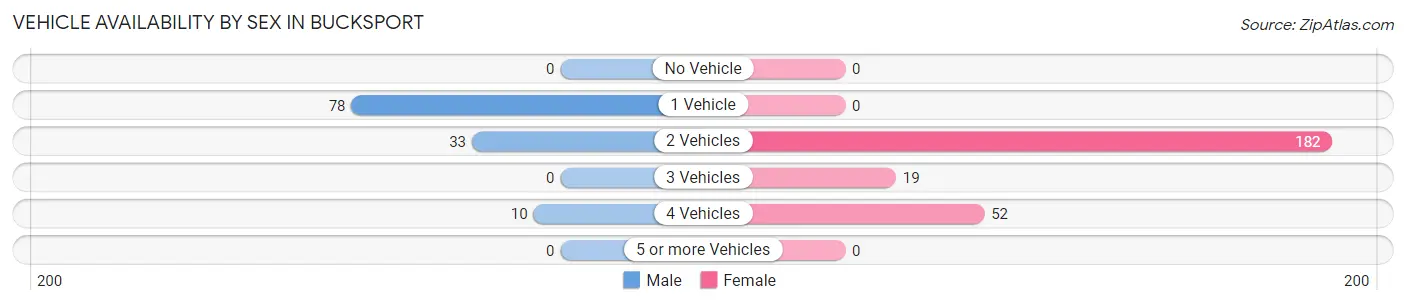
| Vehicles Available | Male | Female |
| No Vehicle | 0 (0.0%) | 0 (0.0%) |
| 1 Vehicle | 78 (64.5%) | 0 (0.0%) |
| 2 Vehicles | 33 (27.3%) | 182 (71.9%) |
| 3 Vehicles | 0 (0.0%) | 19 (7.5%) |
| 4 Vehicles | 10 (8.3%) | 52 (20.5%) |
| 5 or more Vehicles | 0 (0.0%) | 0 (0.0%) |
| Total | 121 (100.0%) | 253 (100.0%) |
Commute Time in Bucksport
The most frequently occuring commute durations in Bucksport are 45 to 59 minutes (138 commuters, 36.9%), 20 to 24 minutes (85 commuters, 22.7%), and 40 to 44 minutes (78 commuters, 20.9%).
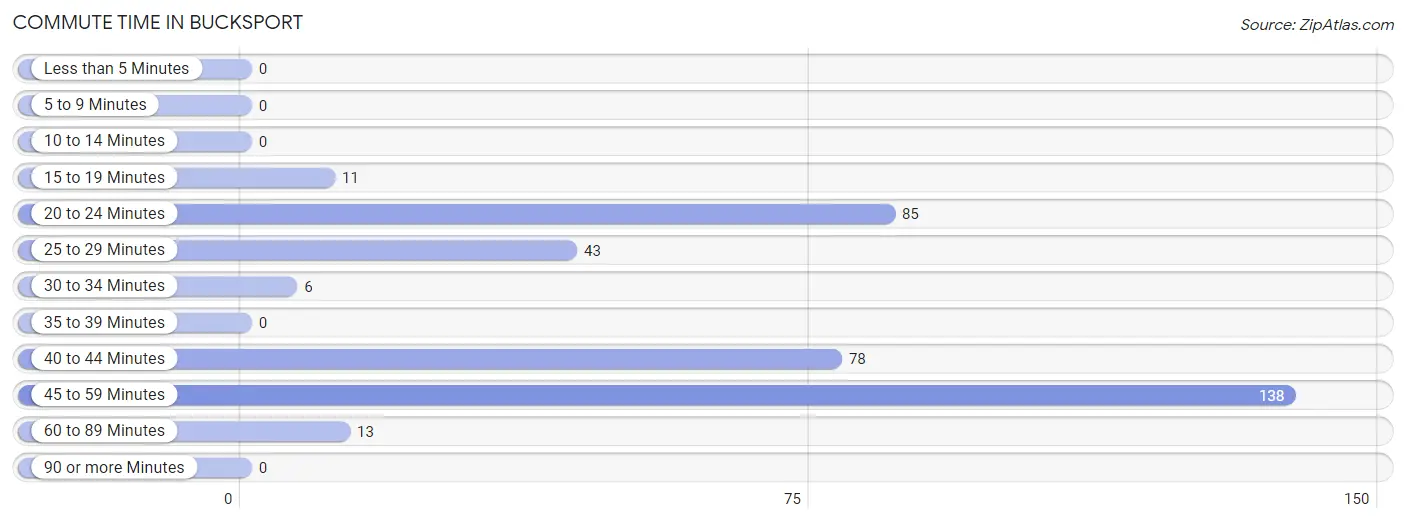
| Commute Time | # Commuters | % Commuters |
| Less than 5 Minutes | 0 | 0.0% |
| 5 to 9 Minutes | 0 | 0.0% |
| 10 to 14 Minutes | 0 | 0.0% |
| 15 to 19 Minutes | 11 | 2.9% |
| 20 to 24 Minutes | 85 | 22.7% |
| 25 to 29 Minutes | 43 | 11.5% |
| 30 to 34 Minutes | 6 | 1.6% |
| 35 to 39 Minutes | 0 | 0.0% |
| 40 to 44 Minutes | 78 | 20.9% |
| 45 to 59 Minutes | 138 | 36.9% |
| 60 to 89 Minutes | 13 | 3.5% |
| 90 or more Minutes | 0 | 0.0% |
Commute Time by Sex in Bucksport
The most common commute times in Bucksport are 45 to 59 minutes (44 commuters, 36.4%) for males and 45 to 59 minutes (94 commuters, 37.1%) for females.
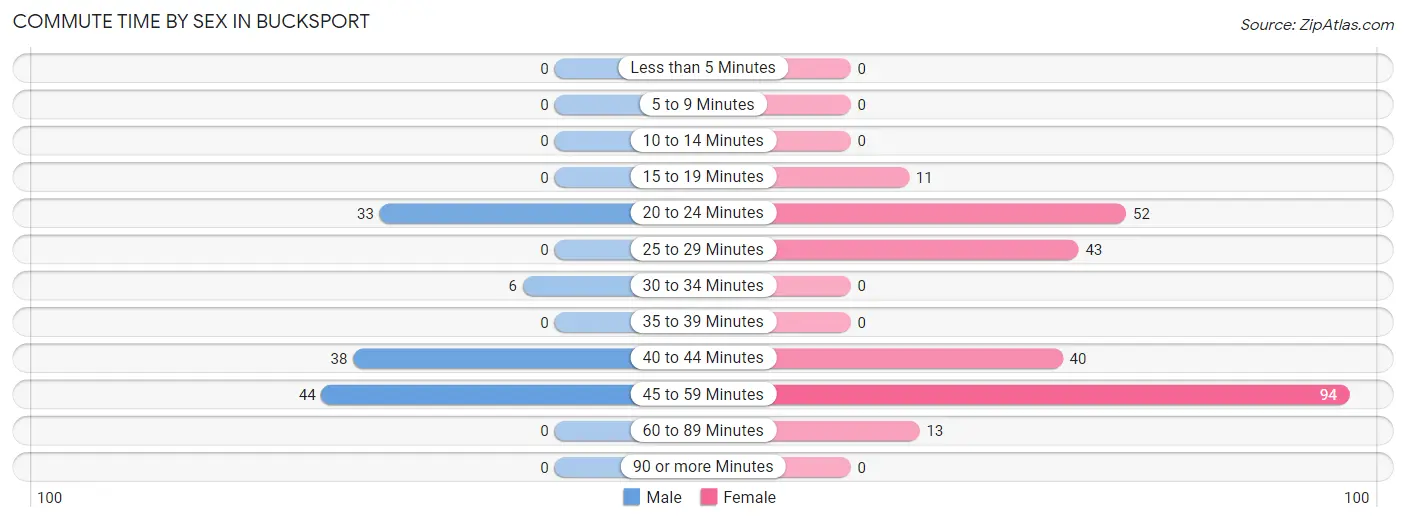
| Commute Time | Male | Female |
| Less than 5 Minutes | 0 (0.0%) | 0 (0.0%) |
| 5 to 9 Minutes | 0 (0.0%) | 0 (0.0%) |
| 10 to 14 Minutes | 0 (0.0%) | 0 (0.0%) |
| 15 to 19 Minutes | 0 (0.0%) | 11 (4.3%) |
| 20 to 24 Minutes | 33 (27.3%) | 52 (20.5%) |
| 25 to 29 Minutes | 0 (0.0%) | 43 (17.0%) |
| 30 to 34 Minutes | 6 (5.0%) | 0 (0.0%) |
| 35 to 39 Minutes | 0 (0.0%) | 0 (0.0%) |
| 40 to 44 Minutes | 38 (31.4%) | 40 (15.8%) |
| 45 to 59 Minutes | 44 (36.4%) | 94 (37.1%) |
| 60 to 89 Minutes | 0 (0.0%) | 13 (5.1%) |
| 90 or more Minutes | 0 (0.0%) | 0 (0.0%) |
Time of Departure to Work by Sex in Bucksport
The most frequent times of departure to work in Bucksport are 7:00 AM to 7:29 AM (44, 36.4%) for males and 8:00 AM to 8:29 AM (92, 36.4%) for females.
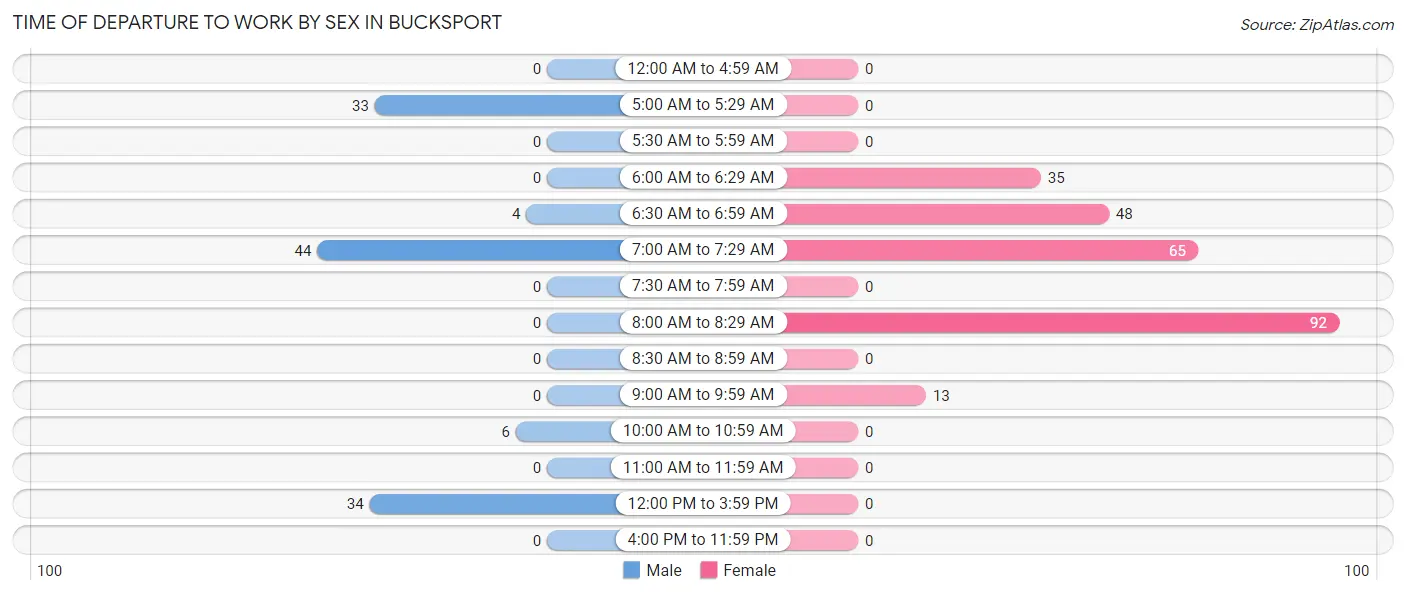
| Time of Departure | Male | Female |
| 12:00 AM to 4:59 AM | 0 (0.0%) | 0 (0.0%) |
| 5:00 AM to 5:29 AM | 33 (27.3%) | 0 (0.0%) |
| 5:30 AM to 5:59 AM | 0 (0.0%) | 0 (0.0%) |
| 6:00 AM to 6:29 AM | 0 (0.0%) | 35 (13.8%) |
| 6:30 AM to 6:59 AM | 4 (3.3%) | 48 (19.0%) |
| 7:00 AM to 7:29 AM | 44 (36.4%) | 65 (25.7%) |
| 7:30 AM to 7:59 AM | 0 (0.0%) | 0 (0.0%) |
| 8:00 AM to 8:29 AM | 0 (0.0%) | 92 (36.4%) |
| 8:30 AM to 8:59 AM | 0 (0.0%) | 0 (0.0%) |
| 9:00 AM to 9:59 AM | 0 (0.0%) | 13 (5.1%) |
| 10:00 AM to 10:59 AM | 6 (5.0%) | 0 (0.0%) |
| 11:00 AM to 11:59 AM | 0 (0.0%) | 0 (0.0%) |
| 12:00 PM to 3:59 PM | 34 (28.1%) | 0 (0.0%) |
| 4:00 PM to 11:59 PM | 0 (0.0%) | 0 (0.0%) |
| Total | 121 (100.0%) | 253 (100.0%) |
Housing Occupancy in Bucksport
Occupancy by Ownership in Bucksport
Of the total 293 dwellings in Bucksport, owner-occupied units account for 247 (84.3%), while renter-occupied units make up 46 (15.7%).
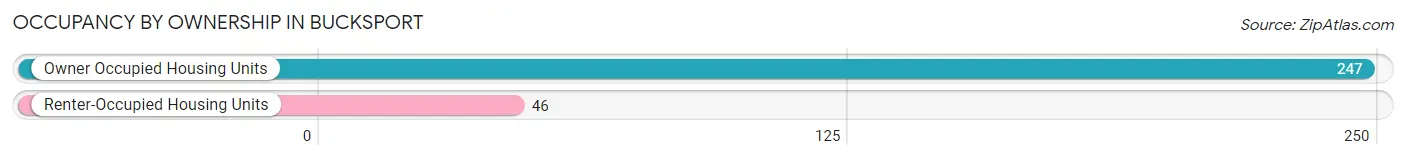
| Occupancy | # Housing Units | % Housing Units |
| Owner Occupied Housing Units | 247 | 84.3% |
| Renter-Occupied Housing Units | 46 | 15.7% |
| Total Occupied Housing Units | 293 | 100.0% |
Occupancy by Household Size in Bucksport
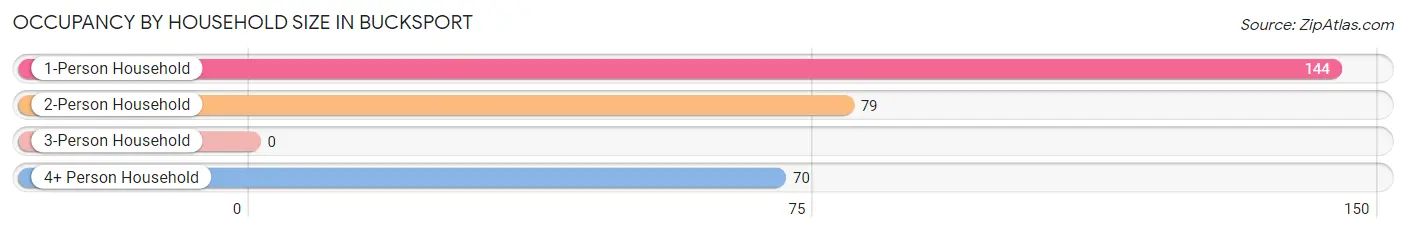
| Household Size | # Housing Units | % Housing Units |
| 1-Person Household | 144 | 49.1% |
| 2-Person Household | 79 | 27.0% |
| 3-Person Household | 0 | 0.0% |
| 4+ Person Household | 70 | 23.9% |
| Total Housing Units | 293 | 100.0% |
Occupancy by Ownership by Household Size in Bucksport
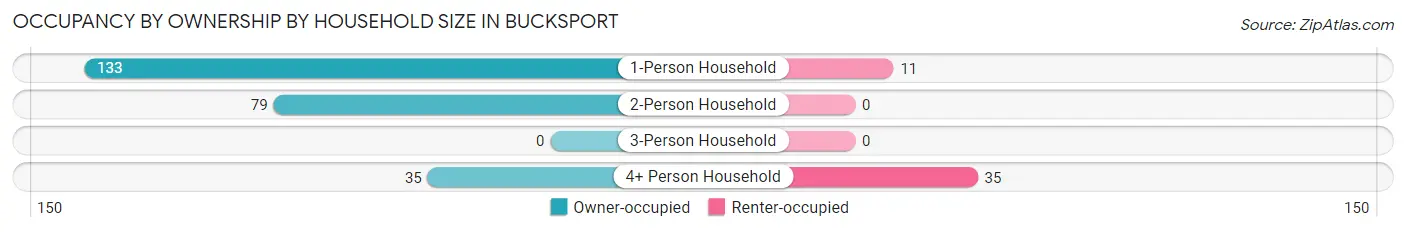
| Household Size | Owner-occupied | Renter-occupied |
| 1-Person Household | 133 (92.4%) | 11 (7.6%) |
| 2-Person Household | 79 (100.0%) | 0 (0.0%) |
| 3-Person Household | 0 (0.0%) | 0 (0.0%) |
| 4+ Person Household | 35 (50.0%) | 35 (50.0%) |
| Total Housing Units | 247 (84.3%) | 46 (15.7%) |
Occupancy by Educational Attainment in Bucksport
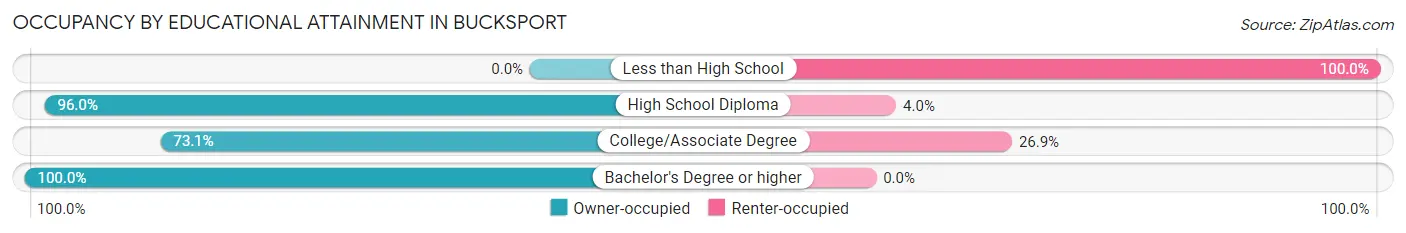
| Household Size | Owner-occupied | Renter-occupied |
| Less than High School | 0 (0.0%) | 7 (100.0%) |
| High School Diploma | 97 (96.0%) | 4 (4.0%) |
| College/Associate Degree | 95 (73.1%) | 35 (26.9%) |
| Bachelor's Degree or higher | 55 (100.0%) | 0 (0.0%) |
Occupancy by Age of Householder in Bucksport
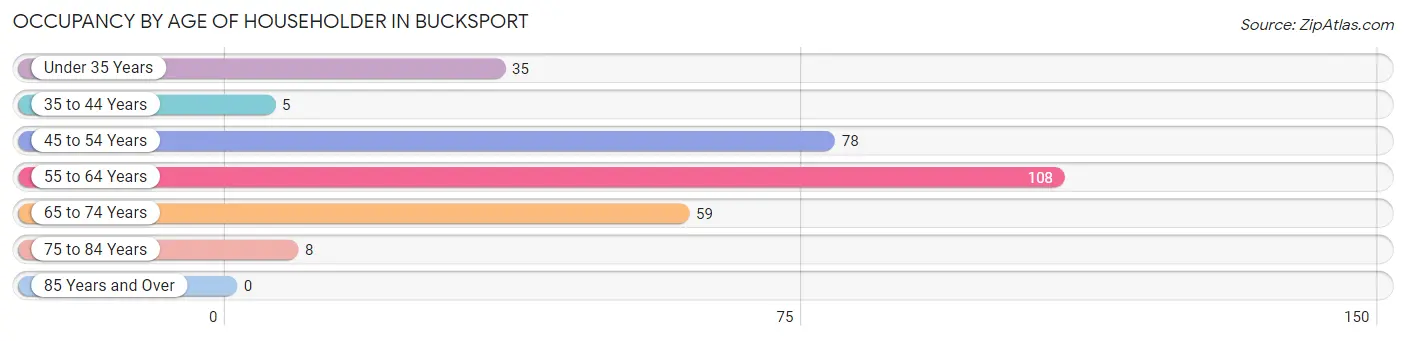
| Age Bracket | # Households | % Households |
| Under 35 Years | 35 | 11.9% |
| 35 to 44 Years | 5 | 1.7% |
| 45 to 54 Years | 78 | 26.6% |
| 55 to 64 Years | 108 | 36.9% |
| 65 to 74 Years | 59 | 20.1% |
| 75 to 84 Years | 8 | 2.7% |
| 85 Years and Over | 0 | 0.0% |
| Total | 293 | 100.0% |
Housing Finances in Bucksport
Median Income by Occupancy in Bucksport
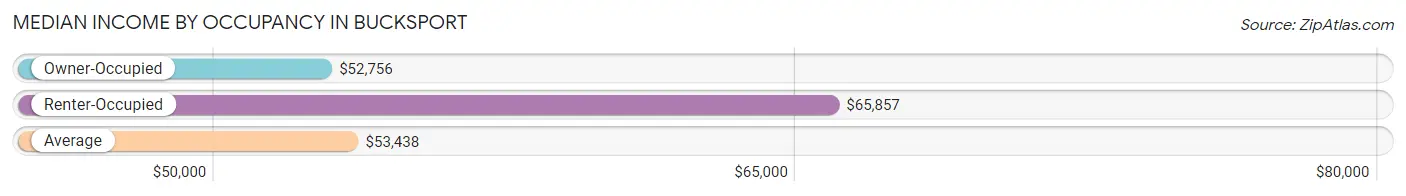
| Occupancy Type | # Households | Median Income |
| Owner-Occupied | 247 (84.3%) | $52,756 |
| Renter-Occupied | 46 (15.7%) | $65,857 |
| Average | 293 (100.0%) | $53,438 |
Occupancy by Householder Income Bracket in Bucksport
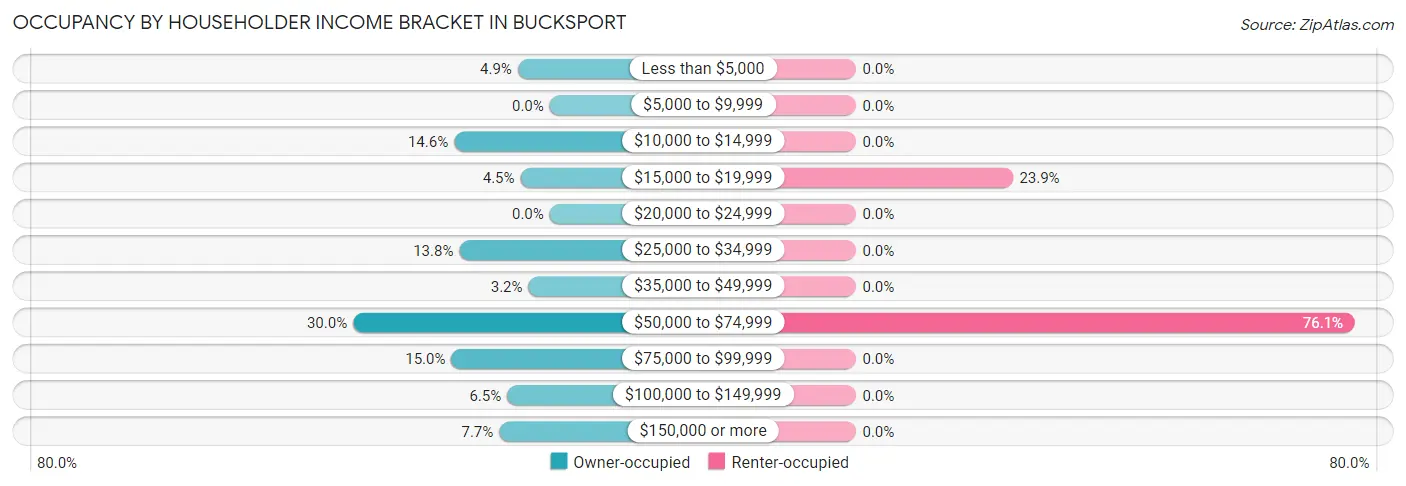
| Income Bracket | Owner-occupied | Renter-occupied |
| Less than $5,000 | 12 (4.9%) | 0 (0.0%) |
| $5,000 to $9,999 | 0 (0.0%) | 0 (0.0%) |
| $10,000 to $14,999 | 36 (14.6%) | 0 (0.0%) |
| $15,000 to $19,999 | 11 (4.4%) | 11 (23.9%) |
| $20,000 to $24,999 | 0 (0.0%) | 0 (0.0%) |
| $25,000 to $34,999 | 34 (13.8%) | 0 (0.0%) |
| $35,000 to $49,999 | 8 (3.2%) | 0 (0.0%) |
| $50,000 to $74,999 | 74 (30.0%) | 35 (76.1%) |
| $75,000 to $99,999 | 37 (15.0%) | 0 (0.0%) |
| $100,000 to $149,999 | 16 (6.5%) | 0 (0.0%) |
| $150,000 or more | 19 (7.7%) | 0 (0.0%) |
| Total | 247 (100.0%) | 46 (100.0%) |
Monthly Housing Cost Tiers in Bucksport
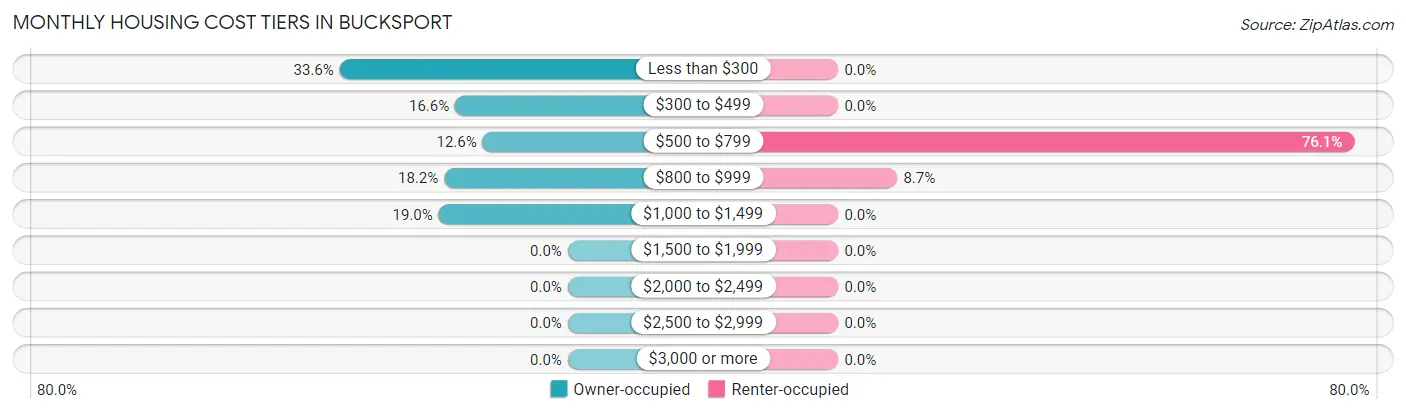
| Monthly Cost | Owner-occupied | Renter-occupied |
| Less than $300 | 83 (33.6%) | 0 (0.0%) |
| $300 to $499 | 41 (16.6%) | 0 (0.0%) |
| $500 to $799 | 31 (12.6%) | 35 (76.1%) |
| $800 to $999 | 45 (18.2%) | 4 (8.7%) |
| $1,000 to $1,499 | 47 (19.0%) | 0 (0.0%) |
| $1,500 to $1,999 | 0 (0.0%) | 0 (0.0%) |
| $2,000 to $2,499 | 0 (0.0%) | 0 (0.0%) |
| $2,500 to $2,999 | 0 (0.0%) | 0 (0.0%) |
| $3,000 or more | 0 (0.0%) | 0 (0.0%) |
| Total | 247 (100.0%) | 46 (100.0%) |
Physical Housing Characteristics in Bucksport
Housing Structures in Bucksport
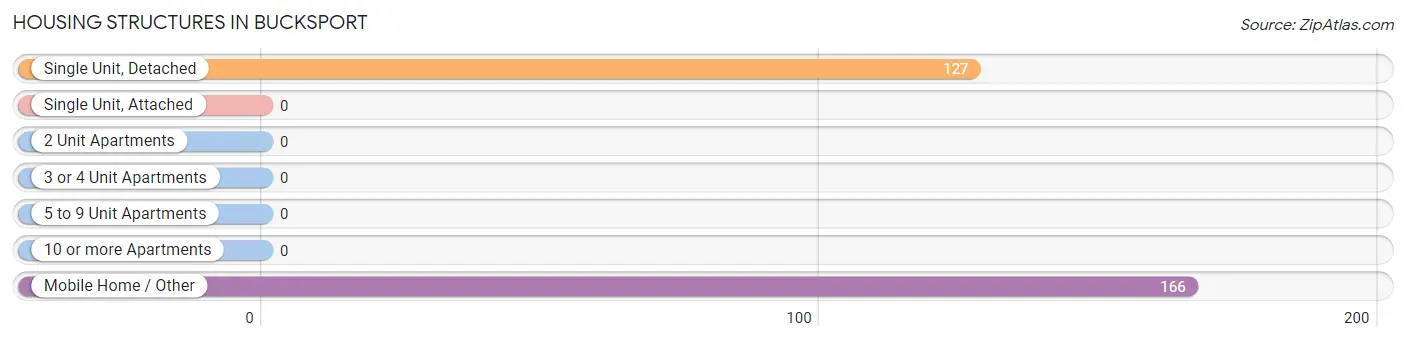
| Structure Type | # Housing Units | % Housing Units |
| Single Unit, Detached | 127 | 43.3% |
| Single Unit, Attached | 0 | 0.0% |
| 2 Unit Apartments | 0 | 0.0% |
| 3 or 4 Unit Apartments | 0 | 0.0% |
| 5 to 9 Unit Apartments | 0 | 0.0% |
| 10 or more Apartments | 0 | 0.0% |
| Mobile Home / Other | 166 | 56.7% |
| Total | 293 | 100.0% |
Housing Structures by Occupancy in Bucksport
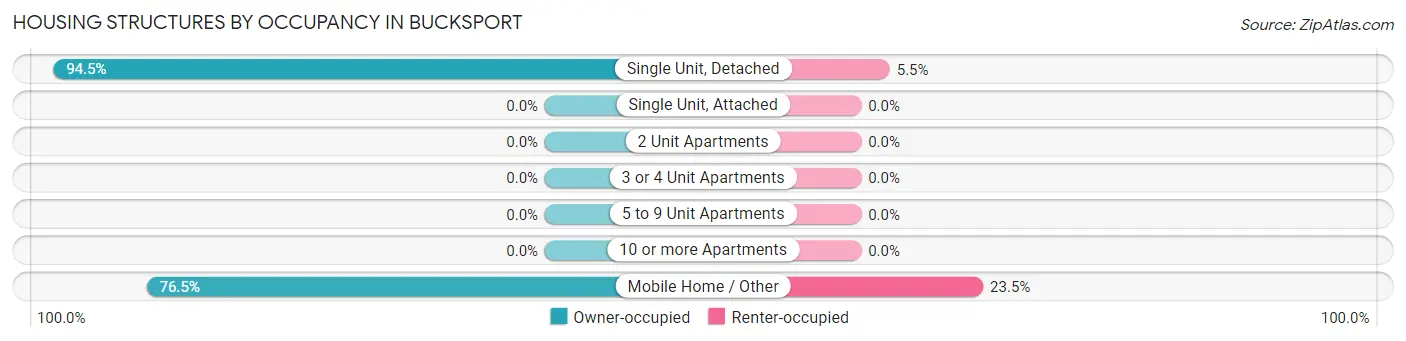
| Structure Type | Owner-occupied | Renter-occupied |
| Single Unit, Detached | 120 (94.5%) | 7 (5.5%) |
| Single Unit, Attached | 0 (0.0%) | 0 (0.0%) |
| 2 Unit Apartments | 0 (0.0%) | 0 (0.0%) |
| 3 or 4 Unit Apartments | 0 (0.0%) | 0 (0.0%) |
| 5 to 9 Unit Apartments | 0 (0.0%) | 0 (0.0%) |
| 10 or more Apartments | 0 (0.0%) | 0 (0.0%) |
| Mobile Home / Other | 127 (76.5%) | 39 (23.5%) |
| Total | 247 (84.3%) | 46 (15.7%) |
Housing Structures by Number of Rooms in Bucksport
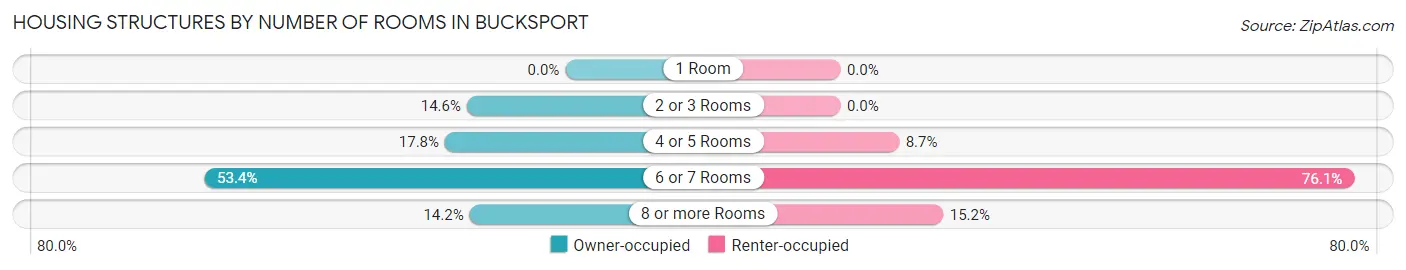
| Number of Rooms | Owner-occupied | Renter-occupied |
| 1 Room | 0 (0.0%) | 0 (0.0%) |
| 2 or 3 Rooms | 36 (14.6%) | 0 (0.0%) |
| 4 or 5 Rooms | 44 (17.8%) | 4 (8.7%) |
| 6 or 7 Rooms | 132 (53.4%) | 35 (76.1%) |
| 8 or more Rooms | 35 (14.2%) | 7 (15.2%) |
| Total | 247 (100.0%) | 46 (100.0%) |
Housing Structure by Heating Type in Bucksport
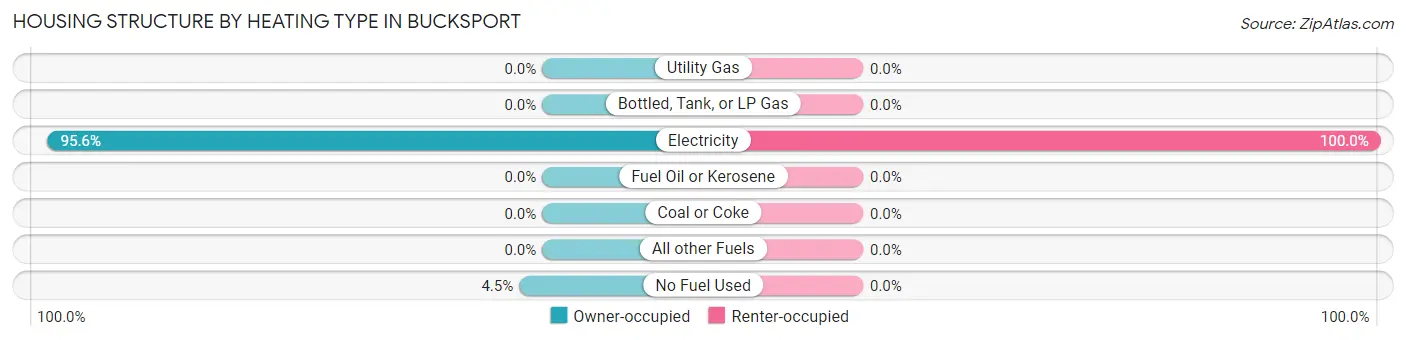
| Heating Type | Owner-occupied | Renter-occupied |
| Utility Gas | 0 (0.0%) | 0 (0.0%) |
| Bottled, Tank, or LP Gas | 0 (0.0%) | 0 (0.0%) |
| Electricity | 236 (95.6%) | 46 (100.0%) |
| Fuel Oil or Kerosene | 0 (0.0%) | 0 (0.0%) |
| Coal or Coke | 0 (0.0%) | 0 (0.0%) |
| All other Fuels | 0 (0.0%) | 0 (0.0%) |
| No Fuel Used | 11 (4.4%) | 0 (0.0%) |
| Total | 247 (100.0%) | 46 (100.0%) |
Household Vehicle Usage in Bucksport
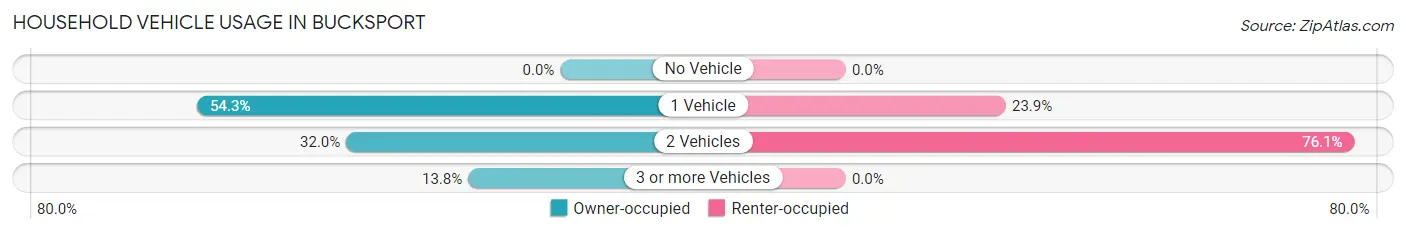
| Vehicles per Household | Owner-occupied | Renter-occupied |
| No Vehicle | 0 (0.0%) | 0 (0.0%) |
| 1 Vehicle | 134 (54.2%) | 11 (23.9%) |
| 2 Vehicles | 79 (32.0%) | 35 (76.1%) |
| 3 or more Vehicles | 34 (13.8%) | 0 (0.0%) |
| Total | 247 (100.0%) | 46 (100.0%) |
Real Estate & Mortgages in Bucksport
Real Estate and Mortgage Overview in Bucksport
| Characteristic | Without Mortgage | With Mortgage |
| Housing Units | 192 | 55 |
| Median Property Value | $100,900 | $164,600 |
| Median Household Income | $53,693 | $0 |
| Monthly Housing Costs | $407 | $0 |
| Real Estate Taxes | $467 | $0 |
Property Value by Mortgage Status in Bucksport
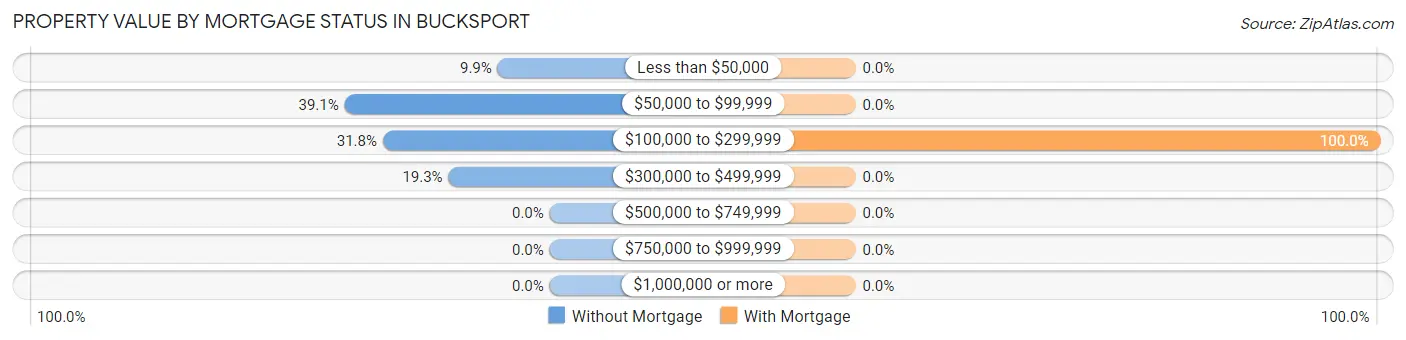
| Property Value | Without Mortgage | With Mortgage |
| Less than $50,000 | 19 (9.9%) | 0 (0.0%) |
| $50,000 to $99,999 | 75 (39.1%) | 0 (0.0%) |
| $100,000 to $299,999 | 61 (31.8%) | 55 (100.0%) |
| $300,000 to $499,999 | 37 (19.3%) | 0 (0.0%) |
| $500,000 to $749,999 | 0 (0.0%) | 0 (0.0%) |
| $750,000 to $999,999 | 0 (0.0%) | 0 (0.0%) |
| $1,000,000 or more | 0 (0.0%) | 0 (0.0%) |
| Total | 192 (100.0%) | 55 (100.0%) |
Household Income by Mortgage Status in Bucksport
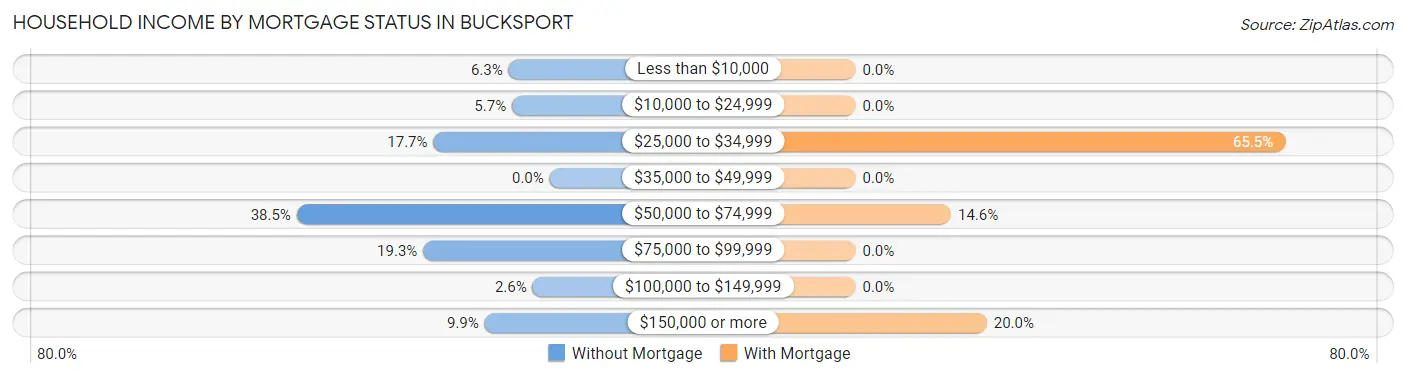
| Household Income | Without Mortgage | With Mortgage |
| Less than $10,000 | 12 (6.2%) | 0 (0.0%) |
| $10,000 to $24,999 | 11 (5.7%) | 0 (0.0%) |
| $25,000 to $34,999 | 34 (17.7%) | 36 (65.4%) |
| $35,000 to $49,999 | 0 (0.0%) | 0 (0.0%) |
| $50,000 to $74,999 | 74 (38.5%) | 8 (14.5%) |
| $75,000 to $99,999 | 37 (19.3%) | 0 (0.0%) |
| $100,000 to $149,999 | 5 (2.6%) | 0 (0.0%) |
| $150,000 or more | 19 (9.9%) | 11 (20.0%) |
| Total | 192 (100.0%) | 55 (100.0%) |
Property Value to Household Income Ratio in Bucksport
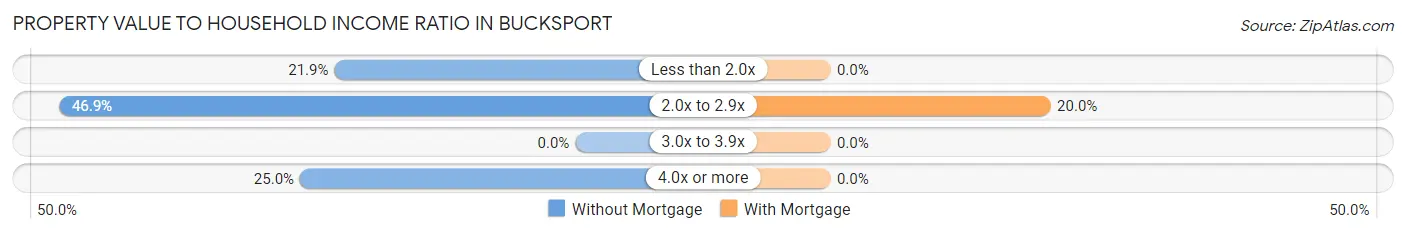
| Value-to-Income Ratio | Without Mortgage | With Mortgage |
| Less than 2.0x | 42 (21.9%) | 0 (0.0%) |
| 2.0x to 2.9x | 90 (46.9%) | 11 (20.0%) |
| 3.0x to 3.9x | 0 (0.0%) | 0 (0.0%) |
| 4.0x or more | 48 (25.0%) | 0 (0.0%) |
| Total | 192 (100.0%) | 55 (100.0%) |
Real Estate Taxes by Mortgage Status in Bucksport
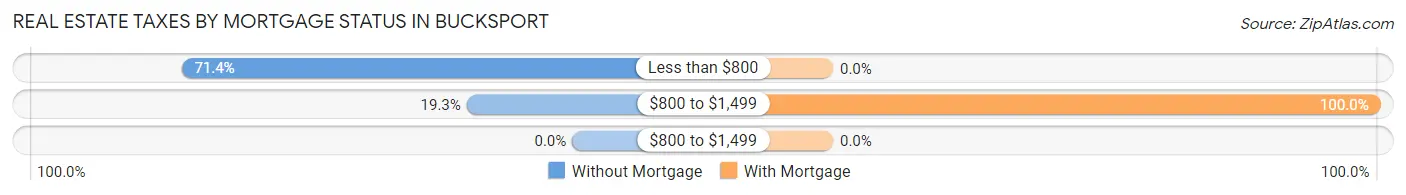
| Property Taxes | Without Mortgage | With Mortgage |
| Less than $800 | 137 (71.4%) | 0 (0.0%) |
| $800 to $1,499 | 37 (19.3%) | 55 (100.0%) |
| $800 to $1,499 | 0 (0.0%) | 0 (0.0%) |
| Total | 192 (100.0%) | 55 (100.0%) |
Health & Disability in Bucksport
Health Insurance Coverage by Age in Bucksport
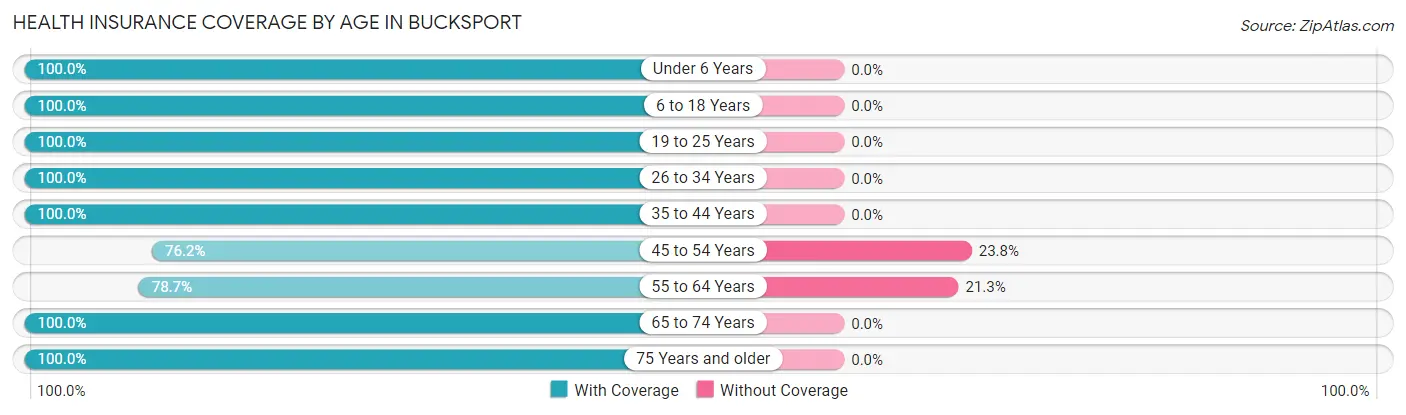
| Age Bracket | With Coverage | Without Coverage |
| Under 6 Years | 79 (100.0%) | 0 (0.0%) |
| 6 to 18 Years | 41 (100.0%) | 0 (0.0%) |
| 19 to 25 Years | 138 (100.0%) | 0 (0.0%) |
| 26 to 34 Years | 52 (100.0%) | 0 (0.0%) |
| 35 to 44 Years | 9 (100.0%) | 0 (0.0%) |
| 45 to 54 Years | 141 (76.2%) | 44 (23.8%) |
| 55 to 64 Years | 133 (78.7%) | 36 (21.3%) |
| 65 to 74 Years | 63 (100.0%) | 0 (0.0%) |
| 75 Years and older | 8 (100.0%) | 0 (0.0%) |
| Total | 664 (89.2%) | 80 (10.7%) |
Health Insurance Coverage by Citizenship Status in Bucksport
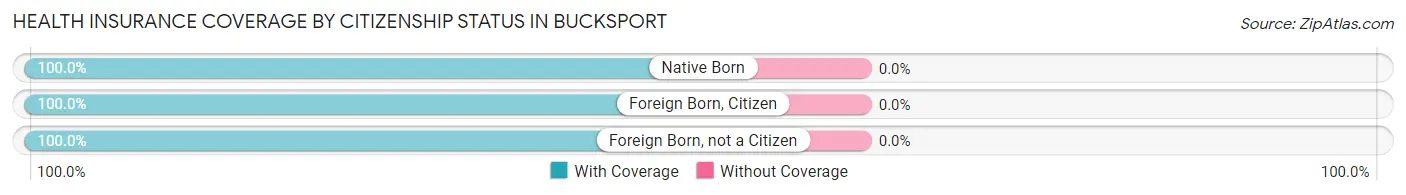
| Citizenship Status | With Coverage | Without Coverage |
| Native Born | 79 (100.0%) | 0 (0.0%) |
| Foreign Born, Citizen | 41 (100.0%) | 0 (0.0%) |
| Foreign Born, not a Citizen | 138 (100.0%) | 0 (0.0%) |
Health Insurance Coverage by Household Income in Bucksport
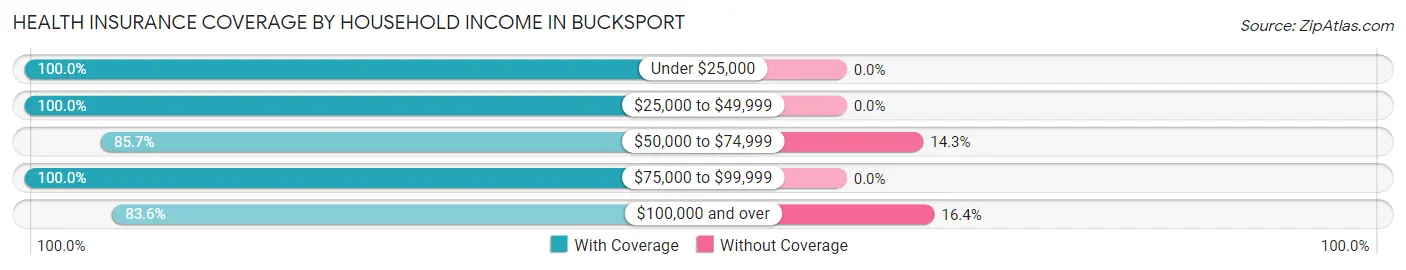
| Household Income | With Coverage | Without Coverage |
| Under $25,000 | 82 (100.0%) | 0 (0.0%) |
| $25,000 to $49,999 | 42 (100.0%) | 0 (0.0%) |
| $50,000 to $74,999 | 263 (85.7%) | 44 (14.3%) |
| $75,000 to $99,999 | 94 (100.0%) | 0 (0.0%) |
| $100,000 and over | 183 (83.6%) | 36 (16.4%) |
Public vs Private Health Insurance Coverage by Age in Bucksport
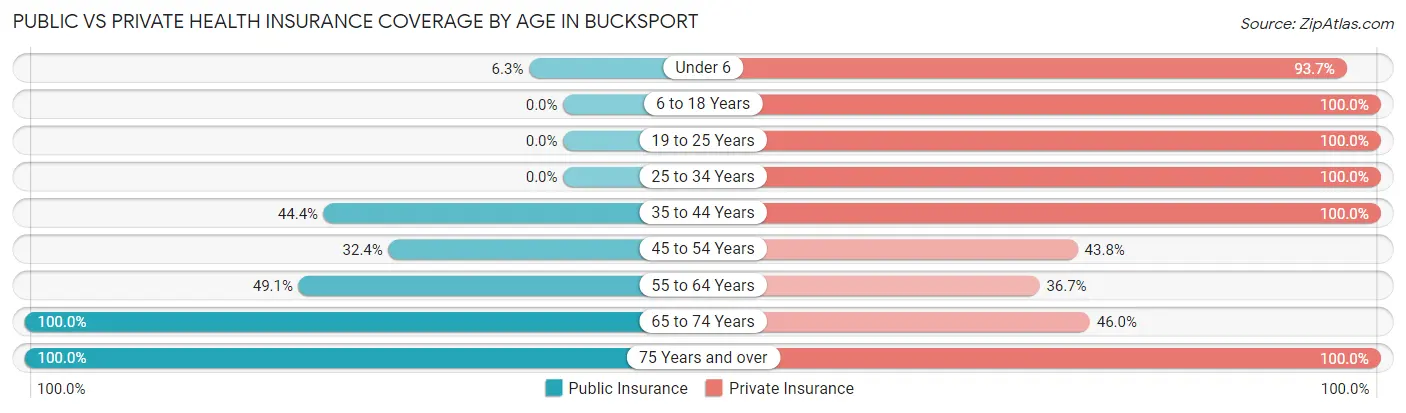
| Age Bracket | Public Insurance | Private Insurance |
| Under 6 | 5 (6.3%) | 74 (93.7%) |
| 6 to 18 Years | 0 (0.0%) | 41 (100.0%) |
| 19 to 25 Years | 0 (0.0%) | 138 (100.0%) |
| 25 to 34 Years | 0 (0.0%) | 52 (100.0%) |
| 35 to 44 Years | 4 (44.4%) | 9 (100.0%) |
| 45 to 54 Years | 60 (32.4%) | 81 (43.8%) |
| 55 to 64 Years | 83 (49.1%) | 62 (36.7%) |
| 65 to 74 Years | 63 (100.0%) | 29 (46.0%) |
| 75 Years and over | 8 (100.0%) | 8 (100.0%) |
| Total | 223 (30.0%) | 494 (66.4%) |
Disability Status by Sex by Age in Bucksport
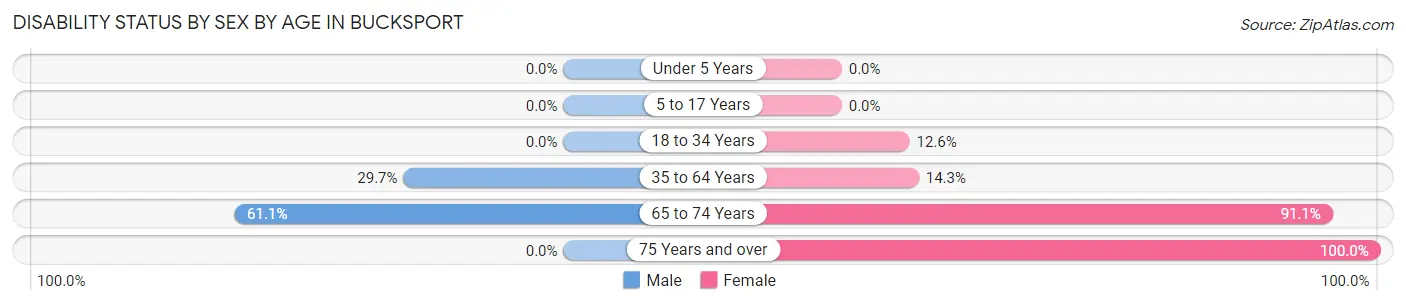
| Age Bracket | Male | Female |
| Under 5 Years | 0 (0.0%) | 0 (0.0%) |
| 5 to 17 Years | 0 (0.0%) | 0 (0.0%) |
| 18 to 34 Years | 0 (0.0%) | 19 (12.6%) |
| 35 to 64 Years | 60 (29.7%) | 23 (14.3%) |
| 65 to 74 Years | 11 (61.1%) | 41 (91.1%) |
| 75 Years and over | 0 (0.0%) | 8 (100.0%) |
Disability Class by Sex by Age in Bucksport
Disability Class: Hearing Difficulty
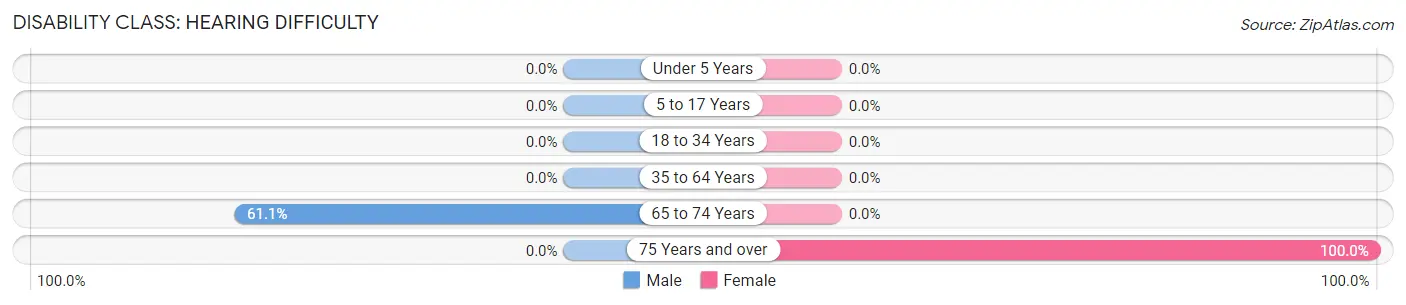
| Age Bracket | Male | Female |
| Under 5 Years | 0 (0.0%) | 0 (0.0%) |
| 5 to 17 Years | 0 (0.0%) | 0 (0.0%) |
| 18 to 34 Years | 0 (0.0%) | 0 (0.0%) |
| 35 to 64 Years | 0 (0.0%) | 0 (0.0%) |
| 65 to 74 Years | 11 (61.1%) | 0 (0.0%) |
| 75 Years and over | 0 (0.0%) | 8 (100.0%) |
Disability Class: Vision Difficulty
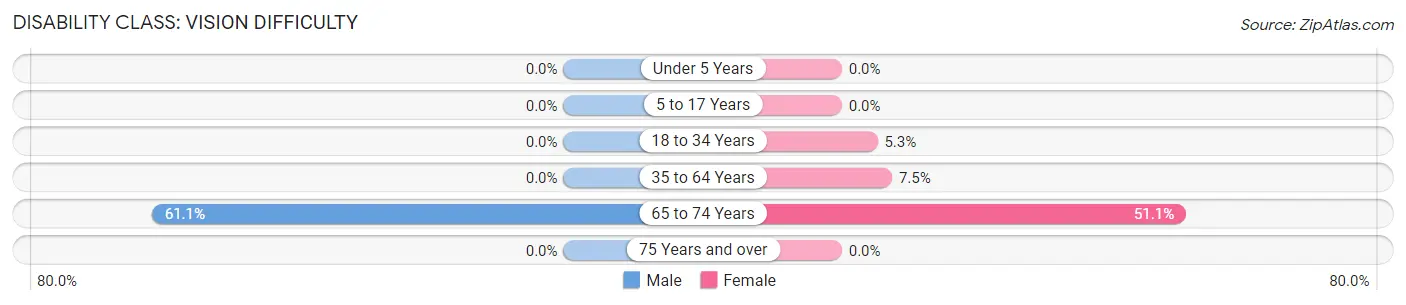
| Age Bracket | Male | Female |
| Under 5 Years | 0 (0.0%) | 0 (0.0%) |
| 5 to 17 Years | 0 (0.0%) | 0 (0.0%) |
| 18 to 34 Years | 0 (0.0%) | 8 (5.3%) |
| 35 to 64 Years | 0 (0.0%) | 12 (7.4%) |
| 65 to 74 Years | 11 (61.1%) | 23 (51.1%) |
| 75 Years and over | 0 (0.0%) | 0 (0.0%) |
Disability Class: Cognitive Difficulty
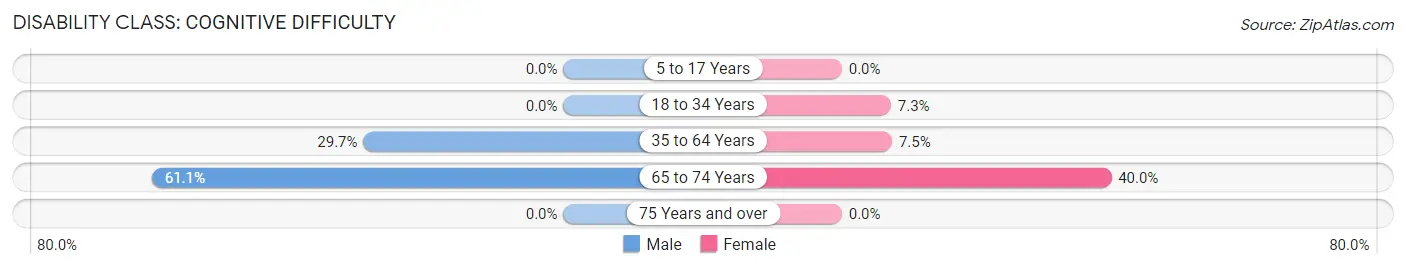
| Age Bracket | Male | Female |
| 5 to 17 Years | 0 (0.0%) | 0 (0.0%) |
| 18 to 34 Years | 0 (0.0%) | 11 (7.3%) |
| 35 to 64 Years | 60 (29.7%) | 12 (7.4%) |
| 65 to 74 Years | 11 (61.1%) | 18 (40.0%) |
| 75 Years and over | 0 (0.0%) | 0 (0.0%) |
Disability Class: Ambulatory Difficulty
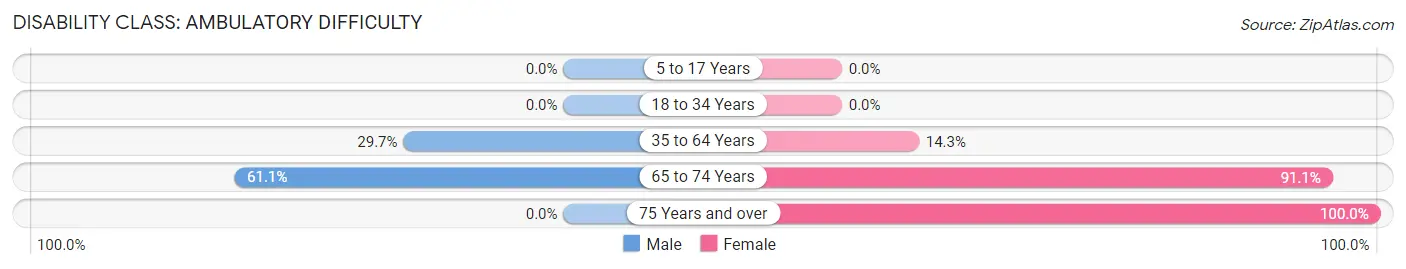
| Age Bracket | Male | Female |
| 5 to 17 Years | 0 (0.0%) | 0 (0.0%) |
| 18 to 34 Years | 0 (0.0%) | 0 (0.0%) |
| 35 to 64 Years | 60 (29.7%) | 23 (14.3%) |
| 65 to 74 Years | 11 (61.1%) | 41 (91.1%) |
| 75 Years and over | 0 (0.0%) | 8 (100.0%) |
Disability Class: Self-Care Difficulty
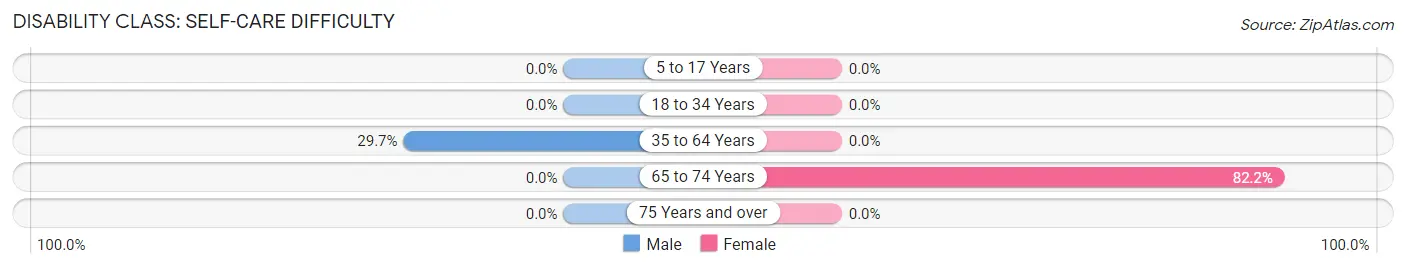
| Age Bracket | Male | Female |
| 5 to 17 Years | 0 (0.0%) | 0 (0.0%) |
| 18 to 34 Years | 0 (0.0%) | 0 (0.0%) |
| 35 to 64 Years | 60 (29.7%) | 0 (0.0%) |
| 65 to 74 Years | 0 (0.0%) | 37 (82.2%) |
| 75 Years and over | 0 (0.0%) | 0 (0.0%) |
Technology Access in Bucksport
Computing Device Access in Bucksport
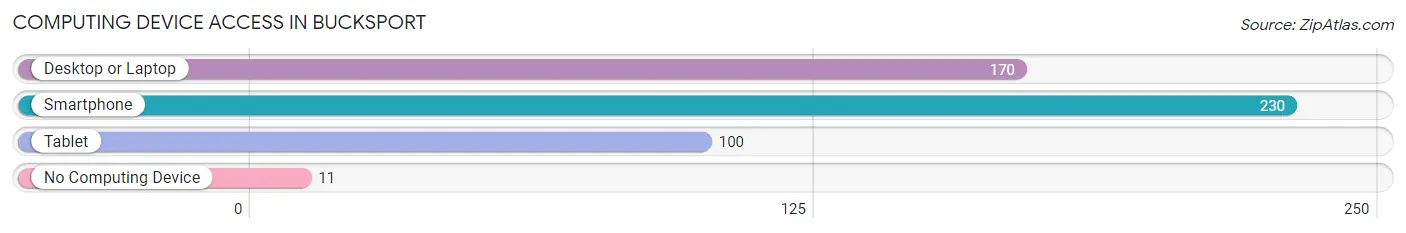
| Device Type | # Households | % Households |
| Desktop or Laptop | 170 | 58.0% |
| Smartphone | 230 | 78.5% |
| Tablet | 100 | 34.1% |
| No Computing Device | 11 | 3.7% |
| Total | 293 | 100.0% |
Internet Access in Bucksport
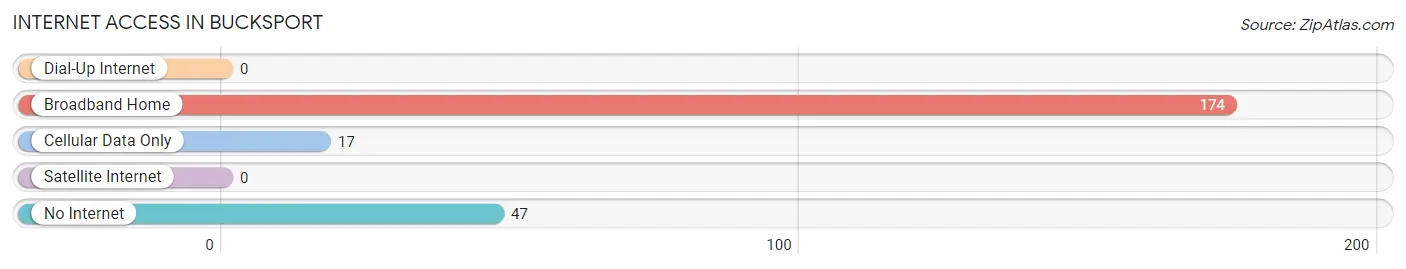
| Internet Type | # Households | % Households |
| Dial-Up Internet | 0 | 0.0% |
| Broadband Home | 174 | 59.4% |
| Cellular Data Only | 17 | 5.8% |
| Satellite Internet | 0 | 0.0% |
| No Internet | 47 | 16.0% |
| Total | 293 | 100.0% |
Bucksport Summary
Bucksport is a small town located in the Lowcountry region of South Carolina. It is situated on the banks of the Waccamaw River, about 25 miles north of Myrtle Beach. The town has a population of just over 1,000 people and is part of Horry County.
History
Bucksport was founded in 1790 by a group of settlers from Bucks County, Pennsylvania. The town was named after the county in Pennsylvania and was originally known as Bucksport Landing. The town was incorporated in 1891 and was a thriving port town for many years. The town was home to a number of businesses, including a sawmill, a grist mill, a cotton gin, and a general store.
In the late 19th century, the town was a popular destination for tourists. The town was home to a number of hotels and resorts, including the Bucksport Hotel, which was built in 1891. The hotel was a popular destination for wealthy visitors from the North.
In the early 20th century, the town began to decline as the port business declined. The town was hit hard by the Great Depression and many of the businesses closed. The town was also hit hard by Hurricane Hugo in 1989, which caused extensive damage to the town.
Geography
Bucksport is located in the Lowcountry region of South Carolina. The town is situated on the banks of the Waccamaw River, about 25 miles north of Myrtle Beach. The town is surrounded by a number of small towns and villages, including Conway, Loris, and Murrells Inlet.
The town is located in a humid subtropical climate zone, with hot, humid summers and mild winters. The average annual temperature is around 70 degrees Fahrenheit. The town receives an average of 48 inches of rain per year.
Economy
Bucksport is a small town with a limited economy. The town is home to a number of small businesses, including a few restaurants, a grocery store, and a few retail stores. The town is also home to a number of small manufacturing businesses.
The town is also home to a number of tourist attractions, including the Bucksport Marina, which offers boat rentals and fishing charters. The town is also home to a number of historic sites, including the Bucksport Hotel, which was built in 1891.
Demographics
As of the 2010 census, the population of Bucksport was 1,072. The town has a population that is predominantly white (94.3%), with a small African American population (3.3%). The town has a median household income of $37,500 and a poverty rate of 16.3%. The town has a high school graduation rate of 81.3%.
Common Questions
What is Per Capita Income in Bucksport?
Per Capita income in Bucksport is $31,146.
What is the Median Family Income in Bucksport?
Median Family Income in Bucksport is $85,236.
What is the Median Household income in Bucksport?
Median Household Income in Bucksport is $53,438.
What is Income or Wage Gap in Bucksport?
Income or Wage Gap in Bucksport is 34.9%.
Women in Bucksport earn 65.1 cents for every dollar earned by a man.
What is Inequality or Gini Index in Bucksport?
Inequality or Gini Index in Bucksport is 0.44.
What is the Total Population of Bucksport?
Total Population of Bucksport is 744.
What is the Total Male Population of Bucksport?
Total Male Population of Bucksport is 290.
What is the Total Female Population of Bucksport?
Total Female Population of Bucksport is 454.
What is the Ratio of Males per 100 Females in Bucksport?
There are 63.88 Males per 100 Females in Bucksport.
What is the Ratio of Females per 100 Males in Bucksport?
There are 156.55 Females per 100 Males in Bucksport.
What is the Median Population Age in Bucksport?
Median Population Age in Bucksport is 50.1 Years.
What is the Average Family Size in Bucksport
Average Family Size in Bucksport is 4.0 People.
What is the Average Household Size in Bucksport
Average Household Size in Bucksport is 2.5 People.
How Large is the Labor Force in Bucksport?
There are 421 People in the Labor Forcein in Bucksport.
What is the Percentage of People in the Labor Force in Bucksport?
67.5% of People are in the Labor Force in Bucksport.
What is the Unemployment Rate in Bucksport?
Unemployment Rate in Bucksport is 8.6%.