Zip Codes with the Highest Percentage of Population Employed in Food Preparation & Serving in Columbia, SC
RELATED REPORTS & OPTIONS
Food Preparation & Serving
Columbia
Compare Zip Codes
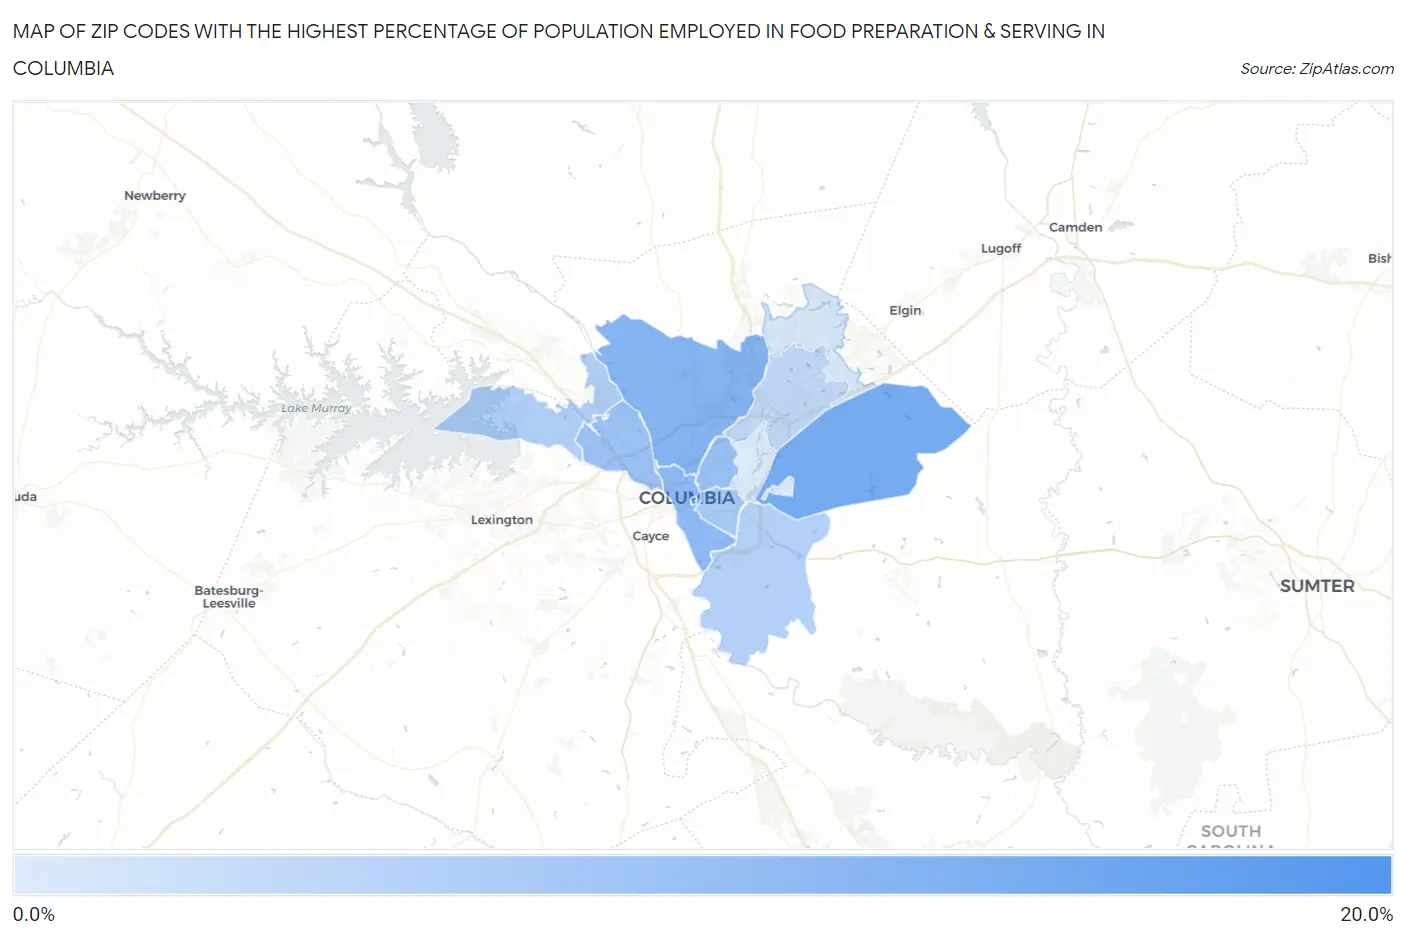
Map of Zip Codes with the Highest Percentage of Population Employed in Food Preparation & Serving in Columbia
2.6%
16.1%
Zip Codes with the Highest Percentage of Population Employed in Food Preparation & Serving in Columbia, SC
| Zip Code | % Employed | vs State | vs National | |
| 1. | 29208 | 16.1% | 5.8%(+10.3)#11 | 5.3%(+10.8)#856 |
| 2. | 29225 | 12.7% | 5.8%(+6.91)#26 | 5.3%(+7.39)#1,473 |
| 3. | 29207 | 11.7% | 5.8%(+5.95)#34 | 5.3%(+6.43)#1,767 |
| 4. | 29203 | 10.5% | 5.8%(+4.77)#46 | 5.3%(+5.26)#2,303 |
| 5. | 29201 | 9.5% | 5.8%(+3.75)#57 | 5.3%(+4.24)#3,040 |
| 6. | 29204 | 8.7% | 5.8%(+2.91)#70 | 5.3%(+3.39)#3,885 |
| 7. | 29210 | 8.2% | 5.8%(+2.42)#80 | 5.3%(+2.91)#4,448 |
| 8. | 29205 | 7.3% | 5.8%(+1.51)#102 | 5.3%(+2.00)#5,954 |
| 9. | 29212 | 6.4% | 5.8%(+0.627)#131 | 5.3%(+1.11)#8,153 |
| 10. | 29209 | 6.1% | 5.8%(+0.356)#144 | 5.3%(+0.839)#8,944 |
| 11. | 29223 | 5.0% | 5.8%(-0.764)#191 | 5.3%(-0.280)#12,921 |
| 12. | 29229 | 3.1% | 5.8%(-2.69)#300 | 5.3%(-2.21)#20,948 |
| 13. | 29206 | 2.6% | 5.8%(-3.15)#320 | 5.3%(-2.66)#22,685 |
1
Common Questions
What are the Top 10 Zip Codes with the Highest Percentage of Population Employed in Food Preparation & Serving in Columbia, SC?
Top 10 Zip Codes with the Highest Percentage of Population Employed in Food Preparation & Serving in Columbia, SC are:
What zip code has the Highest Percentage of Population Employed in Food Preparation & Serving in Columbia, SC?
29208 has the Highest Percentage of Population Employed in Food Preparation & Serving in Columbia, SC with 16.1%.
What is the Percentage of Population Employed in Food Preparation & Serving in Columbia, SC?
Percentage of Population Employed in Food Preparation & Serving in Columbia is 8.8%.
What is the Percentage of Population Employed in Food Preparation & Serving in South Carolina?
Percentage of Population Employed in Food Preparation & Serving in South Carolina is 5.8%.
What is the Percentage of Population Employed in Food Preparation & Serving in the United States?
Percentage of Population Employed in Food Preparation & Serving in the United States is 5.3%.