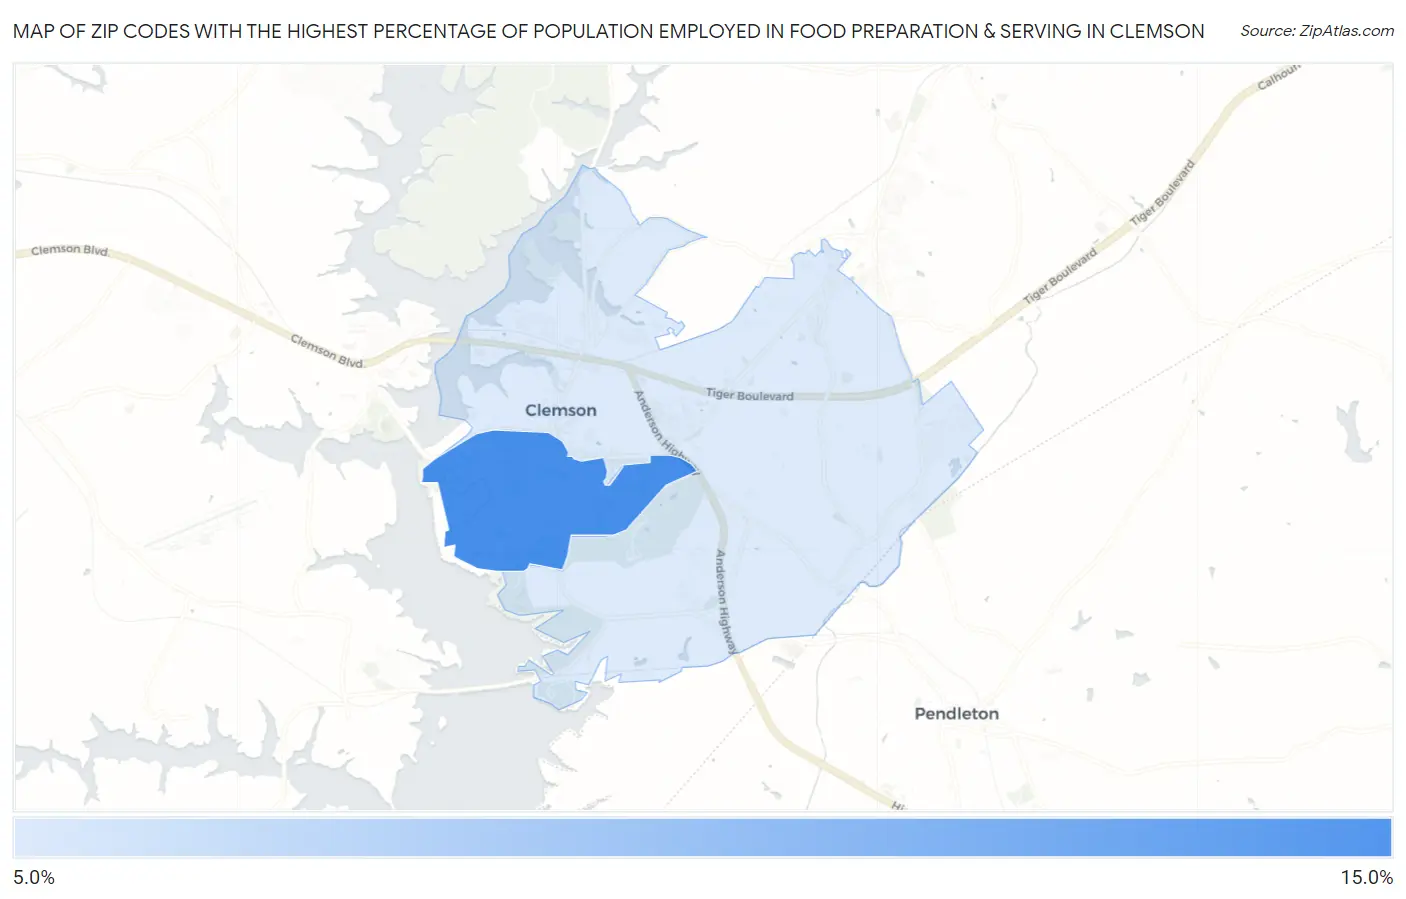
Zip Codes with the Highest Percentage of Population Employed in Food Preparation & Serving in Clemson, SC
RELATED REPORTS & OPTIONS
Food Preparation & Serving
Clemson
Compare Zip Codes
Map of Zip Codes with the Highest Percentage of Population Employed in Food Preparation & Serving in Clemson
13.3%
13.4%
Zip Codes with the Highest Percentage of Population Employed in Food Preparation & Serving in Clemson, SC
| Zip Code | % Employed | vs State | vs National | |
| 1. | 29634 | 13.4% | 5.8%(+7.60)#21 | 5.3%(+8.09)#1,296 |
| 2. | 29631 | 13.3% | 5.8%(+7.52)#22 | 5.3%(+8.01)#1,320 |
1
Common Questions
What are the Top Zip Codes with the Highest Percentage of Population Employed in Food Preparation & Serving in Clemson, SC?
Top Zip Codes with the Highest Percentage of Population Employed in Food Preparation & Serving in Clemson, SC are:
What zip code has the Highest Percentage of Population Employed in Food Preparation & Serving in Clemson, SC?
29634 has the Highest Percentage of Population Employed in Food Preparation & Serving in Clemson, SC with 13.4%.
What is the Percentage of Population Employed in Food Preparation & Serving in Clemson, SC?
Percentage of Population Employed in Food Preparation & Serving in Clemson is 11.2%.
What is the Percentage of Population Employed in Food Preparation & Serving in South Carolina?
Percentage of Population Employed in Food Preparation & Serving in South Carolina is 5.8%.
What is the Percentage of Population Employed in Food Preparation & Serving in the United States?
Percentage of Population Employed in Food Preparation & Serving in the United States is 5.3%.