Promised Land, SC Map & Demographics
Promised Land Map
Promised Land Overview
$19,770
PER CAPITA INCOME
$56,660
AVG FAMILY INCOME
$56,475
AVG HOUSEHOLD INCOME
6.4%
WAGE / INCOME GAP [ % ]
93.6¢/ $1
WAGE / INCOME GAP [ $ ]
0.20
INEQUALITY / GINI INDEX
334
TOTAL POPULATION
182
MALE POPULATION
152
FEMALE POPULATION
119.74
MALES / 100 FEMALES
83.52
FEMALES / 100 MALES
40.8
MEDIAN AGE
3.2
AVG FAMILY SIZE
3.0
AVG HOUSEHOLD SIZE
282
LABOR FORCE [ PEOPLE ]
92.8%
PERCENT IN LABOR FORCE
Income in Promised Land
Income Overview in Promised Land
Per Capita Income in Promised Land is $19,770, while median incomes of families and households are $56,660 and $56,475 respectively.
| Characteristic | Number | Measure |
| Per Capita Income | 334 | $19,770 |
| Median Family Income | 101 | $56,660 |
| Mean Family Income | 101 | $58,679 |
| Median Household Income | 110 | $56,475 |
| Mean Household Income | 110 | $54,977 |
| Income Deficit | 101 | $0 |
| Wage / Income Gap (%) | 334 | 6.39% |
| Wage / Income Gap ($) | 334 | 93.61¢ per $1 |
| Gini / Inequality Index | 334 | 0.20 |
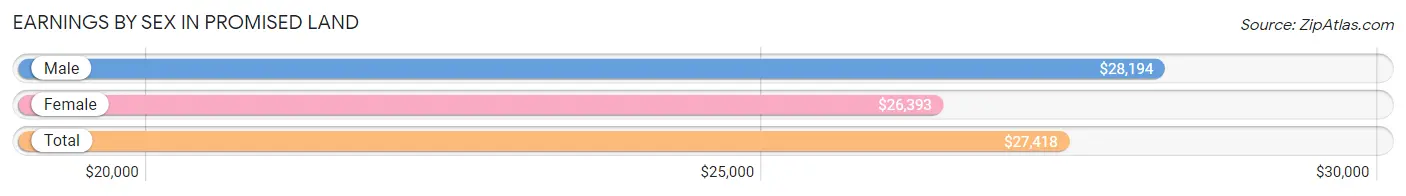
Earnings by Sex in Promised Land
Average Earnings in Promised Land are $27,418, $28,194 for men and $26,393 for women, a difference of 6.4%.
| Sex | Number | Average Earnings |
| Male | 130 (46.1%) | $28,194 |
| Female | 152 (53.9%) | $26,393 |
| Total | 282 (100.0%) | $27,418 |
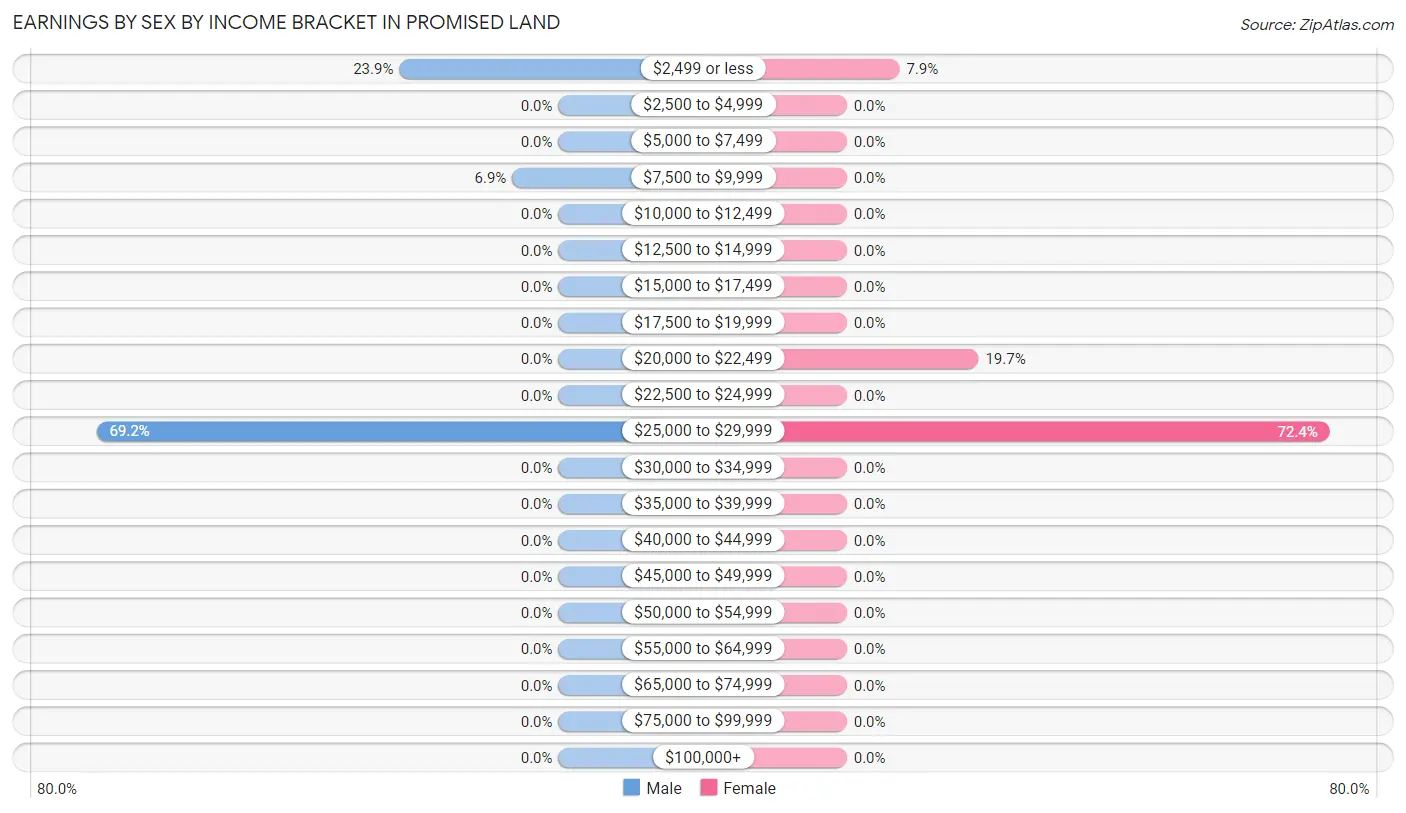
Earnings by Sex by Income Bracket in Promised Land
The most common earnings brackets in Promised Land are $25,000 to $29,999 for men (90 | 69.2%) and $25,000 to $29,999 for women (110 | 72.4%).
| Income | Male | Female |
| $2,499 or less | 31 (23.8%) | 12 (7.9%) |
| $2,500 to $4,999 | 0 (0.0%) | 0 (0.0%) |
| $5,000 to $7,499 | 0 (0.0%) | 0 (0.0%) |
| $7,500 to $9,999 | 9 (6.9%) | 0 (0.0%) |
| $10,000 to $12,499 | 0 (0.0%) | 0 (0.0%) |
| $12,500 to $14,999 | 0 (0.0%) | 0 (0.0%) |
| $15,000 to $17,499 | 0 (0.0%) | 0 (0.0%) |
| $17,500 to $19,999 | 0 (0.0%) | 0 (0.0%) |
| $20,000 to $22,499 | 0 (0.0%) | 30 (19.7%) |
| $22,500 to $24,999 | 0 (0.0%) | 0 (0.0%) |
| $25,000 to $29,999 | 90 (69.2%) | 110 (72.4%) |
| $30,000 to $34,999 | 0 (0.0%) | 0 (0.0%) |
| $35,000 to $39,999 | 0 (0.0%) | 0 (0.0%) |
| $40,000 to $44,999 | 0 (0.0%) | 0 (0.0%) |
| $45,000 to $49,999 | 0 (0.0%) | 0 (0.0%) |
| $50,000 to $54,999 | 0 (0.0%) | 0 (0.0%) |
| $55,000 to $64,999 | 0 (0.0%) | 0 (0.0%) |
| $65,000 to $74,999 | 0 (0.0%) | 0 (0.0%) |
| $75,000 to $99,999 | 0 (0.0%) | 0 (0.0%) |
| $100,000+ | 0 (0.0%) | 0 (0.0%) |
| Total | 130 (100.0%) | 152 (100.0%) |
Earnings by Sex by Educational Attainment in Promised Land
| Educational Attainment | Male Income | Female Income |
| Less than High School | - | - |
| High School Diploma | - | - |
| College or Associate's Degree | - | - |
| Bachelor's Degree | - | - |
| Graduate Degree | - | - |
| Total | $27,841 | $26,393 |
Family Income in Promised Land
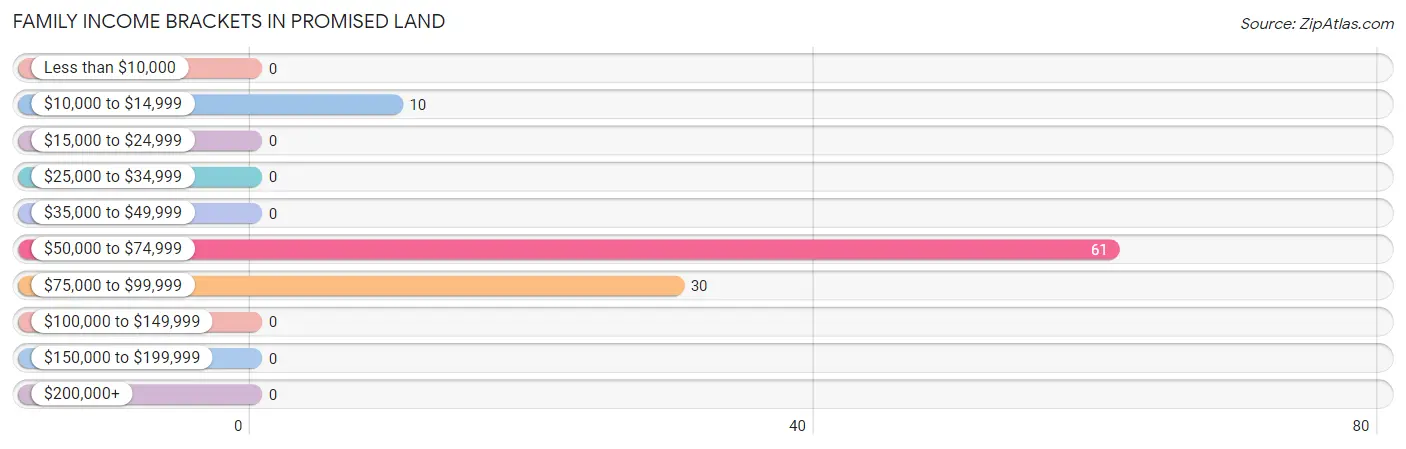
Family Income Brackets in Promised Land
According to the Promised Land family income data, there are 61 families falling into the $50,000 to $74,999 income range, which is the most common income bracket and makes up 60.4% of all families.
| Income Bracket | # Families | % Families |
| Less than $10,000 | 0 | 0.0% |
| $10,000 to $14,999 | 10 | 9.9% |
| $15,000 to $24,999 | 0 | 0.0% |
| $25,000 to $34,999 | 0 | 0.0% |
| $35,000 to $49,999 | 0 | 0.0% |
| $50,000 to $74,999 | 61 | 60.4% |
| $75,000 to $99,999 | 30 | 29.7% |
| $100,000 to $149,999 | 0 | 0.0% |
| $150,000 to $199,999 | 0 | 0.0% |
| $200,000+ | 0 | 0.0% |
Family Income by Famaliy Size in Promised Land
| Income Bracket | # Families | Median Income |
| 2-Person Families | 61 (60.4%) | $0 |
| 3-Person Families | 10 (9.9%) | $0 |
| 4-Person Families | 0 (0.0%) | $0 |
| 5-Person Families | 30 (29.7%) | $0 |
| 6-Person Families | 0 (0.0%) | $0 |
| 7+ Person Families | 0 (0.0%) | $0 |
| Total | 101 (100.0%) | $56,660 |
Family Income by Number of Earners in Promised Land
| Number of Earners | # Families | Median Income |
| No Earners | 0 (0.0%) | $0 |
| 1 Earner | 10 (9.9%) | $0 |
| 2 Earners | 61 (60.4%) | $0 |
| 3+ Earners | 30 (29.7%) | $0 |
| Total | 101 (100.0%) | $56,660 |
Household Income in Promised Land
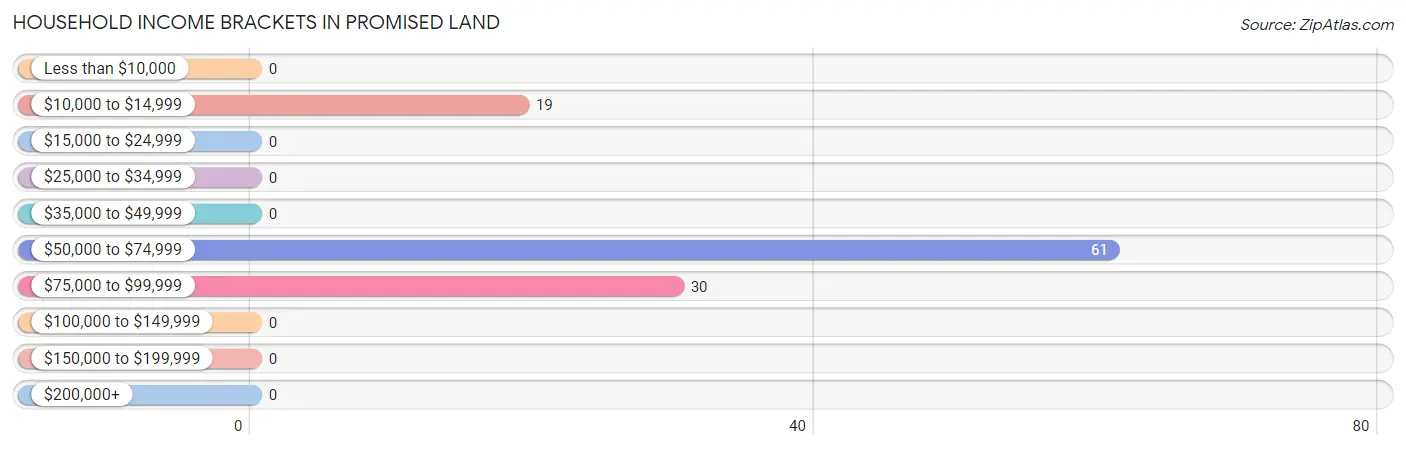
Household Income Brackets in Promised Land
With 61 households falling in the category, the $50,000 to $74,999 income range is the most frequent in Promised Land, accounting for 55.4% of all households.
| Income Bracket | # Households | % Households |
| Less than $10,000 | 0 | 0.0% |
| $10,000 to $14,999 | 19 | 17.3% |
| $15,000 to $24,999 | 0 | 0.0% |
| $25,000 to $34,999 | 0 | 0.0% |
| $35,000 to $49,999 | 0 | 0.0% |
| $50,000 to $74,999 | 61 | 55.5% |
| $75,000 to $99,999 | 30 | 27.3% |
| $100,000 to $149,999 | 0 | 0.0% |
| $150,000 to $199,999 | 0 | 0.0% |
| $200,000+ | 0 | 0.0% |
Household Income by Householder Age in Promised Land
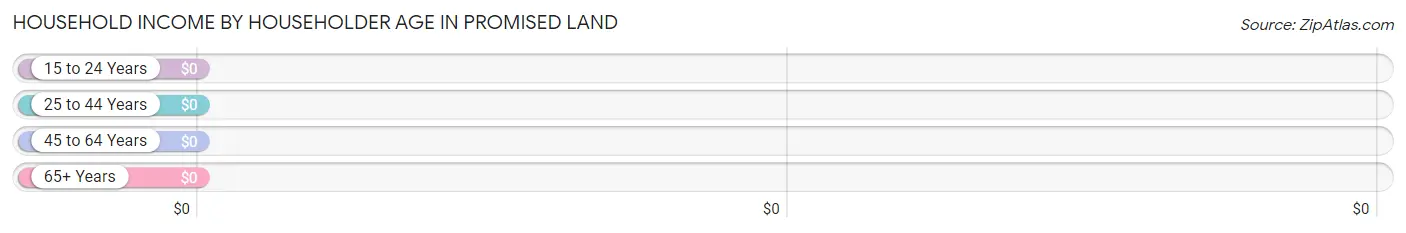
| Income Bracket | # Households | Median Income |
| 15 to 24 Years | 0 (0.0%) | $0 |
| 25 to 44 Years | 9 (8.2%) | $0 |
| 45 to 64 Years | 61 (55.4%) | $0 |
| 65+ Years | 40 (36.4%) | $0 |
| Total | 110 (100.0%) | $56,475 |
Poverty in Promised Land
Income Below Poverty by Sex and Age in Promised Land
With 17.0% poverty level for males and 7.9% for females among the residents of Promised Land, 25 to 34 year old males and 65 to 74 year old females are the most vulnerable to poverty, with 9 males (100.0%) and 12 females (28.6%) in their respective age groups living below the poverty level.
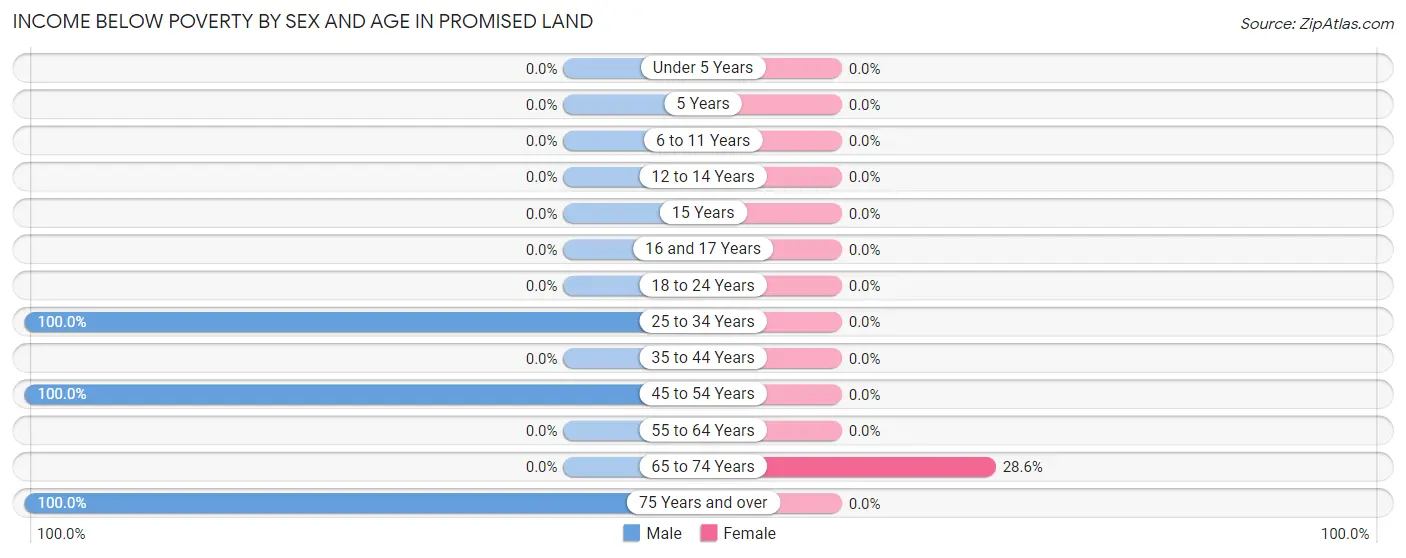
| Age Bracket | Male | Female |
| Under 5 Years | 0 (0.0%) | 0 (0.0%) |
| 5 Years | 0 (0.0%) | 0 (0.0%) |
| 6 to 11 Years | 0 (0.0%) | 0 (0.0%) |
| 12 to 14 Years | 0 (0.0%) | 0 (0.0%) |
| 15 Years | 0 (0.0%) | 0 (0.0%) |
| 16 and 17 Years | 0 (0.0%) | 0 (0.0%) |
| 18 to 24 Years | 0 (0.0%) | 0 (0.0%) |
| 25 to 34 Years | 9 (100.0%) | 0 (0.0%) |
| 35 to 44 Years | 0 (0.0%) | 0 (0.0%) |
| 45 to 54 Years | 12 (100.0%) | 0 (0.0%) |
| 55 to 64 Years | 0 (0.0%) | 0 (0.0%) |
| 65 to 74 Years | 0 (0.0%) | 12 (28.6%) |
| 75 Years and over | 10 (100.0%) | 0 (0.0%) |
| Total | 31 (17.0%) | 12 (7.9%) |
Income Above Poverty by Sex and Age in Promised Land
According to the poverty statistics in Promised Land, males aged 6 to 11 years and females aged 25 to 34 years are the age groups that are most secure financially, with 100.0% of males and 100.0% of females in these age groups living above the poverty line.
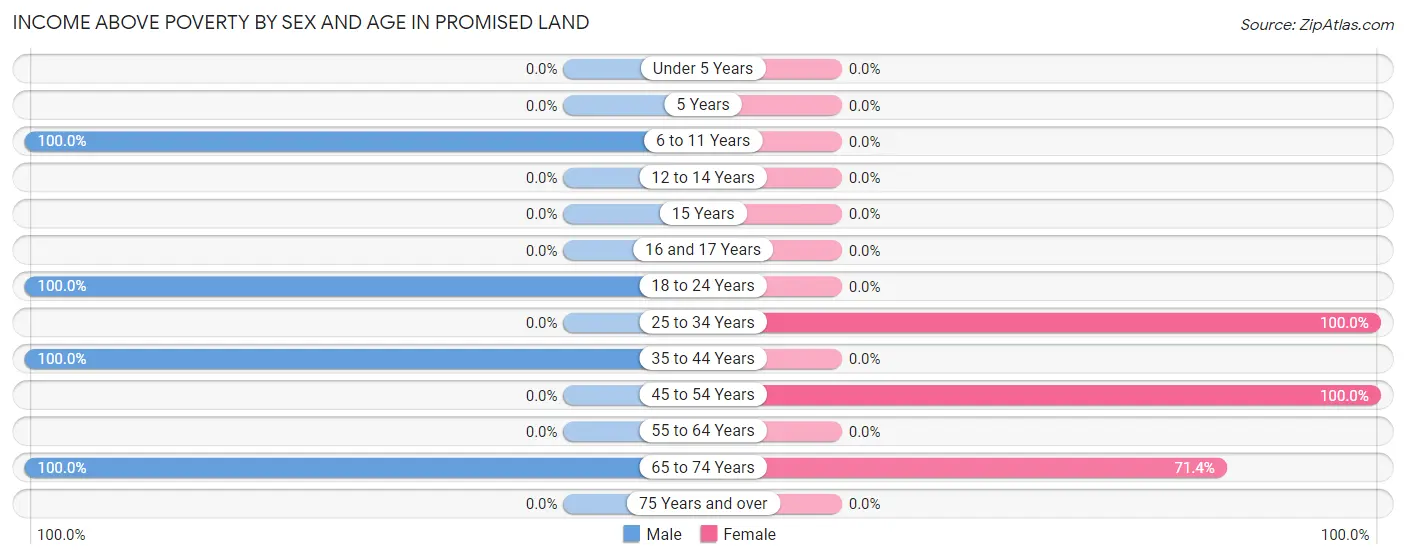
| Age Bracket | Male | Female |
| Under 5 Years | 0 (0.0%) | 0 (0.0%) |
| 5 Years | 0 (0.0%) | 0 (0.0%) |
| 6 to 11 Years | 30 (100.0%) | 0 (0.0%) |
| 12 to 14 Years | 0 (0.0%) | 0 (0.0%) |
| 15 Years | 0 (0.0%) | 0 (0.0%) |
| 16 and 17 Years | 0 (0.0%) | 0 (0.0%) |
| 18 to 24 Years | 35 (100.0%) | 0 (0.0%) |
| 25 to 34 Years | 0 (0.0%) | 49 (100.0%) |
| 35 to 44 Years | 55 (100.0%) | 0 (0.0%) |
| 45 to 54 Years | 0 (0.0%) | 61 (100.0%) |
| 55 to 64 Years | 0 (0.0%) | 0 (0.0%) |
| 65 to 74 Years | 31 (100.0%) | 30 (71.4%) |
| 75 Years and over | 0 (0.0%) | 0 (0.0%) |
| Total | 151 (83.0%) | 140 (92.1%) |
Income Below Poverty Among Married-Couple Families in Promised Land
The poverty statistics for married-couple families in Promised Land show that 25.0% or 10 of the total 40 families live below the poverty line. Families with no children have the highest poverty rate of 100.0%, comprising of 10 families. On the other hand, families with 1 or 2 children have the lowest poverty rate of 0.0%, which includes 0 families.
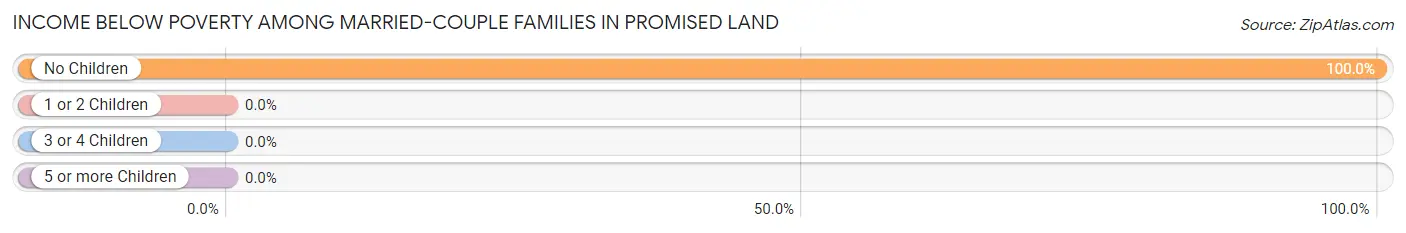
| Children | Above Poverty | Below Poverty |
| No Children | 0 (0.0%) | 10 (100.0%) |
| 1 or 2 Children | 30 (100.0%) | 0 (0.0%) |
| 3 or 4 Children | 0 (0.0%) | 0 (0.0%) |
| 5 or more Children | 0 (0.0%) | 0 (0.0%) |
| Total | 30 (75.0%) | 10 (25.0%) |
Income Below Poverty Among Single-Parent Households in Promised Land
| Children | Single Father | Single Mother |
| No Children | 0 (0.0%) | 0 (0.0%) |
| 1 or 2 Children | 0 (0.0%) | 0 (0.0%) |
| 3 or 4 Children | 0 (0.0%) | 0 (0.0%) |
| 5 or more Children | 0 (0.0%) | 0 (0.0%) |
| Total | 0 (0.0%) | 0 (0.0%) |
Income Below Poverty Among Married-Couple vs Single-Parent Households in Promised Land
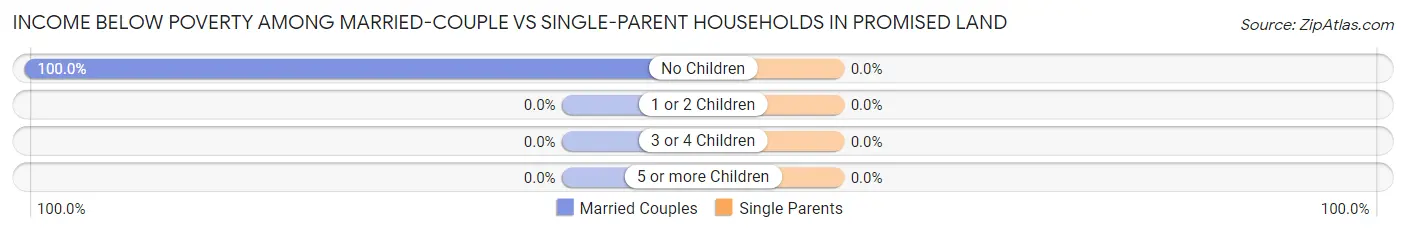
| Children | Married-Couple Families | Single-Parent Households |
| No Children | 10 (100.0%) | 0 (0.0%) |
| 1 or 2 Children | 0 (0.0%) | 0 (0.0%) |
| 3 or 4 Children | 0 (0.0%) | 0 (0.0%) |
| 5 or more Children | 0 (0.0%) | 0 (0.0%) |
| Total | 10 (25.0%) | 0 (0.0%) |
Race in Promised Land
The most populous races in Promised Land are , and Black / African American (334 | 100.0%).
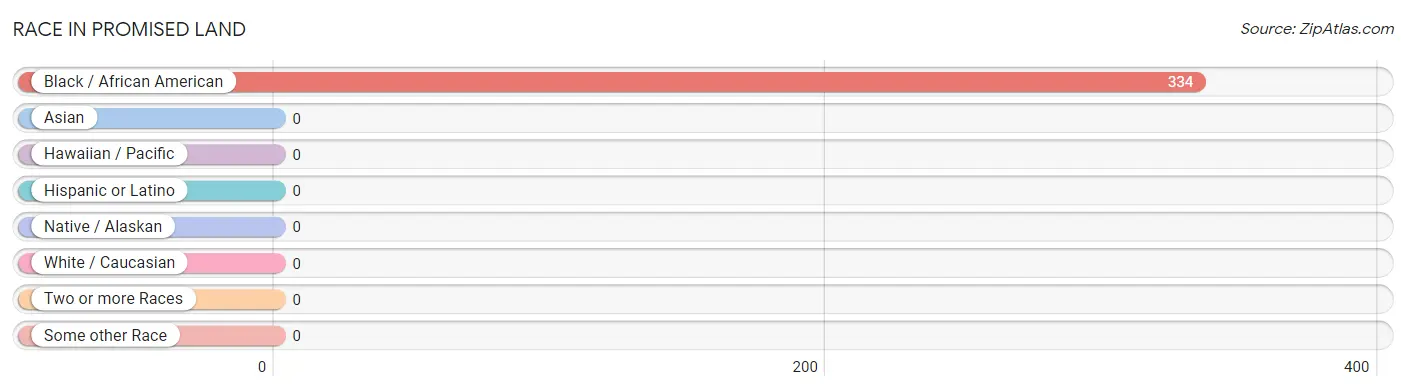
| Race | # Population | % Population |
| Asian | 0 | 0.0% |
| Black / African American | 334 | 100.0% |
| Hawaiian / Pacific | 0 | 0.0% |
| Hispanic or Latino | 0 | 0.0% |
| Native / Alaskan | 0 | 0.0% |
| White / Caucasian | 0 | 0.0% |
| Two or more Races | 0 | 0.0% |
| Some other Race | 0 | 0.0% |
| Total | 334 | 100.0% |
Ancestry in Promised Land
The most populous ancestries reported in Promised Land are African (110 | 32.9%), and Subsaharan African (110 | 32.9%), together accounting for 65.9% of all Promised Land residents.
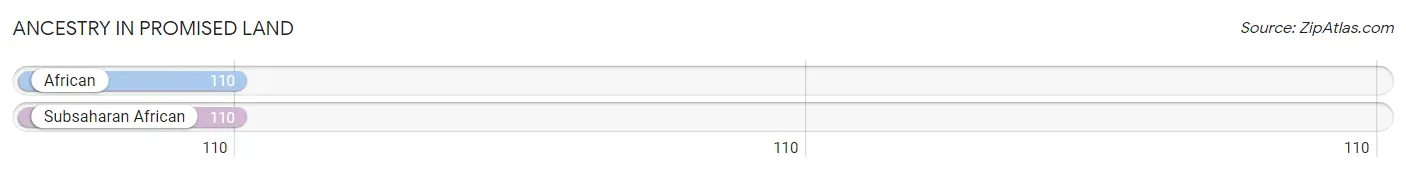
| Ancestry | # Population | % Population |
| African | 110 | 32.9% |
| Subsaharan African | 110 | 32.9% | View All 2 Rows |
Immigrants in Promised Land

| Immigration Origin | # Population | % Population | View All 0 Rows |
Sex and Age in Promised Land
Sex and Age in Promised Land
The most populous age groups in Promised Land are 40 to 44 Years (55 | 30.2%) for men and 50 to 54 Years (61 | 40.1%) for women.
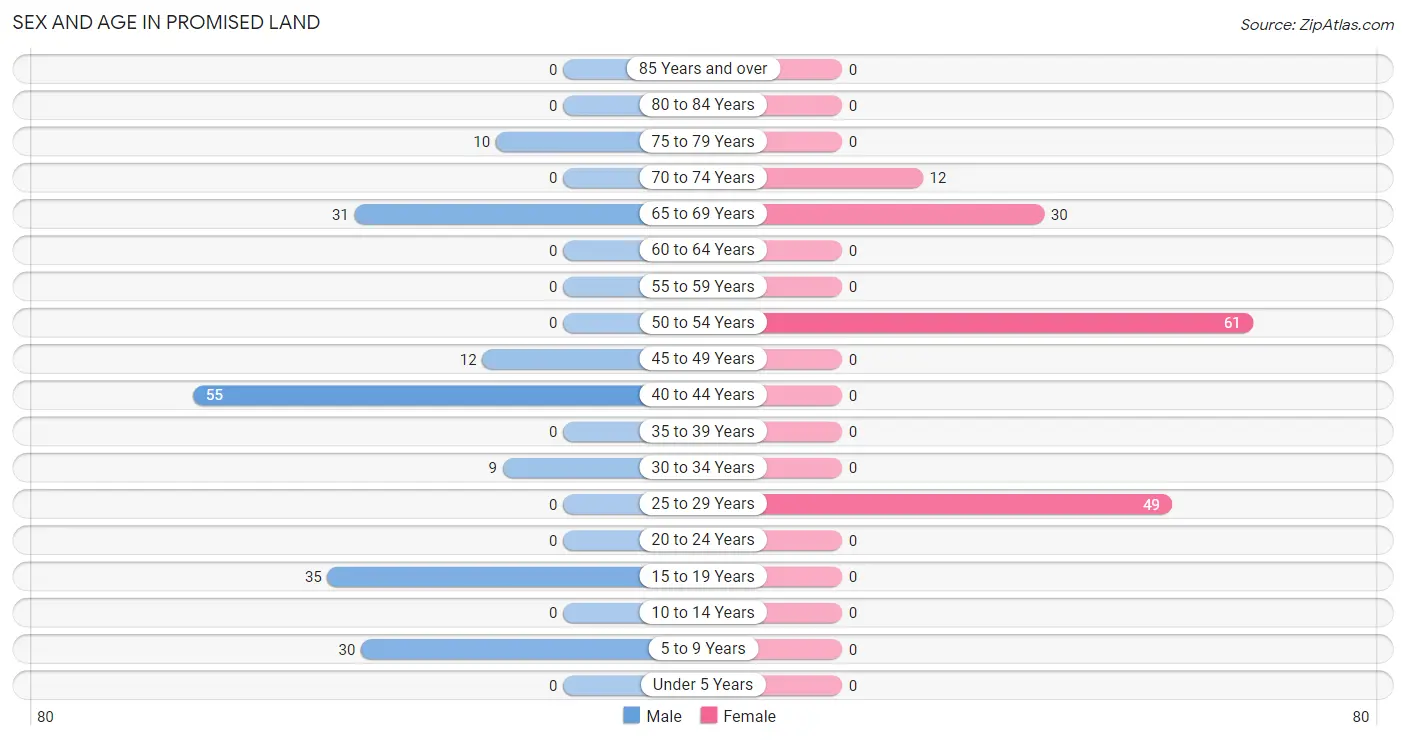
| Age Bracket | Male | Female |
| Under 5 Years | 0 (0.0%) | 0 (0.0%) |
| 5 to 9 Years | 30 (16.5%) | 0 (0.0%) |
| 10 to 14 Years | 0 (0.0%) | 0 (0.0%) |
| 15 to 19 Years | 35 (19.2%) | 0 (0.0%) |
| 20 to 24 Years | 0 (0.0%) | 0 (0.0%) |
| 25 to 29 Years | 0 (0.0%) | 49 (32.2%) |
| 30 to 34 Years | 9 (5.0%) | 0 (0.0%) |
| 35 to 39 Years | 0 (0.0%) | 0 (0.0%) |
| 40 to 44 Years | 55 (30.2%) | 0 (0.0%) |
| 45 to 49 Years | 12 (6.6%) | 0 (0.0%) |
| 50 to 54 Years | 0 (0.0%) | 61 (40.1%) |
| 55 to 59 Years | 0 (0.0%) | 0 (0.0%) |
| 60 to 64 Years | 0 (0.0%) | 0 (0.0%) |
| 65 to 69 Years | 31 (17.0%) | 30 (19.7%) |
| 70 to 74 Years | 0 (0.0%) | 12 (7.9%) |
| 75 to 79 Years | 10 (5.5%) | 0 (0.0%) |
| 80 to 84 Years | 0 (0.0%) | 0 (0.0%) |
| 85 Years and over | 0 (0.0%) | 0 (0.0%) |
| Total | 182 (100.0%) | 152 (100.0%) |
Families and Households in Promised Land
Median Family Size in Promised Land
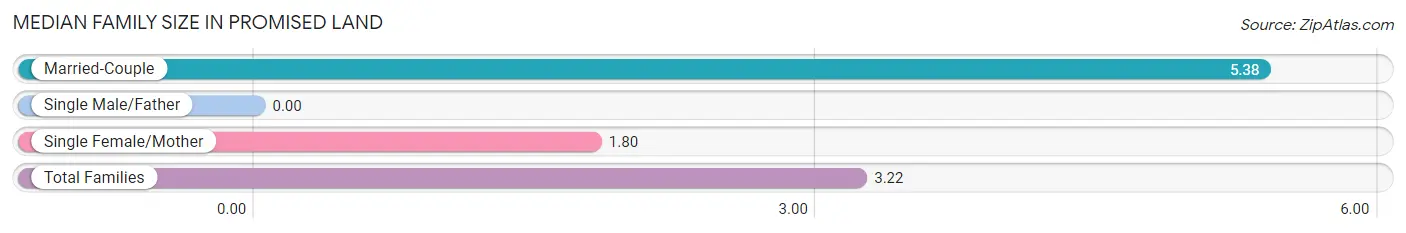
| Family Type | # Families | Family Size |
| Married-Couple | 40 (39.6%) | 5.38 |
| Single Male/Father | 0 (0.0%) | - |
| Single Female/Mother | 61 (60.4%) | 1.80 |
| Total Families | 101 (100.0%) | 3.22 |
Median Household Size in Promised Land
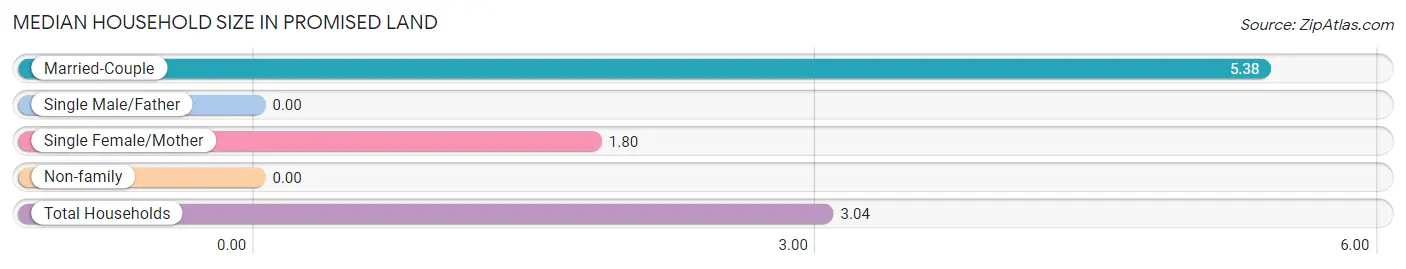
| Household Type | # Households | Household Size |
| Married-Couple | 40 (36.4%) | 5.38 |
| Single Male/Father | 0 (0.0%) | - |
| Single Female/Mother | 61 (55.4%) | 1.80 |
| Non-family | 9 (8.2%) | - |
| Total Households | 110 (100.0%) | 3.04 |
Household Size by Marriage Status in Promised Land
Out of a total of 110 households in Promised Land, 101 (91.8%) are family households, while 9 (8.2%) are nonfamily households. The most numerous type of family households are 2-person households, comprising 61, and the most common type of nonfamily households are 1-person households, comprising 9.
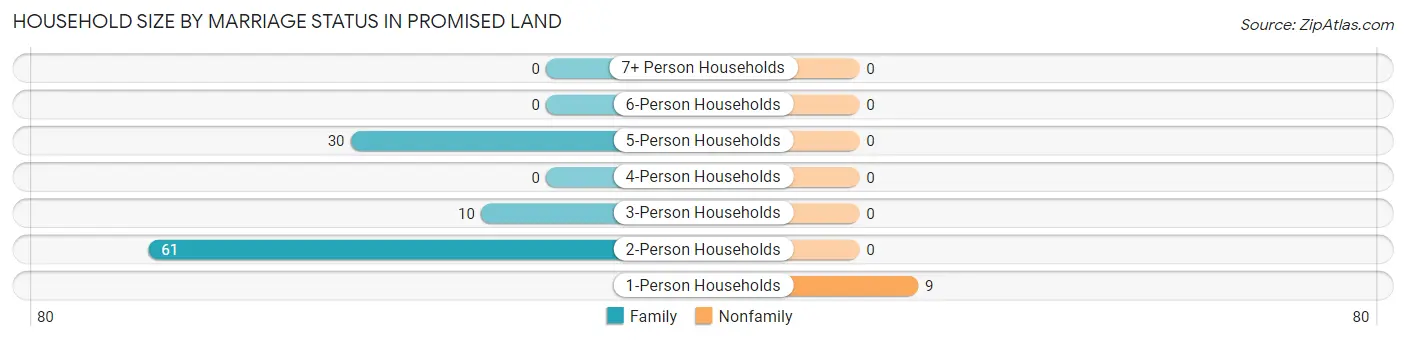
| Household Size | Family Households | Nonfamily Households |
| 1-Person Households | - | 9 (8.2%) |
| 2-Person Households | 61 (55.4%) | 0 (0.0%) |
| 3-Person Households | 10 (9.1%) | 0 (0.0%) |
| 4-Person Households | 0 (0.0%) | 0 (0.0%) |
| 5-Person Households | 30 (27.3%) | 0 (0.0%) |
| 6-Person Households | 0 (0.0%) | 0 (0.0%) |
| 7+ Person Households | 0 (0.0%) | 0 (0.0%) |
| Total | 101 (91.8%) | 9 (8.2%) |
Female Fertility in Promised Land
Fertility by Age in Promised Land
| Age Bracket | Women with Births | Births / 1,000 Women |
| 15 to 19 years | 0 (0.0%) | 0.0 |
| 20 to 34 years | 0 (0.0%) | 0.0 |
| 35 to 50 years | 0 (0.0%) | 0.0 |
| Total | 0 (0.0%) | 0.0 |
Fertility by Age by Marriage Status in Promised Land
| Age Bracket | Married | Unmarried |
| 15 to 19 years | 0 (0.0%) | 0 (0.0%) |
| 20 to 34 years | 0 (0.0%) | 0 (0.0%) |
| 35 to 50 years | 0 (0.0%) | 0 (0.0%) |
| Total | 0 (0.0%) | 0 (0.0%) |
Fertility by Education in Promised Land
| Educational Attainment | Women with Births | Births / 1,000 Women |
| Less than High School | 0 (0.0%) | 0.0 |
| High School Diploma | 0 (0.0%) | 0.0 |
| College or Associate's Degree | 0 (0.0%) | 0.0 |
| Bachelor's Degree | 0 (0.0%) | 0.0 |
| Graduate Degree | 0 (0.0%) | 0.0 |
| Total | 0 (0.0%) | 0.0 |
Fertility by Education by Marriage Status in Promised Land
| Educational Attainment | Married | Unmarried |
| Less than High School | 0 (0.0%) | 0 (0.0%) |
| High School Diploma | 0 (0.0%) | 0 (0.0%) |
| College or Associate's Degree | 0 (0.0%) | 0 (0.0%) |
| Bachelor's Degree | 0 (0.0%) | 0 (0.0%) |
| Graduate Degree | 0 (0.0%) | 0 (0.0%) |
| Total | 0 (0.0%) | 0 (0.0%) |
Employment Characteristics in Promised Land
Employment by Class of Employer in Promised Land
Among the 282 employed individuals in Promised Land, private company employees (252 | 89.4%), and state government employees (30 | 10.6%) make up the most common classes of employment.
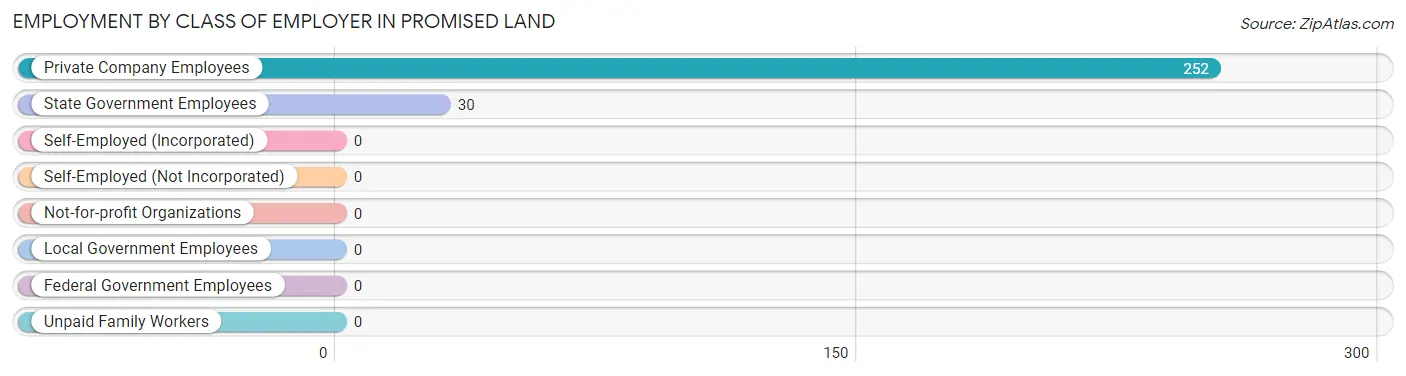
| Employer Class | # Employees | % Employees |
| Private Company Employees | 252 | 89.4% |
| Self-Employed (Incorporated) | 0 | 0.0% |
| Self-Employed (Not Incorporated) | 0 | 0.0% |
| Not-for-profit Organizations | 0 | 0.0% |
| Local Government Employees | 0 | 0.0% |
| State Government Employees | 30 | 10.6% |
| Federal Government Employees | 0 | 0.0% |
| Unpaid Family Workers | 0 | 0.0% |
| Total | 282 | 100.0% |
Employment Status by Age in Promised Land
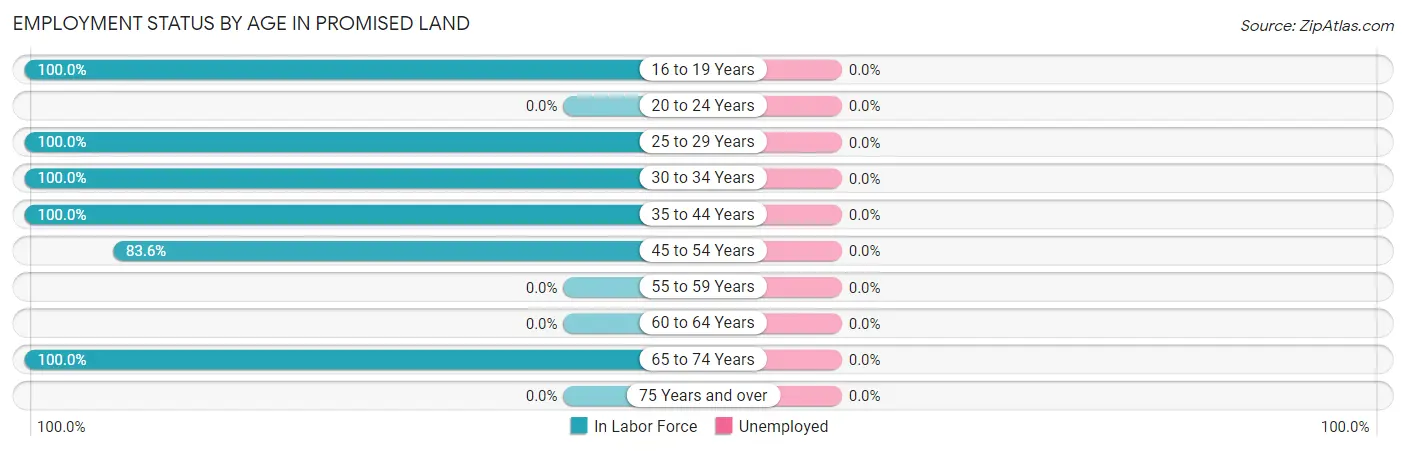
| Age Bracket | In Labor Force | Unemployed |
| 16 to 19 Years | 35 (100.0%) | 0 (0.0%) |
| 20 to 24 Years | 0 (0.0%) | 0 (0.0%) |
| 25 to 29 Years | 49 (100.0%) | 0 (0.0%) |
| 30 to 34 Years | 9 (100.0%) | 0 (0.0%) |
| 35 to 44 Years | 55 (100.0%) | 0 (0.0%) |
| 45 to 54 Years | 61 (83.6%) | 0 (0.0%) |
| 55 to 59 Years | 0 (0.0%) | 0 (0.0%) |
| 60 to 64 Years | 0 (0.0%) | 0 (0.0%) |
| 65 to 74 Years | 73 (100.0%) | 0 (0.0%) |
| 75 Years and over | 0 (0.0%) | 0 (0.0%) |
| Total | 282 (92.8%) | 0 (0.0%) |
Employment Status by Educational Attainment in Promised Land
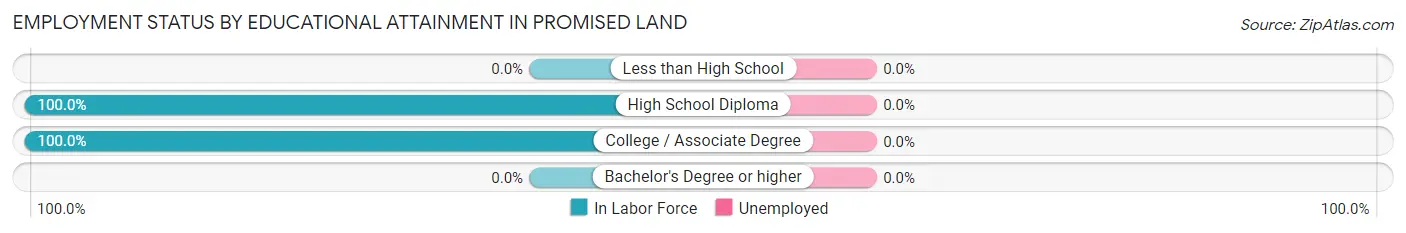
| Educational Attainment | In Labor Force | Unemployed |
| Less than High School | 0 (0.0%) | 0 (0.0%) |
| High School Diploma | 58 (100.0%) | 0 (0.0%) |
| College / Associate Degree | 116 (100.0%) | 0 (0.0%) |
| Bachelor's Degree or higher | 0 (0.0%) | 0 (0.0%) |
| Total | 174 (93.5%) | 0 (0.0%) |
Employment Occupations by Sex in Promised Land
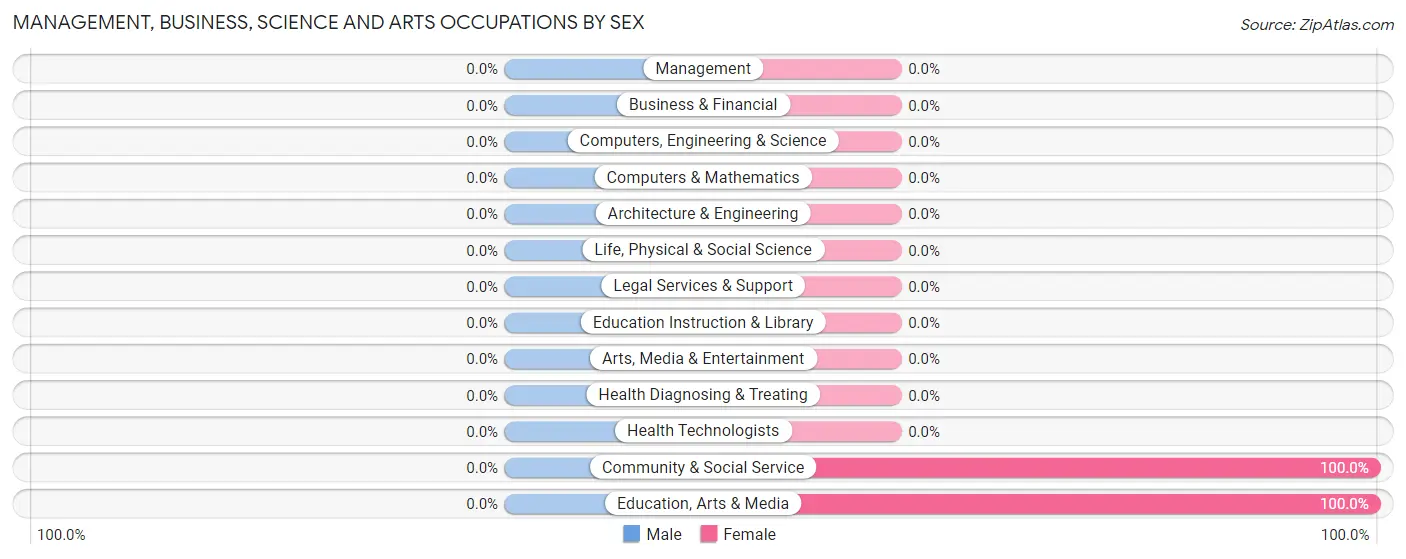
Management, Business, Science and Arts Occupations
The most common Management, Business, Science and Arts occupations in Promised Land are Community & Social Service (30 | 10.6%), and Education, Arts & Media (30 | 10.6%).
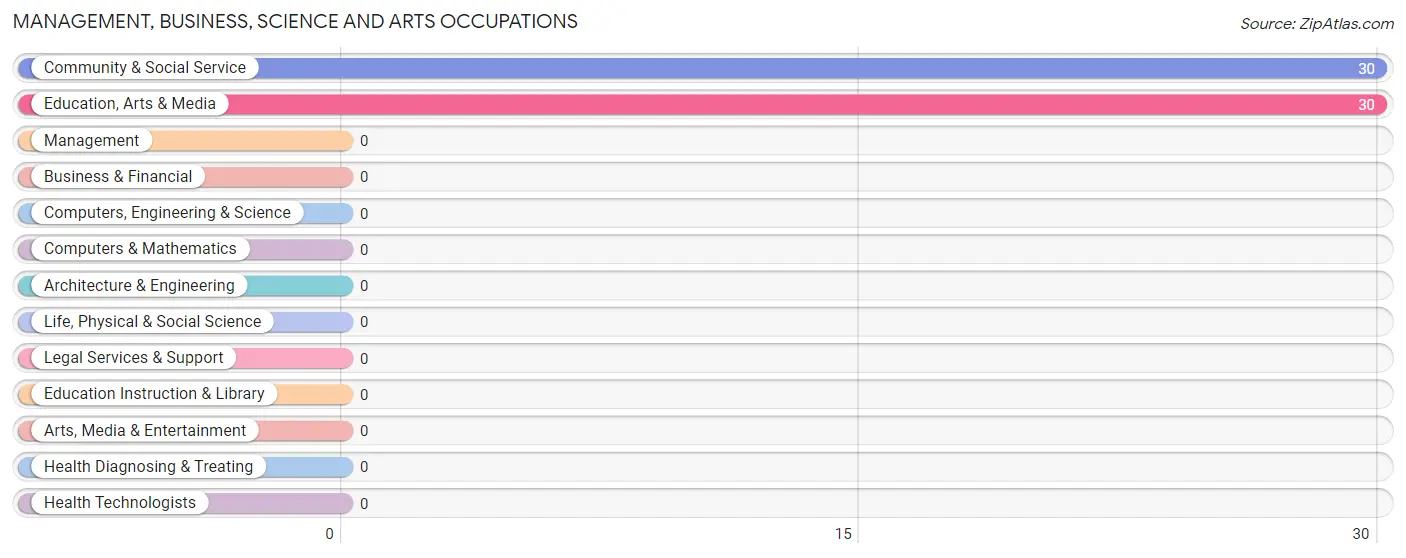
Management, Business, Science and Arts Occupations by Sex
| Occupation | Male | Female |
| Management | 0 (0.0%) | 0 (0.0%) |
| Business & Financial | 0 (0.0%) | 0 (0.0%) |
| Computers, Engineering & Science | 0 (0.0%) | 0 (0.0%) |
| Computers & Mathematics | 0 (0.0%) | 0 (0.0%) |
| Architecture & Engineering | 0 (0.0%) | 0 (0.0%) |
| Life, Physical & Social Science | 0 (0.0%) | 0 (0.0%) |
| Community & Social Service | 0 (0.0%) | 30 (100.0%) |
| Education, Arts & Media | 0 (0.0%) | 30 (100.0%) |
| Legal Services & Support | 0 (0.0%) | 0 (0.0%) |
| Education Instruction & Library | 0 (0.0%) | 0 (0.0%) |
| Arts, Media & Entertainment | 0 (0.0%) | 0 (0.0%) |
| Health Diagnosing & Treating | 0 (0.0%) | 0 (0.0%) |
| Health Technologists | 0 (0.0%) | 0 (0.0%) |
| Total (Category) | 0 (0.0%) | 30 (100.0%) |
| Total (Overall) | 130 (46.1%) | 152 (53.9%) |
Services Occupations
The most common Services occupations in Promised Land are , and Food Preparation & Serving (55 | 19.5%).
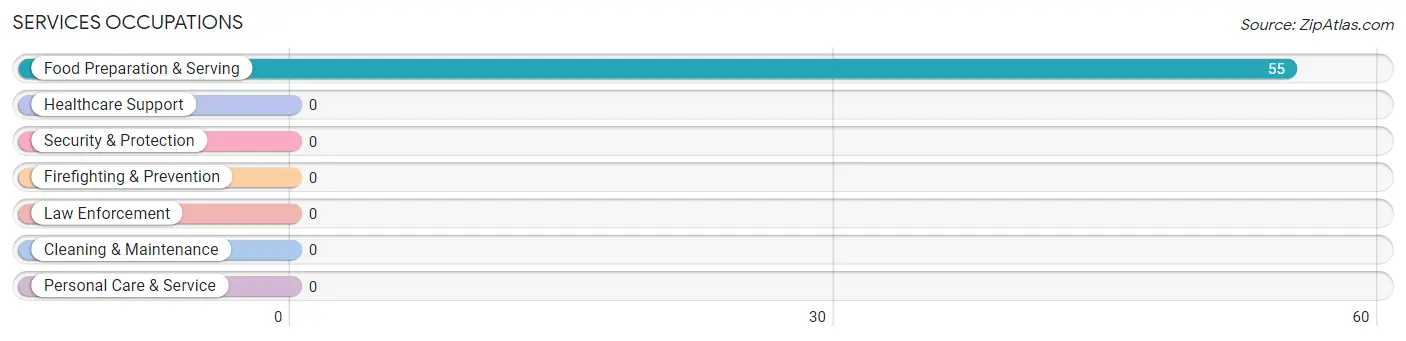
Services Occupations by Sex
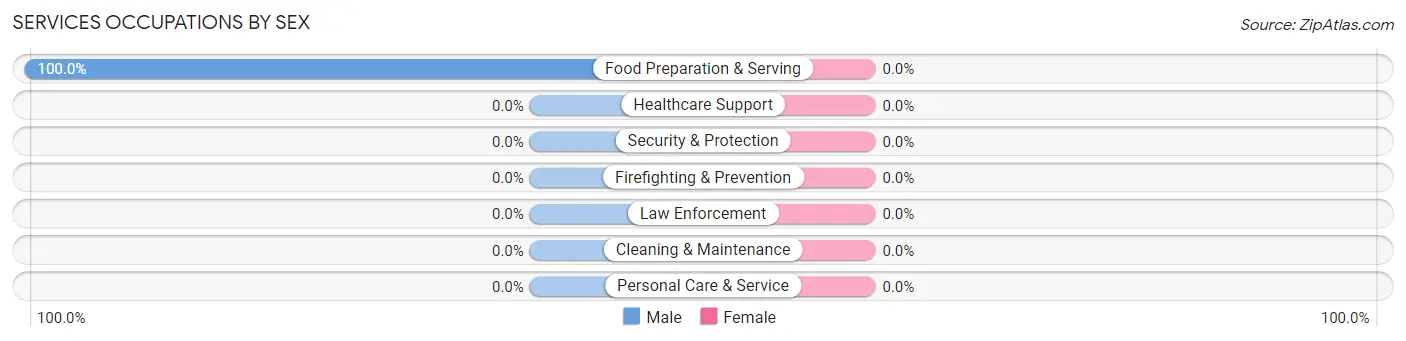
| Occupation | Male | Female |
| Healthcare Support | 0 (0.0%) | 0 (0.0%) |
| Security & Protection | 0 (0.0%) | 0 (0.0%) |
| Firefighting & Prevention | 0 (0.0%) | 0 (0.0%) |
| Law Enforcement | 0 (0.0%) | 0 (0.0%) |
| Food Preparation & Serving | 55 (100.0%) | 0 (0.0%) |
| Cleaning & Maintenance | 0 (0.0%) | 0 (0.0%) |
| Personal Care & Service | 0 (0.0%) | 0 (0.0%) |
| Total (Category) | 55 (100.0%) | 0 (0.0%) |
| Total (Overall) | 130 (46.1%) | 152 (53.9%) |
Sales and Office Occupations
The most common Sales and Office occupations in Promised Land are , and Office & Administration (9 | 3.2%).
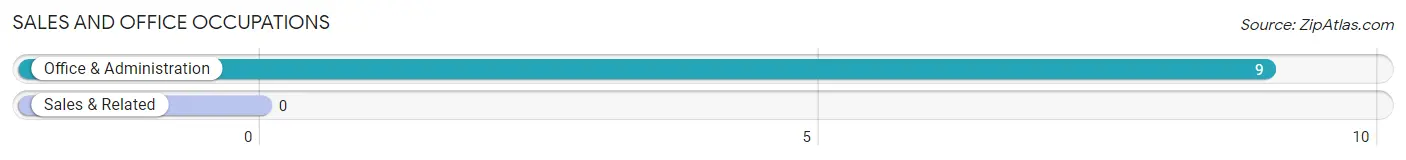
Sales and Office Occupations by Sex
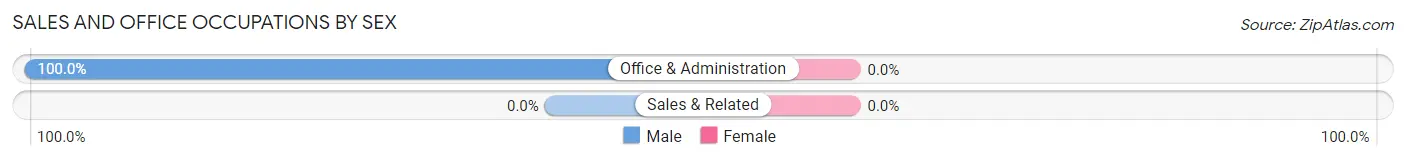
| Occupation | Male | Female |
| Sales & Related | 0 (0.0%) | 0 (0.0%) |
| Office & Administration | 9 (100.0%) | 0 (0.0%) |
| Total (Category) | 9 (100.0%) | 0 (0.0%) |
| Total (Overall) | 130 (46.1%) | 152 (53.9%) |
Natural Resources, Construction and Maintenance Occupations
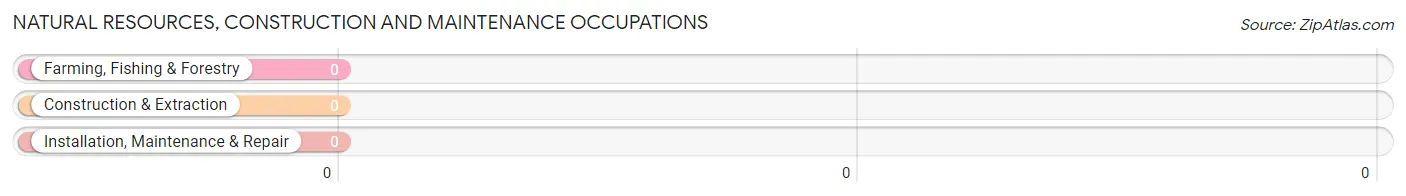
Natural Resources, Construction and Maintenance Occupations by Sex
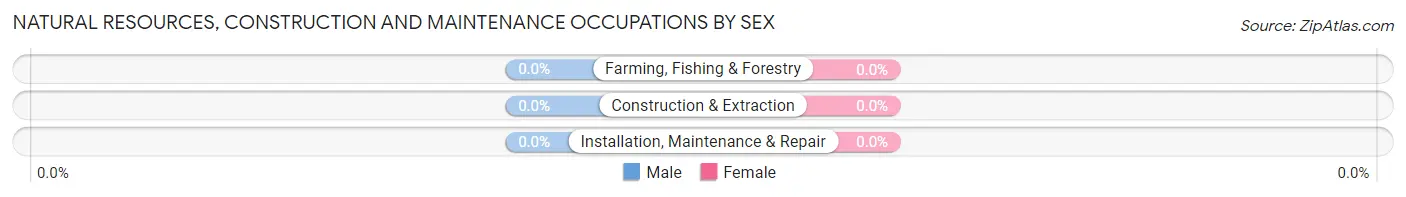
| Occupation | Male | Female |
| Farming, Fishing & Forestry | 0 (0.0%) | 0 (0.0%) |
| Construction & Extraction | 0 (0.0%) | 0 (0.0%) |
| Installation, Maintenance & Repair | 0 (0.0%) | 0 (0.0%) |
| Total (Category) | 0 (0.0%) | 0 (0.0%) |
| Total (Overall) | 130 (46.1%) | 152 (53.9%) |
Production, Transportation and Moving Occupations
The most common Production, Transportation and Moving occupations in Promised Land are Production (96 | 34.0%), and Transportation (92 | 32.6%).
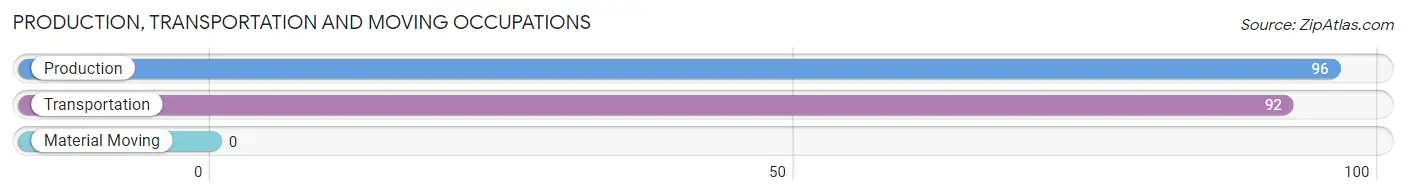
Production, Transportation and Moving Occupations by Sex
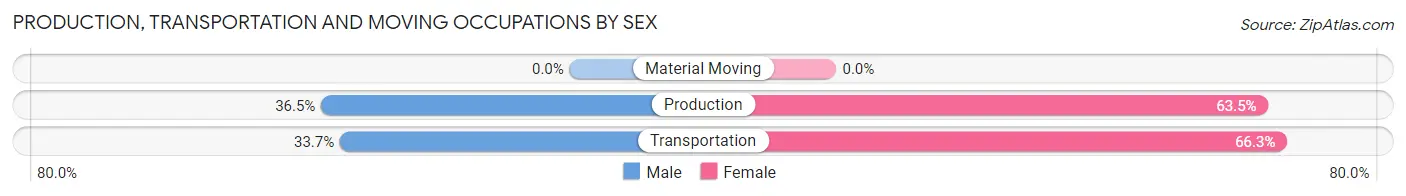
| Occupation | Male | Female |
| Production | 35 (36.5%) | 61 (63.5%) |
| Transportation | 31 (33.7%) | 61 (66.3%) |
| Material Moving | 0 (0.0%) | 0 (0.0%) |
| Total (Category) | 66 (35.1%) | 122 (64.9%) |
| Total (Overall) | 130 (46.1%) | 152 (53.9%) |
Employment Industries by Sex in Promised Land
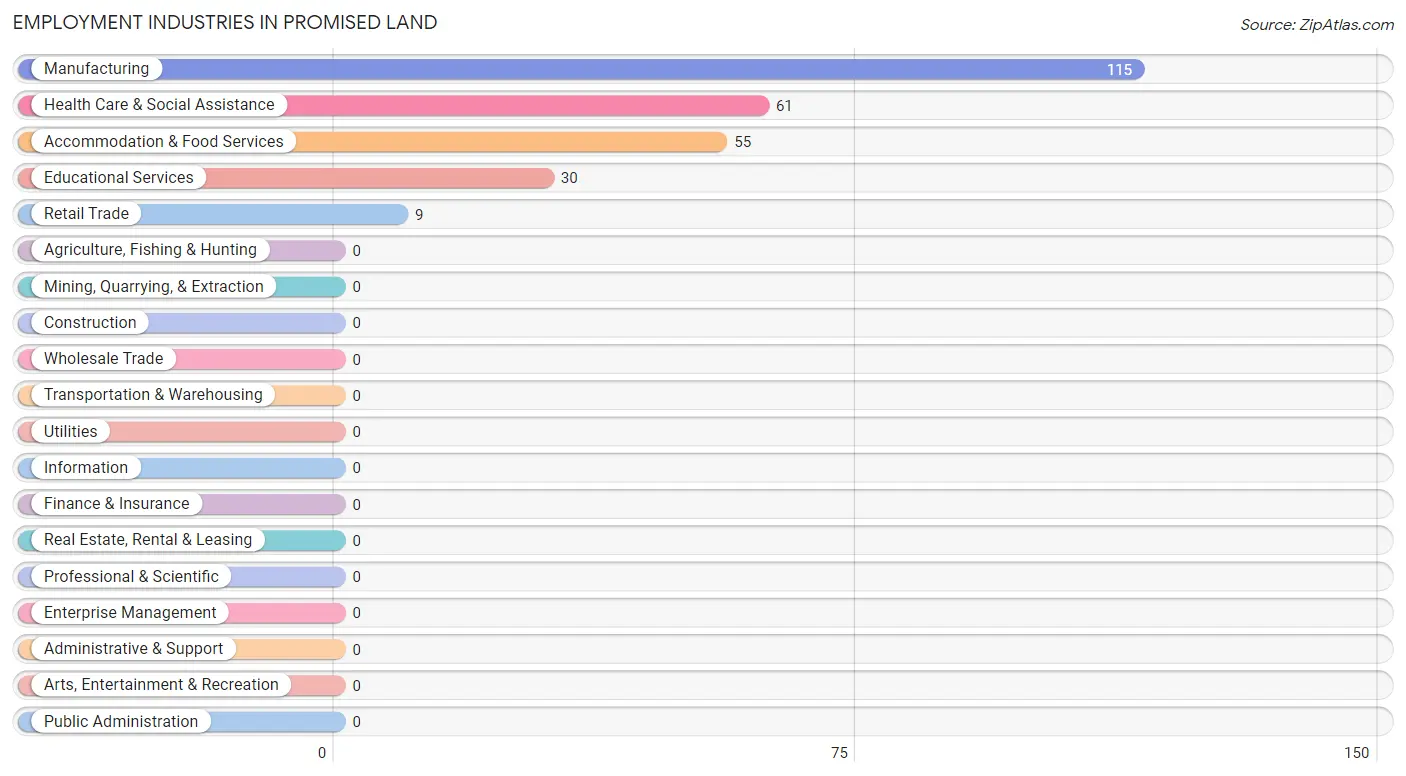
Employment Industries in Promised Land
The major employment industries in Promised Land include Manufacturing (115 | 40.8%), Health Care & Social Assistance (61 | 21.6%), Accommodation & Food Services (55 | 19.5%), Educational Services (30 | 10.6%), and Retail Trade (9 | 3.2%).
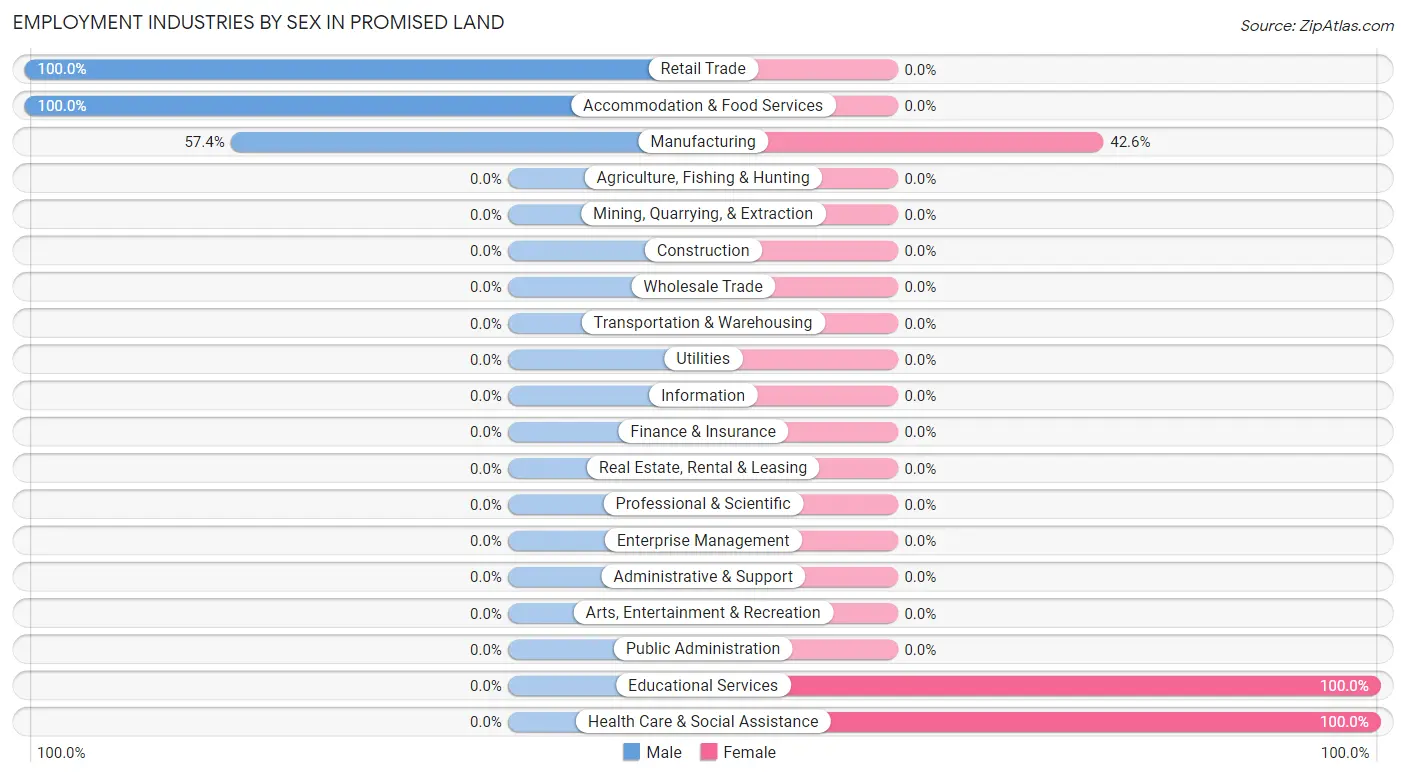
Employment Industries by Sex in Promised Land
The Promised Land industries that see more men than women are Retail Trade (100.0%), Accommodation & Food Services (100.0%), and Manufacturing (57.4%), whereas the industries that tend to have a higher number of women are Educational Services (100.0%), Health Care & Social Assistance (100.0%), and Manufacturing (42.6%).
| Industry | Male | Female |
| Agriculture, Fishing & Hunting | 0 (0.0%) | 0 (0.0%) |
| Mining, Quarrying, & Extraction | 0 (0.0%) | 0 (0.0%) |
| Construction | 0 (0.0%) | 0 (0.0%) |
| Manufacturing | 66 (57.4%) | 49 (42.6%) |
| Wholesale Trade | 0 (0.0%) | 0 (0.0%) |
| Retail Trade | 9 (100.0%) | 0 (0.0%) |
| Transportation & Warehousing | 0 (0.0%) | 0 (0.0%) |
| Utilities | 0 (0.0%) | 0 (0.0%) |
| Information | 0 (0.0%) | 0 (0.0%) |
| Finance & Insurance | 0 (0.0%) | 0 (0.0%) |
| Real Estate, Rental & Leasing | 0 (0.0%) | 0 (0.0%) |
| Professional & Scientific | 0 (0.0%) | 0 (0.0%) |
| Enterprise Management | 0 (0.0%) | 0 (0.0%) |
| Administrative & Support | 0 (0.0%) | 0 (0.0%) |
| Educational Services | 0 (0.0%) | 30 (100.0%) |
| Health Care & Social Assistance | 0 (0.0%) | 61 (100.0%) |
| Arts, Entertainment & Recreation | 0 (0.0%) | 0 (0.0%) |
| Accommodation & Food Services | 55 (100.0%) | 0 (0.0%) |
| Public Administration | 0 (0.0%) | 0 (0.0%) |
| Total | 130 (46.1%) | 152 (53.9%) |
Education in Promised Land
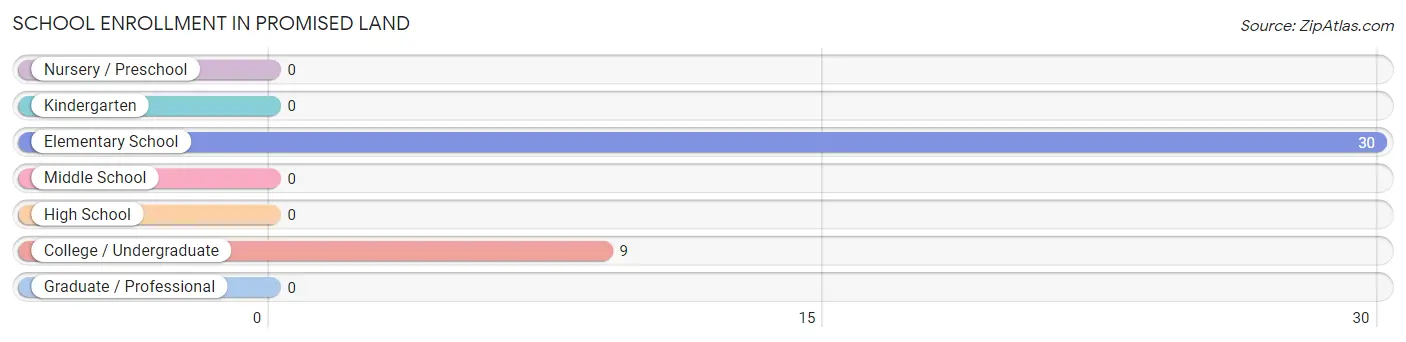
School Enrollment in Promised Land
The most common levels of schooling among the 39 students in Promised Land are elementary school (30 | 76.9%), and college / undergraduate (9 | 23.1%).
| School Level | # Students | % Students |
| Nursery / Preschool | 0 | 0.0% |
| Kindergarten | 0 | 0.0% |
| Elementary School | 30 | 76.9% |
| Middle School | 0 | 0.0% |
| High School | 0 | 0.0% |
| College / Undergraduate | 9 | 23.1% |
| Graduate / Professional | 0 | 0.0% |
| Total | 39 | 100.0% |
School Enrollment by Age by Funding Source in Promised Land
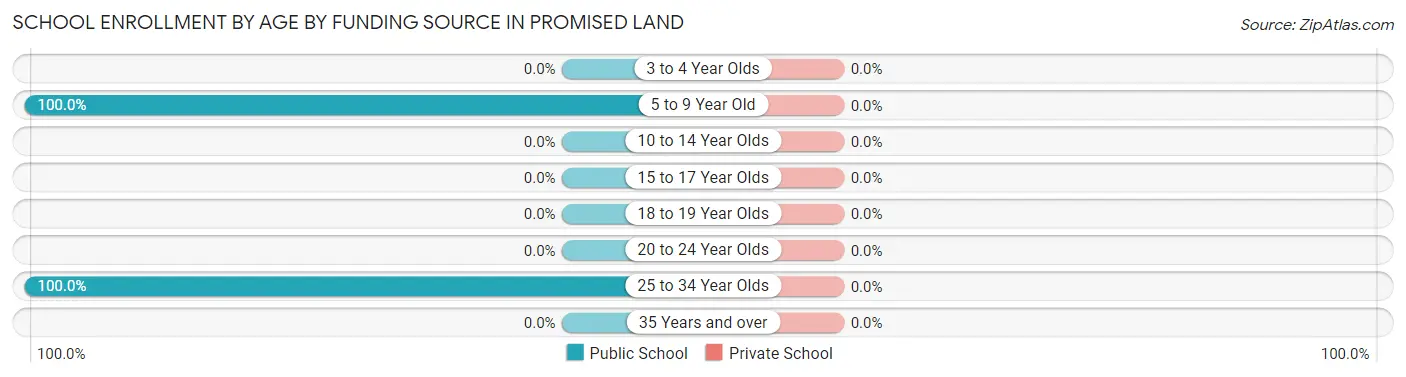
| Age Bracket | Public School | Private School |
| 3 to 4 Year Olds | 0 (0.0%) | 0 (0.0%) |
| 5 to 9 Year Old | 30 (100.0%) | 0 (0.0%) |
| 10 to 14 Year Olds | 0 (0.0%) | 0 (0.0%) |
| 15 to 17 Year Olds | 0 (0.0%) | 0 (0.0%) |
| 18 to 19 Year Olds | 0 (0.0%) | 0 (0.0%) |
| 20 to 24 Year Olds | 0 (0.0%) | 0 (0.0%) |
| 25 to 34 Year Olds | 9 (100.0%) | 0 (0.0%) |
| 35 Years and over | 0 (0.0%) | 0 (0.0%) |
| Total | 39 (100.0%) | 0 (0.0%) |
Educational Attainment by Field of Study in Promised Land
Arts & humanities (30 | 71.4%), and business (12 | 28.6%) are the most common fields of study among 42 individuals in Promised Land who have obtained a bachelor's degree or higher.
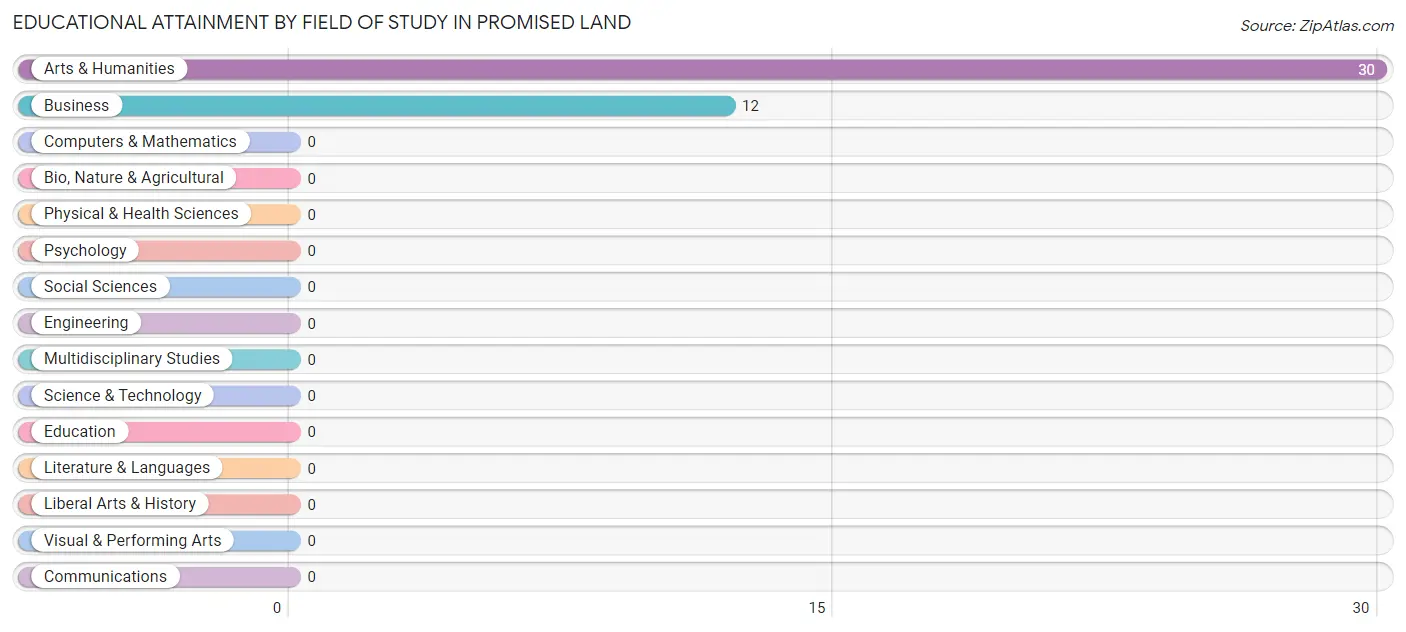
| Field of Study | # Graduates | % Graduates |
| Computers & Mathematics | 0 | 0.0% |
| Bio, Nature & Agricultural | 0 | 0.0% |
| Physical & Health Sciences | 0 | 0.0% |
| Psychology | 0 | 0.0% |
| Social Sciences | 0 | 0.0% |
| Engineering | 0 | 0.0% |
| Multidisciplinary Studies | 0 | 0.0% |
| Science & Technology | 0 | 0.0% |
| Business | 12 | 28.6% |
| Education | 0 | 0.0% |
| Literature & Languages | 0 | 0.0% |
| Liberal Arts & History | 0 | 0.0% |
| Visual & Performing Arts | 0 | 0.0% |
| Communications | 0 | 0.0% |
| Arts & Humanities | 30 | 71.4% |
| Total | 42 | 100.0% |
Transportation & Commute in Promised Land
Vehicle Availability by Sex in Promised Land
The most prevalent vehicle ownership categories in Promised Land are males with 4 vehicles (121, accounting for 93.1%) and females with 4 vehicles (30, making up 79.6%).
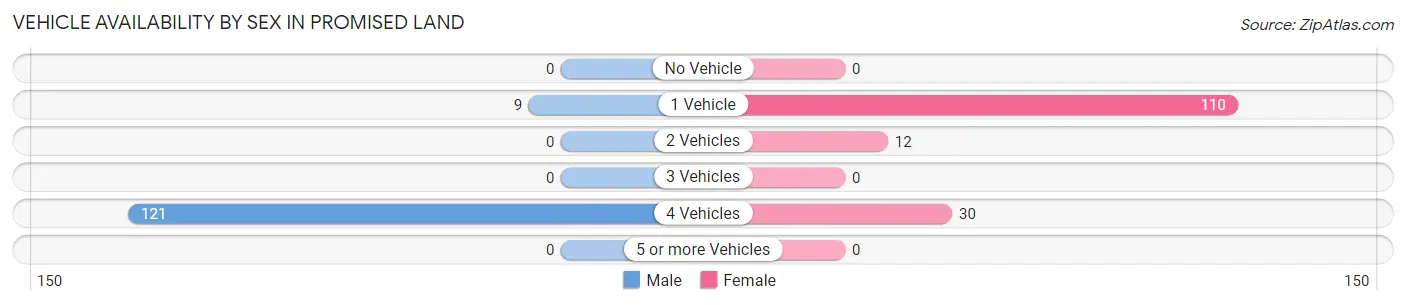
| Vehicles Available | Male | Female |
| No Vehicle | 0 (0.0%) | 0 (0.0%) |
| 1 Vehicle | 9 (6.9%) | 110 (72.4%) |
| 2 Vehicles | 0 (0.0%) | 12 (7.9%) |
| 3 Vehicles | 0 (0.0%) | 0 (0.0%) |
| 4 Vehicles | 121 (93.1%) | 30 (19.7%) |
| 5 or more Vehicles | 0 (0.0%) | 0 (0.0%) |
| Total | 130 (100.0%) | 152 (100.0%) |
Commute Time in Promised Land
The most frequently occuring commute durations in Promised Land are 15 to 19 minutes (120 commuters, 42.5%), 20 to 24 minutes (119 commuters, 42.2%), and 10 to 14 minutes (43 commuters, 15.2%).
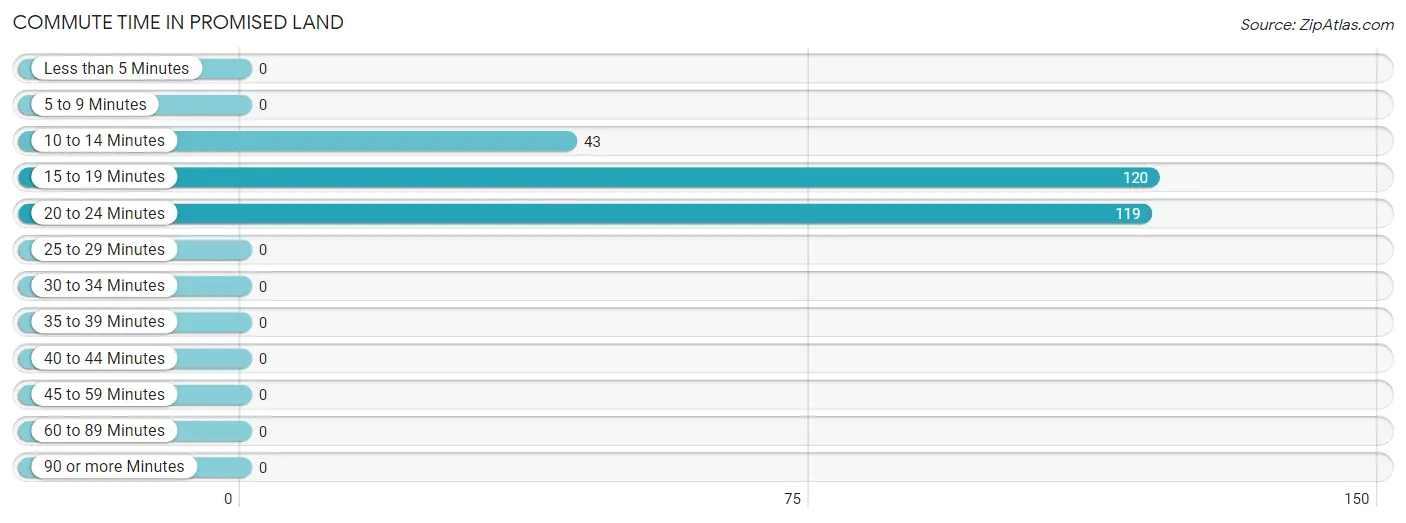
| Commute Time | # Commuters | % Commuters |
| Less than 5 Minutes | 0 | 0.0% |
| 5 to 9 Minutes | 0 | 0.0% |
| 10 to 14 Minutes | 43 | 15.2% |
| 15 to 19 Minutes | 120 | 42.5% |
| 20 to 24 Minutes | 119 | 42.2% |
| 25 to 29 Minutes | 0 | 0.0% |
| 30 to 34 Minutes | 0 | 0.0% |
| 35 to 39 Minutes | 0 | 0.0% |
| 40 to 44 Minutes | 0 | 0.0% |
| 45 to 59 Minutes | 0 | 0.0% |
| 60 to 89 Minutes | 0 | 0.0% |
| 90 or more Minutes | 0 | 0.0% |
Commute Time by Sex in Promised Land
The most common commute times in Promised Land are 15 to 19 minutes (90 commuters, 69.2%) for males and 20 to 24 minutes (110 commuters, 72.4%) for females.
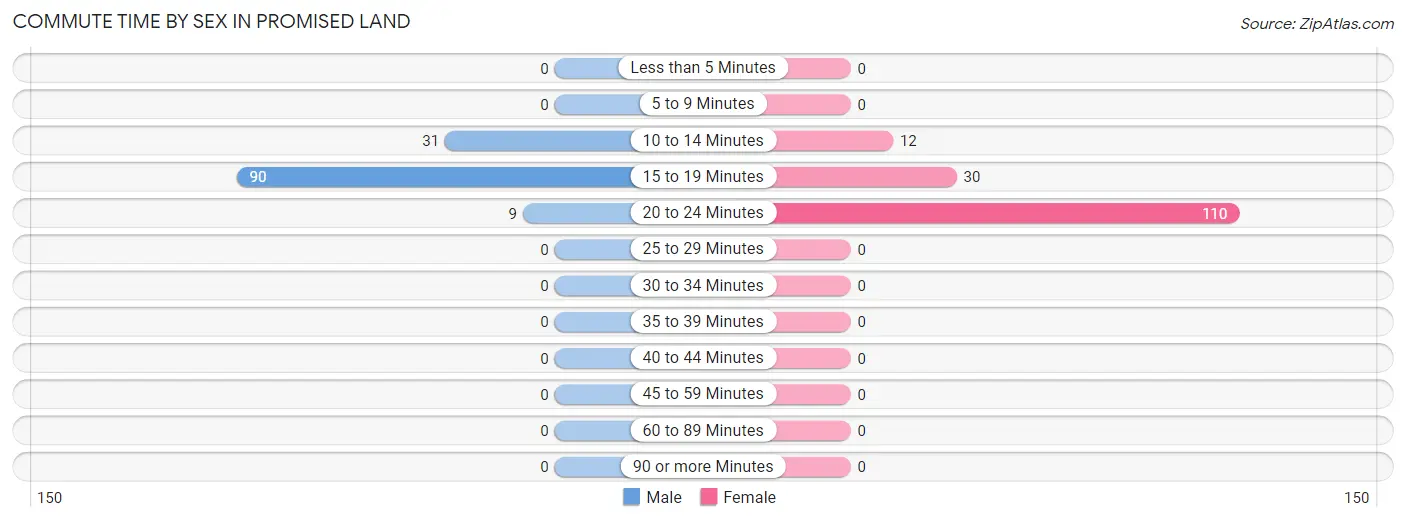
| Commute Time | Male | Female |
| Less than 5 Minutes | 0 (0.0%) | 0 (0.0%) |
| 5 to 9 Minutes | 0 (0.0%) | 0 (0.0%) |
| 10 to 14 Minutes | 31 (23.8%) | 12 (7.9%) |
| 15 to 19 Minutes | 90 (69.2%) | 30 (19.7%) |
| 20 to 24 Minutes | 9 (6.9%) | 110 (72.4%) |
| 25 to 29 Minutes | 0 (0.0%) | 0 (0.0%) |
| 30 to 34 Minutes | 0 (0.0%) | 0 (0.0%) |
| 35 to 39 Minutes | 0 (0.0%) | 0 (0.0%) |
| 40 to 44 Minutes | 0 (0.0%) | 0 (0.0%) |
| 45 to 59 Minutes | 0 (0.0%) | 0 (0.0%) |
| 60 to 89 Minutes | 0 (0.0%) | 0 (0.0%) |
| 90 or more Minutes | 0 (0.0%) | 0 (0.0%) |
Time of Departure to Work by Sex in Promised Land
The most frequent times of departure to work in Promised Land are 12:00 PM to 3:59 PM (55, 42.3%) for males and 7:00 AM to 7:29 AM (110, 72.4%) for females.
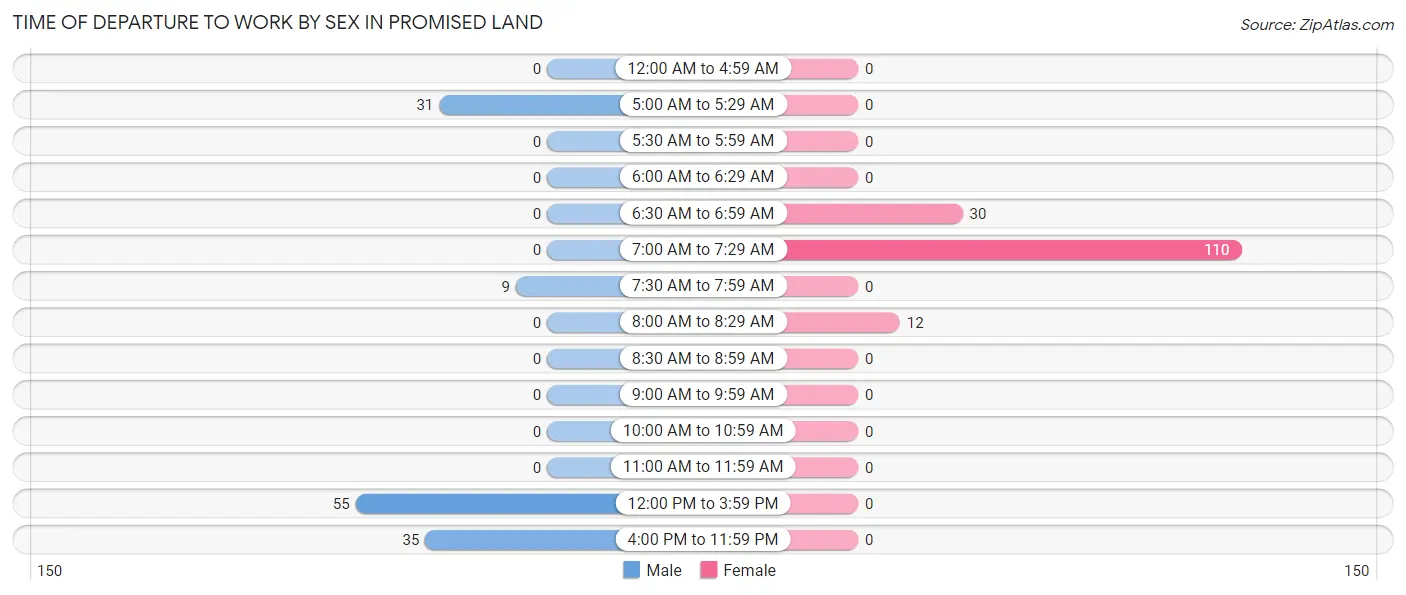
| Time of Departure | Male | Female |
| 12:00 AM to 4:59 AM | 0 (0.0%) | 0 (0.0%) |
| 5:00 AM to 5:29 AM | 31 (23.8%) | 0 (0.0%) |
| 5:30 AM to 5:59 AM | 0 (0.0%) | 0 (0.0%) |
| 6:00 AM to 6:29 AM | 0 (0.0%) | 0 (0.0%) |
| 6:30 AM to 6:59 AM | 0 (0.0%) | 30 (19.7%) |
| 7:00 AM to 7:29 AM | 0 (0.0%) | 110 (72.4%) |
| 7:30 AM to 7:59 AM | 9 (6.9%) | 0 (0.0%) |
| 8:00 AM to 8:29 AM | 0 (0.0%) | 12 (7.9%) |
| 8:30 AM to 8:59 AM | 0 (0.0%) | 0 (0.0%) |
| 9:00 AM to 9:59 AM | 0 (0.0%) | 0 (0.0%) |
| 10:00 AM to 10:59 AM | 0 (0.0%) | 0 (0.0%) |
| 11:00 AM to 11:59 AM | 0 (0.0%) | 0 (0.0%) |
| 12:00 PM to 3:59 PM | 55 (42.3%) | 0 (0.0%) |
| 4:00 PM to 11:59 PM | 35 (26.9%) | 0 (0.0%) |
| Total | 130 (100.0%) | 152 (100.0%) |
Housing Occupancy in Promised Land
Occupancy by Ownership in Promised Land
Of the total 110 dwellings in Promised Land, owner-occupied units account for 110 (100.0%), while renter-occupied units make up 0 (0.0%).
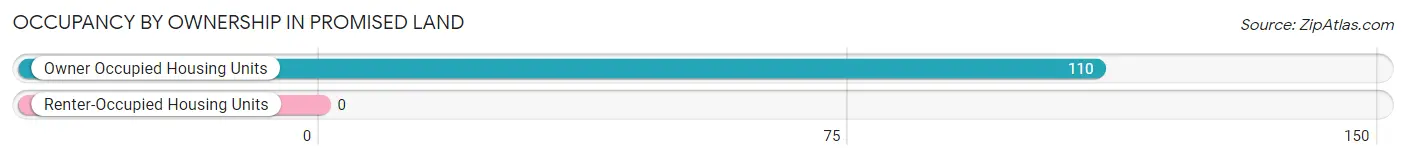
| Occupancy | # Housing Units | % Housing Units |
| Owner Occupied Housing Units | 110 | 100.0% |
| Renter-Occupied Housing Units | 0 | 0.0% |
| Total Occupied Housing Units | 110 | 100.0% |
Occupancy by Household Size in Promised Land
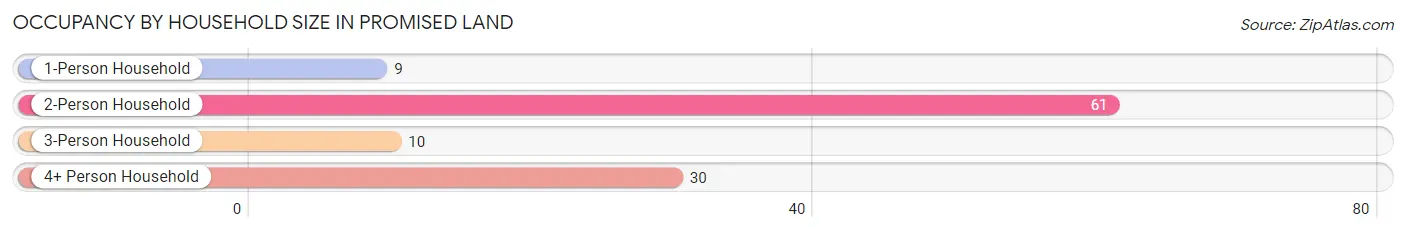
| Household Size | # Housing Units | % Housing Units |
| 1-Person Household | 9 | 8.2% |
| 2-Person Household | 61 | 55.4% |
| 3-Person Household | 10 | 9.1% |
| 4+ Person Household | 30 | 27.3% |
| Total Housing Units | 110 | 100.0% |
Occupancy by Ownership by Household Size in Promised Land
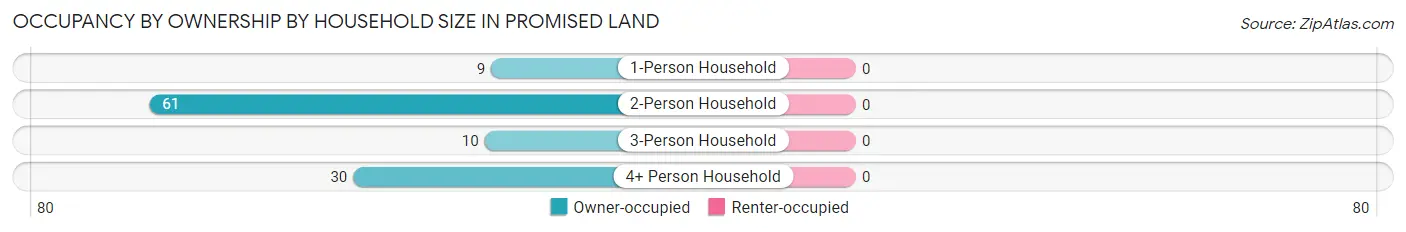
| Household Size | Owner-occupied | Renter-occupied |
| 1-Person Household | 9 (100.0%) | 0 (0.0%) |
| 2-Person Household | 61 (100.0%) | 0 (0.0%) |
| 3-Person Household | 10 (100.0%) | 0 (0.0%) |
| 4+ Person Household | 30 (100.0%) | 0 (0.0%) |
| Total Housing Units | 110 (100.0%) | 0 (0.0%) |
Occupancy by Educational Attainment in Promised Land
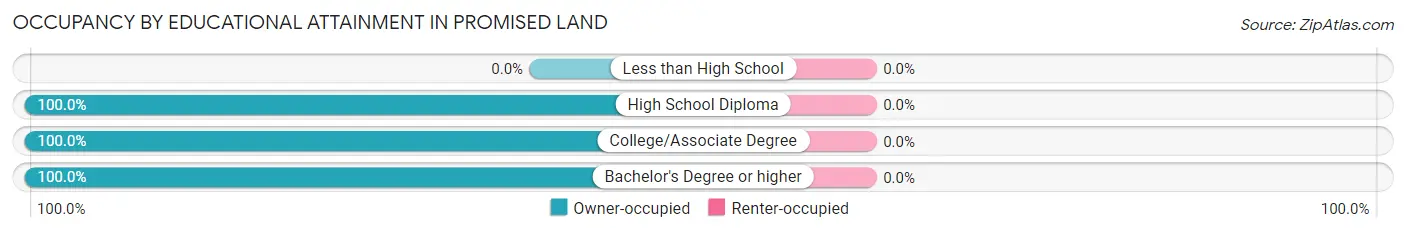
| Household Size | Owner-occupied | Renter-occupied |
| Less than High School | 0 (0.0%) | 0 (0.0%) |
| High School Diploma | 19 (100.0%) | 0 (0.0%) |
| College/Associate Degree | 61 (100.0%) | 0 (0.0%) |
| Bachelor's Degree or higher | 30 (100.0%) | 0 (0.0%) |
Occupancy by Age of Householder in Promised Land
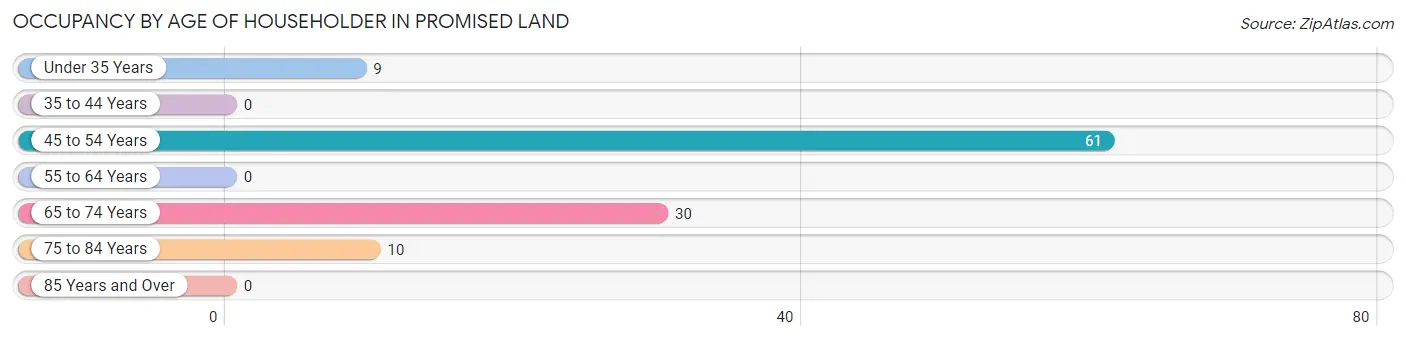
| Age Bracket | # Households | % Households |
| Under 35 Years | 9 | 8.2% |
| 35 to 44 Years | 0 | 0.0% |
| 45 to 54 Years | 61 | 55.4% |
| 55 to 64 Years | 0 | 0.0% |
| 65 to 74 Years | 30 | 27.3% |
| 75 to 84 Years | 10 | 9.1% |
| 85 Years and Over | 0 | 0.0% |
| Total | 110 | 100.0% |
Housing Finances in Promised Land
Median Income by Occupancy in Promised Land
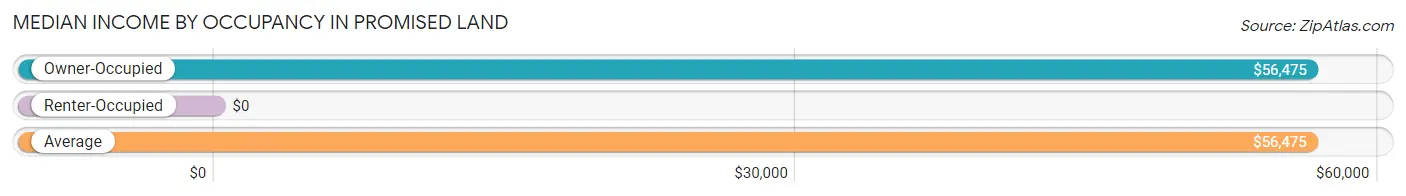
| Occupancy Type | # Households | Median Income |
| Owner-Occupied | 110 (100.0%) | $56,475 |
| Renter-Occupied | 0 (0.0%) | $0 |
| Average | 110 (100.0%) | $56,475 |
Occupancy by Householder Income Bracket in Promised Land
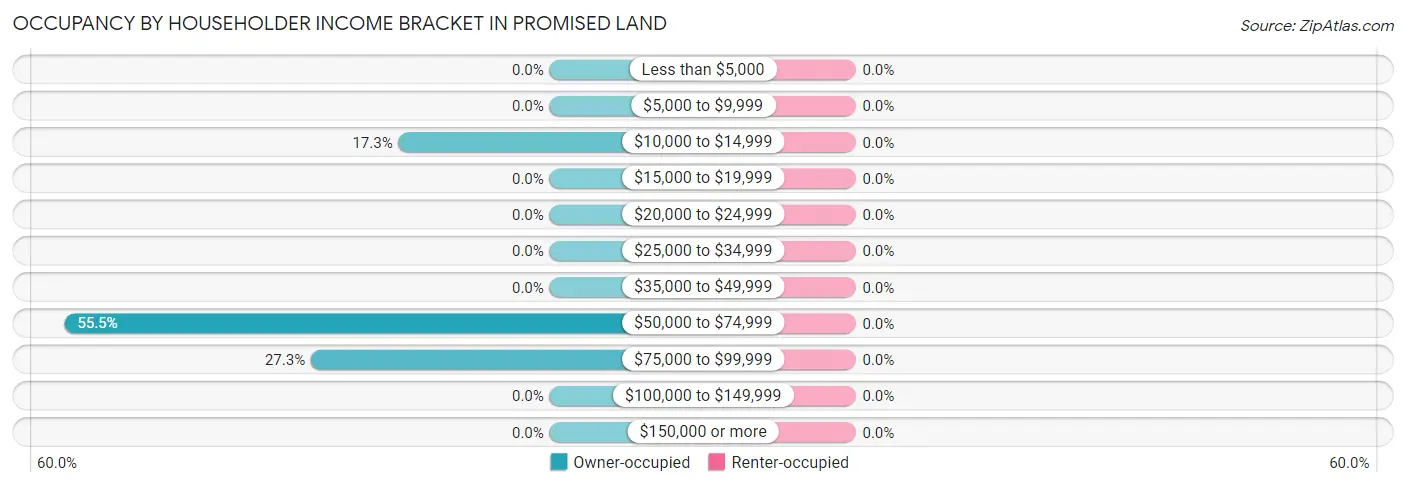
| Income Bracket | Owner-occupied | Renter-occupied |
| Less than $5,000 | 0 (0.0%) | 0 (0.0%) |
| $5,000 to $9,999 | 0 (0.0%) | 0 (0.0%) |
| $10,000 to $14,999 | 19 (17.3%) | 0 (0.0%) |
| $15,000 to $19,999 | 0 (0.0%) | 0 (0.0%) |
| $20,000 to $24,999 | 0 (0.0%) | 0 (0.0%) |
| $25,000 to $34,999 | 0 (0.0%) | 0 (0.0%) |
| $35,000 to $49,999 | 0 (0.0%) | 0 (0.0%) |
| $50,000 to $74,999 | 61 (55.4%) | 0 (0.0%) |
| $75,000 to $99,999 | 30 (27.3%) | 0 (0.0%) |
| $100,000 to $149,999 | 0 (0.0%) | 0 (0.0%) |
| $150,000 or more | 0 (0.0%) | 0 (0.0%) |
| Total | 110 (100.0%) | 0 (0.0%) |
Monthly Housing Cost Tiers in Promised Land
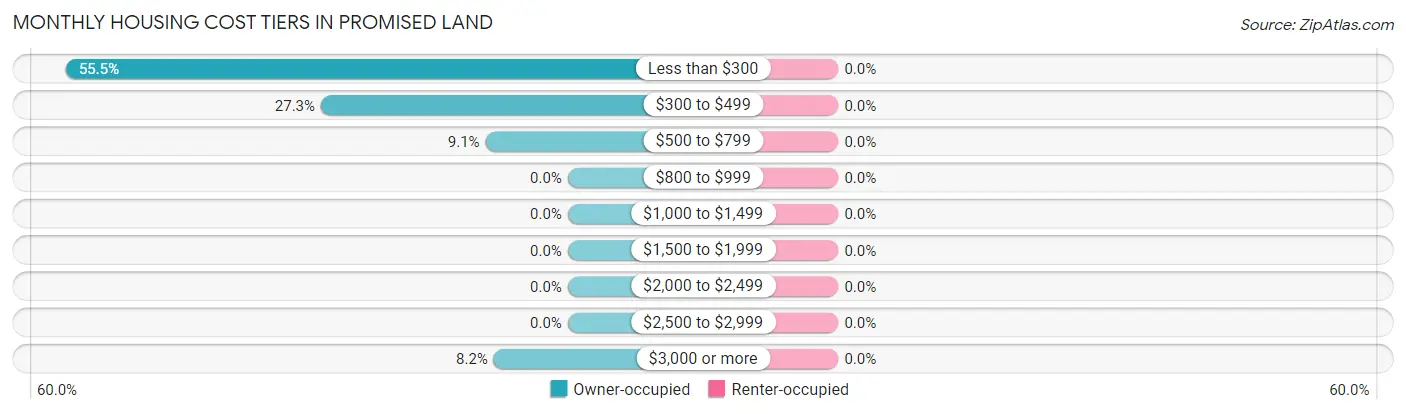
| Monthly Cost | Owner-occupied | Renter-occupied |
| Less than $300 | 61 (55.4%) | 0 (0.0%) |
| $300 to $499 | 30 (27.3%) | 0 (0.0%) |
| $500 to $799 | 10 (9.1%) | 0 (0.0%) |
| $800 to $999 | 0 (0.0%) | 0 (0.0%) |
| $1,000 to $1,499 | 0 (0.0%) | 0 (0.0%) |
| $1,500 to $1,999 | 0 (0.0%) | 0 (0.0%) |
| $2,000 to $2,499 | 0 (0.0%) | 0 (0.0%) |
| $2,500 to $2,999 | 0 (0.0%) | 0 (0.0%) |
| $3,000 or more | 9 (8.2%) | 0 (0.0%) |
| Total | 110 (100.0%) | 0 (0.0%) |
Physical Housing Characteristics in Promised Land
Housing Structures in Promised Land
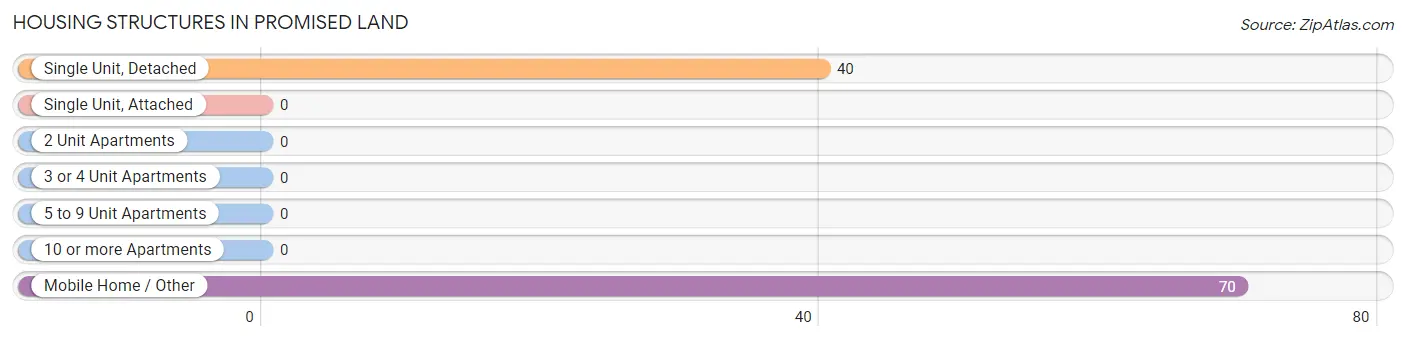
| Structure Type | # Housing Units | % Housing Units |
| Single Unit, Detached | 40 | 36.4% |
| Single Unit, Attached | 0 | 0.0% |
| 2 Unit Apartments | 0 | 0.0% |
| 3 or 4 Unit Apartments | 0 | 0.0% |
| 5 to 9 Unit Apartments | 0 | 0.0% |
| 10 or more Apartments | 0 | 0.0% |
| Mobile Home / Other | 70 | 63.6% |
| Total | 110 | 100.0% |
Housing Structures by Occupancy in Promised Land
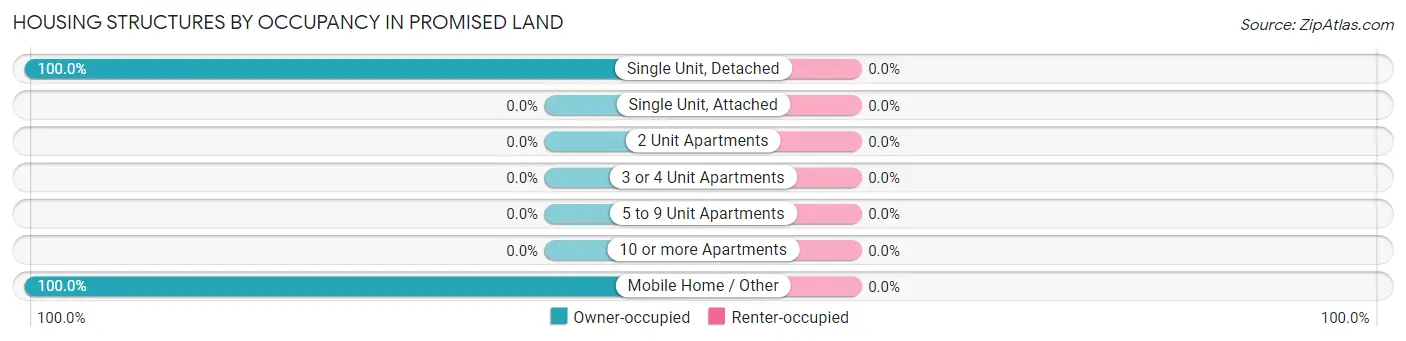
| Structure Type | Owner-occupied | Renter-occupied |
| Single Unit, Detached | 40 (100.0%) | 0 (0.0%) |
| Single Unit, Attached | 0 (0.0%) | 0 (0.0%) |
| 2 Unit Apartments | 0 (0.0%) | 0 (0.0%) |
| 3 or 4 Unit Apartments | 0 (0.0%) | 0 (0.0%) |
| 5 to 9 Unit Apartments | 0 (0.0%) | 0 (0.0%) |
| 10 or more Apartments | 0 (0.0%) | 0 (0.0%) |
| Mobile Home / Other | 70 (100.0%) | 0 (0.0%) |
| Total | 110 (100.0%) | 0 (0.0%) |
Housing Structures by Number of Rooms in Promised Land
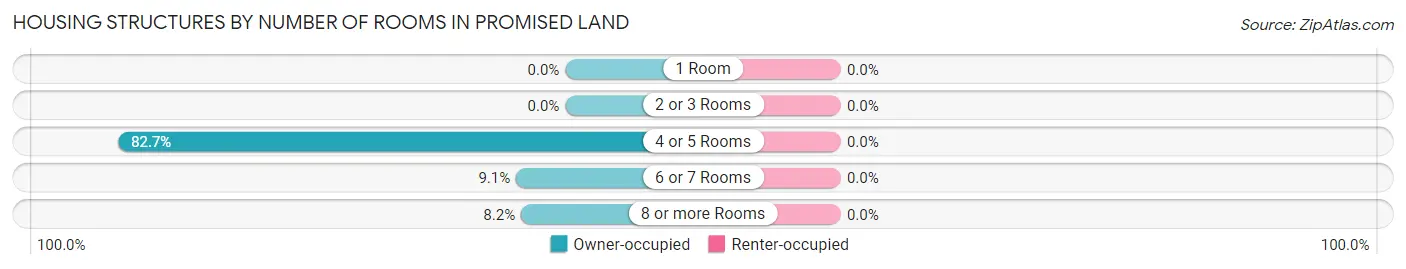
| Number of Rooms | Owner-occupied | Renter-occupied |
| 1 Room | 0 (0.0%) | 0 (0.0%) |
| 2 or 3 Rooms | 0 (0.0%) | 0 (0.0%) |
| 4 or 5 Rooms | 91 (82.7%) | 0 (0.0%) |
| 6 or 7 Rooms | 10 (9.1%) | 0 (0.0%) |
| 8 or more Rooms | 9 (8.2%) | 0 (0.0%) |
| Total | 110 (100.0%) | 0 (0.0%) |
Housing Structure by Heating Type in Promised Land
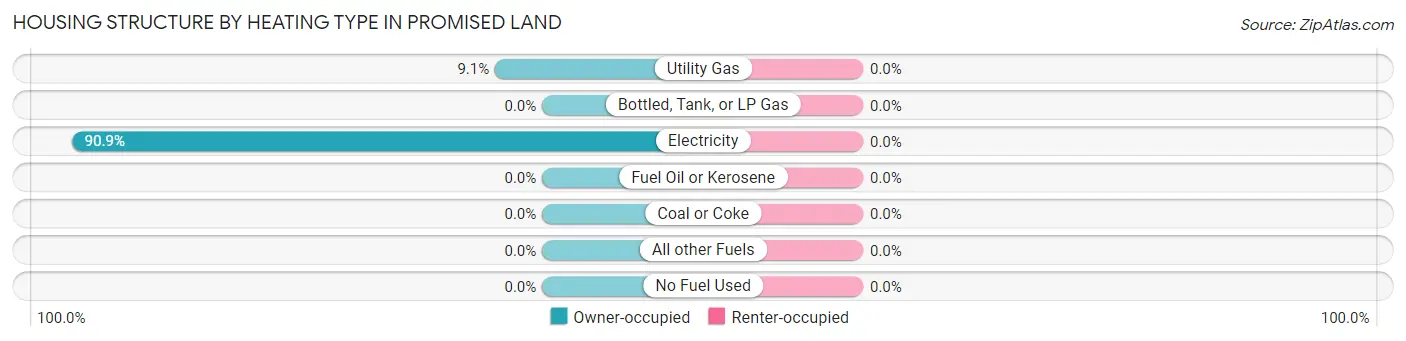
| Heating Type | Owner-occupied | Renter-occupied |
| Utility Gas | 10 (9.1%) | 0 (0.0%) |
| Bottled, Tank, or LP Gas | 0 (0.0%) | 0 (0.0%) |
| Electricity | 100 (90.9%) | 0 (0.0%) |
| Fuel Oil or Kerosene | 0 (0.0%) | 0 (0.0%) |
| Coal or Coke | 0 (0.0%) | 0 (0.0%) |
| All other Fuels | 0 (0.0%) | 0 (0.0%) |
| No Fuel Used | 0 (0.0%) | 0 (0.0%) |
| Total | 110 (100.0%) | 0 (0.0%) |
Household Vehicle Usage in Promised Land
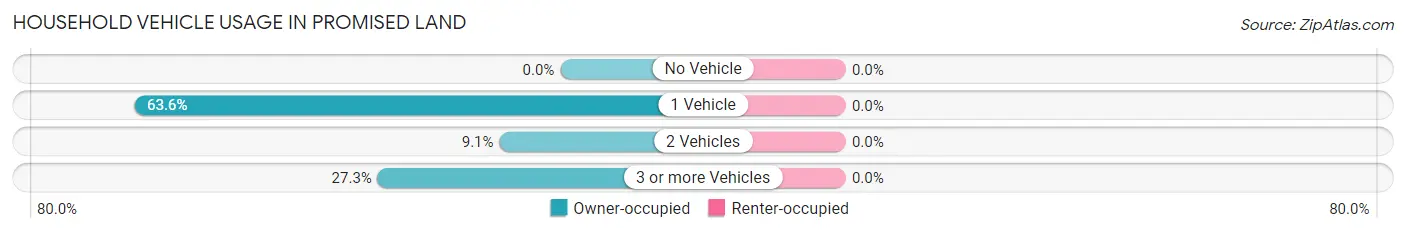
| Vehicles per Household | Owner-occupied | Renter-occupied |
| No Vehicle | 0 (0.0%) | 0 (0.0%) |
| 1 Vehicle | 70 (63.6%) | 0 (0.0%) |
| 2 Vehicles | 10 (9.1%) | 0 (0.0%) |
| 3 or more Vehicles | 30 (27.3%) | 0 (0.0%) |
| Total | 110 (100.0%) | 0 (0.0%) |
Real Estate & Mortgages in Promised Land
Real Estate and Mortgage Overview in Promised Land
| Characteristic | Without Mortgage | With Mortgage |
| Housing Units | 110 | 0 |
| Median Property Value | - | - |
| Median Household Income | $56,475 | $0 |
| Monthly Housing Costs | - | - |
| Real Estate Taxes | $199 | $0 |
Property Value by Mortgage Status in Promised Land
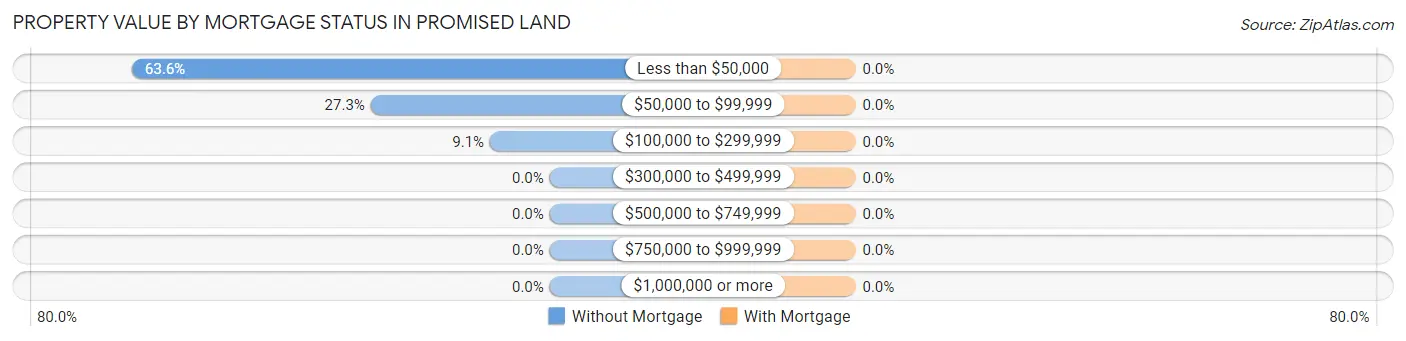
| Property Value | Without Mortgage | With Mortgage |
| Less than $50,000 | 70 (63.6%) | 0 (0.0%) |
| $50,000 to $99,999 | 30 (27.3%) | 0 (0.0%) |
| $100,000 to $299,999 | 10 (9.1%) | 0 (0.0%) |
| $300,000 to $499,999 | 0 (0.0%) | 0 (0.0%) |
| $500,000 to $749,999 | 0 (0.0%) | 0 (0.0%) |
| $750,000 to $999,999 | 0 (0.0%) | 0 (0.0%) |
| $1,000,000 or more | 0 (0.0%) | 0 (0.0%) |
| Total | 110 (100.0%) | 0 (0.0%) |
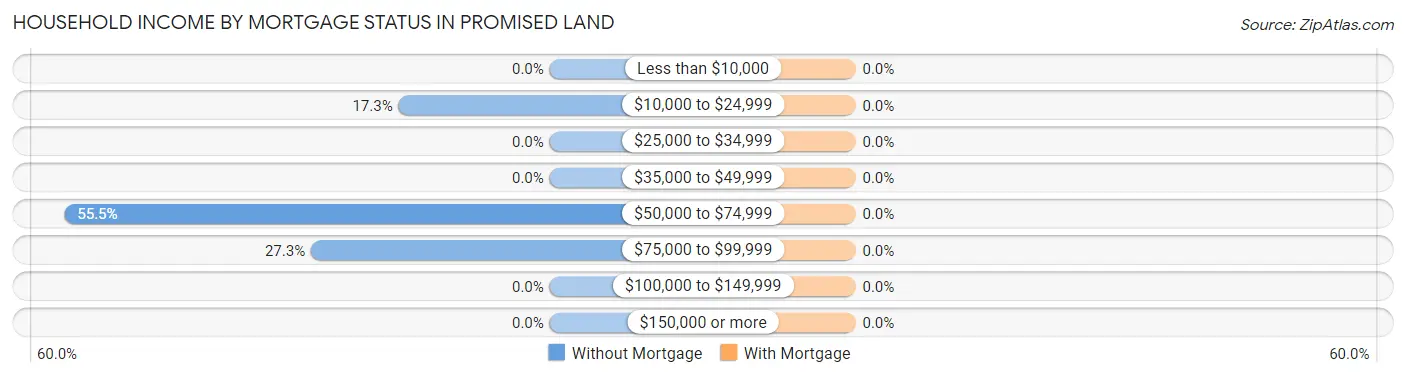
Household Income by Mortgage Status in Promised Land
| Household Income | Without Mortgage | With Mortgage |
| Less than $10,000 | 0 (0.0%) | 0 (0.0%) |
| $10,000 to $24,999 | 19 (17.3%) | 0 (0.0%) |
| $25,000 to $34,999 | 0 (0.0%) | 0 (0.0%) |
| $35,000 to $49,999 | 0 (0.0%) | 0 (0.0%) |
| $50,000 to $74,999 | 61 (55.4%) | 0 (0.0%) |
| $75,000 to $99,999 | 30 (27.3%) | 0 (0.0%) |
| $100,000 to $149,999 | 0 (0.0%) | 0 (0.0%) |
| $150,000 or more | 0 (0.0%) | 0 (0.0%) |
| Total | 110 (100.0%) | 0 (0.0%) |
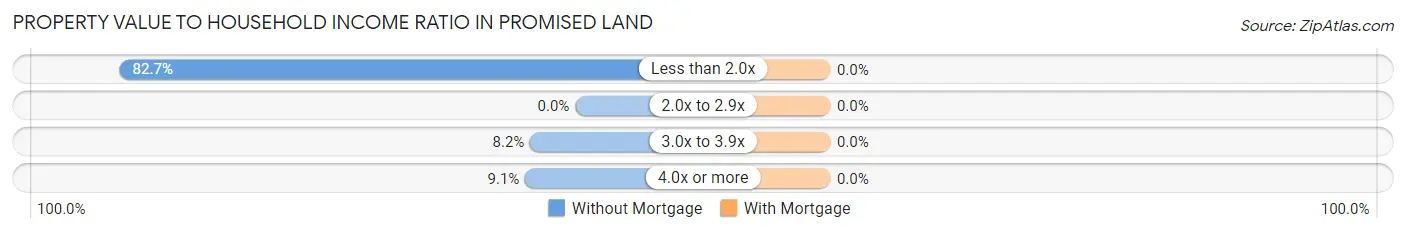
Property Value to Household Income Ratio in Promised Land
| Value-to-Income Ratio | Without Mortgage | With Mortgage |
| Less than 2.0x | 91 (82.7%) | 0 (0.0%) |
| 2.0x to 2.9x | 0 (0.0%) | 0 (0.0%) |
| 3.0x to 3.9x | 9 (8.2%) | 0 (0.0%) |
| 4.0x or more | 10 (9.1%) | 0 (0.0%) |
| Total | 110 (100.0%) | 0 (0.0%) |
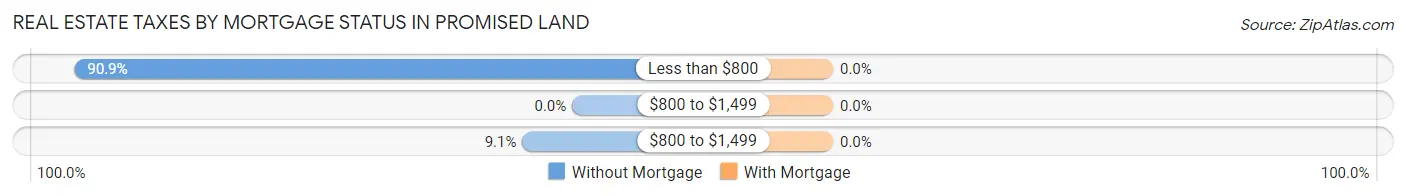
Real Estate Taxes by Mortgage Status in Promised Land
| Property Taxes | Without Mortgage | With Mortgage |
| Less than $800 | 100 (90.9%) | 0 (0.0%) |
| $800 to $1,499 | 0 (0.0%) | 0 (0.0%) |
| $800 to $1,499 | 10 (9.1%) | 0 (0.0%) |
| Total | 110 (100.0%) | 0 (0.0%) |
Health & Disability in Promised Land
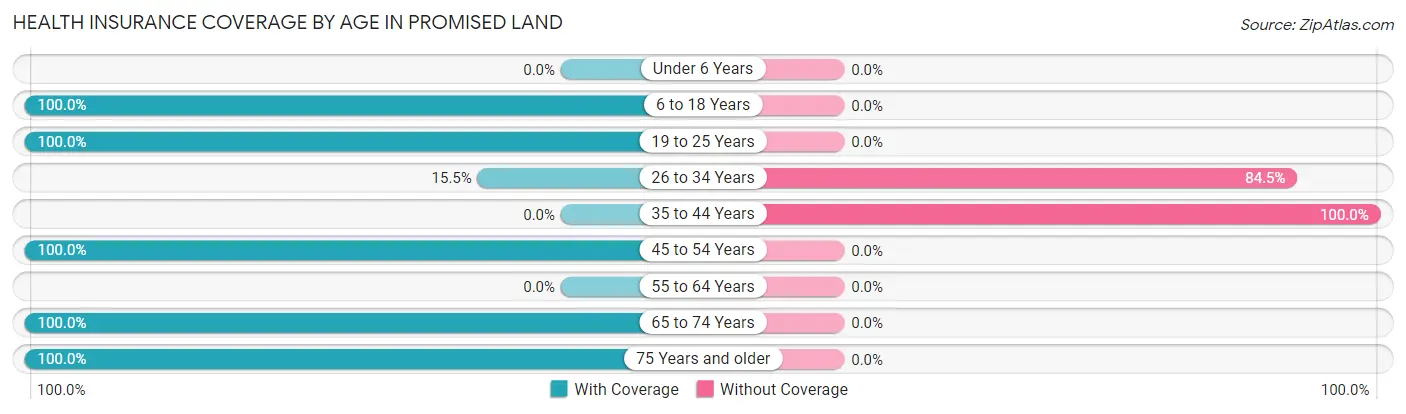
Health Insurance Coverage by Age in Promised Land
| Age Bracket | With Coverage | Without Coverage |
| Under 6 Years | 0 (0.0%) | 0 (0.0%) |
| 6 to 18 Years | 30 (100.0%) | 0 (0.0%) |
| 19 to 25 Years | 35 (100.0%) | 0 (0.0%) |
| 26 to 34 Years | 9 (15.5%) | 49 (84.5%) |
| 35 to 44 Years | 0 (0.0%) | 55 (100.0%) |
| 45 to 54 Years | 73 (100.0%) | 0 (0.0%) |
| 55 to 64 Years | 0 (0.0%) | 0 (0.0%) |
| 65 to 74 Years | 73 (100.0%) | 0 (0.0%) |
| 75 Years and older | 10 (100.0%) | 0 (0.0%) |
| Total | 230 (68.9%) | 104 (31.1%) |
Health Insurance Coverage by Citizenship Status in Promised Land
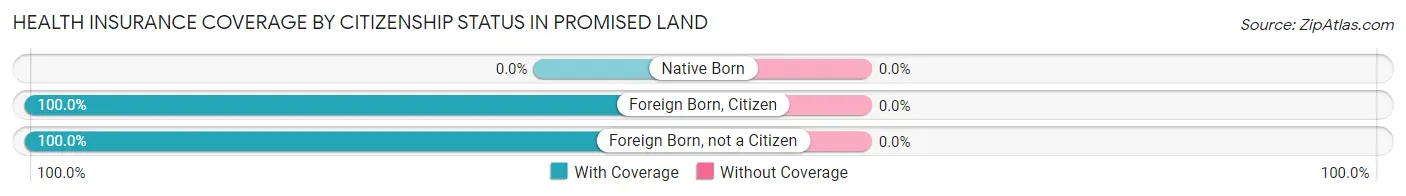
| Citizenship Status | With Coverage | Without Coverage |
| Native Born | 0 (0.0%) | 0 (0.0%) |
| Foreign Born, Citizen | 30 (100.0%) | 0 (0.0%) |
| Foreign Born, not a Citizen | 35 (100.0%) | 0 (0.0%) |
Health Insurance Coverage by Household Income in Promised Land
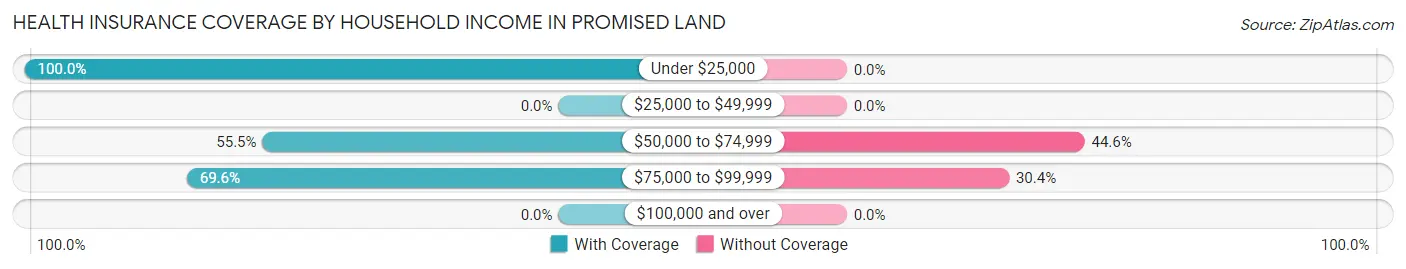
| Household Income | With Coverage | Without Coverage |
| Under $25,000 | 43 (100.0%) | 0 (0.0%) |
| $25,000 to $49,999 | 0 (0.0%) | 0 (0.0%) |
| $50,000 to $74,999 | 61 (55.4%) | 49 (44.6%) |
| $75,000 to $99,999 | 126 (69.6%) | 55 (30.4%) |
| $100,000 and over | 0 (0.0%) | 0 (0.0%) |
Public vs Private Health Insurance Coverage by Age in Promised Land
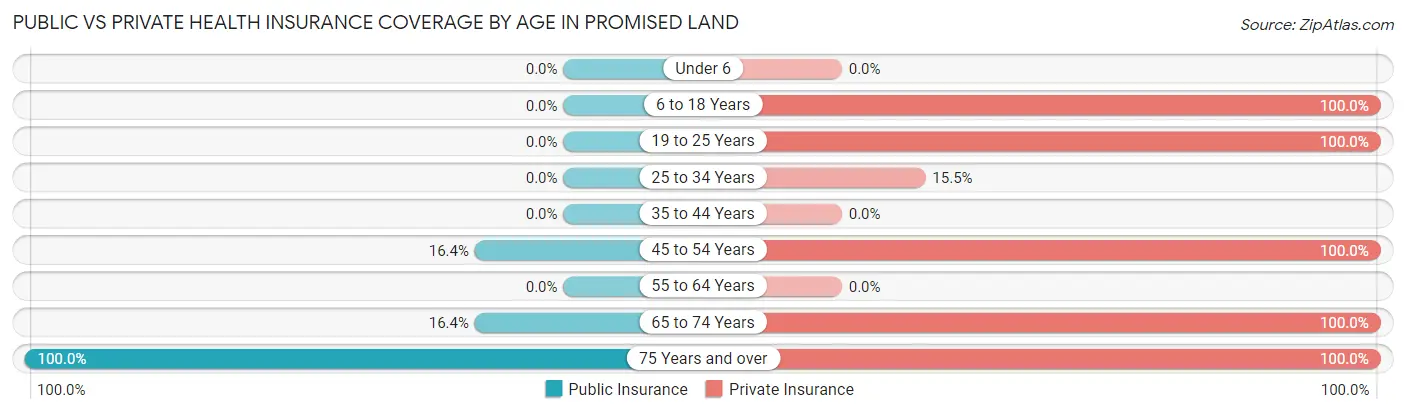
| Age Bracket | Public Insurance | Private Insurance |
| Under 6 | 0 (0.0%) | 0 (0.0%) |
| 6 to 18 Years | 0 (0.0%) | 30 (100.0%) |
| 19 to 25 Years | 0 (0.0%) | 35 (100.0%) |
| 25 to 34 Years | 0 (0.0%) | 9 (15.5%) |
| 35 to 44 Years | 0 (0.0%) | 0 (0.0%) |
| 45 to 54 Years | 12 (16.4%) | 73 (100.0%) |
| 55 to 64 Years | 0 (0.0%) | 0 (0.0%) |
| 65 to 74 Years | 12 (16.4%) | 73 (100.0%) |
| 75 Years and over | 10 (100.0%) | 10 (100.0%) |
| Total | 34 (10.2%) | 230 (68.9%) |
Disability Status by Sex by Age in Promised Land
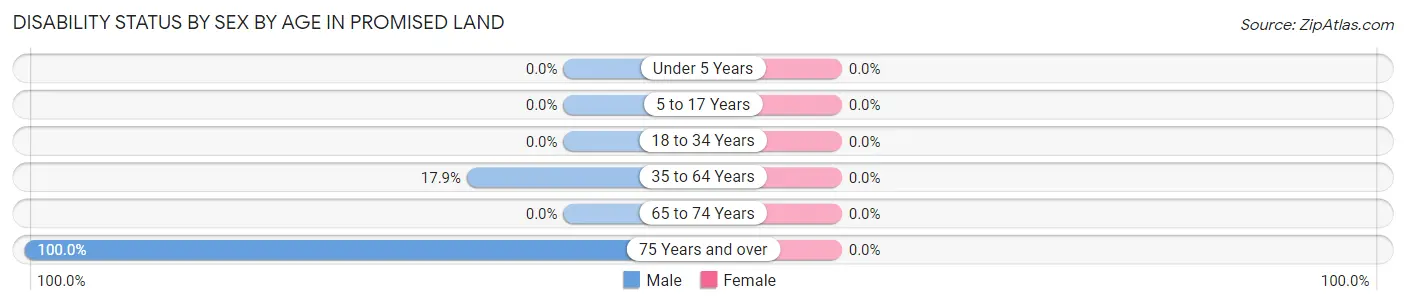
| Age Bracket | Male | Female |
| Under 5 Years | 0 (0.0%) | 0 (0.0%) |
| 5 to 17 Years | 0 (0.0%) | 0 (0.0%) |
| 18 to 34 Years | 0 (0.0%) | 0 (0.0%) |
| 35 to 64 Years | 12 (17.9%) | 0 (0.0%) |
| 65 to 74 Years | 0 (0.0%) | 0 (0.0%) |
| 75 Years and over | 10 (100.0%) | 0 (0.0%) |
Disability Class by Sex by Age in Promised Land
Disability Class: Hearing Difficulty
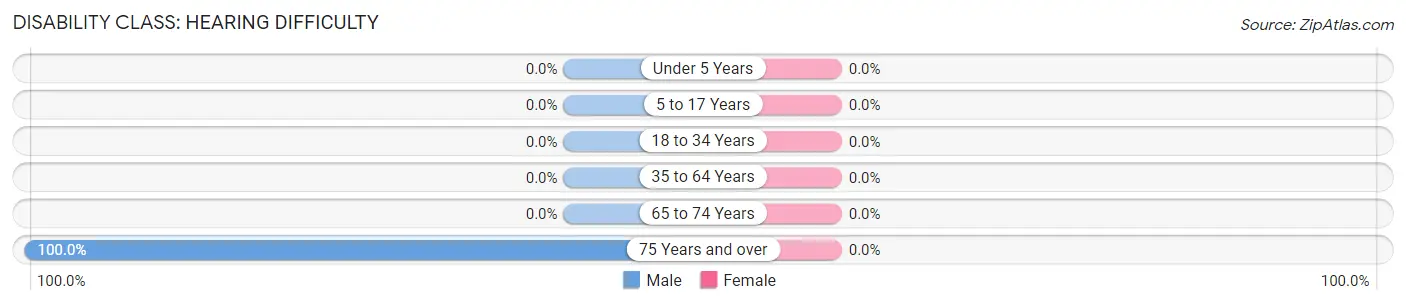
| Age Bracket | Male | Female |
| Under 5 Years | 0 (0.0%) | 0 (0.0%) |
| 5 to 17 Years | 0 (0.0%) | 0 (0.0%) |
| 18 to 34 Years | 0 (0.0%) | 0 (0.0%) |
| 35 to 64 Years | 0 (0.0%) | 0 (0.0%) |
| 65 to 74 Years | 0 (0.0%) | 0 (0.0%) |
| 75 Years and over | 10 (100.0%) | 0 (0.0%) |
Disability Class: Vision Difficulty
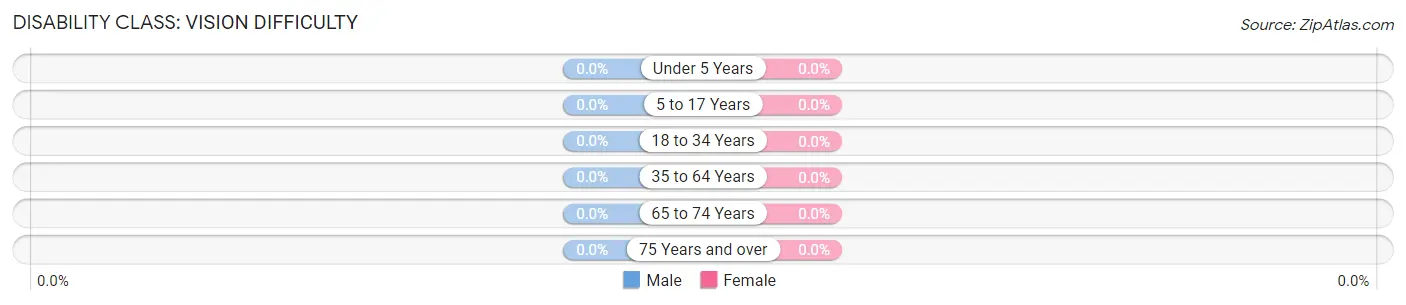
| Age Bracket | Male | Female |
| Under 5 Years | 0 (0.0%) | 0 (0.0%) |
| 5 to 17 Years | 0 (0.0%) | 0 (0.0%) |
| 18 to 34 Years | 0 (0.0%) | 0 (0.0%) |
| 35 to 64 Years | 0 (0.0%) | 0 (0.0%) |
| 65 to 74 Years | 0 (0.0%) | 0 (0.0%) |
| 75 Years and over | 0 (0.0%) | 0 (0.0%) |
Disability Class: Cognitive Difficulty
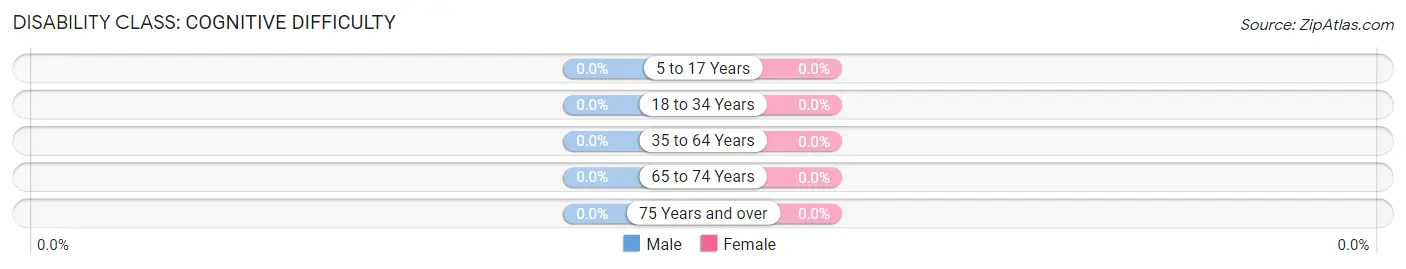
| Age Bracket | Male | Female |
| 5 to 17 Years | 0 (0.0%) | 0 (0.0%) |
| 18 to 34 Years | 0 (0.0%) | 0 (0.0%) |
| 35 to 64 Years | 0 (0.0%) | 0 (0.0%) |
| 65 to 74 Years | 0 (0.0%) | 0 (0.0%) |
| 75 Years and over | 0 (0.0%) | 0 (0.0%) |
Disability Class: Ambulatory Difficulty
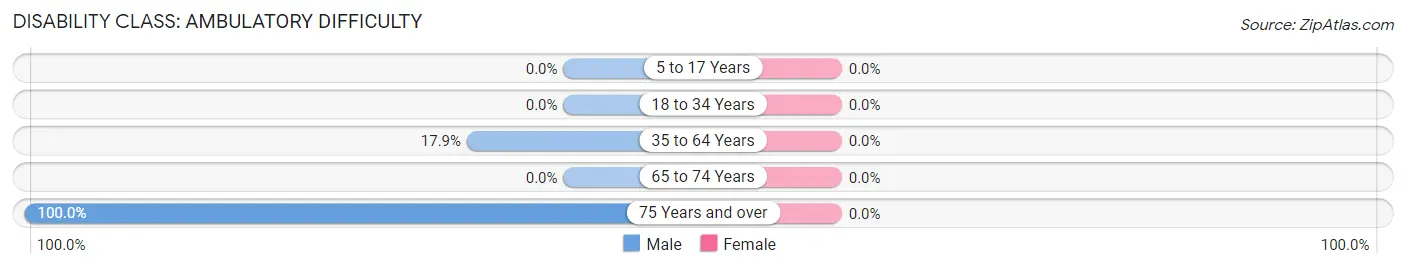
| Age Bracket | Male | Female |
| 5 to 17 Years | 0 (0.0%) | 0 (0.0%) |
| 18 to 34 Years | 0 (0.0%) | 0 (0.0%) |
| 35 to 64 Years | 12 (17.9%) | 0 (0.0%) |
| 65 to 74 Years | 0 (0.0%) | 0 (0.0%) |
| 75 Years and over | 10 (100.0%) | 0 (0.0%) |
Disability Class: Self-Care Difficulty
| Age Bracket | Male | Female |
| 5 to 17 Years | 0 (0.0%) | 0 (0.0%) |
| 18 to 34 Years | 0 (0.0%) | 0 (0.0%) |
| 35 to 64 Years | 0 (0.0%) | 0 (0.0%) |
| 65 to 74 Years | 0 (0.0%) | 0 (0.0%) |
| 75 Years and over | 0 (0.0%) | 0 (0.0%) |
Technology Access in Promised Land
Computing Device Access in Promised Land
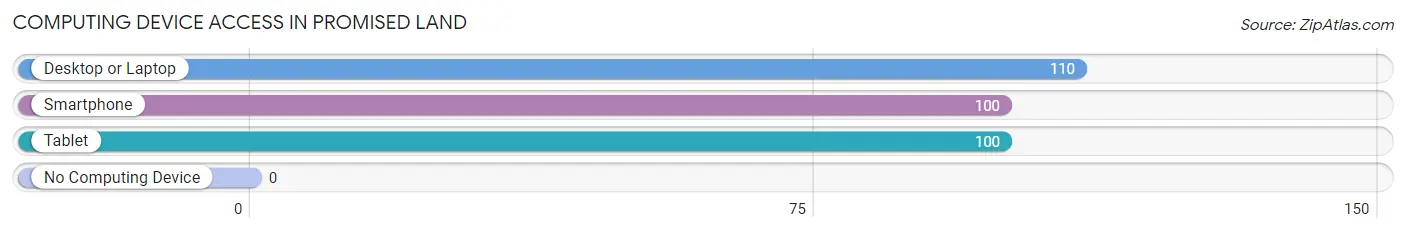
| Device Type | # Households | % Households |
| Desktop or Laptop | 110 | 100.0% |
| Smartphone | 100 | 90.9% |
| Tablet | 100 | 90.9% |
| No Computing Device | 0 | 0.0% |
| Total | 110 | 100.0% |
Internet Access in Promised Land
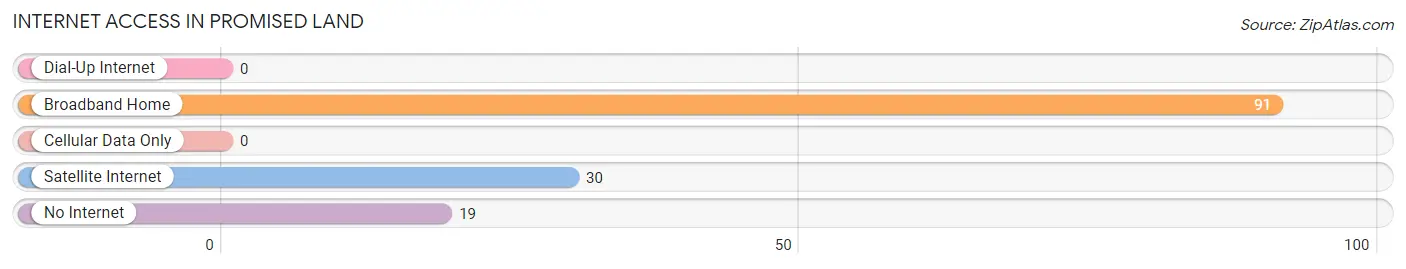
| Internet Type | # Households | % Households |
| Dial-Up Internet | 0 | 0.0% |
| Broadband Home | 91 | 82.7% |
| Cellular Data Only | 0 | 0.0% |
| Satellite Internet | 30 | 27.3% |
| No Internet | 19 | 17.3% |
| Total | 110 | 100.0% |
Promised Land Summary
Promised Land, South Carolina is a small town located in the Lowcountry region of the state. It is situated in the northern part of Beaufort County, about 20 miles from the city of Beaufort. The town has a population of just over 1,000 people and is known for its rural charm and close-knit community.
History
Promised Land was founded in the late 1700s by a group of settlers from the British Isles. The town was originally called “New London” and was part of the larger settlement of St. Helena Island. The town was renamed “Promised Land” in 1820, when the settlers received a land grant from the state of South Carolina.
The town was a thriving agricultural community for many years, with cotton, rice, and indigo being the main crops. The town also had a thriving timber industry, with the local sawmill providing lumber for the area.
In the late 1800s, the town began to decline as the agricultural industry shifted away from the area. The town was further impacted by the Great Depression and World War II. In the 1950s, the town began to experience a resurgence as the local economy shifted to tourism and recreation.
Geography
Promised Land is located in the northern part of Beaufort County, about 20 miles from the city of Beaufort. The town is situated on the banks of the Coosaw River, which flows into the nearby Port Royal Sound. The town is surrounded by marshlands and is home to a variety of wildlife, including deer, alligators, and a variety of birds.
The town is located in a humid subtropical climate zone, with hot, humid summers and mild winters. The average annual temperature is around 70 degrees Fahrenheit, with the average high in the summer months reaching around 90 degrees.
Economy
The economy of Promised Land is largely based on tourism and recreation. The town is home to several marinas, which attract visitors from all over the region. The town also has a number of restaurants, shops, and other businesses that cater to tourists.
The town is also home to a number of small businesses, including a local grocery store, a hardware store, and a few other small shops. The town also has a few small manufacturing businesses, including a boat-building company and a furniture-making company.
Demographics
As of the 2010 census, the population of Promised Land was 1,072. The town is predominantly white, with the majority of the population being of European descent. The town also has a small African American population, as well as a small Hispanic population.
The median household income in Promised Land is $41,250, which is slightly lower than the state average. The town has a poverty rate of 16.3%, which is slightly higher than the state average. The town also has a higher-than-average unemployment rate of 8.2%.
Conclusion
Promised Land, South Carolina is a small town located in the Lowcountry region of the state. It is known for its rural charm and close-knit community. The town has a population of just over 1,000 people and is largely based on tourism and recreation. The town is predominantly white, with the majority of the population being of European descent. The town also has a small African American population, as well as a small Hispanic population. The median household income in Promised Land is $41,250, which is slightly lower than the state average. The town has a poverty rate of 16.3%, which is slightly higher than the state average. The town also has a higher-than-average unemployment rate of 8.2%.
Common Questions
What is Per Capita Income in Promised Land?
Per Capita income in Promised Land is $19,770.
What is the Median Family Income in Promised Land?
Median Family Income in Promised Land is $56,660.
What is the Median Household income in Promised Land?
Median Household Income in Promised Land is $56,475.
What is Income or Wage Gap in Promised Land?
Income or Wage Gap in Promised Land is 6.4%.
Women in Promised Land earn 93.6 cents for every dollar earned by a man.
What is Inequality or Gini Index in Promised Land?
Inequality or Gini Index in Promised Land is 0.20.
What is the Total Population of Promised Land?
Total Population of Promised Land is 334.
What is the Total Male Population of Promised Land?
Total Male Population of Promised Land is 182.
What is the Total Female Population of Promised Land?
Total Female Population of Promised Land is 152.
What is the Ratio of Males per 100 Females in Promised Land?
There are 119.74 Males per 100 Females in Promised Land.
What is the Ratio of Females per 100 Males in Promised Land?
There are 83.52 Females per 100 Males in Promised Land.
What is the Median Population Age in Promised Land?
Median Population Age in Promised Land is 40.8 Years.
What is the Average Family Size in Promised Land
Average Family Size in Promised Land is 3.2 People.
What is the Average Household Size in Promised Land
Average Household Size in Promised Land is 3.0 People.
How Large is the Labor Force in Promised Land?
There are 282 People in the Labor Forcein in Promised Land.
What is the Percentage of People in the Labor Force in Promised Land?
92.8% of People are in the Labor Force in Promised Land.