Zip Codes with the Highest Percentage of Population Employed in Food Preparation & Serving in Beaufort, SC
RELATED REPORTS & OPTIONS
Food Preparation & Serving
Beaufort
Compare Zip Codes
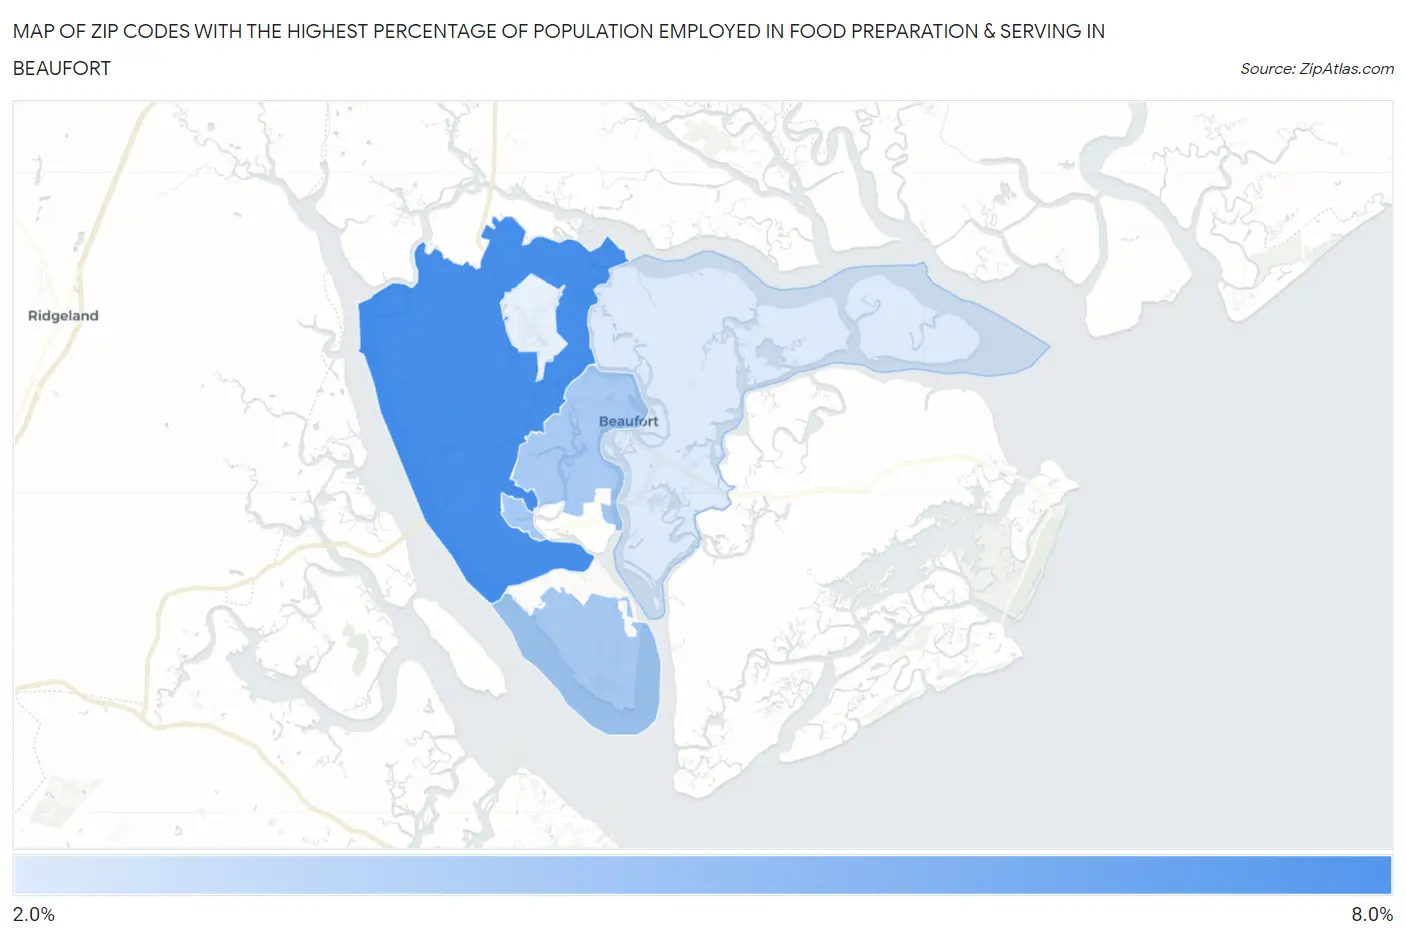
Map of Zip Codes with the Highest Percentage of Population Employed in Food Preparation & Serving in Beaufort
2.6%
7.8%
Zip Codes with the Highest Percentage of Population Employed in Food Preparation & Serving in Beaufort, SC
| Zip Code | % Employed | vs State | vs National | |
| 1. | 29906 | 7.8% | 5.8%(+2.06)#87 | 5.3%(+2.54)#4,998 |
| 2. | 29902 | 4.4% | 5.8%(-1.34)#227 | 5.3%(-0.852)#15,274 |
| 3. | 29907 | 2.6% | 5.8%(-3.16)#323 | 5.3%(-2.68)#22,751 |
1
Common Questions
What are the Top 3 Zip Codes with the Highest Percentage of Population Employed in Food Preparation & Serving in Beaufort, SC?
Top 3 Zip Codes with the Highest Percentage of Population Employed in Food Preparation & Serving in Beaufort, SC are:
What zip code has the Highest Percentage of Population Employed in Food Preparation & Serving in Beaufort, SC?
29906 has the Highest Percentage of Population Employed in Food Preparation & Serving in Beaufort, SC with 7.8%.
What is the Percentage of Population Employed in Food Preparation & Serving in Beaufort, SC?
Percentage of Population Employed in Food Preparation & Serving in Beaufort is 4.6%.
What is the Percentage of Population Employed in Food Preparation & Serving in South Carolina?
Percentage of Population Employed in Food Preparation & Serving in South Carolina is 5.8%.
What is the Percentage of Population Employed in Food Preparation & Serving in the United States?
Percentage of Population Employed in Food Preparation & Serving in the United States is 5.3%.