Zip Codes with the Highest Percentage of Population Employed in Food Preparation & Serving in Fort Mill, SC
RELATED REPORTS & OPTIONS
Food Preparation & Serving
Fort Mill
Compare Zip Codes
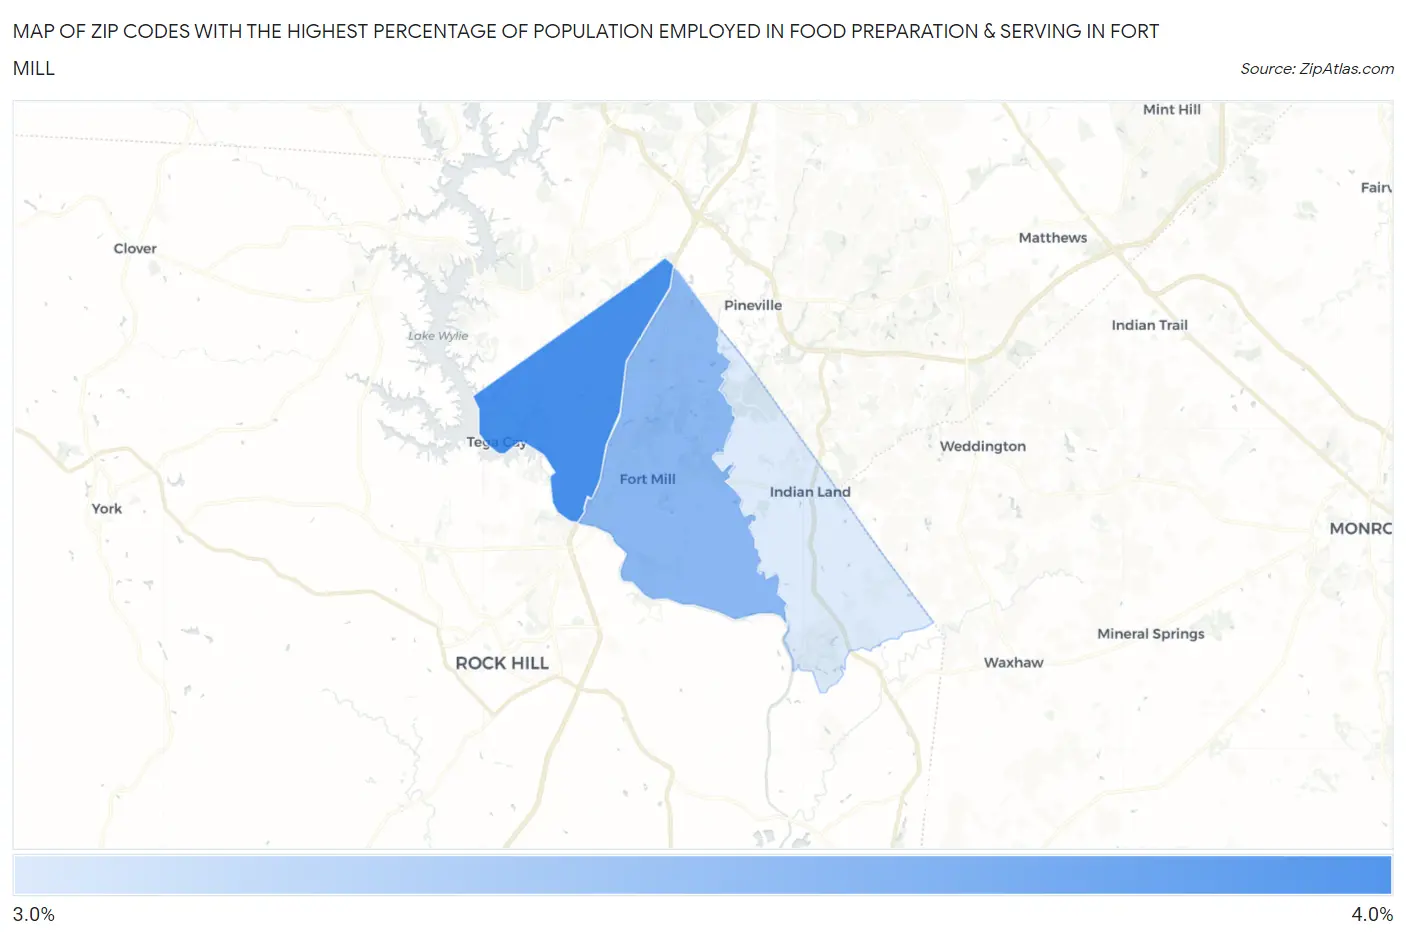
Map of Zip Codes with the Highest Percentage of Population Employed in Food Preparation & Serving in Fort Mill
3.4%
4.0%
Zip Codes with the Highest Percentage of Population Employed in Food Preparation & Serving in Fort Mill, SC
| Zip Code | % Employed | vs State | vs National | |
| 1. | 29708 | 4.0% | 5.8%(-1.80)#248 | 5.3%(-1.31)#17,229 |
| 2. | 29715 | 3.7% | 5.8%(-2.06)#269 | 5.3%(-1.58)#18,307 |
| 3. | 29707 | 3.4% | 5.8%(-2.38)#287 | 5.3%(-1.90)#19,666 |
1
Common Questions
What are the Top Zip Codes with the Highest Percentage of Population Employed in Food Preparation & Serving in Fort Mill, SC?
Top Zip Codes with the Highest Percentage of Population Employed in Food Preparation & Serving in Fort Mill, SC are:
What zip code has the Highest Percentage of Population Employed in Food Preparation & Serving in Fort Mill, SC?
29708 has the Highest Percentage of Population Employed in Food Preparation & Serving in Fort Mill, SC with 4.0%.
What is the Percentage of Population Employed in Food Preparation & Serving in Fort Mill, SC?
Percentage of Population Employed in Food Preparation & Serving in Fort Mill is 1.9%.
What is the Percentage of Population Employed in Food Preparation & Serving in South Carolina?
Percentage of Population Employed in Food Preparation & Serving in South Carolina is 5.8%.
What is the Percentage of Population Employed in Food Preparation & Serving in the United States?
Percentage of Population Employed in Food Preparation & Serving in the United States is 5.3%.