Cherryvale, SC Map & Demographics
Cherryvale Map
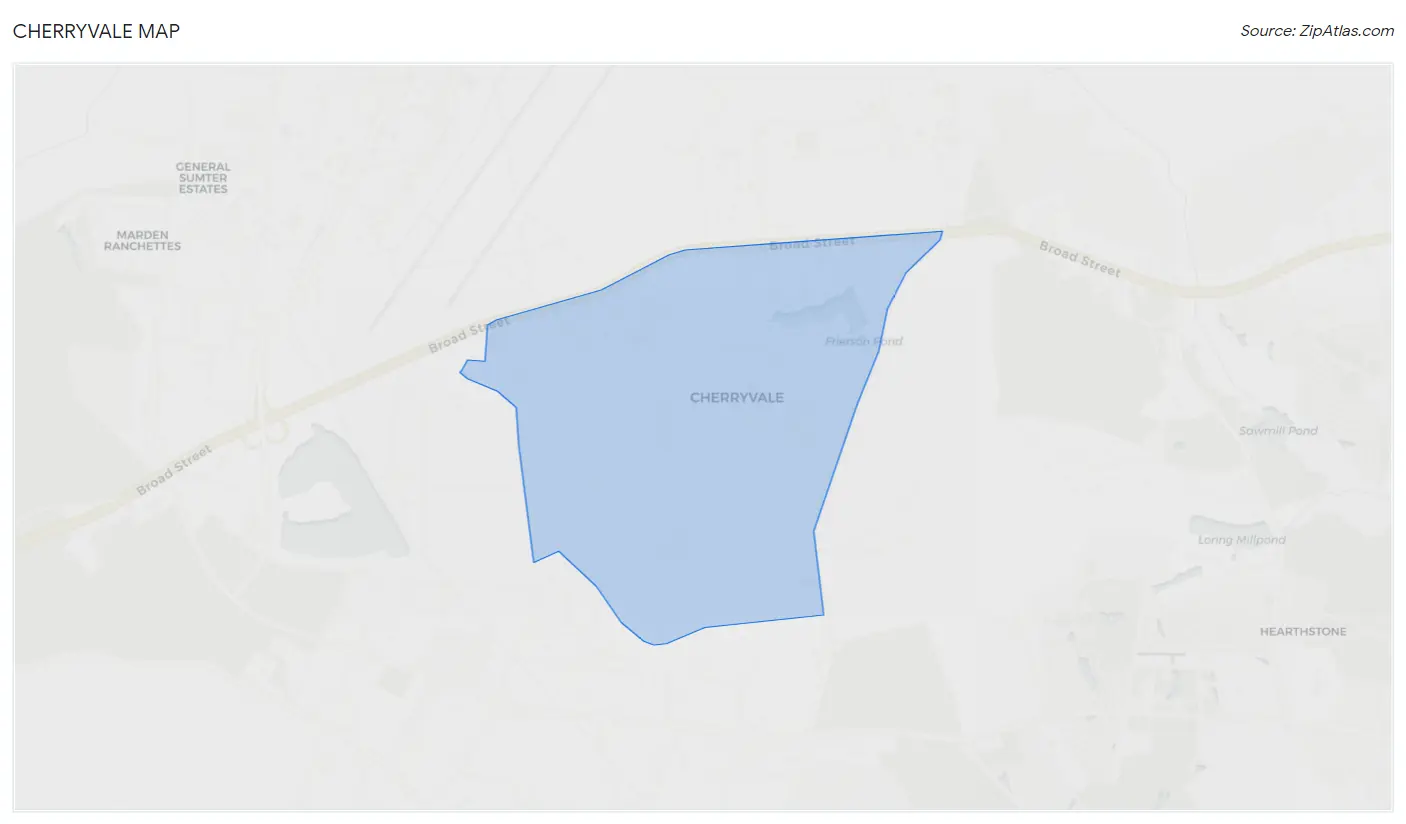
Cherryvale Overview
$18,486
PER CAPITA INCOME
$39,497
AVG FAMILY INCOME
$39,688
AVG HOUSEHOLD INCOME
0.33
INEQUALITY / GINI INDEX
2,843
TOTAL POPULATION
1,230
MALE POPULATION
1,613
FEMALE POPULATION
76.26
MALES / 100 FEMALES
131.14
FEMALES / 100 MALES
26.1
MEDIAN AGE
3.2
AVG FAMILY SIZE
2.4
AVG HOUSEHOLD SIZE
1,560
LABOR FORCE [ PEOPLE ]
68.9%
PERCENT IN LABOR FORCE
26.6%
UNEMPLOYMENT RATE
Income in Cherryvale
Income Overview in Cherryvale
Per Capita Income in Cherryvale is $18,486, while median incomes of families and households are $39,497 and $39,688 respectively.
| Characteristic | Number | Measure |
| Per Capita Income | 2,843 | $18,486 |
| Median Family Income | 655 | $39,497 |
| Mean Family Income | 655 | $39,798 |
| Median Household Income | 1,189 | $39,688 |
| Mean Household Income | 1,189 | $41,960 |
| Income Deficit | 655 | $0 |
| Wage / Income Gap (%) | 2,843 | 0.00% |
| Wage / Income Gap ($) | 2,843 | 100.00¢ per $1 |
| Gini / Inequality Index | 2,843 | 0.33 |
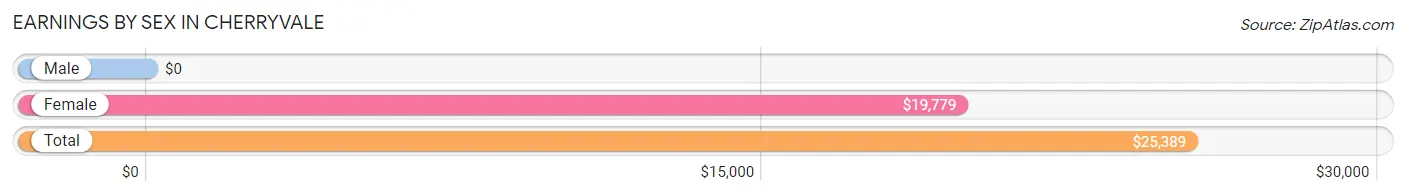
Earnings by Sex in Cherryvale
| Sex | Number | Average Earnings |
| Male | 816 (55.5%) | $0 |
| Female | 655 (44.5%) | $19,779 |
| Total | 1,471 (100.0%) | $25,389 |
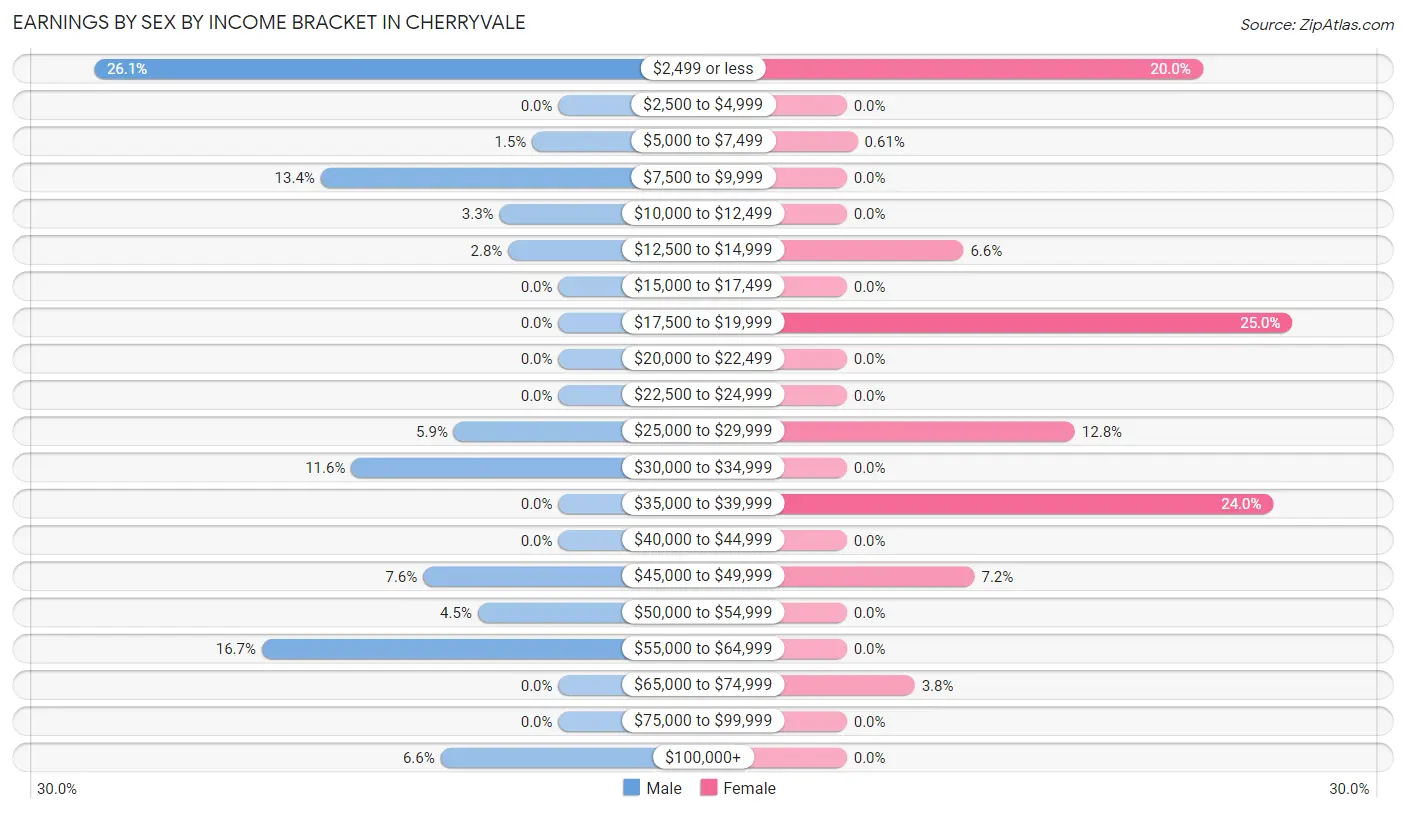
Earnings by Sex by Income Bracket in Cherryvale
The most common earnings brackets in Cherryvale are $2,499 or less for men (213 | 26.1%) and $17,500 to $19,999 for women (164 | 25.0%).
| Income | Male | Female |
| $2,499 or less | 213 (26.1%) | 131 (20.0%) |
| $2,500 to $4,999 | 0 (0.0%) | 0 (0.0%) |
| $5,000 to $7,499 | 12 (1.5%) | 4 (0.6%) |
| $7,500 to $9,999 | 109 (13.4%) | 0 (0.0%) |
| $10,000 to $12,499 | 27 (3.3%) | 0 (0.0%) |
| $12,500 to $14,999 | 23 (2.8%) | 43 (6.6%) |
| $15,000 to $17,499 | 0 (0.0%) | 0 (0.0%) |
| $17,500 to $19,999 | 0 (0.0%) | 164 (25.0%) |
| $20,000 to $22,499 | 0 (0.0%) | 0 (0.0%) |
| $22,500 to $24,999 | 0 (0.0%) | 0 (0.0%) |
| $25,000 to $29,999 | 48 (5.9%) | 84 (12.8%) |
| $30,000 to $34,999 | 95 (11.6%) | 0 (0.0%) |
| $35,000 to $39,999 | 0 (0.0%) | 157 (24.0%) |
| $40,000 to $44,999 | 0 (0.0%) | 0 (0.0%) |
| $45,000 to $49,999 | 62 (7.6%) | 47 (7.2%) |
| $50,000 to $54,999 | 37 (4.5%) | 0 (0.0%) |
| $55,000 to $64,999 | 136 (16.7%) | 0 (0.0%) |
| $65,000 to $74,999 | 0 (0.0%) | 25 (3.8%) |
| $75,000 to $99,999 | 0 (0.0%) | 0 (0.0%) |
| $100,000+ | 54 (6.6%) | 0 (0.0%) |
| Total | 816 (100.0%) | 655 (100.0%) |
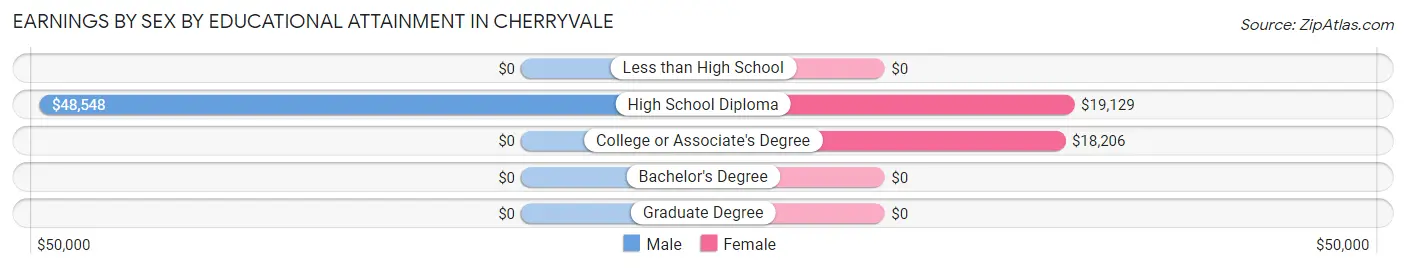
Earnings by Sex by Educational Attainment in Cherryvale
Average earnings in Cherryvale are $49,234 for men and $18,864 for women, a difference of 61.7%. Men with an educational attainment of high school diploma enjoy the highest average annual earnings of $48,548, while those with high school diploma education earn the least with $48,548. Women with an educational attainment of high school diploma earn the most with the average annual earnings of $19,129, while those with college or associate's degree education have the smallest earnings of $18,206.
| Educational Attainment | Male Income | Female Income |
| Less than High School | - | - |
| High School Diploma | $48,548 | $19,129 |
| College or Associate's Degree | - | - |
| Bachelor's Degree | - | - |
| Graduate Degree | - | - |
| Total | $49,234 | $18,864 |
Family Income in Cherryvale
Family Income Brackets in Cherryvale
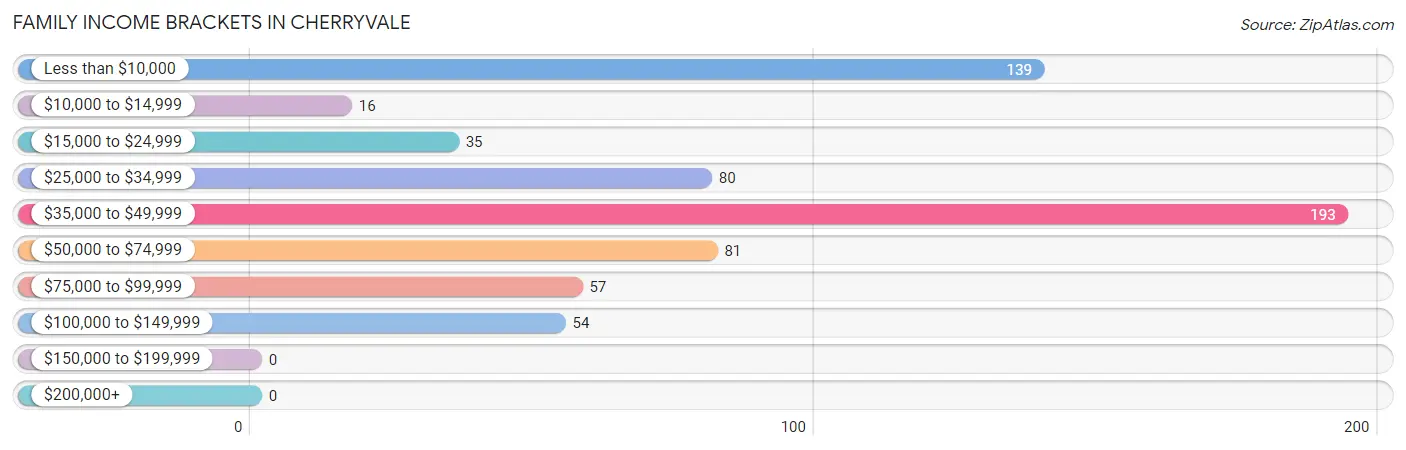
According to the Cherryvale family income data, there are 193 families falling into the $35,000 to $49,999 income range, which is the most common income bracket and makes up 29.5% of all families.
| Income Bracket | # Families | % Families |
| Less than $10,000 | 139 | 21.2% |
| $10,000 to $14,999 | 16 | 2.4% |
| $15,000 to $24,999 | 35 | 5.3% |
| $25,000 to $34,999 | 80 | 12.2% |
| $35,000 to $49,999 | 193 | 29.5% |
| $50,000 to $74,999 | 81 | 12.4% |
| $75,000 to $99,999 | 57 | 8.7% |
| $100,000 to $149,999 | 54 | 8.2% |
| $150,000 to $199,999 | 0 | 0.0% |
| $200,000+ | 0 | 0.0% |
Family Income by Famaliy Size in Cherryvale
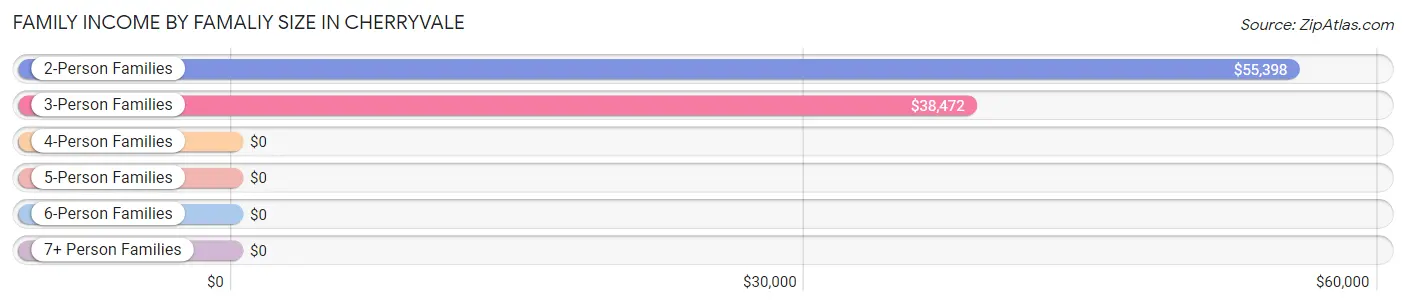
2-person families (161 | 24.6%) account for the highest median family income in Cherryvale with $55,398 per family, while 2-person families (161 | 24.6%) have the highest median income of $27,699 per family member.
| Income Bracket | # Families | Median Income |
| 2-Person Families | 161 (24.6%) | $55,398 |
| 3-Person Families | 378 (57.7%) | $38,472 |
| 4-Person Families | 116 (17.7%) | $0 |
| 5-Person Families | 0 (0.0%) | $0 |
| 6-Person Families | 0 (0.0%) | $0 |
| 7+ Person Families | 0 (0.0%) | $0 |
| Total | 655 (100.0%) | $39,497 |
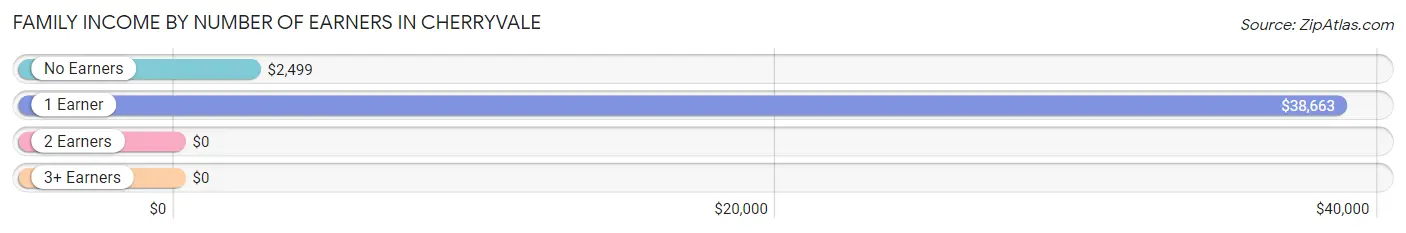
Family Income by Number of Earners in Cherryvale
| Number of Earners | # Families | Median Income |
| No Earners | 132 (20.2%) | $2,499 |
| 1 Earner | 297 (45.3%) | $38,663 |
| 2 Earners | 135 (20.6%) | $0 |
| 3+ Earners | 91 (13.9%) | $0 |
| Total | 655 (100.0%) | $39,497 |
Household Income in Cherryvale
Household Income Brackets in Cherryvale
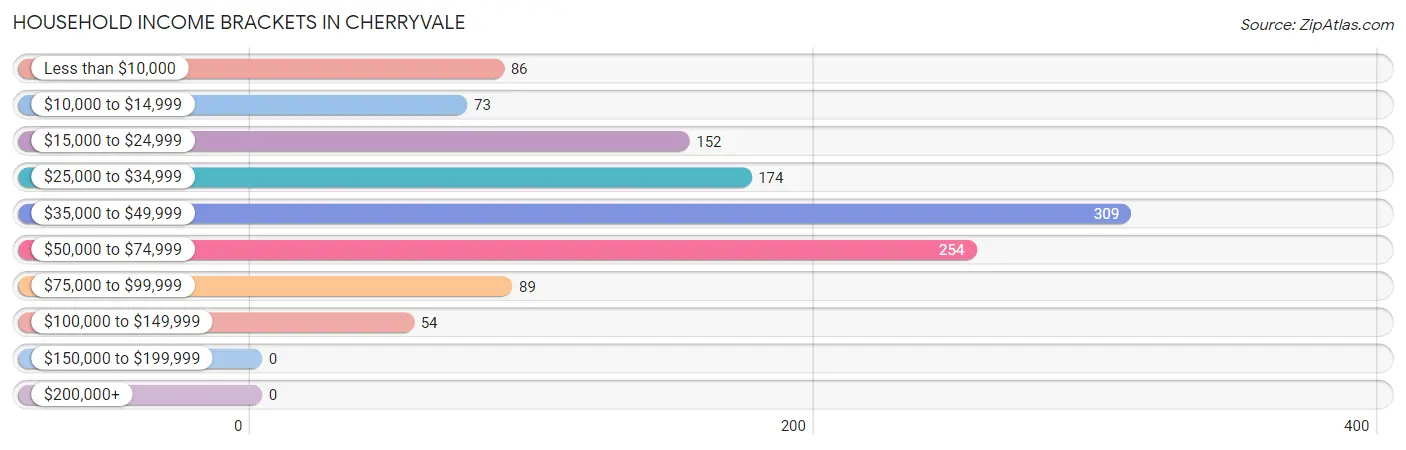
With 309 households falling in the category, the $35,000 to $49,999 income range is the most frequent in Cherryvale, accounting for 26.0% of all households.
| Income Bracket | # Households | % Households |
| Less than $10,000 | 86 | 7.2% |
| $10,000 to $14,999 | 73 | 6.1% |
| $15,000 to $24,999 | 152 | 12.8% |
| $25,000 to $34,999 | 174 | 14.6% |
| $35,000 to $49,999 | 309 | 26.0% |
| $50,000 to $74,999 | 254 | 21.4% |
| $75,000 to $99,999 | 89 | 7.5% |
| $100,000 to $149,999 | 54 | 4.5% |
| $150,000 to $199,999 | 0 | 0.0% |
| $200,000+ | 0 | 0.0% |
Household Income by Householder Age in Cherryvale
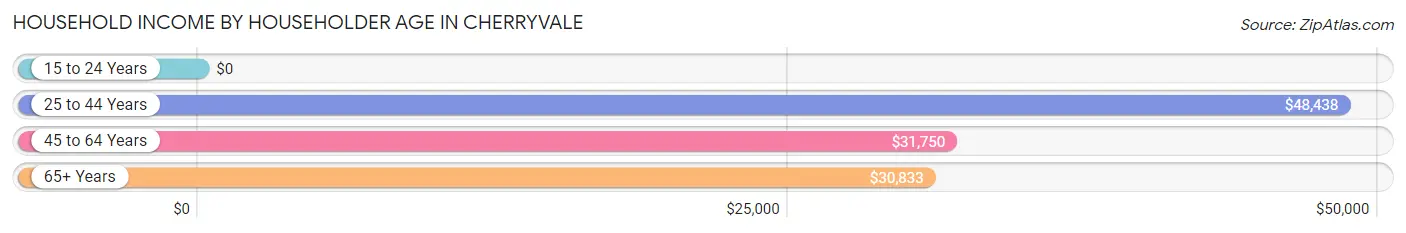
The median household income in Cherryvale is $39,688, with the highest median household income of $48,438 found in the 25 to 44 years age bracket for the primary householder. A total of 422 households (35.5%) fall into this category. Meanwhile, the 15 to 24 years age bracket for the primary householder has the lowest median household income of $0, with 185 households (15.6%) in this group.
| Income Bracket | # Households | Median Income |
| 15 to 24 Years | 185 (15.6%) | $0 |
| 25 to 44 Years | 422 (35.5%) | $48,438 |
| 45 to 64 Years | 358 (30.1%) | $31,750 |
| 65+ Years | 224 (18.8%) | $30,833 |
| Total | 1,189 (100.0%) | $39,688 |
Poverty in Cherryvale
Income Below Poverty by Sex and Age in Cherryvale
With 18.9% poverty level for males and 22.1% for females among the residents of Cherryvale, 65 to 74 year old males and 5 year old females are the most vulnerable to poverty, with 22 males (37.9%) and 46 females (43.8%) in their respective age groups living below the poverty level.
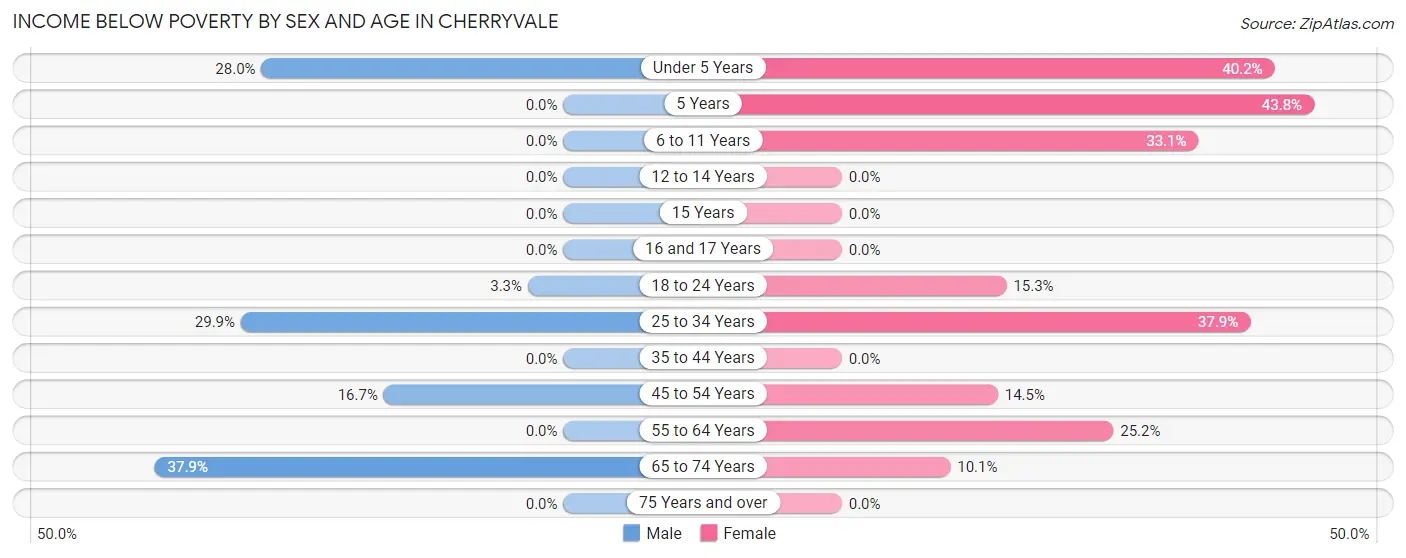
| Age Bracket | Male | Female |
| Under 5 Years | 51 (28.0%) | 55 (40.2%) |
| 5 Years | 0 (0.0%) | 46 (43.8%) |
| 6 to 11 Years | 0 (0.0%) | 46 (33.1%) |
| 12 to 14 Years | 0 (0.0%) | 0 (0.0%) |
| 15 Years | 0 (0.0%) | 0 (0.0%) |
| 16 and 17 Years | 0 (0.0%) | 0 (0.0%) |
| 18 to 24 Years | 11 (3.3%) | 70 (15.3%) |
| 25 to 34 Years | 129 (29.9%) | 72 (37.9%) |
| 35 to 44 Years | 0 (0.0%) | 0 (0.0%) |
| 45 to 54 Years | 19 (16.7%) | 21 (14.5%) |
| 55 to 64 Years | 0 (0.0%) | 31 (25.2%) |
| 65 to 74 Years | 22 (37.9%) | 15 (10.1%) |
| 75 Years and over | 0 (0.0%) | 0 (0.0%) |
| Total | 232 (18.9%) | 356 (22.1%) |
Income Above Poverty by Sex and Age in Cherryvale
According to the poverty statistics in Cherryvale, males aged 55 to 64 years and females aged 12 to 14 years are the age groups that are most secure financially, with 100.0% of males and 100.0% of females in these age groups living above the poverty line.
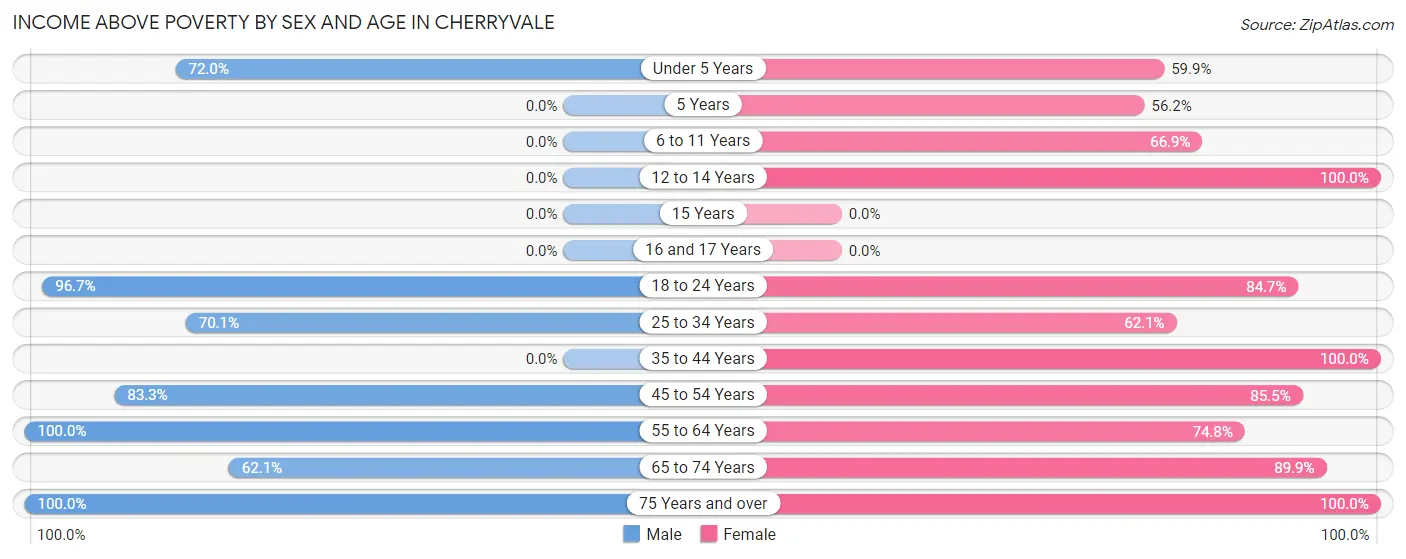
| Age Bracket | Male | Female |
| Under 5 Years | 131 (72.0%) | 82 (59.9%) |
| 5 Years | 0 (0.0%) | 59 (56.2%) |
| 6 to 11 Years | 0 (0.0%) | 93 (66.9%) |
| 12 to 14 Years | 0 (0.0%) | 16 (100.0%) |
| 15 Years | 0 (0.0%) | 0 (0.0%) |
| 16 and 17 Years | 0 (0.0%) | 0 (0.0%) |
| 18 to 24 Years | 323 (96.7%) | 388 (84.7%) |
| 25 to 34 Years | 302 (70.1%) | 118 (62.1%) |
| 35 to 44 Years | 0 (0.0%) | 122 (100.0%) |
| 45 to 54 Years | 95 (83.3%) | 124 (85.5%) |
| 55 to 64 Years | 82 (100.0%) | 92 (74.8%) |
| 65 to 74 Years | 36 (62.1%) | 134 (89.9%) |
| 75 Years and over | 29 (100.0%) | 29 (100.0%) |
| Total | 998 (81.1%) | 1,257 (77.9%) |
Income Below Poverty Among Married-Couple Families in Cherryvale
The poverty statistics for married-couple families in Cherryvale show that 39.6% or 97 of the total 245 families live below the poverty line. Families with 1 or 2 children have the highest poverty rate of 56.5%, comprising of 70 families. On the other hand, families with no children have the lowest poverty rate of 22.3%, which includes 27 families.
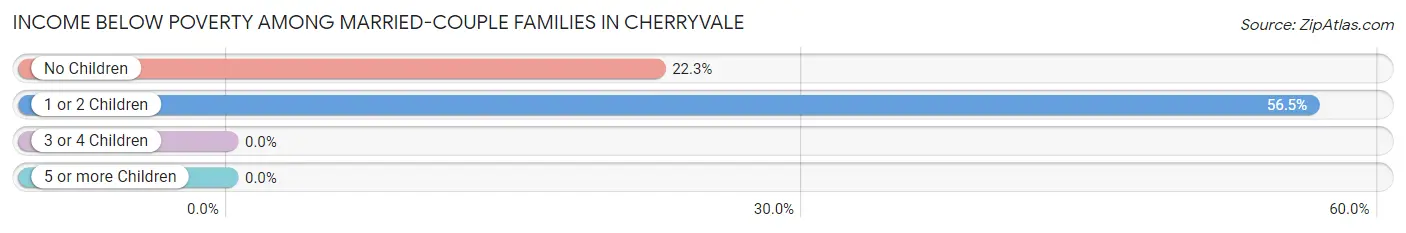
| Children | Above Poverty | Below Poverty |
| No Children | 94 (77.7%) | 27 (22.3%) |
| 1 or 2 Children | 54 (43.5%) | 70 (56.5%) |
| 3 or 4 Children | 0 (0.0%) | 0 (0.0%) |
| 5 or more Children | 0 (0.0%) | 0 (0.0%) |
| Total | 148 (60.4%) | 97 (39.6%) |
Income Below Poverty Among Single-Parent Households in Cherryvale
According to the poverty data in Cherryvale, 66.7% or 16 single-father households and 12.4% or 48 single-mother households are living below the poverty line. Among single-father households, those with no children have the highest poverty rate, with 16 households (66.7%) experiencing poverty. Likewise, among single-mother households, those with 3 or 4 children have the highest poverty rate, with 48 households (100.0%) falling below the poverty line.
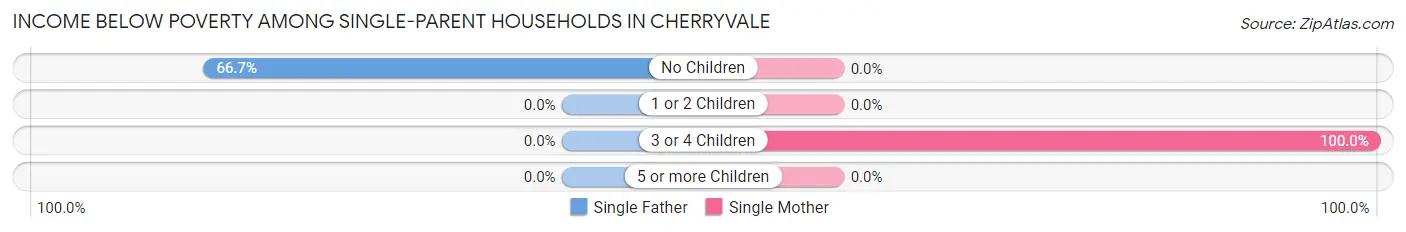
| Children | Single Father | Single Mother |
| No Children | 16 (66.7%) | 0 (0.0%) |
| 1 or 2 Children | 0 (0.0%) | 0 (0.0%) |
| 3 or 4 Children | 0 (0.0%) | 48 (100.0%) |
| 5 or more Children | 0 (0.0%) | 0 (0.0%) |
| Total | 16 (66.7%) | 48 (12.4%) |
Income Below Poverty Among Married-Couple vs Single-Parent Households in Cherryvale
The poverty data for Cherryvale shows that 97 of the married-couple family households (39.6%) and 64 of the single-parent households (15.6%) are living below the poverty level. Within the married-couple family households, those with 1 or 2 children have the highest poverty rate, with 70 households (56.5%) falling below the poverty line. Among the single-parent households, those with 3 or 4 children have the highest poverty rate, with 48 household (100.0%) living below poverty.
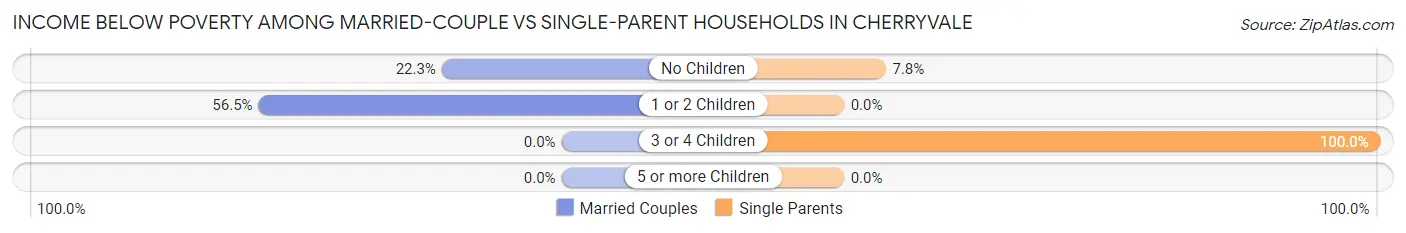
| Children | Married-Couple Families | Single-Parent Households |
| No Children | 27 (22.3%) | 16 (7.8%) |
| 1 or 2 Children | 70 (56.5%) | 0 (0.0%) |
| 3 or 4 Children | 0 (0.0%) | 48 (100.0%) |
| 5 or more Children | 0 (0.0%) | 0 (0.0%) |
| Total | 97 (39.6%) | 64 (15.6%) |
Race in Cherryvale
The most populous races in Cherryvale are Black / African American (1,970 | 69.3%), White / Caucasian (842 | 29.6%), and Two or more Races (18 | 0.6%).
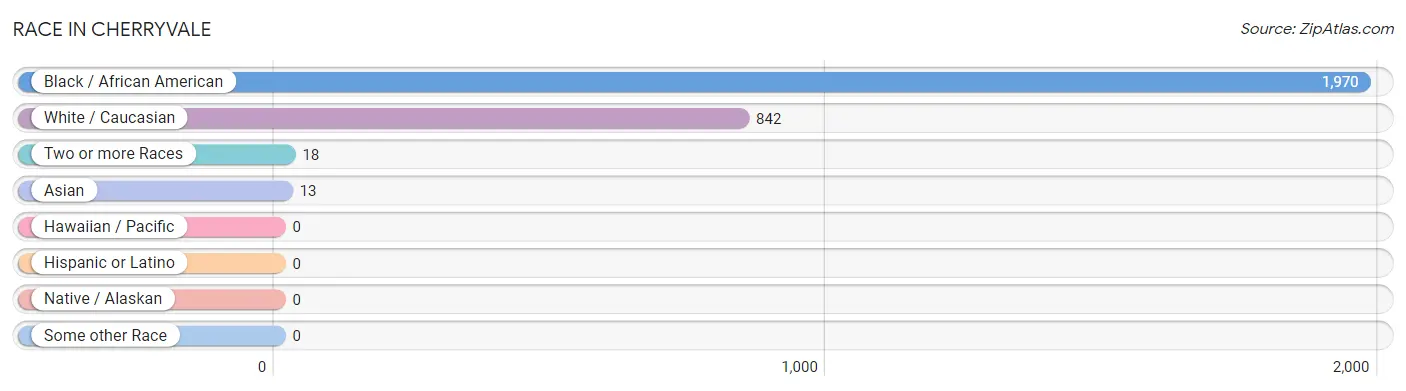
| Race | # Population | % Population |
| Asian | 13 | 0.5% |
| Black / African American | 1,970 | 69.3% |
| Hawaiian / Pacific | 0 | 0.0% |
| Hispanic or Latino | 0 | 0.0% |
| Native / Alaskan | 0 | 0.0% |
| White / Caucasian | 842 | 29.6% |
| Two or more Races | 18 | 0.6% |
| Some other Race | 0 | 0.0% |
| Total | 2,843 | 100.0% |
Ancestry in Cherryvale
The most populous ancestries reported in Cherryvale are English (69 | 2.4%), Norwegian (54 | 1.9%), Swedish (54 | 1.9%), German (44 | 1.5%), and Irish (43 | 1.5%), together accounting for 9.3% of all Cherryvale residents.
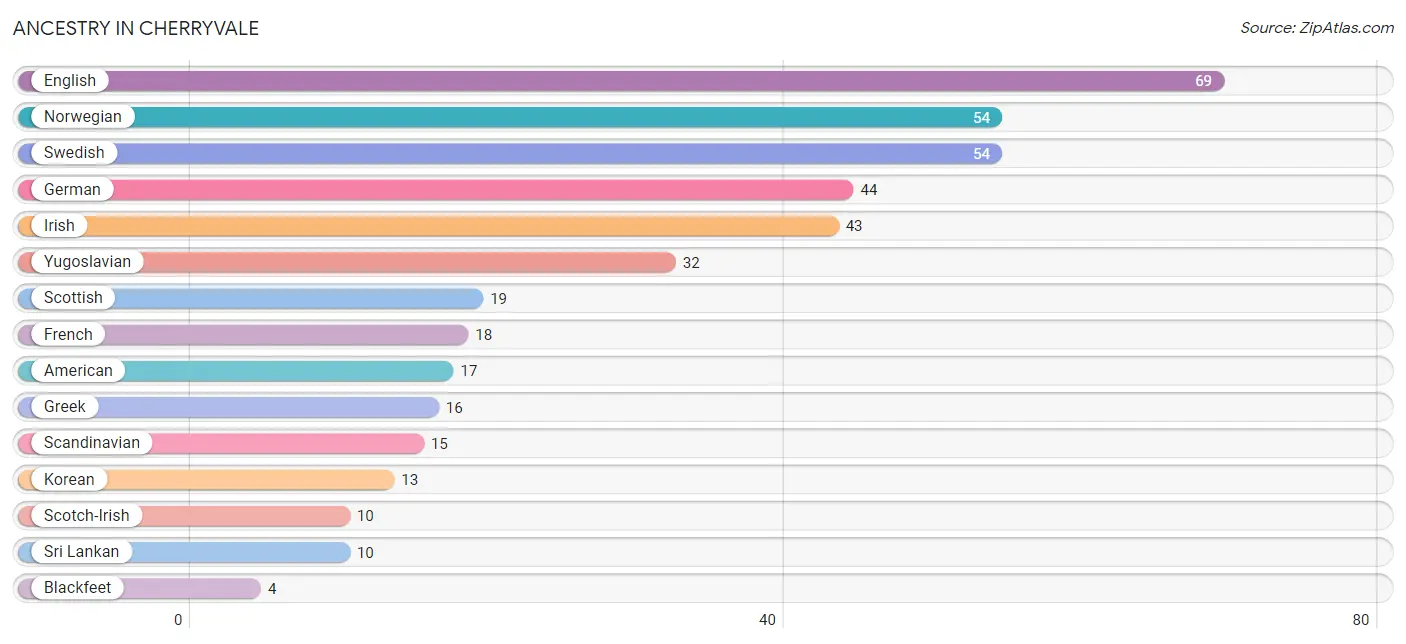
| Ancestry | # Population | % Population |
| American | 17 | 0.6% |
| Blackfeet | 4 | 0.1% |
| English | 69 | 2.4% |
| French | 18 | 0.6% |
| German | 44 | 1.5% |
| Greek | 16 | 0.6% |
| Irish | 43 | 1.5% |
| Italian | 4 | 0.1% |
| Korean | 13 | 0.5% |
| Norwegian | 54 | 1.9% |
| Scandinavian | 15 | 0.5% |
| Scotch-Irish | 10 | 0.4% |
| Scottish | 19 | 0.7% |
| Sri Lankan | 10 | 0.4% |
| Swedish | 54 | 1.9% |
| Yugoslavian | 32 | 1.1% | View All 16 Rows |
Immigrants in Cherryvale
The most numerous immigrant groups reported in Cherryvale came from Europe (40 | 1.4%), Bosnia and Herzegovina (32 | 1.1%), Eastern Europe (32 | 1.1%), Asia (13 | 0.5%), and Philippines (13 | 0.5%), together accounting for 4.6% of all Cherryvale residents.
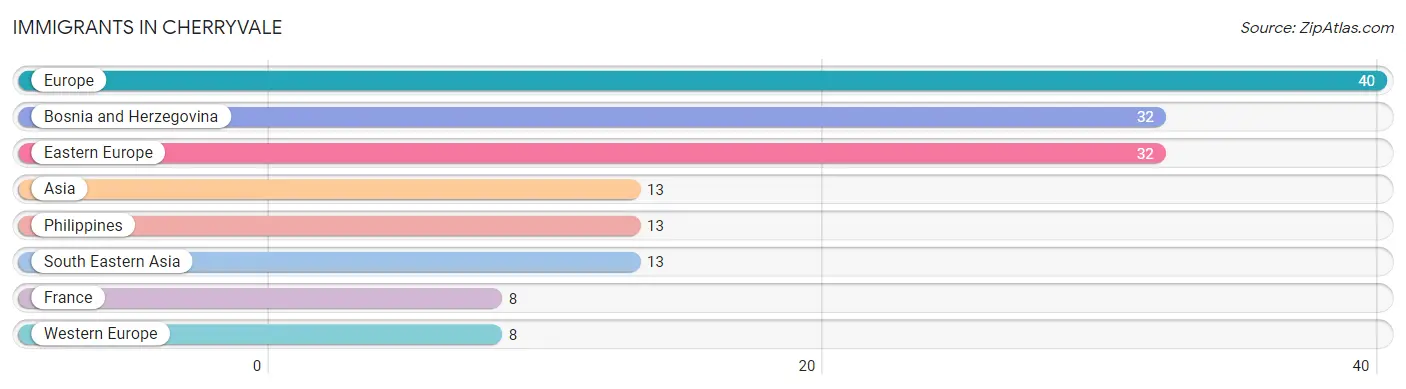
| Immigration Origin | # Population | % Population |
| Asia | 13 | 0.5% |
| Bosnia and Herzegovina | 32 | 1.1% |
| Eastern Europe | 32 | 1.1% |
| Europe | 40 | 1.4% |
| France | 8 | 0.3% |
| Philippines | 13 | 0.5% |
| South Eastern Asia | 13 | 0.5% |
| Western Europe | 8 | 0.3% | View All 8 Rows |
Sex and Age in Cherryvale
Sex and Age in Cherryvale
The most populous age groups in Cherryvale are 20 to 24 Years (324 | 26.3%) for men and 20 to 24 Years (364 | 22.6%) for women.
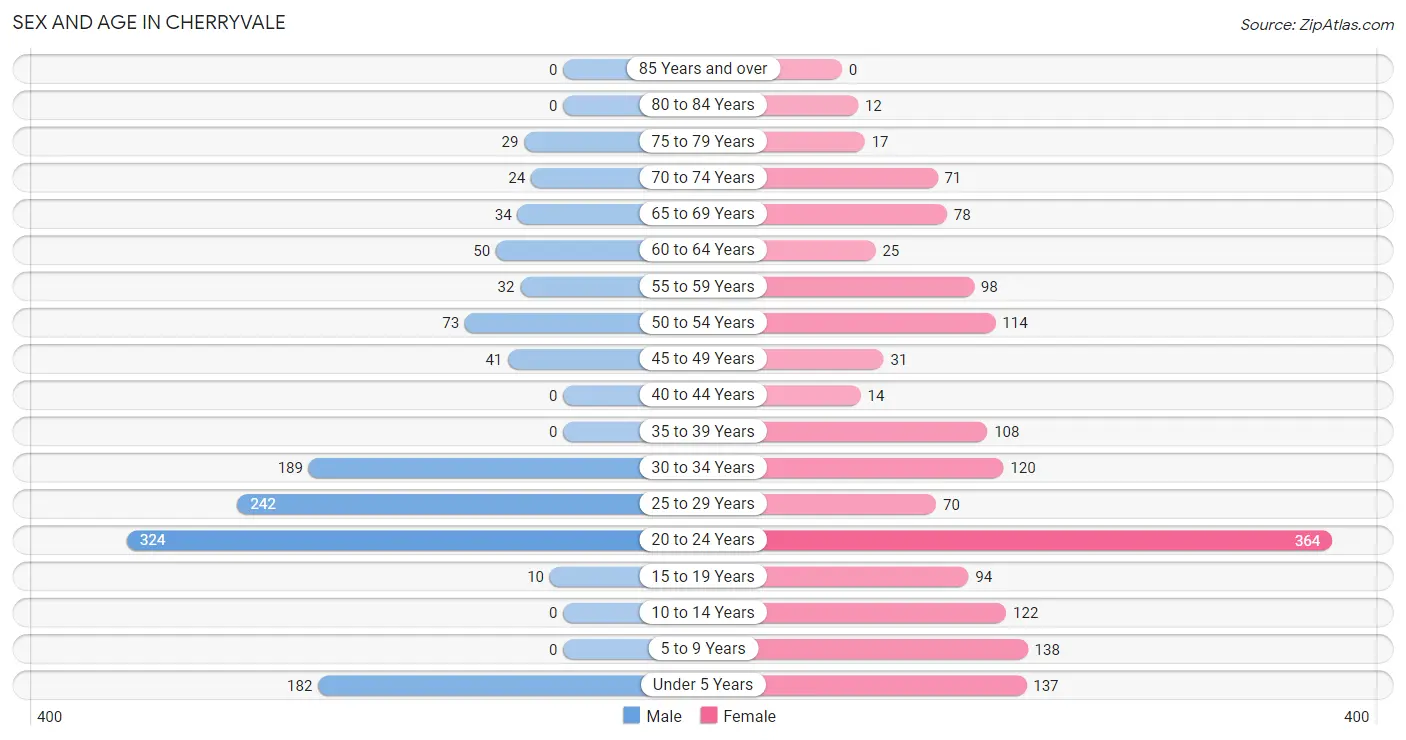
| Age Bracket | Male | Female |
| Under 5 Years | 182 (14.8%) | 137 (8.5%) |
| 5 to 9 Years | 0 (0.0%) | 138 (8.6%) |
| 10 to 14 Years | 0 (0.0%) | 122 (7.6%) |
| 15 to 19 Years | 10 (0.8%) | 94 (5.8%) |
| 20 to 24 Years | 324 (26.3%) | 364 (22.6%) |
| 25 to 29 Years | 242 (19.7%) | 70 (4.3%) |
| 30 to 34 Years | 189 (15.4%) | 120 (7.4%) |
| 35 to 39 Years | 0 (0.0%) | 108 (6.7%) |
| 40 to 44 Years | 0 (0.0%) | 14 (0.9%) |
| 45 to 49 Years | 41 (3.3%) | 31 (1.9%) |
| 50 to 54 Years | 73 (5.9%) | 114 (7.1%) |
| 55 to 59 Years | 32 (2.6%) | 98 (6.1%) |
| 60 to 64 Years | 50 (4.1%) | 25 (1.5%) |
| 65 to 69 Years | 34 (2.8%) | 78 (4.8%) |
| 70 to 74 Years | 24 (1.9%) | 71 (4.4%) |
| 75 to 79 Years | 29 (2.4%) | 17 (1.1%) |
| 80 to 84 Years | 0 (0.0%) | 12 (0.7%) |
| 85 Years and over | 0 (0.0%) | 0 (0.0%) |
| Total | 1,230 (100.0%) | 1,613 (100.0%) |
Families and Households in Cherryvale
Median Family Size in Cherryvale
The median family size in Cherryvale is 3.24 persons per family, with single female/mother families (386 | 58.9%) accounting for the largest median family size of 3.61 persons per family. On the other hand, single male/father families (24 | 3.7%) represent the smallest median family size with 2.17 persons per family.
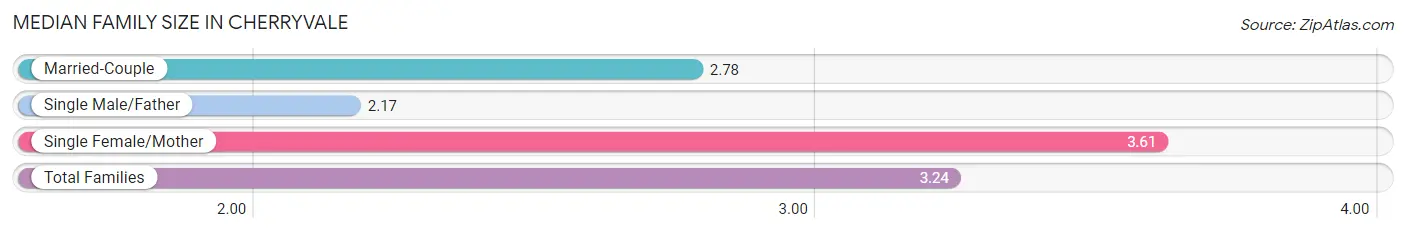
| Family Type | # Families | Family Size |
| Married-Couple | 245 (37.4%) | 2.78 |
| Single Male/Father | 24 (3.7%) | 2.17 |
| Single Female/Mother | 386 (58.9%) | 3.61 |
| Total Families | 655 (100.0%) | 3.24 |
Median Household Size in Cherryvale
The median household size in Cherryvale is 2.36 persons per household, with single female/mother households (386 | 32.5%) accounting for the largest median household size of 3.74 persons per household. non-family households (534 | 44.9%) represent the smallest median household size with 1.13 persons per household.
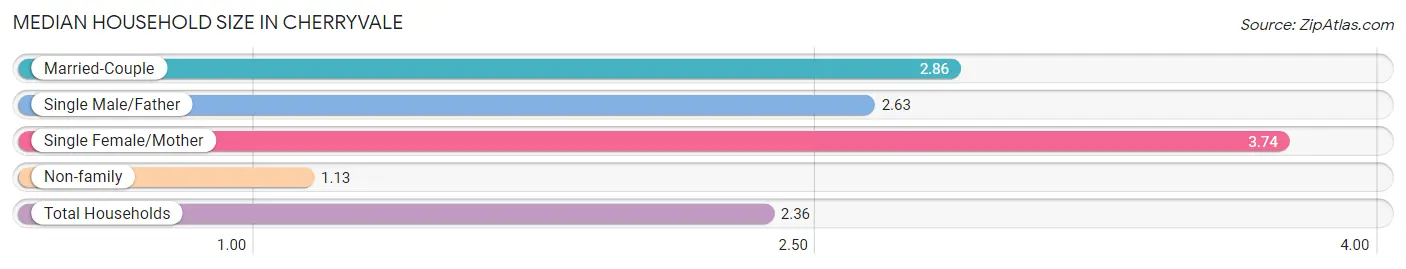
| Household Type | # Households | Household Size |
| Married-Couple | 245 (20.6%) | 2.86 |
| Single Male/Father | 24 (2.0%) | 2.63 |
| Single Female/Mother | 386 (32.5%) | 3.74 |
| Non-family | 534 (44.9%) | 1.13 |
| Total Households | 1,189 (100.0%) | 2.36 |
Household Size by Marriage Status in Cherryvale
Out of a total of 1,189 households in Cherryvale, 655 (55.1%) are family households, while 534 (44.9%) are nonfamily households. The most numerous type of family households are 3-person households, comprising 407, and the most common type of nonfamily households are 1-person households, comprising 467.
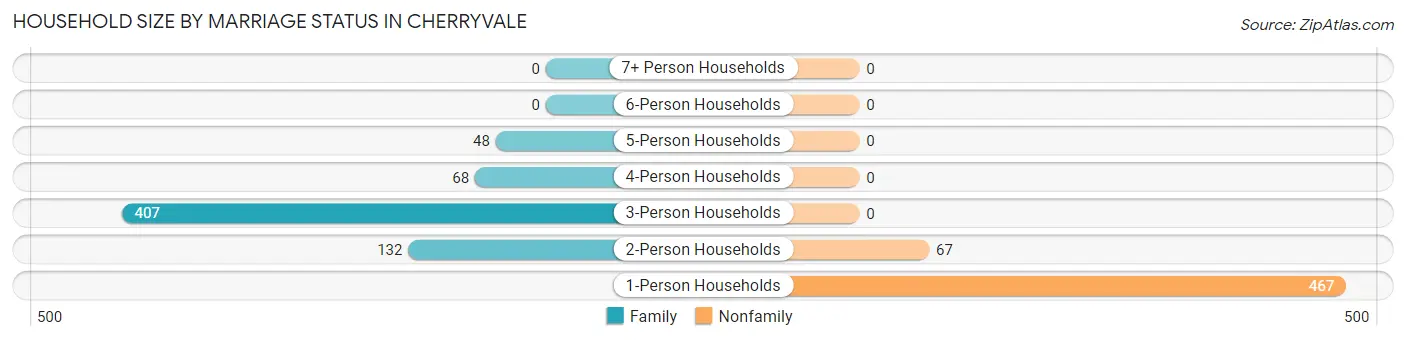
| Household Size | Family Households | Nonfamily Households |
| 1-Person Households | - | 467 (39.3%) |
| 2-Person Households | 132 (11.1%) | 67 (5.6%) |
| 3-Person Households | 407 (34.2%) | 0 (0.0%) |
| 4-Person Households | 68 (5.7%) | 0 (0.0%) |
| 5-Person Households | 48 (4.0%) | 0 (0.0%) |
| 6-Person Households | 0 (0.0%) | 0 (0.0%) |
| 7+ Person Households | 0 (0.0%) | 0 (0.0%) |
| Total | 655 (55.1%) | 534 (44.9%) |
Female Fertility in Cherryvale
Fertility by Age in Cherryvale
Average fertility rate in Cherryvale is 60.0 births per 1,000 women. Women in the age bracket of 20 to 34 years have the highest fertility rate with 87.0 births per 1,000 women. Women in the age bracket of 20 to 34 years acount for 100.0% of all women with births.
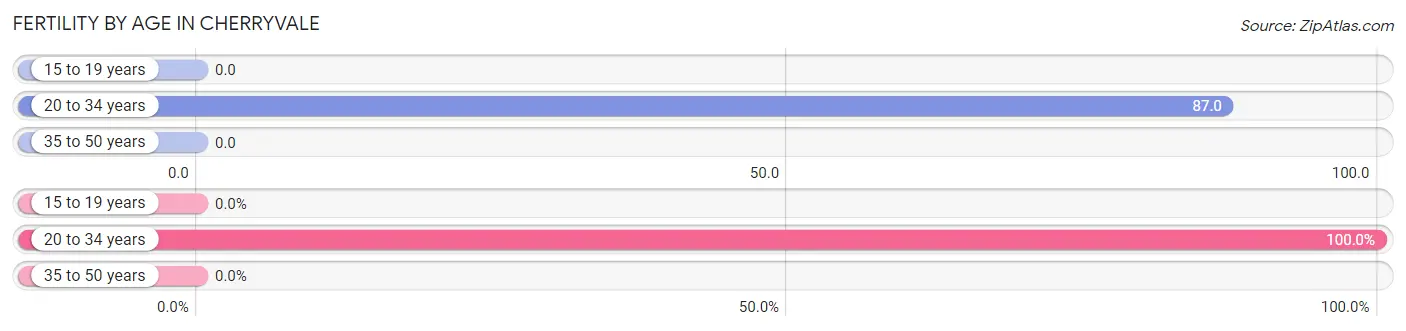
| Age Bracket | Women with Births | Births / 1,000 Women |
| 15 to 19 years | 0 (0.0%) | 0.0 |
| 20 to 34 years | 48 (100.0%) | 87.0 |
| 35 to 50 years | 0 (0.0%) | 0.0 |
| Total | 48 (100.0%) | 60.0 |
Fertility by Age by Marriage Status in Cherryvale
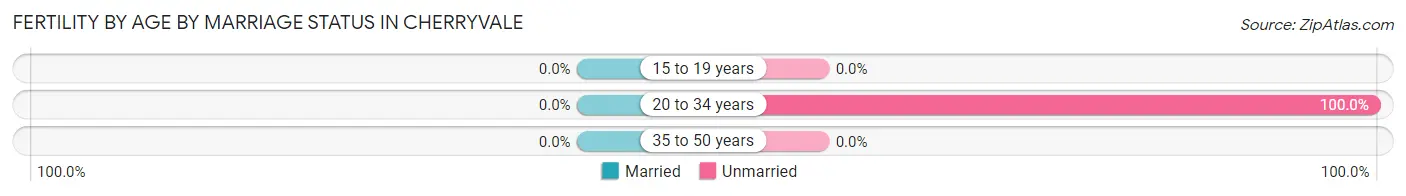
| Age Bracket | Married | Unmarried |
| 15 to 19 years | 0 (0.0%) | 0 (0.0%) |
| 20 to 34 years | 0 (0.0%) | 48 (100.0%) |
| 35 to 50 years | 0 (0.0%) | 0 (0.0%) |
| Total | 0 (0.0%) | 48 (100.0%) |
Fertility by Education in Cherryvale
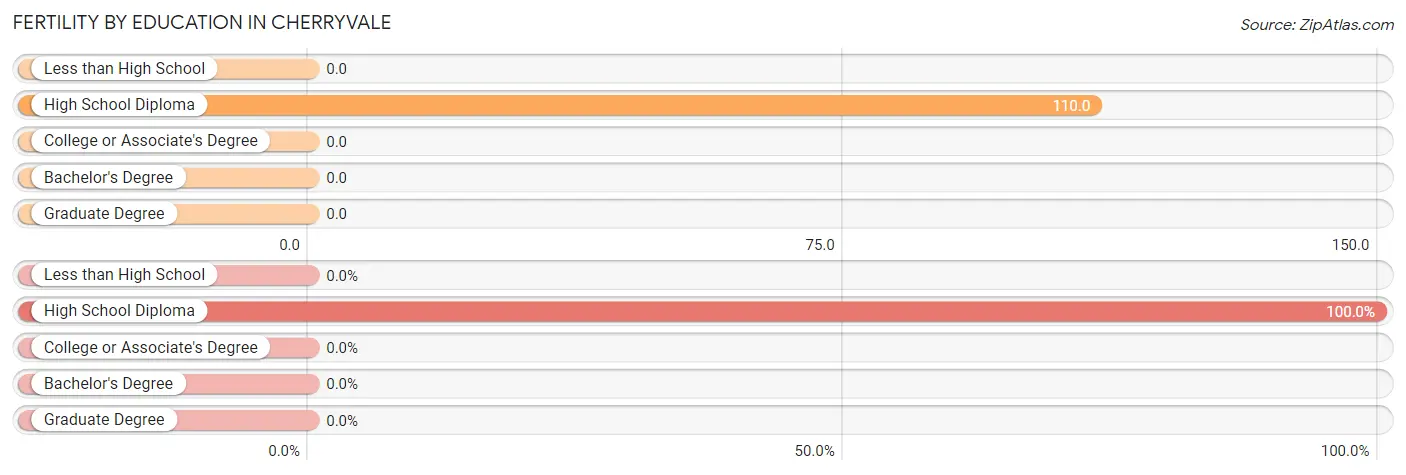
| Educational Attainment | Women with Births | Births / 1,000 Women |
| Less than High School | 0 (0.0%) | 0.0 |
| High School Diploma | 48 (100.0%) | 110.0 |
| College or Associate's Degree | 0 (0.0%) | 0.0 |
| Bachelor's Degree | 0 (0.0%) | 0.0 |
| Graduate Degree | 0 (0.0%) | 0.0 |
| Total | 48 (100.0%) | 60.0 |
Fertility by Education by Marriage Status in Cherryvale
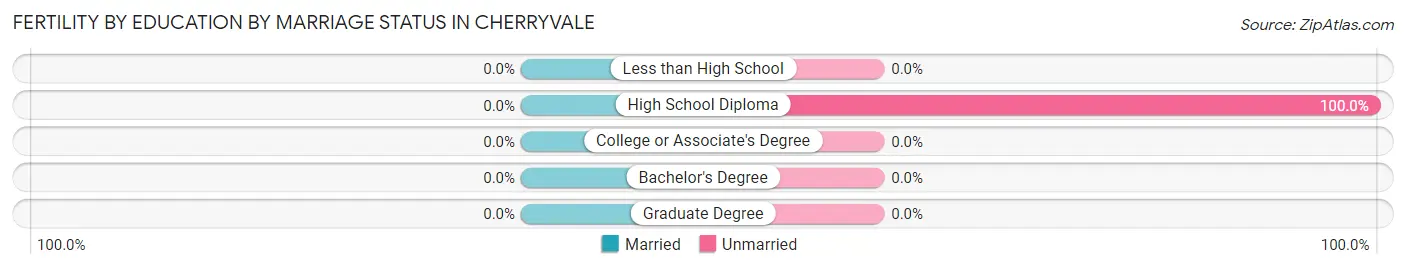
| Educational Attainment | Married | Unmarried |
| Less than High School | 0 (0.0%) | 0 (0.0%) |
| High School Diploma | 0 (0.0%) | 48 (100.0%) |
| College or Associate's Degree | 0 (0.0%) | 0 (0.0%) |
| Bachelor's Degree | 0 (0.0%) | 0 (0.0%) |
| Graduate Degree | 0 (0.0%) | 0 (0.0%) |
| Total | 0 (0.0%) | 48 (100.0%) |
Employment Characteristics in Cherryvale
Employment by Class of Employer in Cherryvale
Among the 1,153 employed individuals in Cherryvale, private company employees (737 | 63.9%), self-employed (not incorporated) (136 | 11.8%), and state government employees (116 | 10.1%) make up the most common classes of employment.
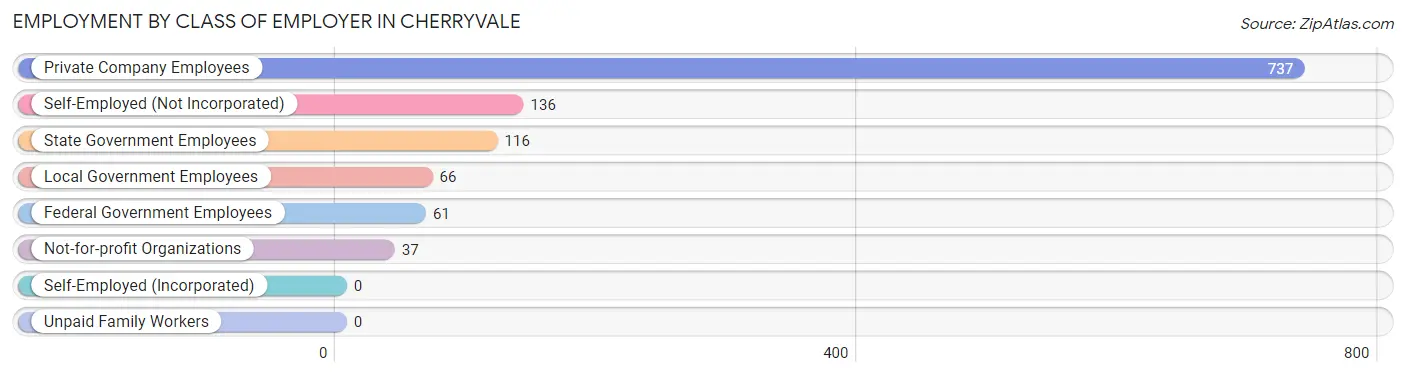
| Employer Class | # Employees | % Employees |
| Private Company Employees | 737 | 63.9% |
| Self-Employed (Incorporated) | 0 | 0.0% |
| Self-Employed (Not Incorporated) | 136 | 11.8% |
| Not-for-profit Organizations | 37 | 3.2% |
| Local Government Employees | 66 | 5.7% |
| State Government Employees | 116 | 10.1% |
| Federal Government Employees | 61 | 5.3% |
| Unpaid Family Workers | 0 | 0.0% |
| Total | 1,153 | 100.0% |
Employment Status by Age in Cherryvale
According to the labor force statistics for Cherryvale, out of the total population over 16 years of age (2,264), 68.9% or 1,560 individuals are in the labor force, with 26.6% or 415 of them unemployed. The age group with the highest labor force participation rate is 35 to 44 years, with 100.0% or 122 individuals in the labor force. Within the labor force, the 25 to 29 years age range has the highest percentage of unemployed individuals, with 45.7% or 121 of them being unemployed.
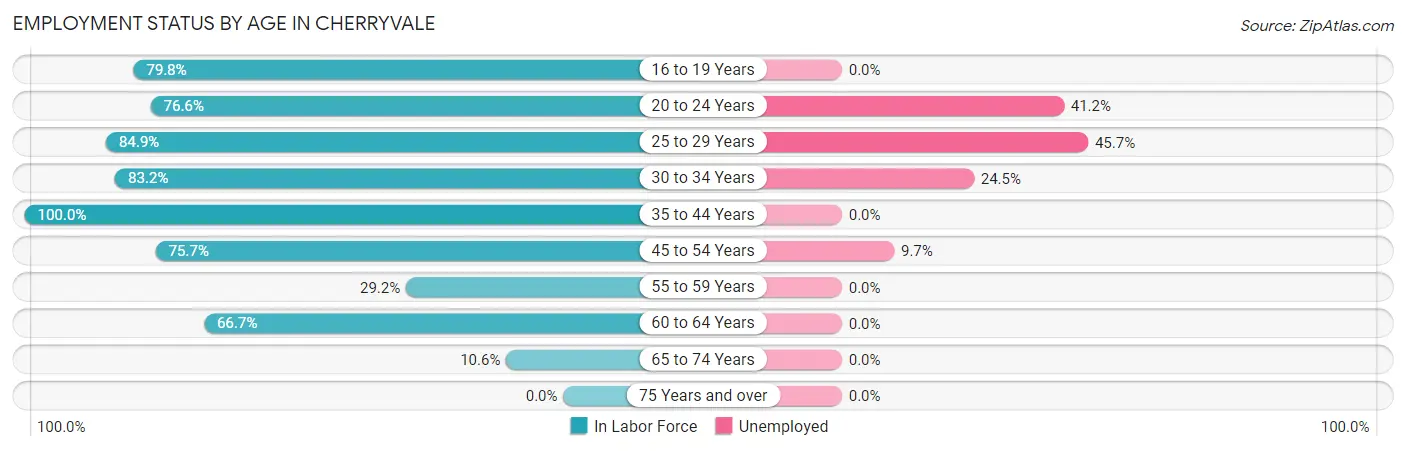
| Age Bracket | In Labor Force | Unemployed |
| 16 to 19 Years | 83 (79.8%) | 0 (0.0%) |
| 20 to 24 Years | 527 (76.6%) | 217 (41.2%) |
| 25 to 29 Years | 265 (84.9%) | 121 (45.7%) |
| 30 to 34 Years | 257 (83.2%) | 63 (24.5%) |
| 35 to 44 Years | 122 (100.0%) | 0 (0.0%) |
| 45 to 54 Years | 196 (75.7%) | 19 (9.7%) |
| 55 to 59 Years | 38 (29.2%) | 0 (0.0%) |
| 60 to 64 Years | 50 (66.7%) | 0 (0.0%) |
| 65 to 74 Years | 22 (10.6%) | 0 (0.0%) |
| 75 Years and over | 0 (0.0%) | 0 (0.0%) |
| Total | 1,560 (68.9%) | 415 (26.6%) |
Employment Status by Educational Attainment in Cherryvale
According to labor force statistics for Cherryvale, 76.9% of individuals (928) out of the total population between 25 and 64 years of age (1,207) are in the labor force, with 21.9% or 203 of them being unemployed. The group with the highest labor force participation rate are those with the educational attainment of less than high school, with 100.0% or 57 individuals in the labor force. Within the labor force, individuals with high school diploma education have the highest percentage of unemployment, with 34.1% or 203 of them being unemployed.
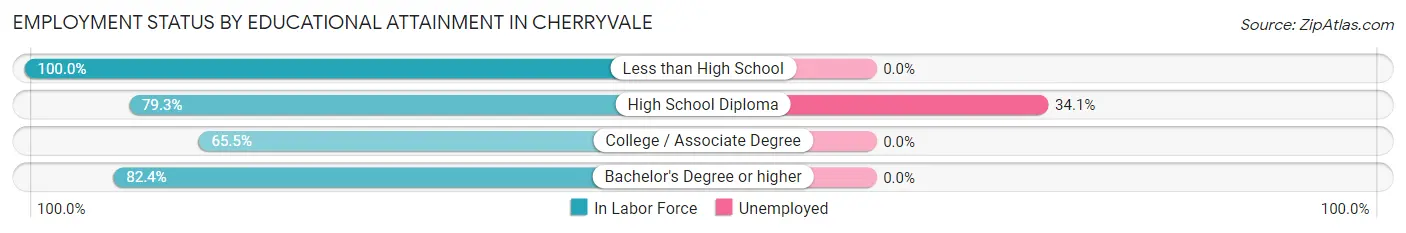
| Educational Attainment | In Labor Force | Unemployed |
| Less than High School | 57 (100.0%) | 0 (0.0%) |
| High School Diploma | 596 (79.3%) | 256 (34.1%) |
| College / Associate Degree | 205 (65.5%) | 0 (0.0%) |
| Bachelor's Degree or higher | 70 (82.4%) | 0 (0.0%) |
| Total | 928 (76.9%) | 264 (21.9%) |
Employment Occupations by Sex in Cherryvale
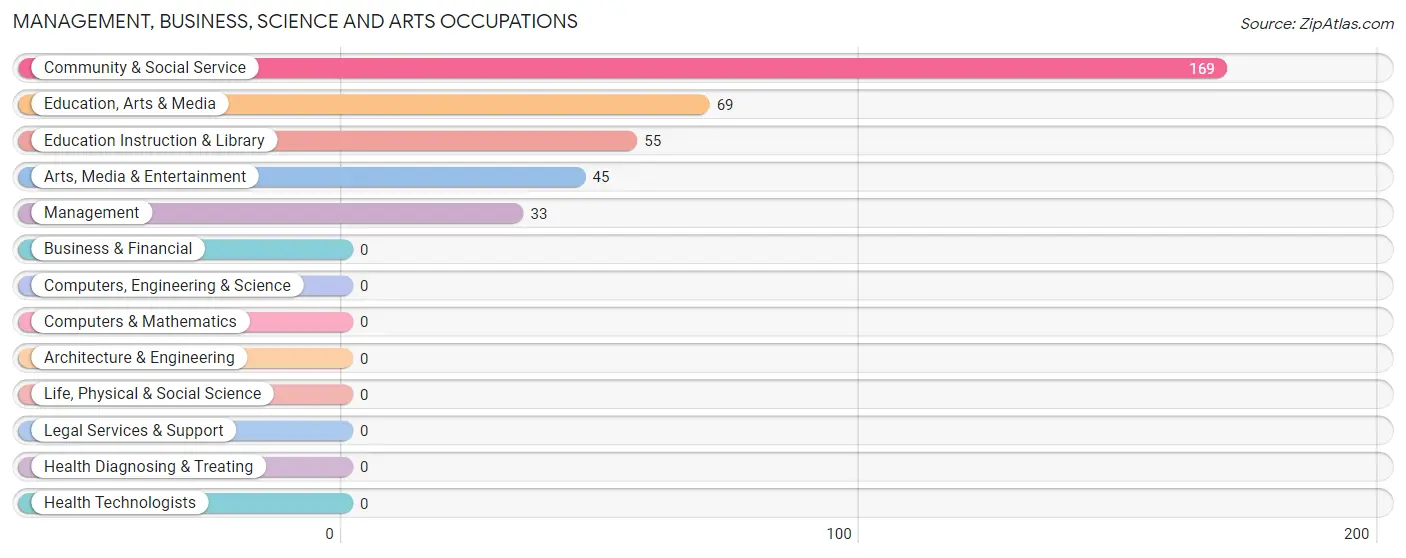
Management, Business, Science and Arts Occupations
The most common Management, Business, Science and Arts occupations in Cherryvale are Community & Social Service (169 | 15.1%), Education, Arts & Media (69 | 6.2%), Education Instruction & Library (55 | 4.9%), Arts, Media & Entertainment (45 | 4.0%), and Management (33 | 2.9%).
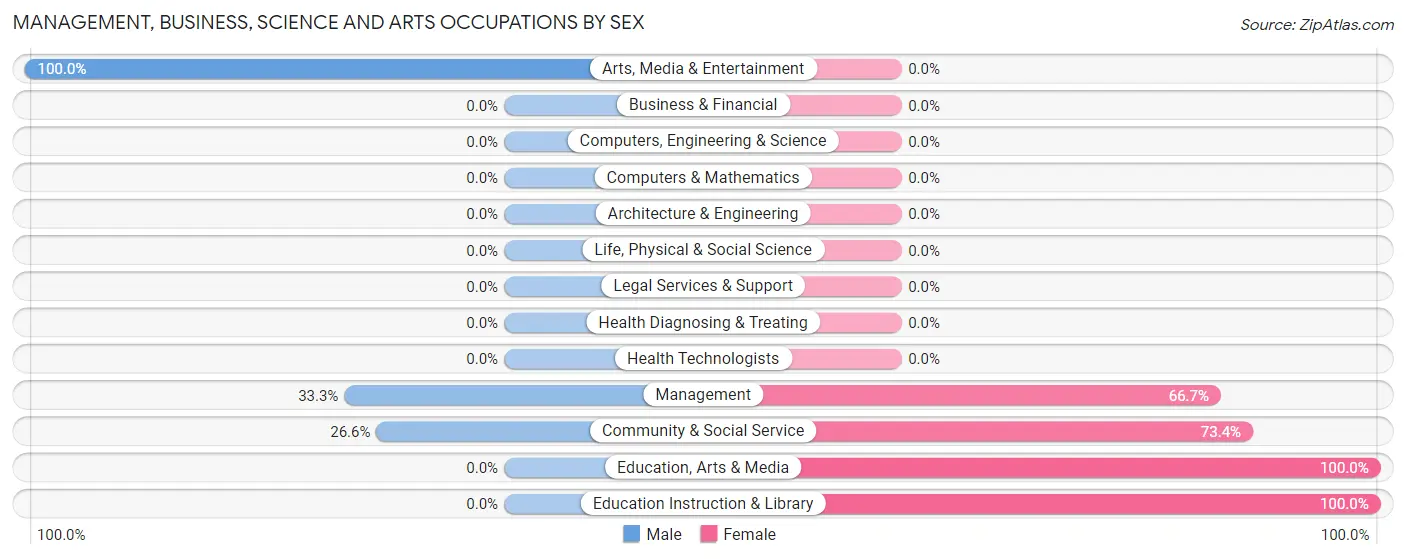
Management, Business, Science and Arts Occupations by Sex
Within the Management, Business, Science and Arts occupations in Cherryvale, the most male-oriented occupations are Arts, Media & Entertainment (100.0%), Management (33.3%), and Community & Social Service (26.6%), while the most female-oriented occupations are Education, Arts & Media (100.0%), Education Instruction & Library (100.0%), and Community & Social Service (73.4%).
| Occupation | Male | Female |
| Management | 11 (33.3%) | 22 (66.7%) |
| Business & Financial | 0 (0.0%) | 0 (0.0%) |
| Computers, Engineering & Science | 0 (0.0%) | 0 (0.0%) |
| Computers & Mathematics | 0 (0.0%) | 0 (0.0%) |
| Architecture & Engineering | 0 (0.0%) | 0 (0.0%) |
| Life, Physical & Social Science | 0 (0.0%) | 0 (0.0%) |
| Community & Social Service | 45 (26.6%) | 124 (73.4%) |
| Education, Arts & Media | 0 (0.0%) | 69 (100.0%) |
| Legal Services & Support | 0 (0.0%) | 0 (0.0%) |
| Education Instruction & Library | 0 (0.0%) | 55 (100.0%) |
| Arts, Media & Entertainment | 45 (100.0%) | 0 (0.0%) |
| Health Diagnosing & Treating | 0 (0.0%) | 0 (0.0%) |
| Health Technologists | 0 (0.0%) | 0 (0.0%) |
| Total (Category) | 56 (27.7%) | 146 (72.3%) |
| Total (Overall) | 550 (49.1%) | 571 (50.9%) |
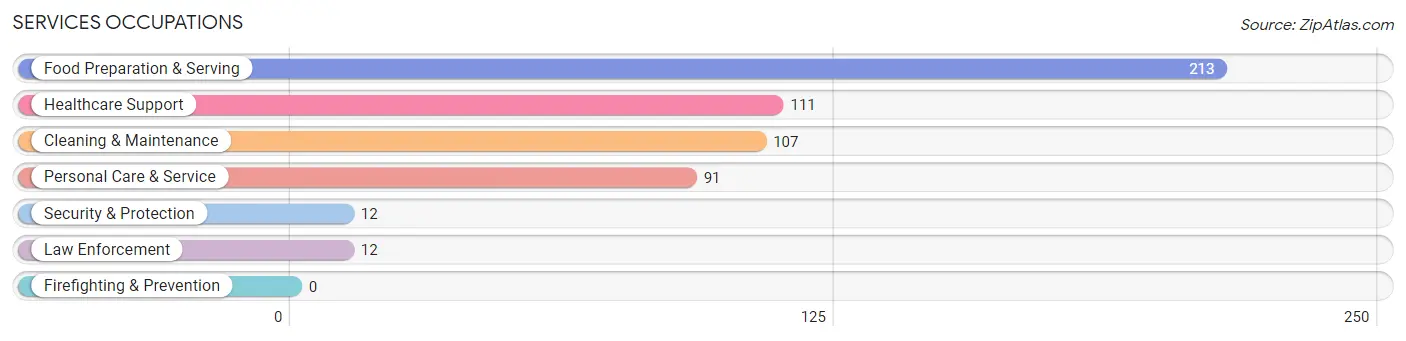
Services Occupations
The most common Services occupations in Cherryvale are Food Preparation & Serving (213 | 19.0%), Healthcare Support (111 | 9.9%), Cleaning & Maintenance (107 | 9.6%), Personal Care & Service (91 | 8.1%), and Security & Protection (12 | 1.1%).
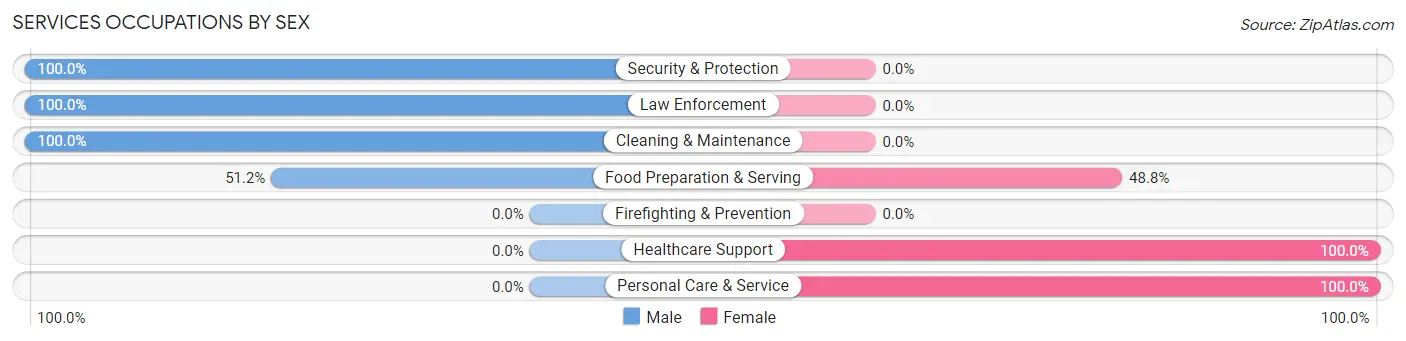
Services Occupations by Sex
Within the Services occupations in Cherryvale, the most male-oriented occupations are Security & Protection (100.0%), Law Enforcement (100.0%), and Cleaning & Maintenance (100.0%), while the most female-oriented occupations are Healthcare Support (100.0%), Personal Care & Service (100.0%), and Food Preparation & Serving (48.8%).
| Occupation | Male | Female |
| Healthcare Support | 0 (0.0%) | 111 (100.0%) |
| Security & Protection | 12 (100.0%) | 0 (0.0%) |
| Firefighting & Prevention | 0 (0.0%) | 0 (0.0%) |
| Law Enforcement | 12 (100.0%) | 0 (0.0%) |
| Food Preparation & Serving | 109 (51.2%) | 104 (48.8%) |
| Cleaning & Maintenance | 107 (100.0%) | 0 (0.0%) |
| Personal Care & Service | 0 (0.0%) | 91 (100.0%) |
| Total (Category) | 228 (42.7%) | 306 (57.3%) |
| Total (Overall) | 550 (49.1%) | 571 (50.9%) |
Sales and Office Occupations
The most common Sales and Office occupations in Cherryvale are Sales & Related (172 | 15.3%), and Office & Administration (16 | 1.4%).
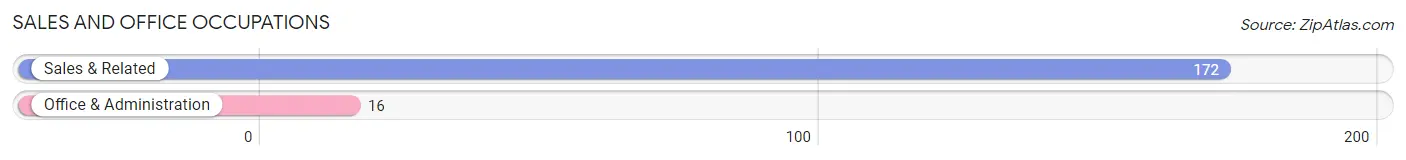
Sales and Office Occupations by Sex
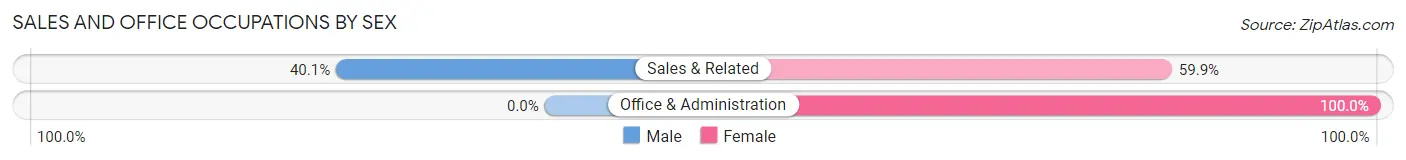
| Occupation | Male | Female |
| Sales & Related | 69 (40.1%) | 103 (59.9%) |
| Office & Administration | 0 (0.0%) | 16 (100.0%) |
| Total (Category) | 69 (36.7%) | 119 (63.3%) |
| Total (Overall) | 550 (49.1%) | 571 (50.9%) |
Natural Resources, Construction and Maintenance Occupations
The most common Natural Resources, Construction and Maintenance occupations in Cherryvale are Installation, Maintenance & Repair (67 | 6.0%), and Farming, Fishing & Forestry (56 | 5.0%).
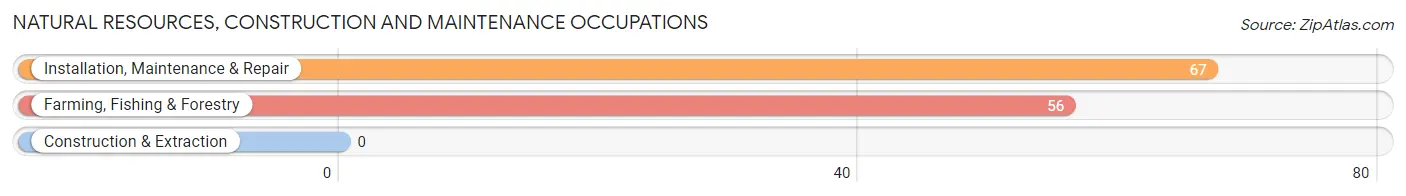
Natural Resources, Construction and Maintenance Occupations by Sex
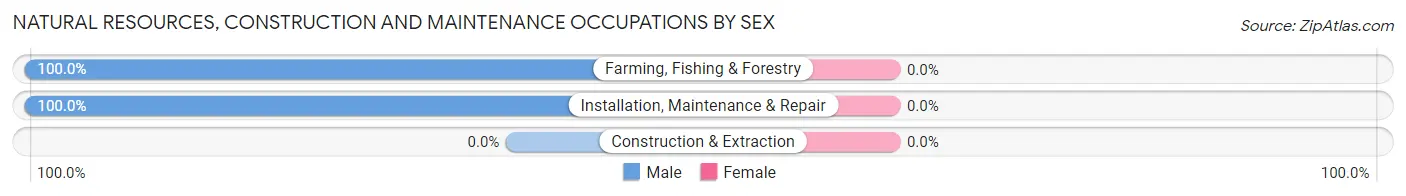
| Occupation | Male | Female |
| Farming, Fishing & Forestry | 56 (100.0%) | 0 (0.0%) |
| Construction & Extraction | 0 (0.0%) | 0 (0.0%) |
| Installation, Maintenance & Repair | 67 (100.0%) | 0 (0.0%) |
| Total (Category) | 123 (100.0%) | 0 (0.0%) |
| Total (Overall) | 550 (49.1%) | 571 (50.9%) |
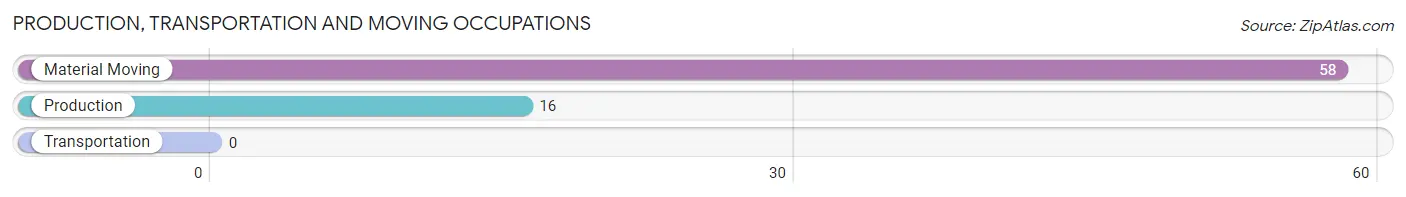
Production, Transportation and Moving Occupations
The most common Production, Transportation and Moving occupations in Cherryvale are Material Moving (58 | 5.2%), and Production (16 | 1.4%).
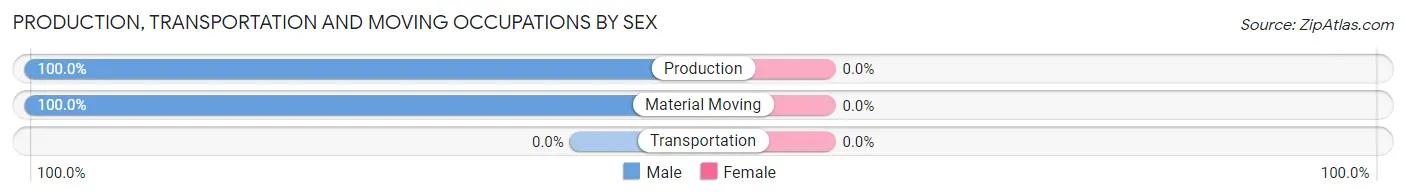
Production, Transportation and Moving Occupations by Sex
| Occupation | Male | Female |
| Production | 16 (100.0%) | 0 (0.0%) |
| Transportation | 0 (0.0%) | 0 (0.0%) |
| Material Moving | 58 (100.0%) | 0 (0.0%) |
| Total (Category) | 74 (100.0%) | 0 (0.0%) |
| Total (Overall) | 550 (49.1%) | 571 (50.9%) |
Employment Industries by Sex in Cherryvale
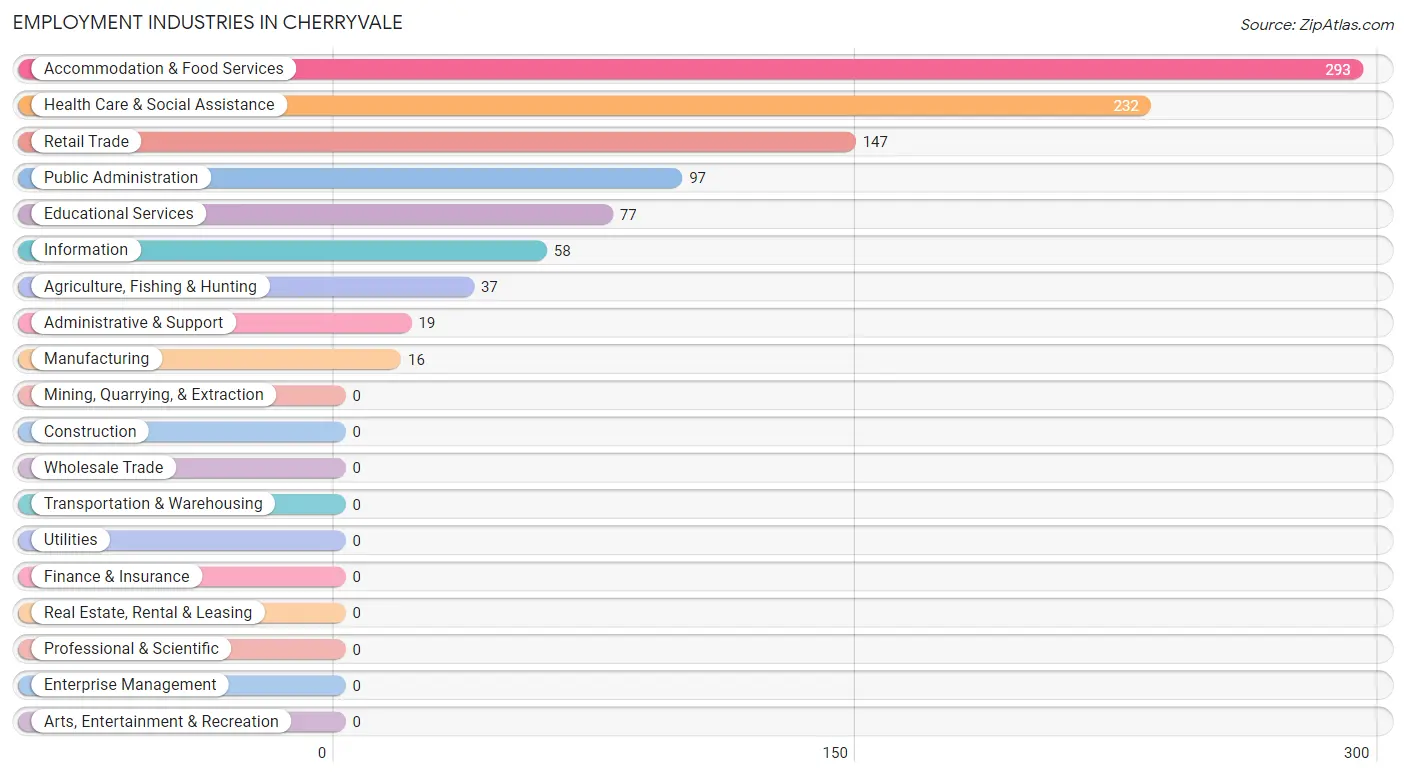
Employment Industries in Cherryvale
The major employment industries in Cherryvale include Accommodation & Food Services (293 | 26.1%), Health Care & Social Assistance (232 | 20.7%), Retail Trade (147 | 13.1%), Public Administration (97 | 8.6%), and Educational Services (77 | 6.9%).
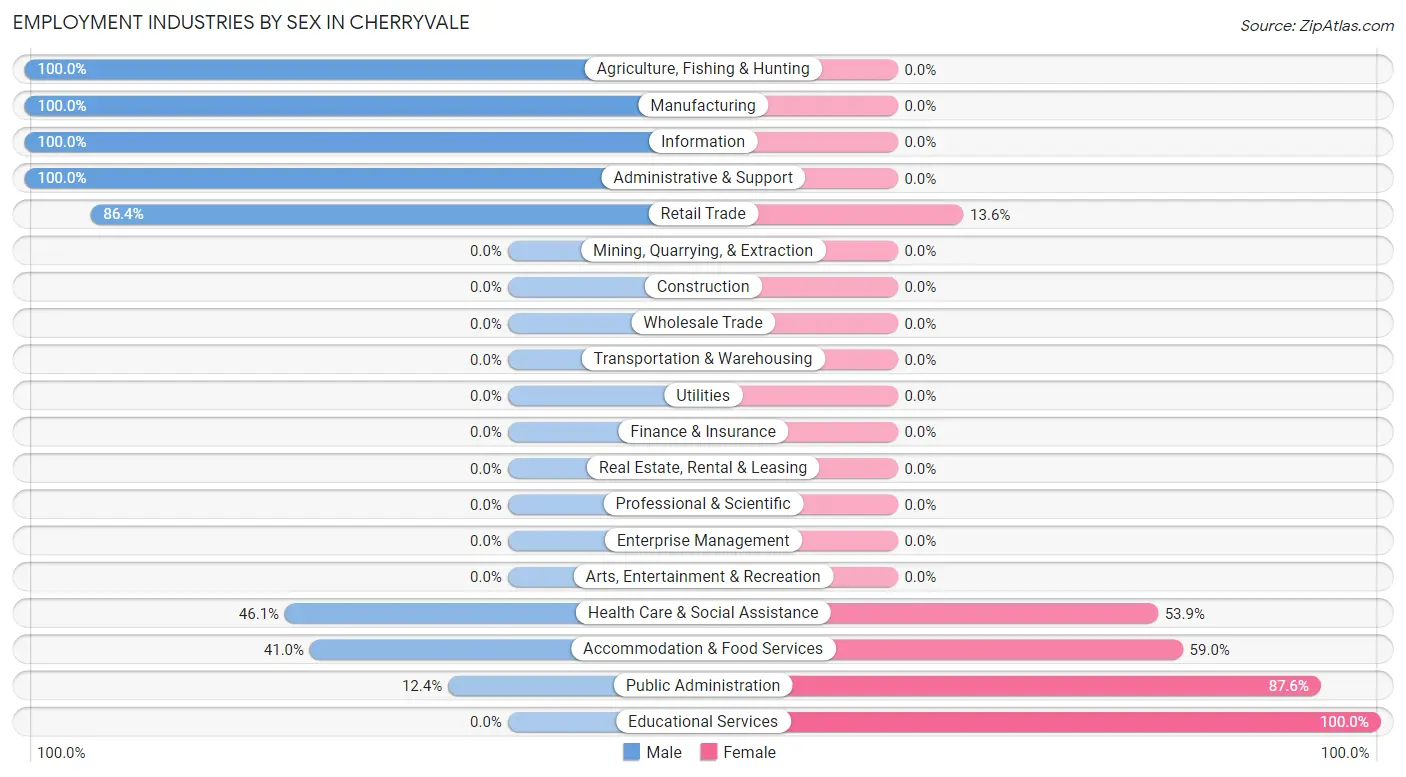
Employment Industries by Sex in Cherryvale
The Cherryvale industries that see more men than women are Agriculture, Fishing & Hunting (100.0%), Manufacturing (100.0%), and Information (100.0%), whereas the industries that tend to have a higher number of women are Educational Services (100.0%), Public Administration (87.6%), and Accommodation & Food Services (59.0%).
| Industry | Male | Female |
| Agriculture, Fishing & Hunting | 37 (100.0%) | 0 (0.0%) |
| Mining, Quarrying, & Extraction | 0 (0.0%) | 0 (0.0%) |
| Construction | 0 (0.0%) | 0 (0.0%) |
| Manufacturing | 16 (100.0%) | 0 (0.0%) |
| Wholesale Trade | 0 (0.0%) | 0 (0.0%) |
| Retail Trade | 127 (86.4%) | 20 (13.6%) |
| Transportation & Warehousing | 0 (0.0%) | 0 (0.0%) |
| Utilities | 0 (0.0%) | 0 (0.0%) |
| Information | 58 (100.0%) | 0 (0.0%) |
| Finance & Insurance | 0 (0.0%) | 0 (0.0%) |
| Real Estate, Rental & Leasing | 0 (0.0%) | 0 (0.0%) |
| Professional & Scientific | 0 (0.0%) | 0 (0.0%) |
| Enterprise Management | 0 (0.0%) | 0 (0.0%) |
| Administrative & Support | 19 (100.0%) | 0 (0.0%) |
| Educational Services | 0 (0.0%) | 77 (100.0%) |
| Health Care & Social Assistance | 107 (46.1%) | 125 (53.9%) |
| Arts, Entertainment & Recreation | 0 (0.0%) | 0 (0.0%) |
| Accommodation & Food Services | 120 (41.0%) | 173 (59.0%) |
| Public Administration | 12 (12.4%) | 85 (87.6%) |
| Total | 550 (49.1%) | 571 (50.9%) |
Education in Cherryvale
School Enrollment in Cherryvale
The most common levels of schooling among the 413 students in Cherryvale are graduate / professional (101 | 24.5%), nursery / preschool (84 | 20.3%), and elementary school (79 | 19.1%).
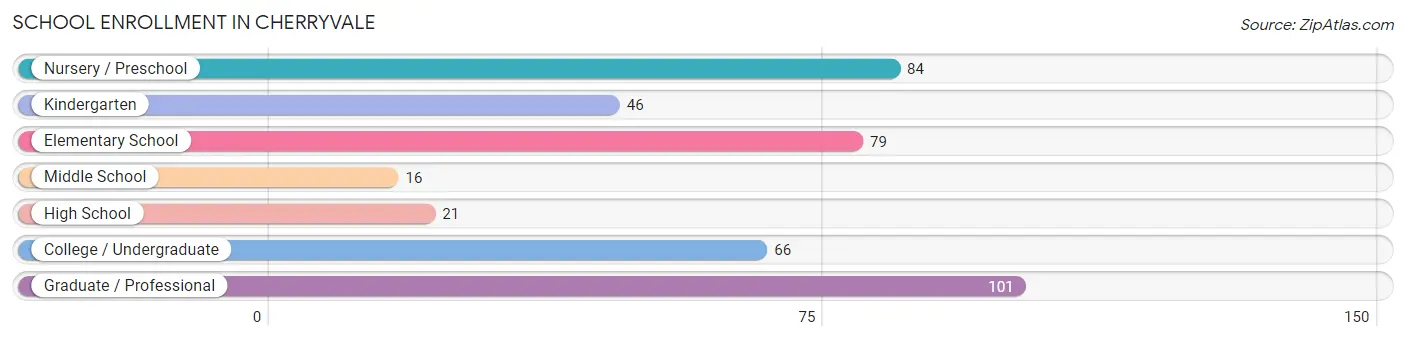
| School Level | # Students | % Students |
| Nursery / Preschool | 84 | 20.3% |
| Kindergarten | 46 | 11.1% |
| Elementary School | 79 | 19.1% |
| Middle School | 16 | 3.9% |
| High School | 21 | 5.1% |
| College / Undergraduate | 66 | 16.0% |
| Graduate / Professional | 101 | 24.5% |
| Total | 413 | 100.0% |
School Enrollment by Age by Funding Source in Cherryvale
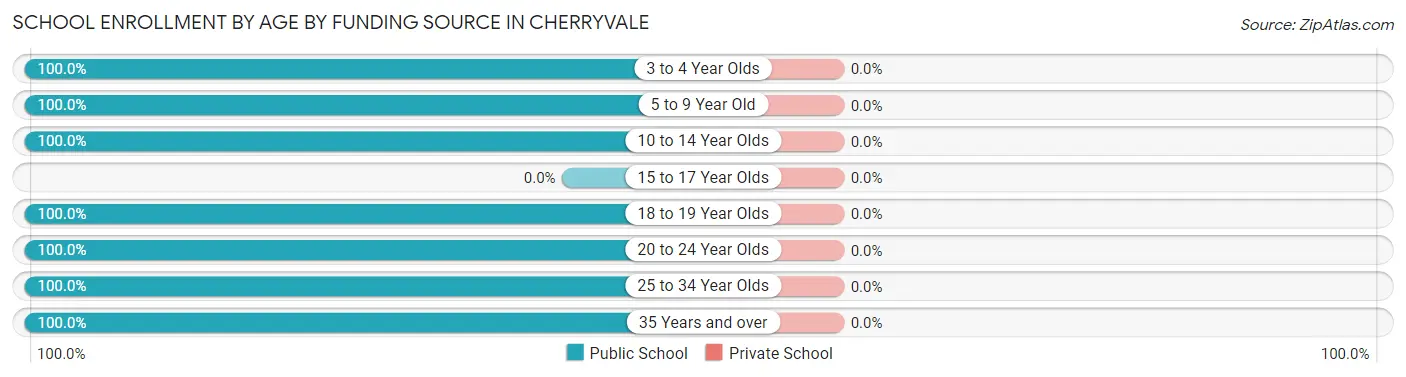
| Age Bracket | Public School | Private School |
| 3 to 4 Year Olds | 25 (100.0%) | 0 (0.0%) |
| 5 to 9 Year Old | 138 (100.0%) | 0 (0.0%) |
| 10 to 14 Year Olds | 62 (100.0%) | 0 (0.0%) |
| 15 to 17 Year Olds | 0 (0.0%) | 0 (0.0%) |
| 18 to 19 Year Olds | 21 (100.0%) | 0 (0.0%) |
| 20 to 24 Year Olds | 101 (100.0%) | 0 (0.0%) |
| 25 to 34 Year Olds | 52 (100.0%) | 0 (0.0%) |
| 35 Years and over | 14 (100.0%) | 0 (0.0%) |
| Total | 413 (100.0%) | 0 (0.0%) |
Educational Attainment by Field of Study in Cherryvale
Communications (45 | 41.3%), physical & health sciences (25 | 22.9%), liberal arts & history (15 | 13.8%), engineering (12 | 11.0%), and science & technology (12 | 11.0%) are the most common fields of study among 109 individuals in Cherryvale who have obtained a bachelor's degree or higher.
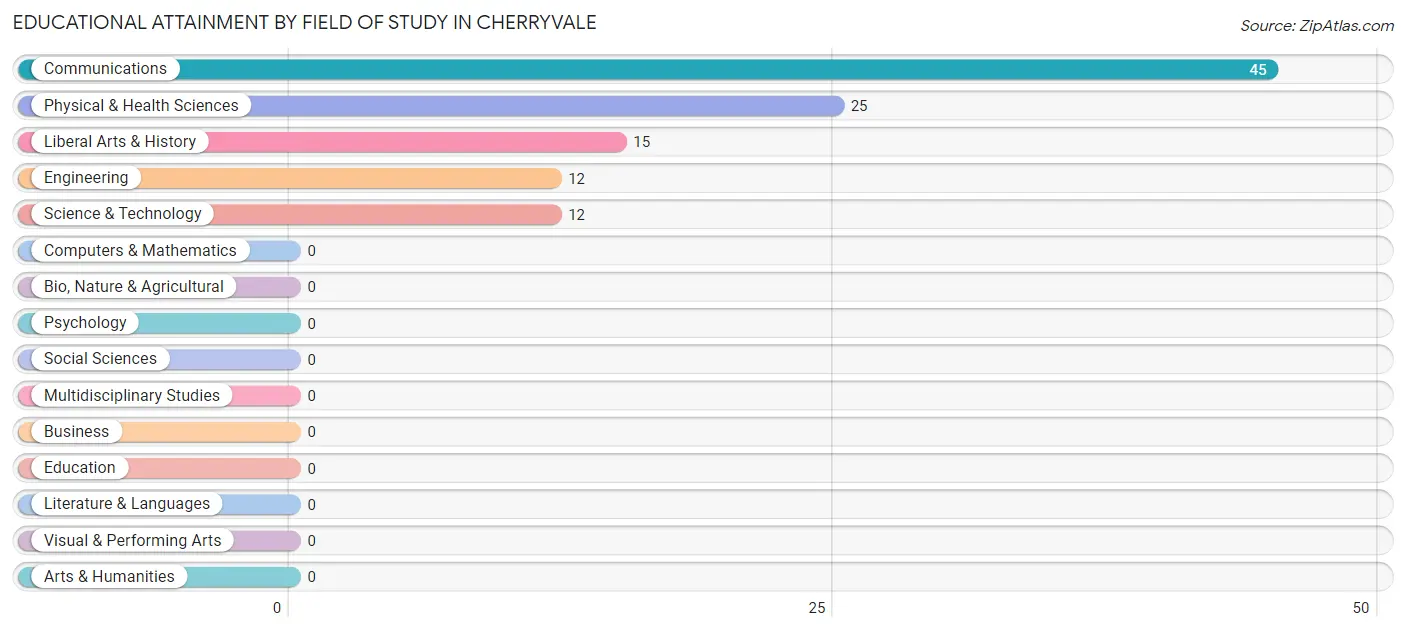
| Field of Study | # Graduates | % Graduates |
| Computers & Mathematics | 0 | 0.0% |
| Bio, Nature & Agricultural | 0 | 0.0% |
| Physical & Health Sciences | 25 | 22.9% |
| Psychology | 0 | 0.0% |
| Social Sciences | 0 | 0.0% |
| Engineering | 12 | 11.0% |
| Multidisciplinary Studies | 0 | 0.0% |
| Science & Technology | 12 | 11.0% |
| Business | 0 | 0.0% |
| Education | 0 | 0.0% |
| Literature & Languages | 0 | 0.0% |
| Liberal Arts & History | 15 | 13.8% |
| Visual & Performing Arts | 0 | 0.0% |
| Communications | 45 | 41.3% |
| Arts & Humanities | 0 | 0.0% |
| Total | 109 | 100.0% |
Transportation & Commute in Cherryvale
Vehicle Availability by Sex in Cherryvale
The most prevalent vehicle ownership categories in Cherryvale are males with 1 vehicle (222, accounting for 40.4%) and females with 1 vehicle (178, making up 39.0%).
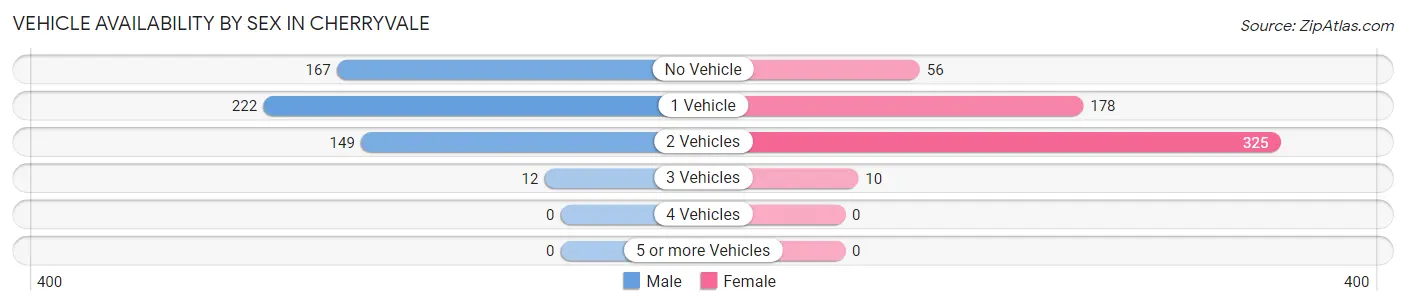
| Vehicles Available | Male | Female |
| No Vehicle | 167 (30.4%) | 56 (9.8%) |
| 1 Vehicle | 222 (40.4%) | 178 (31.3%) |
| 2 Vehicles | 149 (27.1%) | 325 (57.1%) |
| 3 Vehicles | 12 (2.2%) | 10 (1.8%) |
| 4 Vehicles | 0 (0.0%) | 0 (0.0%) |
| 5 or more Vehicles | 0 (0.0%) | 0 (0.0%) |
| Total | 550 (100.0%) | 569 (100.0%) |
Commute Time in Cherryvale
The most frequently occuring commute durations in Cherryvale are 15 to 19 minutes (426 commuters, 40.3%), 10 to 14 minutes (241 commuters, 22.8%), and 30 to 34 minutes (149 commuters, 14.1%).
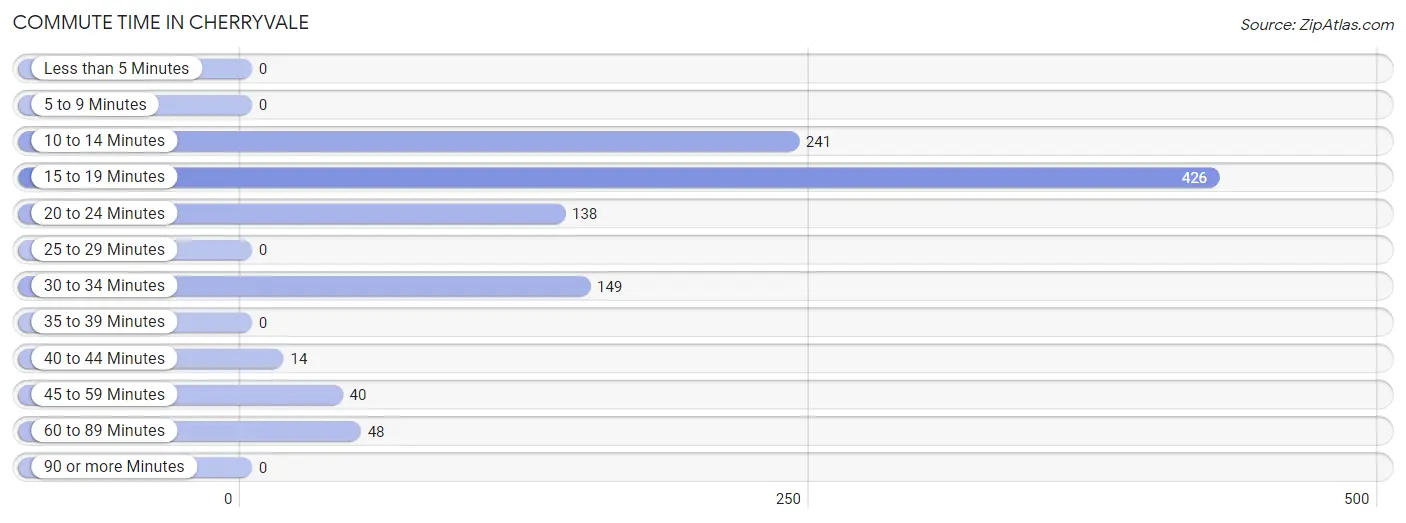
| Commute Time | # Commuters | % Commuters |
| Less than 5 Minutes | 0 | 0.0% |
| 5 to 9 Minutes | 0 | 0.0% |
| 10 to 14 Minutes | 241 | 22.8% |
| 15 to 19 Minutes | 426 | 40.3% |
| 20 to 24 Minutes | 138 | 13.1% |
| 25 to 29 Minutes | 0 | 0.0% |
| 30 to 34 Minutes | 149 | 14.1% |
| 35 to 39 Minutes | 0 | 0.0% |
| 40 to 44 Minutes | 14 | 1.3% |
| 45 to 59 Minutes | 40 | 3.8% |
| 60 to 89 Minutes | 48 | 4.5% |
| 90 or more Minutes | 0 | 0.0% |
Commute Time by Sex in Cherryvale
The most common commute times in Cherryvale are 10 to 14 minutes (159 commuters, 28.9%) for males and 15 to 19 minutes (309 commuters, 61.1%) for females.
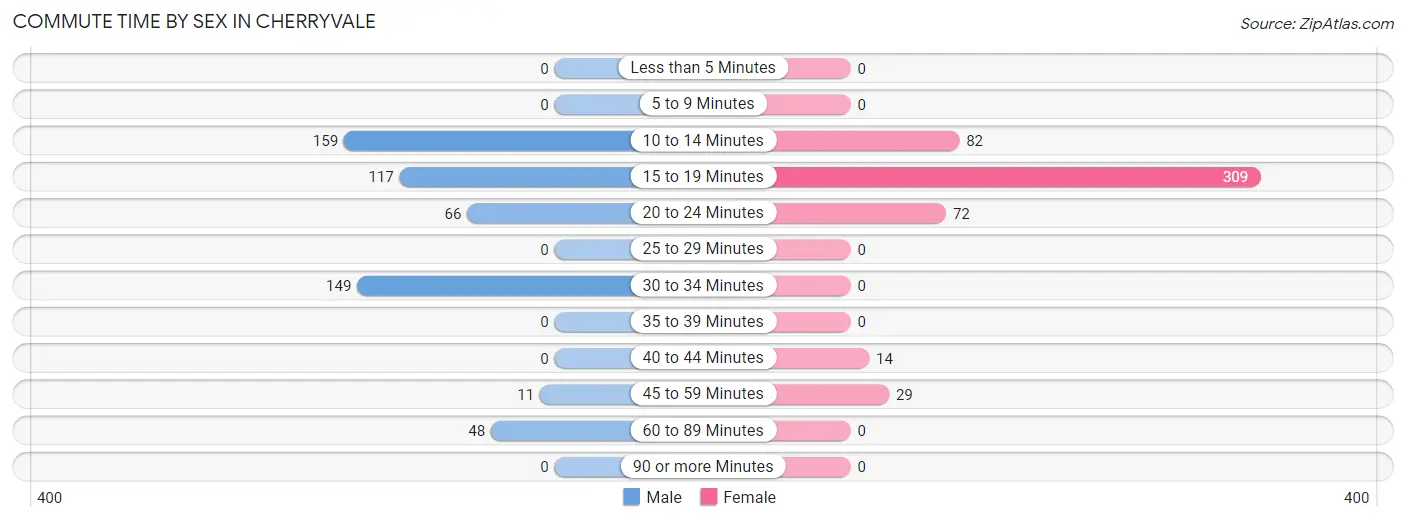
| Commute Time | Male | Female |
| Less than 5 Minutes | 0 (0.0%) | 0 (0.0%) |
| 5 to 9 Minutes | 0 (0.0%) | 0 (0.0%) |
| 10 to 14 Minutes | 159 (28.9%) | 82 (16.2%) |
| 15 to 19 Minutes | 117 (21.3%) | 309 (61.1%) |
| 20 to 24 Minutes | 66 (12.0%) | 72 (14.2%) |
| 25 to 29 Minutes | 0 (0.0%) | 0 (0.0%) |
| 30 to 34 Minutes | 149 (27.1%) | 0 (0.0%) |
| 35 to 39 Minutes | 0 (0.0%) | 0 (0.0%) |
| 40 to 44 Minutes | 0 (0.0%) | 14 (2.8%) |
| 45 to 59 Minutes | 11 (2.0%) | 29 (5.7%) |
| 60 to 89 Minutes | 48 (8.7%) | 0 (0.0%) |
| 90 or more Minutes | 0 (0.0%) | 0 (0.0%) |
Time of Departure to Work by Sex in Cherryvale
The most frequent times of departure to work in Cherryvale are 6:00 AM to 6:29 AM (154, 28.0%) for males and 12:00 AM to 4:59 AM (139, 27.5%) for females.
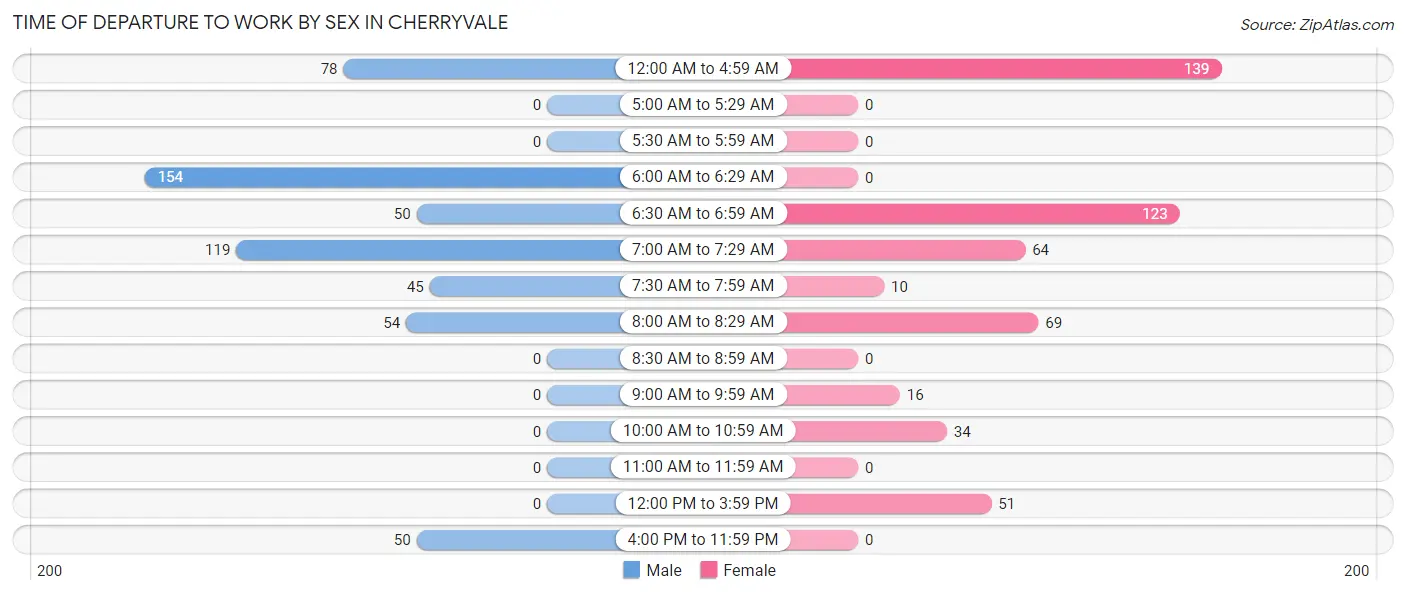
| Time of Departure | Male | Female |
| 12:00 AM to 4:59 AM | 78 (14.2%) | 139 (27.5%) |
| 5:00 AM to 5:29 AM | 0 (0.0%) | 0 (0.0%) |
| 5:30 AM to 5:59 AM | 0 (0.0%) | 0 (0.0%) |
| 6:00 AM to 6:29 AM | 154 (28.0%) | 0 (0.0%) |
| 6:30 AM to 6:59 AM | 50 (9.1%) | 123 (24.3%) |
| 7:00 AM to 7:29 AM | 119 (21.6%) | 64 (12.7%) |
| 7:30 AM to 7:59 AM | 45 (8.2%) | 10 (2.0%) |
| 8:00 AM to 8:29 AM | 54 (9.8%) | 69 (13.6%) |
| 8:30 AM to 8:59 AM | 0 (0.0%) | 0 (0.0%) |
| 9:00 AM to 9:59 AM | 0 (0.0%) | 16 (3.2%) |
| 10:00 AM to 10:59 AM | 0 (0.0%) | 34 (6.7%) |
| 11:00 AM to 11:59 AM | 0 (0.0%) | 0 (0.0%) |
| 12:00 PM to 3:59 PM | 0 (0.0%) | 51 (10.1%) |
| 4:00 PM to 11:59 PM | 50 (9.1%) | 0 (0.0%) |
| Total | 550 (100.0%) | 506 (100.0%) |
Housing Occupancy in Cherryvale
Occupancy by Ownership in Cherryvale
Of the total 1,189 dwellings in Cherryvale, owner-occupied units account for 422 (35.5%), while renter-occupied units make up 767 (64.5%).
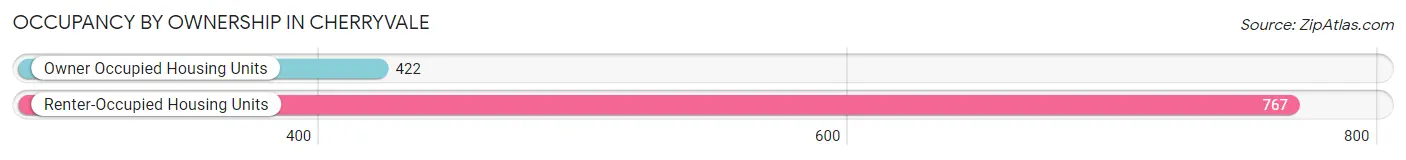
| Occupancy | # Housing Units | % Housing Units |
| Owner Occupied Housing Units | 422 | 35.5% |
| Renter-Occupied Housing Units | 767 | 64.5% |
| Total Occupied Housing Units | 1,189 | 100.0% |
Occupancy by Household Size in Cherryvale
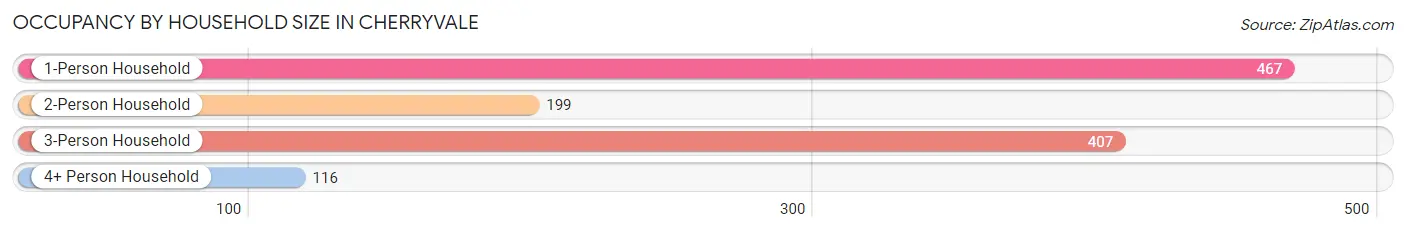
| Household Size | # Housing Units | % Housing Units |
| 1-Person Household | 467 | 39.3% |
| 2-Person Household | 199 | 16.7% |
| 3-Person Household | 407 | 34.2% |
| 4+ Person Household | 116 | 9.8% |
| Total Housing Units | 1,189 | 100.0% |
Occupancy by Ownership by Household Size in Cherryvale
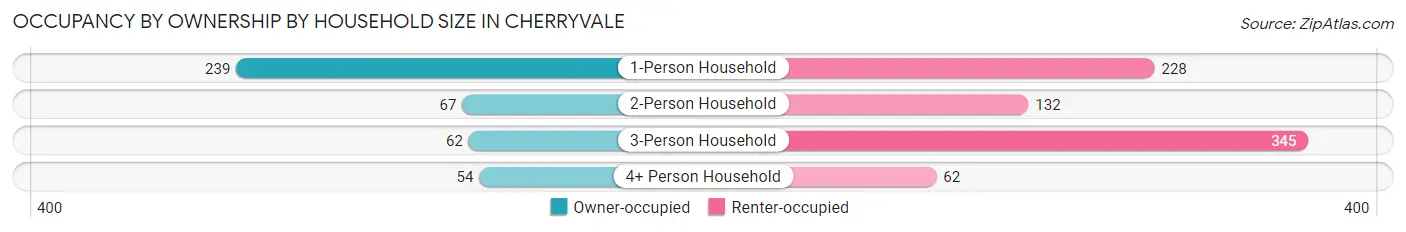
| Household Size | Owner-occupied | Renter-occupied |
| 1-Person Household | 239 (51.2%) | 228 (48.8%) |
| 2-Person Household | 67 (33.7%) | 132 (66.3%) |
| 3-Person Household | 62 (15.2%) | 345 (84.8%) |
| 4+ Person Household | 54 (46.6%) | 62 (53.4%) |
| Total Housing Units | 422 (35.5%) | 767 (64.5%) |
Occupancy by Educational Attainment in Cherryvale
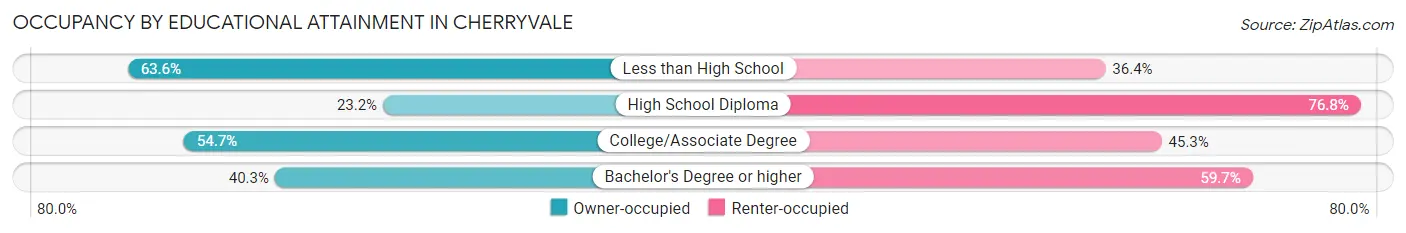
| Household Size | Owner-occupied | Renter-occupied |
| Less than High School | 28 (63.6%) | 16 (36.4%) |
| High School Diploma | 157 (23.2%) | 521 (76.8%) |
| College/Associate Degree | 185 (54.7%) | 153 (45.3%) |
| Bachelor's Degree or higher | 52 (40.3%) | 77 (59.7%) |
Occupancy by Age of Householder in Cherryvale
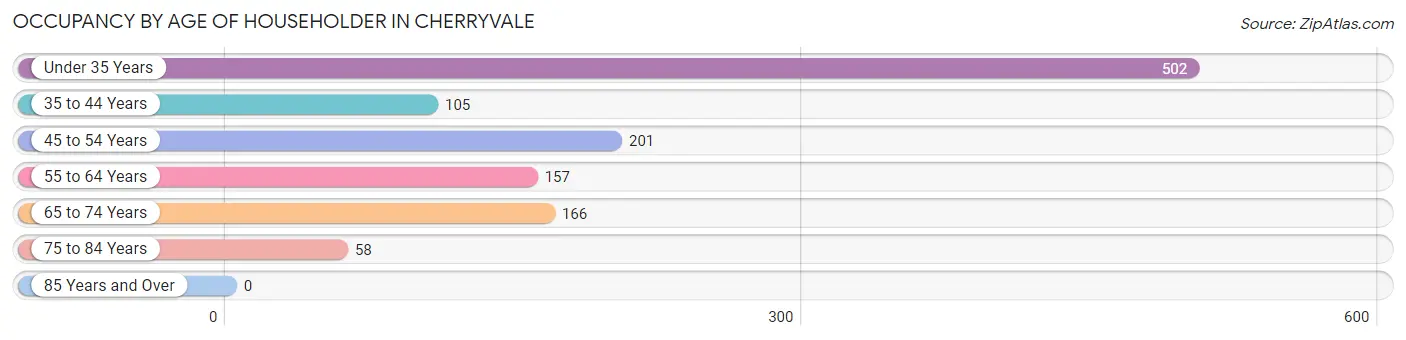
| Age Bracket | # Households | % Households |
| Under 35 Years | 502 | 42.2% |
| 35 to 44 Years | 105 | 8.8% |
| 45 to 54 Years | 201 | 16.9% |
| 55 to 64 Years | 157 | 13.2% |
| 65 to 74 Years | 166 | 14.0% |
| 75 to 84 Years | 58 | 4.9% |
| 85 Years and Over | 0 | 0.0% |
| Total | 1,189 | 100.0% |
Housing Finances in Cherryvale
Median Income by Occupancy in Cherryvale
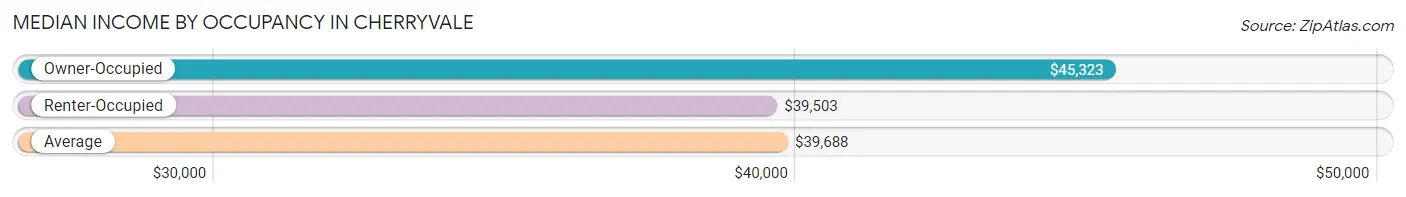
| Occupancy Type | # Households | Median Income |
| Owner-Occupied | 422 (35.5%) | $45,323 |
| Renter-Occupied | 767 (64.5%) | $39,503 |
| Average | 1,189 (100.0%) | $39,688 |
Occupancy by Householder Income Bracket in Cherryvale
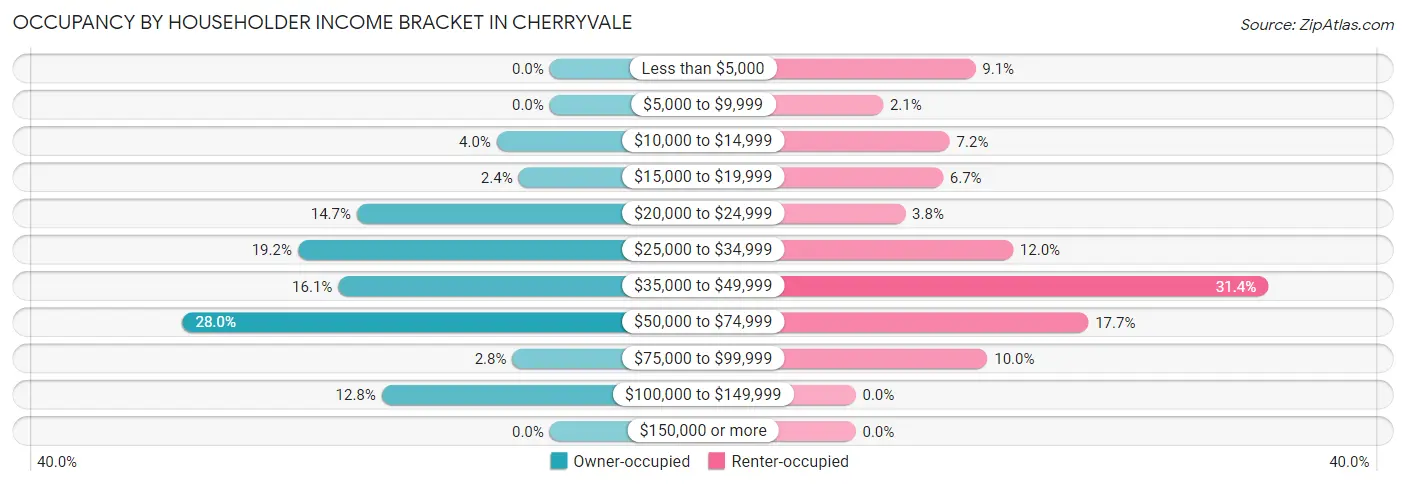
| Income Bracket | Owner-occupied | Renter-occupied |
| Less than $5,000 | 0 (0.0%) | 70 (9.1%) |
| $5,000 to $9,999 | 0 (0.0%) | 16 (2.1%) |
| $10,000 to $14,999 | 17 (4.0%) | 55 (7.2%) |
| $15,000 to $19,999 | 10 (2.4%) | 51 (6.7%) |
| $20,000 to $24,999 | 62 (14.7%) | 29 (3.8%) |
| $25,000 to $34,999 | 81 (19.2%) | 92 (12.0%) |
| $35,000 to $49,999 | 68 (16.1%) | 241 (31.4%) |
| $50,000 to $74,999 | 118 (28.0%) | 136 (17.7%) |
| $75,000 to $99,999 | 12 (2.8%) | 77 (10.0%) |
| $100,000 to $149,999 | 54 (12.8%) | 0 (0.0%) |
| $150,000 or more | 0 (0.0%) | 0 (0.0%) |
| Total | 422 (100.0%) | 767 (100.0%) |
Monthly Housing Cost Tiers in Cherryvale
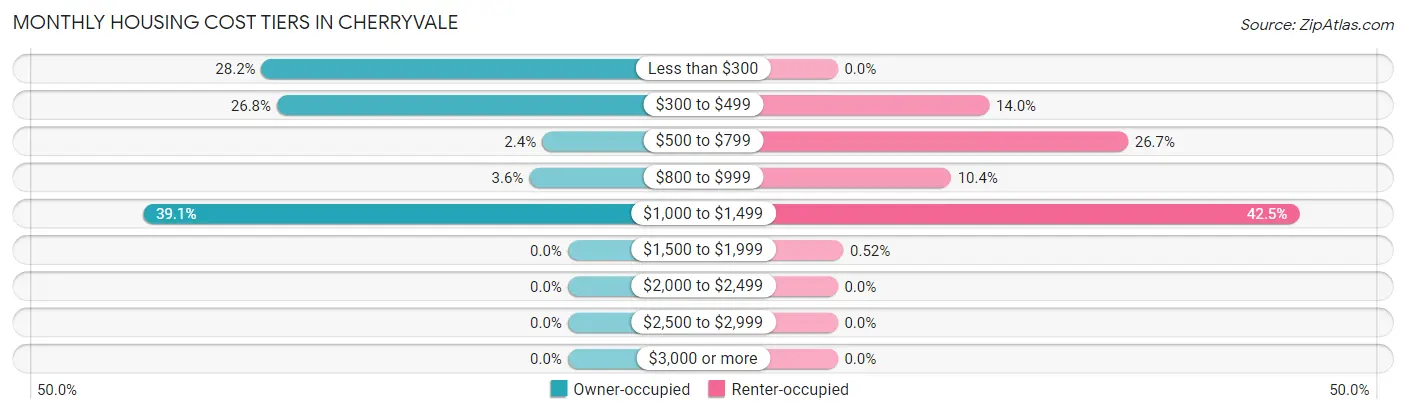
| Monthly Cost | Owner-occupied | Renter-occupied |
| Less than $300 | 119 (28.2%) | 0 (0.0%) |
| $300 to $499 | 113 (26.8%) | 107 (14.0%) |
| $500 to $799 | 10 (2.4%) | 205 (26.7%) |
| $800 to $999 | 15 (3.5%) | 80 (10.4%) |
| $1,000 to $1,499 | 165 (39.1%) | 326 (42.5%) |
| $1,500 to $1,999 | 0 (0.0%) | 4 (0.5%) |
| $2,000 to $2,499 | 0 (0.0%) | 0 (0.0%) |
| $2,500 to $2,999 | 0 (0.0%) | 0 (0.0%) |
| $3,000 or more | 0 (0.0%) | 0 (0.0%) |
| Total | 422 (100.0%) | 767 (100.0%) |
Physical Housing Characteristics in Cherryvale
Housing Structures in Cherryvale
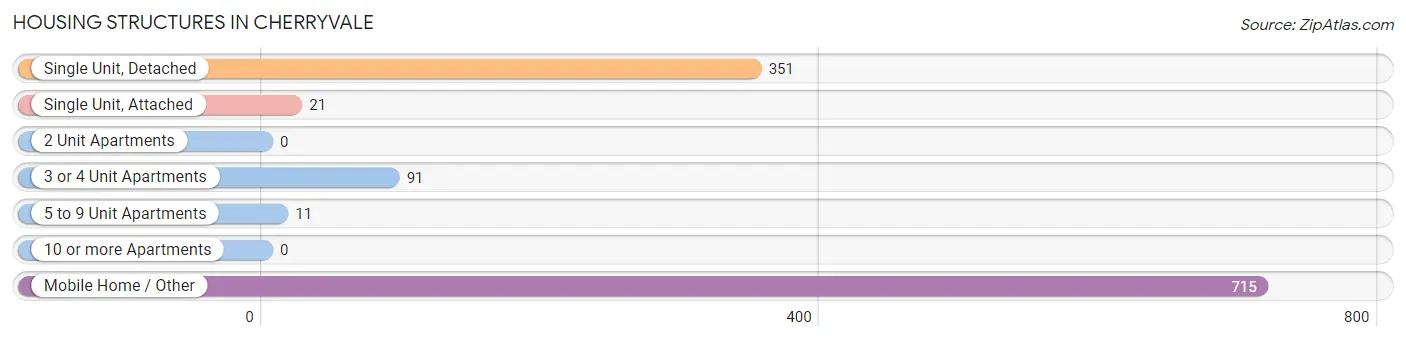
| Structure Type | # Housing Units | % Housing Units |
| Single Unit, Detached | 351 | 29.5% |
| Single Unit, Attached | 21 | 1.8% |
| 2 Unit Apartments | 0 | 0.0% |
| 3 or 4 Unit Apartments | 91 | 7.6% |
| 5 to 9 Unit Apartments | 11 | 0.9% |
| 10 or more Apartments | 0 | 0.0% |
| Mobile Home / Other | 715 | 60.1% |
| Total | 1,189 | 100.0% |
Housing Structures by Occupancy in Cherryvale
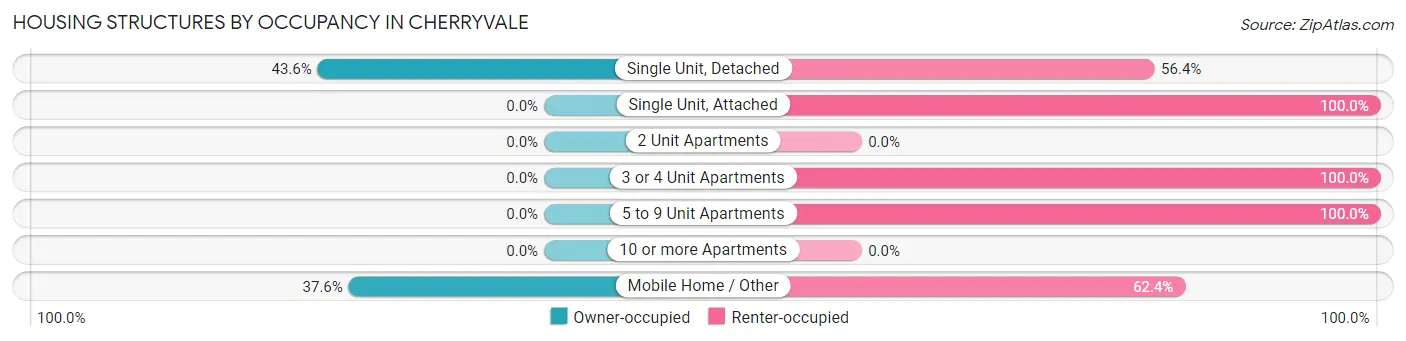
| Structure Type | Owner-occupied | Renter-occupied |
| Single Unit, Detached | 153 (43.6%) | 198 (56.4%) |
| Single Unit, Attached | 0 (0.0%) | 21 (100.0%) |
| 2 Unit Apartments | 0 (0.0%) | 0 (0.0%) |
| 3 or 4 Unit Apartments | 0 (0.0%) | 91 (100.0%) |
| 5 to 9 Unit Apartments | 0 (0.0%) | 11 (100.0%) |
| 10 or more Apartments | 0 (0.0%) | 0 (0.0%) |
| Mobile Home / Other | 269 (37.6%) | 446 (62.4%) |
| Total | 422 (35.5%) | 767 (64.5%) |
Housing Structures by Number of Rooms in Cherryvale
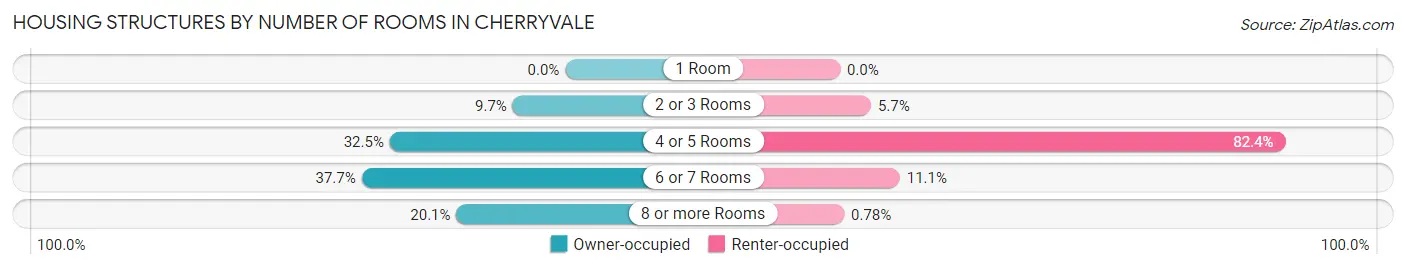
| Number of Rooms | Owner-occupied | Renter-occupied |
| 1 Room | 0 (0.0%) | 0 (0.0%) |
| 2 or 3 Rooms | 41 (9.7%) | 44 (5.7%) |
| 4 or 5 Rooms | 137 (32.5%) | 632 (82.4%) |
| 6 or 7 Rooms | 159 (37.7%) | 85 (11.1%) |
| 8 or more Rooms | 85 (20.1%) | 6 (0.8%) |
| Total | 422 (100.0%) | 767 (100.0%) |
Housing Structure by Heating Type in Cherryvale
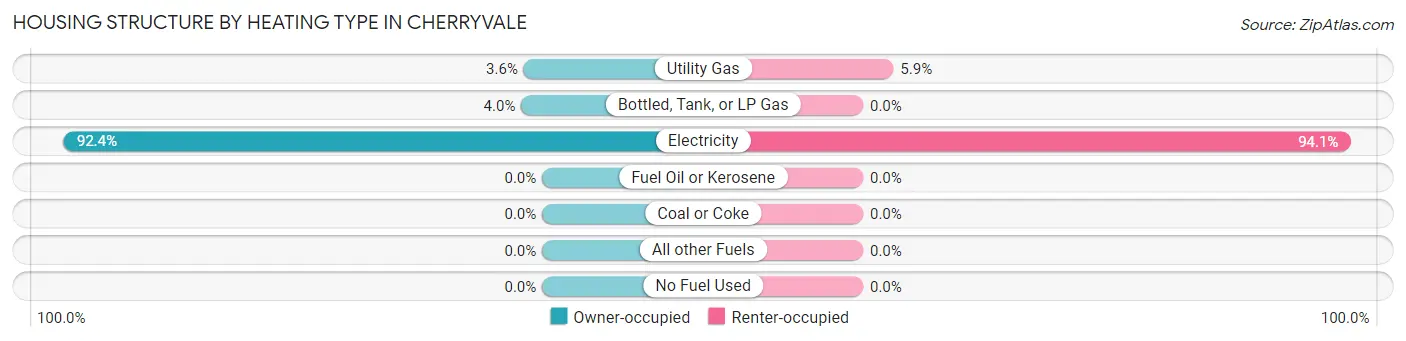
| Heating Type | Owner-occupied | Renter-occupied |
| Utility Gas | 15 (3.5%) | 45 (5.9%) |
| Bottled, Tank, or LP Gas | 17 (4.0%) | 0 (0.0%) |
| Electricity | 390 (92.4%) | 722 (94.1%) |
| Fuel Oil or Kerosene | 0 (0.0%) | 0 (0.0%) |
| Coal or Coke | 0 (0.0%) | 0 (0.0%) |
| All other Fuels | 0 (0.0%) | 0 (0.0%) |
| No Fuel Used | 0 (0.0%) | 0 (0.0%) |
| Total | 422 (100.0%) | 767 (100.0%) |
Household Vehicle Usage in Cherryvale
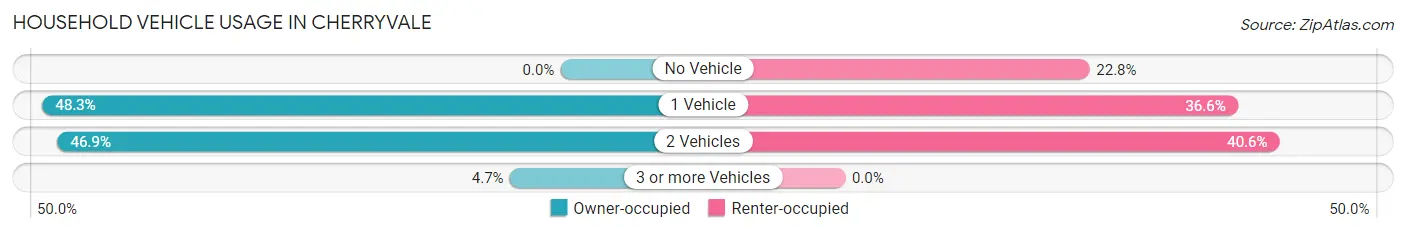
| Vehicles per Household | Owner-occupied | Renter-occupied |
| No Vehicle | 0 (0.0%) | 175 (22.8%) |
| 1 Vehicle | 204 (48.3%) | 281 (36.6%) |
| 2 Vehicles | 198 (46.9%) | 311 (40.6%) |
| 3 or more Vehicles | 20 (4.7%) | 0 (0.0%) |
| Total | 422 (100.0%) | 767 (100.0%) |
Real Estate & Mortgages in Cherryvale
Real Estate and Mortgage Overview in Cherryvale
| Characteristic | Without Mortgage | With Mortgage |
| Housing Units | 232 | 190 |
| Median Property Value | $53,100 | $121,300 |
| Median Household Income | - | - |
| Monthly Housing Costs | $297 | $0 |
| Real Estate Taxes | $313 | $0 |
Property Value by Mortgage Status in Cherryvale
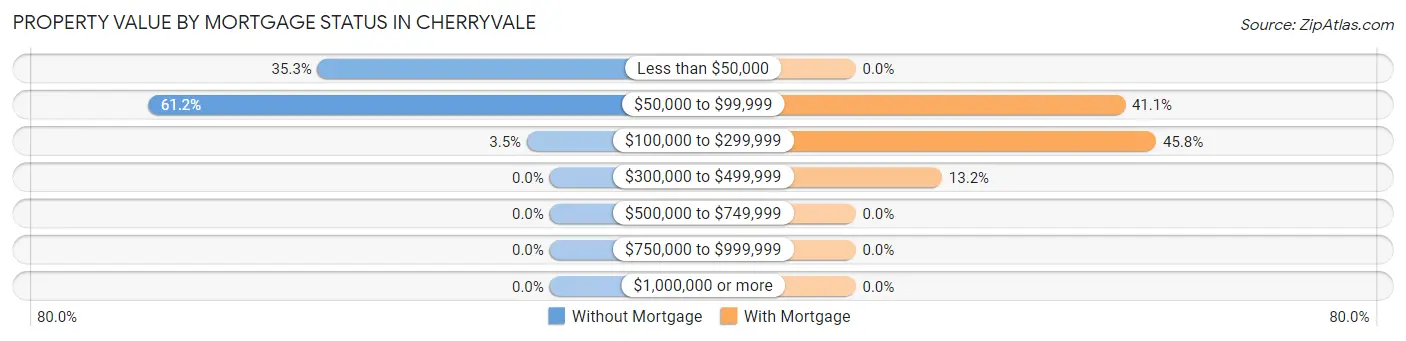
| Property Value | Without Mortgage | With Mortgage |
| Less than $50,000 | 82 (35.3%) | 0 (0.0%) |
| $50,000 to $99,999 | 142 (61.2%) | 78 (41.0%) |
| $100,000 to $299,999 | 8 (3.5%) | 87 (45.8%) |
| $300,000 to $499,999 | 0 (0.0%) | 25 (13.2%) |
| $500,000 to $749,999 | 0 (0.0%) | 0 (0.0%) |
| $750,000 to $999,999 | 0 (0.0%) | 0 (0.0%) |
| $1,000,000 or more | 0 (0.0%) | 0 (0.0%) |
| Total | 232 (100.0%) | 190 (100.0%) |
Household Income by Mortgage Status in Cherryvale
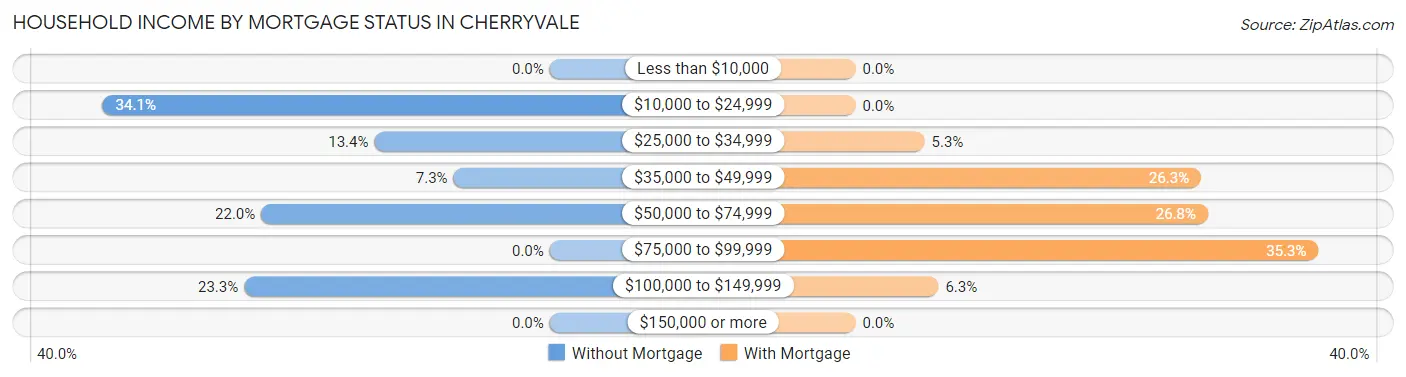
| Household Income | Without Mortgage | With Mortgage |
| Less than $10,000 | 0 (0.0%) | 0 (0.0%) |
| $10,000 to $24,999 | 79 (34.1%) | 0 (0.0%) |
| $25,000 to $34,999 | 31 (13.4%) | 10 (5.3%) |
| $35,000 to $49,999 | 17 (7.3%) | 50 (26.3%) |
| $50,000 to $74,999 | 51 (22.0%) | 51 (26.8%) |
| $75,000 to $99,999 | 0 (0.0%) | 67 (35.3%) |
| $100,000 to $149,999 | 54 (23.3%) | 12 (6.3%) |
| $150,000 or more | 0 (0.0%) | 0 (0.0%) |
| Total | 232 (100.0%) | 190 (100.0%) |
Property Value to Household Income Ratio in Cherryvale
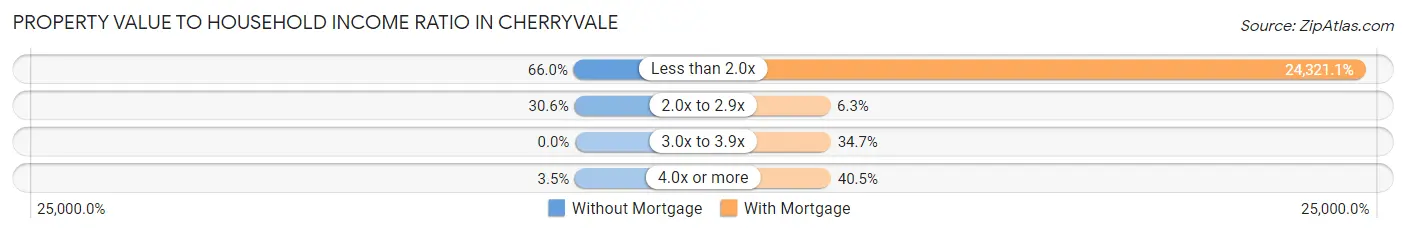
| Value-to-Income Ratio | Without Mortgage | With Mortgage |
| Less than 2.0x | 153 (65.9%) | 46,210 (24,321.0%) |
| 2.0x to 2.9x | 71 (30.6%) | 12 (6.3%) |
| 3.0x to 3.9x | 0 (0.0%) | 66 (34.7%) |
| 4.0x or more | 8 (3.5%) | 77 (40.5%) |
| Total | 232 (100.0%) | 190 (100.0%) |
Real Estate Taxes by Mortgage Status in Cherryvale
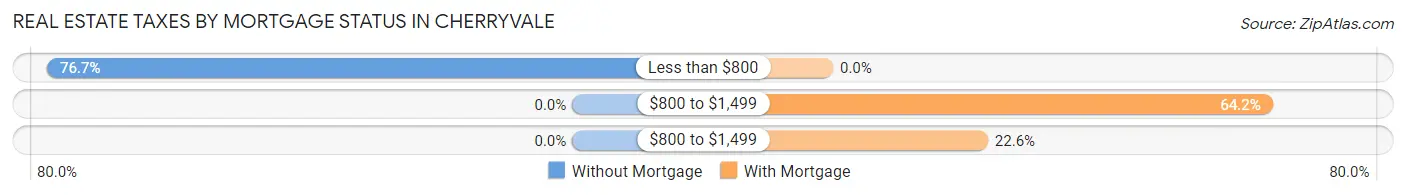
| Property Taxes | Without Mortgage | With Mortgage |
| Less than $800 | 178 (76.7%) | 0 (0.0%) |
| $800 to $1,499 | 0 (0.0%) | 122 (64.2%) |
| $800 to $1,499 | 0 (0.0%) | 43 (22.6%) |
| Total | 232 (100.0%) | 190 (100.0%) |
Health & Disability in Cherryvale
Health Insurance Coverage by Age in Cherryvale
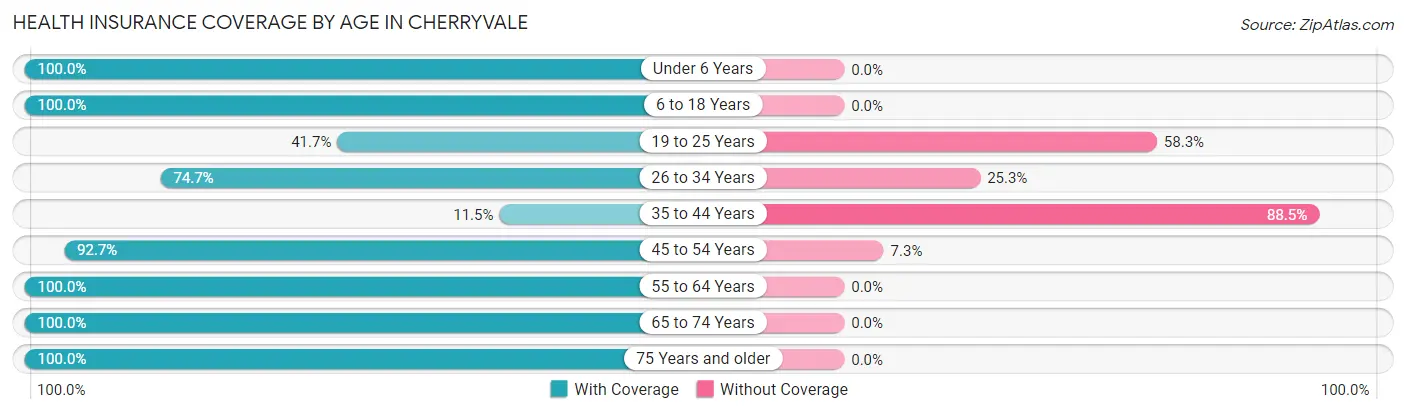
| Age Bracket | With Coverage | Without Coverage |
| Under 6 Years | 424 (100.0%) | 0 (0.0%) |
| 6 to 18 Years | 259 (100.0%) | 0 (0.0%) |
| 19 to 25 Years | 289 (41.7%) | 404 (58.3%) |
| 26 to 34 Years | 436 (74.7%) | 148 (25.3%) |
| 35 to 44 Years | 14 (11.5%) | 108 (88.5%) |
| 45 to 54 Years | 240 (92.7%) | 19 (7.3%) |
| 55 to 64 Years | 205 (100.0%) | 0 (0.0%) |
| 65 to 74 Years | 207 (100.0%) | 0 (0.0%) |
| 75 Years and older | 58 (100.0%) | 0 (0.0%) |
| Total | 2,132 (75.8%) | 679 (24.2%) |
Health Insurance Coverage by Citizenship Status in Cherryvale
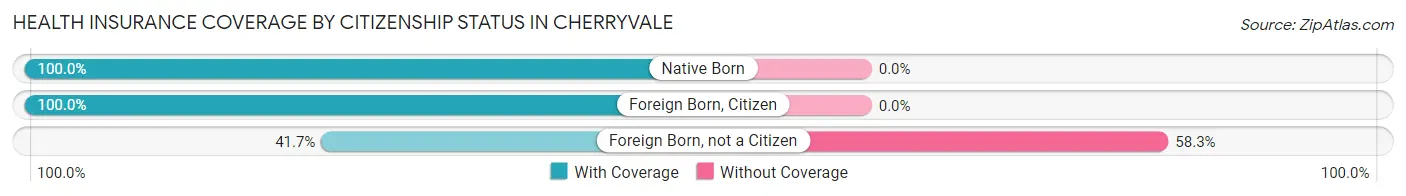
| Citizenship Status | With Coverage | Without Coverage |
| Native Born | 424 (100.0%) | 0 (0.0%) |
| Foreign Born, Citizen | 259 (100.0%) | 0 (0.0%) |
| Foreign Born, not a Citizen | 289 (41.7%) | 404 (58.3%) |
Health Insurance Coverage by Household Income in Cherryvale
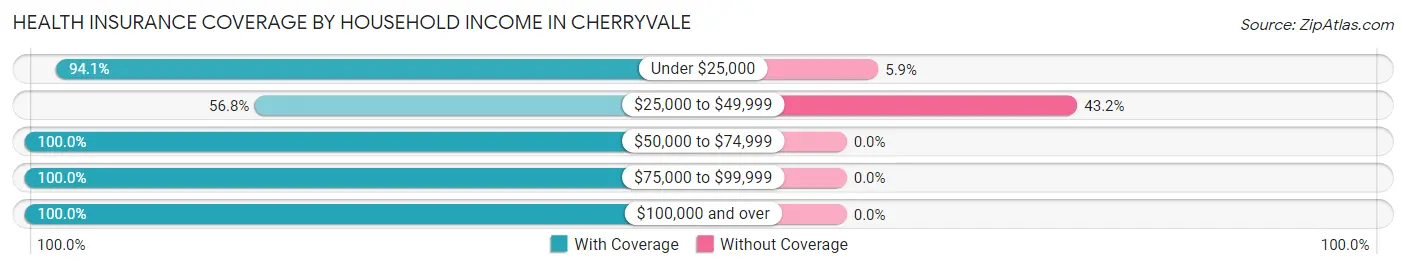
| Household Income | With Coverage | Without Coverage |
| Under $25,000 | 510 (94.1%) | 32 (5.9%) |
| $25,000 to $49,999 | 806 (56.8%) | 613 (43.2%) |
| $50,000 to $74,999 | 424 (100.0%) | 0 (0.0%) |
| $75,000 to $99,999 | 144 (100.0%) | 0 (0.0%) |
| $100,000 and over | 248 (100.0%) | 0 (0.0%) |
Public vs Private Health Insurance Coverage by Age in Cherryvale
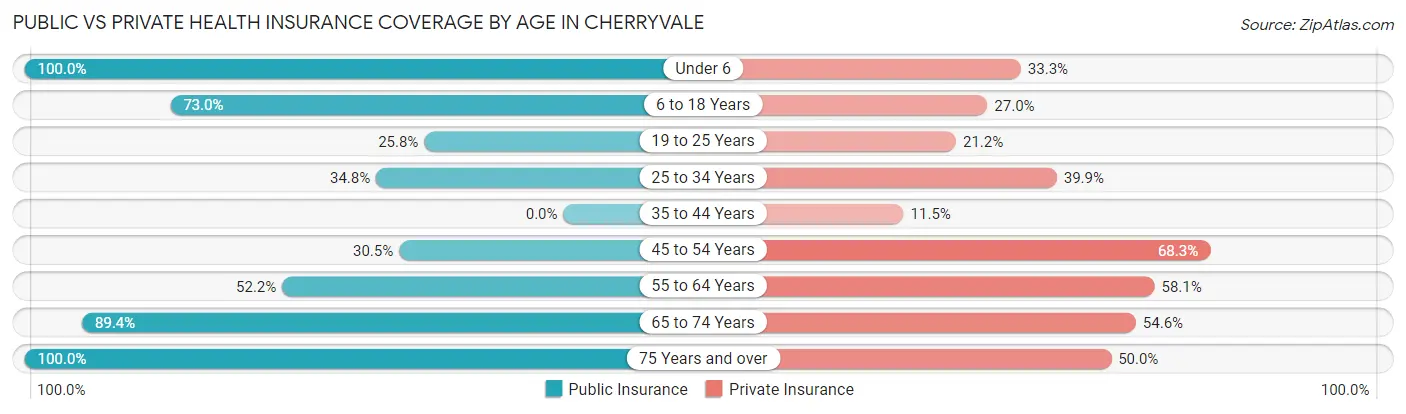
| Age Bracket | Public Insurance | Private Insurance |
| Under 6 | 424 (100.0%) | 141 (33.3%) |
| 6 to 18 Years | 189 (73.0%) | 70 (27.0%) |
| 19 to 25 Years | 179 (25.8%) | 147 (21.2%) |
| 25 to 34 Years | 203 (34.8%) | 233 (39.9%) |
| 35 to 44 Years | 0 (0.0%) | 14 (11.5%) |
| 45 to 54 Years | 79 (30.5%) | 177 (68.3%) |
| 55 to 64 Years | 107 (52.2%) | 119 (58.1%) |
| 65 to 74 Years | 185 (89.4%) | 113 (54.6%) |
| 75 Years and over | 58 (100.0%) | 29 (50.0%) |
| Total | 1,424 (50.7%) | 1,043 (37.1%) |
Disability Status by Sex by Age in Cherryvale
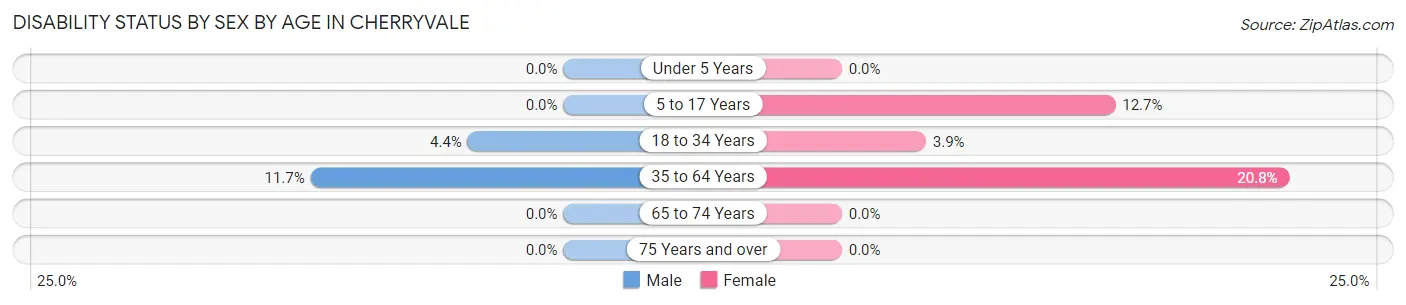
| Age Bracket | Male | Female |
| Under 5 Years | 0 (0.0%) | 0 (0.0%) |
| 5 to 17 Years | 0 (0.0%) | 33 (12.7%) |
| 18 to 34 Years | 34 (4.4%) | 24 (3.9%) |
| 35 to 64 Years | 23 (11.7%) | 81 (20.8%) |
| 65 to 74 Years | 0 (0.0%) | 0 (0.0%) |
| 75 Years and over | 0 (0.0%) | 0 (0.0%) |
Disability Class by Sex by Age in Cherryvale
Disability Class: Hearing Difficulty
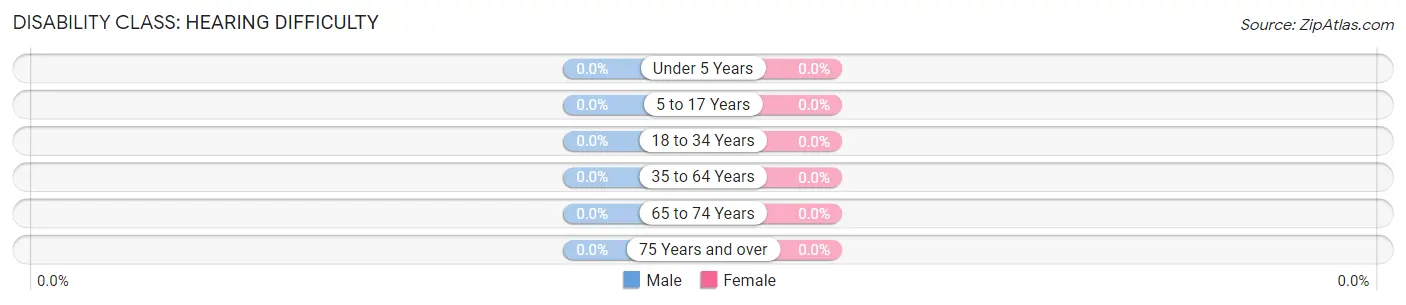
| Age Bracket | Male | Female |
| Under 5 Years | 0 (0.0%) | 0 (0.0%) |
| 5 to 17 Years | 0 (0.0%) | 0 (0.0%) |
| 18 to 34 Years | 0 (0.0%) | 0 (0.0%) |
| 35 to 64 Years | 0 (0.0%) | 0 (0.0%) |
| 65 to 74 Years | 0 (0.0%) | 0 (0.0%) |
| 75 Years and over | 0 (0.0%) | 0 (0.0%) |
Disability Class: Vision Difficulty
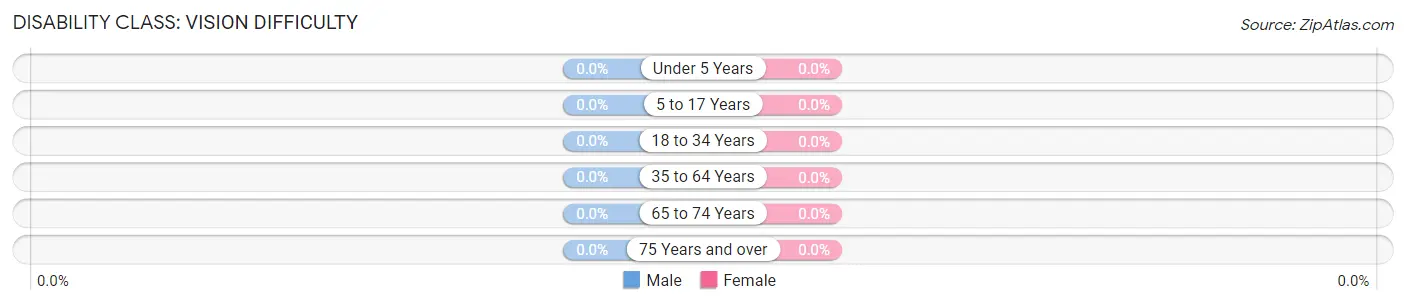
| Age Bracket | Male | Female |
| Under 5 Years | 0 (0.0%) | 0 (0.0%) |
| 5 to 17 Years | 0 (0.0%) | 0 (0.0%) |
| 18 to 34 Years | 0 (0.0%) | 0 (0.0%) |
| 35 to 64 Years | 0 (0.0%) | 0 (0.0%) |
| 65 to 74 Years | 0 (0.0%) | 0 (0.0%) |
| 75 Years and over | 0 (0.0%) | 0 (0.0%) |
Disability Class: Cognitive Difficulty
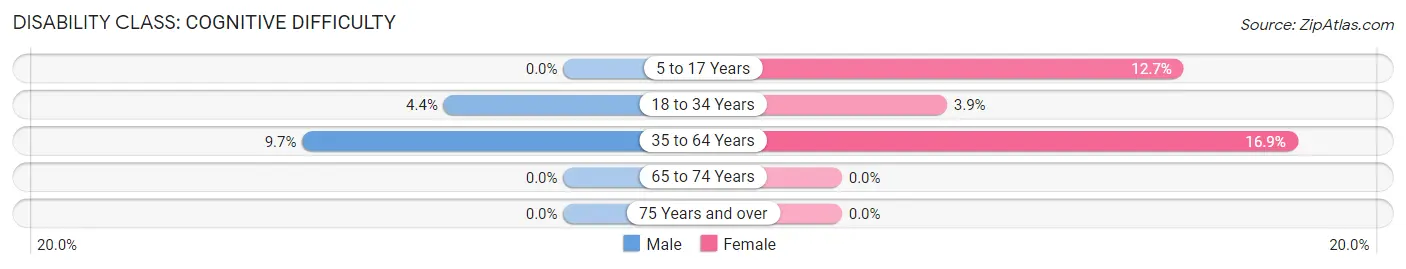
| Age Bracket | Male | Female |
| 5 to 17 Years | 0 (0.0%) | 33 (12.7%) |
| 18 to 34 Years | 34 (4.4%) | 24 (3.9%) |
| 35 to 64 Years | 19 (9.7%) | 66 (16.9%) |
| 65 to 74 Years | 0 (0.0%) | 0 (0.0%) |
| 75 Years and over | 0 (0.0%) | 0 (0.0%) |
Disability Class: Ambulatory Difficulty
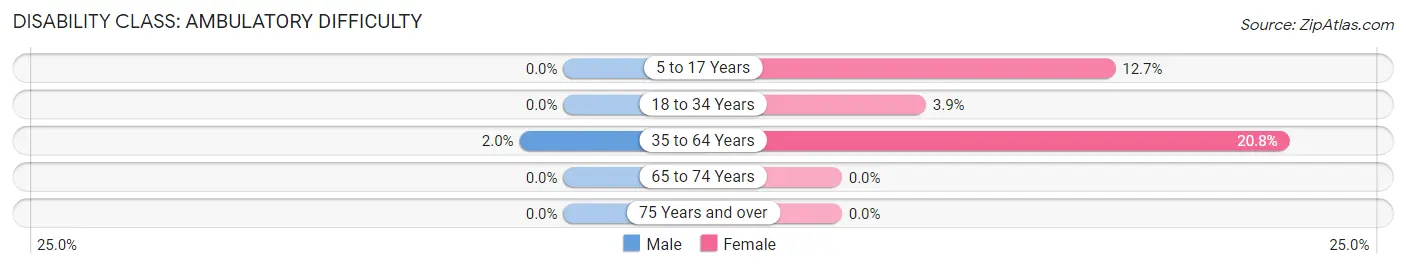
| Age Bracket | Male | Female |
| 5 to 17 Years | 0 (0.0%) | 33 (12.7%) |
| 18 to 34 Years | 0 (0.0%) | 24 (3.9%) |
| 35 to 64 Years | 4 (2.0%) | 81 (20.8%) |
| 65 to 74 Years | 0 (0.0%) | 0 (0.0%) |
| 75 Years and over | 0 (0.0%) | 0 (0.0%) |
Disability Class: Self-Care Difficulty
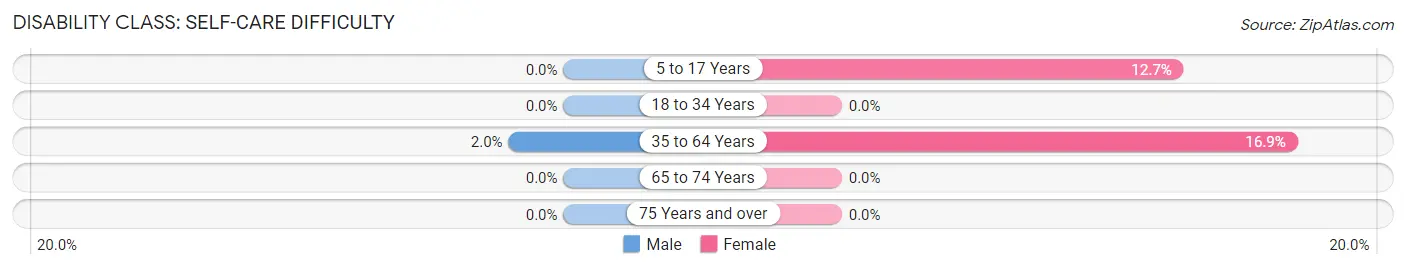
| Age Bracket | Male | Female |
| 5 to 17 Years | 0 (0.0%) | 33 (12.7%) |
| 18 to 34 Years | 0 (0.0%) | 0 (0.0%) |
| 35 to 64 Years | 4 (2.0%) | 66 (16.9%) |
| 65 to 74 Years | 0 (0.0%) | 0 (0.0%) |
| 75 Years and over | 0 (0.0%) | 0 (0.0%) |
Technology Access in Cherryvale
Computing Device Access in Cherryvale
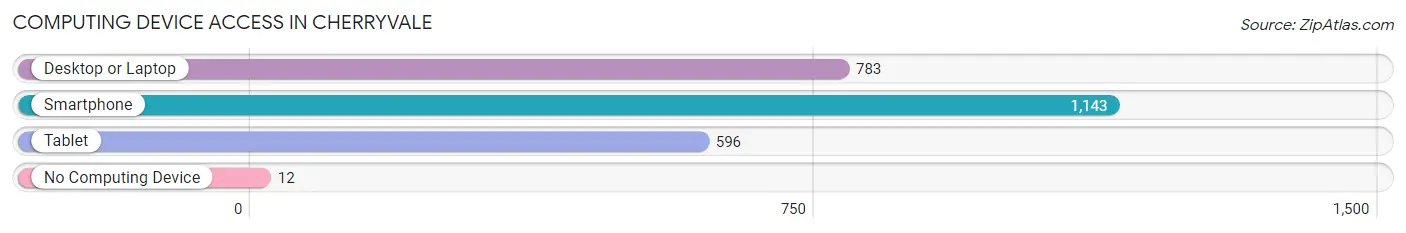
| Device Type | # Households | % Households |
| Desktop or Laptop | 783 | 65.8% |
| Smartphone | 1,143 | 96.1% |
| Tablet | 596 | 50.1% |
| No Computing Device | 12 | 1.0% |
| Total | 1,189 | 100.0% |
Internet Access in Cherryvale
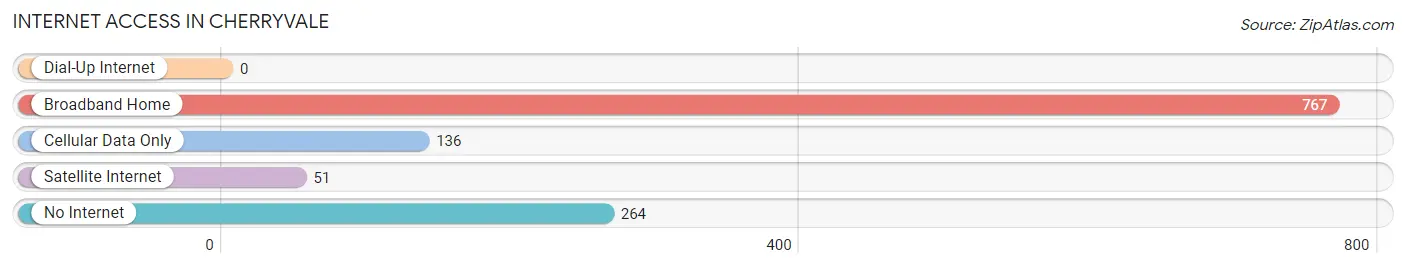
| Internet Type | # Households | % Households |
| Dial-Up Internet | 0 | 0.0% |
| Broadband Home | 767 | 64.5% |
| Cellular Data Only | 136 | 11.4% |
| Satellite Internet | 51 | 4.3% |
| No Internet | 264 | 22.2% |
| Total | 1,189 | 100.0% |
Cherryvale Summary
Cherryvale is a small town located in the Piedmont region of South Carolina. It is situated in the foothills of the Blue Ridge Mountains, approximately 25 miles northwest of Greenville. The town was founded in 1883 and is named after the cherry trees that were planted in the area by early settlers.
Geography
Cherryvale is located in the foothills of the Blue Ridge Mountains, approximately 25 miles northwest of Greenville. The town is situated in the Piedmont region of South Carolina, which is characterized by rolling hills and valleys. The town is located at an elevation of 890 feet above sea level. The climate in Cherryvale is mild and humid, with temperatures ranging from the mid-50s in the winter to the mid-80s in the summer.
Economy
Cherryvale’s economy is largely based on agriculture and manufacturing. The town is home to several small businesses, including a furniture store, a hardware store, and a grocery store. The town also has a few restaurants and a few small retail stores. The town is also home to a number of farms, which produce a variety of crops, including corn, soybeans, and wheat.
Demographics
As of the 2010 census, the population of Cherryvale was 1,845. The population is predominantly white, with African Americans making up about 10% of the population. The median household income in Cherryvale is $37,000, and the median age is 40. The town has a low unemployment rate of 4.2%.
History
Cherryvale was founded in 1883 by a group of settlers from North Carolina. The town was named after the cherry trees that were planted in the area by the settlers. The town grew slowly over the years, and by the early 1900s, it had become a thriving agricultural community. The town was also home to several small businesses, including a furniture store, a hardware store, and a grocery store.
In the 1950s, Cherryvale began to experience a period of growth and development. The town was home to several new businesses, including a movie theater, a bowling alley, and a shopping center. The town also saw the construction of several new homes and businesses.
In the late 1970s, Cherryvale experienced a period of decline. Many of the businesses that had been established in the 1950s closed, and the town’s population began to decline. In the 1980s, the town began to experience a period of revitalization, and many of the businesses that had closed in the 1970s reopened.
Today, Cherryvale is a small town with a population of approximately 1,845. The town is home to several small businesses, including a furniture store, a hardware store, and a grocery store. The town also has a few restaurants and a few small retail stores. The town is also home to a number of farms, which produce a variety of crops, including corn, soybeans, and wheat.
Common Questions
What is Per Capita Income in Cherryvale?
Per Capita income in Cherryvale is $18,486.
What is the Median Family Income in Cherryvale?
Median Family Income in Cherryvale is $39,497.
What is the Median Household income in Cherryvale?
Median Household Income in Cherryvale is $39,688.
What is Inequality or Gini Index in Cherryvale?
Inequality or Gini Index in Cherryvale is 0.33.
What is the Total Population of Cherryvale?
Total Population of Cherryvale is 2,843.
What is the Total Male Population of Cherryvale?
Total Male Population of Cherryvale is 1,230.
What is the Total Female Population of Cherryvale?
Total Female Population of Cherryvale is 1,613.
What is the Ratio of Males per 100 Females in Cherryvale?
There are 76.26 Males per 100 Females in Cherryvale.
What is the Ratio of Females per 100 Males in Cherryvale?
There are 131.14 Females per 100 Males in Cherryvale.
What is the Median Population Age in Cherryvale?
Median Population Age in Cherryvale is 26.1 Years.
What is the Average Family Size in Cherryvale
Average Family Size in Cherryvale is 3.2 People.
What is the Average Household Size in Cherryvale
Average Household Size in Cherryvale is 2.4 People.
How Large is the Labor Force in Cherryvale?
There are 1,560 People in the Labor Forcein in Cherryvale.
What is the Percentage of People in the Labor Force in Cherryvale?
68.9% of People are in the Labor Force in Cherryvale.
What is the Unemployment Rate in Cherryvale?
Unemployment Rate in Cherryvale is 26.6%.