Mountville, SC Map & Demographics
Mountville Map
Mountville Overview
$39,007
PER CAPITA INCOME
0.22
INEQUALITY / GINI INDEX
135
TOTAL POPULATION
63
MALE POPULATION
72
FEMALE POPULATION
87.50
MALES / 100 FEMALES
114.29
FEMALES / 100 MALES
40.9
MEDIAN AGE
3.1
AVG FAMILY SIZE
2.0
AVG HOUSEHOLD SIZE
97
LABOR FORCE [ PEOPLE ]
80.2%
PERCENT IN LABOR FORCE
Mountville Zip Codes
Mountville Area Codes
Income in Mountville
Income Overview in Mountville
| Characteristic | Number | Measure |
| Per Capita Income | 135 | $39,007 |
| Median Family Income | 27 | $0 |
| Mean Family Income | 27 | $0 |
| Median Household Income | 67 | $0 |
| Mean Household Income | 67 | $80,046 |
| Income Deficit | 27 | $0 |
| Wage / Income Gap (%) | 135 | 0.00% |
| Wage / Income Gap ($) | 135 | 100.00¢ per $1 |
| Gini / Inequality Index | 135 | 0.22 |
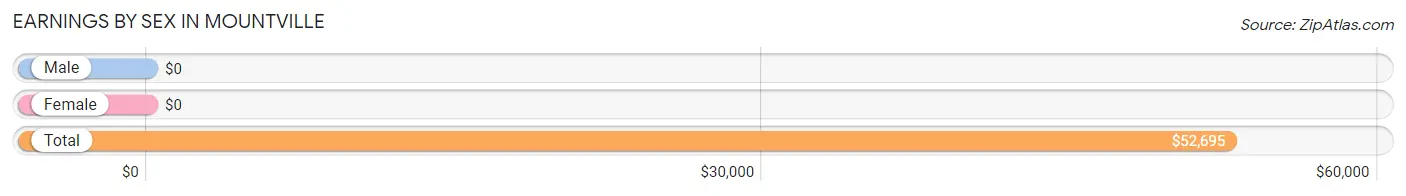
Earnings by Sex in Mountville
| Sex | Number | Average Earnings |
| Male | 41 (36.3%) | $0 |
| Female | 72 (63.7%) | $0 |
| Total | 113 (100.0%) | $52,695 |
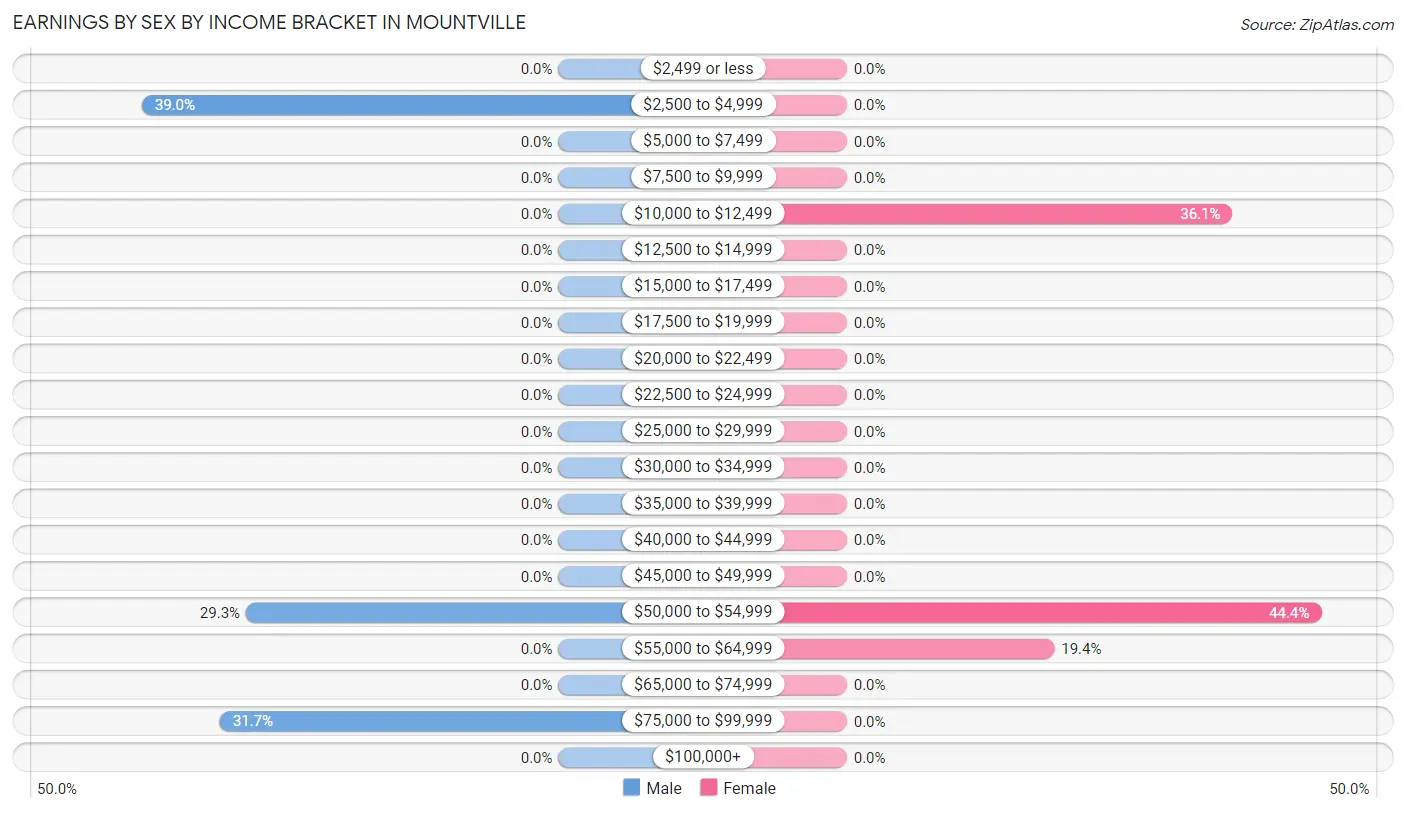
Earnings by Sex by Income Bracket in Mountville
The most common earnings brackets in Mountville are $2,500 to $4,999 for men (16 | 39.0%) and $50,000 to $54,999 for women (32 | 44.4%).
| Income | Male | Female |
| $2,499 or less | 0 (0.0%) | 0 (0.0%) |
| $2,500 to $4,999 | 16 (39.0%) | 0 (0.0%) |
| $5,000 to $7,499 | 0 (0.0%) | 0 (0.0%) |
| $7,500 to $9,999 | 0 (0.0%) | 0 (0.0%) |
| $10,000 to $12,499 | 0 (0.0%) | 26 (36.1%) |
| $12,500 to $14,999 | 0 (0.0%) | 0 (0.0%) |
| $15,000 to $17,499 | 0 (0.0%) | 0 (0.0%) |
| $17,500 to $19,999 | 0 (0.0%) | 0 (0.0%) |
| $20,000 to $22,499 | 0 (0.0%) | 0 (0.0%) |
| $22,500 to $24,999 | 0 (0.0%) | 0 (0.0%) |
| $25,000 to $29,999 | 0 (0.0%) | 0 (0.0%) |
| $30,000 to $34,999 | 0 (0.0%) | 0 (0.0%) |
| $35,000 to $39,999 | 0 (0.0%) | 0 (0.0%) |
| $40,000 to $44,999 | 0 (0.0%) | 0 (0.0%) |
| $45,000 to $49,999 | 0 (0.0%) | 0 (0.0%) |
| $50,000 to $54,999 | 12 (29.3%) | 32 (44.4%) |
| $55,000 to $64,999 | 0 (0.0%) | 14 (19.4%) |
| $65,000 to $74,999 | 0 (0.0%) | 0 (0.0%) |
| $75,000 to $99,999 | 13 (31.7%) | 0 (0.0%) |
| $100,000+ | 0 (0.0%) | 0 (0.0%) |
| Total | 41 (100.0%) | 72 (100.0%) |
Earnings by Sex by Educational Attainment in Mountville
| Educational Attainment | Male Income | Female Income |
| Less than High School | - | - |
| High School Diploma | - | - |
| College or Associate's Degree | - | - |
| Bachelor's Degree | - | - |
| Graduate Degree | - | - |
| Total | - | - |
Family Income in Mountville
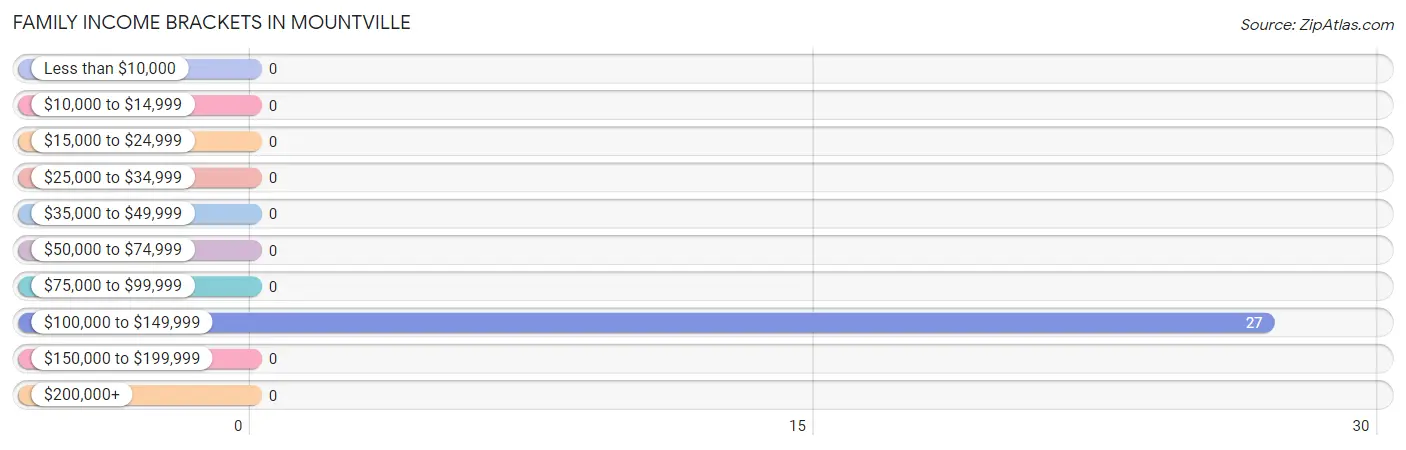
Family Income Brackets in Mountville
According to the Mountville family income data, there are 27 families falling into the $100,000 to $149,999 income range, which is the most common income bracket and makes up 100.0% of all families.
| Income Bracket | # Families | % Families |
| Less than $10,000 | 0 | 0.0% |
| $10,000 to $14,999 | 0 | 0.0% |
| $15,000 to $24,999 | 0 | 0.0% |
| $25,000 to $34,999 | 0 | 0.0% |
| $35,000 to $49,999 | 0 | 0.0% |
| $50,000 to $74,999 | 0 | 0.0% |
| $75,000 to $99,999 | 0 | 0.0% |
| $100,000 to $149,999 | 27 | 100.0% |
| $150,000 to $199,999 | 0 | 0.0% |
| $200,000+ | 0 | 0.0% |
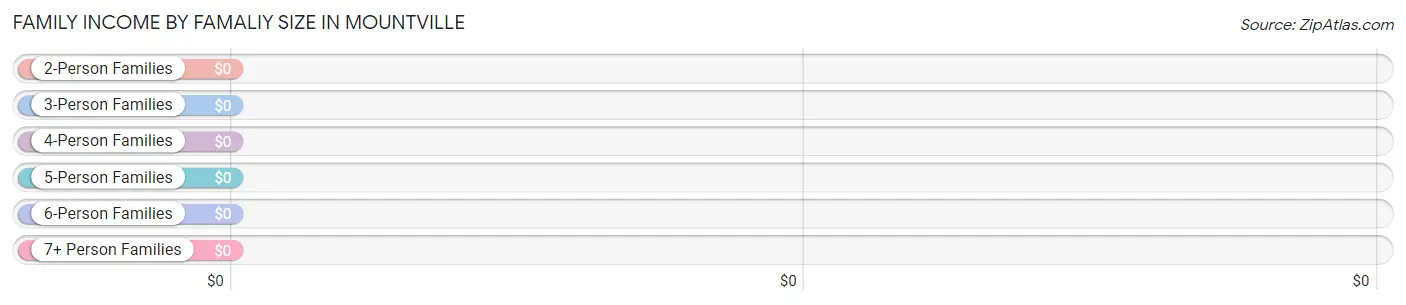
Family Income by Famaliy Size in Mountville
| Income Bracket | # Families | Median Income |
| 2-Person Families | 0 (0.0%) | $0 |
| 3-Person Families | 27 (100.0%) | $0 |
| 4-Person Families | 0 (0.0%) | $0 |
| 5-Person Families | 0 (0.0%) | $0 |
| 6-Person Families | 0 (0.0%) | $0 |
| 7+ Person Families | 0 (0.0%) | $0 |
| Total | 27 (100.0%) | $0 |
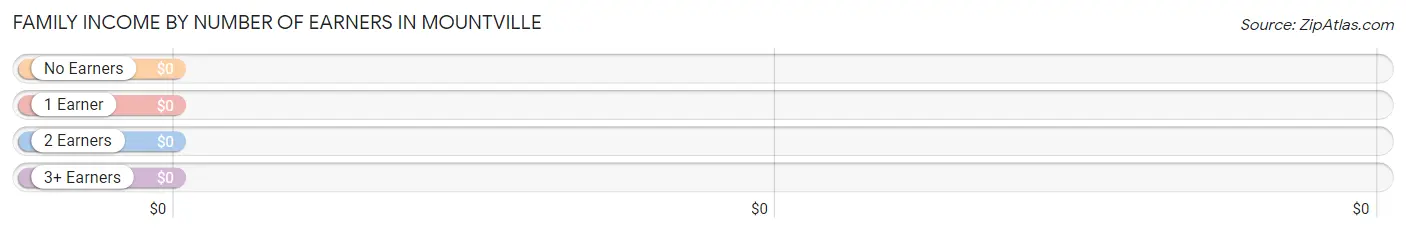
Family Income by Number of Earners in Mountville
| Number of Earners | # Families | Median Income |
| No Earners | 0 (0.0%) | $0 |
| 1 Earner | 0 (0.0%) | $0 |
| 2 Earners | 13 (48.1%) | $0 |
| 3+ Earners | 14 (51.8%) | $0 |
| Total | 27 (100.0%) | $0 |
Household Income in Mountville
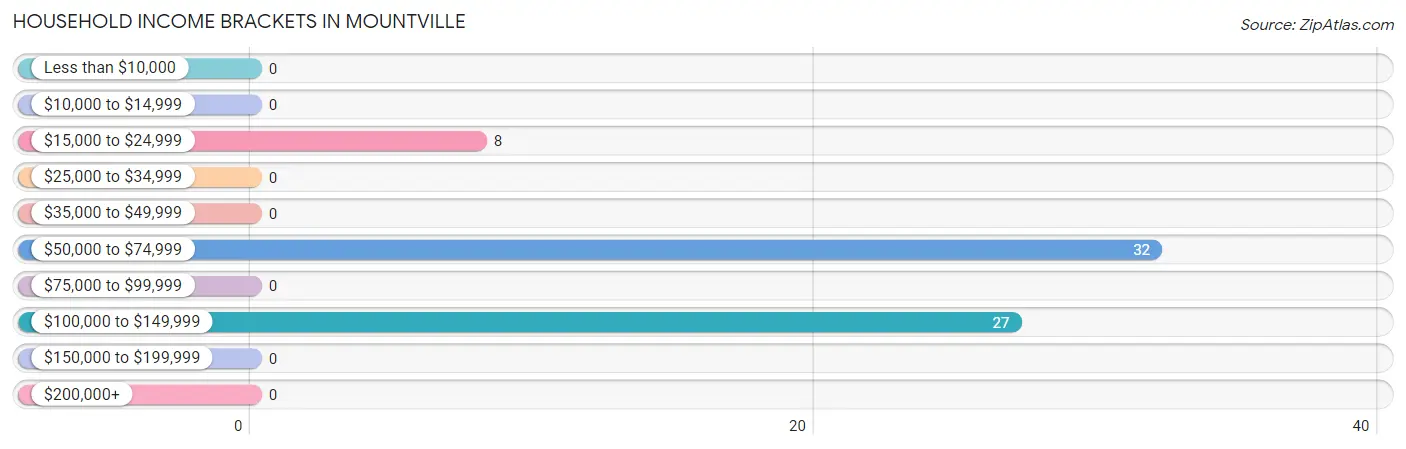
Household Income Brackets in Mountville
With 32 households falling in the category, the $50,000 to $74,999 income range is the most frequent in Mountville, accounting for 47.8% of all households.
| Income Bracket | # Households | % Households |
| Less than $10,000 | 0 | 0.0% |
| $10,000 to $14,999 | 0 | 0.0% |
| $15,000 to $24,999 | 8 | 11.9% |
| $25,000 to $34,999 | 0 | 0.0% |
| $35,000 to $49,999 | 0 | 0.0% |
| $50,000 to $74,999 | 32 | 47.8% |
| $75,000 to $99,999 | 0 | 0.0% |
| $100,000 to $149,999 | 27 | 40.3% |
| $150,000 to $199,999 | 0 | 0.0% |
| $200,000+ | 0 | 0.0% |
Household Income by Householder Age in Mountville
| Income Bracket | # Households | Median Income |
| 15 to 24 Years | 0 (0.0%) | $0 |
| 25 to 44 Years | 13 (19.4%) | $0 |
| 45 to 64 Years | 14 (20.9%) | $0 |
| 65+ Years | 40 (59.7%) | $0 |
| Total | 67 (100.0%) | $0 |
Poverty in Mountville
Income Below Poverty by Sex and Age in Mountville
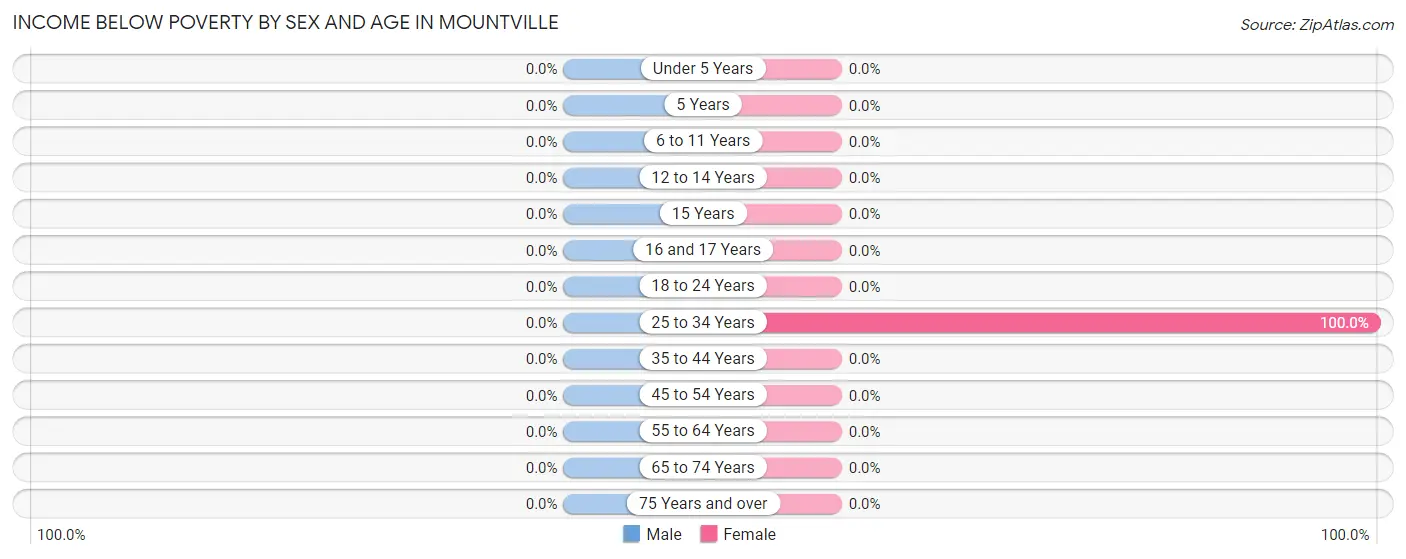
| Age Bracket | Male | Female |
| Under 5 Years | 0 (0.0%) | 0 (0.0%) |
| 5 Years | 0 (0.0%) | 0 (0.0%) |
| 6 to 11 Years | 0 (0.0%) | 0 (0.0%) |
| 12 to 14 Years | 0 (0.0%) | 0 (0.0%) |
| 15 Years | 0 (0.0%) | 0 (0.0%) |
| 16 and 17 Years | 0 (0.0%) | 0 (0.0%) |
| 18 to 24 Years | 0 (0.0%) | 0 (0.0%) |
| 25 to 34 Years | 0 (0.0%) | 10 (100.0%) |
| 35 to 44 Years | 0 (0.0%) | 0 (0.0%) |
| 45 to 54 Years | 0 (0.0%) | 0 (0.0%) |
| 55 to 64 Years | 0 (0.0%) | 0 (0.0%) |
| 65 to 74 Years | 0 (0.0%) | 0 (0.0%) |
| 75 Years and over | 0 (0.0%) | 0 (0.0%) |
| Total | 0 (0.0%) | 10 (13.9%) |
Income Above Poverty by Sex and Age in Mountville
According to the poverty statistics in Mountville, males aged 6 to 11 years and females aged 18 to 24 years are the age groups that are most secure financially, with 100.0% of males and 100.0% of females in these age groups living above the poverty line.
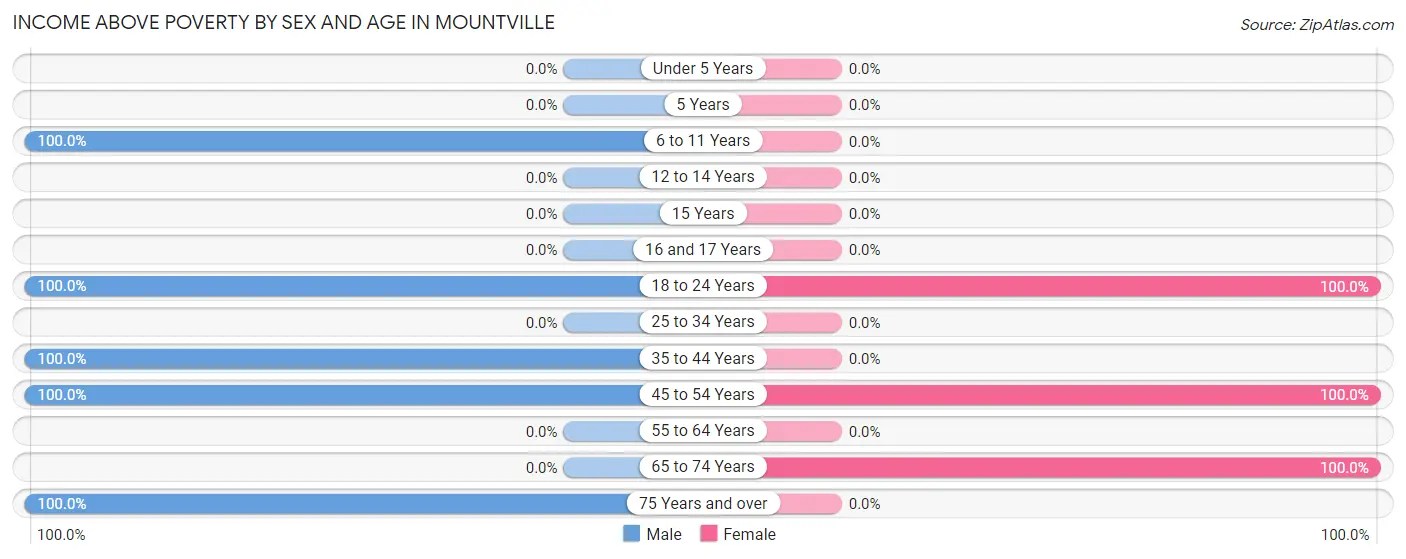
| Age Bracket | Male | Female |
| Under 5 Years | 0 (0.0%) | 0 (0.0%) |
| 5 Years | 0 (0.0%) | 0 (0.0%) |
| 6 to 11 Years | 14 (100.0%) | 0 (0.0%) |
| 12 to 14 Years | 0 (0.0%) | 0 (0.0%) |
| 15 Years | 0 (0.0%) | 0 (0.0%) |
| 16 and 17 Years | 0 (0.0%) | 0 (0.0%) |
| 18 to 24 Years | 16 (100.0%) | 16 (100.0%) |
| 25 to 34 Years | 0 (0.0%) | 0 (0.0%) |
| 35 to 44 Years | 13 (100.0%) | 0 (0.0%) |
| 45 to 54 Years | 12 (100.0%) | 14 (100.0%) |
| 55 to 64 Years | 0 (0.0%) | 0 (0.0%) |
| 65 to 74 Years | 0 (0.0%) | 32 (100.0%) |
| 75 Years and over | 8 (100.0%) | 0 (0.0%) |
| Total | 63 (100.0%) | 62 (86.1%) |
Income Below Poverty Among Married-Couple Families in Mountville
| Children | Above Poverty | Below Poverty |
| No Children | 14 (100.0%) | 0 (0.0%) |
| 1 or 2 Children | 0 (0.0%) | 0 (0.0%) |
| 3 or 4 Children | 0 (0.0%) | 0 (0.0%) |
| 5 or more Children | 0 (0.0%) | 0 (0.0%) |
| Total | 14 (100.0%) | 0 (0.0%) |
Income Below Poverty Among Single-Parent Households in Mountville
| Children | Single Father | Single Mother |
| No Children | 0 (0.0%) | 0 (0.0%) |
| 1 or 2 Children | 0 (0.0%) | 0 (0.0%) |
| 3 or 4 Children | 0 (0.0%) | 0 (0.0%) |
| 5 or more Children | 0 (0.0%) | 0 (0.0%) |
| Total | 0 (0.0%) | 0 (0.0%) |
Income Below Poverty Among Married-Couple vs Single-Parent Households in Mountville
| Children | Married-Couple Families | Single-Parent Households |
| No Children | 0 (0.0%) | 0 (0.0%) |
| 1 or 2 Children | 0 (0.0%) | 0 (0.0%) |
| 3 or 4 Children | 0 (0.0%) | 0 (0.0%) |
| 5 or more Children | 0 (0.0%) | 0 (0.0%) |
| Total | 0 (0.0%) | 0 (0.0%) |
Race in Mountville
The most populous races in Mountville are White / Caucasian (111 | 82.2%), Hispanic or Latino (24 | 17.8%), and Two or more Races (24 | 17.8%).
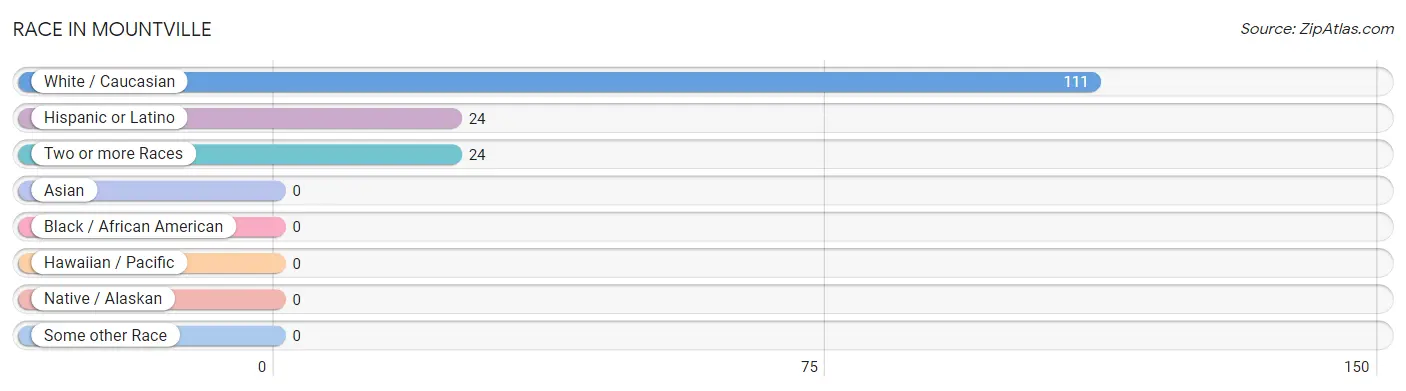
| Race | # Population | % Population |
| Asian | 0 | 0.0% |
| Black / African American | 0 | 0.0% |
| Hawaiian / Pacific | 0 | 0.0% |
| Hispanic or Latino | 24 | 17.8% |
| Native / Alaskan | 0 | 0.0% |
| White / Caucasian | 111 | 82.2% |
| Two or more Races | 24 | 17.8% |
| Some other Race | 0 | 0.0% |
| Total | 135 | 100.0% |
Ancestry in Mountville
The most populous ancestries reported in Mountville are Irish (70 | 51.8%), English (42 | 31.1%), Puerto Rican (24 | 17.8%), French (13 | 9.6%), and Ukrainian (10 | 7.4%), together accounting for 117.8% of all Mountville residents.
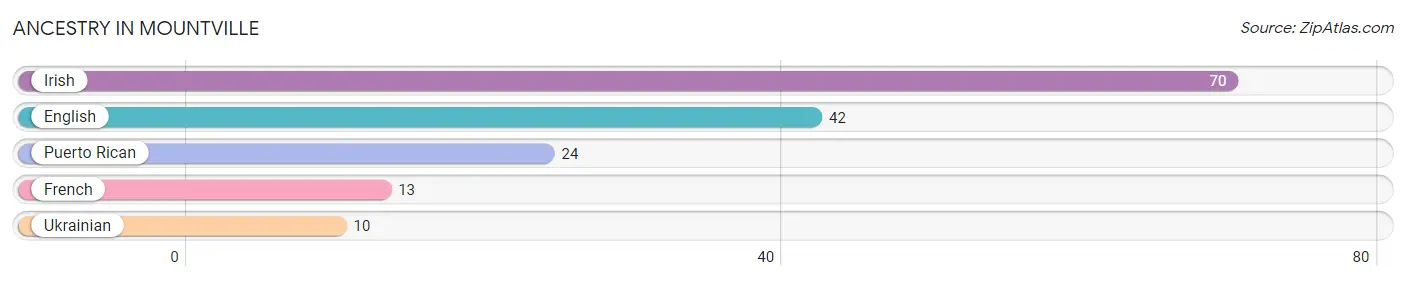
| Ancestry | # Population | % Population |
| English | 42 | 31.1% |
| French | 13 | 9.6% |
| Irish | 70 | 51.8% |
| Puerto Rican | 24 | 17.8% |
| Ukrainian | 10 | 7.4% | View All 5 Rows |
Immigrants in Mountville

| Immigration Origin | # Population | % Population | View All 0 Rows |
Sex and Age in Mountville
Sex and Age in Mountville
The most populous age groups in Mountville are 20 to 24 Years (16 | 25.4%) for men and 70 to 74 Years (32 | 44.4%) for women.
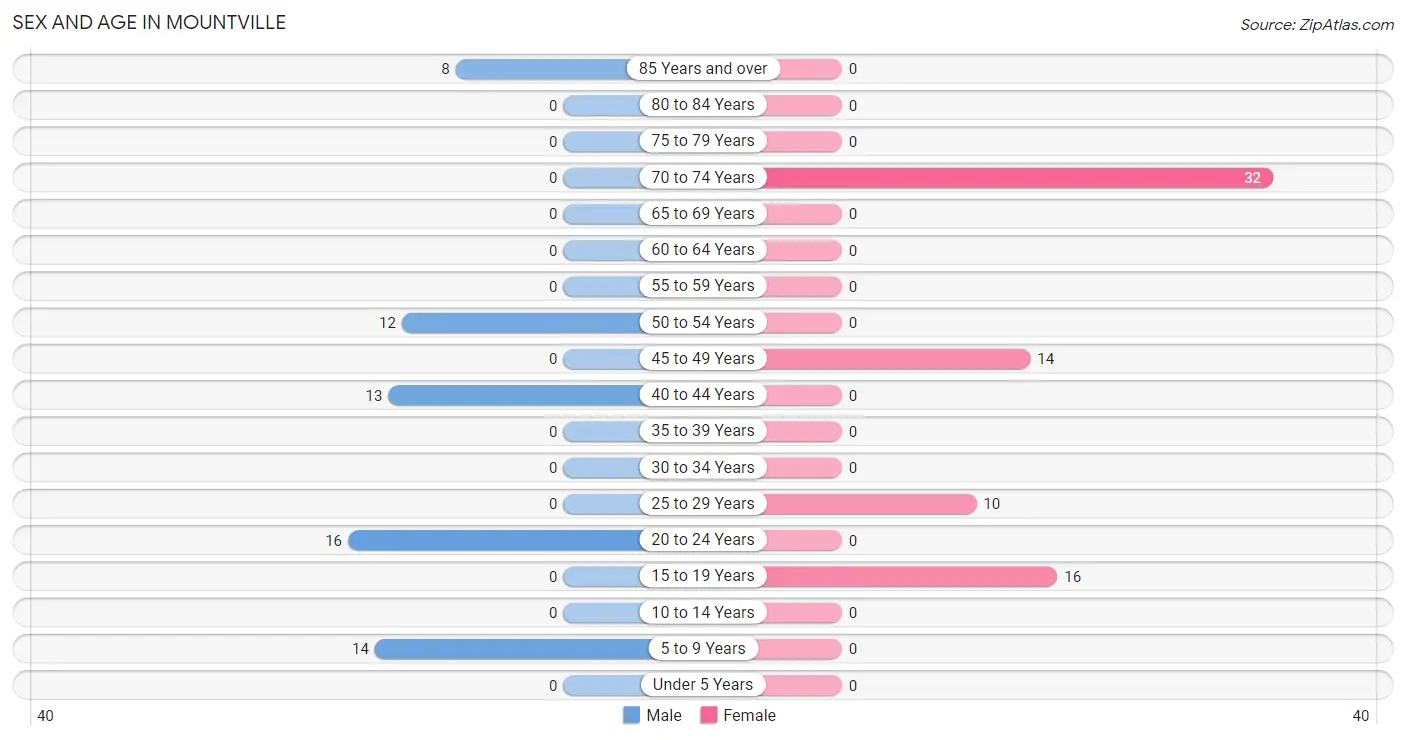
| Age Bracket | Male | Female |
| Under 5 Years | 0 (0.0%) | 0 (0.0%) |
| 5 to 9 Years | 14 (22.2%) | 0 (0.0%) |
| 10 to 14 Years | 0 (0.0%) | 0 (0.0%) |
| 15 to 19 Years | 0 (0.0%) | 16 (22.2%) |
| 20 to 24 Years | 16 (25.4%) | 0 (0.0%) |
| 25 to 29 Years | 0 (0.0%) | 10 (13.9%) |
| 30 to 34 Years | 0 (0.0%) | 0 (0.0%) |
| 35 to 39 Years | 0 (0.0%) | 0 (0.0%) |
| 40 to 44 Years | 13 (20.6%) | 0 (0.0%) |
| 45 to 49 Years | 0 (0.0%) | 14 (19.4%) |
| 50 to 54 Years | 12 (19.1%) | 0 (0.0%) |
| 55 to 59 Years | 0 (0.0%) | 0 (0.0%) |
| 60 to 64 Years | 0 (0.0%) | 0 (0.0%) |
| 65 to 69 Years | 0 (0.0%) | 0 (0.0%) |
| 70 to 74 Years | 0 (0.0%) | 32 (44.4%) |
| 75 to 79 Years | 0 (0.0%) | 0 (0.0%) |
| 80 to 84 Years | 0 (0.0%) | 0 (0.0%) |
| 85 Years and over | 8 (12.7%) | 0 (0.0%) |
| Total | 63 (100.0%) | 72 (100.0%) |
Families and Households in Mountville
Median Family Size in Mountville
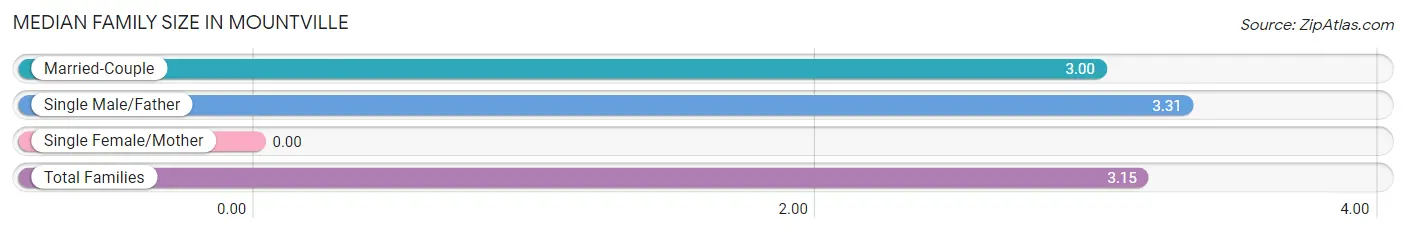
| Family Type | # Families | Family Size |
| Married-Couple | 14 (51.8%) | 3.00 |
| Single Male/Father | 13 (48.1%) | 3.31 |
| Single Female/Mother | 0 (0.0%) | - |
| Total Families | 27 (100.0%) | 3.15 |
Median Household Size in Mountville
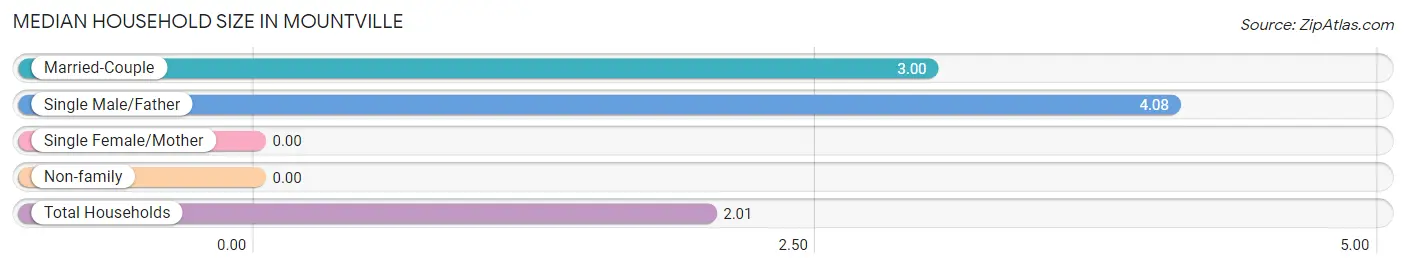
| Household Type | # Households | Household Size |
| Married-Couple | 14 (20.9%) | 3.00 |
| Single Male/Father | 13 (19.4%) | 4.08 |
| Single Female/Mother | 0 (0.0%) | - |
| Non-family | 40 (59.7%) | - |
| Total Households | 67 (100.0%) | 2.01 |
Household Size by Marriage Status in Mountville
Out of a total of 67 households in Mountville, 27 (40.3%) are family households, while 40 (59.7%) are nonfamily households. The most numerous type of family households are 3-person households, comprising 14, and the most common type of nonfamily households are 1-person households, comprising 40.
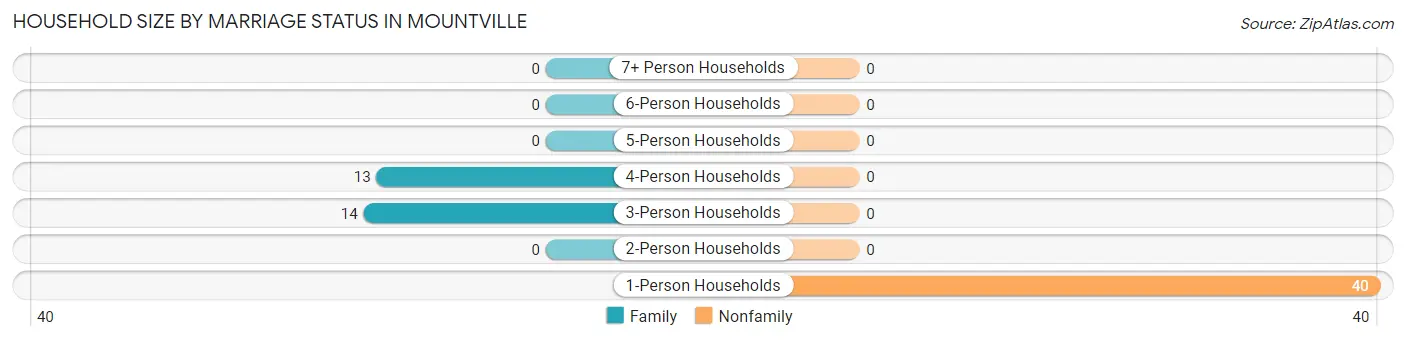
| Household Size | Family Households | Nonfamily Households |
| 1-Person Households | - | 40 (59.7%) |
| 2-Person Households | 0 (0.0%) | 0 (0.0%) |
| 3-Person Households | 14 (20.9%) | 0 (0.0%) |
| 4-Person Households | 13 (19.4%) | 0 (0.0%) |
| 5-Person Households | 0 (0.0%) | 0 (0.0%) |
| 6-Person Households | 0 (0.0%) | 0 (0.0%) |
| 7+ Person Households | 0 (0.0%) | 0 (0.0%) |
| Total | 27 (40.3%) | 40 (59.7%) |
Female Fertility in Mountville
Fertility by Age in Mountville
| Age Bracket | Women with Births | Births / 1,000 Women |
| 15 to 19 years | 0 (0.0%) | 0.0 |
| 20 to 34 years | 0 (0.0%) | 0.0 |
| 35 to 50 years | 0 (0.0%) | 0.0 |
| Total | 0 (0.0%) | 0.0 |
Fertility by Age by Marriage Status in Mountville
| Age Bracket | Married | Unmarried |
| 15 to 19 years | 0 (0.0%) | 0 (0.0%) |
| 20 to 34 years | 0 (0.0%) | 0 (0.0%) |
| 35 to 50 years | 0 (0.0%) | 0 (0.0%) |
| Total | 0 (0.0%) | 0 (0.0%) |
Fertility by Education in Mountville
| Educational Attainment | Women with Births | Births / 1,000 Women |
| Less than High School | 0 (0.0%) | 0.0 |
| High School Diploma | 0 (0.0%) | 0.0 |
| College or Associate's Degree | 0 (0.0%) | 0.0 |
| Bachelor's Degree | 0 (0.0%) | 0.0 |
| Graduate Degree | 0 (0.0%) | 0.0 |
| Total | 0 (0.0%) | 0.0 |
Fertility by Education by Marriage Status in Mountville
| Educational Attainment | Married | Unmarried |
| Less than High School | 0 (0.0%) | 0 (0.0%) |
| High School Diploma | 0 (0.0%) | 0 (0.0%) |
| College or Associate's Degree | 0 (0.0%) | 0 (0.0%) |
| Bachelor's Degree | 0 (0.0%) | 0 (0.0%) |
| Graduate Degree | 0 (0.0%) | 0 (0.0%) |
| Total | 0 (0.0%) | 0 (0.0%) |
Employment Characteristics in Mountville
Employment by Class of Employer in Mountville
Among the 97 employed individuals in Mountville, private company employees (71 | 73.2%), and local government employees (26 | 26.8%) make up the most common classes of employment.
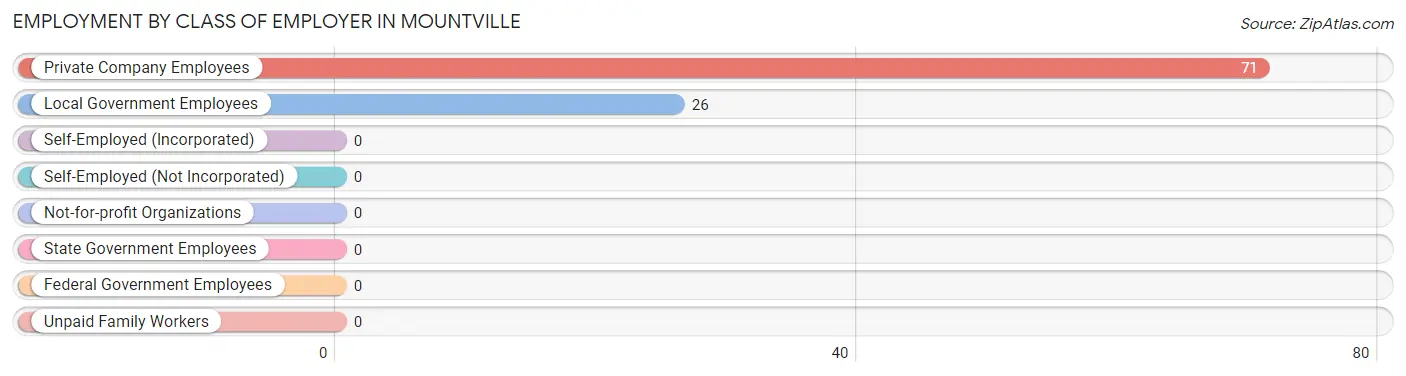
| Employer Class | # Employees | % Employees |
| Private Company Employees | 71 | 73.2% |
| Self-Employed (Incorporated) | 0 | 0.0% |
| Self-Employed (Not Incorporated) | 0 | 0.0% |
| Not-for-profit Organizations | 0 | 0.0% |
| Local Government Employees | 26 | 26.8% |
| State Government Employees | 0 | 0.0% |
| Federal Government Employees | 0 | 0.0% |
| Unpaid Family Workers | 0 | 0.0% |
| Total | 97 | 100.0% |
Employment Status by Age in Mountville
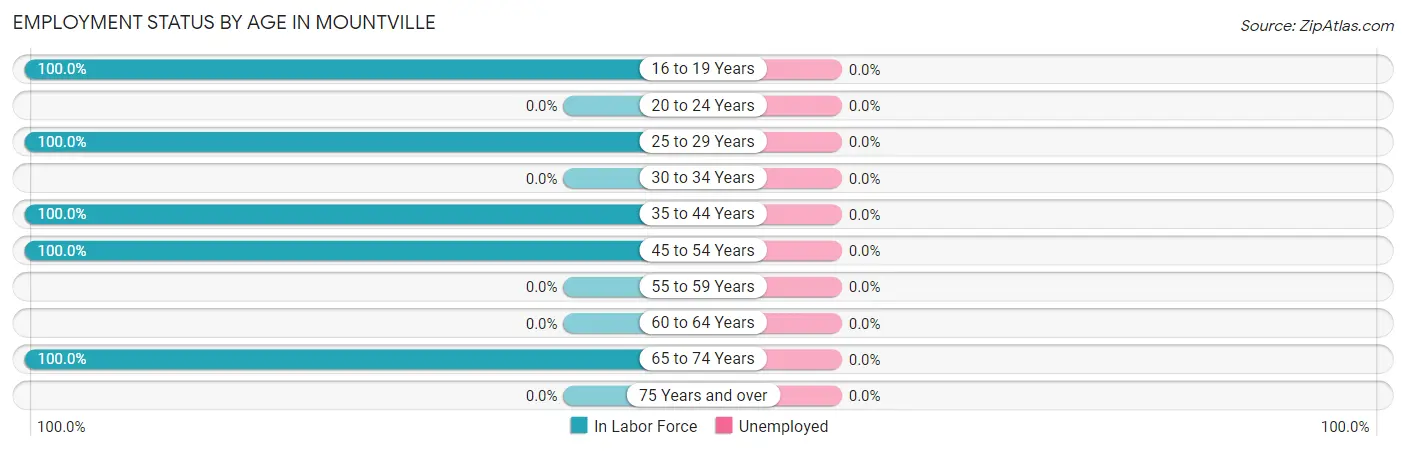
| Age Bracket | In Labor Force | Unemployed |
| 16 to 19 Years | 16 (100.0%) | 0 (0.0%) |
| 20 to 24 Years | 0 (0.0%) | 0 (0.0%) |
| 25 to 29 Years | 10 (100.0%) | 0 (0.0%) |
| 30 to 34 Years | 0 (0.0%) | 0 (0.0%) |
| 35 to 44 Years | 13 (100.0%) | 0 (0.0%) |
| 45 to 54 Years | 26 (100.0%) | 0 (0.0%) |
| 55 to 59 Years | 0 (0.0%) | 0 (0.0%) |
| 60 to 64 Years | 0 (0.0%) | 0 (0.0%) |
| 65 to 74 Years | 32 (100.0%) | 0 (0.0%) |
| 75 Years and over | 0 (0.0%) | 0 (0.0%) |
| Total | 97 (80.2%) | 0 (0.0%) |
Employment Status by Educational Attainment in Mountville
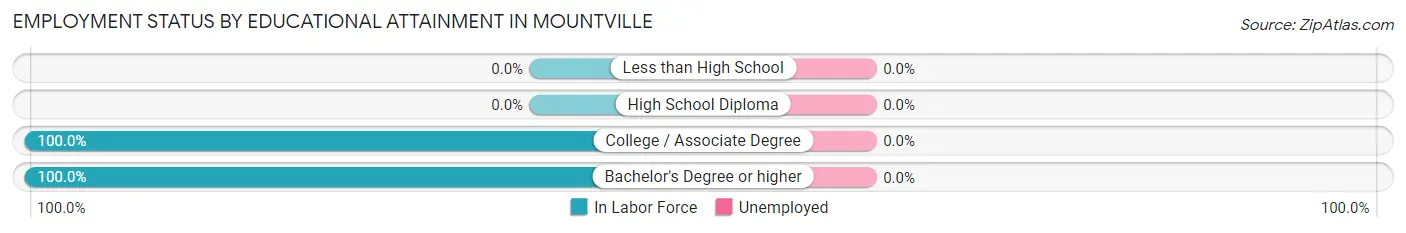
| Educational Attainment | In Labor Force | Unemployed |
| Less than High School | 0 (0.0%) | 0 (0.0%) |
| High School Diploma | 0 (0.0%) | 0 (0.0%) |
| College / Associate Degree | 22 (100.0%) | 0 (0.0%) |
| Bachelor's Degree or higher | 27 (100.0%) | 0 (0.0%) |
| Total | 49 (100.0%) | 0 (0.0%) |
Employment Occupations by Sex in Mountville
Management, Business, Science and Arts Occupations
The most common Management, Business, Science and Arts occupations in Mountville are Community & Social Service (14 | 14.4%), Education Instruction & Library (14 | 14.4%), and Business & Financial (13 | 13.4%).
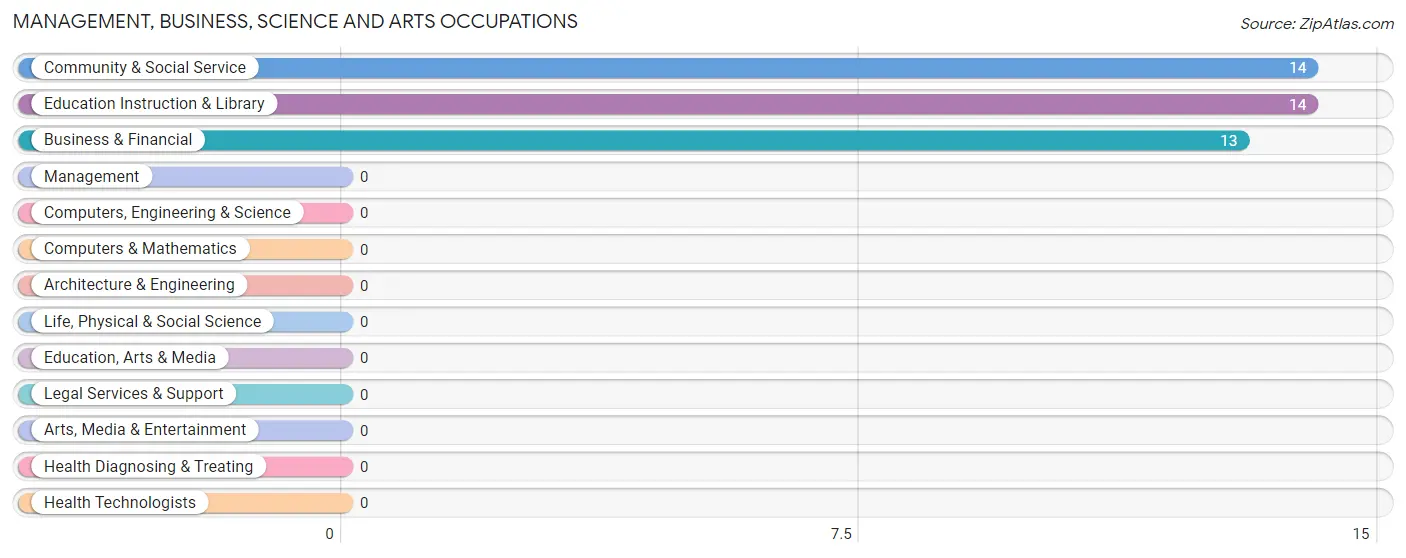
Management, Business, Science and Arts Occupations by Sex
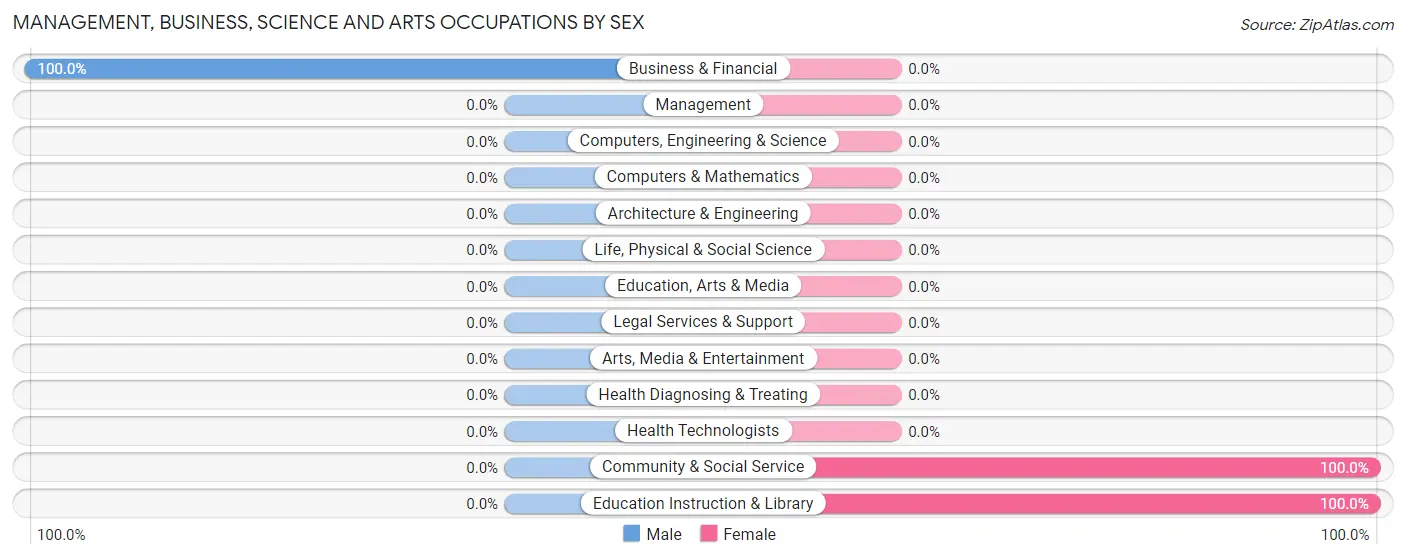
| Occupation | Male | Female |
| Management | 0 (0.0%) | 0 (0.0%) |
| Business & Financial | 13 (100.0%) | 0 (0.0%) |
| Computers, Engineering & Science | 0 (0.0%) | 0 (0.0%) |
| Computers & Mathematics | 0 (0.0%) | 0 (0.0%) |
| Architecture & Engineering | 0 (0.0%) | 0 (0.0%) |
| Life, Physical & Social Science | 0 (0.0%) | 0 (0.0%) |
| Community & Social Service | 0 (0.0%) | 14 (100.0%) |
| Education, Arts & Media | 0 (0.0%) | 0 (0.0%) |
| Legal Services & Support | 0 (0.0%) | 0 (0.0%) |
| Education Instruction & Library | 0 (0.0%) | 14 (100.0%) |
| Arts, Media & Entertainment | 0 (0.0%) | 0 (0.0%) |
| Health Diagnosing & Treating | 0 (0.0%) | 0 (0.0%) |
| Health Technologists | 0 (0.0%) | 0 (0.0%) |
| Total (Category) | 13 (48.1%) | 14 (51.8%) |
| Total (Overall) | 25 (25.8%) | 72 (74.2%) |
Services Occupations
The most common Services occupations in Mountville are Food Preparation & Serving (16 | 16.5%), and Healthcare Support (10 | 10.3%).
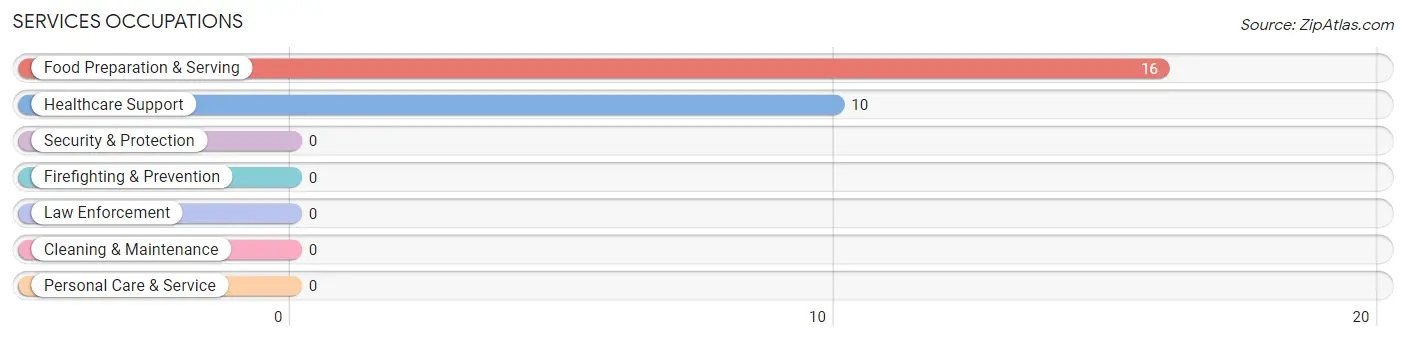
Services Occupations by Sex
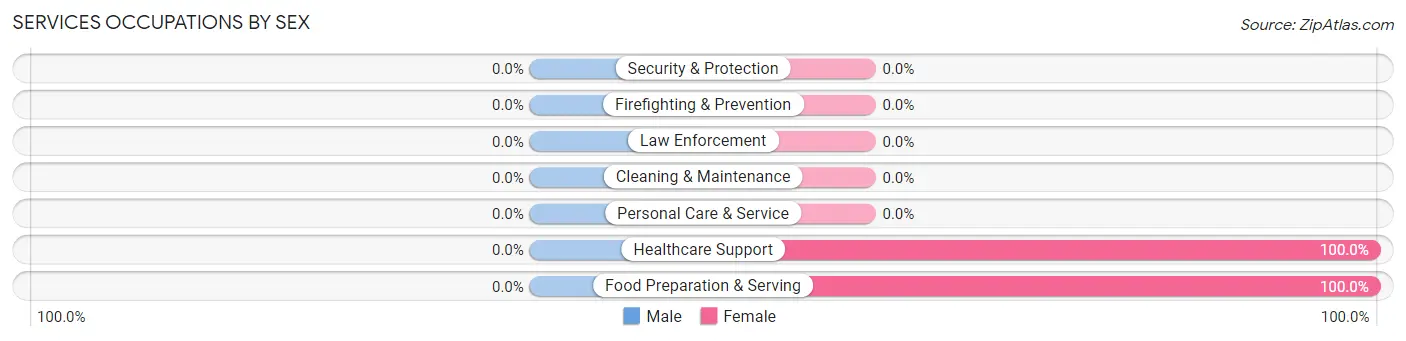
| Occupation | Male | Female |
| Healthcare Support | 0 (0.0%) | 10 (100.0%) |
| Security & Protection | 0 (0.0%) | 0 (0.0%) |
| Firefighting & Prevention | 0 (0.0%) | 0 (0.0%) |
| Law Enforcement | 0 (0.0%) | 0 (0.0%) |
| Food Preparation & Serving | 0 (0.0%) | 16 (100.0%) |
| Cleaning & Maintenance | 0 (0.0%) | 0 (0.0%) |
| Personal Care & Service | 0 (0.0%) | 0 (0.0%) |
| Total (Category) | 0 (0.0%) | 26 (100.0%) |
| Total (Overall) | 25 (25.8%) | 72 (74.2%) |
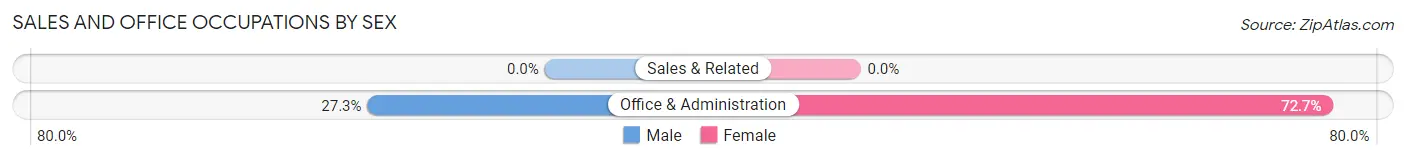
Sales and Office Occupations
The most common Sales and Office occupations in Mountville are , and Office & Administration (44 | 45.4%).
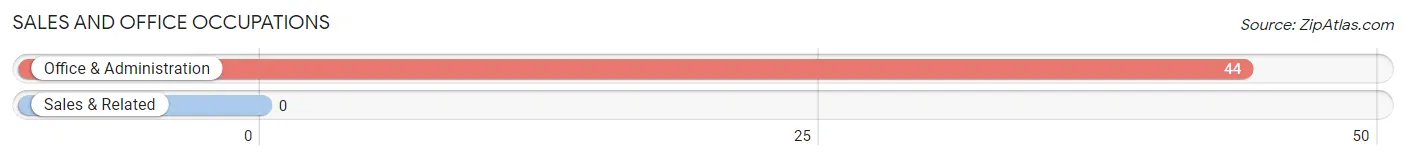
Sales and Office Occupations by Sex
| Occupation | Male | Female |
| Sales & Related | 0 (0.0%) | 0 (0.0%) |
| Office & Administration | 12 (27.3%) | 32 (72.7%) |
| Total (Category) | 12 (27.3%) | 32 (72.7%) |
| Total (Overall) | 25 (25.8%) | 72 (74.2%) |
Natural Resources, Construction and Maintenance Occupations
Natural Resources, Construction and Maintenance Occupations by Sex
| Occupation | Male | Female |
| Farming, Fishing & Forestry | 0 (0.0%) | 0 (0.0%) |
| Construction & Extraction | 0 (0.0%) | 0 (0.0%) |
| Installation, Maintenance & Repair | 0 (0.0%) | 0 (0.0%) |
| Total (Category) | 0 (0.0%) | 0 (0.0%) |
| Total (Overall) | 25 (25.8%) | 72 (74.2%) |
Production, Transportation and Moving Occupations
Production, Transportation and Moving Occupations by Sex
| Occupation | Male | Female |
| Production | 0 (0.0%) | 0 (0.0%) |
| Transportation | 0 (0.0%) | 0 (0.0%) |
| Material Moving | 0 (0.0%) | 0 (0.0%) |
| Total (Category) | 0 (0.0%) | 0 (0.0%) |
| Total (Overall) | 25 (25.8%) | 72 (74.2%) |
Employment Industries by Sex in Mountville
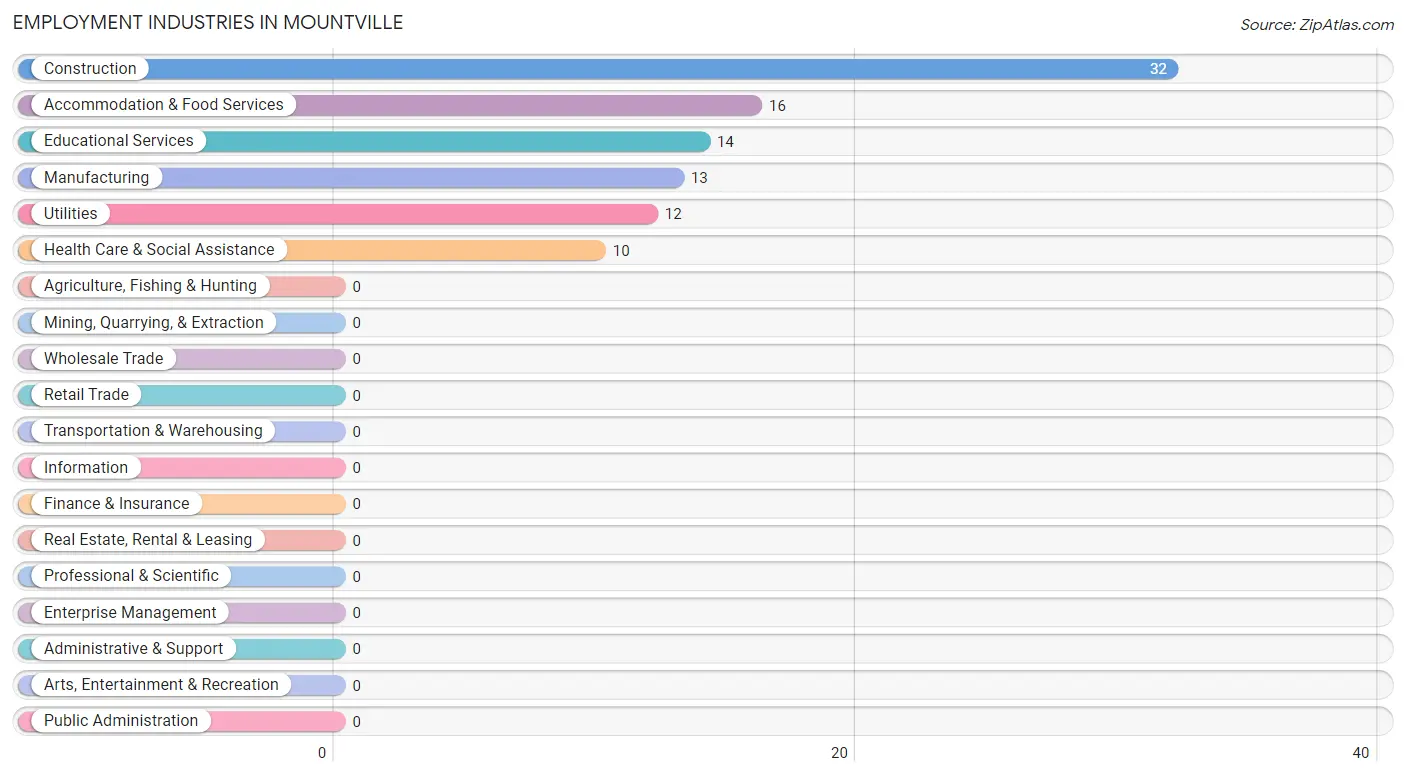
Employment Industries in Mountville
The major employment industries in Mountville include Construction (32 | 33.0%), Accommodation & Food Services (16 | 16.5%), Educational Services (14 | 14.4%), Manufacturing (13 | 13.4%), and Utilities (12 | 12.4%).
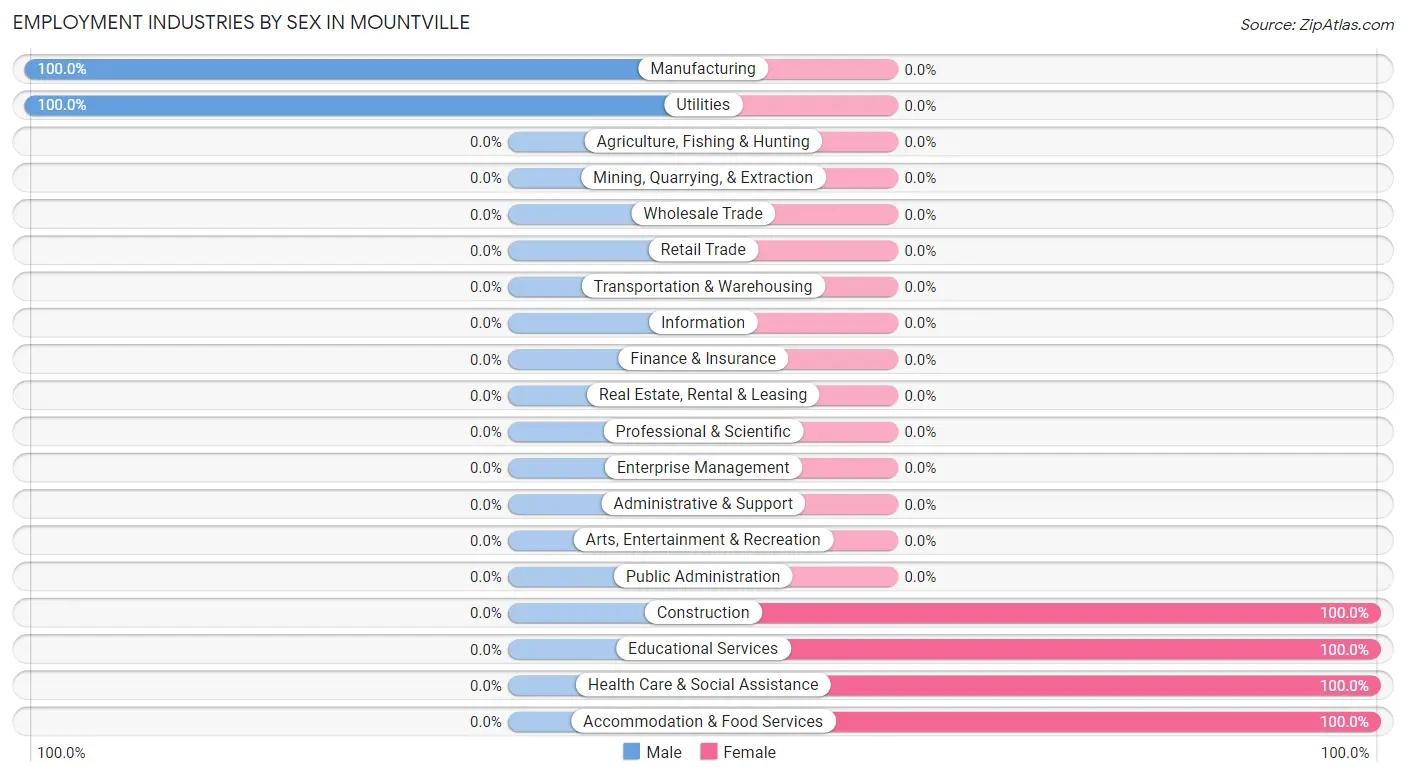
Employment Industries by Sex in Mountville
The Mountville industries that see more men than women are Manufacturing (100.0%), and Utilities (100.0%), whereas the industries that tend to have a higher number of women are Construction (100.0%), Educational Services (100.0%), and Health Care & Social Assistance (100.0%).
| Industry | Male | Female |
| Agriculture, Fishing & Hunting | 0 (0.0%) | 0 (0.0%) |
| Mining, Quarrying, & Extraction | 0 (0.0%) | 0 (0.0%) |
| Construction | 0 (0.0%) | 32 (100.0%) |
| Manufacturing | 13 (100.0%) | 0 (0.0%) |
| Wholesale Trade | 0 (0.0%) | 0 (0.0%) |
| Retail Trade | 0 (0.0%) | 0 (0.0%) |
| Transportation & Warehousing | 0 (0.0%) | 0 (0.0%) |
| Utilities | 12 (100.0%) | 0 (0.0%) |
| Information | 0 (0.0%) | 0 (0.0%) |
| Finance & Insurance | 0 (0.0%) | 0 (0.0%) |
| Real Estate, Rental & Leasing | 0 (0.0%) | 0 (0.0%) |
| Professional & Scientific | 0 (0.0%) | 0 (0.0%) |
| Enterprise Management | 0 (0.0%) | 0 (0.0%) |
| Administrative & Support | 0 (0.0%) | 0 (0.0%) |
| Educational Services | 0 (0.0%) | 14 (100.0%) |
| Health Care & Social Assistance | 0 (0.0%) | 10 (100.0%) |
| Arts, Entertainment & Recreation | 0 (0.0%) | 0 (0.0%) |
| Accommodation & Food Services | 0 (0.0%) | 16 (100.0%) |
| Public Administration | 0 (0.0%) | 0 (0.0%) |
| Total | 25 (25.8%) | 72 (74.2%) |
Education in Mountville
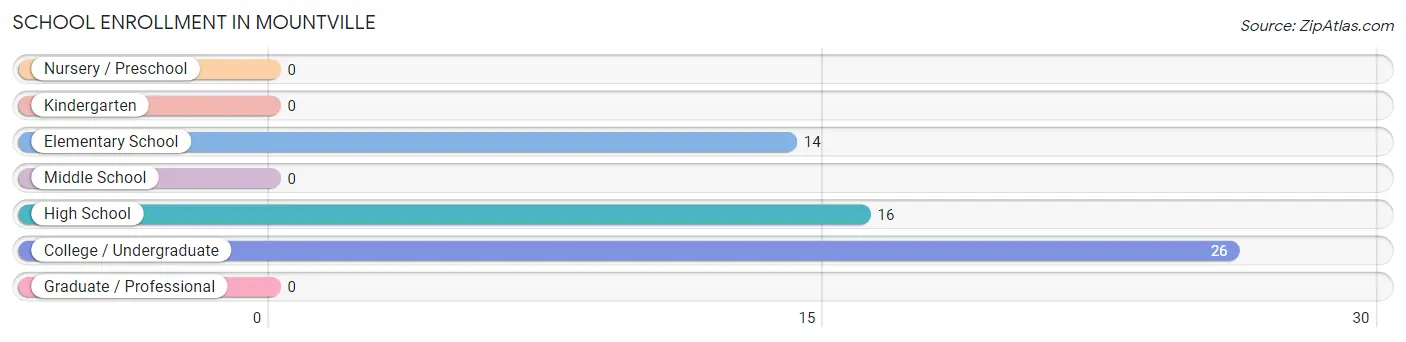
School Enrollment in Mountville
The most common levels of schooling among the 56 students in Mountville are college / undergraduate (26 | 46.4%), high school (16 | 28.6%), and elementary school (14 | 25.0%).
| School Level | # Students | % Students |
| Nursery / Preschool | 0 | 0.0% |
| Kindergarten | 0 | 0.0% |
| Elementary School | 14 | 25.0% |
| Middle School | 0 | 0.0% |
| High School | 16 | 28.6% |
| College / Undergraduate | 26 | 46.4% |
| Graduate / Professional | 0 | 0.0% |
| Total | 56 | 100.0% |
School Enrollment by Age by Funding Source in Mountville
Out of a total of 56 students who are enrolled in schools in Mountville, 26 (46.4%) attend a private institution, while the remaining 30 (53.6%) are enrolled in public schools. The age group of 20 to 24 year olds has the highest likelihood of being enrolled in private schools, with 16 (100.0% in the age bracket) enrolled. Conversely, the age group of 5 to 9 year old has the lowest likelihood of being enrolled in a private school, with 14 (100.0% in the age bracket) attending a public institution.
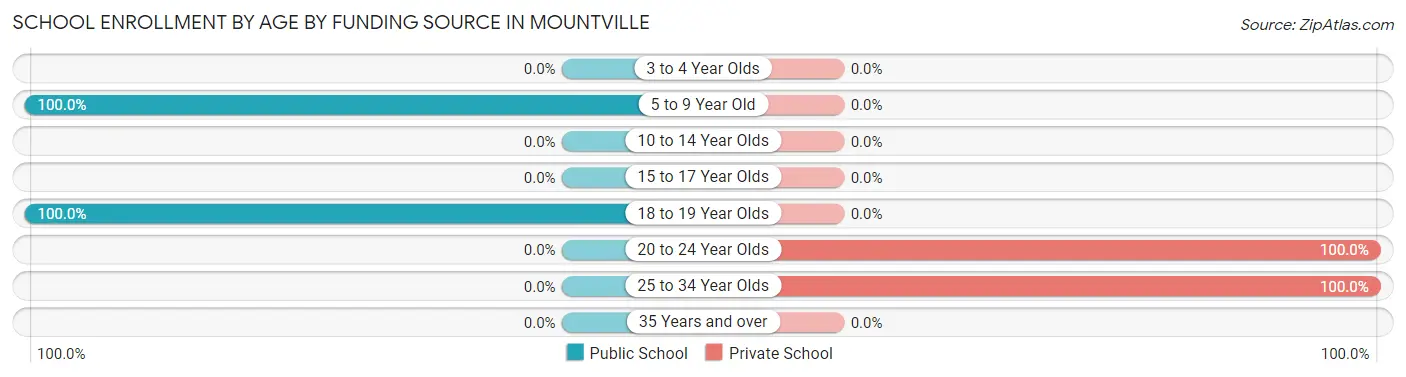
| Age Bracket | Public School | Private School |
| 3 to 4 Year Olds | 0 (0.0%) | 0 (0.0%) |
| 5 to 9 Year Old | 14 (100.0%) | 0 (0.0%) |
| 10 to 14 Year Olds | 0 (0.0%) | 0 (0.0%) |
| 15 to 17 Year Olds | 0 (0.0%) | 0 (0.0%) |
| 18 to 19 Year Olds | 16 (100.0%) | 0 (0.0%) |
| 20 to 24 Year Olds | 0 (0.0%) | 16 (100.0%) |
| 25 to 34 Year Olds | 0 (0.0%) | 10 (100.0%) |
| 35 Years and over | 0 (0.0%) | 0 (0.0%) |
| Total | 30 (53.6%) | 26 (46.4%) |
Educational Attainment by Field of Study in Mountville
Education (14 | 51.8%), and engineering (13 | 48.1%) are the most common fields of study among 27 individuals in Mountville who have obtained a bachelor's degree or higher.
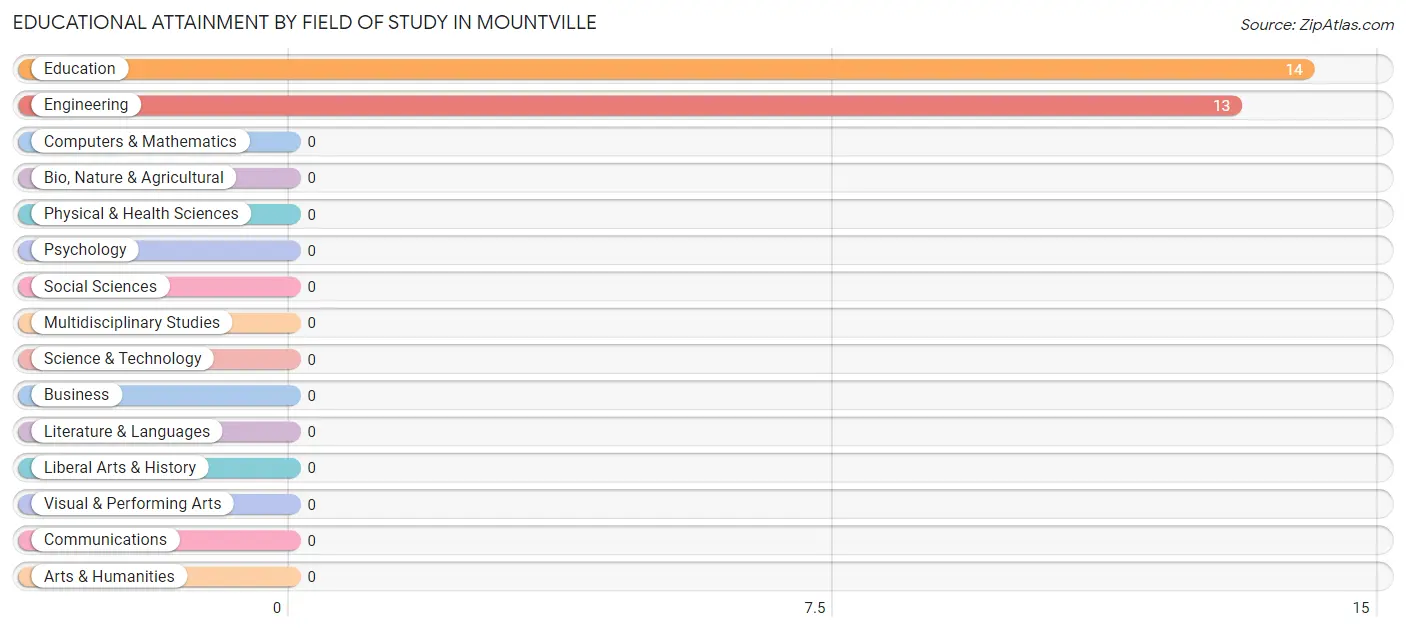
| Field of Study | # Graduates | % Graduates |
| Computers & Mathematics | 0 | 0.0% |
| Bio, Nature & Agricultural | 0 | 0.0% |
| Physical & Health Sciences | 0 | 0.0% |
| Psychology | 0 | 0.0% |
| Social Sciences | 0 | 0.0% |
| Engineering | 13 | 48.1% |
| Multidisciplinary Studies | 0 | 0.0% |
| Science & Technology | 0 | 0.0% |
| Business | 0 | 0.0% |
| Education | 14 | 51.8% |
| Literature & Languages | 0 | 0.0% |
| Liberal Arts & History | 0 | 0.0% |
| Visual & Performing Arts | 0 | 0.0% |
| Communications | 0 | 0.0% |
| Arts & Humanities | 0 | 0.0% |
| Total | 27 | 100.0% |
Transportation & Commute in Mountville
Vehicle Availability by Sex in Mountville
The most prevalent vehicle ownership categories in Mountville are males with 3 vehicles (25, accounting for 100.0%) and females with 3 vehicles (40, making up 34.7%).
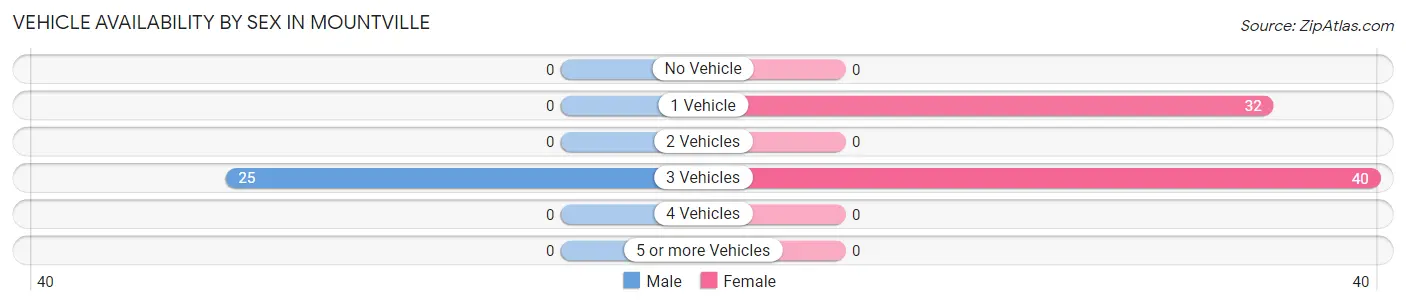
| Vehicles Available | Male | Female |
| No Vehicle | 0 (0.0%) | 0 (0.0%) |
| 1 Vehicle | 0 (0.0%) | 32 (44.4%) |
| 2 Vehicles | 0 (0.0%) | 0 (0.0%) |
| 3 Vehicles | 25 (100.0%) | 40 (55.6%) |
| 4 Vehicles | 0 (0.0%) | 0 (0.0%) |
| 5 or more Vehicles | 0 (0.0%) | 0 (0.0%) |
| Total | 25 (100.0%) | 72 (100.0%) |
Commute Time in Mountville
The most frequently occuring commute durations in Mountville are less than 5 minutes (42 commuters, 43.3%), 15 to 19 minutes (29 commuters, 29.9%), and 10 to 14 minutes (26 commuters, 26.8%).
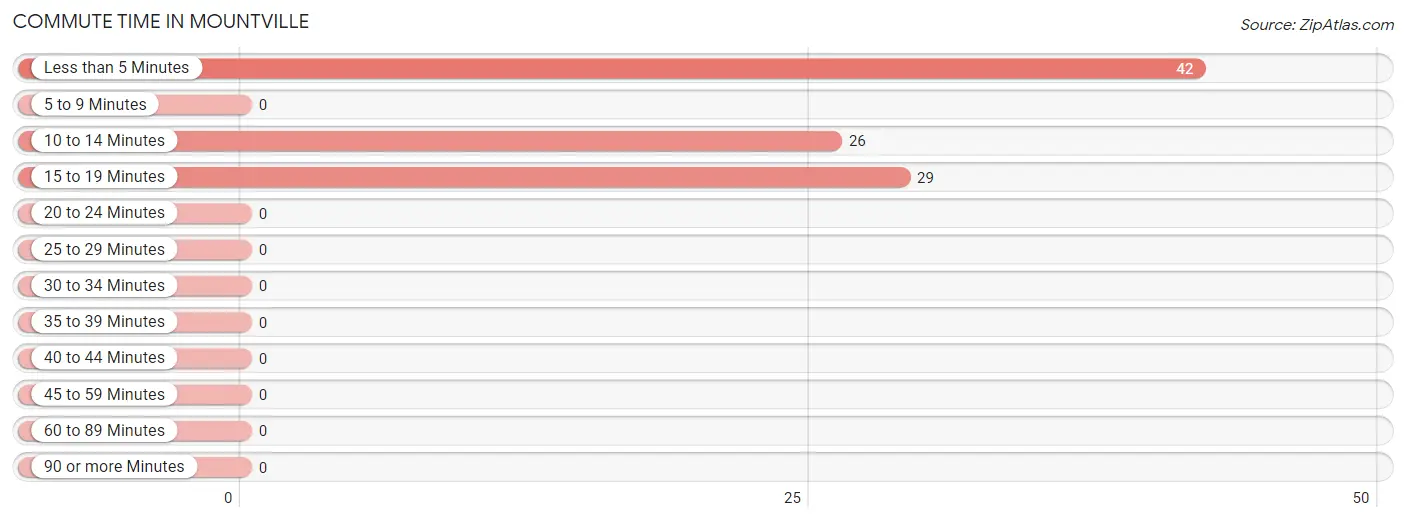
| Commute Time | # Commuters | % Commuters |
| Less than 5 Minutes | 42 | 43.3% |
| 5 to 9 Minutes | 0 | 0.0% |
| 10 to 14 Minutes | 26 | 26.8% |
| 15 to 19 Minutes | 29 | 29.9% |
| 20 to 24 Minutes | 0 | 0.0% |
| 25 to 29 Minutes | 0 | 0.0% |
| 30 to 34 Minutes | 0 | 0.0% |
| 35 to 39 Minutes | 0 | 0.0% |
| 40 to 44 Minutes | 0 | 0.0% |
| 45 to 59 Minutes | 0 | 0.0% |
| 60 to 89 Minutes | 0 | 0.0% |
| 90 or more Minutes | 0 | 0.0% |
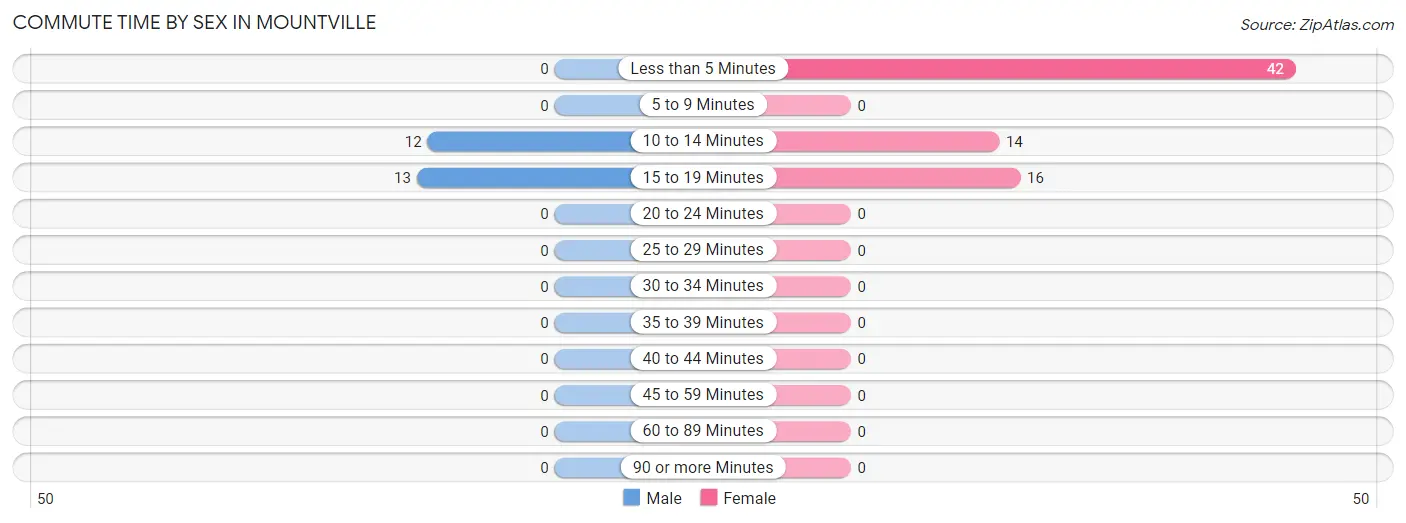
Commute Time by Sex in Mountville
The most common commute times in Mountville are 15 to 19 minutes (13 commuters, 52.0%) for males and less than 5 minutes (42 commuters, 58.3%) for females.
| Commute Time | Male | Female |
| Less than 5 Minutes | 0 (0.0%) | 42 (58.3%) |
| 5 to 9 Minutes | 0 (0.0%) | 0 (0.0%) |
| 10 to 14 Minutes | 12 (48.0%) | 14 (19.4%) |
| 15 to 19 Minutes | 13 (52.0%) | 16 (22.2%) |
| 20 to 24 Minutes | 0 (0.0%) | 0 (0.0%) |
| 25 to 29 Minutes | 0 (0.0%) | 0 (0.0%) |
| 30 to 34 Minutes | 0 (0.0%) | 0 (0.0%) |
| 35 to 39 Minutes | 0 (0.0%) | 0 (0.0%) |
| 40 to 44 Minutes | 0 (0.0%) | 0 (0.0%) |
| 45 to 59 Minutes | 0 (0.0%) | 0 (0.0%) |
| 60 to 89 Minutes | 0 (0.0%) | 0 (0.0%) |
| 90 or more Minutes | 0 (0.0%) | 0 (0.0%) |
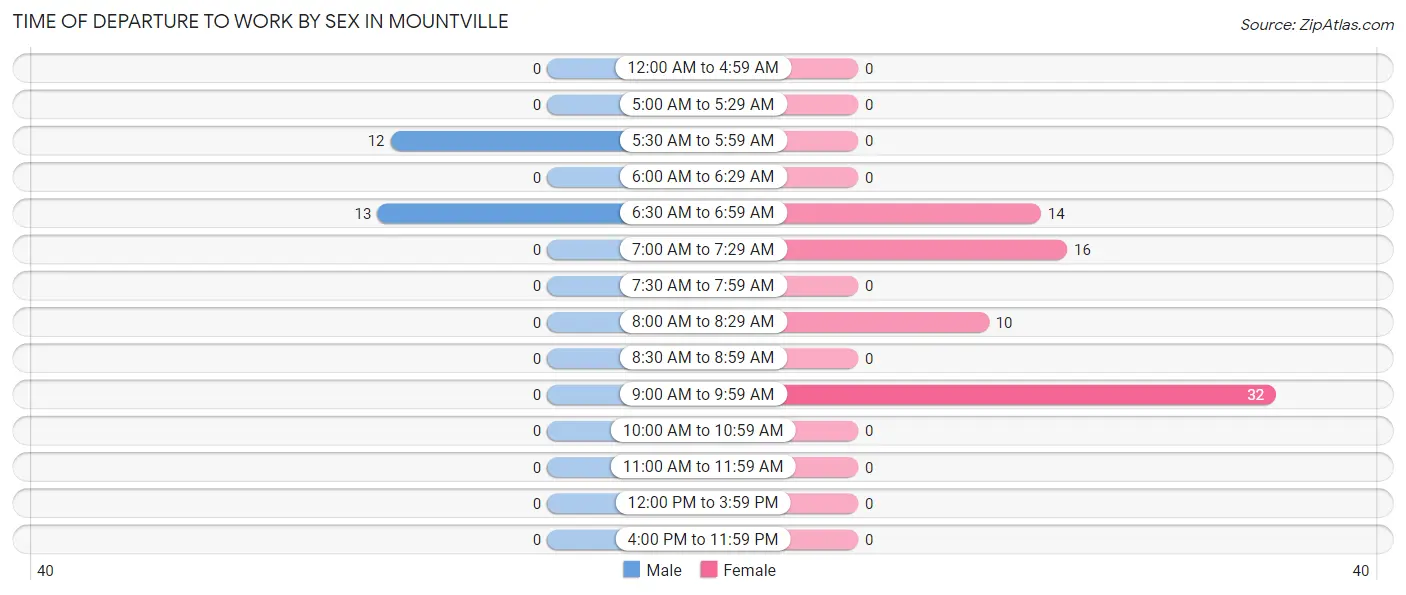
Time of Departure to Work by Sex in Mountville
The most frequent times of departure to work in Mountville are 6:30 AM to 6:59 AM (13, 52.0%) for males and 9:00 AM to 9:59 AM (32, 44.4%) for females.
| Time of Departure | Male | Female |
| 12:00 AM to 4:59 AM | 0 (0.0%) | 0 (0.0%) |
| 5:00 AM to 5:29 AM | 0 (0.0%) | 0 (0.0%) |
| 5:30 AM to 5:59 AM | 12 (48.0%) | 0 (0.0%) |
| 6:00 AM to 6:29 AM | 0 (0.0%) | 0 (0.0%) |
| 6:30 AM to 6:59 AM | 13 (52.0%) | 14 (19.4%) |
| 7:00 AM to 7:29 AM | 0 (0.0%) | 16 (22.2%) |
| 7:30 AM to 7:59 AM | 0 (0.0%) | 0 (0.0%) |
| 8:00 AM to 8:29 AM | 0 (0.0%) | 10 (13.9%) |
| 8:30 AM to 8:59 AM | 0 (0.0%) | 0 (0.0%) |
| 9:00 AM to 9:59 AM | 0 (0.0%) | 32 (44.4%) |
| 10:00 AM to 10:59 AM | 0 (0.0%) | 0 (0.0%) |
| 11:00 AM to 11:59 AM | 0 (0.0%) | 0 (0.0%) |
| 12:00 PM to 3:59 PM | 0 (0.0%) | 0 (0.0%) |
| 4:00 PM to 11:59 PM | 0 (0.0%) | 0 (0.0%) |
| Total | 25 (100.0%) | 72 (100.0%) |
Housing Occupancy in Mountville
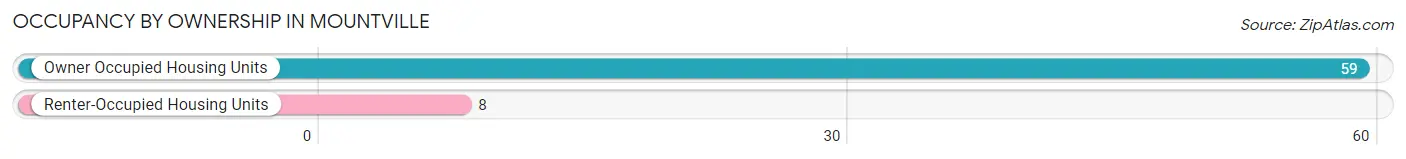
Occupancy by Ownership in Mountville
Of the total 67 dwellings in Mountville, owner-occupied units account for 59 (88.1%), while renter-occupied units make up 8 (11.9%).
| Occupancy | # Housing Units | % Housing Units |
| Owner Occupied Housing Units | 59 | 88.1% |
| Renter-Occupied Housing Units | 8 | 11.9% |
| Total Occupied Housing Units | 67 | 100.0% |
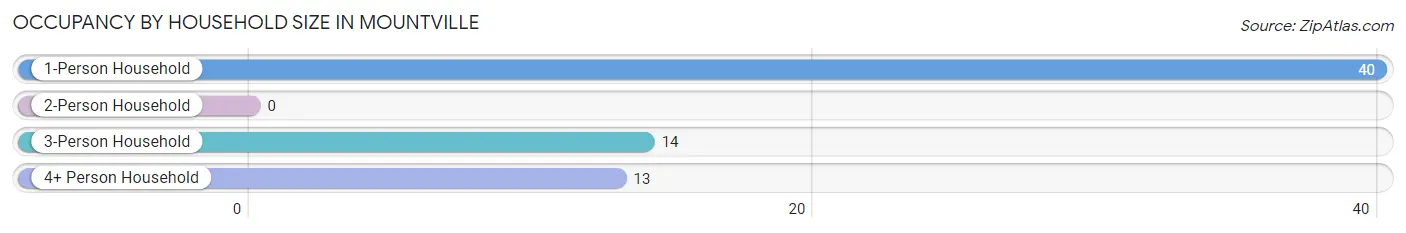
Occupancy by Household Size in Mountville
| Household Size | # Housing Units | % Housing Units |
| 1-Person Household | 40 | 59.7% |
| 2-Person Household | 0 | 0.0% |
| 3-Person Household | 14 | 20.9% |
| 4+ Person Household | 13 | 19.4% |
| Total Housing Units | 67 | 100.0% |
Occupancy by Ownership by Household Size in Mountville
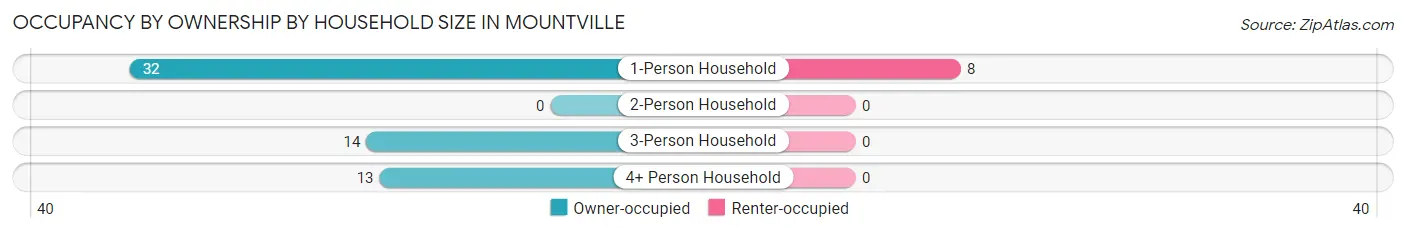
| Household Size | Owner-occupied | Renter-occupied |
| 1-Person Household | 32 (80.0%) | 8 (20.0%) |
| 2-Person Household | 0 (0.0%) | 0 (0.0%) |
| 3-Person Household | 14 (100.0%) | 0 (0.0%) |
| 4+ Person Household | 13 (100.0%) | 0 (0.0%) |
| Total Housing Units | 59 (88.1%) | 8 (11.9%) |
Occupancy by Educational Attainment in Mountville
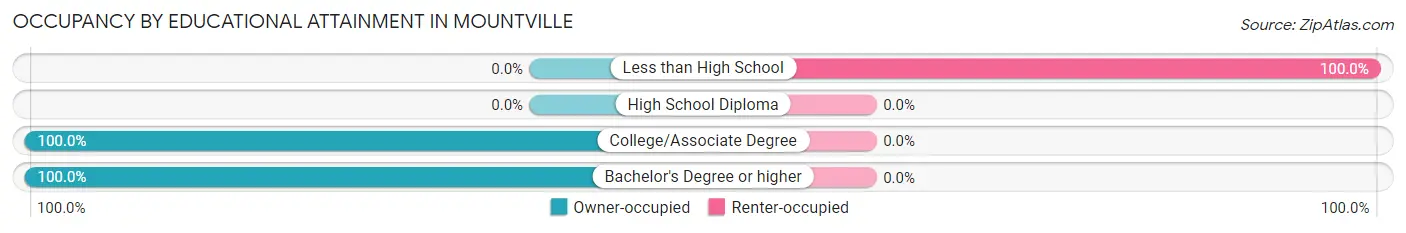
| Household Size | Owner-occupied | Renter-occupied |
| Less than High School | 0 (0.0%) | 8 (100.0%) |
| High School Diploma | 0 (0.0%) | 0 (0.0%) |
| College/Associate Degree | 32 (100.0%) | 0 (0.0%) |
| Bachelor's Degree or higher | 27 (100.0%) | 0 (0.0%) |
Occupancy by Age of Householder in Mountville
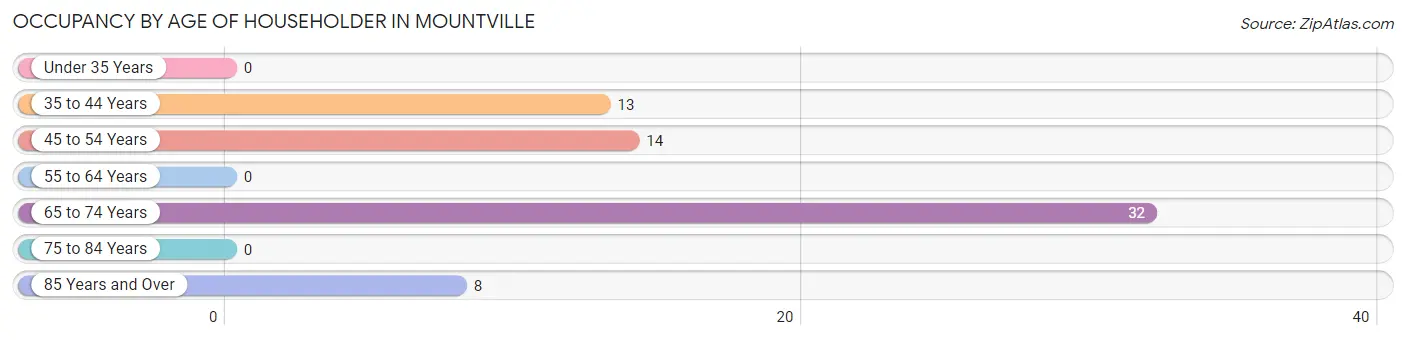
| Age Bracket | # Households | % Households |
| Under 35 Years | 0 | 0.0% |
| 35 to 44 Years | 13 | 19.4% |
| 45 to 54 Years | 14 | 20.9% |
| 55 to 64 Years | 0 | 0.0% |
| 65 to 74 Years | 32 | 47.8% |
| 75 to 84 Years | 0 | 0.0% |
| 85 Years and Over | 8 | 11.9% |
| Total | 67 | 100.0% |
Housing Finances in Mountville
Median Income by Occupancy in Mountville
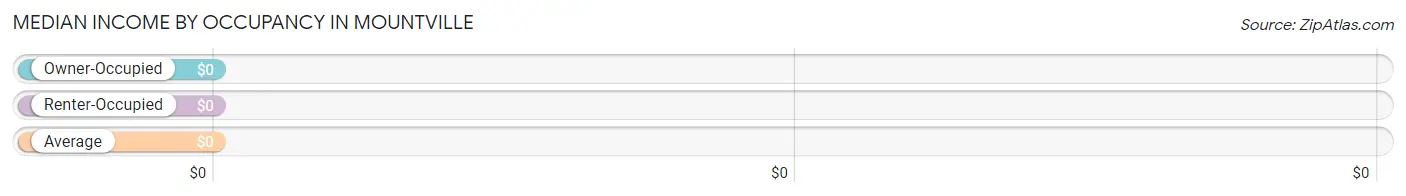
| Occupancy Type | # Households | Median Income |
| Owner-Occupied | 59 (88.1%) | $0 |
| Renter-Occupied | 8 (11.9%) | $0 |
| Average | 67 (100.0%) | $0 |
Occupancy by Householder Income Bracket in Mountville
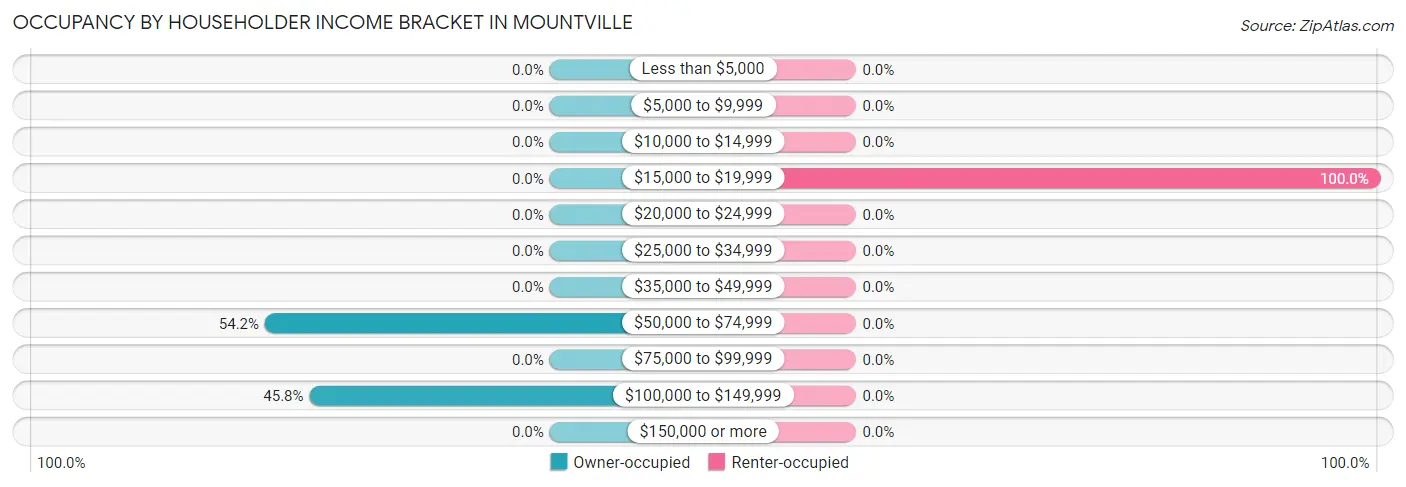
| Income Bracket | Owner-occupied | Renter-occupied |
| Less than $5,000 | 0 (0.0%) | 0 (0.0%) |
| $5,000 to $9,999 | 0 (0.0%) | 0 (0.0%) |
| $10,000 to $14,999 | 0 (0.0%) | 0 (0.0%) |
| $15,000 to $19,999 | 0 (0.0%) | 8 (100.0%) |
| $20,000 to $24,999 | 0 (0.0%) | 0 (0.0%) |
| $25,000 to $34,999 | 0 (0.0%) | 0 (0.0%) |
| $35,000 to $49,999 | 0 (0.0%) | 0 (0.0%) |
| $50,000 to $74,999 | 32 (54.2%) | 0 (0.0%) |
| $75,000 to $99,999 | 0 (0.0%) | 0 (0.0%) |
| $100,000 to $149,999 | 27 (45.8%) | 0 (0.0%) |
| $150,000 or more | 0 (0.0%) | 0 (0.0%) |
| Total | 59 (100.0%) | 8 (100.0%) |
Monthly Housing Cost Tiers in Mountville
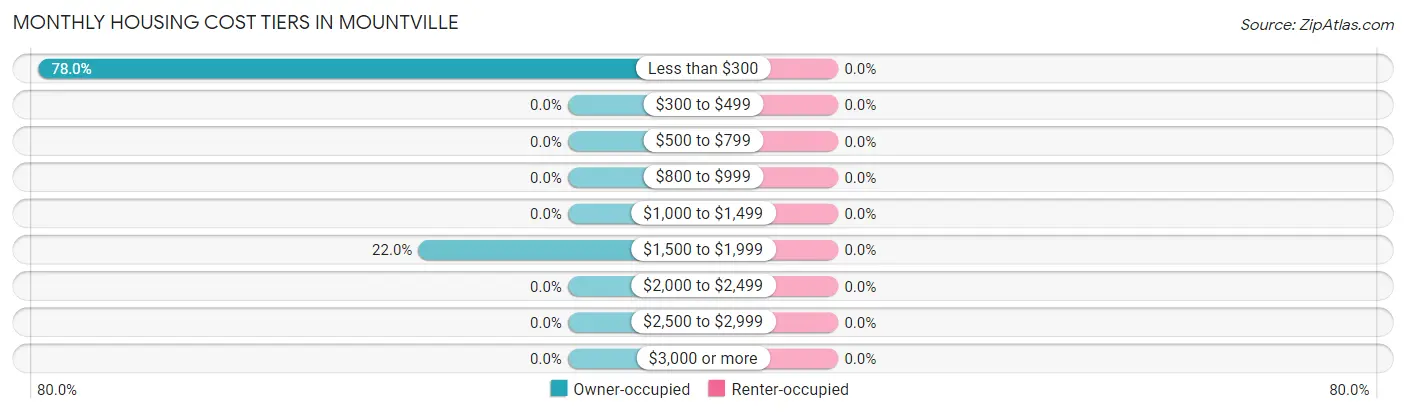
| Monthly Cost | Owner-occupied | Renter-occupied |
| Less than $300 | 46 (78.0%) | 0 (0.0%) |
| $300 to $499 | 0 (0.0%) | 0 (0.0%) |
| $500 to $799 | 0 (0.0%) | 0 (0.0%) |
| $800 to $999 | 0 (0.0%) | 0 (0.0%) |
| $1,000 to $1,499 | 0 (0.0%) | 0 (0.0%) |
| $1,500 to $1,999 | 13 (22.0%) | 0 (0.0%) |
| $2,000 to $2,499 | 0 (0.0%) | 0 (0.0%) |
| $2,500 to $2,999 | 0 (0.0%) | 0 (0.0%) |
| $3,000 or more | 0 (0.0%) | 0 (0.0%) |
| Total | 59 (100.0%) | 8 (100.0%) |
Physical Housing Characteristics in Mountville
Housing Structures in Mountville
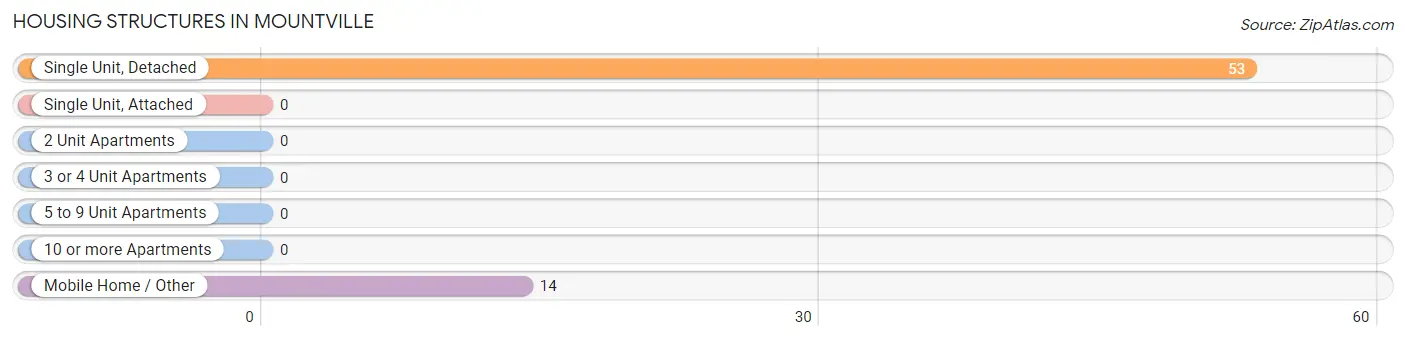
| Structure Type | # Housing Units | % Housing Units |
| Single Unit, Detached | 53 | 79.1% |
| Single Unit, Attached | 0 | 0.0% |
| 2 Unit Apartments | 0 | 0.0% |
| 3 or 4 Unit Apartments | 0 | 0.0% |
| 5 to 9 Unit Apartments | 0 | 0.0% |
| 10 or more Apartments | 0 | 0.0% |
| Mobile Home / Other | 14 | 20.9% |
| Total | 67 | 100.0% |
Housing Structures by Occupancy in Mountville
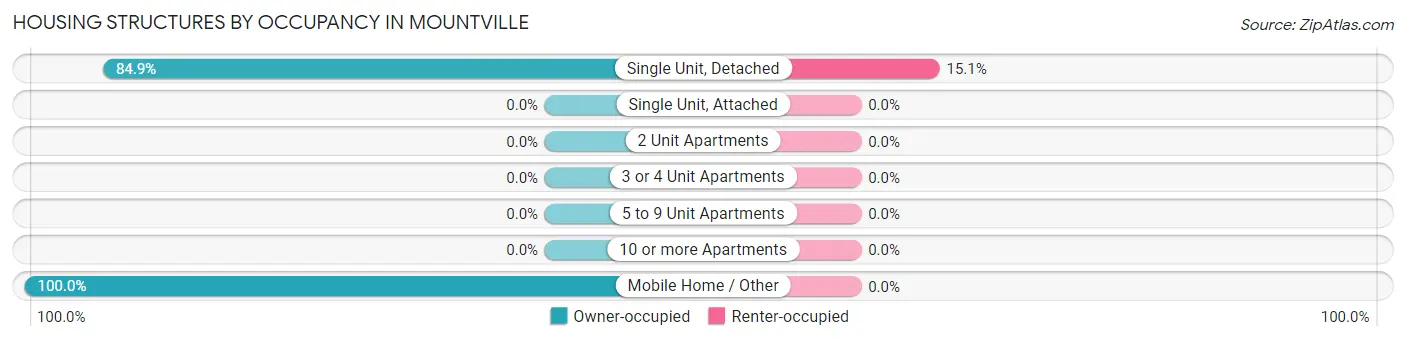
| Structure Type | Owner-occupied | Renter-occupied |
| Single Unit, Detached | 45 (84.9%) | 8 (15.1%) |
| Single Unit, Attached | 0 (0.0%) | 0 (0.0%) |
| 2 Unit Apartments | 0 (0.0%) | 0 (0.0%) |
| 3 or 4 Unit Apartments | 0 (0.0%) | 0 (0.0%) |
| 5 to 9 Unit Apartments | 0 (0.0%) | 0 (0.0%) |
| 10 or more Apartments | 0 (0.0%) | 0 (0.0%) |
| Mobile Home / Other | 14 (100.0%) | 0 (0.0%) |
| Total | 59 (88.1%) | 8 (11.9%) |
Housing Structures by Number of Rooms in Mountville
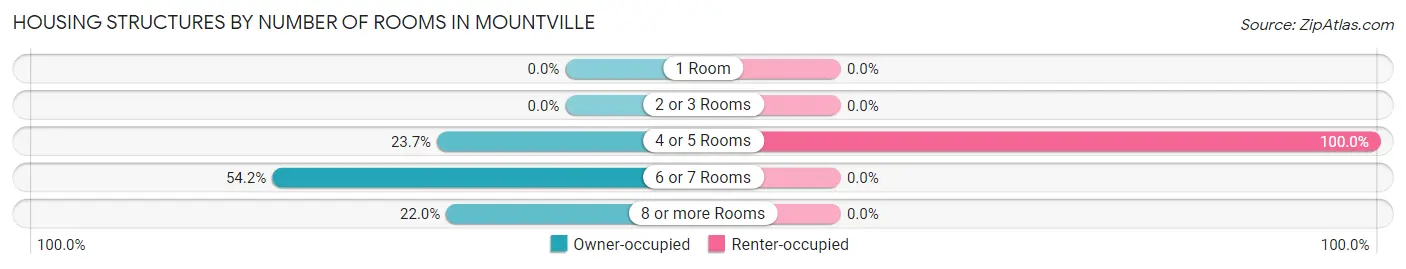
| Number of Rooms | Owner-occupied | Renter-occupied |
| 1 Room | 0 (0.0%) | 0 (0.0%) |
| 2 or 3 Rooms | 0 (0.0%) | 0 (0.0%) |
| 4 or 5 Rooms | 14 (23.7%) | 8 (100.0%) |
| 6 or 7 Rooms | 32 (54.2%) | 0 (0.0%) |
| 8 or more Rooms | 13 (22.0%) | 0 (0.0%) |
| Total | 59 (100.0%) | 8 (100.0%) |
Housing Structure by Heating Type in Mountville
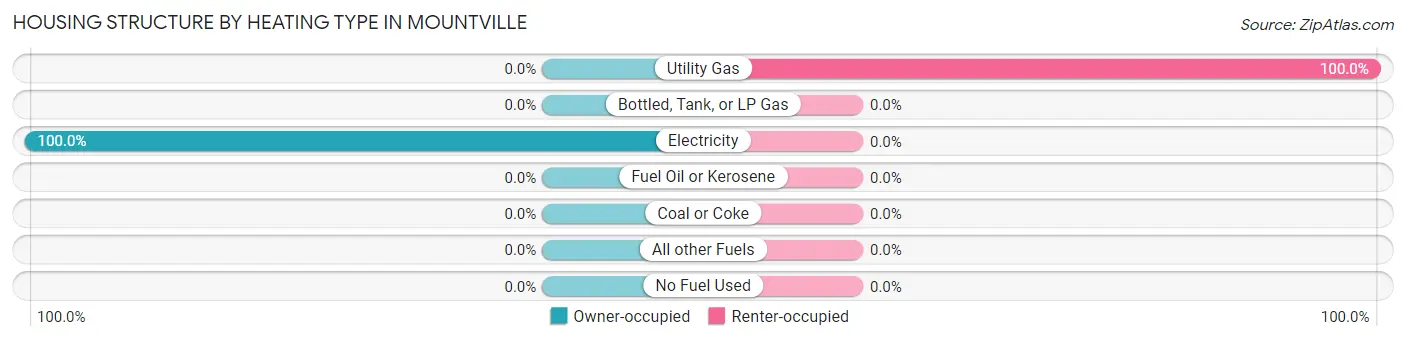
| Heating Type | Owner-occupied | Renter-occupied |
| Utility Gas | 0 (0.0%) | 8 (100.0%) |
| Bottled, Tank, or LP Gas | 0 (0.0%) | 0 (0.0%) |
| Electricity | 59 (100.0%) | 0 (0.0%) |
| Fuel Oil or Kerosene | 0 (0.0%) | 0 (0.0%) |
| Coal or Coke | 0 (0.0%) | 0 (0.0%) |
| All other Fuels | 0 (0.0%) | 0 (0.0%) |
| No Fuel Used | 0 (0.0%) | 0 (0.0%) |
| Total | 59 (100.0%) | 8 (100.0%) |
Household Vehicle Usage in Mountville
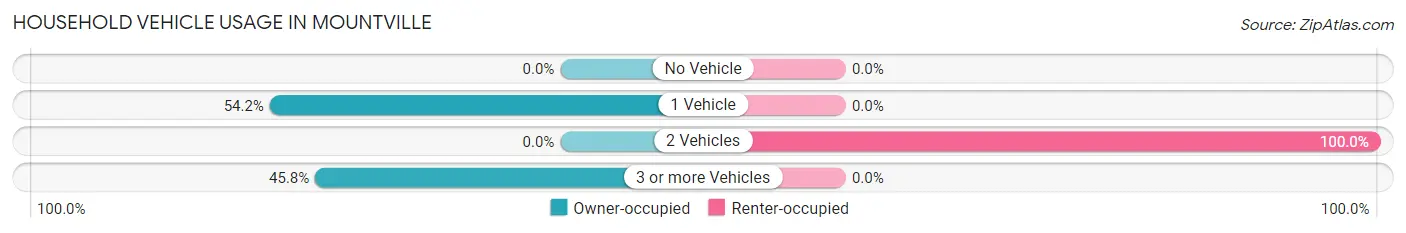
| Vehicles per Household | Owner-occupied | Renter-occupied |
| No Vehicle | 0 (0.0%) | 0 (0.0%) |
| 1 Vehicle | 32 (54.2%) | 0 (0.0%) |
| 2 Vehicles | 0 (0.0%) | 8 (100.0%) |
| 3 or more Vehicles | 27 (45.8%) | 0 (0.0%) |
| Total | 59 (100.0%) | 8 (100.0%) |
Real Estate & Mortgages in Mountville
Real Estate and Mortgage Overview in Mountville
| Characteristic | Without Mortgage | With Mortgage |
| Housing Units | 46 | 13 |
| Median Property Value | - | - |
| Median Household Income | - | - |
| Monthly Housing Costs | - | - |
| Real Estate Taxes | - | - |
Property Value by Mortgage Status in Mountville
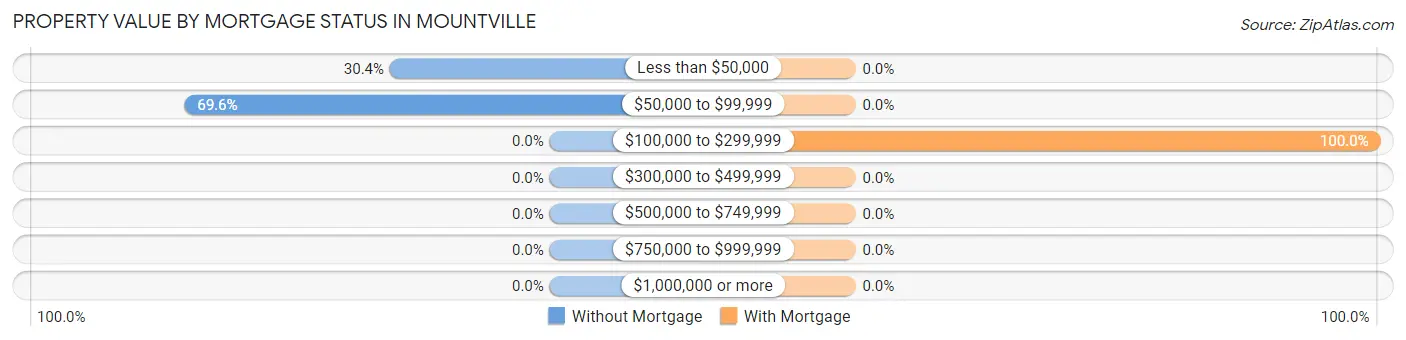
| Property Value | Without Mortgage | With Mortgage |
| Less than $50,000 | 14 (30.4%) | 0 (0.0%) |
| $50,000 to $99,999 | 32 (69.6%) | 0 (0.0%) |
| $100,000 to $299,999 | 0 (0.0%) | 13 (100.0%) |
| $300,000 to $499,999 | 0 (0.0%) | 0 (0.0%) |
| $500,000 to $749,999 | 0 (0.0%) | 0 (0.0%) |
| $750,000 to $999,999 | 0 (0.0%) | 0 (0.0%) |
| $1,000,000 or more | 0 (0.0%) | 0 (0.0%) |
| Total | 46 (100.0%) | 13 (100.0%) |
Household Income by Mortgage Status in Mountville
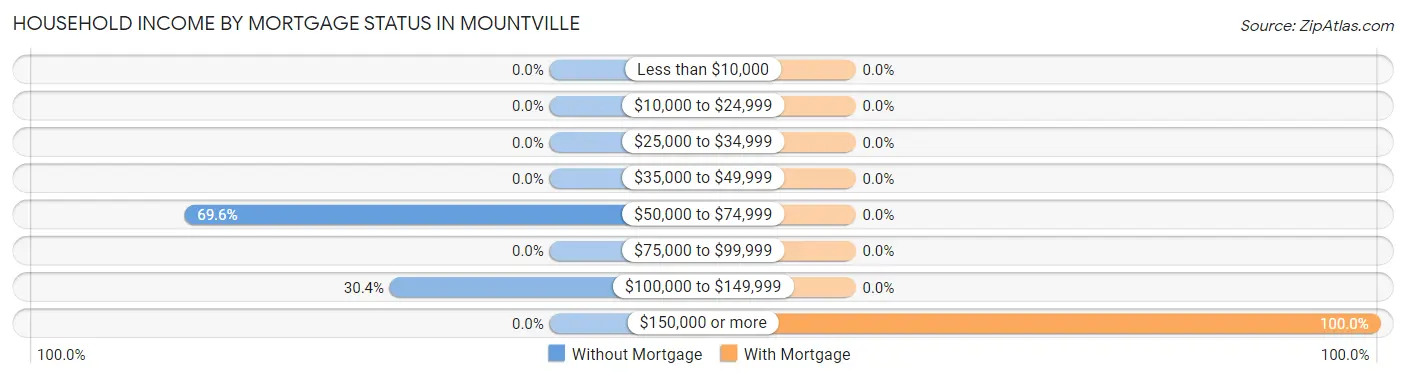
| Household Income | Without Mortgage | With Mortgage |
| Less than $10,000 | 0 (0.0%) | 0 (0.0%) |
| $10,000 to $24,999 | 0 (0.0%) | 0 (0.0%) |
| $25,000 to $34,999 | 0 (0.0%) | 0 (0.0%) |
| $35,000 to $49,999 | 0 (0.0%) | 0 (0.0%) |
| $50,000 to $74,999 | 32 (69.6%) | 0 (0.0%) |
| $75,000 to $99,999 | 0 (0.0%) | 0 (0.0%) |
| $100,000 to $149,999 | 14 (30.4%) | 0 (0.0%) |
| $150,000 or more | 0 (0.0%) | 13 (100.0%) |
| Total | 46 (100.0%) | 13 (100.0%) |
Property Value to Household Income Ratio in Mountville
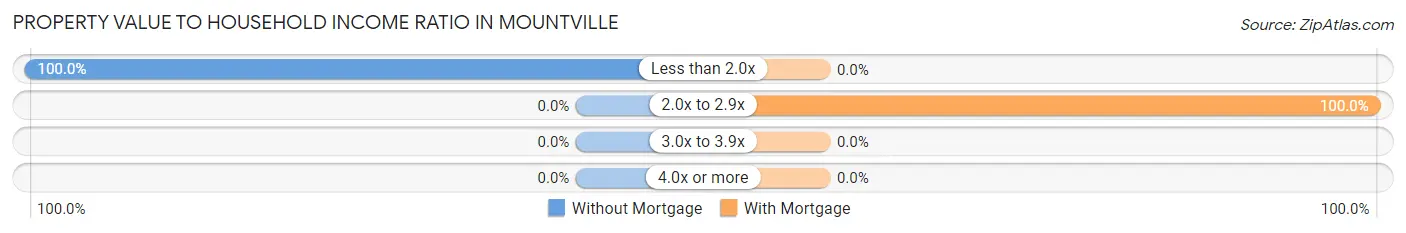
| Value-to-Income Ratio | Without Mortgage | With Mortgage |
| Less than 2.0x | 46 (100.0%) | 0 (0.0%) |
| 2.0x to 2.9x | 0 (0.0%) | 13 (100.0%) |
| 3.0x to 3.9x | 0 (0.0%) | 0 (0.0%) |
| 4.0x or more | 0 (0.0%) | 0 (0.0%) |
| Total | 46 (100.0%) | 13 (100.0%) |
Real Estate Taxes by Mortgage Status in Mountville
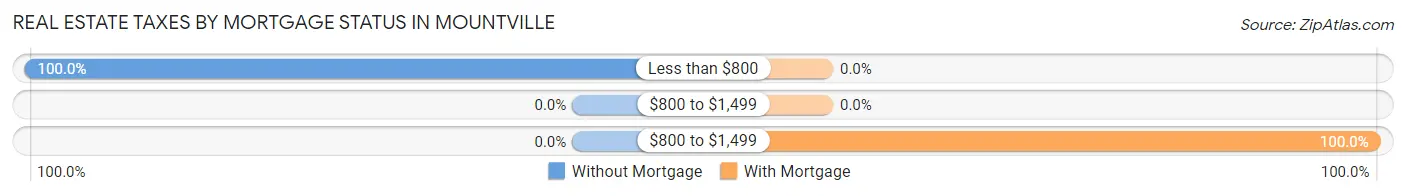
| Property Taxes | Without Mortgage | With Mortgage |
| Less than $800 | 46 (100.0%) | 0 (0.0%) |
| $800 to $1,499 | 0 (0.0%) | 0 (0.0%) |
| $800 to $1,499 | 0 (0.0%) | 13 (100.0%) |
| Total | 46 (100.0%) | 13 (100.0%) |
Health & Disability in Mountville
Health Insurance Coverage by Age in Mountville
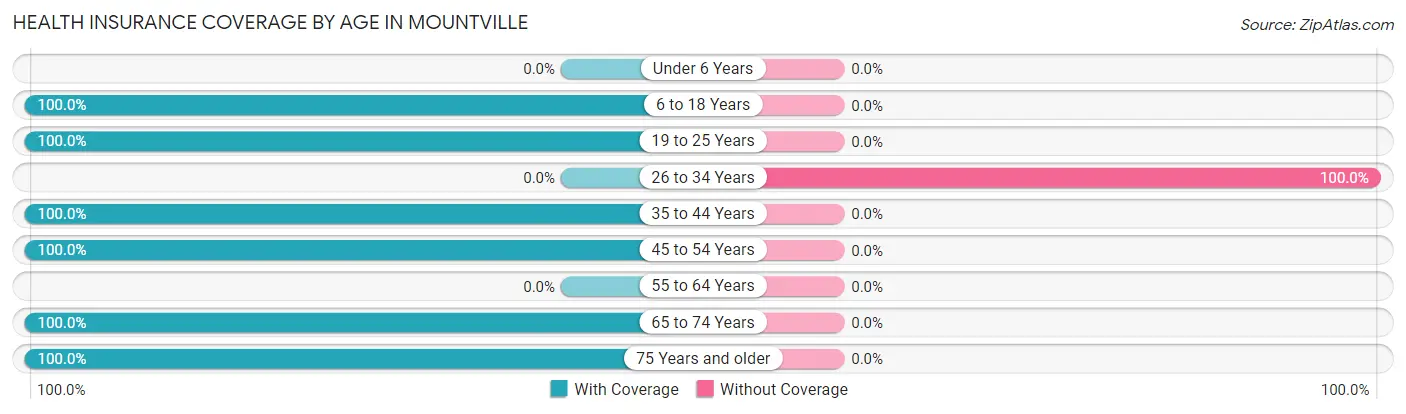
| Age Bracket | With Coverage | Without Coverage |
| Under 6 Years | 0 (0.0%) | 0 (0.0%) |
| 6 to 18 Years | 30 (100.0%) | 0 (0.0%) |
| 19 to 25 Years | 16 (100.0%) | 0 (0.0%) |
| 26 to 34 Years | 0 (0.0%) | 10 (100.0%) |
| 35 to 44 Years | 13 (100.0%) | 0 (0.0%) |
| 45 to 54 Years | 26 (100.0%) | 0 (0.0%) |
| 55 to 64 Years | 0 (0.0%) | 0 (0.0%) |
| 65 to 74 Years | 32 (100.0%) | 0 (0.0%) |
| 75 Years and older | 8 (100.0%) | 0 (0.0%) |
| Total | 125 (92.6%) | 10 (7.4%) |
Health Insurance Coverage by Citizenship Status in Mountville
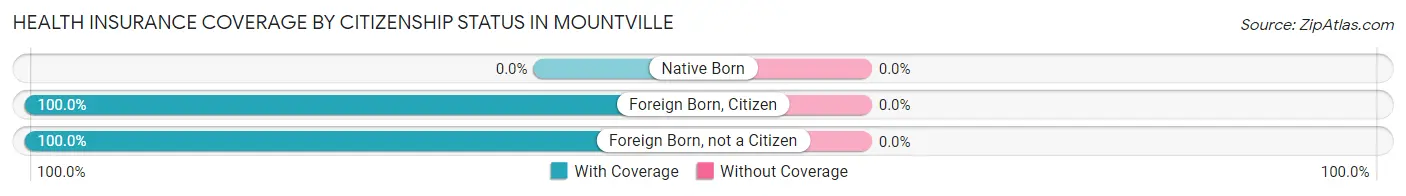
| Citizenship Status | With Coverage | Without Coverage |
| Native Born | 0 (0.0%) | 0 (0.0%) |
| Foreign Born, Citizen | 30 (100.0%) | 0 (0.0%) |
| Foreign Born, not a Citizen | 16 (100.0%) | 0 (0.0%) |
Health Insurance Coverage by Household Income in Mountville
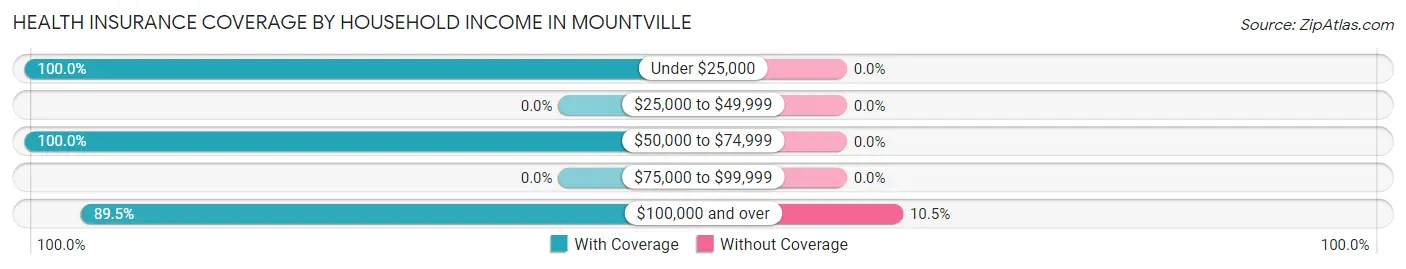
| Household Income | With Coverage | Without Coverage |
| Under $25,000 | 8 (100.0%) | 0 (0.0%) |
| $25,000 to $49,999 | 0 (0.0%) | 0 (0.0%) |
| $50,000 to $74,999 | 32 (100.0%) | 0 (0.0%) |
| $75,000 to $99,999 | 0 (0.0%) | 0 (0.0%) |
| $100,000 and over | 85 (89.5%) | 10 (10.5%) |
Public vs Private Health Insurance Coverage by Age in Mountville
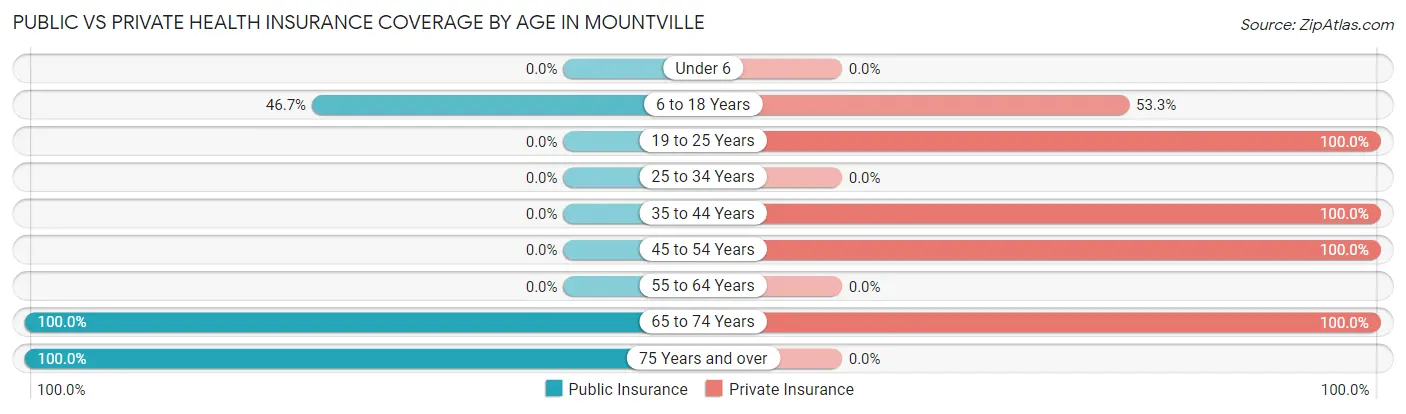
| Age Bracket | Public Insurance | Private Insurance |
| Under 6 | 0 (0.0%) | 0 (0.0%) |
| 6 to 18 Years | 14 (46.7%) | 16 (53.3%) |
| 19 to 25 Years | 0 (0.0%) | 16 (100.0%) |
| 25 to 34 Years | 0 (0.0%) | 0 (0.0%) |
| 35 to 44 Years | 0 (0.0%) | 13 (100.0%) |
| 45 to 54 Years | 0 (0.0%) | 26 (100.0%) |
| 55 to 64 Years | 0 (0.0%) | 0 (0.0%) |
| 65 to 74 Years | 32 (100.0%) | 32 (100.0%) |
| 75 Years and over | 8 (100.0%) | 0 (0.0%) |
| Total | 54 (40.0%) | 103 (76.3%) |
Disability Status by Sex by Age in Mountville
| Age Bracket | Male | Female |
| Under 5 Years | 0 (0.0%) | 0 (0.0%) |
| 5 to 17 Years | 0 (0.0%) | 0 (0.0%) |
| 18 to 34 Years | 0 (0.0%) | 0 (0.0%) |
| 35 to 64 Years | 0 (0.0%) | 0 (0.0%) |
| 65 to 74 Years | 0 (0.0%) | 0 (0.0%) |
| 75 Years and over | 0 (0.0%) | 0 (0.0%) |
Disability Class by Sex by Age in Mountville
Disability Class: Hearing Difficulty
| Age Bracket | Male | Female |
| Under 5 Years | 0 (0.0%) | 0 (0.0%) |
| 5 to 17 Years | 0 (0.0%) | 0 (0.0%) |
| 18 to 34 Years | 0 (0.0%) | 0 (0.0%) |
| 35 to 64 Years | 0 (0.0%) | 0 (0.0%) |
| 65 to 74 Years | 0 (0.0%) | 0 (0.0%) |
| 75 Years and over | 0 (0.0%) | 0 (0.0%) |
Disability Class: Vision Difficulty
| Age Bracket | Male | Female |
| Under 5 Years | 0 (0.0%) | 0 (0.0%) |
| 5 to 17 Years | 0 (0.0%) | 0 (0.0%) |
| 18 to 34 Years | 0 (0.0%) | 0 (0.0%) |
| 35 to 64 Years | 0 (0.0%) | 0 (0.0%) |
| 65 to 74 Years | 0 (0.0%) | 0 (0.0%) |
| 75 Years and over | 0 (0.0%) | 0 (0.0%) |
Disability Class: Cognitive Difficulty
| Age Bracket | Male | Female |
| 5 to 17 Years | 0 (0.0%) | 0 (0.0%) |
| 18 to 34 Years | 0 (0.0%) | 0 (0.0%) |
| 35 to 64 Years | 0 (0.0%) | 0 (0.0%) |
| 65 to 74 Years | 0 (0.0%) | 0 (0.0%) |
| 75 Years and over | 0 (0.0%) | 0 (0.0%) |
Disability Class: Ambulatory Difficulty
| Age Bracket | Male | Female |
| 5 to 17 Years | 0 (0.0%) | 0 (0.0%) |
| 18 to 34 Years | 0 (0.0%) | 0 (0.0%) |
| 35 to 64 Years | 0 (0.0%) | 0 (0.0%) |
| 65 to 74 Years | 0 (0.0%) | 0 (0.0%) |
| 75 Years and over | 0 (0.0%) | 0 (0.0%) |
Disability Class: Self-Care Difficulty
| Age Bracket | Male | Female |
| 5 to 17 Years | 0 (0.0%) | 0 (0.0%) |
| 18 to 34 Years | 0 (0.0%) | 0 (0.0%) |
| 35 to 64 Years | 0 (0.0%) | 0 (0.0%) |
| 65 to 74 Years | 0 (0.0%) | 0 (0.0%) |
| 75 Years and over | 0 (0.0%) | 0 (0.0%) |
Technology Access in Mountville
Computing Device Access in Mountville
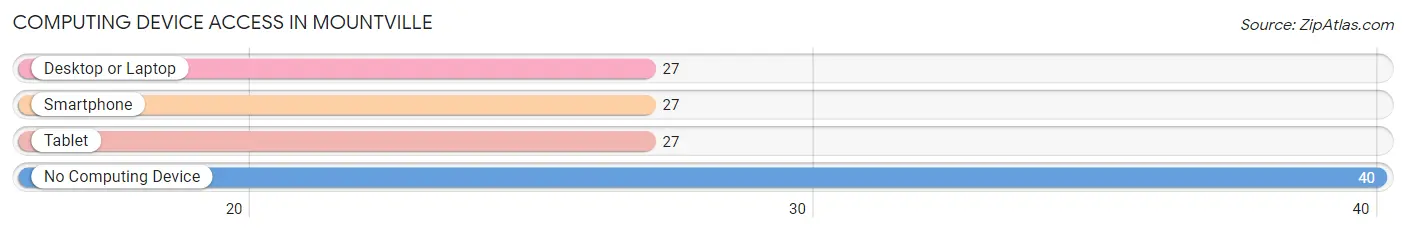
| Device Type | # Households | % Households |
| Desktop or Laptop | 27 | 40.3% |
| Smartphone | 27 | 40.3% |
| Tablet | 27 | 40.3% |
| No Computing Device | 40 | 59.7% |
| Total | 67 | 100.0% |
Internet Access in Mountville

| Internet Type | # Households | % Households |
| Dial-Up Internet | 0 | 0.0% |
| Broadband Home | 27 | 40.3% |
| Cellular Data Only | 0 | 0.0% |
| Satellite Internet | 13 | 19.4% |
| No Internet | 40 | 59.7% |
| Total | 67 | 100.0% |
Mountville Summary
Mountville, South Carolina is a small town located in the northwestern corner of the state, in Lancaster County. It is situated on the banks of the Catawba River, and is home to a population of just over 1,000 people. The town was founded in 1845, and has a rich history that is intertwined with the history of the Catawba Nation.
Geography
Mountville is located in the Piedmont region of South Carolina, and is situated on the banks of the Catawba River. The town is located in the northwestern corner of the state, and is bordered by the towns of Kershaw, Heath Springs, and Lancaster. The town is situated at an elevation of approximately 500 feet above sea level, and is located in the Catawba River Valley. The town is located in a rural area, and is surrounded by rolling hills and forests.
Economy
The economy of Mountville is largely based on agriculture and manufacturing. The town is home to several small businesses, including a grocery store, a hardware store, and a few restaurants. The town is also home to a number of small farms, which produce a variety of crops, including corn, soybeans, and cotton. The town is also home to a number of manufacturing companies, which produce a variety of products, including furniture, textiles, and automotive parts.
Demographics
As of the 2010 census, the population of Mountville was 1,072. The town is predominantly white, with a population that is approximately 90% white. The town also has a small African American population, which makes up approximately 5% of the population. The town also has a small Hispanic population, which makes up approximately 2% of the population. The median household income in the town is approximately $35,000, and the median home value is approximately $90,000.
History
Mountville was founded in 1845, and was originally known as Mountville Station. The town was named after the nearby Mountville Church, which was built in 1845. The town was originally a stop on the Charlotte and South Carolina Railroad, and was a popular destination for travelers. The town was also home to a number of mills, which produced a variety of products, including textiles and furniture. The town was also home to a number of small farms, which produced a variety of crops, including corn, soybeans, and cotton.
In the late 19th century, the town was home to a number of prominent citizens, including the prominent Catawba Nation leader, Chief William Harris. Chief Harris was a leader of the Catawba Nation, and was instrumental in the development of the town. He was also a leader in the fight for Native American rights, and was a prominent figure in the civil rights movement.
Mountville is a small town with a rich history and a bright future. The town is home to a diverse population, and is a great place to live and work. The town is also home to a number of small businesses, which provide a variety of goods and services to the community. The town is also home to a number of small farms, which produce a variety of crops, and is a great place to visit and explore.
Common Questions
What is Per Capita Income in Mountville?
Per Capita income in Mountville is $39,007.
What is Inequality or Gini Index in Mountville?
Inequality or Gini Index in Mountville is 0.22.
What is the Total Population of Mountville?
Total Population of Mountville is 135.
What is the Total Male Population of Mountville?
Total Male Population of Mountville is 63.
What is the Total Female Population of Mountville?
Total Female Population of Mountville is 72.
What is the Ratio of Males per 100 Females in Mountville?
There are 87.50 Males per 100 Females in Mountville.
What is the Ratio of Females per 100 Males in Mountville?
There are 114.29 Females per 100 Males in Mountville.
What is the Median Population Age in Mountville?
Median Population Age in Mountville is 40.9 Years.
What is the Average Family Size in Mountville
Average Family Size in Mountville is 3.1 People.
What is the Average Household Size in Mountville
Average Household Size in Mountville is 2.0 People.
How Large is the Labor Force in Mountville?
There are 97 People in the Labor Forcein in Mountville.
What is the Percentage of People in the Labor Force in Mountville?
80.2% of People are in the Labor Force in Mountville.