Welcome, SC Map & Demographics
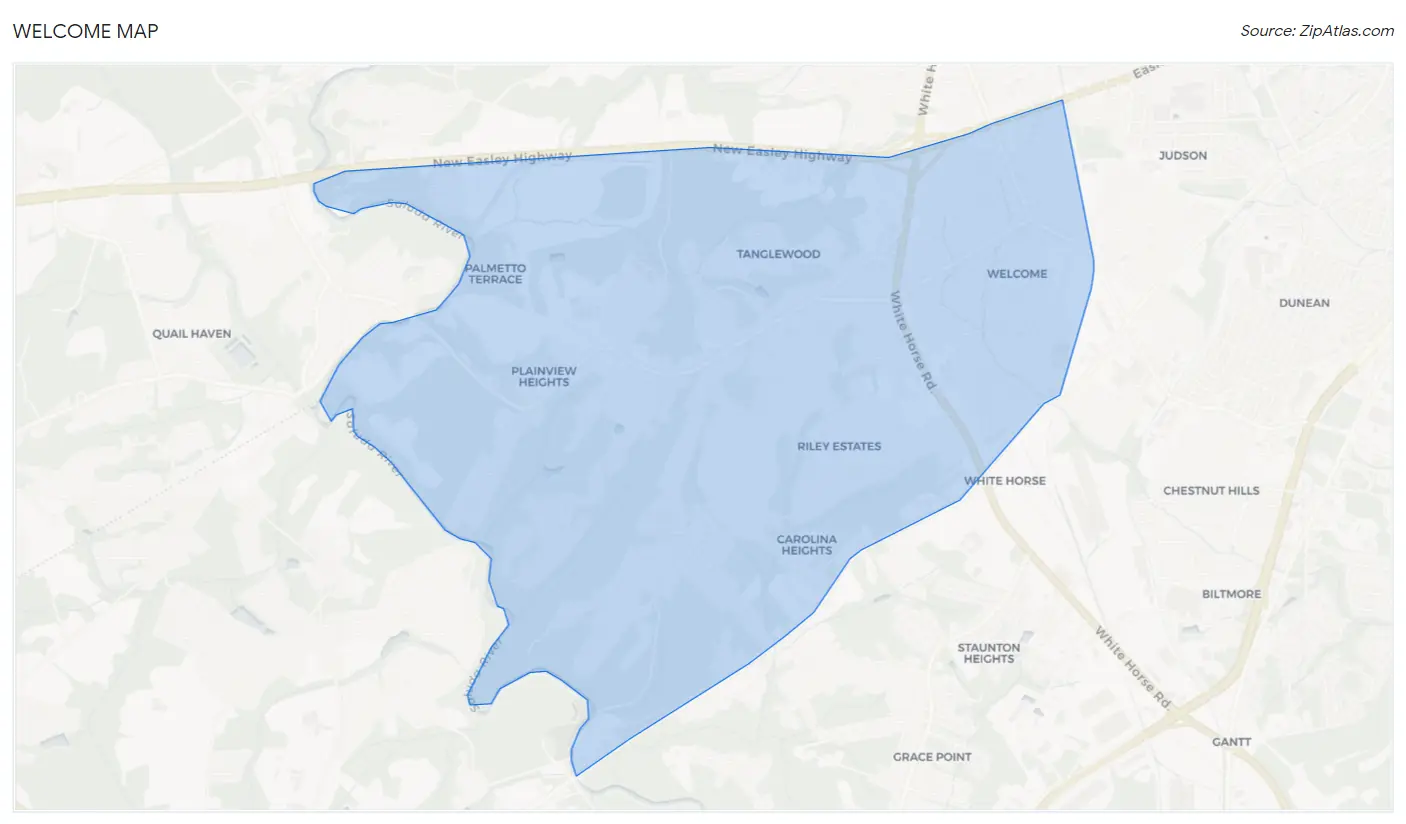
Welcome Map
Welcome Overview
$33,763
PER CAPITA INCOME
$64,138
AVG FAMILY INCOME
$47,730
AVG HOUSEHOLD INCOME
44.0%
WAGE / INCOME GAP [ % ]
56.0¢/ $1
WAGE / INCOME GAP [ $ ]
0.49
INEQUALITY / GINI INDEX
7,153
TOTAL POPULATION
3,379
MALE POPULATION
3,774
FEMALE POPULATION
89.53
MALES / 100 FEMALES
111.69
FEMALES / 100 MALES
36.7
MEDIAN AGE
3.0
AVG FAMILY SIZE
2.2
AVG HOUSEHOLD SIZE
4,175
LABOR FORCE [ PEOPLE ]
69.3%
PERCENT IN LABOR FORCE
5.7%
UNEMPLOYMENT RATE
Income in Welcome
Income Overview in Welcome
Per Capita Income in Welcome is $33,763, while median incomes of families and households are $64,138 and $47,730 respectively.
| Characteristic | Number | Measure |
| Per Capita Income | 7,153 | $33,763 |
| Median Family Income | 1,850 | $64,138 |
| Mean Family Income | 1,850 | $95,689 |
| Median Household Income | 3,227 | $47,730 |
| Mean Household Income | 3,227 | $72,083 |
| Income Deficit | 1,850 | $0 |
| Wage / Income Gap (%) | 7,153 | 43.97% |
| Wage / Income Gap ($) | 7,153 | 56.03¢ per $1 |
| Gini / Inequality Index | 7,153 | 0.49 |
Earnings by Sex in Welcome
Average Earnings in Welcome are $34,375, $46,504 for men and $26,058 for women, a difference of 44.0%.
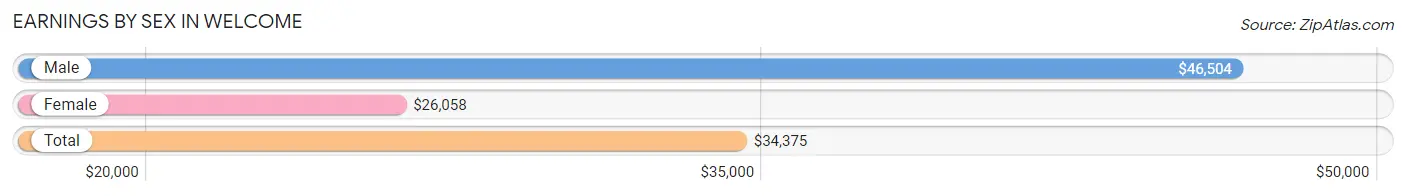
| Sex | Number | Average Earnings |
| Male | 2,345 (56.6%) | $46,504 |
| Female | 1,801 (43.4%) | $26,058 |
| Total | 4,146 (100.0%) | $34,375 |
Earnings by Sex by Income Bracket in Welcome
The most common earnings brackets in Welcome are $100,000+ for men (493 | 21.0%) and $25,000 to $29,999 for women (281 | 15.6%).
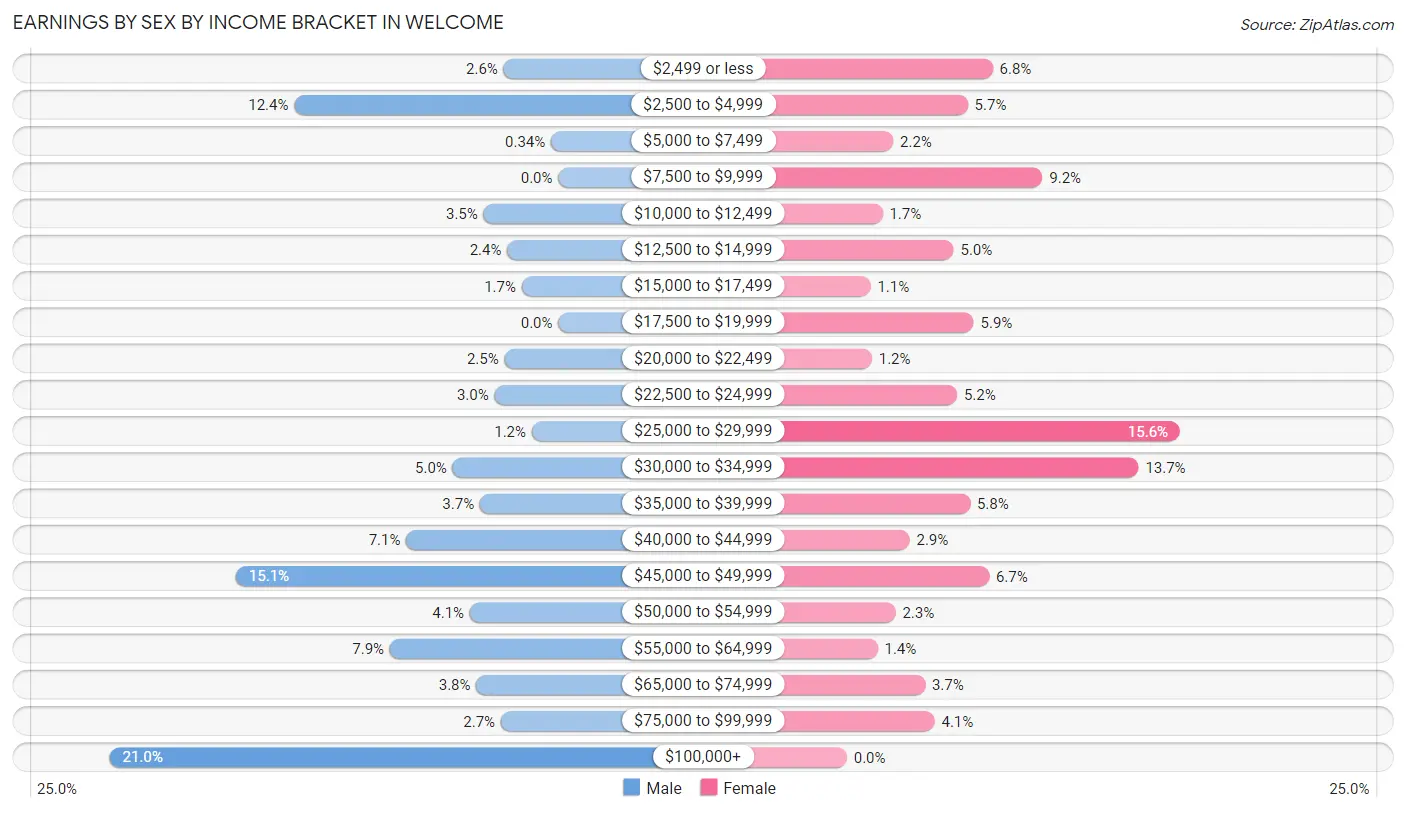
| Income | Male | Female |
| $2,499 or less | 60 (2.6%) | 123 (6.8%) |
| $2,500 to $4,999 | 290 (12.4%) | 102 (5.7%) |
| $5,000 to $7,499 | 8 (0.3%) | 39 (2.2%) |
| $7,500 to $9,999 | 0 (0.0%) | 165 (9.2%) |
| $10,000 to $12,499 | 82 (3.5%) | 30 (1.7%) |
| $12,500 to $14,999 | 56 (2.4%) | 90 (5.0%) |
| $15,000 to $17,499 | 40 (1.7%) | 20 (1.1%) |
| $17,500 to $19,999 | 0 (0.0%) | 107 (5.9%) |
| $20,000 to $22,499 | 59 (2.5%) | 21 (1.2%) |
| $22,500 to $24,999 | 70 (3.0%) | 93 (5.2%) |
| $25,000 to $29,999 | 29 (1.2%) | 281 (15.6%) |
| $30,000 to $34,999 | 116 (5.0%) | 246 (13.7%) |
| $35,000 to $39,999 | 86 (3.7%) | 104 (5.8%) |
| $40,000 to $44,999 | 167 (7.1%) | 53 (2.9%) |
| $45,000 to $49,999 | 354 (15.1%) | 120 (6.7%) |
| $50,000 to $54,999 | 97 (4.1%) | 41 (2.3%) |
| $55,000 to $64,999 | 185 (7.9%) | 26 (1.4%) |
| $65,000 to $74,999 | 90 (3.8%) | 66 (3.7%) |
| $75,000 to $99,999 | 63 (2.7%) | 74 (4.1%) |
| $100,000+ | 493 (21.0%) | 0 (0.0%) |
| Total | 2,345 (100.0%) | 1,801 (100.0%) |
Earnings by Sex by Educational Attainment in Welcome
Average earnings in Welcome are $49,397 for men and $27,361 for women, a difference of 44.6%. Men with an educational attainment of college or associate's degree enjoy the highest average annual earnings of $55,493, while those with less than high school education earn the least with $41,528. Women with an educational attainment of bachelor's degree earn the most with the average annual earnings of $37,179, while those with less than high school education have the smallest earnings of $26,166.
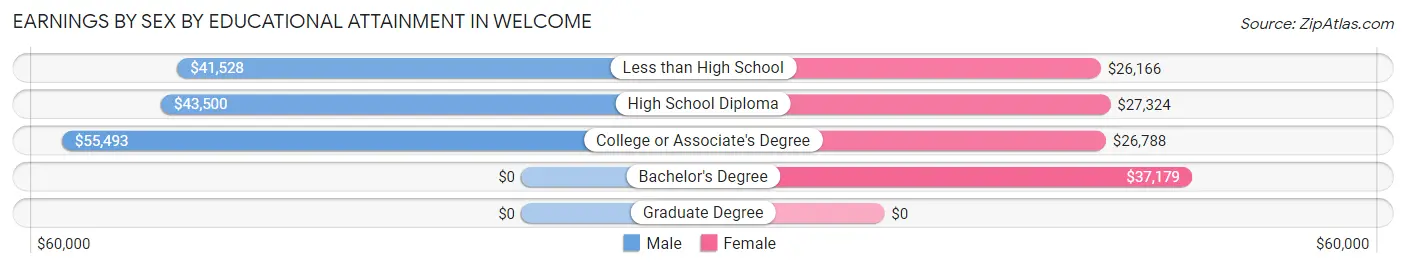
| Educational Attainment | Male Income | Female Income |
| Less than High School | $41,528 | $26,166 |
| High School Diploma | $43,500 | $27,324 |
| College or Associate's Degree | $55,493 | $26,788 |
| Bachelor's Degree | - | - |
| Graduate Degree | - | - |
| Total | $49,397 | $27,361 |
Family Income in Welcome
Family Income Brackets in Welcome
According to the Welcome family income data, there are 426 families falling into the $200,000+ income range, which is the most common income bracket and makes up 23.0% of all families. Conversely, the $150,000 to $199,999 income bracket is the least frequent group with only 6 families (0.3%) belonging to this category.
| Income Bracket | # Families | % Families |
| Less than $10,000 | 26 | 1.4% |
| $10,000 to $14,999 | 100 | 5.4% |
| $15,000 to $24,999 | 9 | 0.5% |
| $25,000 to $34,999 | 285 | 15.4% |
| $35,000 to $49,999 | 340 | 18.4% |
| $50,000 to $74,999 | 320 | 17.3% |
| $75,000 to $99,999 | 250 | 13.5% |
| $100,000 to $149,999 | 91 | 4.9% |
| $150,000 to $199,999 | 6 | 0.3% |
| $200,000+ | 426 | 23.0% |
Family Income by Famaliy Size in Welcome
5-person families (70 | 3.8%) account for the highest median family income in Welcome with $62,697 per family, while 2-person families (716 | 38.7%) have the highest median income of $18,304 per family member.
| Income Bracket | # Families | Median Income |
| 2-Person Families | 716 (38.7%) | $36,607 |
| 3-Person Families | 736 (39.8%) | $0 |
| 4-Person Families | 225 (12.2%) | $60,815 |
| 5-Person Families | 70 (3.8%) | $62,697 |
| 6-Person Families | 102 (5.5%) | $0 |
| 7+ Person Families | 1 (0.1%) | $0 |
| Total | 1,850 (100.0%) | $64,138 |
Family Income by Number of Earners in Welcome
| Number of Earners | # Families | Median Income |
| No Earners | 175 (9.5%) | $0 |
| 1 Earner | 558 (30.2%) | $43,306 |
| 2 Earners | 967 (52.3%) | $0 |
| 3+ Earners | 150 (8.1%) | $138,646 |
| Total | 1,850 (100.0%) | $64,138 |
Household Income in Welcome
Household Income Brackets in Welcome
With 639 households falling in the category, the $50,000 to $74,999 income range is the most frequent in Welcome, accounting for 19.8% of all households. In contrast, only 16 households (0.5%) fall into the $150,000 to $199,999 income bracket, making it the least populous group.
| Income Bracket | # Households | % Households |
| Less than $10,000 | 236 | 7.3% |
| $10,000 to $14,999 | 303 | 9.4% |
| $15,000 to $24,999 | 210 | 6.5% |
| $25,000 to $34,999 | 349 | 10.8% |
| $35,000 to $49,999 | 549 | 17.0% |
| $50,000 to $74,999 | 639 | 19.8% |
| $75,000 to $99,999 | 313 | 9.7% |
| $100,000 to $149,999 | 187 | 5.8% |
| $150,000 to $199,999 | 16 | 0.5% |
| $200,000+ | 426 | 13.2% |
Household Income by Householder Age in Welcome
The median household income in Welcome is $47,730, with the highest median household income of $59,551 found in the 25 to 44 years age bracket for the primary householder. A total of 1,497 households (46.4%) fall into this category. Meanwhile, the 15 to 24 years age bracket for the primary householder has the lowest median household income of $0, with 26 households (0.8%) in this group.
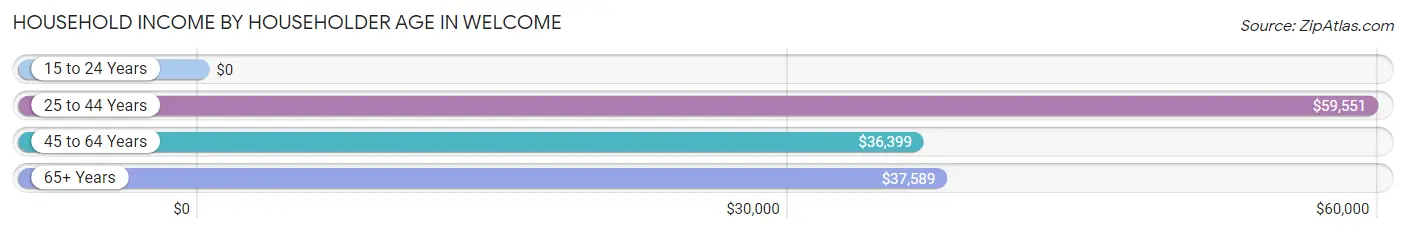
| Income Bracket | # Households | Median Income |
| 15 to 24 Years | 26 (0.8%) | $0 |
| 25 to 44 Years | 1,497 (46.4%) | $59,551 |
| 45 to 64 Years | 1,251 (38.8%) | $36,399 |
| 65+ Years | 453 (14.0%) | $37,589 |
| Total | 3,227 (100.0%) | $47,730 |
Poverty in Welcome
Income Below Poverty by Sex and Age in Welcome
With 6.3% poverty level for males and 14.5% for females among the residents of Welcome, 5 year old males and 55 to 64 year old females are the most vulnerable to poverty, with 19 males (100.0%) and 203 females (35.1%) in their respective age groups living below the poverty level.
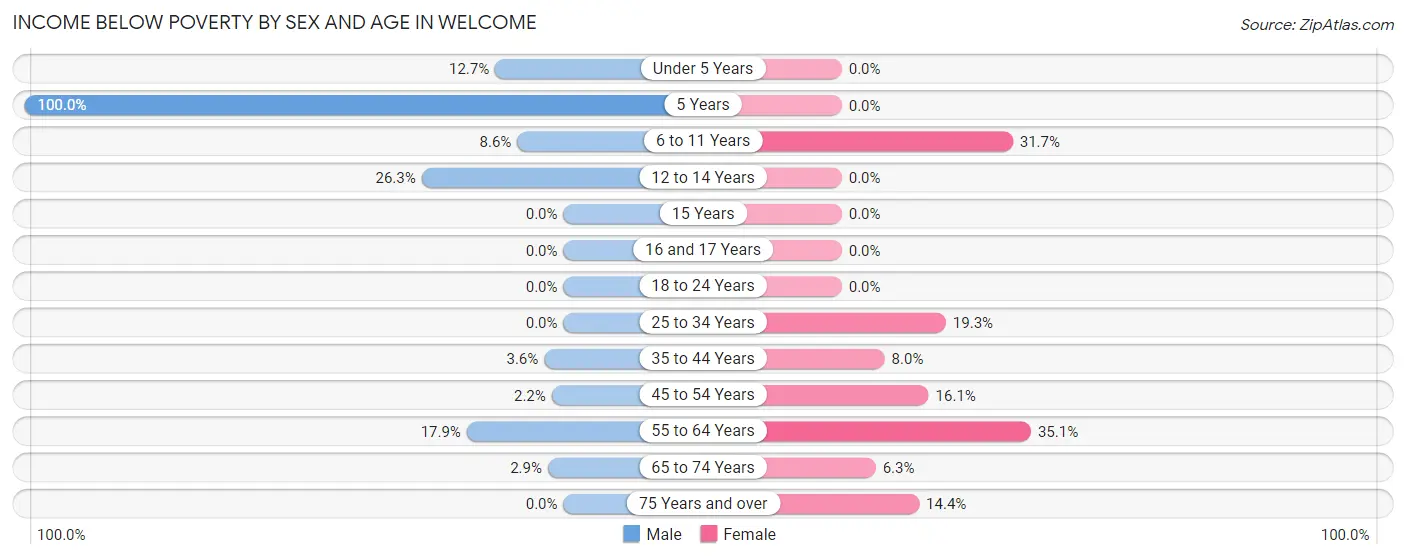
| Age Bracket | Male | Female |
| Under 5 Years | 26 (12.7%) | 0 (0.0%) |
| 5 Years | 19 (100.0%) | 0 (0.0%) |
| 6 to 11 Years | 24 (8.6%) | 73 (31.7%) |
| 12 to 14 Years | 20 (26.3%) | 0 (0.0%) |
| 15 Years | 0 (0.0%) | 0 (0.0%) |
| 16 and 17 Years | 0 (0.0%) | 0 (0.0%) |
| 18 to 24 Years | 0 (0.0%) | 0 (0.0%) |
| 25 to 34 Years | 0 (0.0%) | 115 (19.3%) |
| 35 to 44 Years | 27 (3.6%) | 32 (8.0%) |
| 45 to 54 Years | 8 (2.2%) | 74 (16.1%) |
| 55 to 64 Years | 87 (17.9%) | 203 (35.1%) |
| 65 to 74 Years | 3 (2.9%) | 24 (6.3%) |
| 75 Years and over | 0 (0.0%) | 27 (14.4%) |
| Total | 214 (6.3%) | 548 (14.5%) |
Income Above Poverty by Sex and Age in Welcome
According to the poverty statistics in Welcome, males aged 16 and 17 years and females aged under 5 years are the age groups that are most secure financially, with 100.0% of males and 100.0% of females in these age groups living above the poverty line.
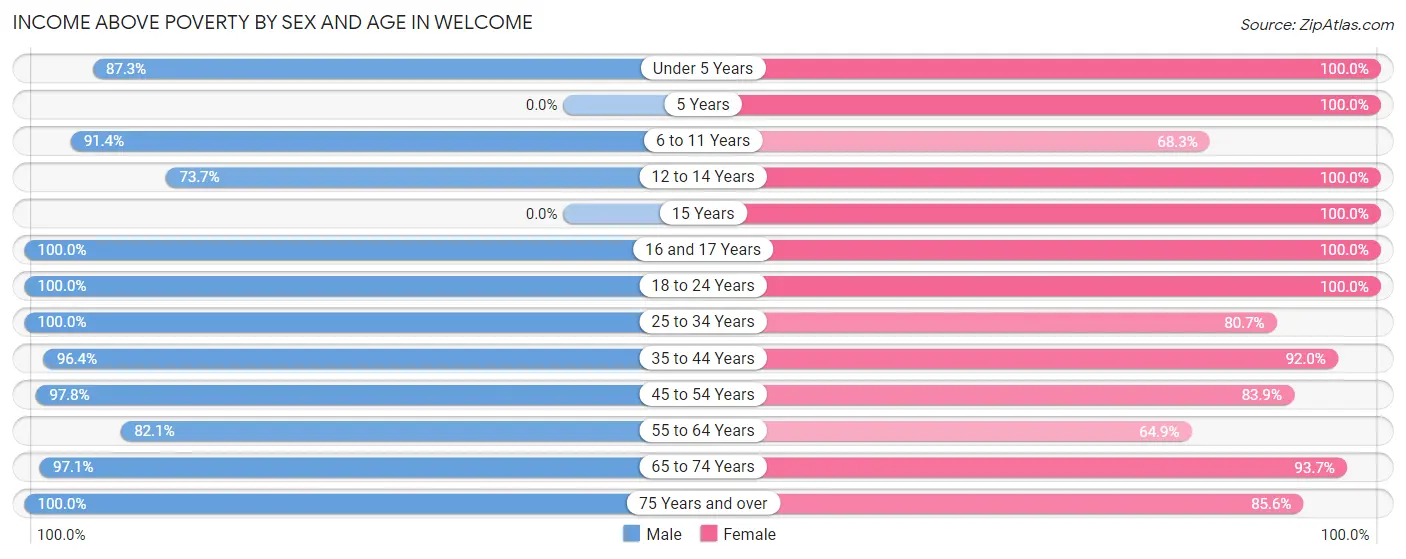
| Age Bracket | Male | Female |
| Under 5 Years | 179 (87.3%) | 154 (100.0%) |
| 5 Years | 0 (0.0%) | 24 (100.0%) |
| 6 to 11 Years | 256 (91.4%) | 157 (68.3%) |
| 12 to 14 Years | 56 (73.7%) | 111 (100.0%) |
| 15 Years | 0 (0.0%) | 26 (100.0%) |
| 16 and 17 Years | 349 (100.0%) | 438 (100.0%) |
| 18 to 24 Years | 120 (100.0%) | 184 (100.0%) |
| 25 to 34 Years | 533 (100.0%) | 480 (80.7%) |
| 35 to 44 Years | 729 (96.4%) | 370 (92.0%) |
| 45 to 54 Years | 359 (97.8%) | 385 (83.9%) |
| 55 to 64 Years | 398 (82.1%) | 375 (64.9%) |
| 65 to 74 Years | 101 (97.1%) | 357 (93.7%) |
| 75 Years and over | 85 (100.0%) | 161 (85.6%) |
| Total | 3,165 (93.7%) | 3,222 (85.5%) |
Income Below Poverty Among Married-Couple Families in Welcome
The poverty statistics for married-couple families in Welcome show that 0.4% or 3 of the total 864 families live below the poverty line. Families with no children have the highest poverty rate of 0.8%, comprising of 3 families. On the other hand, families with 1 or 2 children have the lowest poverty rate of 0.0%, which includes 0 families.
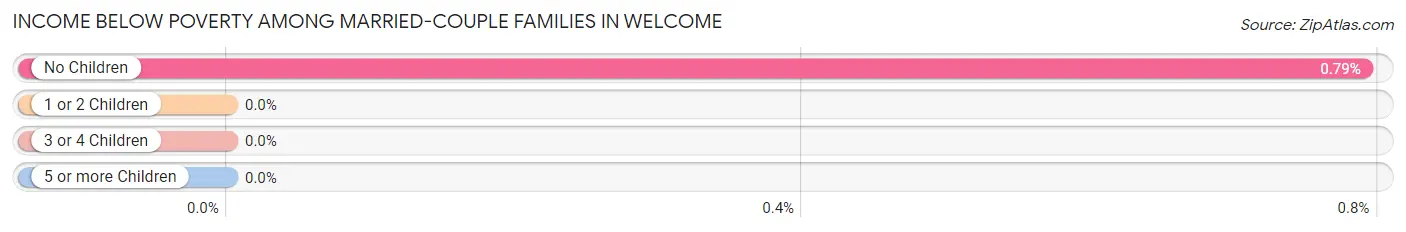
| Children | Above Poverty | Below Poverty |
| No Children | 375 (99.2%) | 3 (0.8%) |
| 1 or 2 Children | 320 (100.0%) | 0 (0.0%) |
| 3 or 4 Children | 166 (100.0%) | 0 (0.0%) |
| 5 or more Children | 0 (0.0%) | 0 (0.0%) |
| Total | 861 (99.7%) | 3 (0.4%) |
Income Below Poverty Among Single-Parent Households in Welcome
According to the poverty data in Welcome, 1.7% or 7 single-father households and 21.4% or 121 single-mother households are living below the poverty line. Among single-father households, those with no children have the highest poverty rate, with 7 households (14.3%) experiencing poverty. Likewise, among single-mother households, those with 1 or 2 children have the highest poverty rate, with 121 households (35.0%) falling below the poverty line.
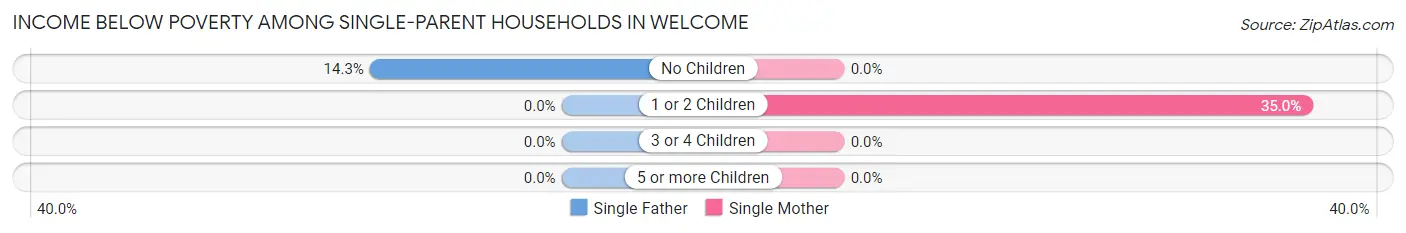
| Children | Single Father | Single Mother |
| No Children | 7 (14.3%) | 0 (0.0%) |
| 1 or 2 Children | 0 (0.0%) | 121 (35.0%) |
| 3 or 4 Children | 0 (0.0%) | 0 (0.0%) |
| 5 or more Children | 0 (0.0%) | 0 (0.0%) |
| Total | 7 (1.7%) | 121 (21.4%) |
Income Below Poverty Among Married-Couple vs Single-Parent Households in Welcome
The poverty data for Welcome shows that 3 of the married-couple family households (0.4%) and 128 of the single-parent households (13.0%) are living below the poverty level. Within the married-couple family households, those with no children have the highest poverty rate, with 3 households (0.8%) falling below the poverty line. Among the single-parent households, those with 1 or 2 children have the highest poverty rate, with 121 household (16.9%) living below poverty.
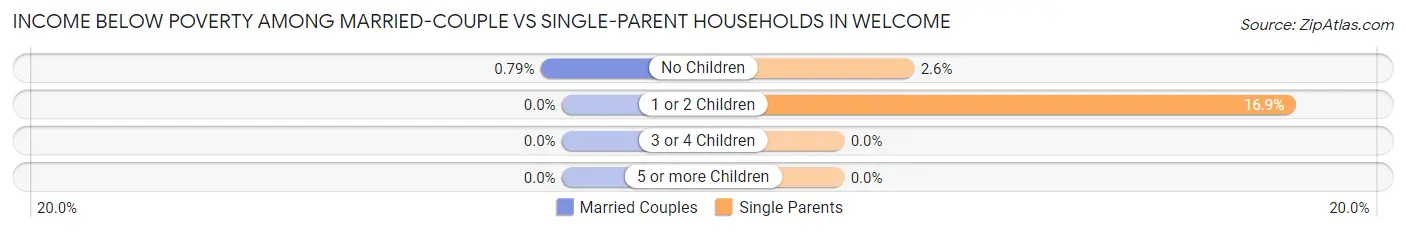
| Children | Married-Couple Families | Single-Parent Households |
| No Children | 3 (0.8%) | 7 (2.6%) |
| 1 or 2 Children | 0 (0.0%) | 121 (16.9%) |
| 3 or 4 Children | 0 (0.0%) | 0 (0.0%) |
| 5 or more Children | 0 (0.0%) | 0 (0.0%) |
| Total | 3 (0.4%) | 128 (13.0%) |
Race in Welcome
The most populous races in Welcome are White / Caucasian (3,730 | 52.1%), Black / African American (1,929 | 27.0%), and Hispanic or Latino (1,359 | 19.0%).
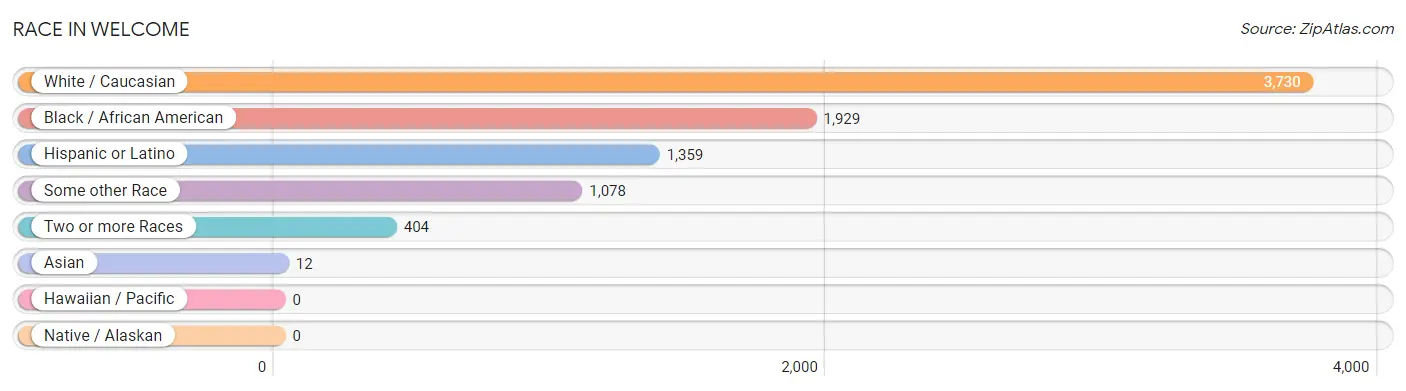
| Race | # Population | % Population |
| Asian | 12 | 0.2% |
| Black / African American | 1,929 | 27.0% |
| Hawaiian / Pacific | 0 | 0.0% |
| Hispanic or Latino | 1,359 | 19.0% |
| Native / Alaskan | 0 | 0.0% |
| White / Caucasian | 3,730 | 52.1% |
| Two or more Races | 404 | 5.7% |
| Some other Race | 1,078 | 15.1% |
| Total | 7,153 | 100.0% |
Ancestry in Welcome
The most populous ancestries reported in Welcome are Mexican (932 | 13.0%), American (563 | 7.9%), German (361 | 5.1%), English (340 | 4.8%), and Central American (300 | 4.2%), together accounting for 34.9% of all Welcome residents.
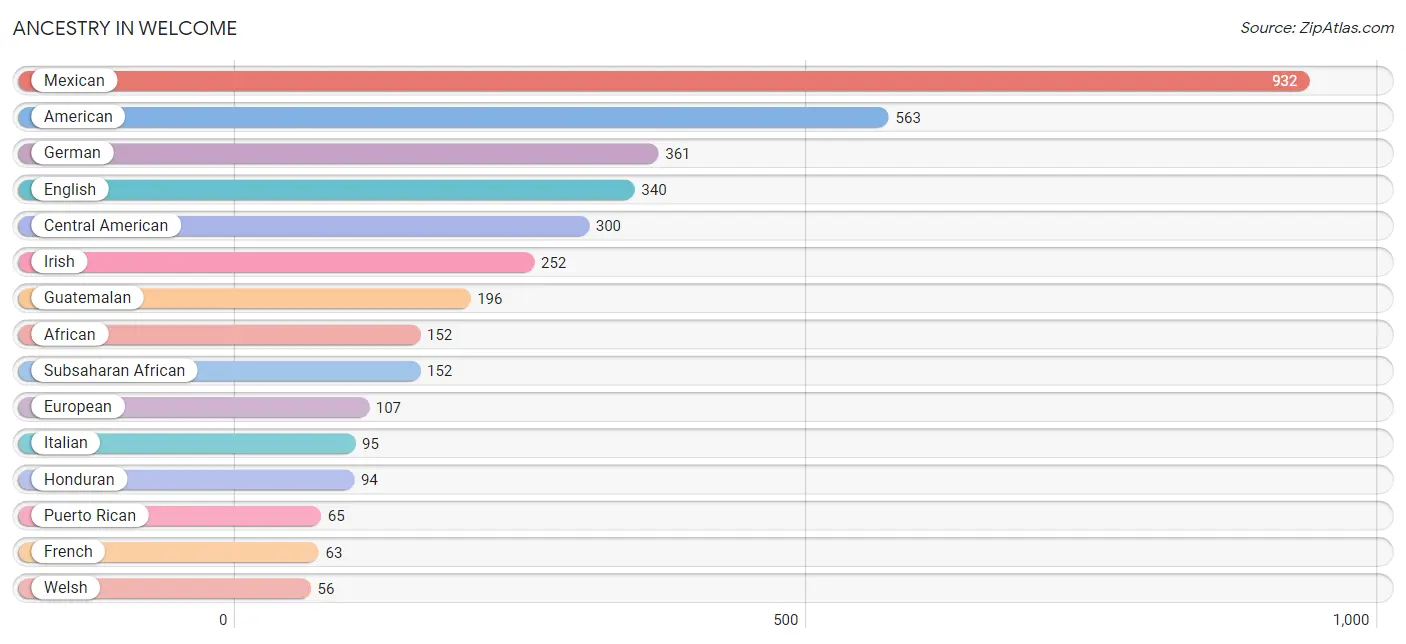
| Ancestry | # Population | % Population |
| African | 152 | 2.1% |
| American | 563 | 7.9% |
| Central American | 300 | 4.2% |
| Cherokee | 4 | 0.1% |
| Colombian | 5 | 0.1% |
| Czechoslovakian | 4 | 0.1% |
| Dominican | 38 | 0.5% |
| Dutch | 27 | 0.4% |
| Eastern European | 32 | 0.4% |
| English | 340 | 4.8% |
| European | 107 | 1.5% |
| French | 63 | 0.9% |
| German | 361 | 5.1% |
| Guatemalan | 196 | 2.7% |
| Haitian | 51 | 0.7% |
| Honduran | 94 | 1.3% |
| Irish | 252 | 3.5% |
| Italian | 95 | 1.3% |
| Jamaican | 50 | 0.7% |
| Korean | 43 | 0.6% |
| Mexican | 932 | 13.0% |
| Nicaraguan | 10 | 0.1% |
| Polish | 51 | 0.7% |
| Puerto Rican | 65 | 0.9% |
| Romanian | 13 | 0.2% |
| Russian | 5 | 0.1% |
| Scandinavian | 38 | 0.5% |
| Scotch-Irish | 11 | 0.2% |
| Scottish | 35 | 0.5% |
| South American | 5 | 0.1% |
| Subsaharan African | 152 | 2.1% |
| Swiss | 4 | 0.1% |
| Welsh | 56 | 0.8% | View All 33 Rows |
Immigrants in Welcome
The most numerous immigrant groups reported in Welcome came from Latin America (719 | 10.1%), Central America (661 | 9.2%), Mexico (438 | 6.1%), Guatemala (196 | 2.7%), and Caribbean (38 | 0.5%), together accounting for 28.7% of all Welcome residents.
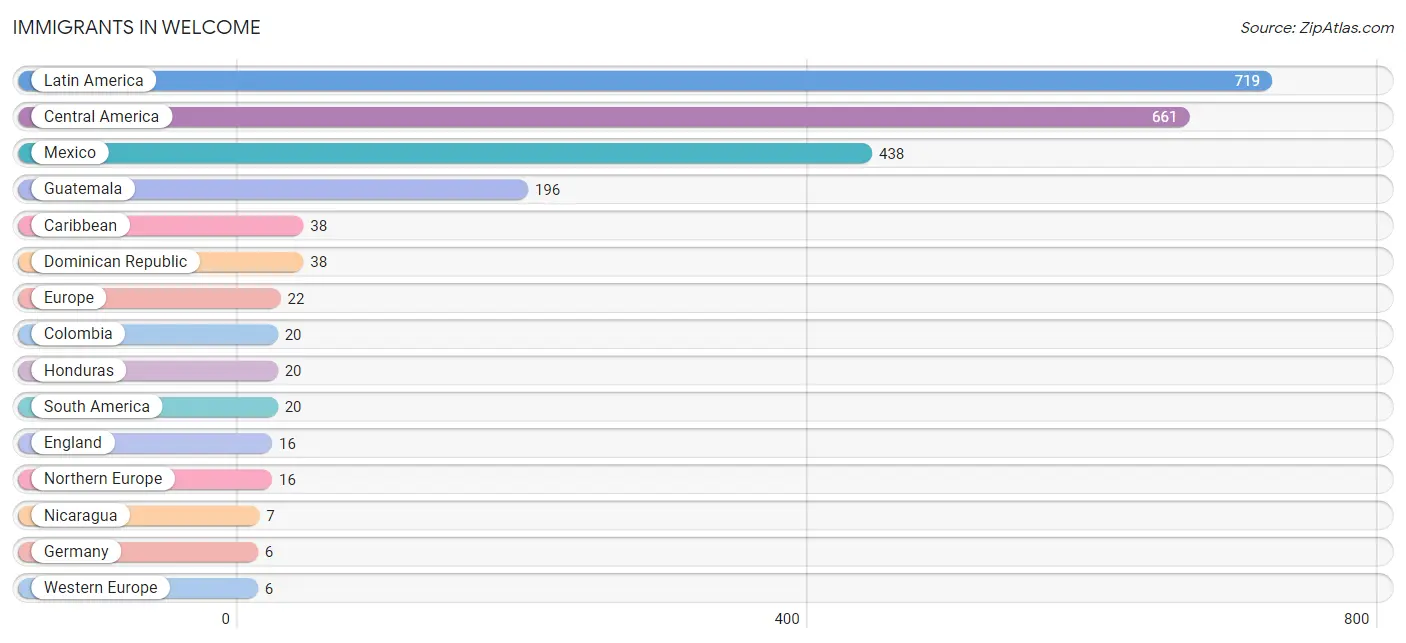
| Immigration Origin | # Population | % Population |
| Caribbean | 38 | 0.5% |
| Central America | 661 | 9.2% |
| Colombia | 20 | 0.3% |
| Dominican Republic | 38 | 0.5% |
| England | 16 | 0.2% |
| Europe | 22 | 0.3% |
| Germany | 6 | 0.1% |
| Guatemala | 196 | 2.7% |
| Honduras | 20 | 0.3% |
| Latin America | 719 | 10.1% |
| Mexico | 438 | 6.1% |
| Nicaragua | 7 | 0.1% |
| Northern Europe | 16 | 0.2% |
| South America | 20 | 0.3% |
| Western Europe | 6 | 0.1% | View All 15 Rows |
Sex and Age in Welcome
Sex and Age in Welcome
The most populous age groups in Welcome are 35 to 39 Years (508 | 15.0%) for men and 30 to 34 Years (515 | 13.7%) for women.
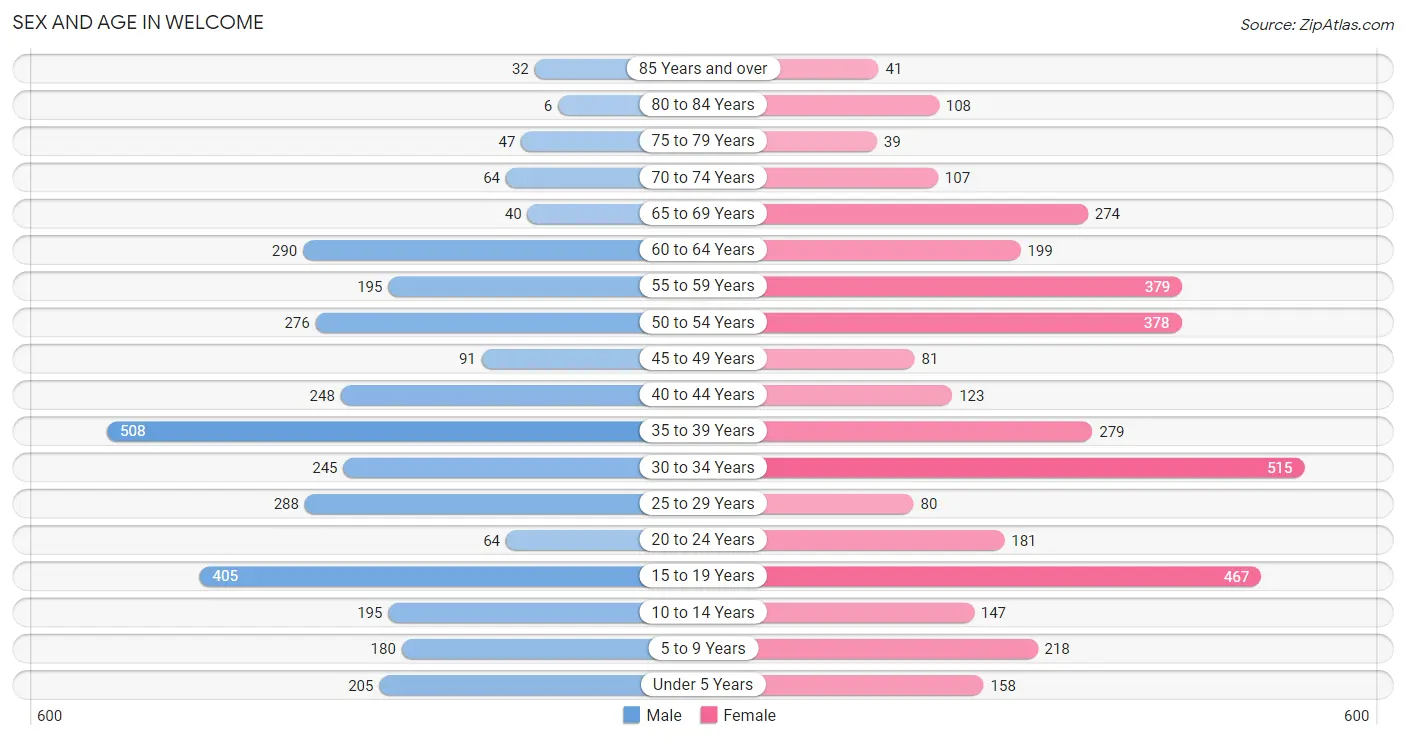
| Age Bracket | Male | Female |
| Under 5 Years | 205 (6.1%) | 158 (4.2%) |
| 5 to 9 Years | 180 (5.3%) | 218 (5.8%) |
| 10 to 14 Years | 195 (5.8%) | 147 (3.9%) |
| 15 to 19 Years | 405 (12.0%) | 467 (12.4%) |
| 20 to 24 Years | 64 (1.9%) | 181 (4.8%) |
| 25 to 29 Years | 288 (8.5%) | 80 (2.1%) |
| 30 to 34 Years | 245 (7.2%) | 515 (13.7%) |
| 35 to 39 Years | 508 (15.0%) | 279 (7.4%) |
| 40 to 44 Years | 248 (7.3%) | 123 (3.3%) |
| 45 to 49 Years | 91 (2.7%) | 81 (2.1%) |
| 50 to 54 Years | 276 (8.2%) | 378 (10.0%) |
| 55 to 59 Years | 195 (5.8%) | 379 (10.0%) |
| 60 to 64 Years | 290 (8.6%) | 199 (5.3%) |
| 65 to 69 Years | 40 (1.2%) | 274 (7.3%) |
| 70 to 74 Years | 64 (1.9%) | 107 (2.8%) |
| 75 to 79 Years | 47 (1.4%) | 39 (1.0%) |
| 80 to 84 Years | 6 (0.2%) | 108 (2.9%) |
| 85 Years and over | 32 (0.9%) | 41 (1.1%) |
| Total | 3,379 (100.0%) | 3,774 (100.0%) |
Families and Households in Welcome
Median Family Size in Welcome
The median family size in Welcome is 3.00 persons per family, with married-couple families (864 | 46.7%) accounting for the largest median family size of 3.65 persons per family. On the other hand, single female/mother families (565 | 30.5%) represent the smallest median family size with 2.41 persons per family.
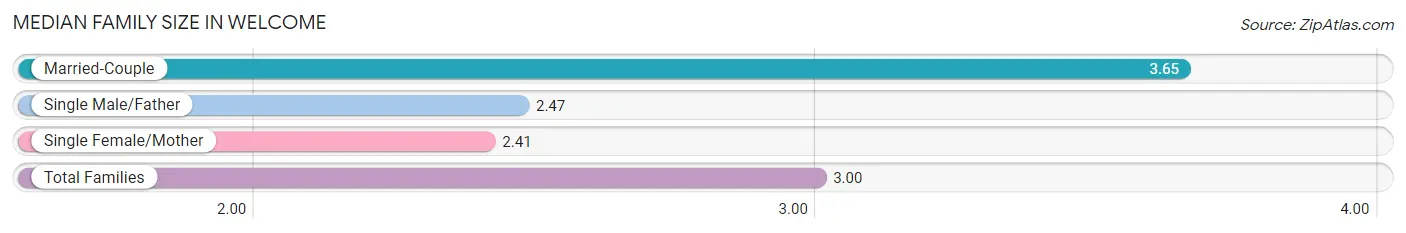
| Family Type | # Families | Family Size |
| Married-Couple | 864 (46.7%) | 3.65 |
| Single Male/Father | 421 (22.8%) | 2.47 |
| Single Female/Mother | 565 (30.5%) | 2.41 |
| Total Families | 1,850 (100.0%) | 3.00 |
Median Household Size in Welcome
The median household size in Welcome is 2.22 persons per household, with married-couple households (864 | 26.8%) accounting for the largest median household size of 3.69 persons per household. non-family households (1,377 | 42.7%) represent the smallest median household size with 1.07 persons per household.
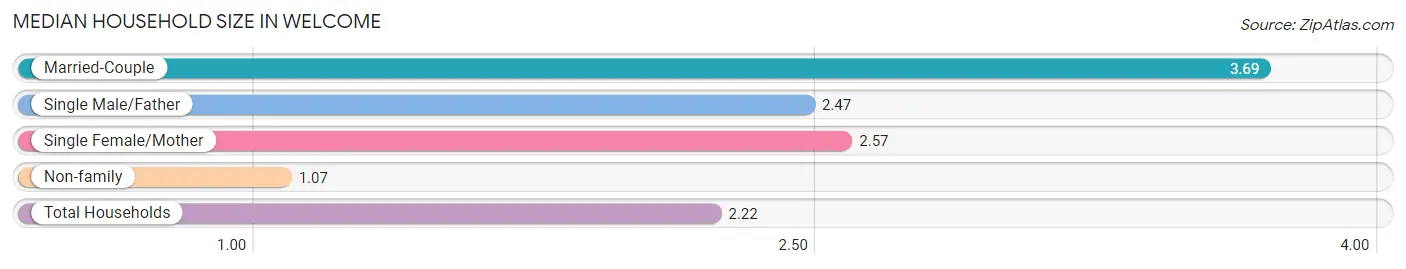
| Household Type | # Households | Household Size |
| Married-Couple | 864 (26.8%) | 3.69 |
| Single Male/Father | 421 (13.1%) | 2.47 |
| Single Female/Mother | 565 (17.5%) | 2.57 |
| Non-family | 1,377 (42.7%) | 1.07 |
| Total Households | 3,227 (100.0%) | 2.22 |
Household Size by Marriage Status in Welcome
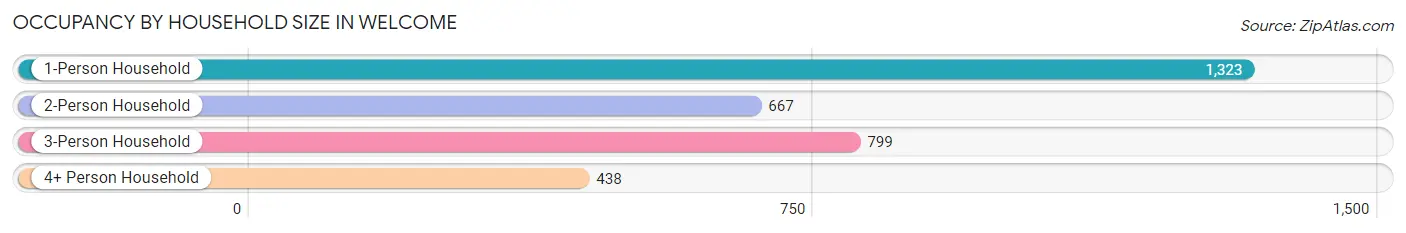
Out of a total of 3,227 households in Welcome, 1,850 (57.3%) are family households, while 1,377 (42.7%) are nonfamily households. The most numerous type of family households are 3-person households, comprising 799, and the most common type of nonfamily households are 1-person households, comprising 1,323.
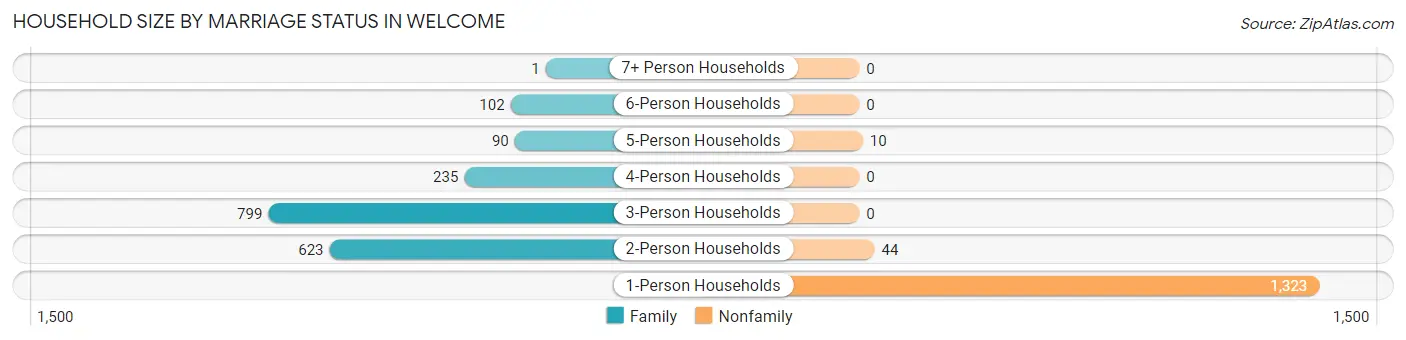
| Household Size | Family Households | Nonfamily Households |
| 1-Person Households | - | 1,323 (41.0%) |
| 2-Person Households | 623 (19.3%) | 44 (1.4%) |
| 3-Person Households | 799 (24.8%) | 0 (0.0%) |
| 4-Person Households | 235 (7.3%) | 0 (0.0%) |
| 5-Person Households | 90 (2.8%) | 10 (0.3%) |
| 6-Person Households | 102 (3.2%) | 0 (0.0%) |
| 7+ Person Households | 1 (0.0%) | 0 (0.0%) |
| Total | 1,850 (57.3%) | 1,377 (42.7%) |
Female Fertility in Welcome
Fertility by Age in Welcome
Average fertility rate in Welcome is 93.0 births per 1,000 women. Women in the age bracket of 20 to 34 years have the highest fertility rate with 216.0 births per 1,000 women. Women in the age bracket of 20 to 34 years acount for 98.3% of all women with births.
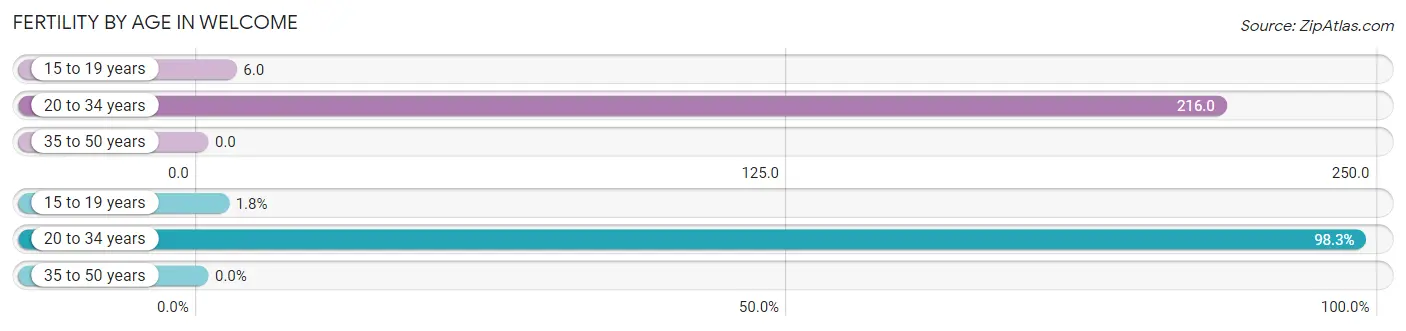
| Age Bracket | Women with Births | Births / 1,000 Women |
| 15 to 19 years | 3 (1.8%) | 6.0 |
| 20 to 34 years | 168 (98.3%) | 216.0 |
| 35 to 50 years | 0 (0.0%) | 0.0 |
| Total | 171 (100.0%) | 93.0 |
Fertility by Age by Marriage Status in Welcome
81.9% of women with births (171) in Welcome are married. The highest percentage of unmarried women with births falls into 15 to 19 years age bracket with 100.0% of them unmarried at the time of birth, while the lowest percentage of unmarried women with births belong to 20 to 34 years age bracket with 16.7% of them unmarried.
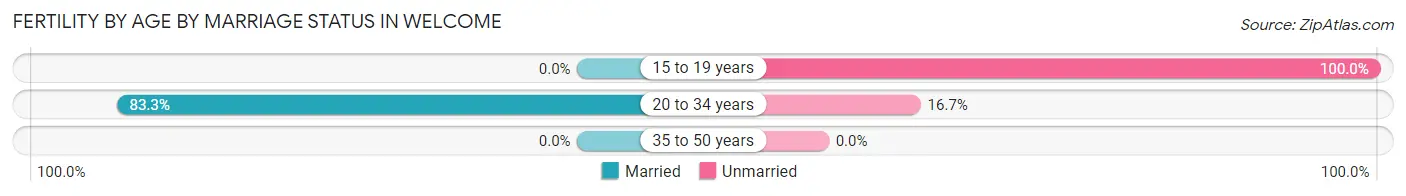
| Age Bracket | Married | Unmarried |
| 15 to 19 years | 0 (0.0%) | 3 (100.0%) |
| 20 to 34 years | 140 (83.3%) | 28 (16.7%) |
| 35 to 50 years | 0 (0.0%) | 0 (0.0%) |
| Total | 140 (81.9%) | 31 (18.1%) |
Fertility by Education in Welcome
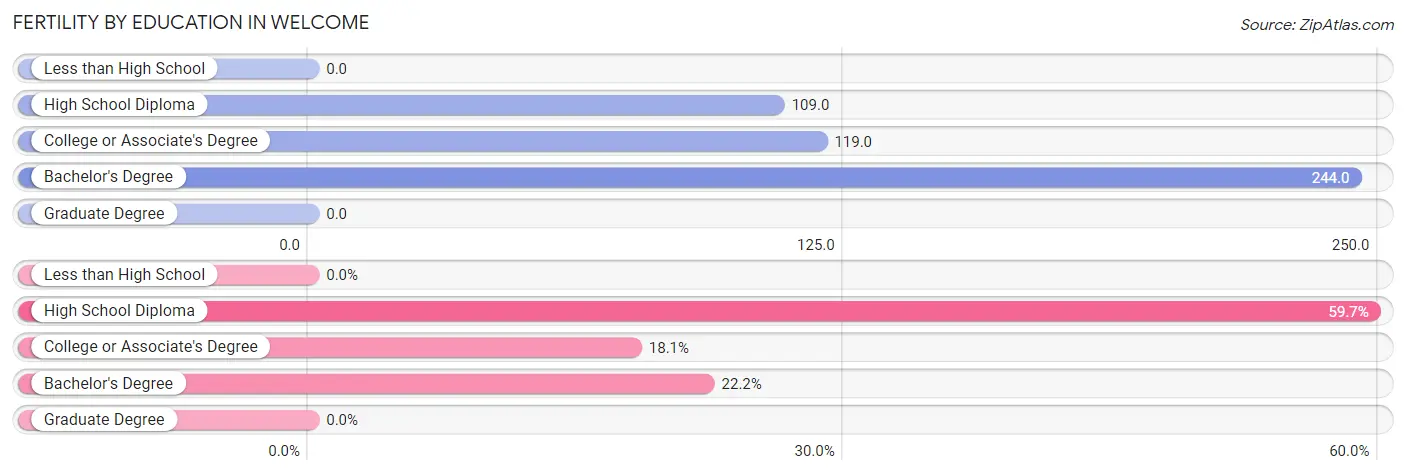
| Educational Attainment | Women with Births | Births / 1,000 Women |
| Less than High School | 0 (0.0%) | 0.0 |
| High School Diploma | 102 (59.7%) | 109.0 |
| College or Associate's Degree | 31 (18.1%) | 119.0 |
| Bachelor's Degree | 38 (22.2%) | 244.0 |
| Graduate Degree | 0 (0.0%) | 0.0 |
| Total | 171 (100.0%) | 93.0 |
Fertility by Education by Marriage Status in Welcome
18.1% of women with births in Welcome are unmarried. Women with the educational attainment of college or associate's degree are most likely to be married with 100.0% of them married at childbirth, while women with the educational attainment of high school diploma are least likely to be married with 30.4% of them unmarried at childbirth.
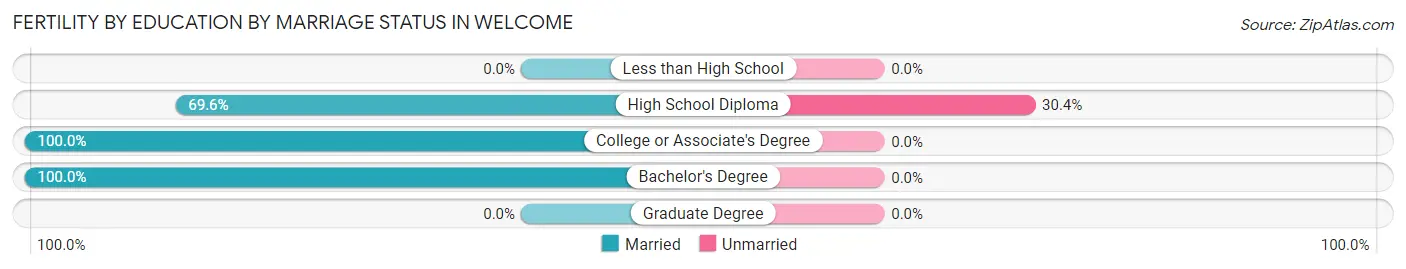
| Educational Attainment | Married | Unmarried |
| Less than High School | 0 (0.0%) | 0 (0.0%) |
| High School Diploma | 71 (69.6%) | 31 (30.4%) |
| College or Associate's Degree | 31 (100.0%) | 0 (0.0%) |
| Bachelor's Degree | 38 (100.0%) | 0 (0.0%) |
| Graduate Degree | 0 (0.0%) | 0 (0.0%) |
| Total | 140 (81.9%) | 31 (18.1%) |
Employment Characteristics in Welcome
Employment by Class of Employer in Welcome
Among the 3,752 employed individuals in Welcome, private company employees (3,318 | 88.4%), local government employees (148 | 3.9%), and self-employed (not incorporated) (119 | 3.2%) make up the most common classes of employment.
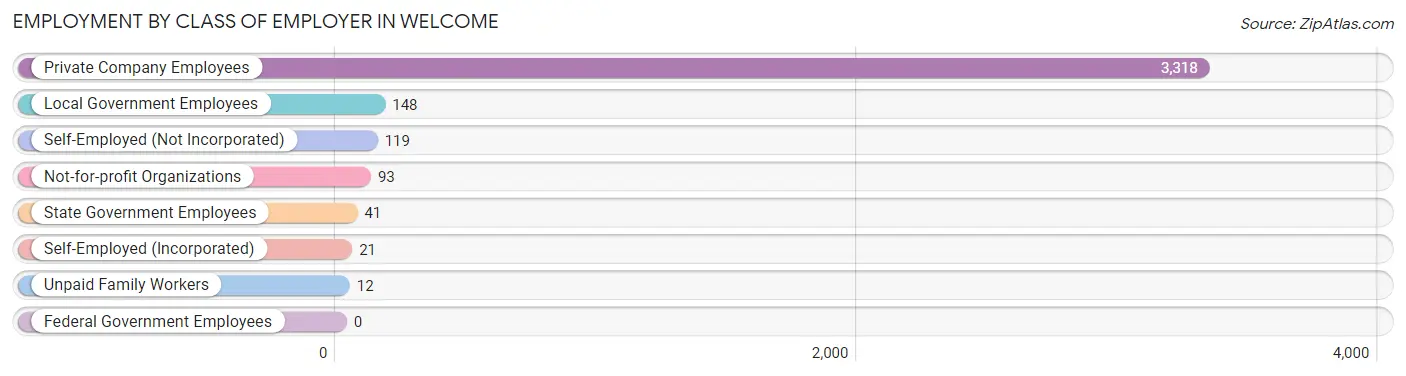
| Employer Class | # Employees | % Employees |
| Private Company Employees | 3,318 | 88.4% |
| Self-Employed (Incorporated) | 21 | 0.6% |
| Self-Employed (Not Incorporated) | 119 | 3.2% |
| Not-for-profit Organizations | 93 | 2.5% |
| Local Government Employees | 148 | 3.9% |
| State Government Employees | 41 | 1.1% |
| Federal Government Employees | 0 | 0.0% |
| Unpaid Family Workers | 12 | 0.3% |
| Total | 3,752 | 100.0% |
Employment Status by Age in Welcome
According to the labor force statistics for Welcome, out of the total population over 16 years of age (6,024), 69.3% or 4,175 individuals are in the labor force, with 5.7% or 238 of them unemployed. The age group with the highest labor force participation rate is 30 to 34 years, with 100.0% or 760 individuals in the labor force. Within the labor force, the 30 to 34 years age range has the highest percentage of unemployed individuals, with 14.7% or 112 of them being unemployed.
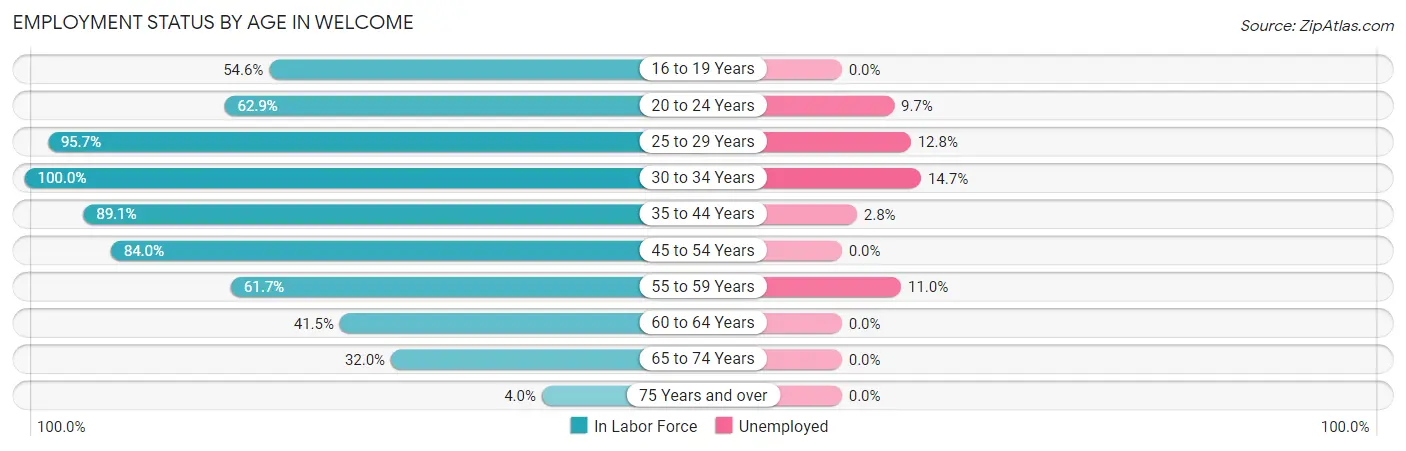
| Age Bracket | In Labor Force | Unemployed |
| 16 to 19 Years | 462 (54.6%) | 0 (0.0%) |
| 20 to 24 Years | 154 (62.9%) | 15 (9.7%) |
| 25 to 29 Years | 352 (95.7%) | 45 (12.8%) |
| 30 to 34 Years | 760 (100.0%) | 112 (14.7%) |
| 35 to 44 Years | 1,032 (89.1%) | 29 (2.8%) |
| 45 to 54 Years | 694 (84.0%) | 0 (0.0%) |
| 55 to 59 Years | 354 (61.7%) | 39 (11.0%) |
| 60 to 64 Years | 203 (41.5%) | 0 (0.0%) |
| 65 to 74 Years | 155 (32.0%) | 0 (0.0%) |
| 75 Years and over | 11 (4.0%) | 0 (0.0%) |
| Total | 4,175 (69.3%) | 238 (5.7%) |
Employment Status by Educational Attainment in Welcome
According to labor force statistics for Welcome, 81.3% of individuals (3,394) out of the total population between 25 and 64 years of age (4,175) are in the labor force, with 6.6% or 224 of them being unemployed. The group with the highest labor force participation rate are those with the educational attainment of bachelor's degree or higher, with 97.8% or 906 individuals in the labor force. Within the labor force, individuals with high school diploma education have the highest percentage of unemployment, with 9.2% or 101 of them being unemployed.
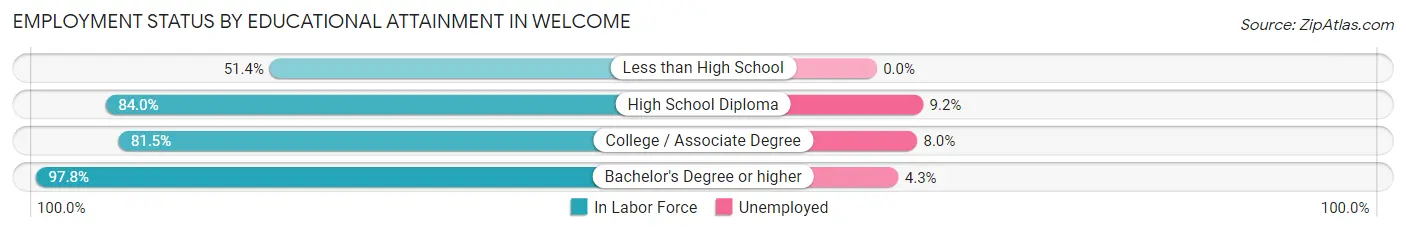
| Educational Attainment | In Labor Force | Unemployed |
| Less than High School | 327 (51.4%) | 0 (0.0%) |
| High School Diploma | 1,095 (84.0%) | 120 (9.2%) |
| College / Associate Degree | 1,067 (81.5%) | 105 (8.0%) |
| Bachelor's Degree or higher | 906 (97.8%) | 40 (4.3%) |
| Total | 3,394 (81.3%) | 276 (6.6%) |
Employment Occupations by Sex in Welcome
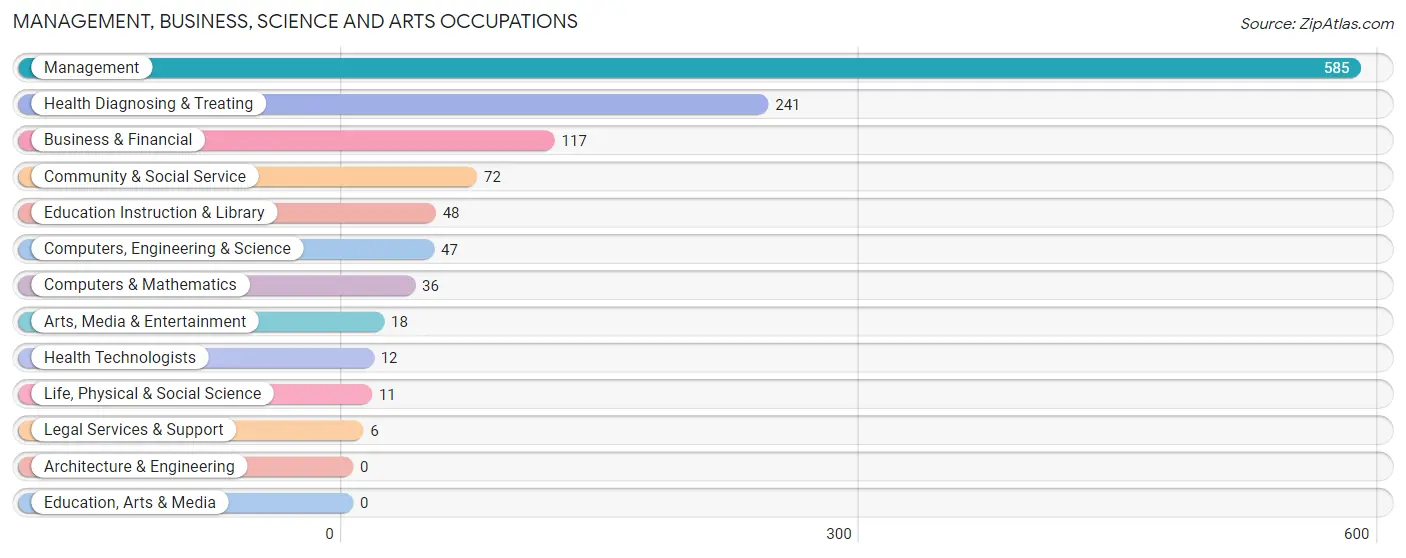
Management, Business, Science and Arts Occupations
The most common Management, Business, Science and Arts occupations in Welcome are Management (585 | 14.9%), Health Diagnosing & Treating (241 | 6.1%), Business & Financial (117 | 3.0%), Community & Social Service (72 | 1.8%), and Education Instruction & Library (48 | 1.2%).
Management, Business, Science and Arts Occupations by Sex
Within the Management, Business, Science and Arts occupations in Welcome, the most male-oriented occupations are Education Instruction & Library (100.0%), Arts, Media & Entertainment (100.0%), and Community & Social Service (91.7%), while the most female-oriented occupations are Business & Financial (100.0%), Life, Physical & Social Science (100.0%), and Legal Services & Support (100.0%).
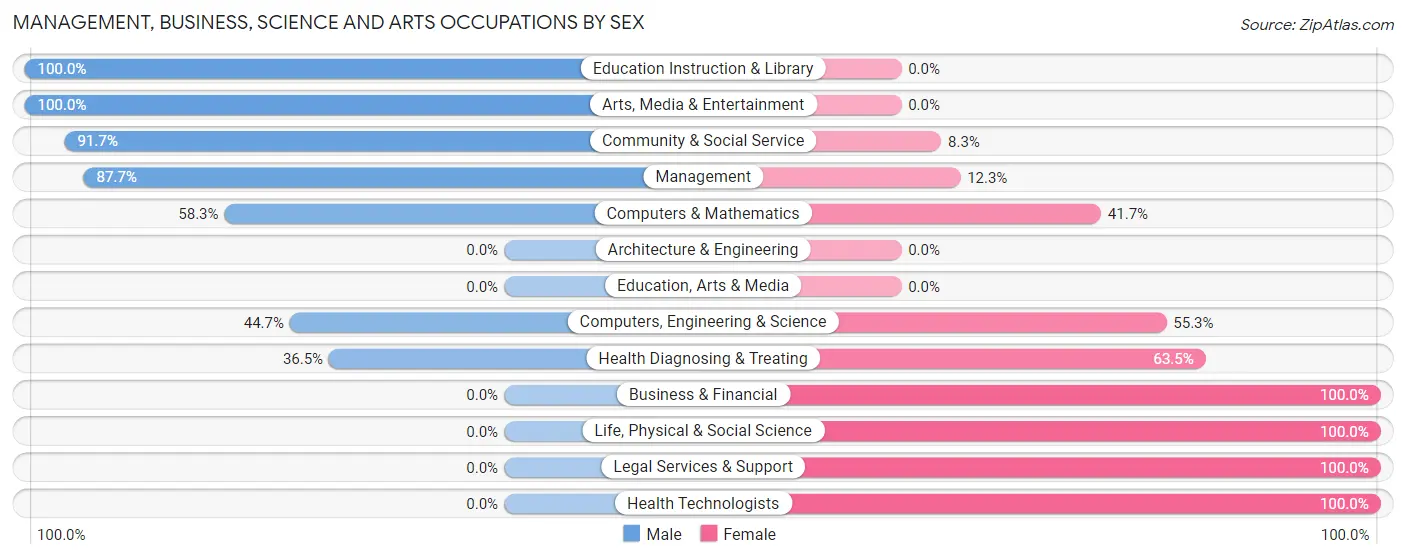
| Occupation | Male | Female |
| Management | 513 (87.7%) | 72 (12.3%) |
| Business & Financial | 0 (0.0%) | 117 (100.0%) |
| Computers, Engineering & Science | 21 (44.7%) | 26 (55.3%) |
| Computers & Mathematics | 21 (58.3%) | 15 (41.7%) |
| Architecture & Engineering | 0 (0.0%) | 0 (0.0%) |
| Life, Physical & Social Science | 0 (0.0%) | 11 (100.0%) |
| Community & Social Service | 66 (91.7%) | 6 (8.3%) |
| Education, Arts & Media | 0 (0.0%) | 0 (0.0%) |
| Legal Services & Support | 0 (0.0%) | 6 (100.0%) |
| Education Instruction & Library | 48 (100.0%) | 0 (0.0%) |
| Arts, Media & Entertainment | 18 (100.0%) | 0 (0.0%) |
| Health Diagnosing & Treating | 88 (36.5%) | 153 (63.5%) |
| Health Technologists | 0 (0.0%) | 12 (100.0%) |
| Total (Category) | 688 (64.8%) | 374 (35.2%) |
| Total (Overall) | 2,186 (55.5%) | 1,751 (44.5%) |
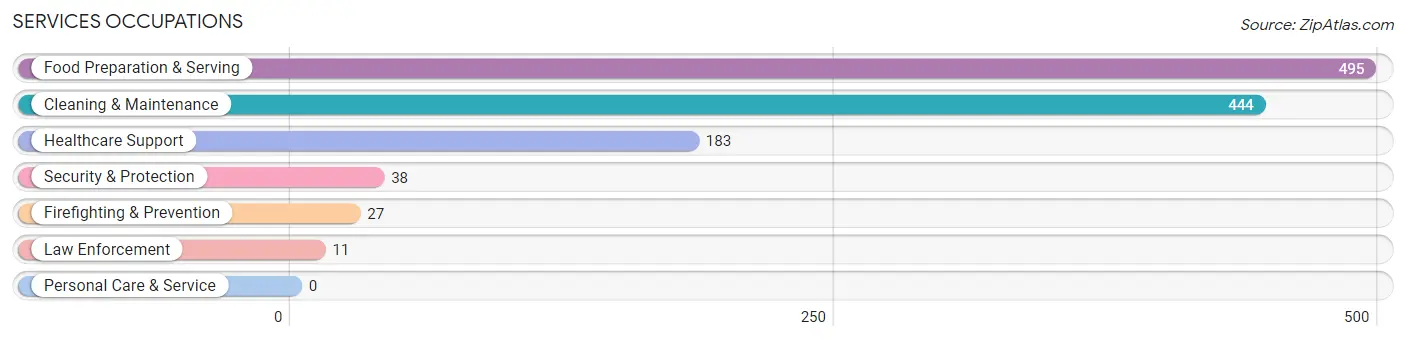
Services Occupations
The most common Services occupations in Welcome are Food Preparation & Serving (495 | 12.6%), Cleaning & Maintenance (444 | 11.3%), Healthcare Support (183 | 4.6%), Security & Protection (38 | 1.0%), and Firefighting & Prevention (27 | 0.7%).
Services Occupations by Sex
Within the Services occupations in Welcome, the most male-oriented occupations are Firefighting & Prevention (100.0%), Cleaning & Maintenance (80.6%), and Security & Protection (71.1%), while the most female-oriented occupations are Healthcare Support (100.0%), Law Enforcement (100.0%), and Food Preparation & Serving (83.8%).
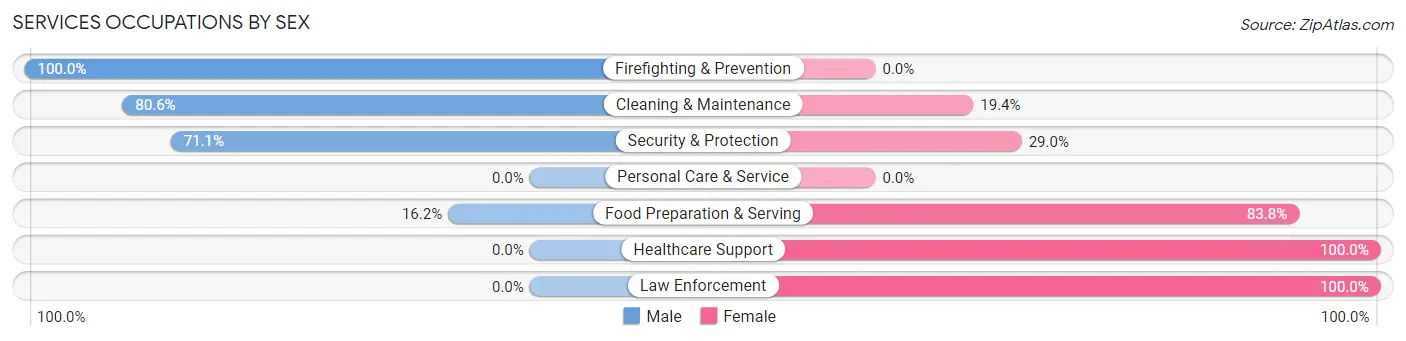
| Occupation | Male | Female |
| Healthcare Support | 0 (0.0%) | 183 (100.0%) |
| Security & Protection | 27 (71.1%) | 11 (28.9%) |
| Firefighting & Prevention | 27 (100.0%) | 0 (0.0%) |
| Law Enforcement | 0 (0.0%) | 11 (100.0%) |
| Food Preparation & Serving | 80 (16.2%) | 415 (83.8%) |
| Cleaning & Maintenance | 358 (80.6%) | 86 (19.4%) |
| Personal Care & Service | 0 (0.0%) | 0 (0.0%) |
| Total (Category) | 465 (40.1%) | 695 (59.9%) |
| Total (Overall) | 2,186 (55.5%) | 1,751 (44.5%) |
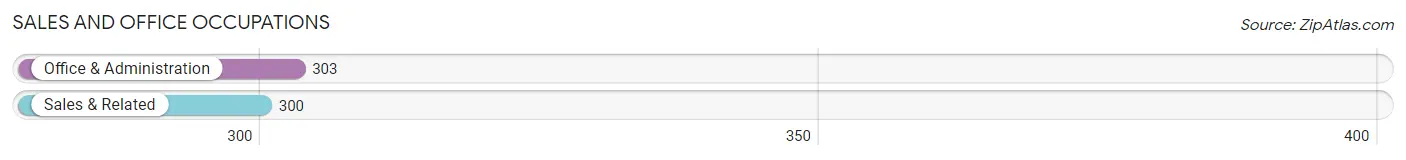
Sales and Office Occupations
The most common Sales and Office occupations in Welcome are Office & Administration (303 | 7.7%), and Sales & Related (300 | 7.6%).
Sales and Office Occupations by Sex
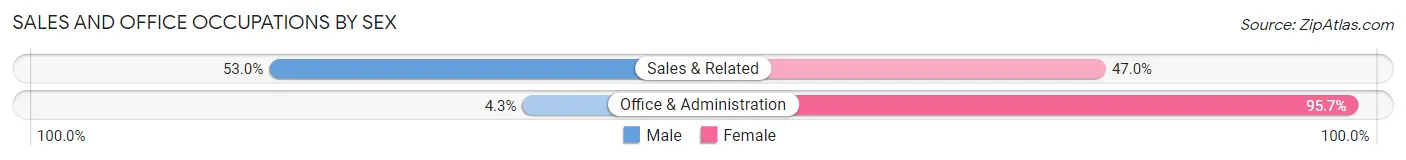
| Occupation | Male | Female |
| Sales & Related | 159 (53.0%) | 141 (47.0%) |
| Office & Administration | 13 (4.3%) | 290 (95.7%) |
| Total (Category) | 172 (28.5%) | 431 (71.5%) |
| Total (Overall) | 2,186 (55.5%) | 1,751 (44.5%) |
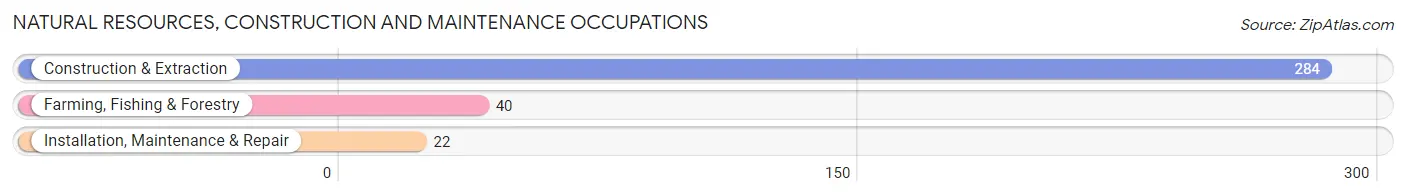
Natural Resources, Construction and Maintenance Occupations
The most common Natural Resources, Construction and Maintenance occupations in Welcome are Construction & Extraction (284 | 7.2%), Farming, Fishing & Forestry (40 | 1.0%), and Installation, Maintenance & Repair (22 | 0.6%).
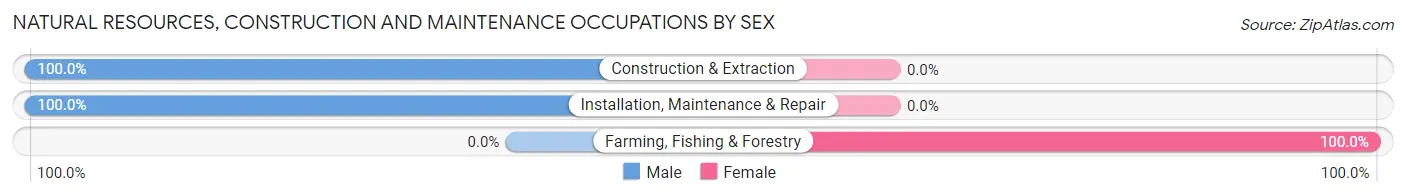
Natural Resources, Construction and Maintenance Occupations by Sex
| Occupation | Male | Female |
| Farming, Fishing & Forestry | 0 (0.0%) | 40 (100.0%) |
| Construction & Extraction | 284 (100.0%) | 0 (0.0%) |
| Installation, Maintenance & Repair | 22 (100.0%) | 0 (0.0%) |
| Total (Category) | 306 (88.4%) | 40 (11.6%) |
| Total (Overall) | 2,186 (55.5%) | 1,751 (44.5%) |
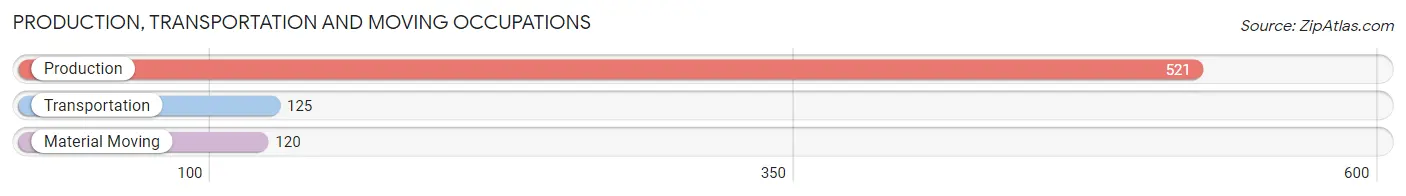
Production, Transportation and Moving Occupations
The most common Production, Transportation and Moving occupations in Welcome are Production (521 | 13.2%), Transportation (125 | 3.2%), and Material Moving (120 | 3.0%).
Production, Transportation and Moving Occupations by Sex
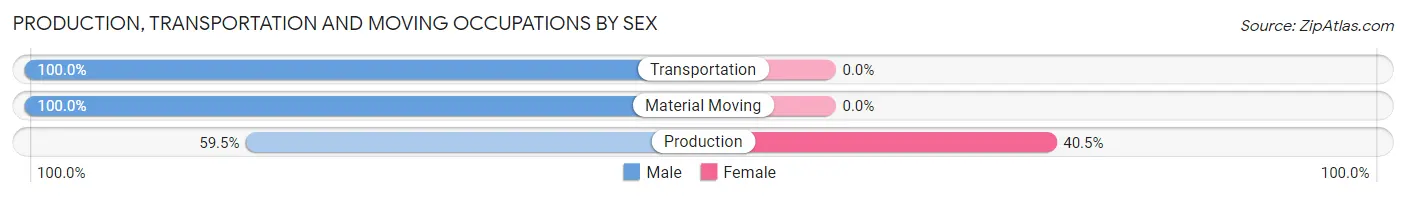
| Occupation | Male | Female |
| Production | 310 (59.5%) | 211 (40.5%) |
| Transportation | 125 (100.0%) | 0 (0.0%) |
| Material Moving | 120 (100.0%) | 0 (0.0%) |
| Total (Category) | 555 (72.5%) | 211 (27.6%) |
| Total (Overall) | 2,186 (55.5%) | 1,751 (44.5%) |
Employment Industries by Sex in Welcome
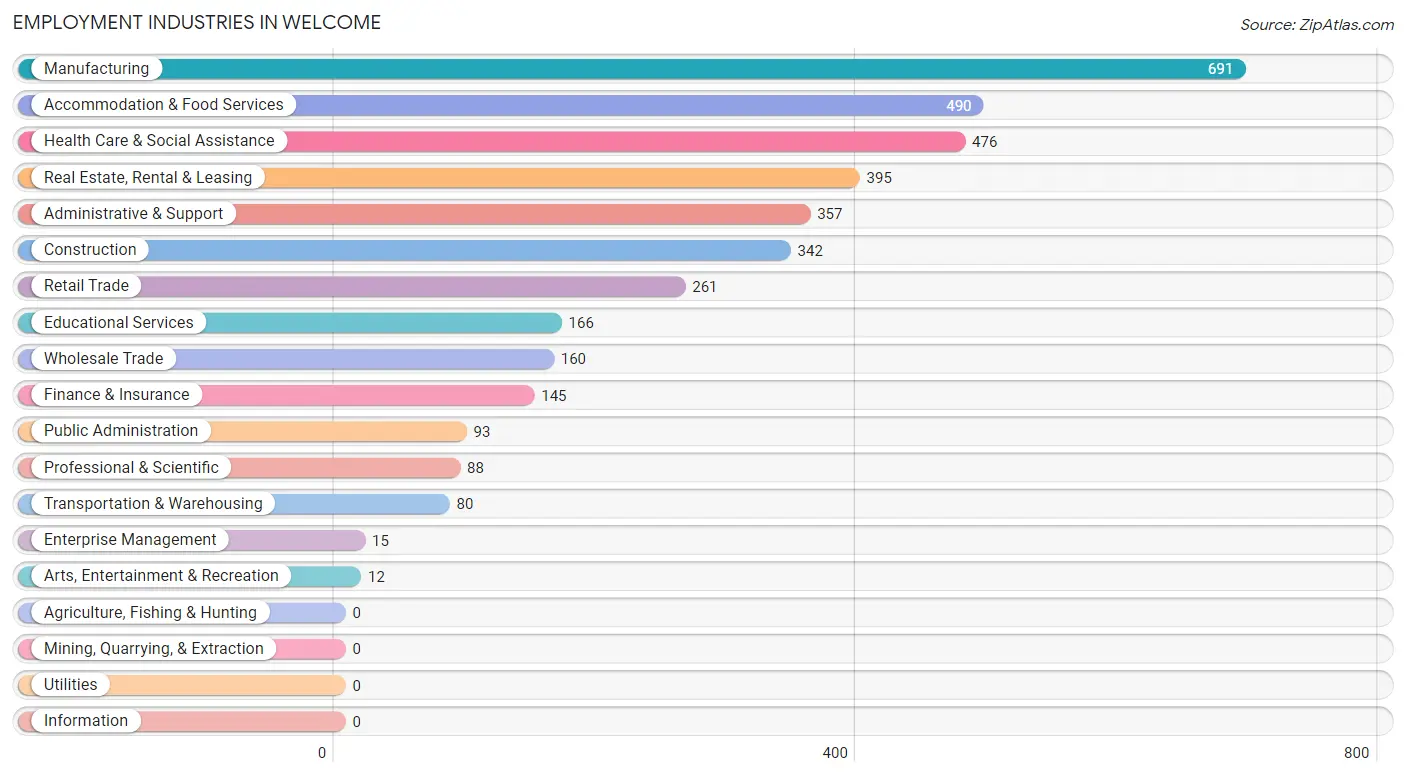
Employment Industries in Welcome
The major employment industries in Welcome include Manufacturing (691 | 17.5%), Accommodation & Food Services (490 | 12.4%), Health Care & Social Assistance (476 | 12.1%), Real Estate, Rental & Leasing (395 | 10.0%), and Administrative & Support (357 | 9.1%).
Employment Industries by Sex in Welcome
The Welcome industries that see more men than women are Construction (100.0%), Transportation & Warehousing (100.0%), and Arts, Entertainment & Recreation (100.0%), whereas the industries that tend to have a higher number of women are Enterprise Management (100.0%), Professional & Scientific (81.8%), and Health Care & Social Assistance (81.5%).
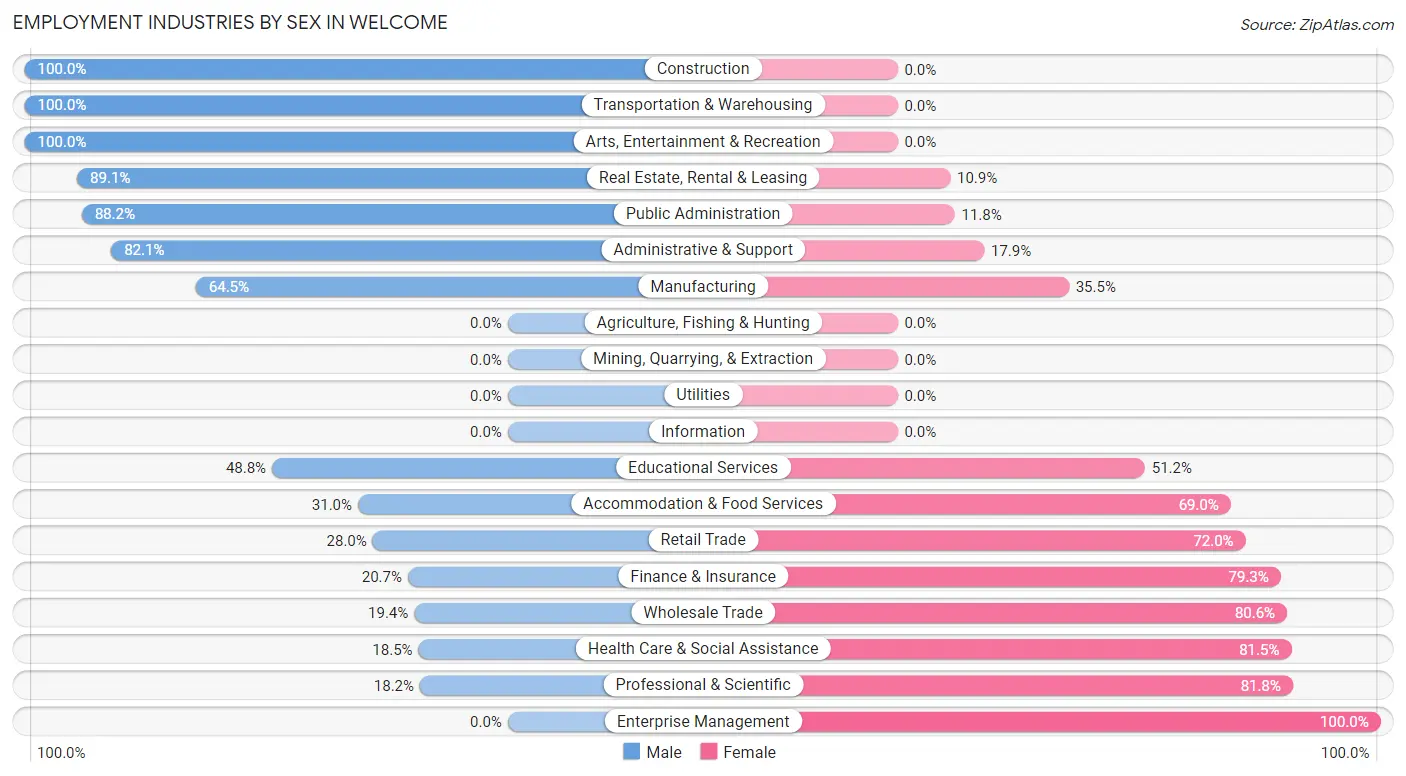
| Industry | Male | Female |
| Agriculture, Fishing & Hunting | 0 (0.0%) | 0 (0.0%) |
| Mining, Quarrying, & Extraction | 0 (0.0%) | 0 (0.0%) |
| Construction | 342 (100.0%) | 0 (0.0%) |
| Manufacturing | 446 (64.5%) | 245 (35.5%) |
| Wholesale Trade | 31 (19.4%) | 129 (80.6%) |
| Retail Trade | 73 (28.0%) | 188 (72.0%) |
| Transportation & Warehousing | 80 (100.0%) | 0 (0.0%) |
| Utilities | 0 (0.0%) | 0 (0.0%) |
| Information | 0 (0.0%) | 0 (0.0%) |
| Finance & Insurance | 30 (20.7%) | 115 (79.3%) |
| Real Estate, Rental & Leasing | 352 (89.1%) | 43 (10.9%) |
| Professional & Scientific | 16 (18.2%) | 72 (81.8%) |
| Enterprise Management | 0 (0.0%) | 15 (100.0%) |
| Administrative & Support | 293 (82.1%) | 64 (17.9%) |
| Educational Services | 81 (48.8%) | 85 (51.2%) |
| Health Care & Social Assistance | 88 (18.5%) | 388 (81.5%) |
| Arts, Entertainment & Recreation | 12 (100.0%) | 0 (0.0%) |
| Accommodation & Food Services | 152 (31.0%) | 338 (69.0%) |
| Public Administration | 82 (88.2%) | 11 (11.8%) |
| Total | 2,186 (55.5%) | 1,751 (44.5%) |
Education in Welcome
School Enrollment in Welcome
The most common levels of schooling among the 1,630 students in Welcome are high school (743 | 45.6%), elementary school (443 | 27.2%), and middle school (215 | 13.2%).
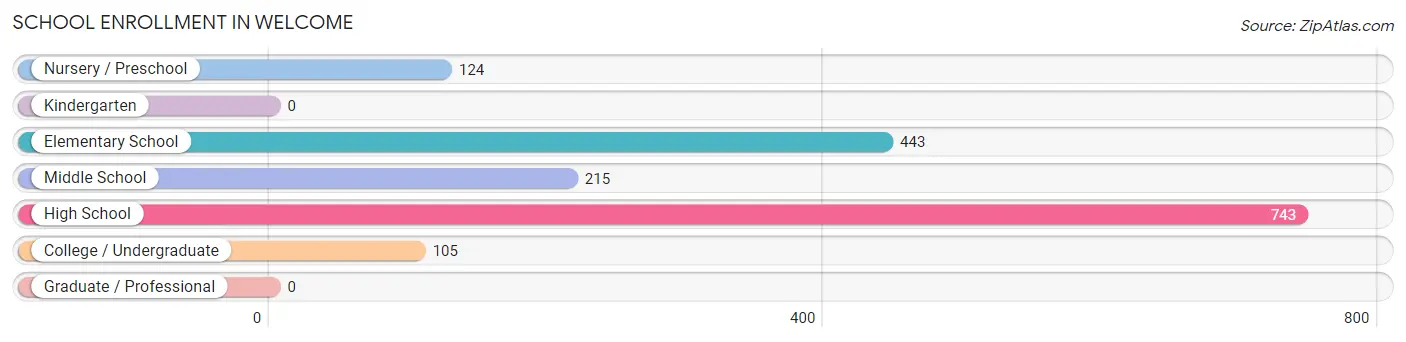
| School Level | # Students | % Students |
| Nursery / Preschool | 124 | 7.6% |
| Kindergarten | 0 | 0.0% |
| Elementary School | 443 | 27.2% |
| Middle School | 215 | 13.2% |
| High School | 743 | 45.6% |
| College / Undergraduate | 105 | 6.4% |
| Graduate / Professional | 0 | 0.0% |
| Total | 1,630 | 100.0% |
School Enrollment by Age by Funding Source in Welcome
Out of a total of 1,630 students who are enrolled in schools in Welcome, 173 (10.6%) attend a private institution, while the remaining 1,457 (89.4%) are enrolled in public schools. The age group of 20 to 24 year olds has the highest likelihood of being enrolled in private schools, with 36 (100.0% in the age bracket) enrolled. Conversely, the age group of 3 to 4 year olds has the lowest likelihood of being enrolled in a private school, with 81 (100.0% in the age bracket) attending a public institution.
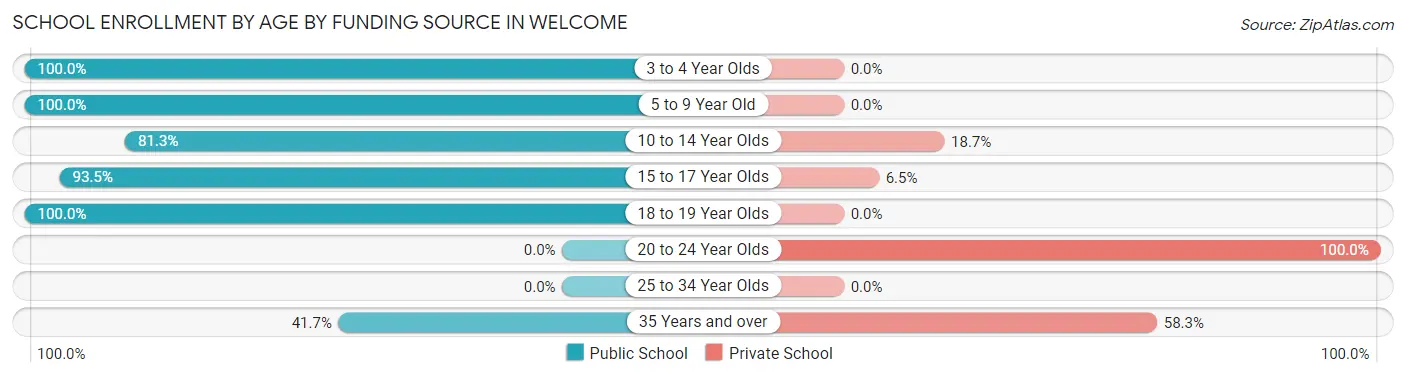
| Age Bracket | Public School | Private School |
| 3 to 4 Year Olds | 81 (100.0%) | 0 (0.0%) |
| 5 to 9 Year Old | 398 (100.0%) | 0 (0.0%) |
| 10 to 14 Year Olds | 278 (81.3%) | 64 (18.7%) |
| 15 to 17 Year Olds | 645 (93.5%) | 45 (6.5%) |
| 18 to 19 Year Olds | 35 (100.0%) | 0 (0.0%) |
| 20 to 24 Year Olds | 0 (0.0%) | 36 (100.0%) |
| 25 to 34 Year Olds | 0 (0.0%) | 0 (0.0%) |
| 35 Years and over | 20 (41.7%) | 28 (58.3%) |
| Total | 1,457 (89.4%) | 173 (10.6%) |
Educational Attainment by Field of Study in Welcome
Education (373 | 37.2%), arts & humanities (194 | 19.4%), bio, nature & agricultural (144 | 14.4%), liberal arts & history (90 | 9.0%), and business (61 | 6.1%) are the most common fields of study among 1,002 individuals in Welcome who have obtained a bachelor's degree or higher.
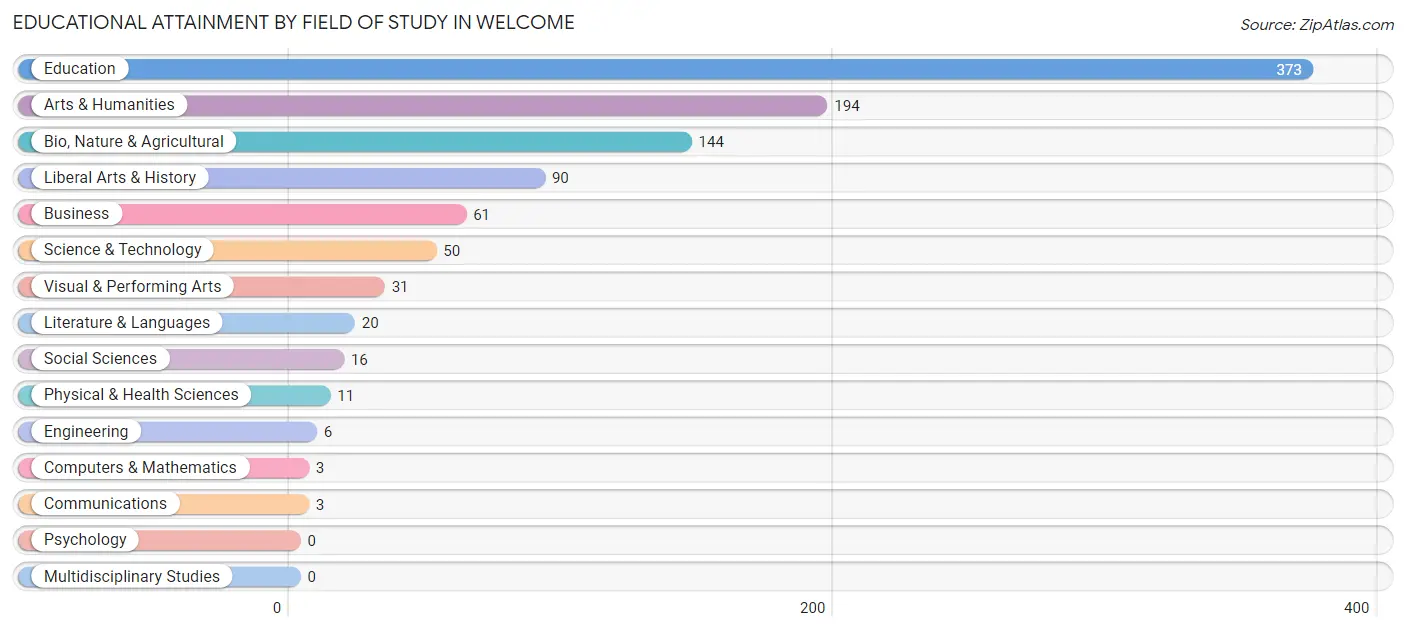
| Field of Study | # Graduates | % Graduates |
| Computers & Mathematics | 3 | 0.3% |
| Bio, Nature & Agricultural | 144 | 14.4% |
| Physical & Health Sciences | 11 | 1.1% |
| Psychology | 0 | 0.0% |
| Social Sciences | 16 | 1.6% |
| Engineering | 6 | 0.6% |
| Multidisciplinary Studies | 0 | 0.0% |
| Science & Technology | 50 | 5.0% |
| Business | 61 | 6.1% |
| Education | 373 | 37.2% |
| Literature & Languages | 20 | 2.0% |
| Liberal Arts & History | 90 | 9.0% |
| Visual & Performing Arts | 31 | 3.1% |
| Communications | 3 | 0.3% |
| Arts & Humanities | 194 | 19.4% |
| Total | 1,002 | 100.0% |
Transportation & Commute in Welcome
Vehicle Availability by Sex in Welcome
The most prevalent vehicle ownership categories in Welcome are males with 3 vehicles (1,084, accounting for 50.2%) and females with 3 vehicles (371, making up 68.1%).
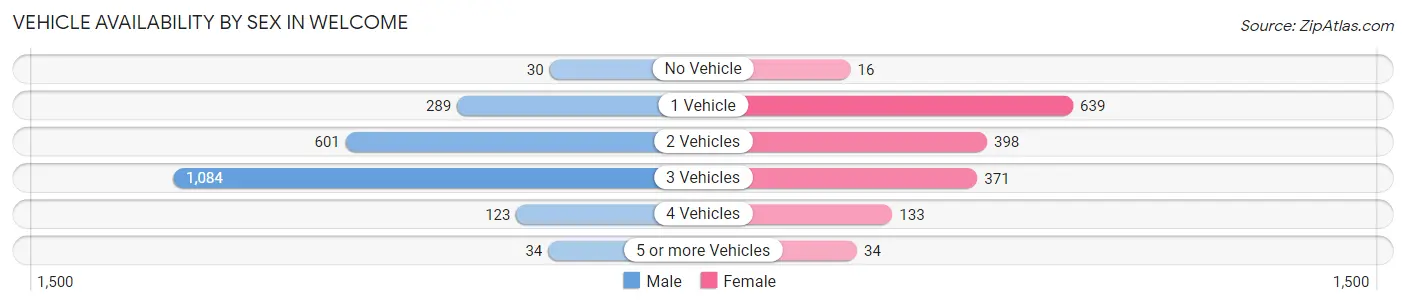
| Vehicles Available | Male | Female |
| No Vehicle | 30 (1.4%) | 16 (1.0%) |
| 1 Vehicle | 289 (13.4%) | 639 (40.2%) |
| 2 Vehicles | 601 (27.8%) | 398 (25.0%) |
| 3 Vehicles | 1,084 (50.2%) | 371 (23.3%) |
| 4 Vehicles | 123 (5.7%) | 133 (8.4%) |
| 5 or more Vehicles | 34 (1.6%) | 34 (2.1%) |
| Total | 2,161 (100.0%) | 1,591 (100.0%) |
Commute Time in Welcome
The most frequently occuring commute durations in Welcome are 30 to 34 minutes (1,036 commuters, 28.1%), 20 to 24 minutes (980 commuters, 26.6%), and 10 to 14 minutes (543 commuters, 14.7%).
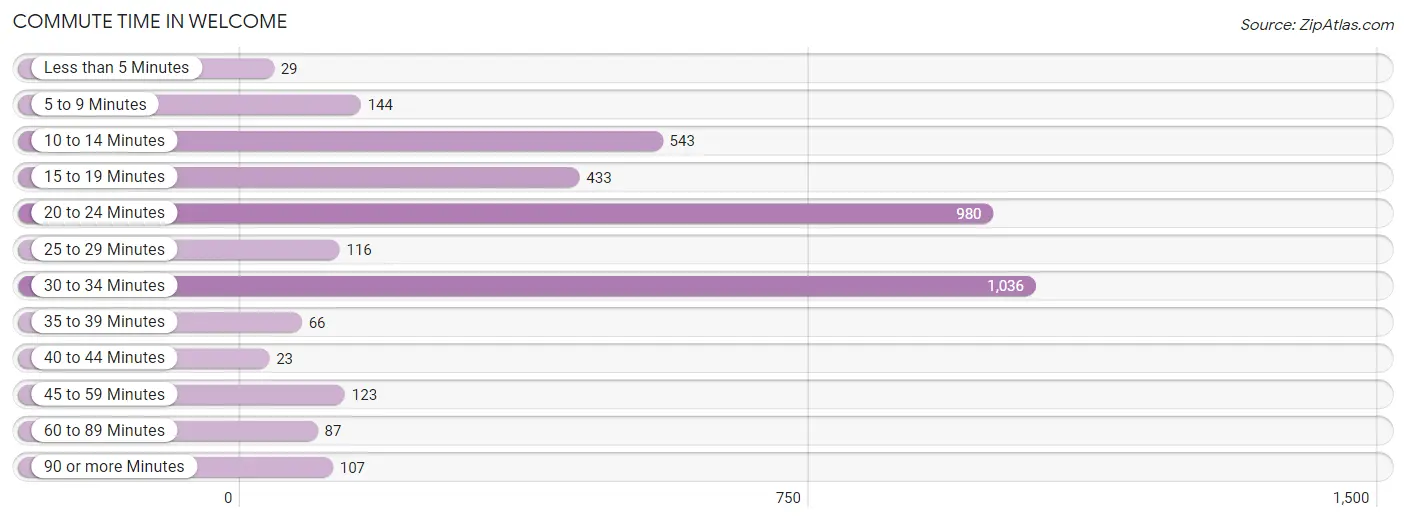
| Commute Time | # Commuters | % Commuters |
| Less than 5 Minutes | 29 | 0.8% |
| 5 to 9 Minutes | 144 | 3.9% |
| 10 to 14 Minutes | 543 | 14.7% |
| 15 to 19 Minutes | 433 | 11.7% |
| 20 to 24 Minutes | 980 | 26.6% |
| 25 to 29 Minutes | 116 | 3.2% |
| 30 to 34 Minutes | 1,036 | 28.1% |
| 35 to 39 Minutes | 66 | 1.8% |
| 40 to 44 Minutes | 23 | 0.6% |
| 45 to 59 Minutes | 123 | 3.3% |
| 60 to 89 Minutes | 87 | 2.4% |
| 90 or more Minutes | 107 | 2.9% |
Commute Time by Sex in Welcome
The most common commute times in Welcome are 30 to 34 minutes (783 commuters, 36.9%) for males and 20 to 24 minutes (438 commuters, 28.0%) for females.
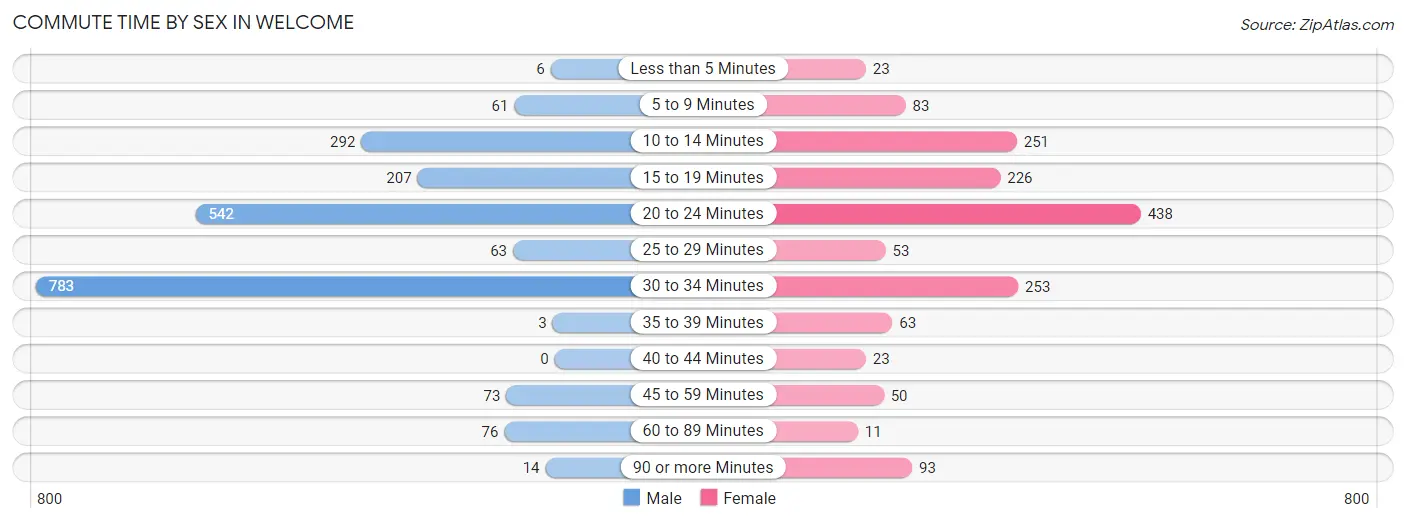
| Commute Time | Male | Female |
| Less than 5 Minutes | 6 (0.3%) | 23 (1.5%) |
| 5 to 9 Minutes | 61 (2.9%) | 83 (5.3%) |
| 10 to 14 Minutes | 292 (13.8%) | 251 (16.0%) |
| 15 to 19 Minutes | 207 (9.8%) | 226 (14.4%) |
| 20 to 24 Minutes | 542 (25.6%) | 438 (28.0%) |
| 25 to 29 Minutes | 63 (3.0%) | 53 (3.4%) |
| 30 to 34 Minutes | 783 (36.9%) | 253 (16.2%) |
| 35 to 39 Minutes | 3 (0.1%) | 63 (4.0%) |
| 40 to 44 Minutes | 0 (0.0%) | 23 (1.5%) |
| 45 to 59 Minutes | 73 (3.4%) | 50 (3.2%) |
| 60 to 89 Minutes | 76 (3.6%) | 11 (0.7%) |
| 90 or more Minutes | 14 (0.7%) | 93 (5.9%) |
Time of Departure to Work by Sex in Welcome
The most frequent times of departure to work in Welcome are 7:30 AM to 7:59 AM (421, 19.9%) for males and 4:00 PM to 11:59 PM (327, 20.9%) for females.
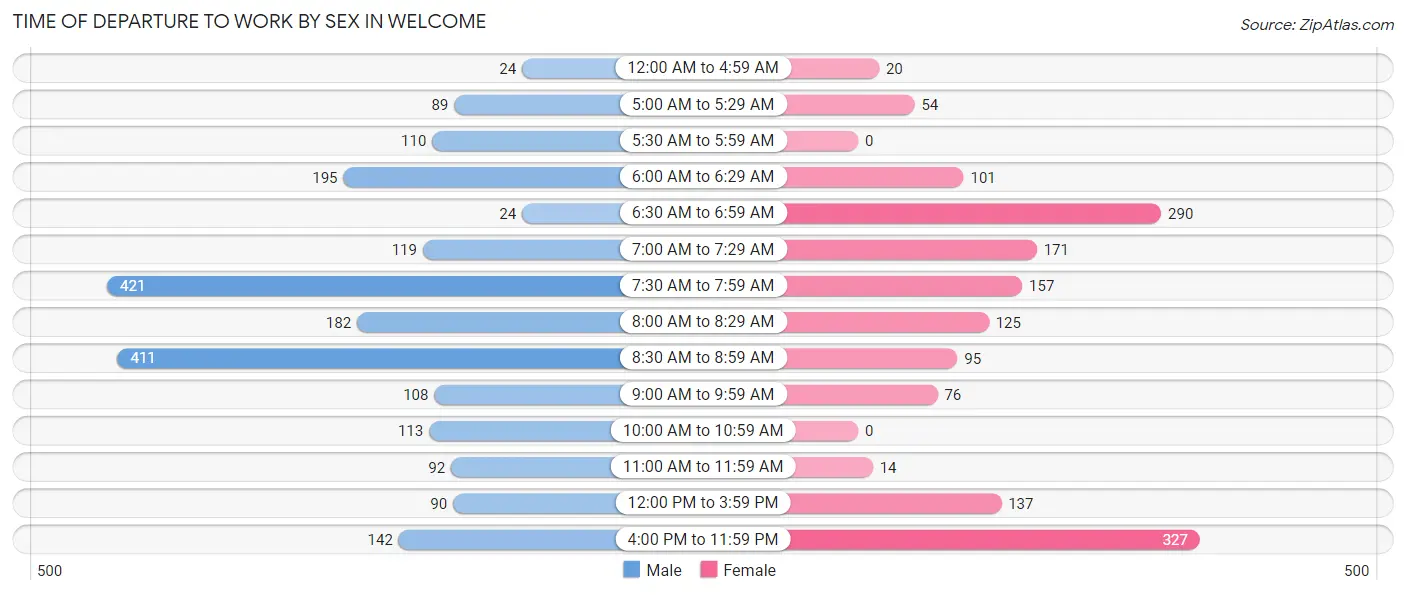
| Time of Departure | Male | Female |
| 12:00 AM to 4:59 AM | 24 (1.1%) | 20 (1.3%) |
| 5:00 AM to 5:29 AM | 89 (4.2%) | 54 (3.5%) |
| 5:30 AM to 5:59 AM | 110 (5.2%) | 0 (0.0%) |
| 6:00 AM to 6:29 AM | 195 (9.2%) | 101 (6.5%) |
| 6:30 AM to 6:59 AM | 24 (1.1%) | 290 (18.5%) |
| 7:00 AM to 7:29 AM | 119 (5.6%) | 171 (10.9%) |
| 7:30 AM to 7:59 AM | 421 (19.9%) | 157 (10.0%) |
| 8:00 AM to 8:29 AM | 182 (8.6%) | 125 (8.0%) |
| 8:30 AM to 8:59 AM | 411 (19.4%) | 95 (6.1%) |
| 9:00 AM to 9:59 AM | 108 (5.1%) | 76 (4.9%) |
| 10:00 AM to 10:59 AM | 113 (5.3%) | 0 (0.0%) |
| 11:00 AM to 11:59 AM | 92 (4.3%) | 14 (0.9%) |
| 12:00 PM to 3:59 PM | 90 (4.3%) | 137 (8.7%) |
| 4:00 PM to 11:59 PM | 142 (6.7%) | 327 (20.9%) |
| Total | 2,120 (100.0%) | 1,567 (100.0%) |
Housing Occupancy in Welcome
Occupancy by Ownership in Welcome
Of the total 3,227 dwellings in Welcome, owner-occupied units account for 2,013 (62.4%), while renter-occupied units make up 1,214 (37.6%).
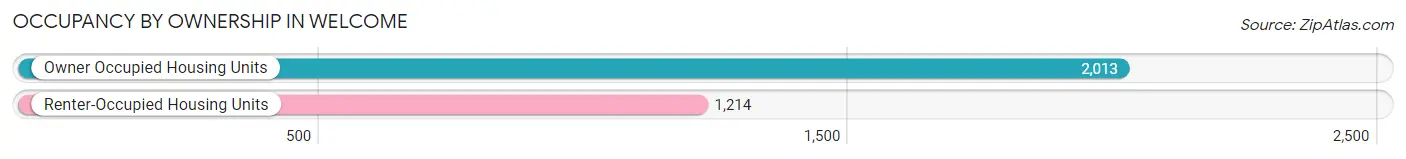
| Occupancy | # Housing Units | % Housing Units |
| Owner Occupied Housing Units | 2,013 | 62.4% |
| Renter-Occupied Housing Units | 1,214 | 37.6% |
| Total Occupied Housing Units | 3,227 | 100.0% |
Occupancy by Household Size in Welcome
| Household Size | # Housing Units | % Housing Units |
| 1-Person Household | 1,323 | 41.0% |
| 2-Person Household | 667 | 20.7% |
| 3-Person Household | 799 | 24.8% |
| 4+ Person Household | 438 | 13.6% |
| Total Housing Units | 3,227 | 100.0% |
Occupancy by Ownership by Household Size in Welcome
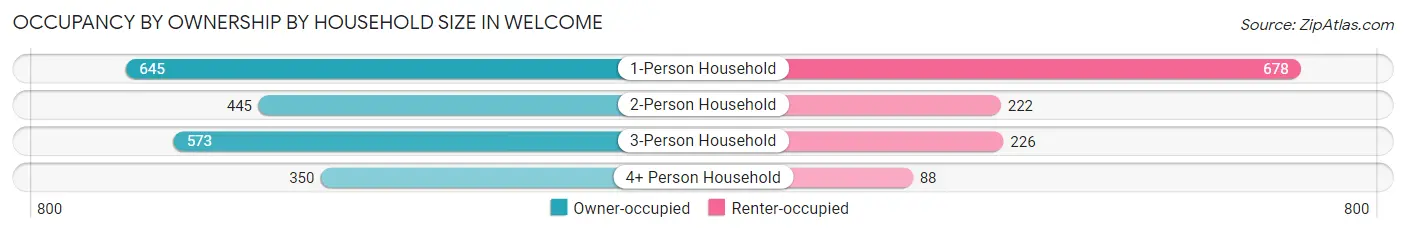
| Household Size | Owner-occupied | Renter-occupied |
| 1-Person Household | 645 (48.7%) | 678 (51.2%) |
| 2-Person Household | 445 (66.7%) | 222 (33.3%) |
| 3-Person Household | 573 (71.7%) | 226 (28.3%) |
| 4+ Person Household | 350 (79.9%) | 88 (20.1%) |
| Total Housing Units | 2,013 (62.4%) | 1,214 (37.6%) |
Occupancy by Educational Attainment in Welcome
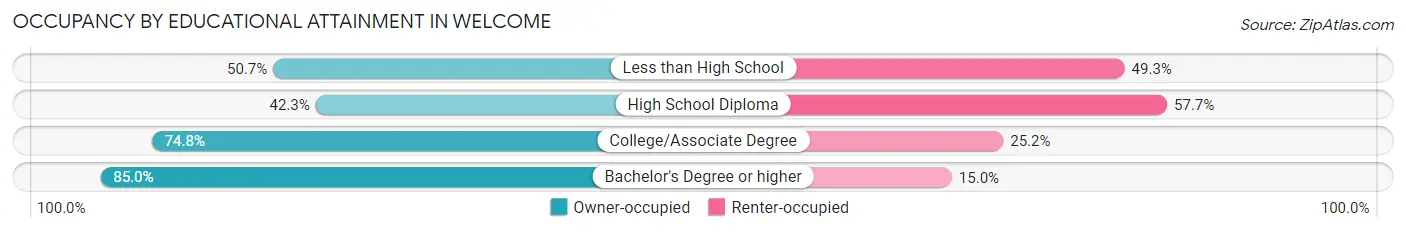
| Household Size | Owner-occupied | Renter-occupied |
| Less than High School | 277 (50.7%) | 269 (49.3%) |
| High School Diploma | 449 (42.3%) | 612 (57.7%) |
| College/Associate Degree | 659 (74.8%) | 222 (25.2%) |
| Bachelor's Degree or higher | 628 (85.0%) | 111 (15.0%) |
Occupancy by Age of Householder in Welcome
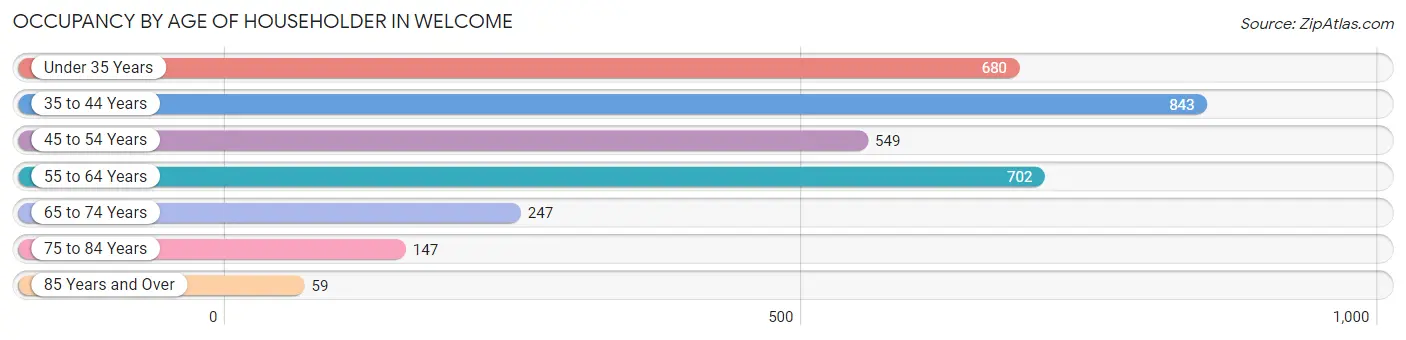
| Age Bracket | # Households | % Households |
| Under 35 Years | 680 | 21.1% |
| 35 to 44 Years | 843 | 26.1% |
| 45 to 54 Years | 549 | 17.0% |
| 55 to 64 Years | 702 | 21.7% |
| 65 to 74 Years | 247 | 7.6% |
| 75 to 84 Years | 147 | 4.6% |
| 85 Years and Over | 59 | 1.8% |
| Total | 3,227 | 100.0% |
Housing Finances in Welcome
Median Income by Occupancy in Welcome
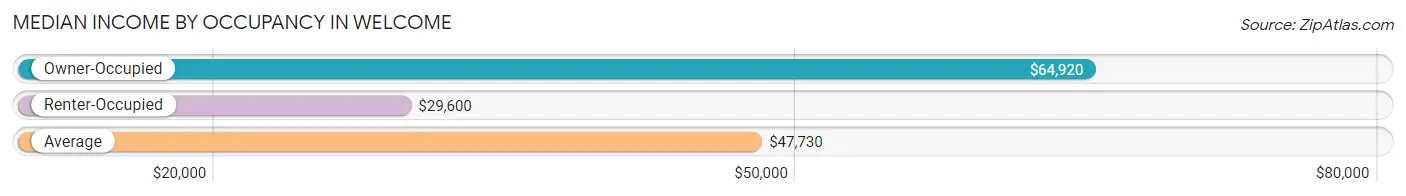
| Occupancy Type | # Households | Median Income |
| Owner-Occupied | 2,013 (62.4%) | $64,920 |
| Renter-Occupied | 1,214 (37.6%) | $29,600 |
| Average | 3,227 (100.0%) | $47,730 |
Occupancy by Householder Income Bracket in Welcome
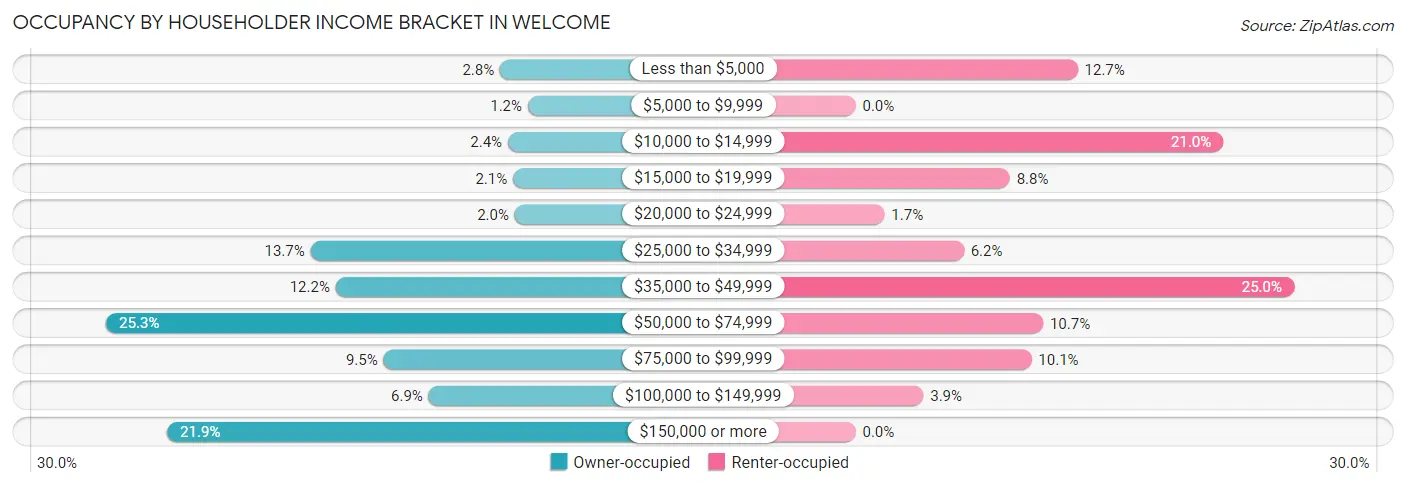
| Income Bracket | Owner-occupied | Renter-occupied |
| Less than $5,000 | 57 (2.8%) | 154 (12.7%) |
| $5,000 to $9,999 | 25 (1.2%) | 0 (0.0%) |
| $10,000 to $14,999 | 48 (2.4%) | 255 (21.0%) |
| $15,000 to $19,999 | 42 (2.1%) | 107 (8.8%) |
| $20,000 to $24,999 | 40 (2.0%) | 20 (1.7%) |
| $25,000 to $34,999 | 275 (13.7%) | 75 (6.2%) |
| $35,000 to $49,999 | 246 (12.2%) | 304 (25.0%) |
| $50,000 to $74,999 | 510 (25.3%) | 130 (10.7%) |
| $75,000 to $99,999 | 191 (9.5%) | 122 (10.1%) |
| $100,000 to $149,999 | 139 (6.9%) | 47 (3.9%) |
| $150,000 or more | 440 (21.9%) | 0 (0.0%) |
| Total | 2,013 (100.0%) | 1,214 (100.0%) |
Monthly Housing Cost Tiers in Welcome
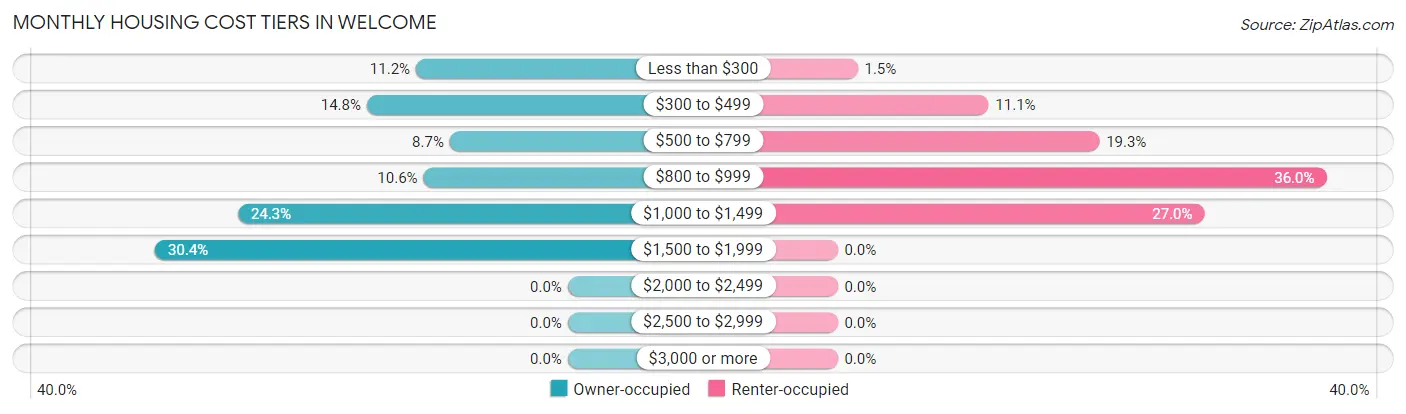
| Monthly Cost | Owner-occupied | Renter-occupied |
| Less than $300 | 225 (11.2%) | 18 (1.5%) |
| $300 to $499 | 298 (14.8%) | 135 (11.1%) |
| $500 to $799 | 175 (8.7%) | 234 (19.3%) |
| $800 to $999 | 214 (10.6%) | 437 (36.0%) |
| $1,000 to $1,499 | 489 (24.3%) | 328 (27.0%) |
| $1,500 to $1,999 | 612 (30.4%) | 0 (0.0%) |
| $2,000 to $2,499 | 0 (0.0%) | 0 (0.0%) |
| $2,500 to $2,999 | 0 (0.0%) | 0 (0.0%) |
| $3,000 or more | 0 (0.0%) | 0 (0.0%) |
| Total | 2,013 (100.0%) | 1,214 (100.0%) |
Physical Housing Characteristics in Welcome
Housing Structures in Welcome
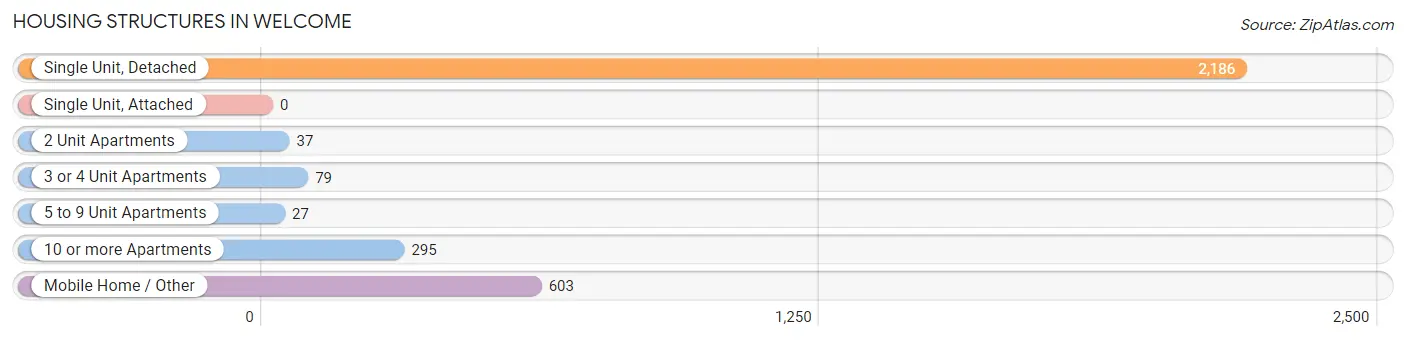
| Structure Type | # Housing Units | % Housing Units |
| Single Unit, Detached | 2,186 | 67.7% |
| Single Unit, Attached | 0 | 0.0% |
| 2 Unit Apartments | 37 | 1.1% |
| 3 or 4 Unit Apartments | 79 | 2.5% |
| 5 to 9 Unit Apartments | 27 | 0.8% |
| 10 or more Apartments | 295 | 9.1% |
| Mobile Home / Other | 603 | 18.7% |
| Total | 3,227 | 100.0% |
Housing Structures by Occupancy in Welcome
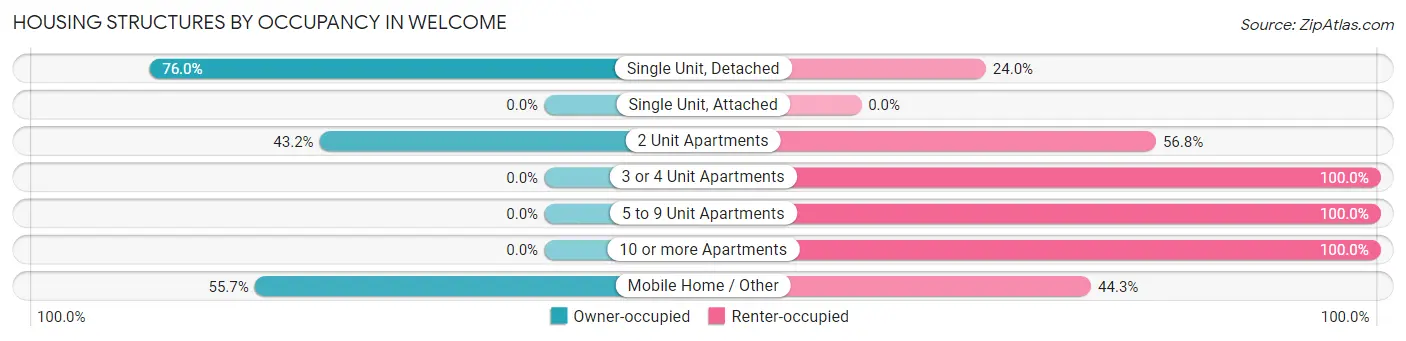
| Structure Type | Owner-occupied | Renter-occupied |
| Single Unit, Detached | 1,661 (76.0%) | 525 (24.0%) |
| Single Unit, Attached | 0 (0.0%) | 0 (0.0%) |
| 2 Unit Apartments | 16 (43.2%) | 21 (56.8%) |
| 3 or 4 Unit Apartments | 0 (0.0%) | 79 (100.0%) |
| 5 to 9 Unit Apartments | 0 (0.0%) | 27 (100.0%) |
| 10 or more Apartments | 0 (0.0%) | 295 (100.0%) |
| Mobile Home / Other | 336 (55.7%) | 267 (44.3%) |
| Total | 2,013 (62.4%) | 1,214 (37.6%) |
Housing Structures by Number of Rooms in Welcome
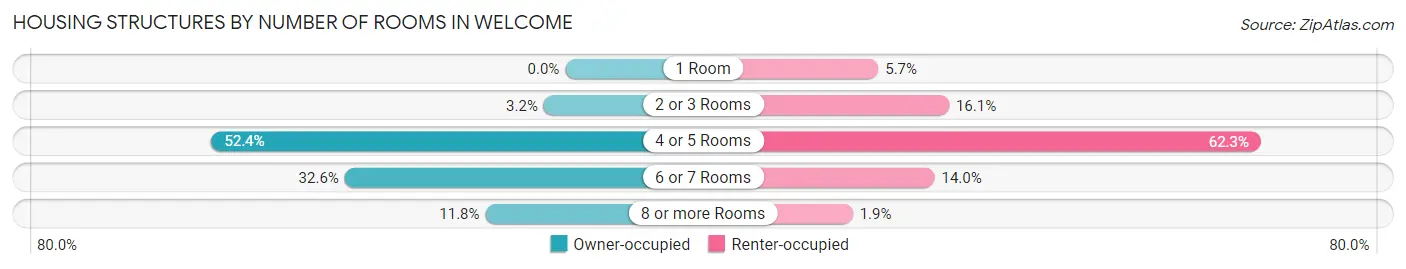
| Number of Rooms | Owner-occupied | Renter-occupied |
| 1 Room | 0 (0.0%) | 69 (5.7%) |
| 2 or 3 Rooms | 64 (3.2%) | 196 (16.1%) |
| 4 or 5 Rooms | 1,054 (52.4%) | 756 (62.3%) |
| 6 or 7 Rooms | 657 (32.6%) | 170 (14.0%) |
| 8 or more Rooms | 238 (11.8%) | 23 (1.9%) |
| Total | 2,013 (100.0%) | 1,214 (100.0%) |
Housing Structure by Heating Type in Welcome
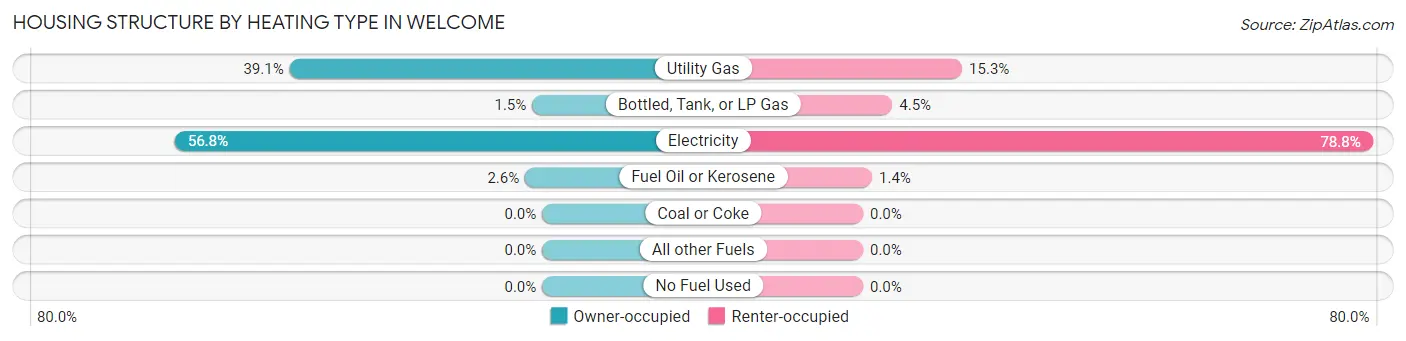
| Heating Type | Owner-occupied | Renter-occupied |
| Utility Gas | 786 (39.1%) | 186 (15.3%) |
| Bottled, Tank, or LP Gas | 31 (1.5%) | 55 (4.5%) |
| Electricity | 1,143 (56.8%) | 956 (78.7%) |
| Fuel Oil or Kerosene | 53 (2.6%) | 17 (1.4%) |
| Coal or Coke | 0 (0.0%) | 0 (0.0%) |
| All other Fuels | 0 (0.0%) | 0 (0.0%) |
| No Fuel Used | 0 (0.0%) | 0 (0.0%) |
| Total | 2,013 (100.0%) | 1,214 (100.0%) |
Household Vehicle Usage in Welcome
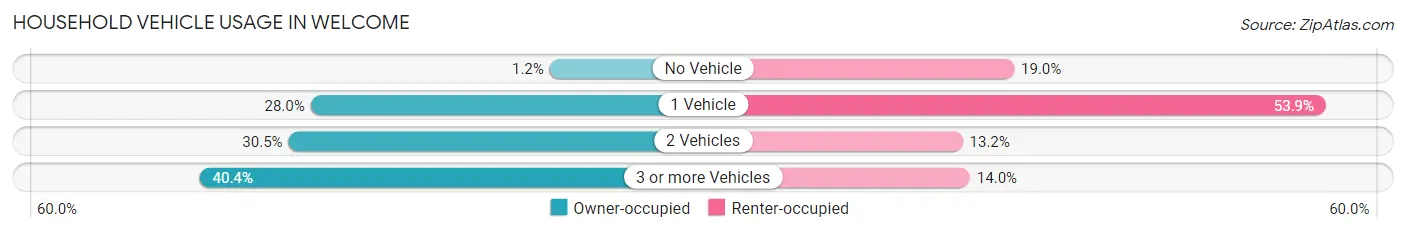
| Vehicles per Household | Owner-occupied | Renter-occupied |
| No Vehicle | 24 (1.2%) | 230 (19.0%) |
| 1 Vehicle | 563 (28.0%) | 654 (53.9%) |
| 2 Vehicles | 613 (30.4%) | 160 (13.2%) |
| 3 or more Vehicles | 813 (40.4%) | 170 (14.0%) |
| Total | 2,013 (100.0%) | 1,214 (100.0%) |
Real Estate & Mortgages in Welcome
Real Estate and Mortgage Overview in Welcome
| Characteristic | Without Mortgage | With Mortgage |
| Housing Units | 622 | 1,391 |
| Median Property Value | $93,400 | $175,800 |
| Median Household Income | $44,541 | $383 |
| Monthly Housing Costs | $369 | $0 |
| Real Estate Taxes | $616 | $30 |
Property Value by Mortgage Status in Welcome
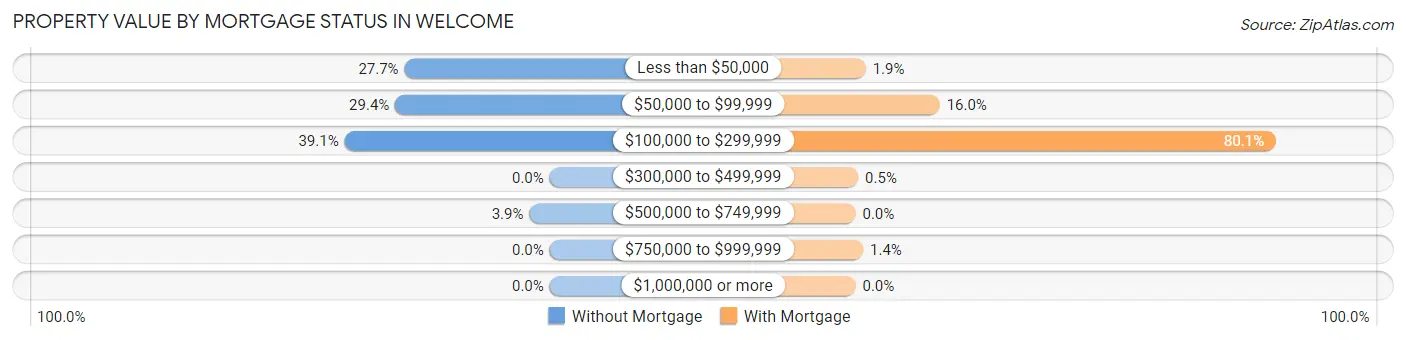
| Property Value | Without Mortgage | With Mortgage |
| Less than $50,000 | 172 (27.7%) | 27 (1.9%) |
| $50,000 to $99,999 | 183 (29.4%) | 223 (16.0%) |
| $100,000 to $299,999 | 243 (39.1%) | 1,114 (80.1%) |
| $300,000 to $499,999 | 0 (0.0%) | 7 (0.5%) |
| $500,000 to $749,999 | 24 (3.9%) | 0 (0.0%) |
| $750,000 to $999,999 | 0 (0.0%) | 20 (1.4%) |
| $1,000,000 or more | 0 (0.0%) | 0 (0.0%) |
| Total | 622 (100.0%) | 1,391 (100.0%) |
Household Income by Mortgage Status in Welcome
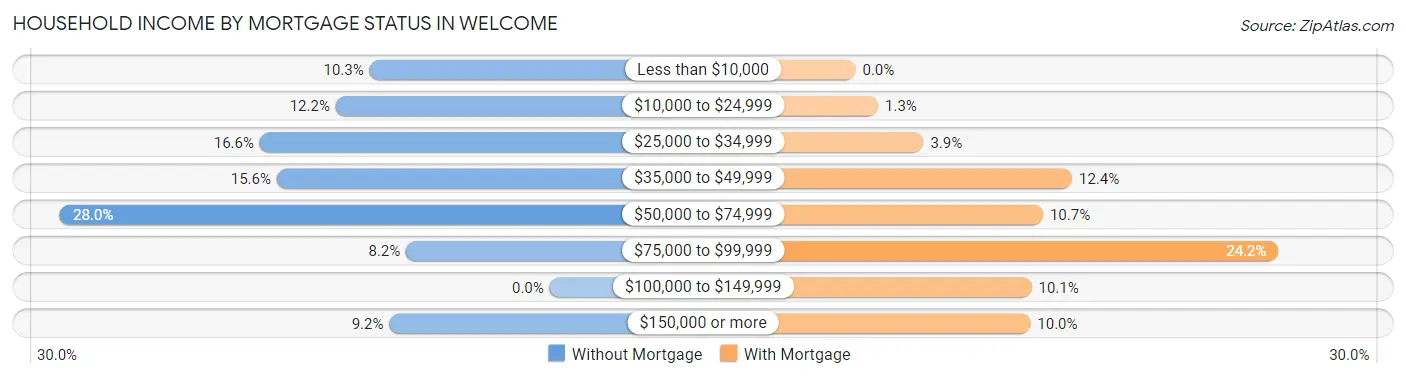
| Household Income | Without Mortgage | With Mortgage |
| Less than $10,000 | 64 (10.3%) | 0 (0.0%) |
| $10,000 to $24,999 | 76 (12.2%) | 18 (1.3%) |
| $25,000 to $34,999 | 103 (16.6%) | 54 (3.9%) |
| $35,000 to $49,999 | 97 (15.6%) | 172 (12.4%) |
| $50,000 to $74,999 | 174 (28.0%) | 149 (10.7%) |
| $75,000 to $99,999 | 51 (8.2%) | 336 (24.2%) |
| $100,000 to $149,999 | 0 (0.0%) | 140 (10.1%) |
| $150,000 or more | 57 (9.2%) | 139 (10.0%) |
| Total | 622 (100.0%) | 1,391 (100.0%) |
Property Value to Household Income Ratio in Welcome
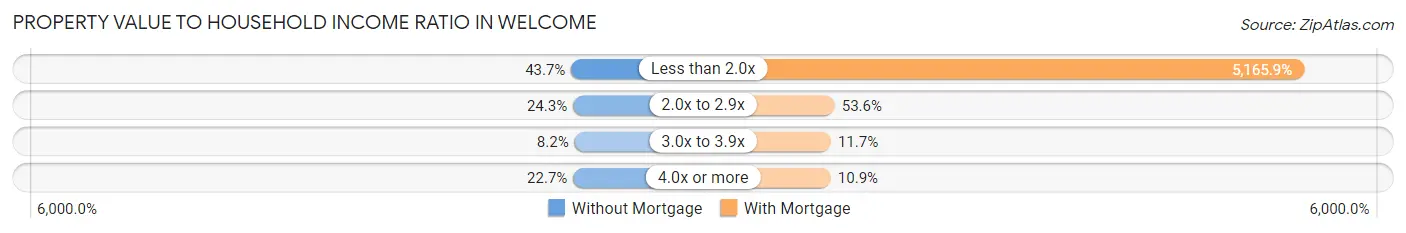
| Value-to-Income Ratio | Without Mortgage | With Mortgage |
| Less than 2.0x | 272 (43.7%) | 71,858 (5,165.9%) |
| 2.0x to 2.9x | 151 (24.3%) | 745 (53.6%) |
| 3.0x to 3.9x | 51 (8.2%) | 163 (11.7%) |
| 4.0x or more | 141 (22.7%) | 152 (10.9%) |
| Total | 622 (100.0%) | 1,391 (100.0%) |
Real Estate Taxes by Mortgage Status in Welcome
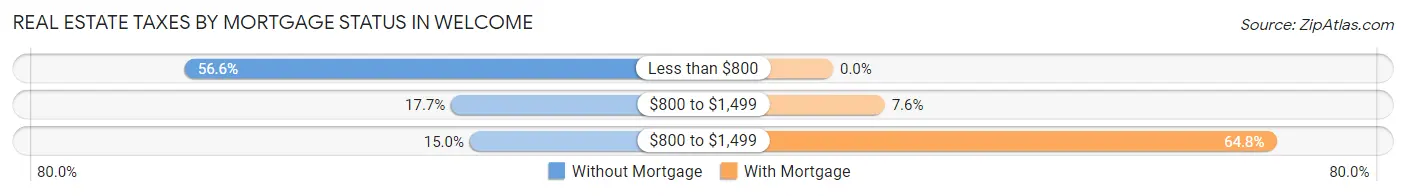
| Property Taxes | Without Mortgage | With Mortgage |
| Less than $800 | 352 (56.6%) | 0 (0.0%) |
| $800 to $1,499 | 110 (17.7%) | 105 (7.5%) |
| $800 to $1,499 | 93 (14.9%) | 901 (64.8%) |
| Total | 622 (100.0%) | 1,391 (100.0%) |
Health & Disability in Welcome
Health Insurance Coverage by Age in Welcome
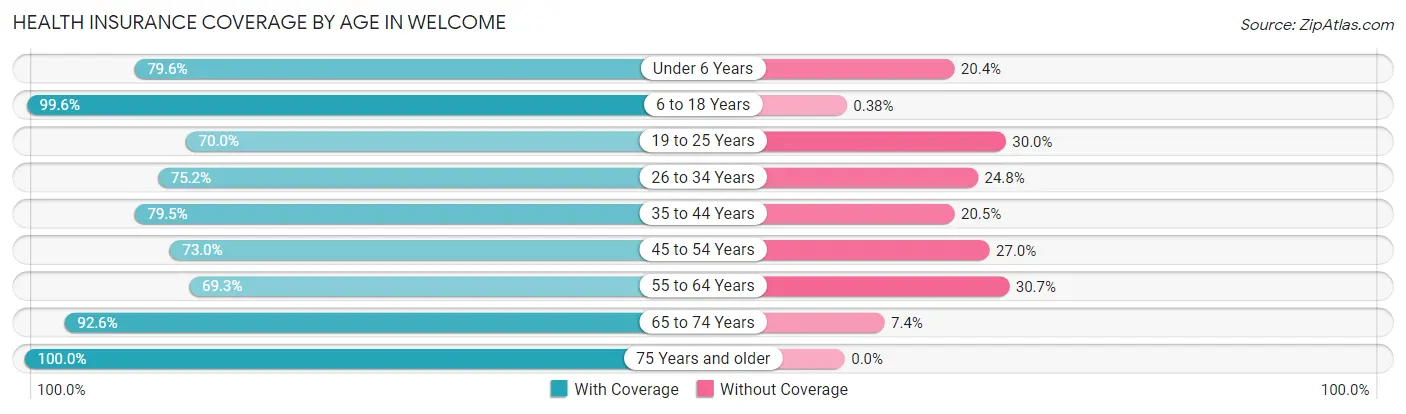
| Age Bracket | With Coverage | Without Coverage |
| Under 6 Years | 323 (79.6%) | 83 (20.4%) |
| 6 to 18 Years | 1,560 (99.6%) | 6 (0.4%) |
| 19 to 25 Years | 219 (70.0%) | 94 (30.0%) |
| 26 to 34 Years | 799 (75.2%) | 264 (24.8%) |
| 35 to 44 Years | 921 (79.5%) | 237 (20.5%) |
| 45 to 54 Years | 603 (73.0%) | 223 (27.0%) |
| 55 to 64 Years | 737 (69.3%) | 326 (30.7%) |
| 65 to 74 Years | 449 (92.6%) | 36 (7.4%) |
| 75 Years and older | 273 (100.0%) | 0 (0.0%) |
| Total | 5,884 (82.3%) | 1,269 (17.7%) |
Health Insurance Coverage by Citizenship Status in Welcome
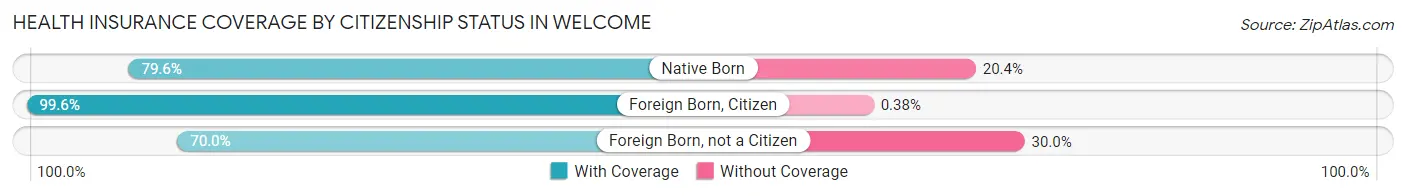
| Citizenship Status | With Coverage | Without Coverage |
| Native Born | 323 (79.6%) | 83 (20.4%) |
| Foreign Born, Citizen | 1,560 (99.6%) | 6 (0.4%) |
| Foreign Born, not a Citizen | 219 (70.0%) | 94 (30.0%) |
Health Insurance Coverage by Household Income in Welcome
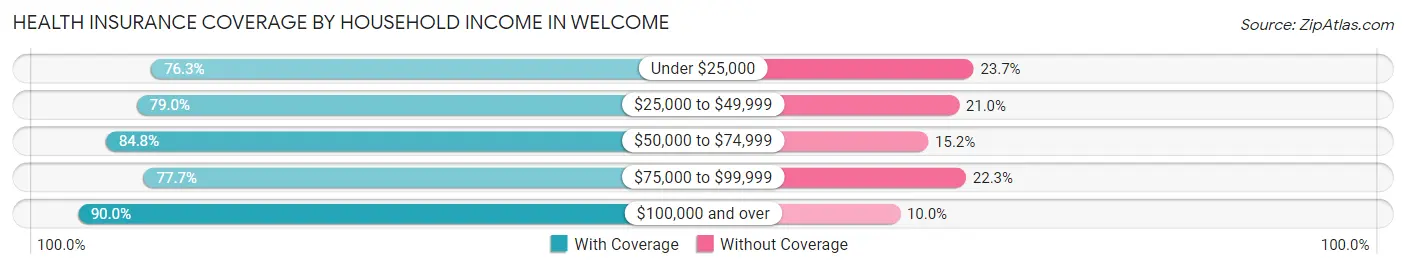
| Household Income | With Coverage | Without Coverage |
| Under $25,000 | 675 (76.3%) | 210 (23.7%) |
| $25,000 to $49,999 | 1,482 (79.0%) | 394 (21.0%) |
| $50,000 to $74,999 | 1,431 (84.8%) | 257 (15.2%) |
| $75,000 to $99,999 | 874 (77.7%) | 251 (22.3%) |
| $100,000 and over | 1,419 (90.0%) | 157 (10.0%) |
Public vs Private Health Insurance Coverage by Age in Welcome
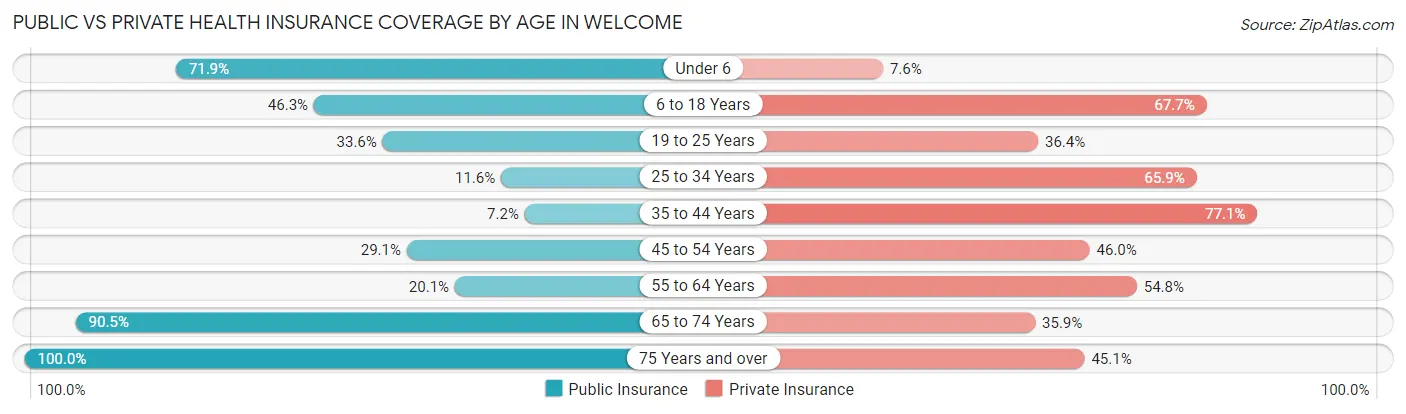
| Age Bracket | Public Insurance | Private Insurance |
| Under 6 | 292 (71.9%) | 31 (7.6%) |
| 6 to 18 Years | 725 (46.3%) | 1,060 (67.7%) |
| 19 to 25 Years | 105 (33.6%) | 114 (36.4%) |
| 25 to 34 Years | 123 (11.6%) | 700 (65.8%) |
| 35 to 44 Years | 83 (7.2%) | 893 (77.1%) |
| 45 to 54 Years | 240 (29.1%) | 380 (46.0%) |
| 55 to 64 Years | 214 (20.1%) | 582 (54.7%) |
| 65 to 74 Years | 439 (90.5%) | 174 (35.9%) |
| 75 Years and over | 273 (100.0%) | 123 (45.1%) |
| Total | 2,494 (34.9%) | 4,057 (56.7%) |
Disability Status by Sex by Age in Welcome
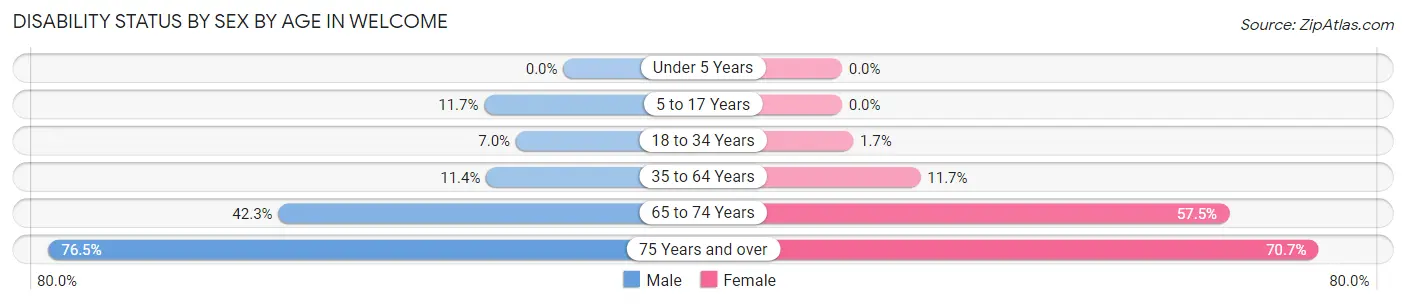
| Age Bracket | Male | Female |
| Under 5 Years | 0 (0.0%) | 0 (0.0%) |
| 5 to 17 Years | 85 (11.7%) | 0 (0.0%) |
| 18 to 34 Years | 46 (7.0%) | 13 (1.7%) |
| 35 to 64 Years | 184 (11.4%) | 168 (11.7%) |
| 65 to 74 Years | 44 (42.3%) | 219 (57.5%) |
| 75 Years and over | 65 (76.5%) | 133 (70.7%) |
Disability Class by Sex by Age in Welcome
Disability Class: Hearing Difficulty
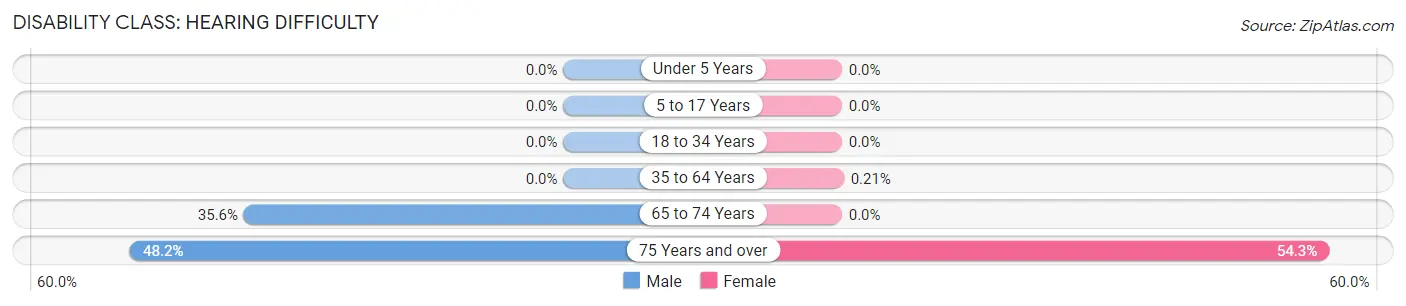
| Age Bracket | Male | Female |
| Under 5 Years | 0 (0.0%) | 0 (0.0%) |
| 5 to 17 Years | 0 (0.0%) | 0 (0.0%) |
| 18 to 34 Years | 0 (0.0%) | 0 (0.0%) |
| 35 to 64 Years | 0 (0.0%) | 3 (0.2%) |
| 65 to 74 Years | 37 (35.6%) | 0 (0.0%) |
| 75 Years and over | 41 (48.2%) | 102 (54.3%) |
Disability Class: Vision Difficulty
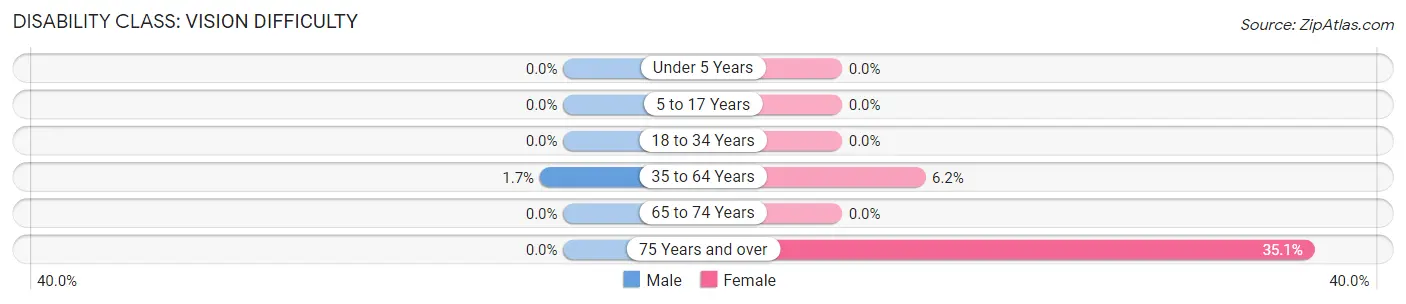
| Age Bracket | Male | Female |
| Under 5 Years | 0 (0.0%) | 0 (0.0%) |
| 5 to 17 Years | 0 (0.0%) | 0 (0.0%) |
| 18 to 34 Years | 0 (0.0%) | 0 (0.0%) |
| 35 to 64 Years | 28 (1.7%) | 89 (6.2%) |
| 65 to 74 Years | 0 (0.0%) | 0 (0.0%) |
| 75 Years and over | 0 (0.0%) | 66 (35.1%) |
Disability Class: Cognitive Difficulty
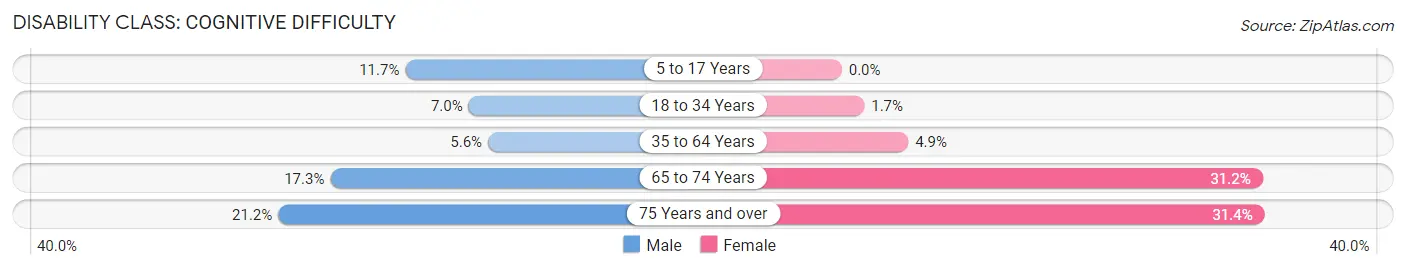
| Age Bracket | Male | Female |
| 5 to 17 Years | 85 (11.7%) | 0 (0.0%) |
| 18 to 34 Years | 46 (7.0%) | 13 (1.7%) |
| 35 to 64 Years | 90 (5.6%) | 71 (4.9%) |
| 65 to 74 Years | 18 (17.3%) | 119 (31.2%) |
| 75 Years and over | 18 (21.2%) | 59 (31.4%) |
Disability Class: Ambulatory Difficulty
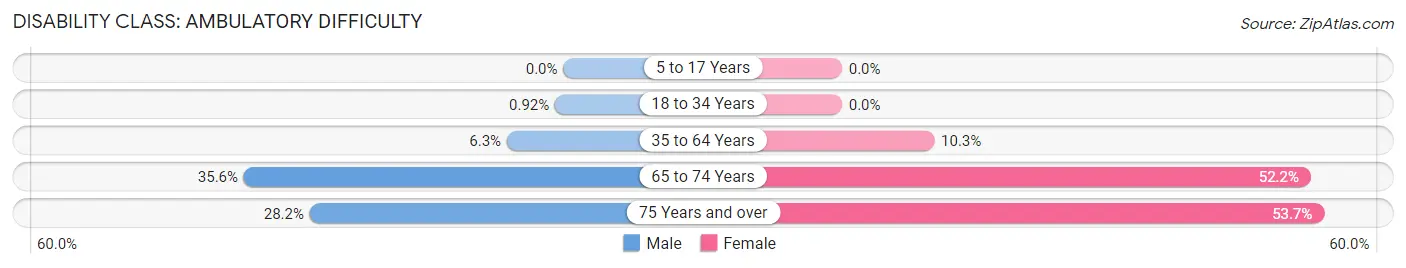
| Age Bracket | Male | Female |
| 5 to 17 Years | 0 (0.0%) | 0 (0.0%) |
| 18 to 34 Years | 6 (0.9%) | 0 (0.0%) |
| 35 to 64 Years | 101 (6.3%) | 148 (10.3%) |
| 65 to 74 Years | 37 (35.6%) | 199 (52.2%) |
| 75 Years and over | 24 (28.2%) | 101 (53.7%) |
Disability Class: Self-Care Difficulty
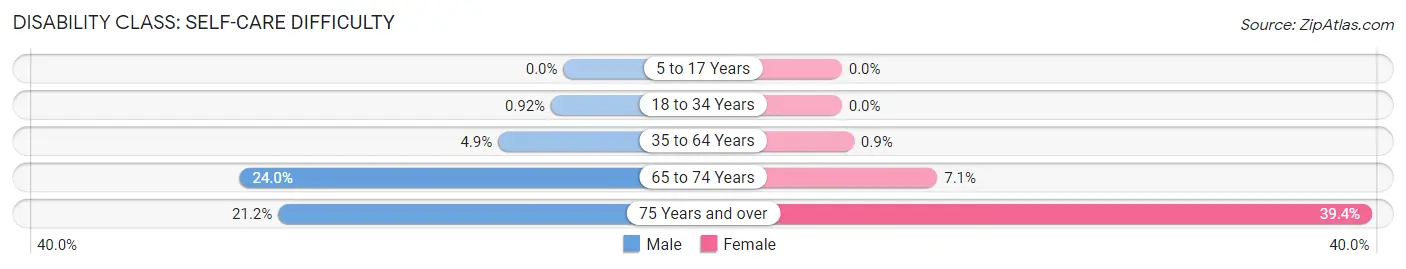
| Age Bracket | Male | Female |
| 5 to 17 Years | 0 (0.0%) | 0 (0.0%) |
| 18 to 34 Years | 6 (0.9%) | 0 (0.0%) |
| 35 to 64 Years | 78 (4.9%) | 13 (0.9%) |
| 65 to 74 Years | 25 (24.0%) | 27 (7.1%) |
| 75 Years and over | 18 (21.2%) | 74 (39.4%) |
Technology Access in Welcome
Computing Device Access in Welcome
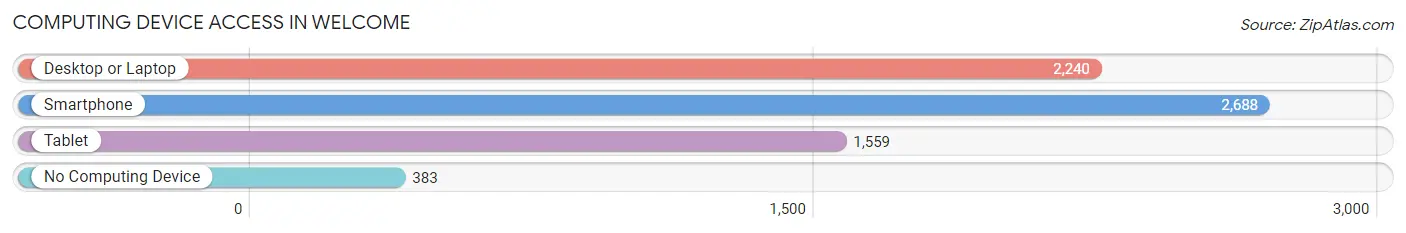
| Device Type | # Households | % Households |
| Desktop or Laptop | 2,240 | 69.4% |
| Smartphone | 2,688 | 83.3% |
| Tablet | 1,559 | 48.3% |
| No Computing Device | 383 | 11.9% |
| Total | 3,227 | 100.0% |
Internet Access in Welcome
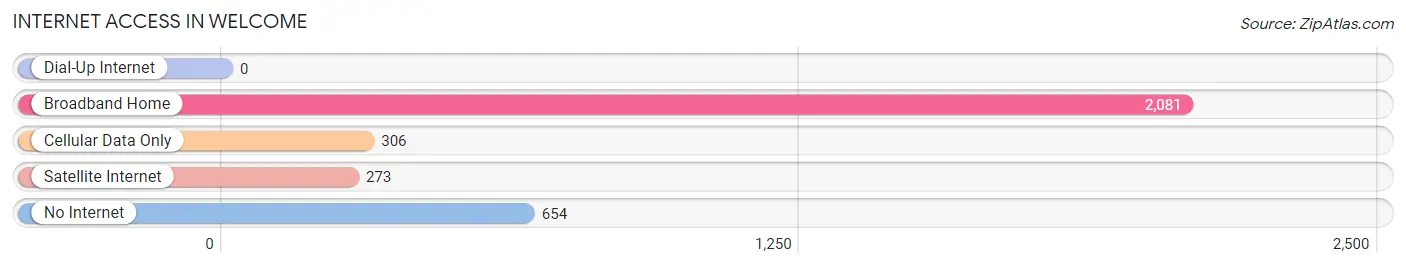
| Internet Type | # Households | % Households |
| Dial-Up Internet | 0 | 0.0% |
| Broadband Home | 2,081 | 64.5% |
| Cellular Data Only | 306 | 9.5% |
| Satellite Internet | 273 | 8.5% |
| No Internet | 654 | 20.3% |
| Total | 3,227 | 100.0% |
Welcome Summary
South Carolina is a state located in the southeastern region of the United States. It is bordered by North Carolina to the north, Georgia to the south and west, and the Atlantic Ocean to the east. South Carolina is the 40th most populous state in the United States, with a population of 5.1 million people as of 2020.
Geography
South Carolina is located in the southeastern United States, bordered by North Carolina to the north, Georgia to the south and west, and the Atlantic Ocean to the east. The state is divided into 46 counties and has an area of 32,020 square miles (82,931 km2). The highest point in the state is Sassafras Mountain, which has an elevation of 3,560 feet (1,085 m). The state has a humid subtropical climate, with hot, humid summers and mild winters.
The coastal plain of South Carolina is divided into three regions: the Atlantic Coastal Plain, the Sandhills, and the Piedmont. The Atlantic Coastal Plain is a narrow strip of land along the Atlantic Ocean, extending from the North Carolina border to the Savannah River. The Sandhills region is a band of rolling hills in the central part of the state, extending from the North Carolina border to the Savannah River. The Piedmont region is a plateau in the northwestern part of the state, extending from the North Carolina border to the Savannah River.
Economy
South Carolina has a diversified economy, with a mix of agriculture, manufacturing, and services. The state’s major industries include textiles, chemicals, automotive, and tourism. The state’s agricultural products include poultry, eggs, dairy products, tobacco, and soybeans. The state’s manufacturing sector is dominated by the automotive industry, with BMW, Michelin, and Boeing all having major operations in the state. The state’s service sector is dominated by tourism, with Myrtle Beach and Charleston being the two most popular destinations.
Demographics
As of 2020, South Carolina had an estimated population of 5.1 million people. The state is racially diverse, with a population that is 63.2% white, 27.3% African American, 5.2% Hispanic or Latino, 2.3% Asian, and 0.7% Native American. The state’s largest cities are Columbia (population of 131,686), Charleston (population of 134,385), and North Charleston (population of 108,304).
South Carolina is a predominantly Christian state, with the largest denominations being Baptist (44.2%), Methodist (11.2%), and Presbyterian (7.2%). The state also has a significant Jewish population (2.2%) and a small Muslim population (0.3%).
Conclusion
South Carolina is a state located in the southeastern United States, bordered by North Carolina to the north, Georgia to the south and west, and the Atlantic Ocean to the east. The state has a population of 5.1 million people, with a diverse racial makeup and a predominantly Christian population. The state’s economy is diversified, with a mix of agriculture, manufacturing, and services. South Carolina is a popular tourist destination, with Myrtle Beach and Charleston being the two most popular destinations.
Common Questions
What is Per Capita Income in Welcome?
Per Capita income in Welcome is $33,763.
What is the Median Family Income in Welcome?
Median Family Income in Welcome is $64,138.
What is the Median Household income in Welcome?
Median Household Income in Welcome is $47,730.
What is Income or Wage Gap in Welcome?
Income or Wage Gap in Welcome is 44.0%.
Women in Welcome earn 56.0 cents for every dollar earned by a man.
What is Inequality or Gini Index in Welcome?
Inequality or Gini Index in Welcome is 0.49.
What is the Total Population of Welcome?
Total Population of Welcome is 7,153.
What is the Total Male Population of Welcome?
Total Male Population of Welcome is 3,379.
What is the Total Female Population of Welcome?
Total Female Population of Welcome is 3,774.
What is the Ratio of Males per 100 Females in Welcome?
There are 89.53 Males per 100 Females in Welcome.
What is the Ratio of Females per 100 Males in Welcome?
There are 111.69 Females per 100 Males in Welcome.
What is the Median Population Age in Welcome?
Median Population Age in Welcome is 36.7 Years.
What is the Average Family Size in Welcome
Average Family Size in Welcome is 3.0 People.
What is the Average Household Size in Welcome
Average Household Size in Welcome is 2.2 People.
How Large is the Labor Force in Welcome?
There are 4,175 People in the Labor Forcein in Welcome.
What is the Percentage of People in the Labor Force in Welcome?
69.3% of People are in the Labor Force in Welcome.
What is the Unemployment Rate in Welcome?
Unemployment Rate in Welcome is 5.7%.