Zip Codes with the Highest Percentage of Population Employed in Food Preparation & Serving in Florence, SC
RELATED REPORTS & OPTIONS
Food Preparation & Serving
Florence
Compare Zip Codes
Map of Zip Codes with the Highest Percentage of Population Employed in Food Preparation & Serving in Florence
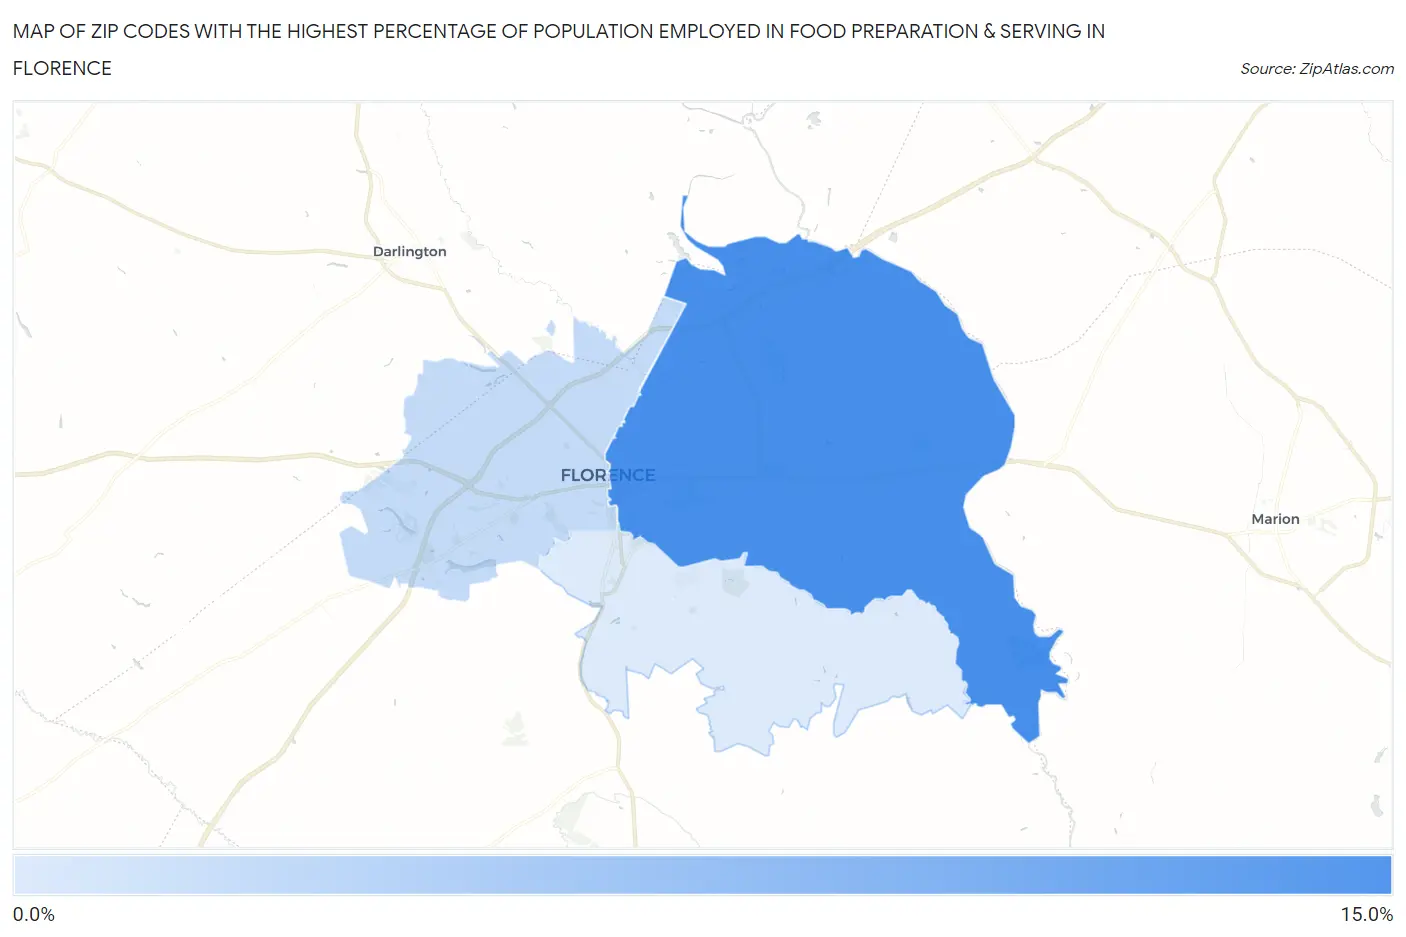
3.7%
14.2%
Zip Codes with the Highest Percentage of Population Employed in Food Preparation & Serving in Florence, SC
| Zip Code | % Employed | vs State | vs National | |
| 1. | 29506 | 14.2% | 5.8%(+8.46)#18 | 5.3%(+8.94)#1,116 |
| 2. | 29501 | 5.5% | 5.8%(-0.316)#177 | 5.3%(+0.167)#11,210 |
| 3. | 29505 | 3.7% | 5.8%(-2.06)#268 | 5.3%(-1.57)#18,291 |
1
Common Questions
What are the Top Zip Codes with the Highest Percentage of Population Employed in Food Preparation & Serving in Florence, SC?
Top Zip Codes with the Highest Percentage of Population Employed in Food Preparation & Serving in Florence, SC are:
What zip code has the Highest Percentage of Population Employed in Food Preparation & Serving in Florence, SC?
29506 has the Highest Percentage of Population Employed in Food Preparation & Serving in Florence, SC with 14.2%.
What is the Percentage of Population Employed in Food Preparation & Serving in Florence, SC?
Percentage of Population Employed in Food Preparation & Serving in Florence is 6.8%.
What is the Percentage of Population Employed in Food Preparation & Serving in South Carolina?
Percentage of Population Employed in Food Preparation & Serving in South Carolina is 5.8%.
What is the Percentage of Population Employed in Food Preparation & Serving in the United States?
Percentage of Population Employed in Food Preparation & Serving in the United States is 5.3%.