Bluffton, SC Map & Demographics
Bluffton Map
Bluffton Overview
$52,381
PER CAPITA INCOME
$110,724
AVG FAMILY INCOME
$99,575
AVG HOUSEHOLD INCOME
27.2%
WAGE / INCOME GAP [ % ]
72.8¢/ $1
WAGE / INCOME GAP [ $ ]
$11,057
FAMILY INCOME DEFICIT
0.46
INEQUALITY / GINI INDEX
29,375
TOTAL POPULATION
14,576
MALE POPULATION
14,799
FEMALE POPULATION
98.49
MALES / 100 FEMALES
101.53
FEMALES / 100 MALES
40.9
MEDIAN AGE
3.1
AVG FAMILY SIZE
2.7
AVG HOUSEHOLD SIZE
14,164
LABOR FORCE [ PEOPLE ]
61.7%
PERCENT IN LABOR FORCE
1.4%
UNEMPLOYMENT RATE
Bluffton Zip Codes
Bluffton Area Codes
Income in Bluffton
Income Overview in Bluffton
Per Capita Income in Bluffton is $52,381, while median incomes of families and households are $110,724 and $99,575 respectively.
| Characteristic | Number | Measure |
| Per Capita Income | 29,375 | $52,381 |
| Median Family Income | 8,178 | $110,724 |
| Mean Family Income | 8,178 | $157,941 |
| Median Household Income | 10,685 | $99,575 |
| Mean Household Income | 10,685 | $139,786 |
| Income Deficit | 8,178 | $11,057 |
| Wage / Income Gap (%) | 29,375 | 27.15% |
| Wage / Income Gap ($) | 29,375 | 72.85¢ per $1 |
| Gini / Inequality Index | 29,375 | 0.46 |
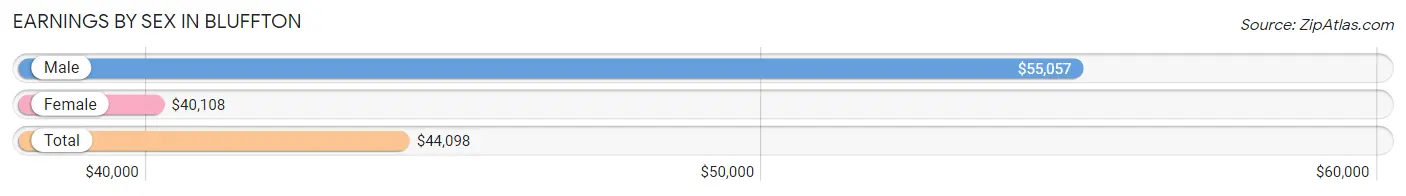
Earnings by Sex in Bluffton
Average Earnings in Bluffton are $44,098, $55,057 for men and $40,108 for women, a difference of 27.2%.
| Sex | Number | Average Earnings |
| Male | 8,384 (55.2%) | $55,057 |
| Female | 6,815 (44.8%) | $40,108 |
| Total | 15,199 (100.0%) | $44,098 |
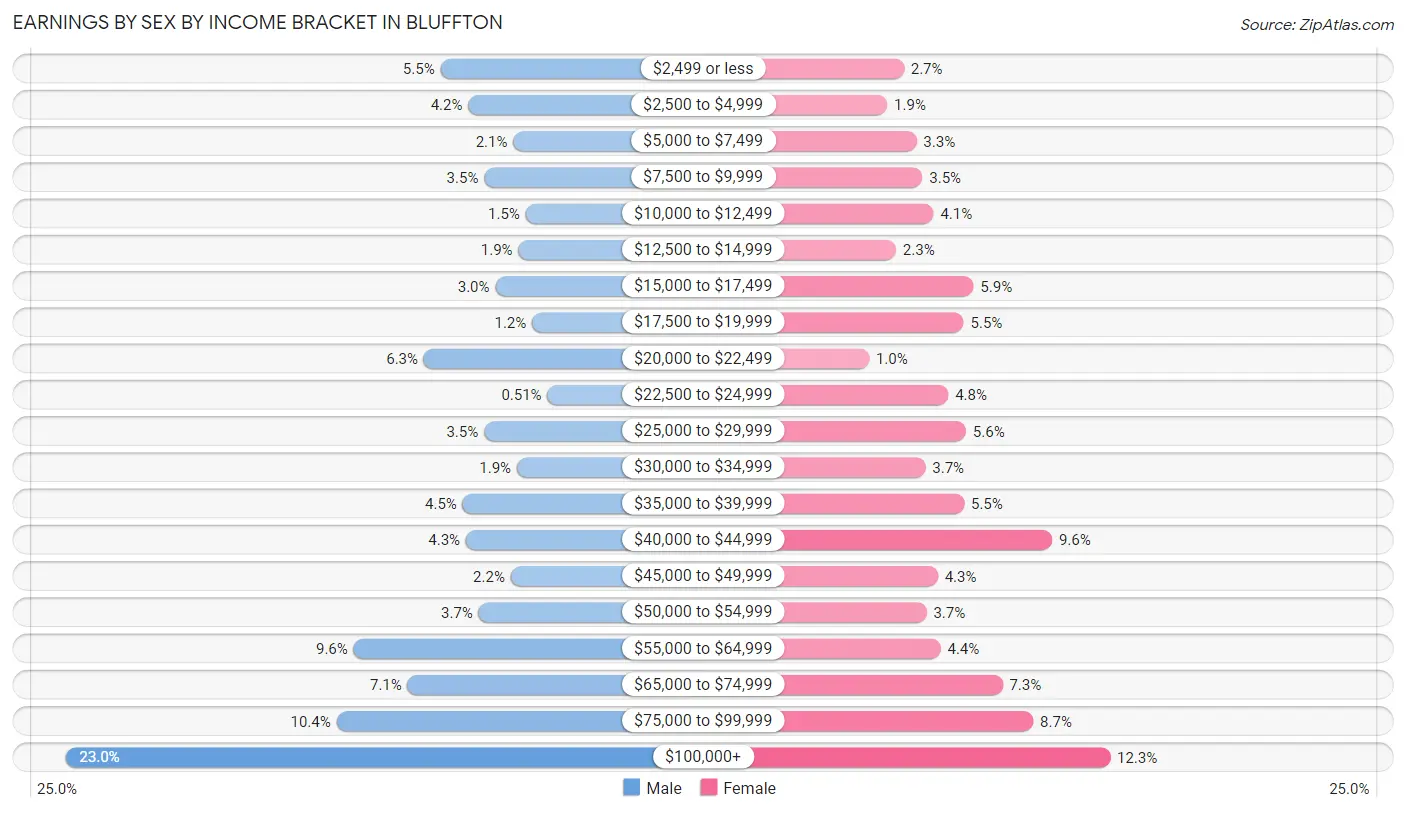
Earnings by Sex by Income Bracket in Bluffton
The most common earnings brackets in Bluffton are $100,000+ for men (1,932 | 23.0%) and $100,000+ for women (840 | 12.3%).
| Income | Male | Female |
| $2,499 or less | 463 (5.5%) | 182 (2.7%) |
| $2,500 to $4,999 | 354 (4.2%) | 129 (1.9%) |
| $5,000 to $7,499 | 177 (2.1%) | 222 (3.3%) |
| $7,500 to $9,999 | 291 (3.5%) | 241 (3.5%) |
| $10,000 to $12,499 | 128 (1.5%) | 277 (4.1%) |
| $12,500 to $14,999 | 157 (1.9%) | 157 (2.3%) |
| $15,000 to $17,499 | 247 (2.9%) | 404 (5.9%) |
| $17,500 to $19,999 | 103 (1.2%) | 373 (5.5%) |
| $20,000 to $22,499 | 528 (6.3%) | 71 (1.0%) |
| $22,500 to $24,999 | 43 (0.5%) | 324 (4.8%) |
| $25,000 to $29,999 | 292 (3.5%) | 380 (5.6%) |
| $30,000 to $34,999 | 163 (1.9%) | 251 (3.7%) |
| $35,000 to $39,999 | 376 (4.5%) | 374 (5.5%) |
| $40,000 to $44,999 | 363 (4.3%) | 655 (9.6%) |
| $45,000 to $49,999 | 187 (2.2%) | 290 (4.3%) |
| $50,000 to $54,999 | 313 (3.7%) | 254 (3.7%) |
| $55,000 to $64,999 | 804 (9.6%) | 299 (4.4%) |
| $65,000 to $74,999 | 592 (7.1%) | 497 (7.3%) |
| $75,000 to $99,999 | 871 (10.4%) | 595 (8.7%) |
| $100,000+ | 1,932 (23.0%) | 840 (12.3%) |
| Total | 8,384 (100.0%) | 6,815 (100.0%) |
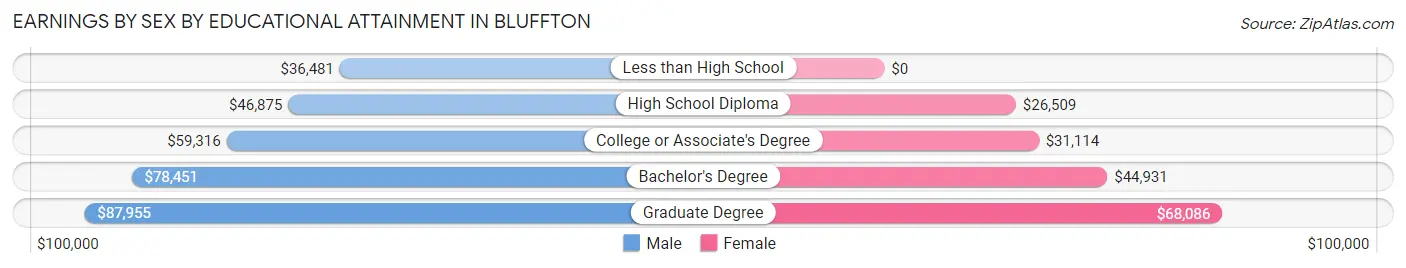
Earnings by Sex by Educational Attainment in Bluffton
Average earnings in Bluffton are $62,817 for men and $41,567 for women, a difference of 33.8%. Men with an educational attainment of graduate degree enjoy the highest average annual earnings of $87,955, while those with less than high school education earn the least with $36,481. Women with an educational attainment of graduate degree earn the most with the average annual earnings of $68,086, while those with high school diploma education have the smallest earnings of $26,509.
| Educational Attainment | Male Income | Female Income |
| Less than High School | $36,481 | $0 |
| High School Diploma | $46,875 | $26,509 |
| College or Associate's Degree | $59,316 | $31,114 |
| Bachelor's Degree | $78,451 | $44,931 |
| Graduate Degree | $87,955 | $68,086 |
| Total | $62,817 | $41,567 |
Family Income in Bluffton
Family Income Brackets in Bluffton
According to the Bluffton family income data, there are 2,102 families falling into the $100,000 to $149,999 income range, which is the most common income bracket and makes up 25.7% of all families. Conversely, the $10,000 to $14,999 income bracket is the least frequent group with only 82 families (1.0%) belonging to this category.
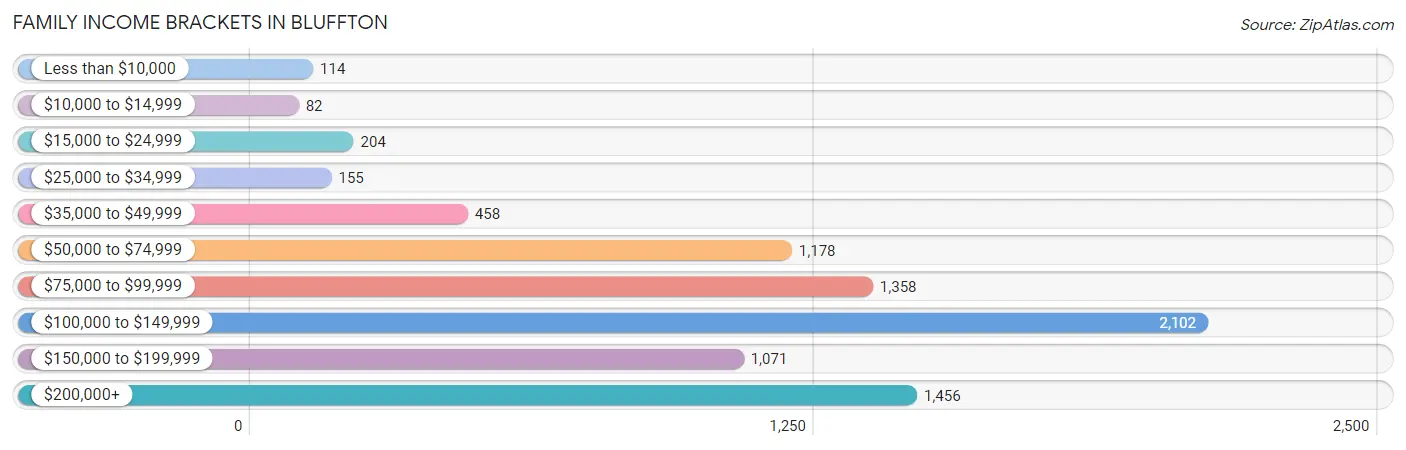
| Income Bracket | # Families | % Families |
| Less than $10,000 | 114 | 1.4% |
| $10,000 to $14,999 | 82 | 1.0% |
| $15,000 to $24,999 | 204 | 2.5% |
| $25,000 to $34,999 | 155 | 1.9% |
| $35,000 to $49,999 | 458 | 5.6% |
| $50,000 to $74,999 | 1,178 | 14.4% |
| $75,000 to $99,999 | 1,358 | 16.6% |
| $100,000 to $149,999 | 2,102 | 25.7% |
| $150,000 to $199,999 | 1,071 | 13.1% |
| $200,000+ | 1,456 | 17.8% |
Family Income by Famaliy Size in Bluffton
5-person families (568 | 7.0%) account for the highest median family income in Bluffton with $120,791 per family, while 2-person families (4,548 | 55.6%) have the highest median income of $53,584 per family member.
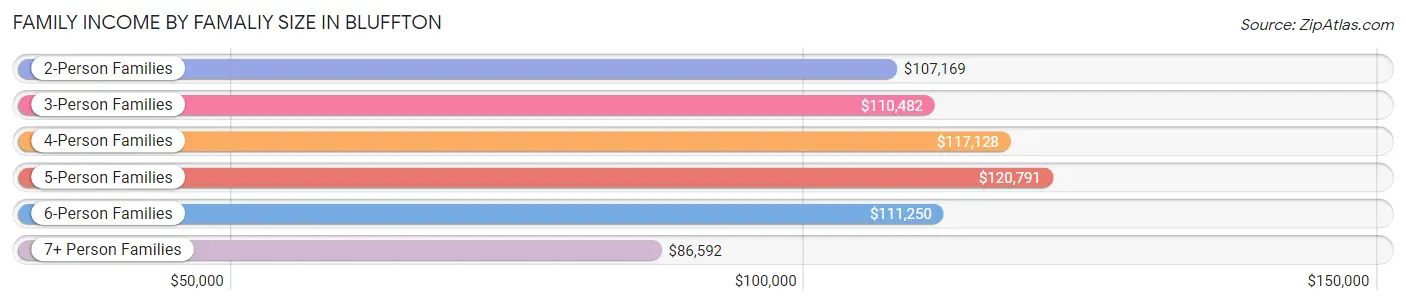
| Income Bracket | # Families | Median Income |
| 2-Person Families | 4,548 (55.6%) | $107,169 |
| 3-Person Families | 1,272 (15.5%) | $110,482 |
| 4-Person Families | 1,533 (18.8%) | $117,128 |
| 5-Person Families | 568 (7.0%) | $120,791 |
| 6-Person Families | 164 (2.0%) | $111,250 |
| 7+ Person Families | 93 (1.1%) | $86,592 |
| Total | 8,178 (100.0%) | $110,724 |
Family Income by Number of Earners in Bluffton
The median family income in Bluffton is $110,724, with families comprising 2 earners (3,334) having the highest median family income of $132,877, while families with 1 earner (2,633) have the lowest median family income of $86,073, accounting for 40.8% and 32.2% of families, respectively.
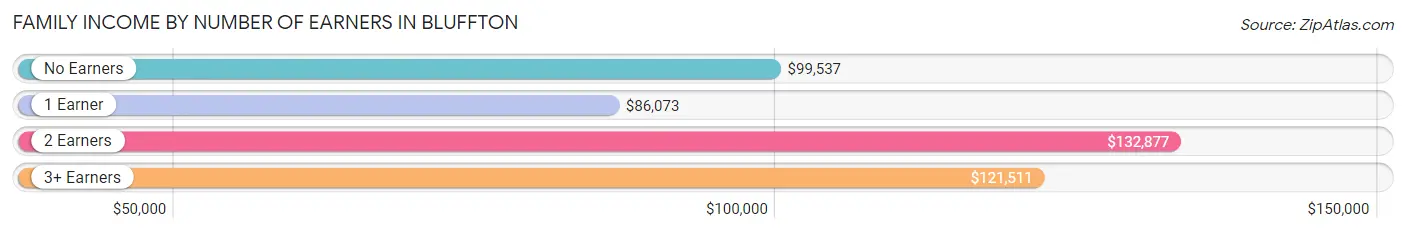
| Number of Earners | # Families | Median Income |
| No Earners | 1,533 (18.8%) | $99,537 |
| 1 Earner | 2,633 (32.2%) | $86,073 |
| 2 Earners | 3,334 (40.8%) | $132,877 |
| 3+ Earners | 678 (8.3%) | $121,511 |
| Total | 8,178 (100.0%) | $110,724 |
Household Income in Bluffton
Household Income Brackets in Bluffton
With 2,447 households falling in the category, the $100,000 to $149,999 income range is the most frequent in Bluffton, accounting for 22.9% of all households. In contrast, only 118 households (1.1%) fall into the $10,000 to $14,999 income bracket, making it the least populous group.
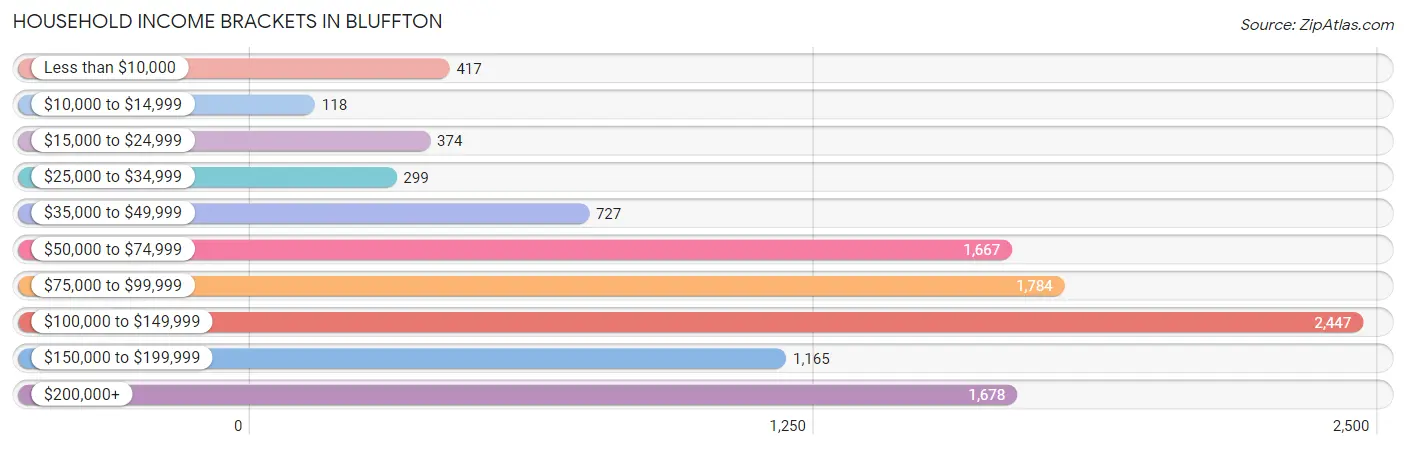
| Income Bracket | # Households | % Households |
| Less than $10,000 | 417 | 3.9% |
| $10,000 to $14,999 | 118 | 1.1% |
| $15,000 to $24,999 | 374 | 3.5% |
| $25,000 to $34,999 | 299 | 2.8% |
| $35,000 to $49,999 | 727 | 6.8% |
| $50,000 to $74,999 | 1,667 | 15.6% |
| $75,000 to $99,999 | 1,784 | 16.7% |
| $100,000 to $149,999 | 2,447 | 22.9% |
| $150,000 to $199,999 | 1,165 | 10.9% |
| $200,000+ | 1,678 | 15.7% |
Household Income by Householder Age in Bluffton
The median household income in Bluffton is $99,575, with the highest median household income of $107,170 found in the 25 to 44 years age bracket for the primary householder. A total of 3,774 households (35.3%) fall into this category. Meanwhile, the 15 to 24 years age bracket for the primary householder has the lowest median household income of $0, with 180 households (1.7%) in this group.
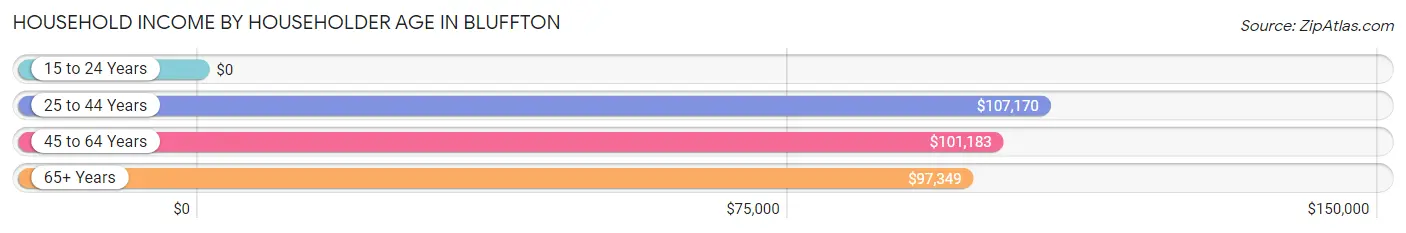
| Income Bracket | # Households | Median Income |
| 15 to 24 Years | 180 (1.7%) | $0 |
| 25 to 44 Years | 3,774 (35.3%) | $107,170 |
| 45 to 64 Years | 3,515 (32.9%) | $101,183 |
| 65+ Years | 3,216 (30.1%) | $97,349 |
| Total | 10,685 (100.0%) | $99,575 |
Poverty in Bluffton
Income Below Poverty by Sex and Age in Bluffton
With 3.3% poverty level for males and 7.5% for females among the residents of Bluffton, 6 to 11 year old males and 18 to 24 year old females are the most vulnerable to poverty, with 116 males (9.4%) and 113 females (15.5%) in their respective age groups living below the poverty level.
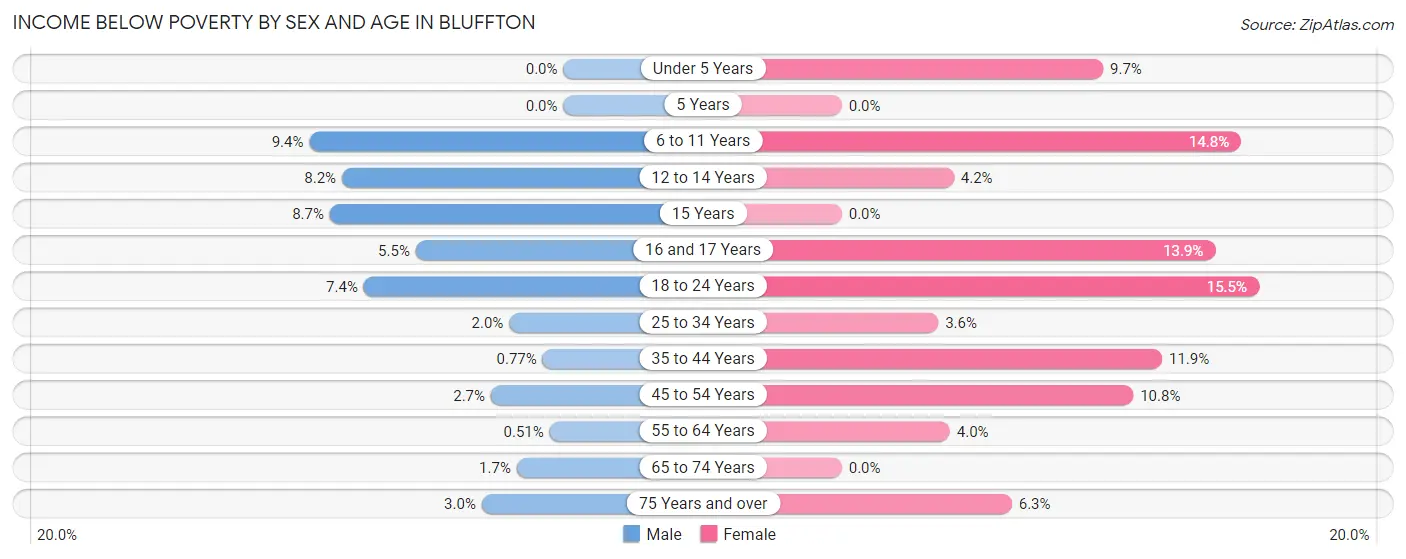
| Age Bracket | Male | Female |
| Under 5 Years | 0 (0.0%) | 52 (9.7%) |
| 5 Years | 0 (0.0%) | 0 (0.0%) |
| 6 to 11 Years | 116 (9.4%) | 170 (14.8%) |
| 12 to 14 Years | 64 (8.2%) | 43 (4.2%) |
| 15 Years | 15 (8.7%) | 0 (0.0%) |
| 16 and 17 Years | 35 (5.5%) | 70 (13.9%) |
| 18 to 24 Years | 80 (7.4%) | 113 (15.5%) |
| 25 to 34 Years | 30 (2.0%) | 51 (3.6%) |
| 35 to 44 Years | 16 (0.8%) | 297 (11.9%) |
| 45 to 54 Years | 42 (2.7%) | 179 (10.8%) |
| 55 to 64 Years | 6 (0.5%) | 79 (4.0%) |
| 65 to 74 Years | 34 (1.7%) | 0 (0.0%) |
| 75 Years and over | 35 (3.0%) | 55 (6.3%) |
| Total | 473 (3.3%) | 1,109 (7.5%) |
Income Above Poverty by Sex and Age in Bluffton
According to the poverty statistics in Bluffton, males aged under 5 years and females aged 5 years are the age groups that are most secure financially, with 100.0% of males and 100.0% of females in these age groups living above the poverty line.
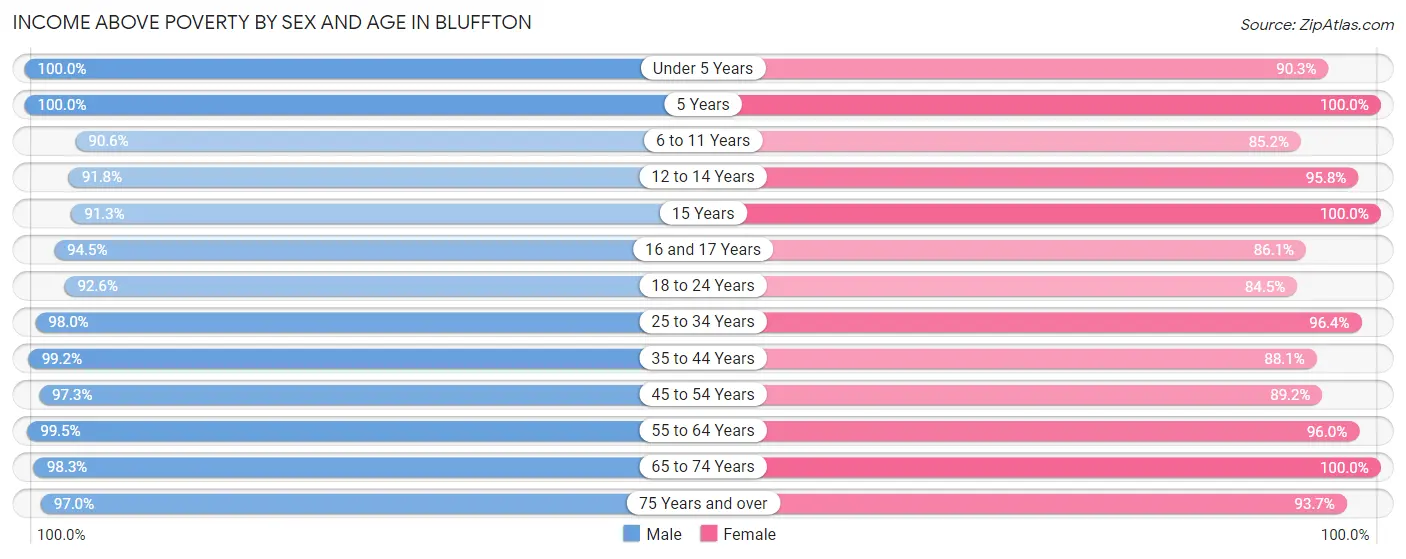
| Age Bracket | Male | Female |
| Under 5 Years | 718 (100.0%) | 484 (90.3%) |
| 5 Years | 159 (100.0%) | 107 (100.0%) |
| 6 to 11 Years | 1,114 (90.6%) | 977 (85.2%) |
| 12 to 14 Years | 715 (91.8%) | 990 (95.8%) |
| 15 Years | 158 (91.3%) | 313 (100.0%) |
| 16 and 17 Years | 604 (94.5%) | 435 (86.1%) |
| 18 to 24 Years | 1,000 (92.6%) | 617 (84.5%) |
| 25 to 34 Years | 1,465 (98.0%) | 1,372 (96.4%) |
| 35 to 44 Years | 2,070 (99.2%) | 2,200 (88.1%) |
| 45 to 54 Years | 1,518 (97.3%) | 1,476 (89.2%) |
| 55 to 64 Years | 1,182 (99.5%) | 1,892 (96.0%) |
| 65 to 74 Years | 1,933 (98.3%) | 1,951 (100.0%) |
| 75 Years and over | 1,122 (97.0%) | 817 (93.7%) |
| Total | 13,758 (96.7%) | 13,631 (92.5%) |
Income Below Poverty Among Married-Couple Families in Bluffton
The poverty statistics for married-couple families in Bluffton show that 1.3% or 91 of the total 7,041 families live below the poverty line. Families with 3 or 4 children have the highest poverty rate of 4.9%, comprising of 19 families. On the other hand, families with 5 or more children have the lowest poverty rate of 0.0%, which includes 0 families.
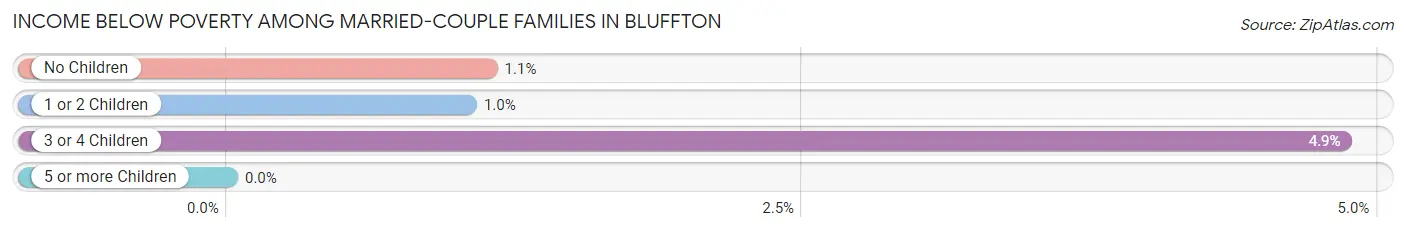
| Children | Above Poverty | Below Poverty |
| No Children | 4,190 (98.9%) | 48 (1.1%) |
| 1 or 2 Children | 2,294 (99.0%) | 24 (1.0%) |
| 3 or 4 Children | 373 (95.2%) | 19 (4.9%) |
| 5 or more Children | 93 (100.0%) | 0 (0.0%) |
| Total | 6,950 (98.7%) | 91 (1.3%) |
Income Below Poverty Among Single-Parent Households in Bluffton
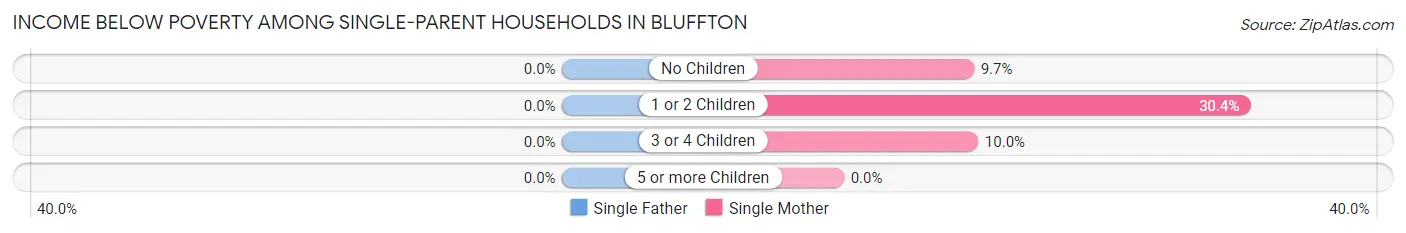
| Children | Single Father | Single Mother |
| No Children | 0 (0.0%) | 37 (9.7%) |
| 1 or 2 Children | 0 (0.0%) | 160 (30.4%) |
| 3 or 4 Children | 0 (0.0%) | 11 (10.0%) |
| 5 or more Children | 0 (0.0%) | 0 (0.0%) |
| Total | 0 (0.0%) | 208 (20.4%) |
Income Below Poverty Among Married-Couple vs Single-Parent Households in Bluffton
The poverty data for Bluffton shows that 91 of the married-couple family households (1.3%) and 208 of the single-parent households (18.3%) are living below the poverty level. Within the married-couple family households, those with 3 or 4 children have the highest poverty rate, with 19 households (4.9%) falling below the poverty line. Among the single-parent households, those with 1 or 2 children have the highest poverty rate, with 160 household (25.9%) living below poverty.
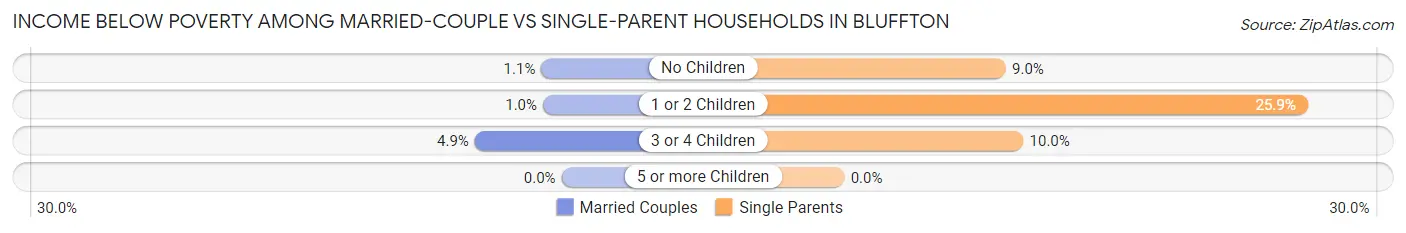
| Children | Married-Couple Families | Single-Parent Households |
| No Children | 48 (1.1%) | 37 (9.0%) |
| 1 or 2 Children | 24 (1.0%) | 160 (25.9%) |
| 3 or 4 Children | 19 (4.9%) | 11 (10.0%) |
| 5 or more Children | 0 (0.0%) | 0 (0.0%) |
| Total | 91 (1.3%) | 208 (18.3%) |
Race in Bluffton
The most populous races in Bluffton are White / Caucasian (22,656 | 77.1%), Hispanic or Latino (3,836 | 13.1%), and Black / African American (2,535 | 8.6%).
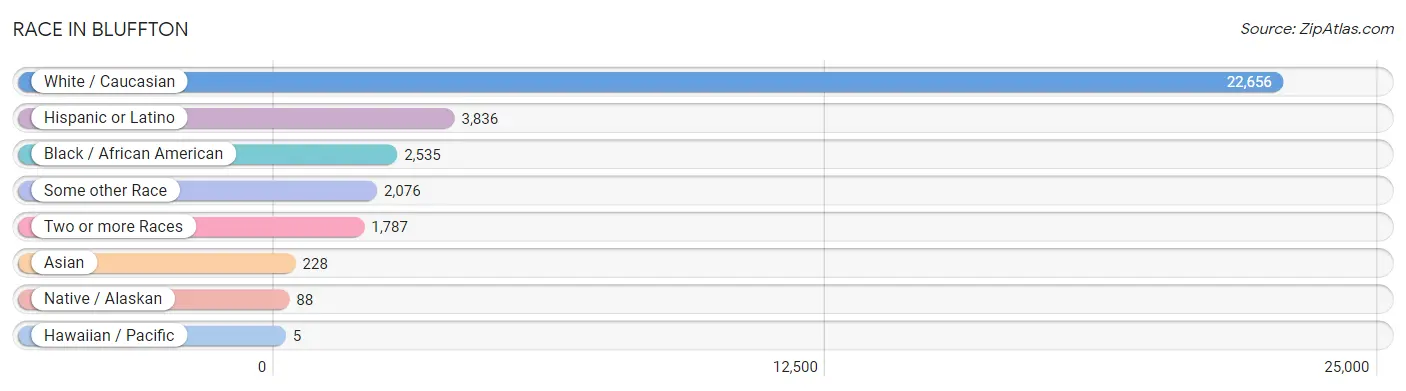
| Race | # Population | % Population |
| Asian | 228 | 0.8% |
| Black / African American | 2,535 | 8.6% |
| Hawaiian / Pacific | 5 | 0.0% |
| Hispanic or Latino | 3,836 | 13.1% |
| Native / Alaskan | 88 | 0.3% |
| White / Caucasian | 22,656 | 77.1% |
| Two or more Races | 1,787 | 6.1% |
| Some other Race | 2,076 | 7.1% |
| Total | 29,375 | 100.0% |
Ancestry in Bluffton
The most populous ancestries reported in Bluffton are Irish (4,519 | 15.4%), German (3,844 | 13.1%), English (3,408 | 11.6%), American (2,316 | 7.9%), and Italian (2,254 | 7.7%), together accounting for 55.6% of all Bluffton residents.
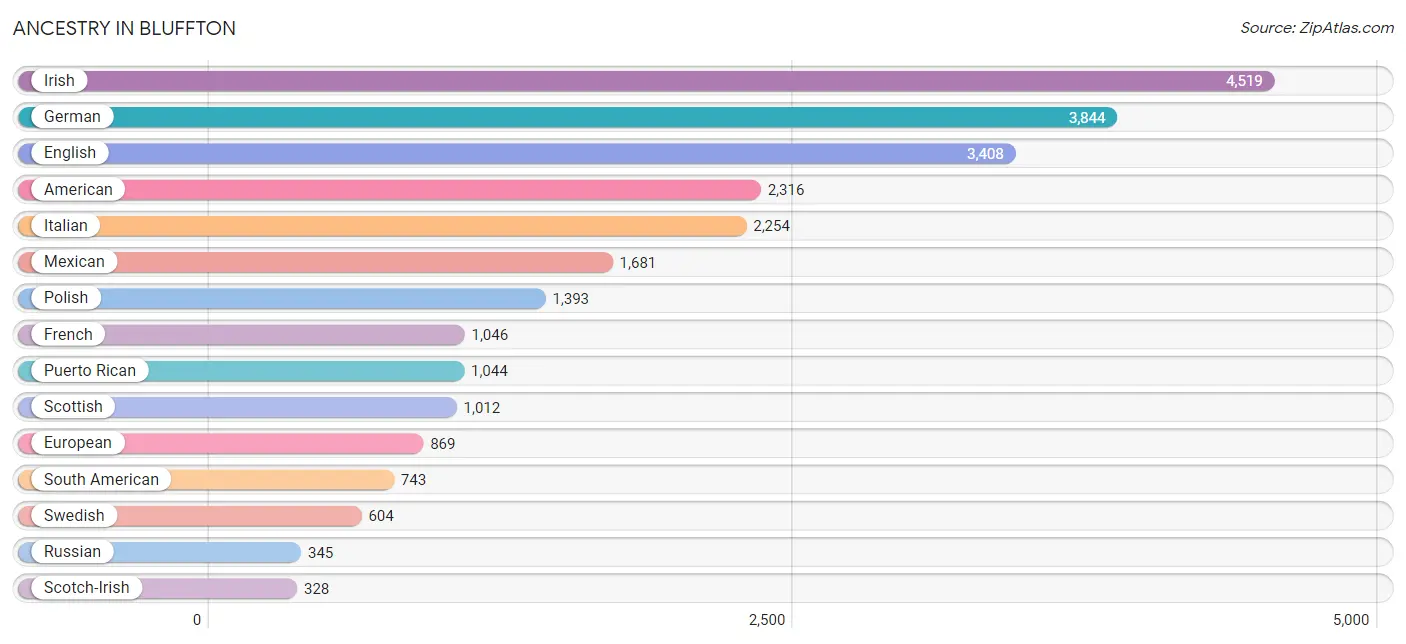
| Ancestry | # Population | % Population |
| American | 2,316 | 7.9% |
| Arab | 111 | 0.4% |
| Argentinean | 197 | 0.7% |
| Austrian | 44 | 0.2% |
| Belgian | 16 | 0.1% |
| Bhutanese | 73 | 0.3% |
| Bolivian | 21 | 0.1% |
| British | 220 | 0.7% |
| Burmese | 52 | 0.2% |
| Canadian | 39 | 0.1% |
| Central American | 248 | 0.8% |
| Cherokee | 22 | 0.1% |
| Chilean | 33 | 0.1% |
| Choctaw | 11 | 0.0% |
| Colombian | 189 | 0.6% |
| Costa Rican | 70 | 0.2% |
| Croatian | 49 | 0.2% |
| Crow | 12 | 0.0% |
| Cuban | 5 | 0.0% |
| Czech | 94 | 0.3% |
| Czechoslovakian | 49 | 0.2% |
| Danish | 83 | 0.3% |
| Dominican | 9 | 0.0% |
| Dutch | 175 | 0.6% |
| Eastern European | 81 | 0.3% |
| English | 3,408 | 11.6% |
| Ethiopian | 64 | 0.2% |
| European | 869 | 3.0% |
| Finnish | 136 | 0.5% |
| French | 1,046 | 3.6% |
| French Canadian | 253 | 0.9% |
| German | 3,844 | 13.1% |
| Greek | 66 | 0.2% |
| Guatemalan | 28 | 0.1% |
| Guyanese | 134 | 0.5% |
| Haitian | 26 | 0.1% |
| Honduran | 109 | 0.4% |
| Hungarian | 181 | 0.6% |
| Indian (Asian) | 104 | 0.4% |
| Iranian | 35 | 0.1% |
| Irish | 4,519 | 15.4% |
| Iroquois | 47 | 0.2% |
| Italian | 2,254 | 7.7% |
| Korean | 209 | 0.7% |
| Laotian | 32 | 0.1% |
| Lebanese | 62 | 0.2% |
| Lithuanian | 73 | 0.3% |
| Macedonian | 22 | 0.1% |
| Mexican | 1,681 | 5.7% |
| Native Hawaiian | 5 | 0.0% |
| Northern European | 75 | 0.3% |
| Norwegian | 305 | 1.0% |
| Pennsylvania German | 12 | 0.0% |
| Peruvian | 28 | 0.1% |
| Polish | 1,393 | 4.7% |
| Portuguese | 123 | 0.4% |
| Puerto Rican | 1,044 | 3.5% |
| Romanian | 20 | 0.1% |
| Russian | 345 | 1.2% |
| Salvadoran | 32 | 0.1% |
| Scandinavian | 48 | 0.2% |
| Scotch-Irish | 328 | 1.1% |
| Scottish | 1,012 | 3.5% |
| Serbian | 32 | 0.1% |
| Slavic | 18 | 0.1% |
| Slovak | 201 | 0.7% |
| Slovene | 20 | 0.1% |
| South African | 43 | 0.2% |
| South American | 743 | 2.5% |
| Spaniard | 53 | 0.2% |
| Spanish | 10 | 0.0% |
| Subsaharan African | 107 | 0.4% |
| Swedish | 604 | 2.1% |
| Swiss | 101 | 0.3% |
| Syrian | 49 | 0.2% |
| Trinidadian and Tobagonian | 1 | 0.0% |
| Turkish | 38 | 0.1% |
| Ukrainian | 213 | 0.7% |
| Venezuelan | 16 | 0.1% |
| Welsh | 175 | 0.6% |
| Yugoslavian | 12 | 0.0% | View All 81 Rows |
Immigrants in Bluffton
The most numerous immigrant groups reported in Bluffton came from Latin America (1,244 | 4.2%), Central America (792 | 2.7%), Mexico (682 | 2.3%), South America (411 | 1.4%), and Europe (176 | 0.6%), together accounting for 11.3% of all Bluffton residents.
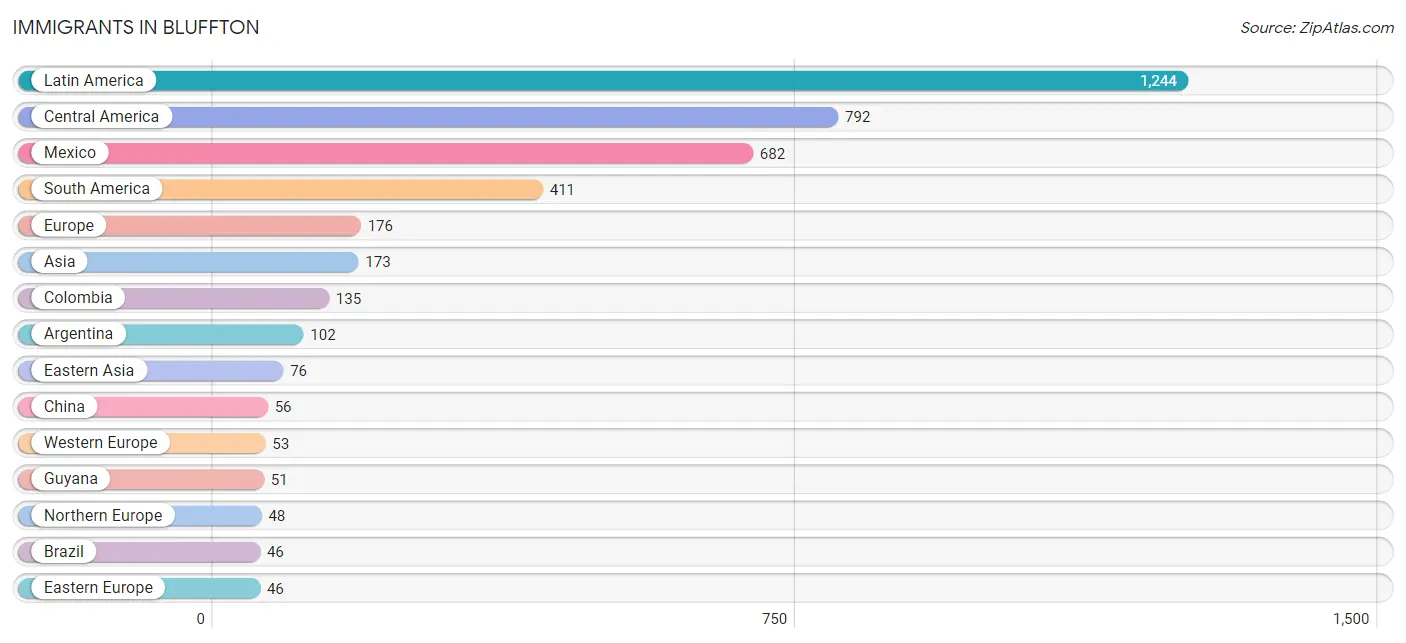
| Immigration Origin | # Population | % Population |
| Africa | 41 | 0.1% |
| Argentina | 102 | 0.4% |
| Asia | 173 | 0.6% |
| Belize | 9 | 0.0% |
| Bolivia | 11 | 0.0% |
| Brazil | 46 | 0.2% |
| Canada | 41 | 0.1% |
| Caribbean | 41 | 0.1% |
| Central America | 792 | 2.7% |
| Chile | 33 | 0.1% |
| China | 56 | 0.2% |
| Colombia | 135 | 0.5% |
| Costa Rica | 41 | 0.1% |
| Cuba | 5 | 0.0% |
| Dominican Republic | 9 | 0.0% |
| Eastern Africa | 27 | 0.1% |
| Eastern Asia | 76 | 0.3% |
| Eastern Europe | 46 | 0.2% |
| El Salvador | 14 | 0.1% |
| England | 12 | 0.0% |
| Ethiopia | 27 | 0.1% |
| Europe | 176 | 0.6% |
| Germany | 18 | 0.1% |
| Guyana | 51 | 0.2% |
| Haiti | 26 | 0.1% |
| Honduras | 46 | 0.2% |
| Hong Kong | 23 | 0.1% |
| Ireland | 4 | 0.0% |
| Japan | 3 | 0.0% |
| Korea | 17 | 0.1% |
| Latin America | 1,244 | 4.2% |
| Mexico | 682 | 2.3% |
| Netherlands | 31 | 0.1% |
| Northern Europe | 48 | 0.2% |
| Pakistan | 32 | 0.1% |
| Peru | 4 | 0.0% |
| Philippines | 27 | 0.1% |
| Poland | 46 | 0.2% |
| Portugal | 17 | 0.1% |
| South Africa | 14 | 0.1% |
| South America | 411 | 1.4% |
| South Central Asia | 32 | 0.1% |
| South Eastern Asia | 27 | 0.1% |
| Southern Europe | 29 | 0.1% |
| Spain | 12 | 0.0% |
| Switzerland | 4 | 0.0% |
| Trinidad and Tobago | 1 | 0.0% |
| Turkey | 38 | 0.1% |
| Western Asia | 38 | 0.1% |
| Western Europe | 53 | 0.2% | View All 50 Rows |
Sex and Age in Bluffton
Sex and Age in Bluffton
The most populous age groups in Bluffton are 10 to 14 Years (1,352 | 9.3%) for men and 10 to 14 Years (1,468 | 9.9%) for women.
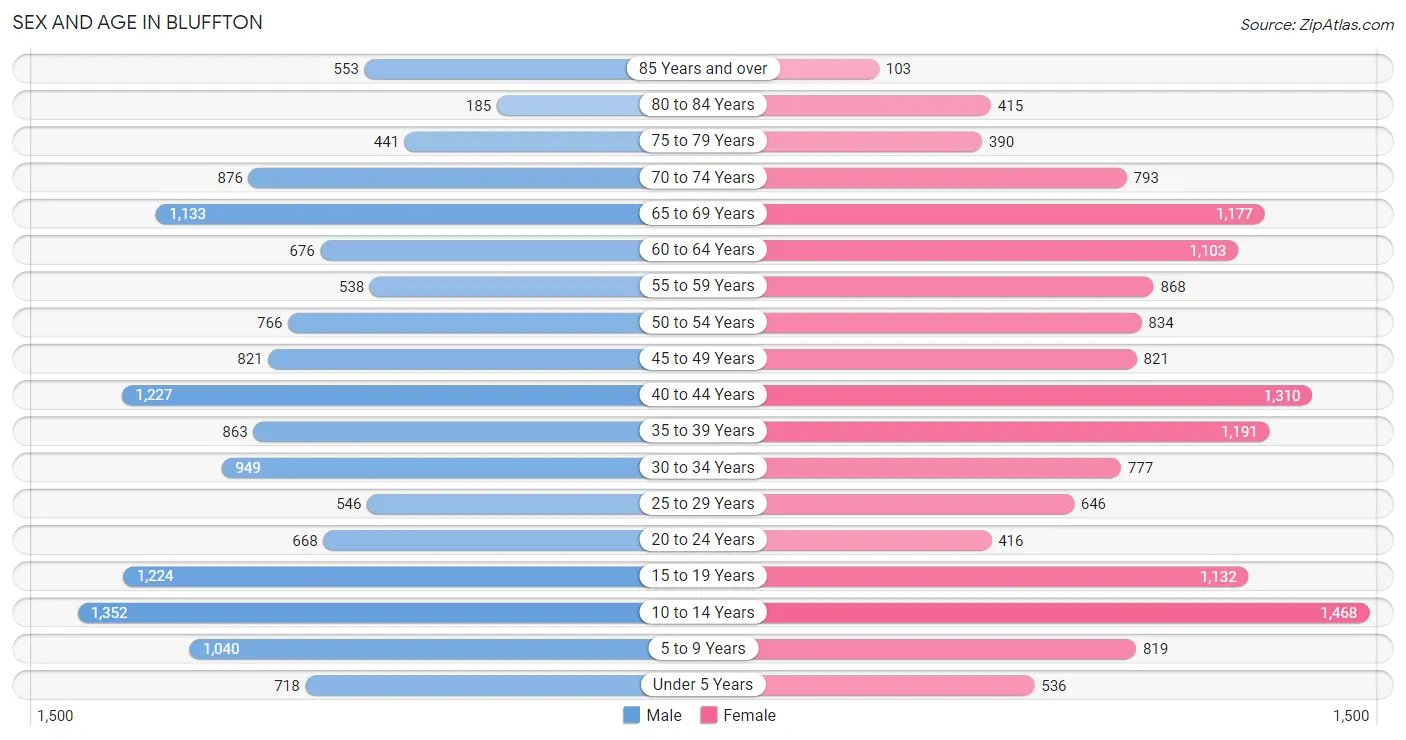
| Age Bracket | Male | Female |
| Under 5 Years | 718 (4.9%) | 536 (3.6%) |
| 5 to 9 Years | 1,040 (7.1%) | 819 (5.5%) |
| 10 to 14 Years | 1,352 (9.3%) | 1,468 (9.9%) |
| 15 to 19 Years | 1,224 (8.4%) | 1,132 (7.6%) |
| 20 to 24 Years | 668 (4.6%) | 416 (2.8%) |
| 25 to 29 Years | 546 (3.7%) | 646 (4.4%) |
| 30 to 34 Years | 949 (6.5%) | 777 (5.2%) |
| 35 to 39 Years | 863 (5.9%) | 1,191 (8.1%) |
| 40 to 44 Years | 1,227 (8.4%) | 1,310 (8.8%) |
| 45 to 49 Years | 821 (5.6%) | 821 (5.6%) |
| 50 to 54 Years | 766 (5.3%) | 834 (5.6%) |
| 55 to 59 Years | 538 (3.7%) | 868 (5.9%) |
| 60 to 64 Years | 676 (4.6%) | 1,103 (7.4%) |
| 65 to 69 Years | 1,133 (7.8%) | 1,177 (8.0%) |
| 70 to 74 Years | 876 (6.0%) | 793 (5.4%) |
| 75 to 79 Years | 441 (3.0%) | 390 (2.6%) |
| 80 to 84 Years | 185 (1.3%) | 415 (2.8%) |
| 85 Years and over | 553 (3.8%) | 103 (0.7%) |
| Total | 14,576 (100.0%) | 14,799 (100.0%) |
Families and Households in Bluffton
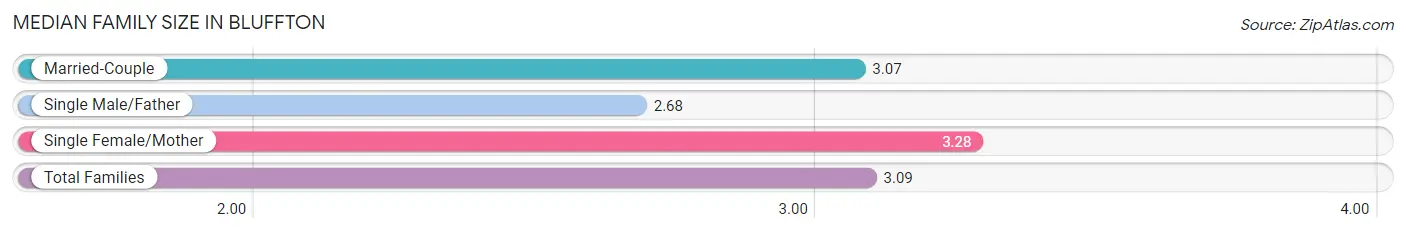
Median Family Size in Bluffton
The median family size in Bluffton is 3.09 persons per family, with single female/mother families (1,019 | 12.5%) accounting for the largest median family size of 3.28 persons per family. On the other hand, single male/father families (118 | 1.4%) represent the smallest median family size with 2.68 persons per family.
| Family Type | # Families | Family Size |
| Married-Couple | 7,041 (86.1%) | 3.07 |
| Single Male/Father | 118 (1.4%) | 2.68 |
| Single Female/Mother | 1,019 (12.5%) | 3.28 |
| Total Families | 8,178 (100.0%) | 3.09 |
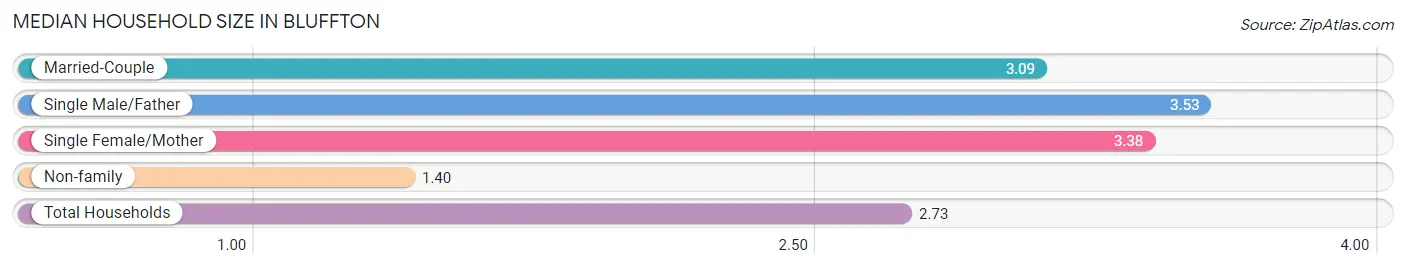
Median Household Size in Bluffton
The median household size in Bluffton is 2.73 persons per household, with single male/father households (118 | 1.1%) accounting for the largest median household size of 3.53 persons per household. non-family households (2,507 | 23.5%) represent the smallest median household size with 1.40 persons per household.
| Household Type | # Households | Household Size |
| Married-Couple | 7,041 (65.9%) | 3.09 |
| Single Male/Father | 118 (1.1%) | 3.53 |
| Single Female/Mother | 1,019 (9.5%) | 3.38 |
| Non-family | 2,507 (23.5%) | 1.40 |
| Total Households | 10,685 (100.0%) | 2.73 |
Household Size by Marriage Status in Bluffton
Out of a total of 10,685 households in Bluffton, 8,178 (76.5%) are family households, while 2,507 (23.5%) are nonfamily households. The most numerous type of family households are 2-person households, comprising 4,364, and the most common type of nonfamily households are 1-person households, comprising 1,954.
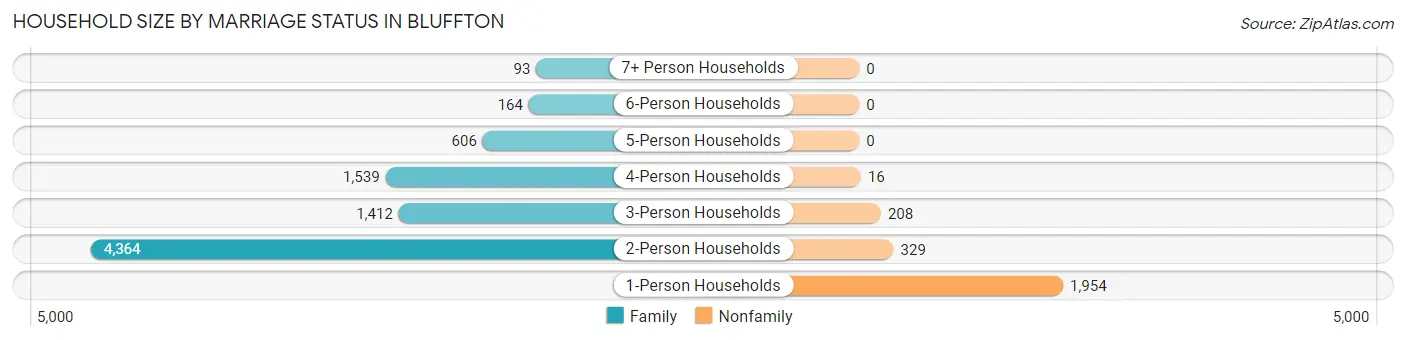
| Household Size | Family Households | Nonfamily Households |
| 1-Person Households | - | 1,954 (18.3%) |
| 2-Person Households | 4,364 (40.8%) | 329 (3.1%) |
| 3-Person Households | 1,412 (13.2%) | 208 (1.9%) |
| 4-Person Households | 1,539 (14.4%) | 16 (0.2%) |
| 5-Person Households | 606 (5.7%) | 0 (0.0%) |
| 6-Person Households | 164 (1.5%) | 0 (0.0%) |
| 7+ Person Households | 93 (0.9%) | 0 (0.0%) |
| Total | 8,178 (76.5%) | 2,507 (23.5%) |
Female Fertility in Bluffton
Fertility by Age in Bluffton
Average fertility rate in Bluffton is 54.0 births per 1,000 women. Women in the age bracket of 20 to 34 years have the highest fertility rate with 120.0 births per 1,000 women. Women in the age bracket of 20 to 34 years acount for 62.8% of all women with births.
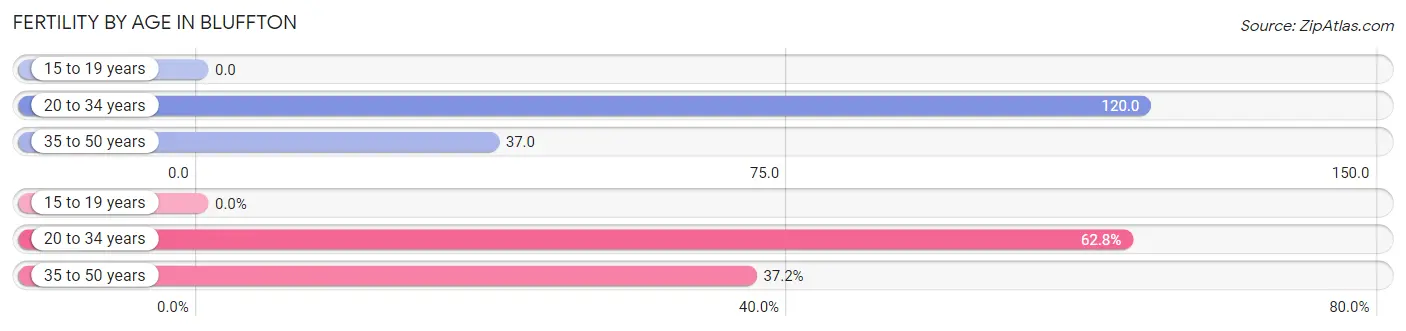
| Age Bracket | Women with Births | Births / 1,000 Women |
| 15 to 19 years | 0 (0.0%) | 0.0 |
| 20 to 34 years | 221 (62.8%) | 120.0 |
| 35 to 50 years | 131 (37.2%) | 37.0 |
| Total | 352 (100.0%) | 54.0 |
Fertility by Age by Marriage Status in Bluffton
86.9% of women with births (352) in Bluffton are married. The highest percentage of unmarried women with births falls into 20 to 34 years age bracket with 20.8% of them unmarried at the time of birth, while the lowest percentage of unmarried women with births belong to 35 to 50 years age bracket with 0.0% of them unmarried.
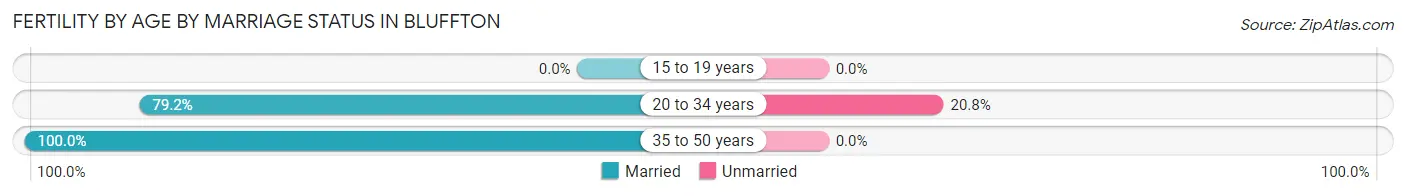
| Age Bracket | Married | Unmarried |
| 15 to 19 years | 0 (0.0%) | 0 (0.0%) |
| 20 to 34 years | 175 (79.2%) | 46 (20.8%) |
| 35 to 50 years | 131 (100.0%) | 0 (0.0%) |
| Total | 306 (86.9%) | 46 (13.1%) |
Fertility by Education in Bluffton
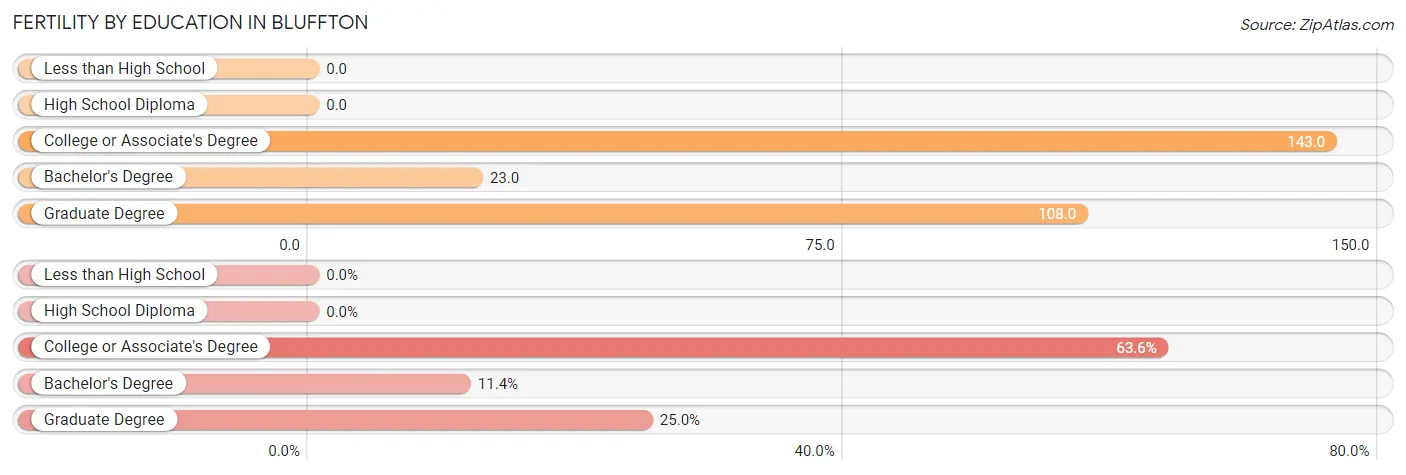
| Educational Attainment | Women with Births | Births / 1,000 Women |
| Less than High School | 0 (0.0%) | 0.0 |
| High School Diploma | 0 (0.0%) | 0.0 |
| College or Associate's Degree | 224 (63.6%) | 143.0 |
| Bachelor's Degree | 40 (11.4%) | 23.0 |
| Graduate Degree | 88 (25.0%) | 108.0 |
| Total | 352 (100.0%) | 54.0 |
Fertility by Education by Marriage Status in Bluffton
13.1% of women with births in Bluffton are unmarried. Women with the educational attainment of bachelor's degree are most likely to be married with 100.0% of them married at childbirth, while women with the educational attainment of college or associate's degree are least likely to be married with 20.5% of them unmarried at childbirth.
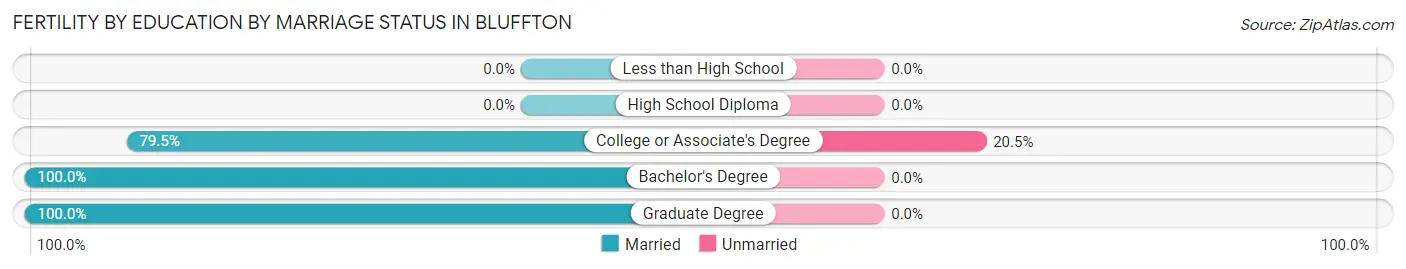
| Educational Attainment | Married | Unmarried |
| Less than High School | 0 (0.0%) | 0 (0.0%) |
| High School Diploma | 0 (0.0%) | 0 (0.0%) |
| College or Associate's Degree | 178 (79.5%) | 46 (20.5%) |
| Bachelor's Degree | 40 (100.0%) | 0 (0.0%) |
| Graduate Degree | 88 (100.0%) | 0 (0.0%) |
| Total | 306 (86.9%) | 46 (13.1%) |
Employment Characteristics in Bluffton
Employment by Class of Employer in Bluffton
Among the 13,877 employed individuals in Bluffton, private company employees (9,188 | 66.2%), self-employed (not incorporated) (1,280 | 9.2%), and not-for-profit organizations (990 | 7.1%) make up the most common classes of employment.
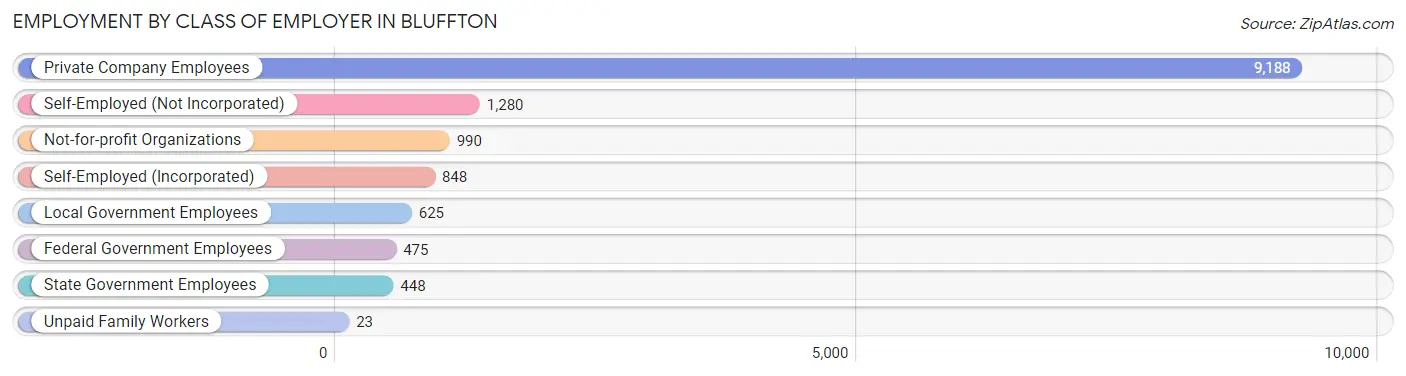
| Employer Class | # Employees | % Employees |
| Private Company Employees | 9,188 | 66.2% |
| Self-Employed (Incorporated) | 848 | 6.1% |
| Self-Employed (Not Incorporated) | 1,280 | 9.2% |
| Not-for-profit Organizations | 990 | 7.1% |
| Local Government Employees | 625 | 4.5% |
| State Government Employees | 448 | 3.2% |
| Federal Government Employees | 475 | 3.4% |
| Unpaid Family Workers | 23 | 0.2% |
| Total | 13,877 | 100.0% |
Employment Status by Age in Bluffton
According to the labor force statistics for Bluffton, out of the total population over 16 years of age (22,956), 61.7% or 14,164 individuals are in the labor force, with 1.4% or 198 of them unemployed. The age group with the highest labor force participation rate is 25 to 29 years, with 90.7% or 1,081 individuals in the labor force. Within the labor force, the 75 years and over age range has the highest percentage of unemployed individuals, with 8.0% or 36 of them being unemployed.
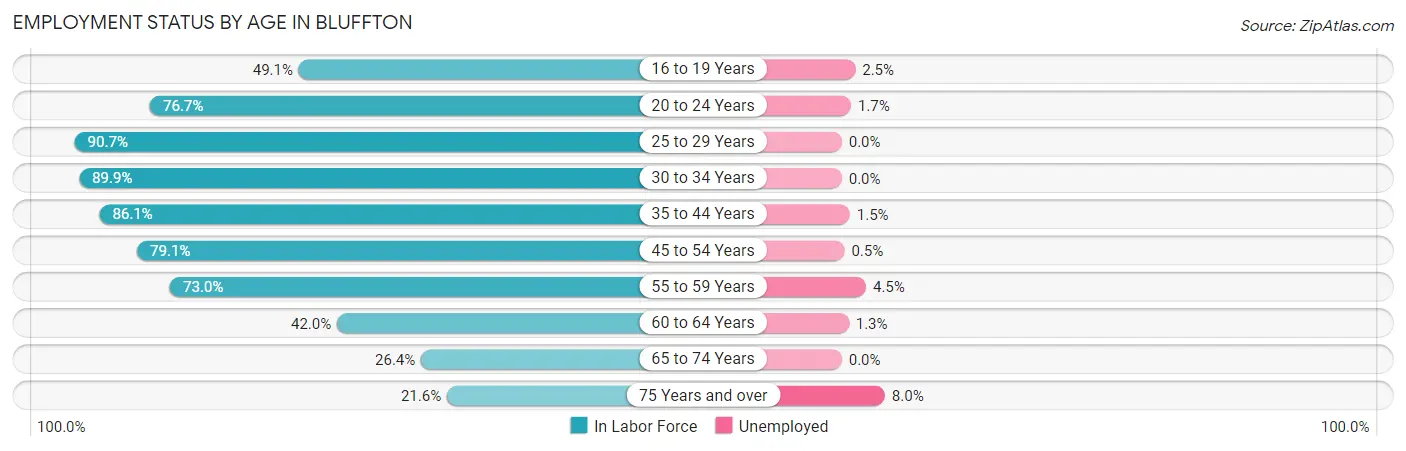
| Age Bracket | In Labor Force | Unemployed |
| 16 to 19 Years | 918 (49.1%) | 23 (2.5%) |
| 20 to 24 Years | 831 (76.7%) | 14 (1.7%) |
| 25 to 29 Years | 1,081 (90.7%) | 0 (0.0%) |
| 30 to 34 Years | 1,552 (89.9%) | 0 (0.0%) |
| 35 to 44 Years | 3,953 (86.1%) | 59 (1.5%) |
| 45 to 54 Years | 2,564 (79.1%) | 13 (0.5%) |
| 55 to 59 Years | 1,026 (73.0%) | 46 (4.5%) |
| 60 to 64 Years | 747 (42.0%) | 10 (1.3%) |
| 65 to 74 Years | 1,050 (26.4%) | 0 (0.0%) |
| 75 Years and over | 451 (21.6%) | 36 (8.0%) |
| Total | 14,164 (61.7%) | 198 (1.4%) |
Employment Status by Educational Attainment in Bluffton
According to labor force statistics for Bluffton, 78.4% of individuals (10,926) out of the total population between 25 and 64 years of age (13,936) are in the labor force, with 1.2% or 131 of them being unemployed. The group with the highest labor force participation rate are those with the educational attainment of bachelor's degree or higher, with 80.5% or 4,840 individuals in the labor force. Within the labor force, individuals with college / associate degree education have the highest percentage of unemployment, with 1.8% or 69 of them being unemployed.
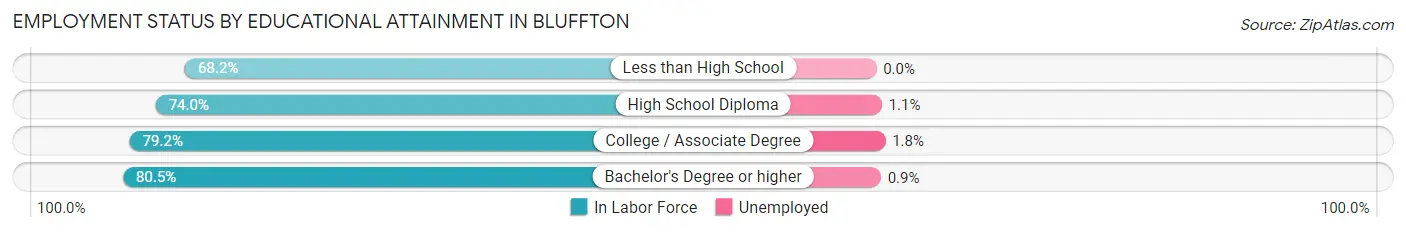
| Educational Attainment | In Labor Force | Unemployed |
| Less than High School | 364 (68.2%) | 0 (0.0%) |
| High School Diploma | 1,867 (74.0%) | 28 (1.1%) |
| College / Associate Degree | 3,855 (79.2%) | 88 (1.8%) |
| Bachelor's Degree or higher | 4,840 (80.5%) | 54 (0.9%) |
| Total | 10,926 (78.4%) | 167 (1.2%) |
Employment Occupations by Sex in Bluffton
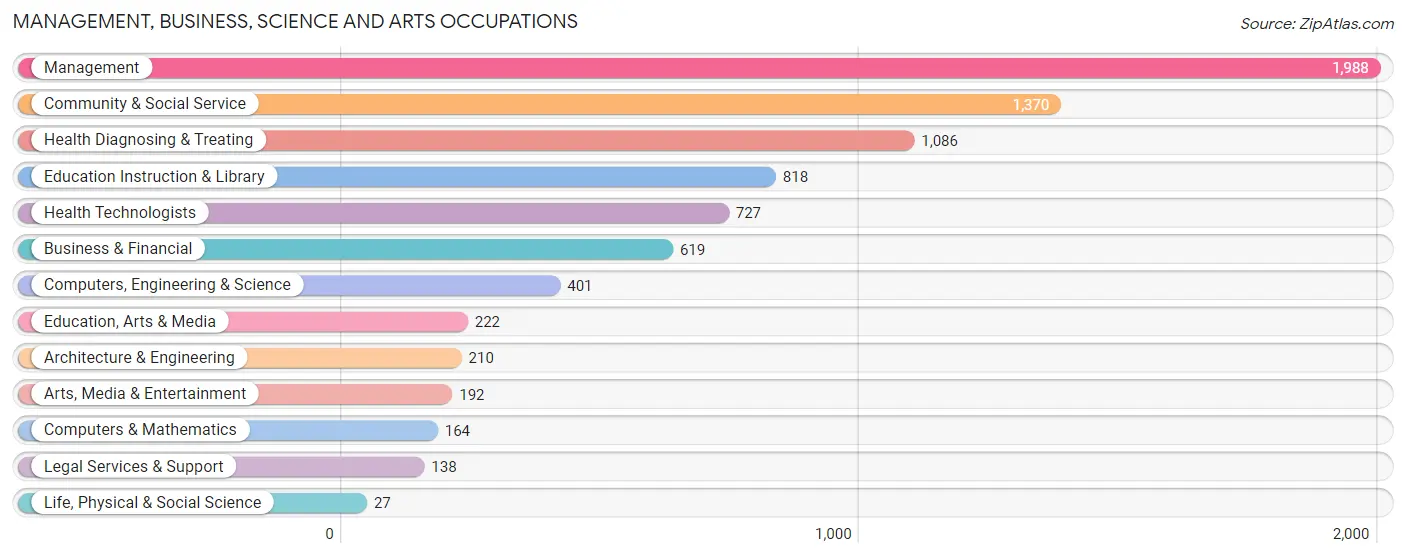
Management, Business, Science and Arts Occupations
The most common Management, Business, Science and Arts occupations in Bluffton are Management (1,988 | 14.4%), Community & Social Service (1,370 | 9.9%), Health Diagnosing & Treating (1,086 | 7.9%), Education Instruction & Library (818 | 5.9%), and Health Technologists (727 | 5.3%).
Management, Business, Science and Arts Occupations by Sex
Within the Management, Business, Science and Arts occupations in Bluffton, the most male-oriented occupations are Computers & Mathematics (94.5%), Legal Services & Support (94.2%), and Education, Arts & Media (89.2%), while the most female-oriented occupations are Education Instruction & Library (92.4%), Health Technologists (87.1%), and Health Diagnosing & Treating (71.2%).
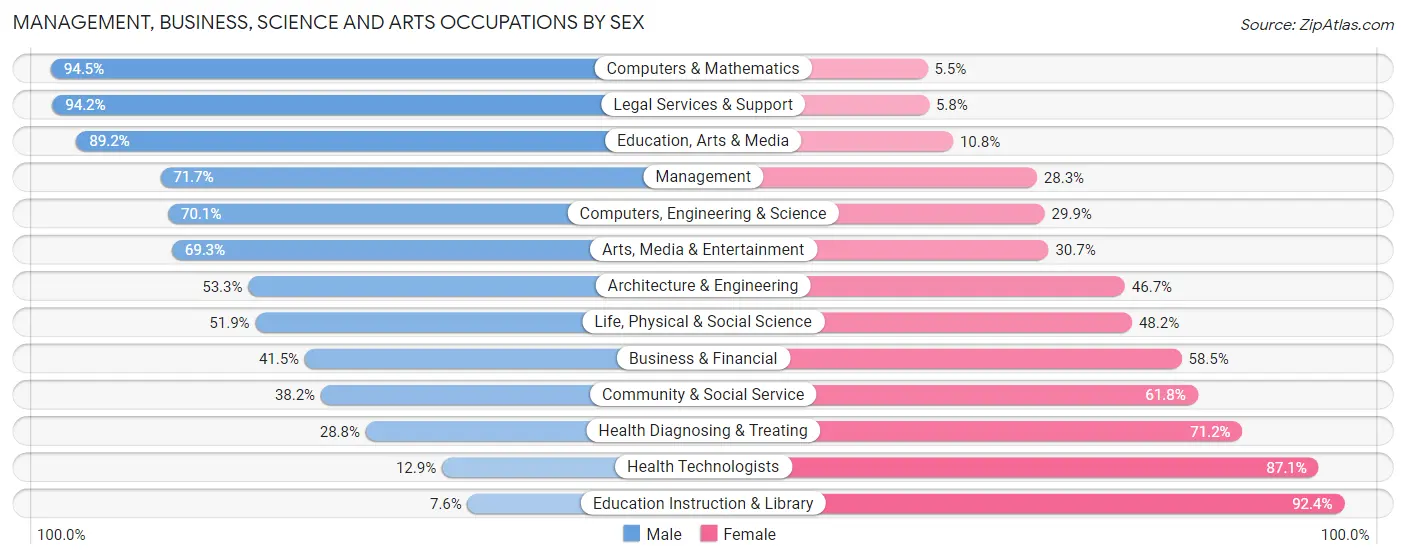
| Occupation | Male | Female |
| Management | 1,425 (71.7%) | 563 (28.3%) |
| Business & Financial | 257 (41.5%) | 362 (58.5%) |
| Computers, Engineering & Science | 281 (70.1%) | 120 (29.9%) |
| Computers & Mathematics | 155 (94.5%) | 9 (5.5%) |
| Architecture & Engineering | 112 (53.3%) | 98 (46.7%) |
| Life, Physical & Social Science | 14 (51.8%) | 13 (48.1%) |
| Community & Social Service | 523 (38.2%) | 847 (61.8%) |
| Education, Arts & Media | 198 (89.2%) | 24 (10.8%) |
| Legal Services & Support | 130 (94.2%) | 8 (5.8%) |
| Education Instruction & Library | 62 (7.6%) | 756 (92.4%) |
| Arts, Media & Entertainment | 133 (69.3%) | 59 (30.7%) |
| Health Diagnosing & Treating | 313 (28.8%) | 773 (71.2%) |
| Health Technologists | 94 (12.9%) | 633 (87.1%) |
| Total (Category) | 2,799 (51.2%) | 2,665 (48.8%) |
| Total (Overall) | 7,509 (54.3%) | 6,306 (45.7%) |
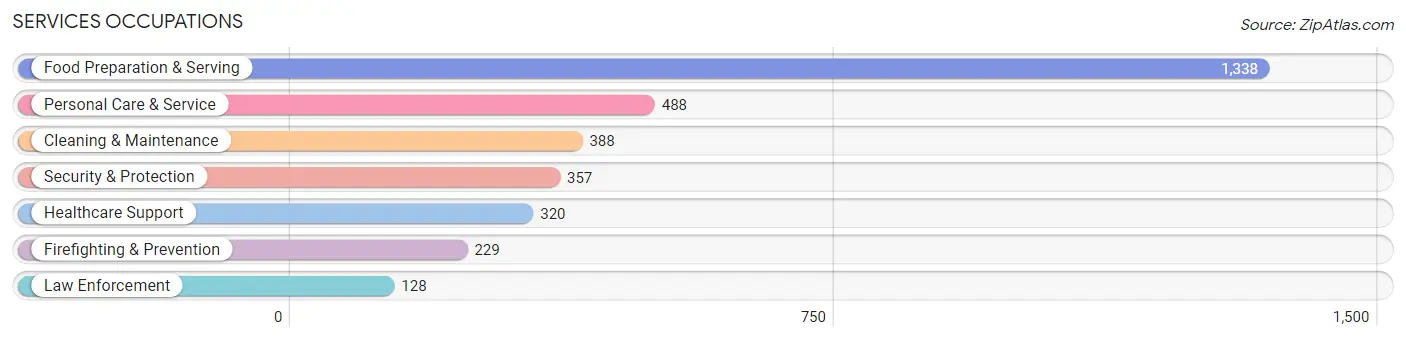
Services Occupations
The most common Services occupations in Bluffton are Food Preparation & Serving (1,338 | 9.7%), Personal Care & Service (488 | 3.5%), Cleaning & Maintenance (388 | 2.8%), Security & Protection (357 | 2.6%), and Healthcare Support (320 | 2.3%).
Services Occupations by Sex
Within the Services occupations in Bluffton, the most male-oriented occupations are Security & Protection (100.0%), Firefighting & Prevention (100.0%), and Law Enforcement (100.0%), while the most female-oriented occupations are Healthcare Support (100.0%), Personal Care & Service (61.7%), and Food Preparation & Serving (42.7%).
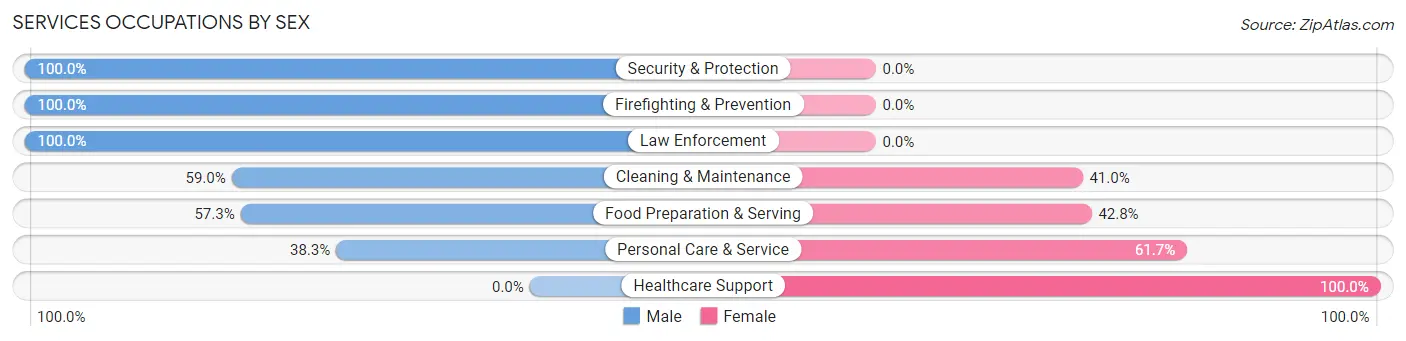
| Occupation | Male | Female |
| Healthcare Support | 0 (0.0%) | 320 (100.0%) |
| Security & Protection | 357 (100.0%) | 0 (0.0%) |
| Firefighting & Prevention | 229 (100.0%) | 0 (0.0%) |
| Law Enforcement | 128 (100.0%) | 0 (0.0%) |
| Food Preparation & Serving | 766 (57.3%) | 572 (42.7%) |
| Cleaning & Maintenance | 229 (59.0%) | 159 (41.0%) |
| Personal Care & Service | 187 (38.3%) | 301 (61.7%) |
| Total (Category) | 1,539 (53.2%) | 1,352 (46.8%) |
| Total (Overall) | 7,509 (54.3%) | 6,306 (45.7%) |
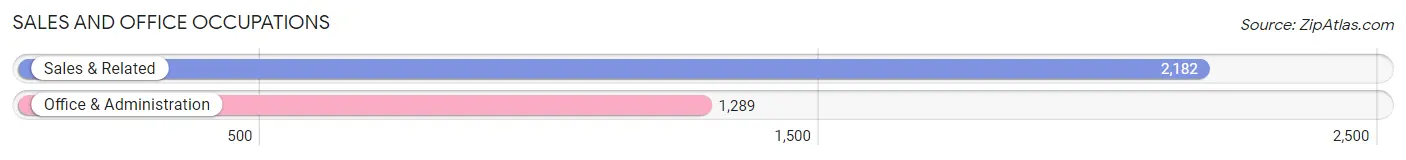
Sales and Office Occupations
The most common Sales and Office occupations in Bluffton are Sales & Related (2,182 | 15.8%), and Office & Administration (1,289 | 9.3%).
Sales and Office Occupations by Sex
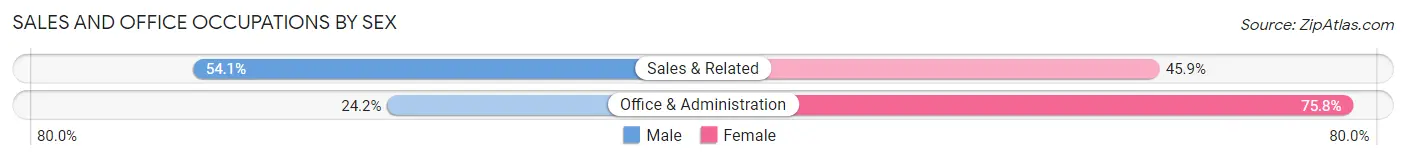
| Occupation | Male | Female |
| Sales & Related | 1,181 (54.1%) | 1,001 (45.9%) |
| Office & Administration | 312 (24.2%) | 977 (75.8%) |
| Total (Category) | 1,493 (43.0%) | 1,978 (57.0%) |
| Total (Overall) | 7,509 (54.3%) | 6,306 (45.7%) |
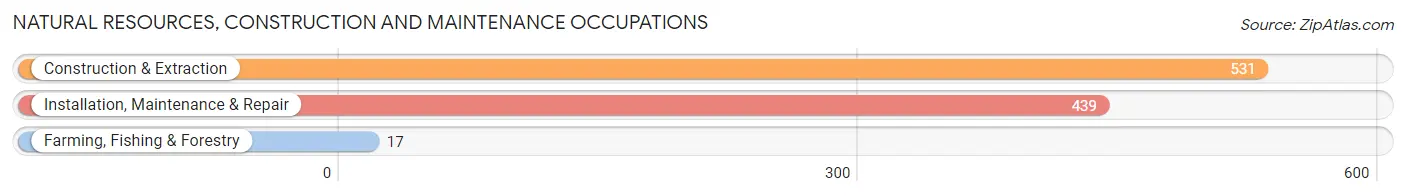
Natural Resources, Construction and Maintenance Occupations
The most common Natural Resources, Construction and Maintenance occupations in Bluffton are Construction & Extraction (531 | 3.8%), Installation, Maintenance & Repair (439 | 3.2%), and Farming, Fishing & Forestry (17 | 0.1%).
Natural Resources, Construction and Maintenance Occupations by Sex
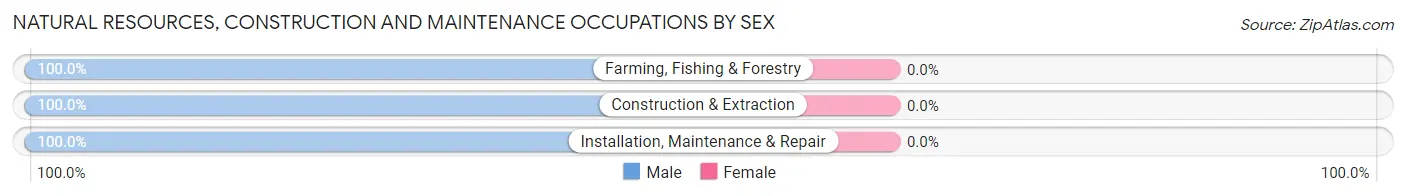
| Occupation | Male | Female |
| Farming, Fishing & Forestry | 17 (100.0%) | 0 (0.0%) |
| Construction & Extraction | 531 (100.0%) | 0 (0.0%) |
| Installation, Maintenance & Repair | 439 (100.0%) | 0 (0.0%) |
| Total (Category) | 987 (100.0%) | 0 (0.0%) |
| Total (Overall) | 7,509 (54.3%) | 6,306 (45.7%) |
Production, Transportation and Moving Occupations
The most common Production, Transportation and Moving occupations in Bluffton are Transportation (539 | 3.9%), Material Moving (243 | 1.8%), and Production (220 | 1.6%).
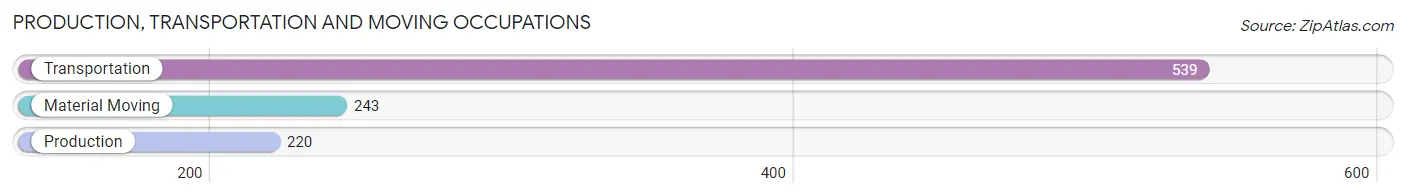
Production, Transportation and Moving Occupations by Sex
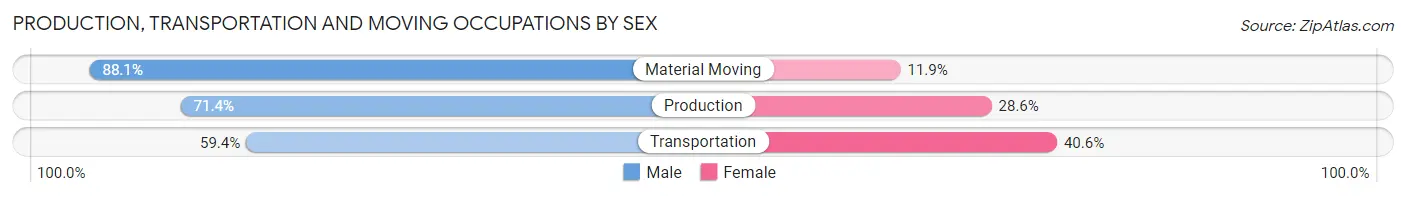
| Occupation | Male | Female |
| Production | 157 (71.4%) | 63 (28.6%) |
| Transportation | 320 (59.4%) | 219 (40.6%) |
| Material Moving | 214 (88.1%) | 29 (11.9%) |
| Total (Category) | 691 (69.0%) | 311 (31.0%) |
| Total (Overall) | 7,509 (54.3%) | 6,306 (45.7%) |
Employment Industries by Sex in Bluffton
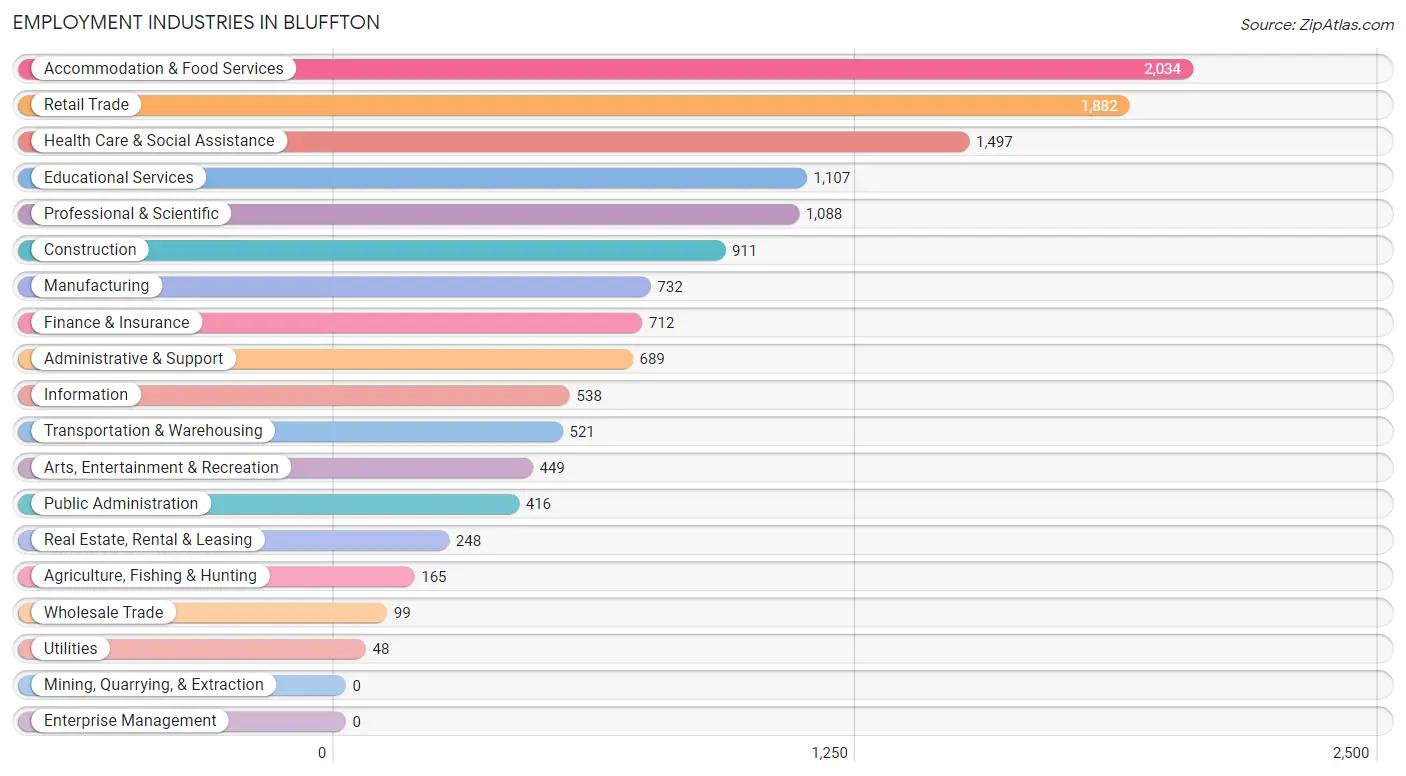
Employment Industries in Bluffton
The major employment industries in Bluffton include Accommodation & Food Services (2,034 | 14.7%), Retail Trade (1,882 | 13.6%), Health Care & Social Assistance (1,497 | 10.8%), Educational Services (1,107 | 8.0%), and Professional & Scientific (1,088 | 7.9%).
Employment Industries by Sex in Bluffton
The Bluffton industries that see more men than women are Agriculture, Fishing & Hunting (100.0%), Utilities (100.0%), and Construction (90.0%), whereas the industries that tend to have a higher number of women are Educational Services (86.8%), Health Care & Social Assistance (78.6%), and Retail Trade (51.0%).
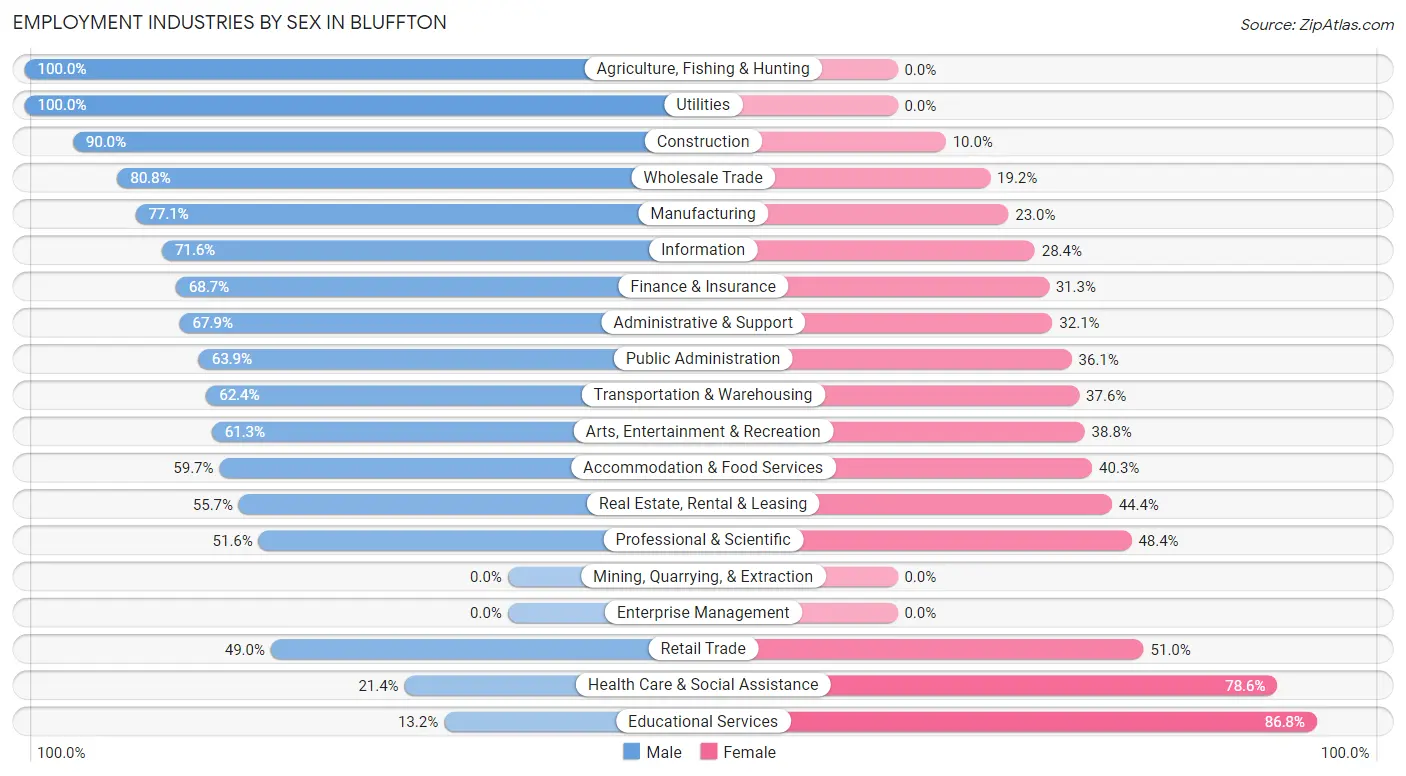
| Industry | Male | Female |
| Agriculture, Fishing & Hunting | 165 (100.0%) | 0 (0.0%) |
| Mining, Quarrying, & Extraction | 0 (0.0%) | 0 (0.0%) |
| Construction | 820 (90.0%) | 91 (10.0%) |
| Manufacturing | 564 (77.0%) | 168 (23.0%) |
| Wholesale Trade | 80 (80.8%) | 19 (19.2%) |
| Retail Trade | 923 (49.0%) | 959 (51.0%) |
| Transportation & Warehousing | 325 (62.4%) | 196 (37.6%) |
| Utilities | 48 (100.0%) | 0 (0.0%) |
| Information | 385 (71.6%) | 153 (28.4%) |
| Finance & Insurance | 489 (68.7%) | 223 (31.3%) |
| Real Estate, Rental & Leasing | 138 (55.6%) | 110 (44.4%) |
| Professional & Scientific | 561 (51.6%) | 527 (48.4%) |
| Enterprise Management | 0 (0.0%) | 0 (0.0%) |
| Administrative & Support | 468 (67.9%) | 221 (32.1%) |
| Educational Services | 146 (13.2%) | 961 (86.8%) |
| Health Care & Social Assistance | 320 (21.4%) | 1,177 (78.6%) |
| Arts, Entertainment & Recreation | 275 (61.3%) | 174 (38.8%) |
| Accommodation & Food Services | 1,214 (59.7%) | 820 (40.3%) |
| Public Administration | 266 (63.9%) | 150 (36.1%) |
| Total | 7,509 (54.3%) | 6,306 (45.7%) |
Education in Bluffton
School Enrollment in Bluffton
The most common levels of schooling among the 7,883 students in Bluffton are high school (2,183 | 27.7%), middle school (2,102 | 26.7%), and elementary school (1,508 | 19.1%).
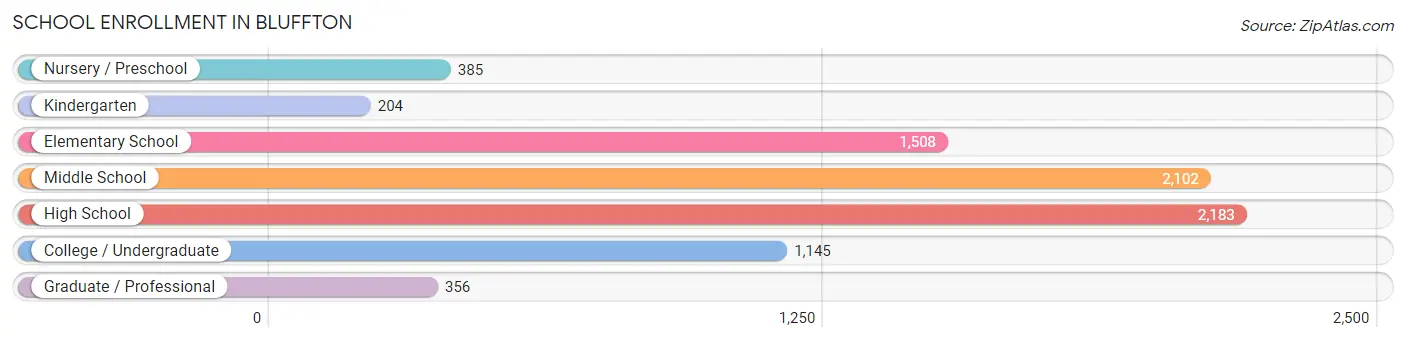
| School Level | # Students | % Students |
| Nursery / Preschool | 385 | 4.9% |
| Kindergarten | 204 | 2.6% |
| Elementary School | 1,508 | 19.1% |
| Middle School | 2,102 | 26.7% |
| High School | 2,183 | 27.7% |
| College / Undergraduate | 1,145 | 14.5% |
| Graduate / Professional | 356 | 4.5% |
| Total | 7,883 | 100.0% |
School Enrollment by Age by Funding Source in Bluffton
Out of a total of 7,883 students who are enrolled in schools in Bluffton, 1,419 (18.0%) attend a private institution, while the remaining 6,464 (82.0%) are enrolled in public schools. The age group of 3 to 4 year olds has the highest likelihood of being enrolled in private schools, with 179 (57.7% in the age bracket) enrolled. Conversely, the age group of 15 to 17 year olds has the lowest likelihood of being enrolled in a private school, with 1,410 (87.7% in the age bracket) attending a public institution.
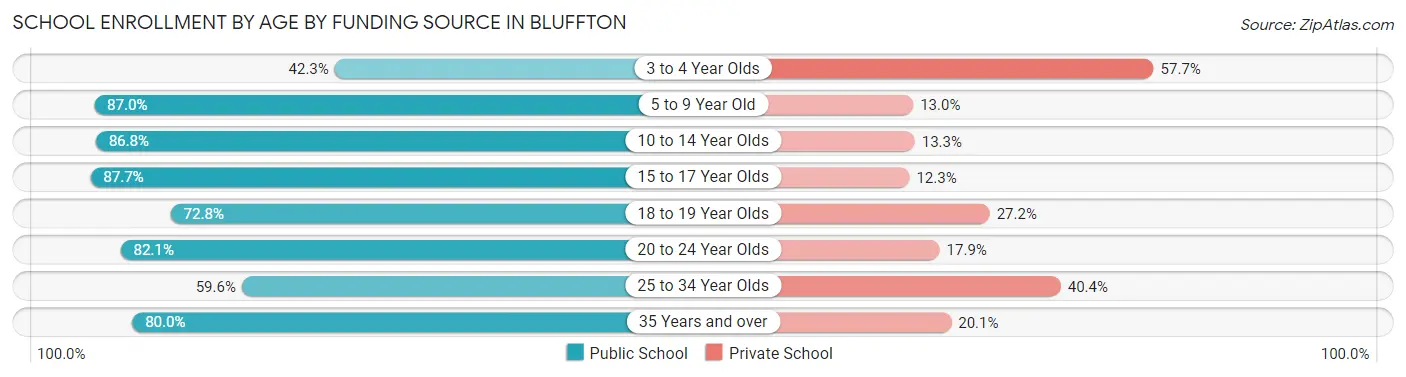
| Age Bracket | Public School | Private School |
| 3 to 4 Year Olds | 131 (42.3%) | 179 (57.7%) |
| 5 to 9 Year Old | 1,303 (87.0%) | 194 (13.0%) |
| 10 to 14 Year Olds | 2,351 (86.8%) | 359 (13.3%) |
| 15 to 17 Year Olds | 1,410 (87.7%) | 197 (12.3%) |
| 18 to 19 Year Olds | 412 (72.8%) | 154 (27.2%) |
| 20 to 24 Year Olds | 248 (82.1%) | 54 (17.9%) |
| 25 to 34 Year Olds | 296 (59.6%) | 201 (40.4%) |
| 35 Years and over | 315 (79.9%) | 79 (20.1%) |
| Total | 6,464 (82.0%) | 1,419 (18.0%) |
Educational Attainment by Field of Study in Bluffton
Business (2,560 | 25.8%), education (1,380 | 13.9%), social sciences (930 | 9.4%), science & technology (883 | 8.9%), and communications (622 | 6.3%) are the most common fields of study among 9,940 individuals in Bluffton who have obtained a bachelor's degree or higher.
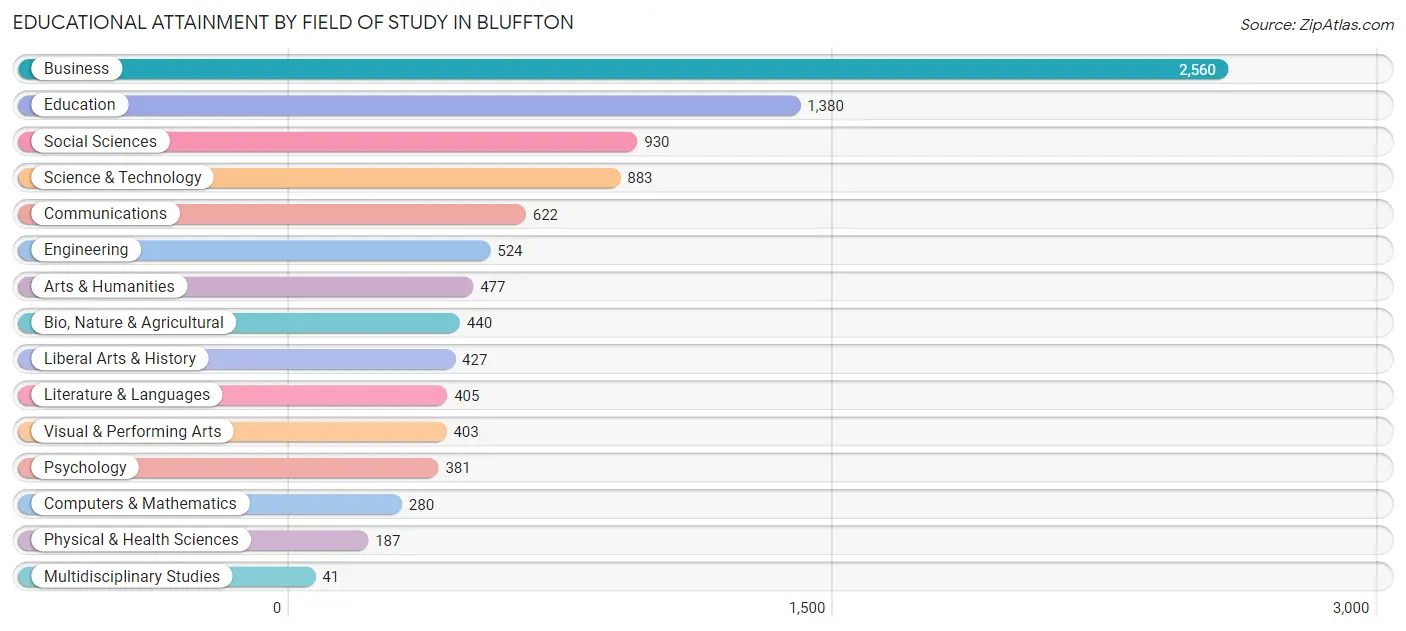
| Field of Study | # Graduates | % Graduates |
| Computers & Mathematics | 280 | 2.8% |
| Bio, Nature & Agricultural | 440 | 4.4% |
| Physical & Health Sciences | 187 | 1.9% |
| Psychology | 381 | 3.8% |
| Social Sciences | 930 | 9.4% |
| Engineering | 524 | 5.3% |
| Multidisciplinary Studies | 41 | 0.4% |
| Science & Technology | 883 | 8.9% |
| Business | 2,560 | 25.8% |
| Education | 1,380 | 13.9% |
| Literature & Languages | 405 | 4.1% |
| Liberal Arts & History | 427 | 4.3% |
| Visual & Performing Arts | 403 | 4.1% |
| Communications | 622 | 6.3% |
| Arts & Humanities | 477 | 4.8% |
| Total | 9,940 | 100.0% |
Transportation & Commute in Bluffton
Vehicle Availability by Sex in Bluffton
The most prevalent vehicle ownership categories in Bluffton are males with 2 vehicles (4,414, accounting for 58.5%) and females with 2 vehicles (3,136, making up 69.7%).
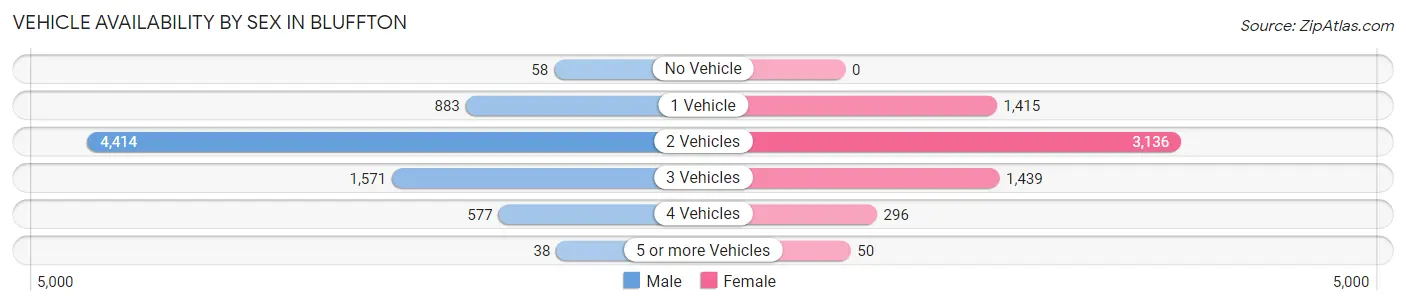
| Vehicles Available | Male | Female |
| No Vehicle | 58 (0.8%) | 0 (0.0%) |
| 1 Vehicle | 883 (11.7%) | 1,415 (22.3%) |
| 2 Vehicles | 4,414 (58.5%) | 3,136 (49.5%) |
| 3 Vehicles | 1,571 (20.8%) | 1,439 (22.7%) |
| 4 Vehicles | 577 (7.6%) | 296 (4.7%) |
| 5 or more Vehicles | 38 (0.5%) | 50 (0.8%) |
| Total | 7,541 (100.0%) | 6,336 (100.0%) |
Commute Time in Bluffton
The most frequently occuring commute durations in Bluffton are 30 to 34 minutes (3,066 commuters, 25.5%), 15 to 19 minutes (2,026 commuters, 16.9%), and 10 to 14 minutes (1,686 commuters, 14.0%).
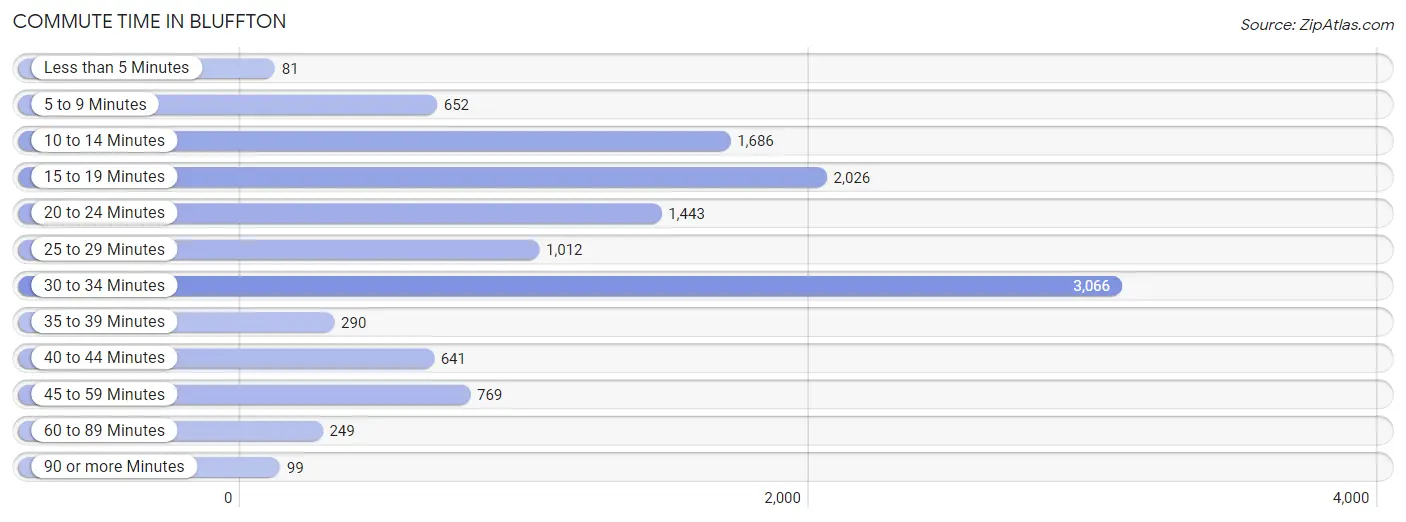
| Commute Time | # Commuters | % Commuters |
| Less than 5 Minutes | 81 | 0.7% |
| 5 to 9 Minutes | 652 | 5.4% |
| 10 to 14 Minutes | 1,686 | 14.0% |
| 15 to 19 Minutes | 2,026 | 16.9% |
| 20 to 24 Minutes | 1,443 | 12.0% |
| 25 to 29 Minutes | 1,012 | 8.4% |
| 30 to 34 Minutes | 3,066 | 25.5% |
| 35 to 39 Minutes | 290 | 2.4% |
| 40 to 44 Minutes | 641 | 5.3% |
| 45 to 59 Minutes | 769 | 6.4% |
| 60 to 89 Minutes | 249 | 2.1% |
| 90 or more Minutes | 99 | 0.8% |
Commute Time by Sex in Bluffton
The most common commute times in Bluffton are 30 to 34 minutes (1,740 commuters, 26.9%) for males and 30 to 34 minutes (1,326 commuters, 23.9%) for females.
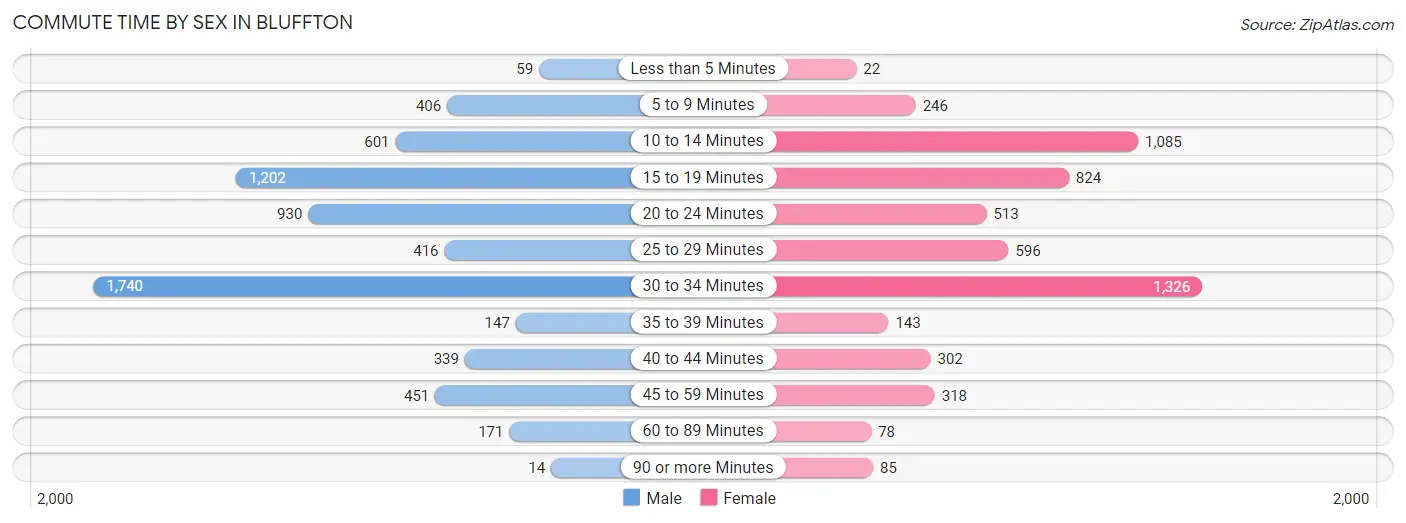
| Commute Time | Male | Female |
| Less than 5 Minutes | 59 (0.9%) | 22 (0.4%) |
| 5 to 9 Minutes | 406 (6.3%) | 246 (4.4%) |
| 10 to 14 Minutes | 601 (9.3%) | 1,085 (19.6%) |
| 15 to 19 Minutes | 1,202 (18.6%) | 824 (14.9%) |
| 20 to 24 Minutes | 930 (14.4%) | 513 (9.3%) |
| 25 to 29 Minutes | 416 (6.4%) | 596 (10.8%) |
| 30 to 34 Minutes | 1,740 (26.9%) | 1,326 (23.9%) |
| 35 to 39 Minutes | 147 (2.3%) | 143 (2.6%) |
| 40 to 44 Minutes | 339 (5.2%) | 302 (5.4%) |
| 45 to 59 Minutes | 451 (7.0%) | 318 (5.7%) |
| 60 to 89 Minutes | 171 (2.6%) | 78 (1.4%) |
| 90 or more Minutes | 14 (0.2%) | 85 (1.5%) |
Time of Departure to Work by Sex in Bluffton
The most frequent times of departure to work in Bluffton are 7:30 AM to 7:59 AM (1,055, 16.3%) for males and 7:30 AM to 7:59 AM (1,237, 22.3%) for females.
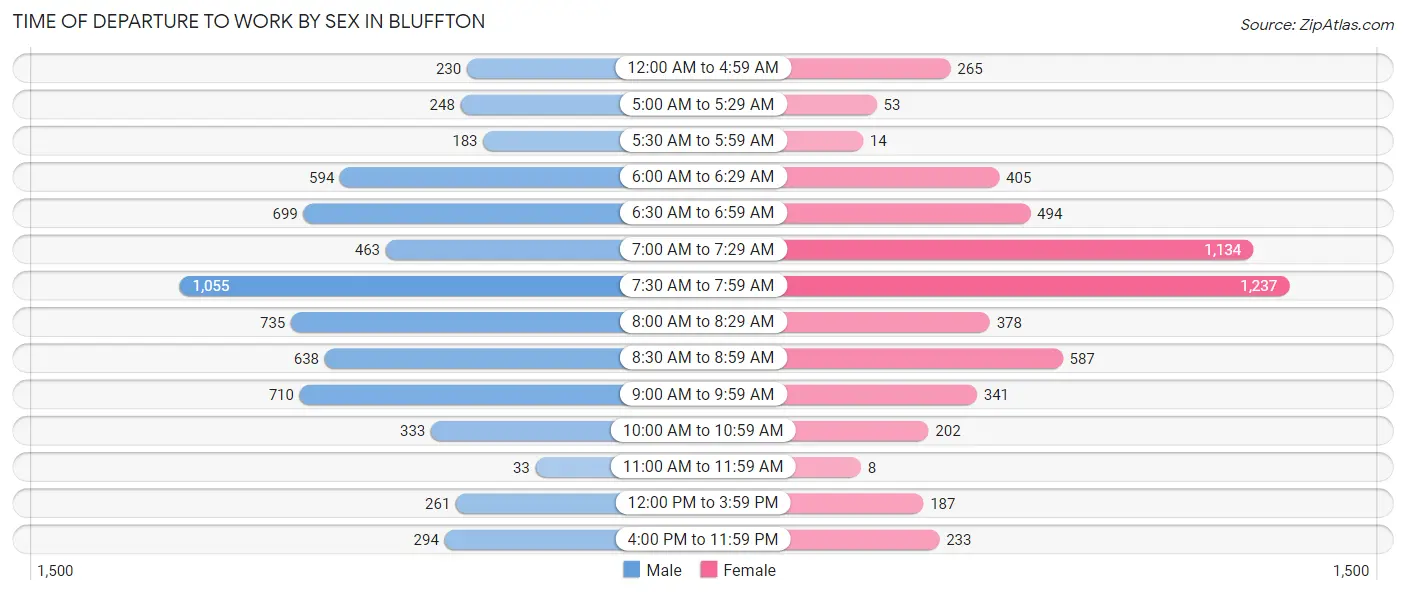
| Time of Departure | Male | Female |
| 12:00 AM to 4:59 AM | 230 (3.5%) | 265 (4.8%) |
| 5:00 AM to 5:29 AM | 248 (3.8%) | 53 (1.0%) |
| 5:30 AM to 5:59 AM | 183 (2.8%) | 14 (0.3%) |
| 6:00 AM to 6:29 AM | 594 (9.2%) | 405 (7.3%) |
| 6:30 AM to 6:59 AM | 699 (10.8%) | 494 (8.9%) |
| 7:00 AM to 7:29 AM | 463 (7.1%) | 1,134 (20.5%) |
| 7:30 AM to 7:59 AM | 1,055 (16.3%) | 1,237 (22.3%) |
| 8:00 AM to 8:29 AM | 735 (11.4%) | 378 (6.8%) |
| 8:30 AM to 8:59 AM | 638 (9.9%) | 587 (10.6%) |
| 9:00 AM to 9:59 AM | 710 (11.0%) | 341 (6.2%) |
| 10:00 AM to 10:59 AM | 333 (5.1%) | 202 (3.6%) |
| 11:00 AM to 11:59 AM | 33 (0.5%) | 8 (0.1%) |
| 12:00 PM to 3:59 PM | 261 (4.0%) | 187 (3.4%) |
| 4:00 PM to 11:59 PM | 294 (4.5%) | 233 (4.2%) |
| Total | 6,476 (100.0%) | 5,538 (100.0%) |
Housing Occupancy in Bluffton
Occupancy by Ownership in Bluffton
Of the total 10,685 dwellings in Bluffton, owner-occupied units account for 8,799 (82.4%), while renter-occupied units make up 1,886 (17.6%).
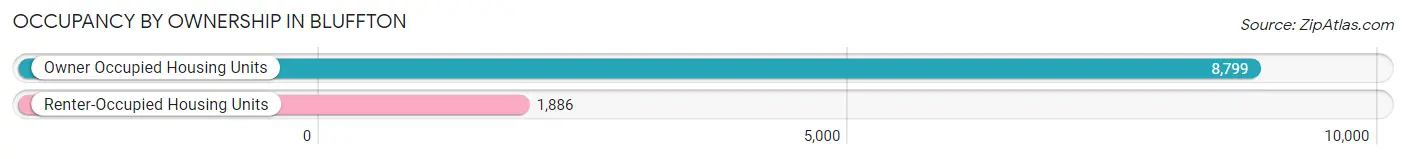
| Occupancy | # Housing Units | % Housing Units |
| Owner Occupied Housing Units | 8,799 | 82.4% |
| Renter-Occupied Housing Units | 1,886 | 17.6% |
| Total Occupied Housing Units | 10,685 | 100.0% |
Occupancy by Household Size in Bluffton
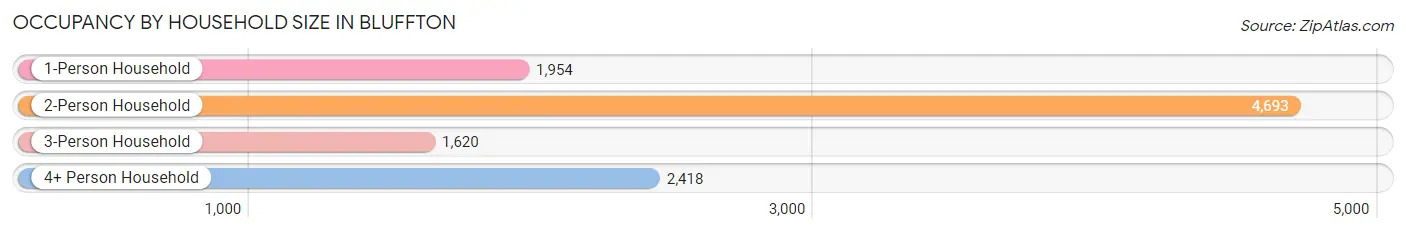
| Household Size | # Housing Units | % Housing Units |
| 1-Person Household | 1,954 | 18.3% |
| 2-Person Household | 4,693 | 43.9% |
| 3-Person Household | 1,620 | 15.2% |
| 4+ Person Household | 2,418 | 22.6% |
| Total Housing Units | 10,685 | 100.0% |
Occupancy by Ownership by Household Size in Bluffton
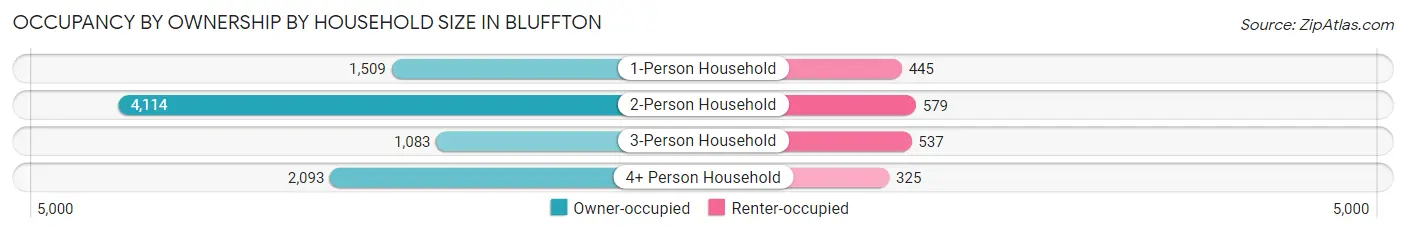
| Household Size | Owner-occupied | Renter-occupied |
| 1-Person Household | 1,509 (77.2%) | 445 (22.8%) |
| 2-Person Household | 4,114 (87.7%) | 579 (12.3%) |
| 3-Person Household | 1,083 (66.8%) | 537 (33.2%) |
| 4+ Person Household | 2,093 (86.6%) | 325 (13.4%) |
| Total Housing Units | 8,799 (82.4%) | 1,886 (17.6%) |
Occupancy by Educational Attainment in Bluffton
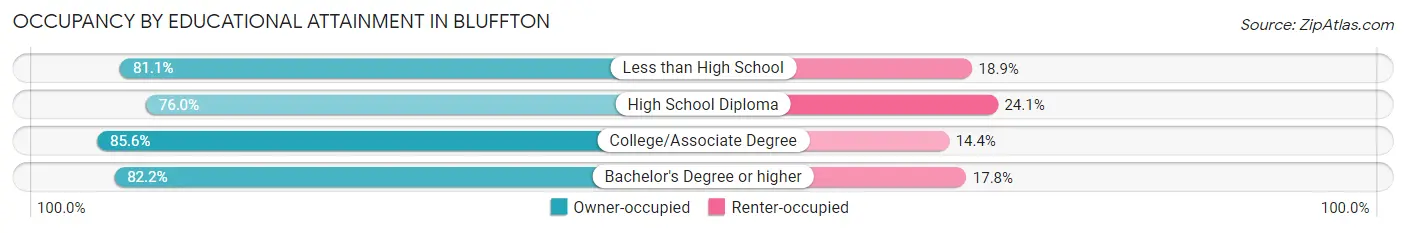
| Household Size | Owner-occupied | Renter-occupied |
| Less than High School | 227 (81.1%) | 53 (18.9%) |
| High School Diploma | 1,134 (75.9%) | 359 (24.0%) |
| College/Associate Degree | 2,786 (85.6%) | 468 (14.4%) |
| Bachelor's Degree or higher | 4,652 (82.2%) | 1,006 (17.8%) |
Occupancy by Age of Householder in Bluffton
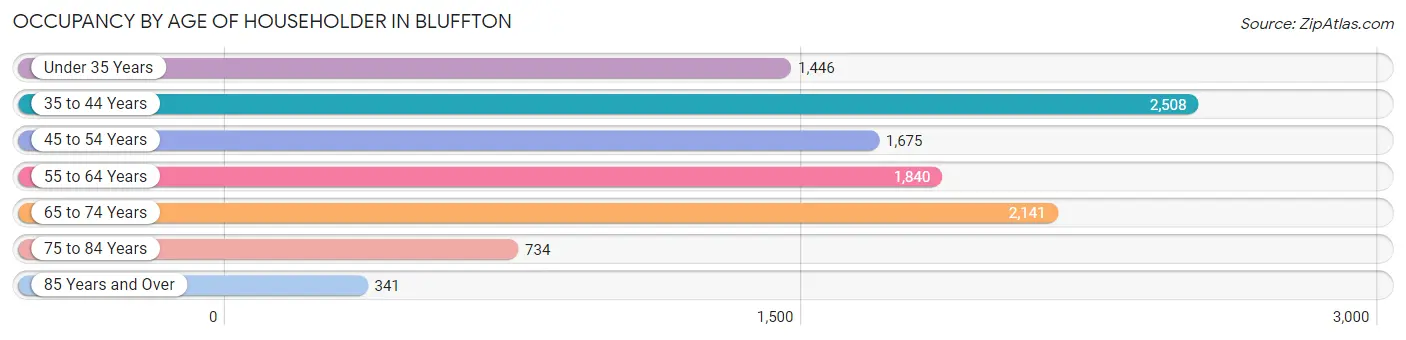
| Age Bracket | # Households | % Households |
| Under 35 Years | 1,446 | 13.5% |
| 35 to 44 Years | 2,508 | 23.5% |
| 45 to 54 Years | 1,675 | 15.7% |
| 55 to 64 Years | 1,840 | 17.2% |
| 65 to 74 Years | 2,141 | 20.0% |
| 75 to 84 Years | 734 | 6.9% |
| 85 Years and Over | 341 | 3.2% |
| Total | 10,685 | 100.0% |
Housing Finances in Bluffton
Median Income by Occupancy in Bluffton
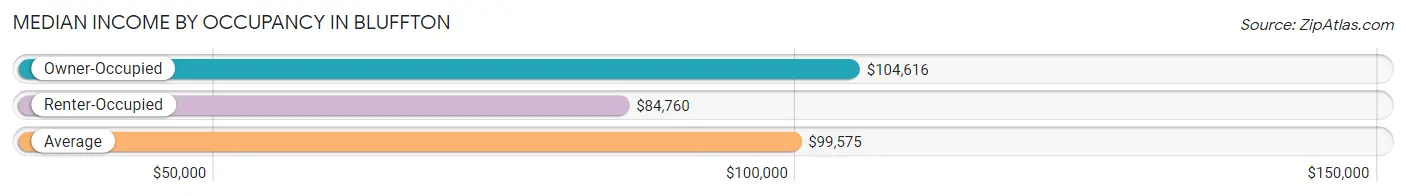
| Occupancy Type | # Households | Median Income |
| Owner-Occupied | 8,799 (82.4%) | $104,616 |
| Renter-Occupied | 1,886 (17.6%) | $84,760 |
| Average | 10,685 (100.0%) | $99,575 |
Occupancy by Householder Income Bracket in Bluffton
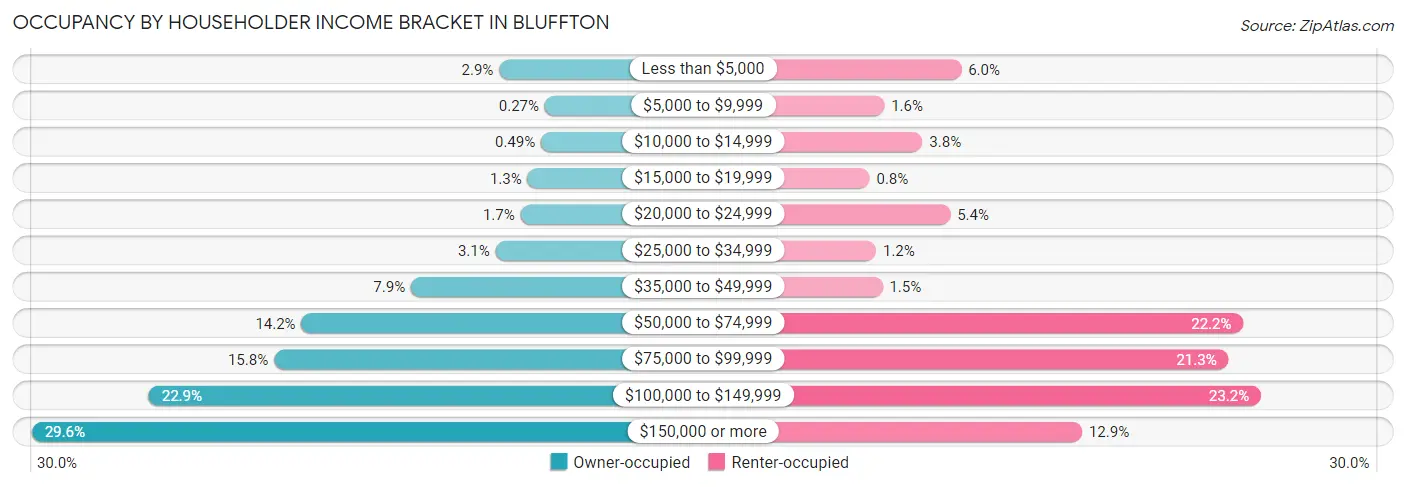
| Income Bracket | Owner-occupied | Renter-occupied |
| Less than $5,000 | 253 (2.9%) | 114 (6.0%) |
| $5,000 to $9,999 | 24 (0.3%) | 31 (1.6%) |
| $10,000 to $14,999 | 43 (0.5%) | 72 (3.8%) |
| $15,000 to $19,999 | 111 (1.3%) | 15 (0.8%) |
| $20,000 to $24,999 | 146 (1.7%) | 102 (5.4%) |
| $25,000 to $34,999 | 272 (3.1%) | 22 (1.2%) |
| $35,000 to $49,999 | 697 (7.9%) | 29 (1.5%) |
| $50,000 to $74,999 | 1,248 (14.2%) | 418 (22.2%) |
| $75,000 to $99,999 | 1,386 (15.8%) | 402 (21.3%) |
| $100,000 to $149,999 | 2,015 (22.9%) | 437 (23.2%) |
| $150,000 or more | 2,604 (29.6%) | 244 (12.9%) |
| Total | 8,799 (100.0%) | 1,886 (100.0%) |
Monthly Housing Cost Tiers in Bluffton
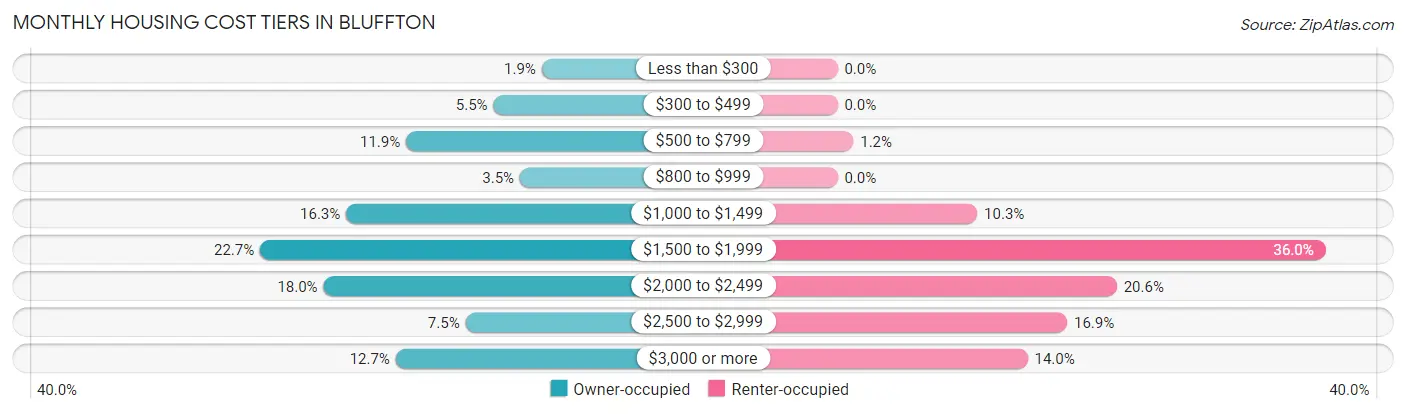
| Monthly Cost | Owner-occupied | Renter-occupied |
| Less than $300 | 169 (1.9%) | 0 (0.0%) |
| $300 to $499 | 481 (5.5%) | 0 (0.0%) |
| $500 to $799 | 1,048 (11.9%) | 22 (1.2%) |
| $800 to $999 | 310 (3.5%) | 0 (0.0%) |
| $1,000 to $1,499 | 1,436 (16.3%) | 194 (10.3%) |
| $1,500 to $1,999 | 1,994 (22.7%) | 678 (35.9%) |
| $2,000 to $2,499 | 1,583 (18.0%) | 388 (20.6%) |
| $2,500 to $2,999 | 663 (7.5%) | 319 (16.9%) |
| $3,000 or more | 1,115 (12.7%) | 264 (14.0%) |
| Total | 8,799 (100.0%) | 1,886 (100.0%) |
Physical Housing Characteristics in Bluffton
Housing Structures in Bluffton
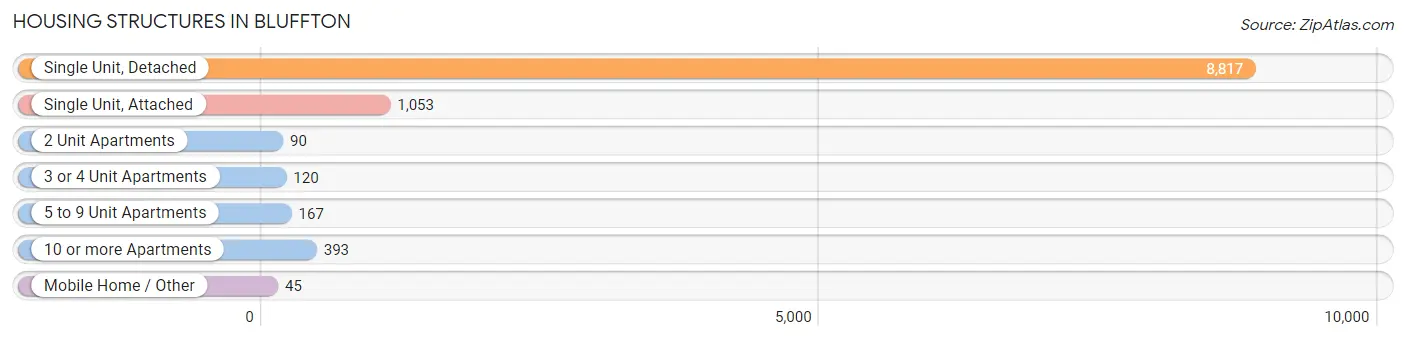
| Structure Type | # Housing Units | % Housing Units |
| Single Unit, Detached | 8,817 | 82.5% |
| Single Unit, Attached | 1,053 | 9.9% |
| 2 Unit Apartments | 90 | 0.8% |
| 3 or 4 Unit Apartments | 120 | 1.1% |
| 5 to 9 Unit Apartments | 167 | 1.6% |
| 10 or more Apartments | 393 | 3.7% |
| Mobile Home / Other | 45 | 0.4% |
| Total | 10,685 | 100.0% |
Housing Structures by Occupancy in Bluffton
| Structure Type | Owner-occupied | Renter-occupied |
| Single Unit, Detached | 7,982 (90.5%) | 835 (9.5%) |
| Single Unit, Attached | 747 (70.9%) | 306 (29.1%) |
| 2 Unit Apartments | 18 (20.0%) | 72 (80.0%) |
| 3 or 4 Unit Apartments | 0 (0.0%) | 120 (100.0%) |
| 5 to 9 Unit Apartments | 7 (4.2%) | 160 (95.8%) |
| 10 or more Apartments | 0 (0.0%) | 393 (100.0%) |
| Mobile Home / Other | 45 (100.0%) | 0 (0.0%) |
| Total | 8,799 (82.4%) | 1,886 (17.6%) |
Housing Structures by Number of Rooms in Bluffton
| Number of Rooms | Owner-occupied | Renter-occupied |
| 1 Room | 17 (0.2%) | 33 (1.8%) |
| 2 or 3 Rooms | 175 (2.0%) | 299 (15.9%) |
| 4 or 5 Rooms | 2,456 (27.9%) | 469 (24.9%) |
| 6 or 7 Rooms | 3,130 (35.6%) | 766 (40.6%) |
| 8 or more Rooms | 3,021 (34.3%) | 319 (16.9%) |
| Total | 8,799 (100.0%) | 1,886 (100.0%) |
Housing Structure by Heating Type in Bluffton
| Heating Type | Owner-occupied | Renter-occupied |
| Utility Gas | 2,812 (32.0%) | 128 (6.8%) |
| Bottled, Tank, or LP Gas | 131 (1.5%) | 9 (0.5%) |
| Electricity | 5,781 (65.7%) | 1,749 (92.7%) |
| Fuel Oil or Kerosene | 0 (0.0%) | 0 (0.0%) |
| Coal or Coke | 0 (0.0%) | 0 (0.0%) |
| All other Fuels | 64 (0.7%) | 0 (0.0%) |
| No Fuel Used | 11 (0.1%) | 0 (0.0%) |
| Total | 8,799 (100.0%) | 1,886 (100.0%) |
Household Vehicle Usage in Bluffton
| Vehicles per Household | Owner-occupied | Renter-occupied |
| No Vehicle | 59 (0.7%) | 18 (0.9%) |
| 1 Vehicle | 2,538 (28.8%) | 655 (34.7%) |
| 2 Vehicles | 4,869 (55.3%) | 987 (52.3%) |
| 3 or more Vehicles | 1,333 (15.1%) | 226 (12.0%) |
| Total | 8,799 (100.0%) | 1,886 (100.0%) |
Real Estate & Mortgages in Bluffton
Real Estate and Mortgage Overview in Bluffton
| Characteristic | Without Mortgage | With Mortgage |
| Housing Units | 2,296 | 6,503 |
| Median Property Value | $388,900 | $390,500 |
| Median Household Income | $76,573 | $2,241 |
| Monthly Housing Costs | $589 | $1,082 |
| Real Estate Taxes | $2,443 | $186 |
Property Value by Mortgage Status in Bluffton
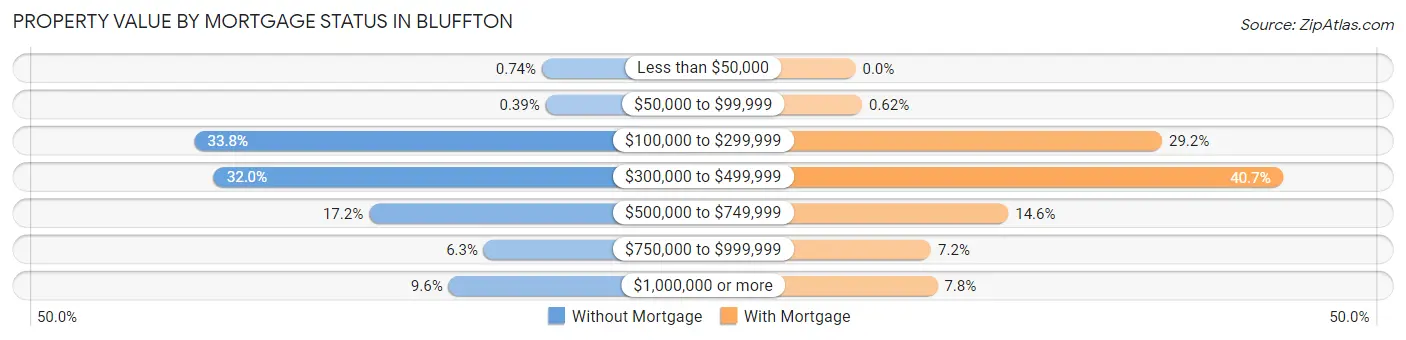
| Property Value | Without Mortgage | With Mortgage |
| Less than $50,000 | 17 (0.7%) | 0 (0.0%) |
| $50,000 to $99,999 | 9 (0.4%) | 40 (0.6%) |
| $100,000 to $299,999 | 776 (33.8%) | 1,898 (29.2%) |
| $300,000 to $499,999 | 734 (32.0%) | 2,644 (40.7%) |
| $500,000 to $749,999 | 395 (17.2%) | 946 (14.5%) |
| $750,000 to $999,999 | 144 (6.3%) | 468 (7.2%) |
| $1,000,000 or more | 221 (9.6%) | 507 (7.8%) |
| Total | 2,296 (100.0%) | 6,503 (100.0%) |
Household Income by Mortgage Status in Bluffton
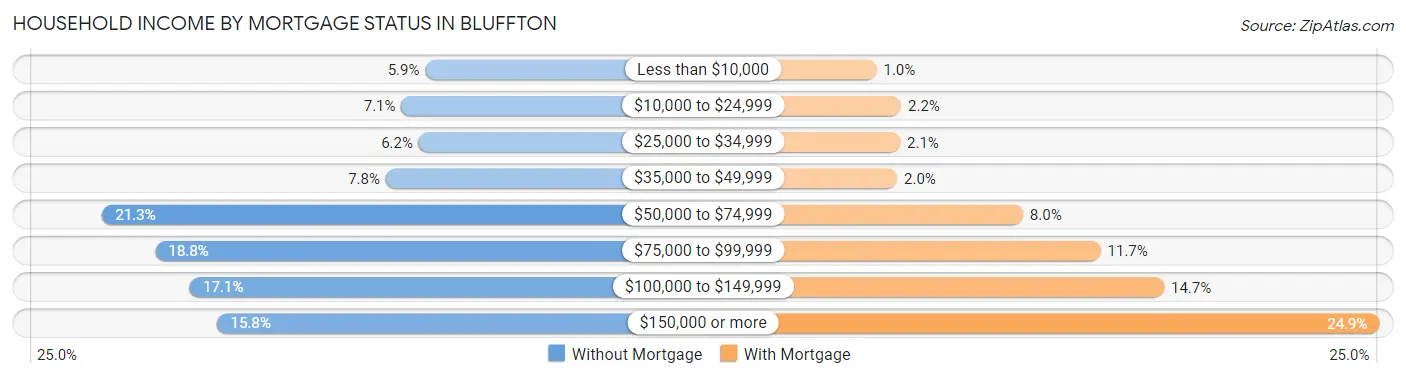
| Household Income | Without Mortgage | With Mortgage |
| Less than $10,000 | 136 (5.9%) | 65 (1.0%) |
| $10,000 to $24,999 | 162 (7.1%) | 141 (2.2%) |
| $25,000 to $34,999 | 143 (6.2%) | 138 (2.1%) |
| $35,000 to $49,999 | 179 (7.8%) | 129 (2.0%) |
| $50,000 to $74,999 | 489 (21.3%) | 518 (8.0%) |
| $75,000 to $99,999 | 431 (18.8%) | 759 (11.7%) |
| $100,000 to $149,999 | 393 (17.1%) | 955 (14.7%) |
| $150,000 or more | 363 (15.8%) | 1,622 (24.9%) |
| Total | 2,296 (100.0%) | 6,503 (100.0%) |
Property Value to Household Income Ratio in Bluffton
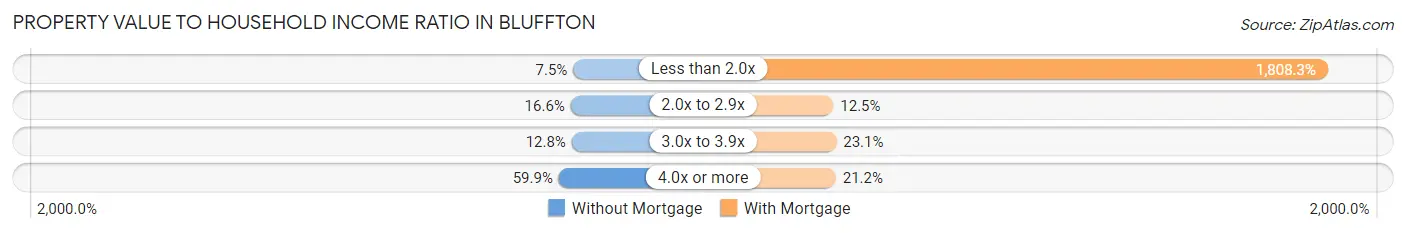
| Value-to-Income Ratio | Without Mortgage | With Mortgage |
| Less than 2.0x | 171 (7.4%) | 117,596 (1,808.3%) |
| 2.0x to 2.9x | 382 (16.6%) | 814 (12.5%) |
| 3.0x to 3.9x | 294 (12.8%) | 1,505 (23.1%) |
| 4.0x or more | 1,376 (59.9%) | 1,380 (21.2%) |
| Total | 2,296 (100.0%) | 6,503 (100.0%) |
Real Estate Taxes by Mortgage Status in Bluffton
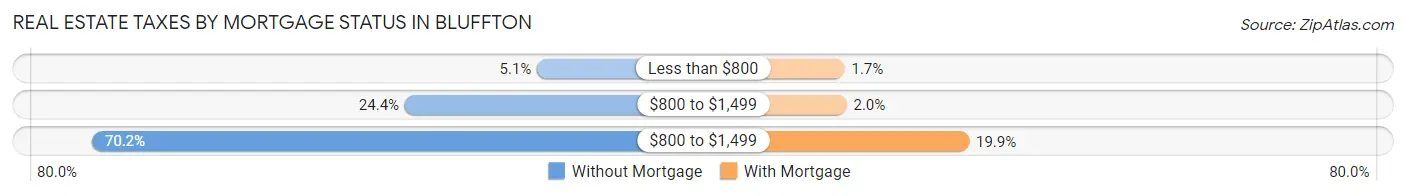
| Property Taxes | Without Mortgage | With Mortgage |
| Less than $800 | 117 (5.1%) | 109 (1.7%) |
| $800 to $1,499 | 561 (24.4%) | 128 (2.0%) |
| $800 to $1,499 | 1,611 (70.2%) | 1,292 (19.9%) |
| Total | 2,296 (100.0%) | 6,503 (100.0%) |
Health & Disability in Bluffton
Health Insurance Coverage by Age in Bluffton
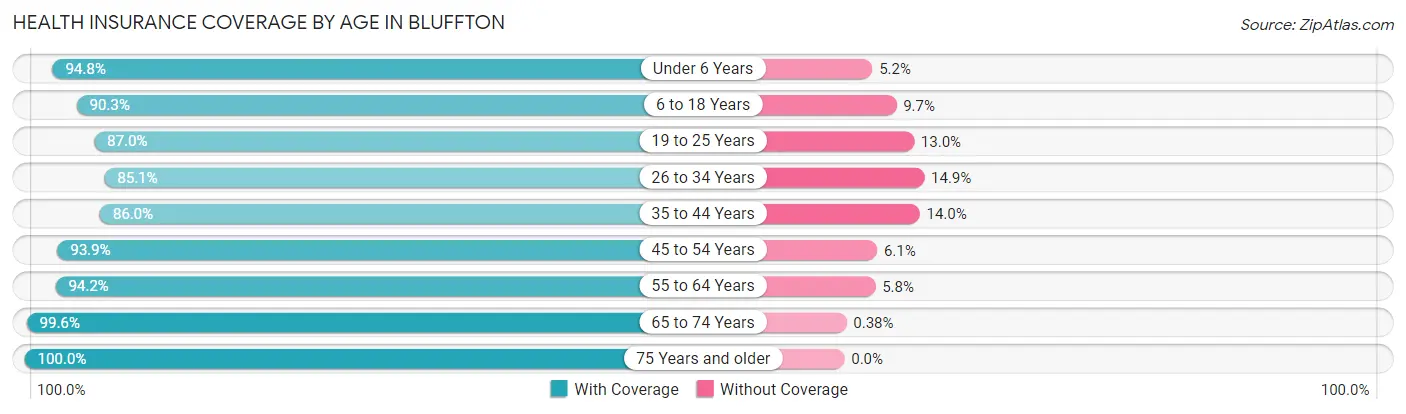
| Age Bracket | With Coverage | Without Coverage |
| Under 6 Years | 1,601 (94.8%) | 88 (5.2%) |
| 6 to 18 Years | 5,775 (90.3%) | 619 (9.7%) |
| 19 to 25 Years | 1,287 (87.0%) | 192 (13.0%) |
| 26 to 34 Years | 2,253 (85.1%) | 394 (14.9%) |
| 35 to 44 Years | 3,875 (86.0%) | 633 (14.0%) |
| 45 to 54 Years | 3,019 (93.9%) | 196 (6.1%) |
| 55 to 64 Years | 2,977 (94.2%) | 182 (5.8%) |
| 65 to 74 Years | 3,903 (99.6%) | 15 (0.4%) |
| 75 Years and older | 2,029 (100.0%) | 0 (0.0%) |
| Total | 26,719 (92.0%) | 2,319 (8.0%) |
Health Insurance Coverage by Citizenship Status in Bluffton
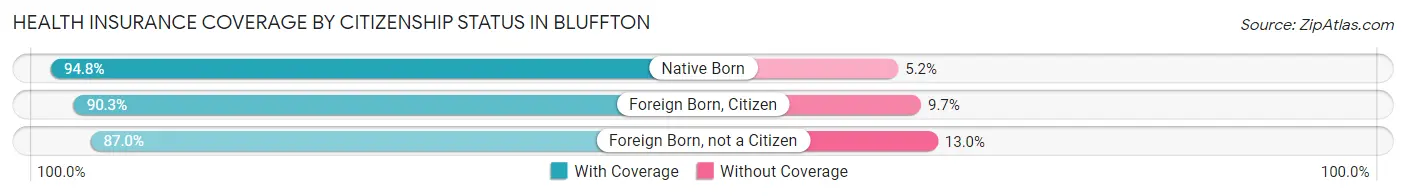
| Citizenship Status | With Coverage | Without Coverage |
| Native Born | 1,601 (94.8%) | 88 (5.2%) |
| Foreign Born, Citizen | 5,775 (90.3%) | 619 (9.7%) |
| Foreign Born, not a Citizen | 1,287 (87.0%) | 192 (13.0%) |
Health Insurance Coverage by Household Income in Bluffton
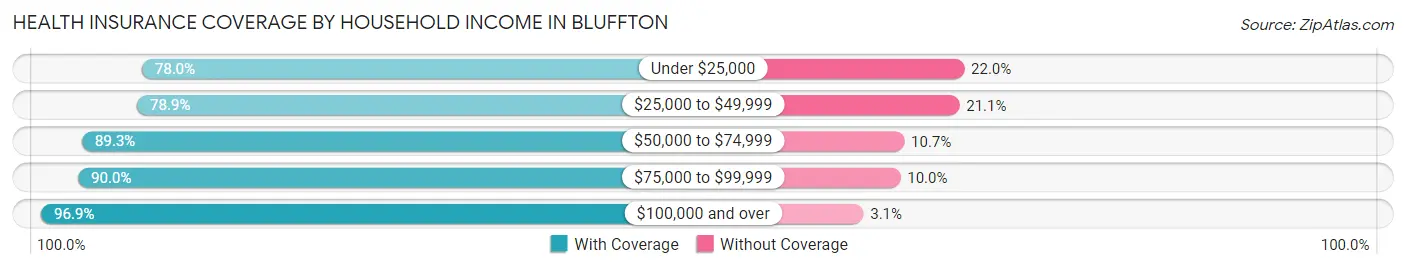
| Household Income | With Coverage | Without Coverage |
| Under $25,000 | 1,274 (78.0%) | 359 (22.0%) |
| $25,000 to $49,999 | 1,659 (78.9%) | 443 (21.1%) |
| $50,000 to $74,999 | 3,764 (89.3%) | 453 (10.7%) |
| $75,000 to $99,999 | 5,355 (90.0%) | 597 (10.0%) |
| $100,000 and over | 14,634 (96.9%) | 467 (3.1%) |
Public vs Private Health Insurance Coverage by Age in Bluffton
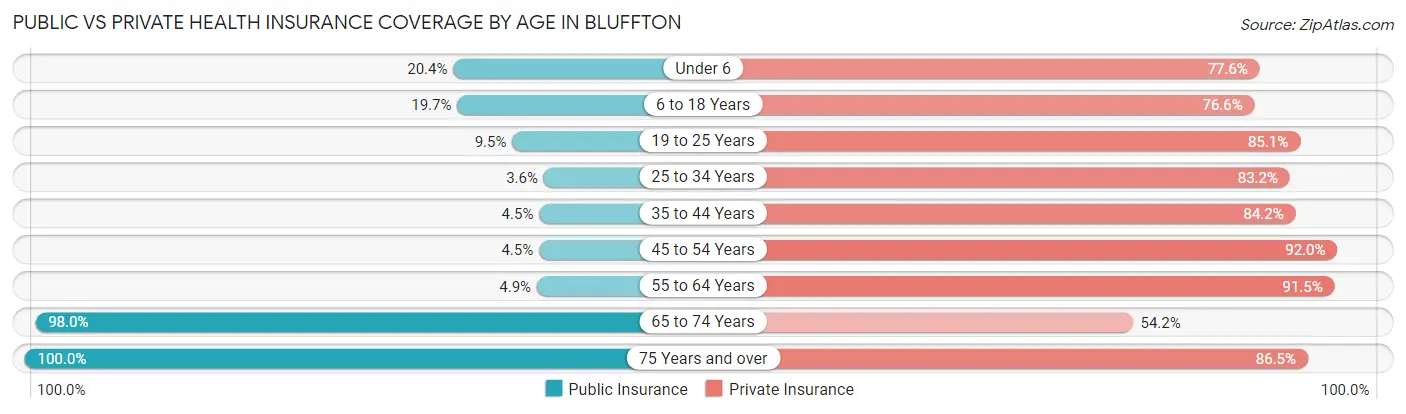
| Age Bracket | Public Insurance | Private Insurance |
| Under 6 | 345 (20.4%) | 1,310 (77.6%) |
| 6 to 18 Years | 1,259 (19.7%) | 4,898 (76.6%) |
| 19 to 25 Years | 140 (9.5%) | 1,258 (85.1%) |
| 25 to 34 Years | 96 (3.6%) | 2,201 (83.2%) |
| 35 to 44 Years | 202 (4.5%) | 3,796 (84.2%) |
| 45 to 54 Years | 145 (4.5%) | 2,957 (92.0%) |
| 55 to 64 Years | 155 (4.9%) | 2,889 (91.4%) |
| 65 to 74 Years | 3,841 (98.0%) | 2,122 (54.2%) |
| 75 Years and over | 2,029 (100.0%) | 1,755 (86.5%) |
| Total | 8,212 (28.3%) | 23,186 (79.8%) |
Disability Status by Sex by Age in Bluffton
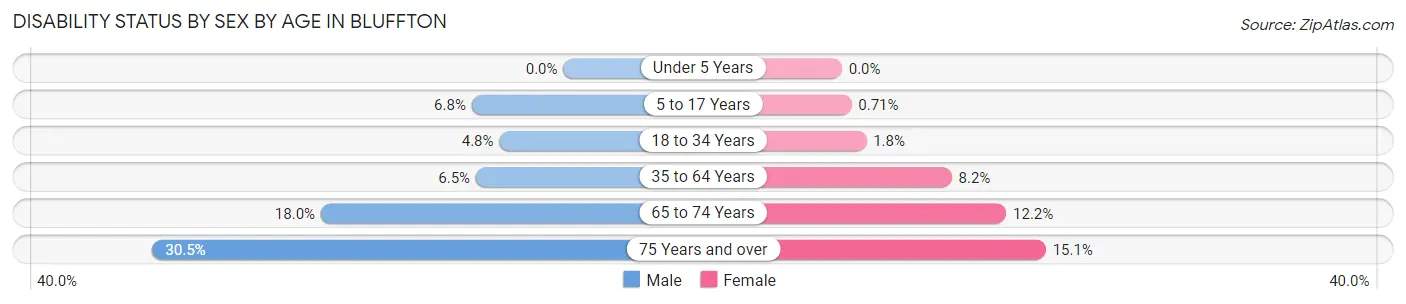
| Age Bracket | Male | Female |
| Under 5 Years | 0 (0.0%) | 0 (0.0%) |
| 5 to 17 Years | 218 (6.8%) | 22 (0.7%) |
| 18 to 34 Years | 121 (4.8%) | 38 (1.8%) |
| 35 to 64 Years | 309 (6.5%) | 499 (8.2%) |
| 65 to 74 Years | 354 (18.0%) | 238 (12.2%) |
| 75 Years and over | 353 (30.5%) | 132 (15.1%) |
Disability Class by Sex by Age in Bluffton
Disability Class: Hearing Difficulty
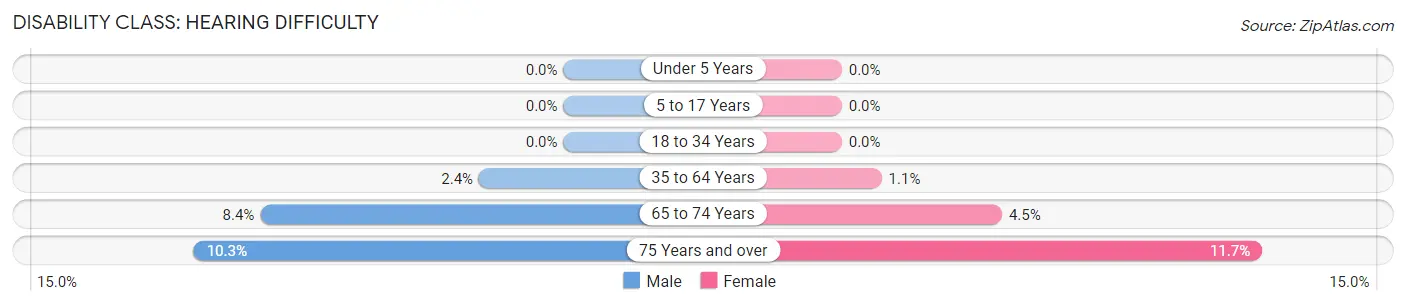
| Age Bracket | Male | Female |
| Under 5 Years | 0 (0.0%) | 0 (0.0%) |
| 5 to 17 Years | 0 (0.0%) | 0 (0.0%) |
| 18 to 34 Years | 0 (0.0%) | 0 (0.0%) |
| 35 to 64 Years | 112 (2.4%) | 68 (1.1%) |
| 65 to 74 Years | 166 (8.4%) | 87 (4.5%) |
| 75 Years and over | 119 (10.3%) | 102 (11.7%) |
Disability Class: Vision Difficulty
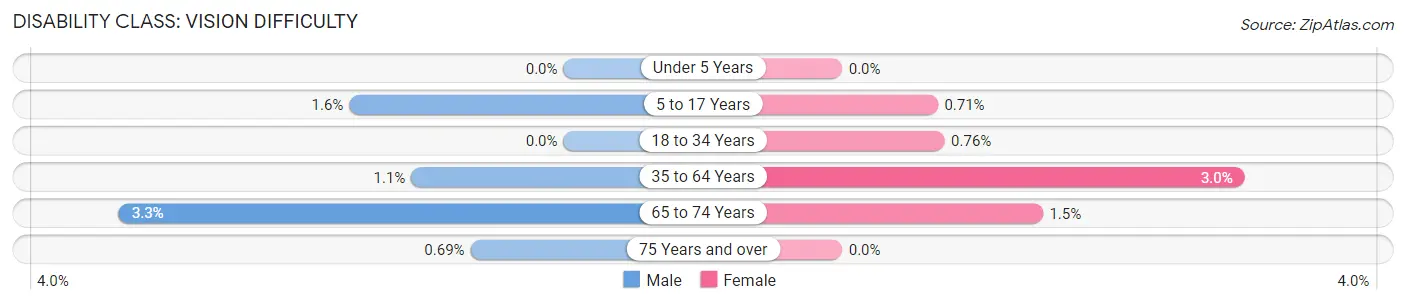
| Age Bracket | Male | Female |
| Under 5 Years | 0 (0.0%) | 0 (0.0%) |
| 5 to 17 Years | 51 (1.6%) | 22 (0.7%) |
| 18 to 34 Years | 0 (0.0%) | 16 (0.8%) |
| 35 to 64 Years | 54 (1.1%) | 183 (3.0%) |
| 65 to 74 Years | 65 (3.3%) | 29 (1.5%) |
| 75 Years and over | 8 (0.7%) | 0 (0.0%) |
Disability Class: Cognitive Difficulty
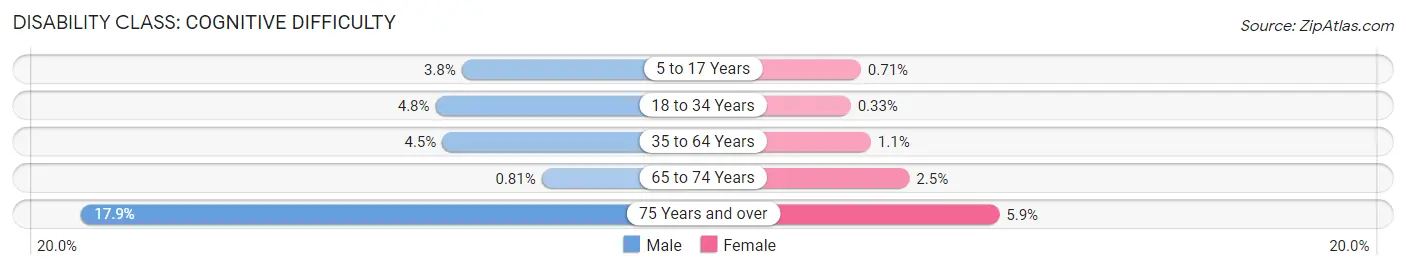
| Age Bracket | Male | Female |
| 5 to 17 Years | 121 (3.8%) | 22 (0.7%) |
| 18 to 34 Years | 121 (4.8%) | 7 (0.3%) |
| 35 to 64 Years | 214 (4.5%) | 66 (1.1%) |
| 65 to 74 Years | 16 (0.8%) | 49 (2.5%) |
| 75 Years and over | 207 (17.9%) | 51 (5.9%) |
Disability Class: Ambulatory Difficulty
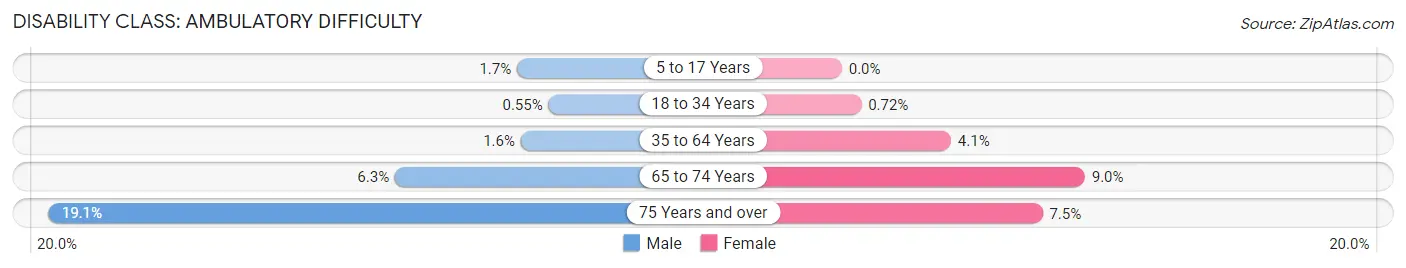
| Age Bracket | Male | Female |
| 5 to 17 Years | 55 (1.7%) | 0 (0.0%) |
| 18 to 34 Years | 14 (0.5%) | 15 (0.7%) |
| 35 to 64 Years | 75 (1.6%) | 248 (4.1%) |
| 65 to 74 Years | 123 (6.2%) | 176 (9.0%) |
| 75 Years and over | 221 (19.1%) | 65 (7.4%) |
Disability Class: Self-Care Difficulty
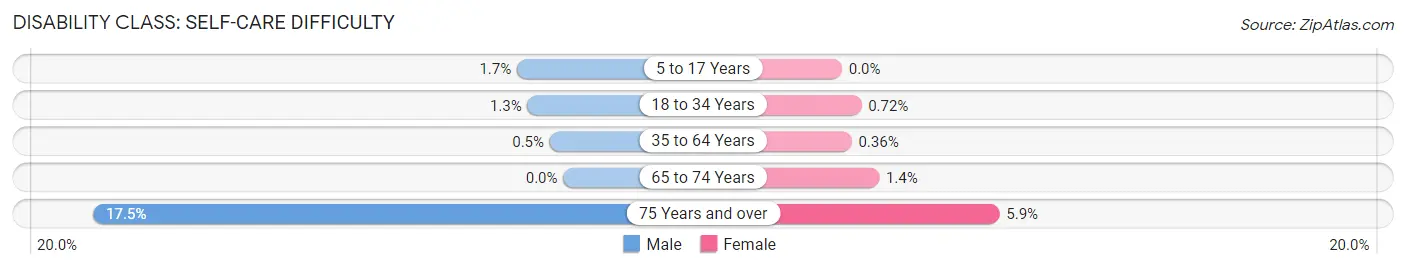
| Age Bracket | Male | Female |
| 5 to 17 Years | 55 (1.7%) | 0 (0.0%) |
| 18 to 34 Years | 34 (1.3%) | 15 (0.7%) |
| 35 to 64 Years | 24 (0.5%) | 22 (0.4%) |
| 65 to 74 Years | 0 (0.0%) | 27 (1.4%) |
| 75 Years and over | 202 (17.5%) | 51 (5.9%) |
Technology Access in Bluffton
Computing Device Access in Bluffton
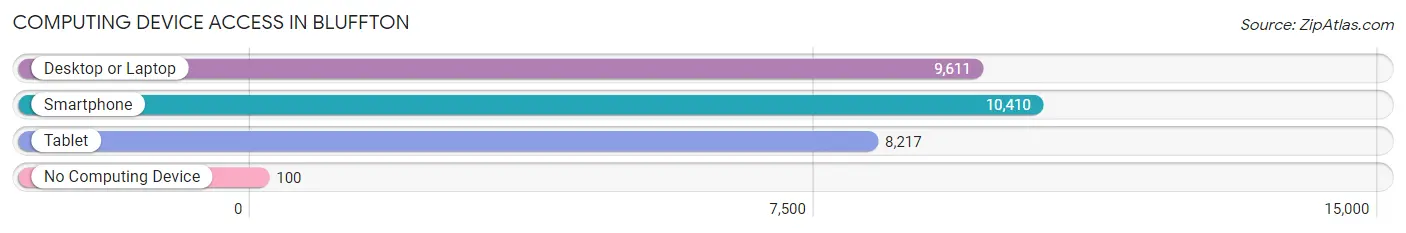
| Device Type | # Households | % Households |
| Desktop or Laptop | 9,611 | 89.9% |
| Smartphone | 10,410 | 97.4% |
| Tablet | 8,217 | 76.9% |
| No Computing Device | 100 | 0.9% |
| Total | 10,685 | 100.0% |
Internet Access in Bluffton
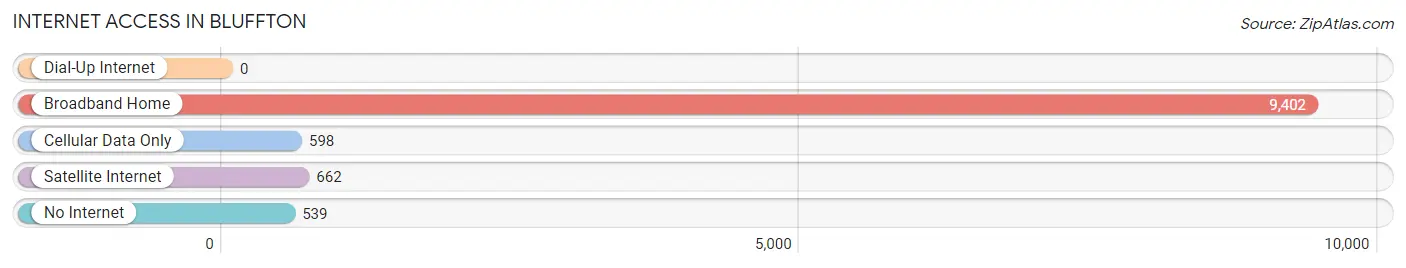
| Internet Type | # Households | % Households |
| Dial-Up Internet | 0 | 0.0% |
| Broadband Home | 9,402 | 88.0% |
| Cellular Data Only | 598 | 5.6% |
| Satellite Internet | 662 | 6.2% |
| No Internet | 539 | 5.0% |
| Total | 10,685 | 100.0% |
Bluffton Summary
Bluffton, South Carolina is a small town located in Beaufort County, South Carolina. It is situated on the banks of the May River, which is part of the Intracoastal Waterway. Bluffton is a popular tourist destination due to its historic downtown area, which is home to many shops, restaurants, and galleries. The town is also known for its natural beauty, with its lush forests, marshlands, and rivers.
Geography
Bluffton is located in the Lowcountry region of South Carolina, which is characterized by its flat terrain and coastal marshes. The town is situated on the banks of the May River, which is part of the Intracoastal Waterway. Bluffton is bordered by the towns of Hilton Head Island, Port Royal, and Beaufort. The town is located approximately 30 miles south of Savannah, Georgia and 40 miles north of Charleston, South Carolina.
The town of Bluffton is divided into two distinct areas: the historic downtown area and the newer residential area. The downtown area is home to many shops, restaurants, and galleries, as well as the historic Bluffton Oyster Factory. The residential area is made up of a variety of neighborhoods, including the Old Town Historic District, the New Town Historic District, and the May River Plantation.
Economy
The economy of Bluffton is largely based on tourism and retail. The town is home to many shops, restaurants, and galleries, as well as the historic Bluffton Oyster Factory. The town is also home to several large employers, including the Bluffton Regional Medical Center, the Bluffton University, and the Bluffton-Okatie Regional Airport.
Demographics
As of the 2010 census, the population of Bluffton was 12,530. The racial makeup of the town was 79.2% White, 14.3% African American, 0.3% Native American, 2.2% Asian, 0.1% Pacific Islander, 1.7% from other races, and 2.5% from two or more races. Hispanic or Latino of any race were 4.2% of the population.
The median income for a household in Bluffton was $50,945, and the median income for a family was $60,945. The per capita income for the town was $27,945. About 8.2% of families and 10.3% of the population were below the poverty line, including 14.2% of those under age 18 and 6.2% of those age 65 or over.
Conclusion
Bluffton, South Carolina is a small town located in Beaufort County, South Carolina. It is situated on the banks of the May River, which is part of the Intracoastal Waterway. Bluffton is a popular tourist destination due to its historic downtown area, which is home to many shops, restaurants, and galleries. The town is also known for its natural beauty, with its lush forests, marshlands, and rivers. The economy of Bluffton is largely based on tourism and retail, and the town is home to several large employers. As of the 2010 census, the population of Bluffton was 12,530, with a median household income of $50,945.
Common Questions
What is Per Capita Income in Bluffton?
Per Capita income in Bluffton is $52,381.
What is the Median Family Income in Bluffton?
Median Family Income in Bluffton is $110,724.
What is the Median Household income in Bluffton?
Median Household Income in Bluffton is $99,575.
What is Income or Wage Gap in Bluffton?
Income or Wage Gap in Bluffton is 27.2%.
Women in Bluffton earn 72.8 cents for every dollar earned by a man.
What is Family Income Deficit in Bluffton?
Family Income Deficit in Bluffton is $11,057.
Families that are below poverty line in Bluffton earn $11,057 less on average than the poverty threshold level.
What is Inequality or Gini Index in Bluffton?
Inequality or Gini Index in Bluffton is 0.46.
What is the Total Population of Bluffton?
Total Population of Bluffton is 29,375.
What is the Total Male Population of Bluffton?
Total Male Population of Bluffton is 14,576.
What is the Total Female Population of Bluffton?
Total Female Population of Bluffton is 14,799.
What is the Ratio of Males per 100 Females in Bluffton?
There are 98.49 Males per 100 Females in Bluffton.
What is the Ratio of Females per 100 Males in Bluffton?
There are 101.53 Females per 100 Males in Bluffton.
What is the Median Population Age in Bluffton?
Median Population Age in Bluffton is 40.9 Years.
What is the Average Family Size in Bluffton
Average Family Size in Bluffton is 3.1 People.
What is the Average Household Size in Bluffton
Average Household Size in Bluffton is 2.7 People.
How Large is the Labor Force in Bluffton?
There are 14,164 People in the Labor Forcein in Bluffton.
What is the Percentage of People in the Labor Force in Bluffton?
61.7% of People are in the Labor Force in Bluffton.
What is the Unemployment Rate in Bluffton?
Unemployment Rate in Bluffton is 1.4%.