Gayle Mill, SC Map & Demographics
Gayle Mill Map
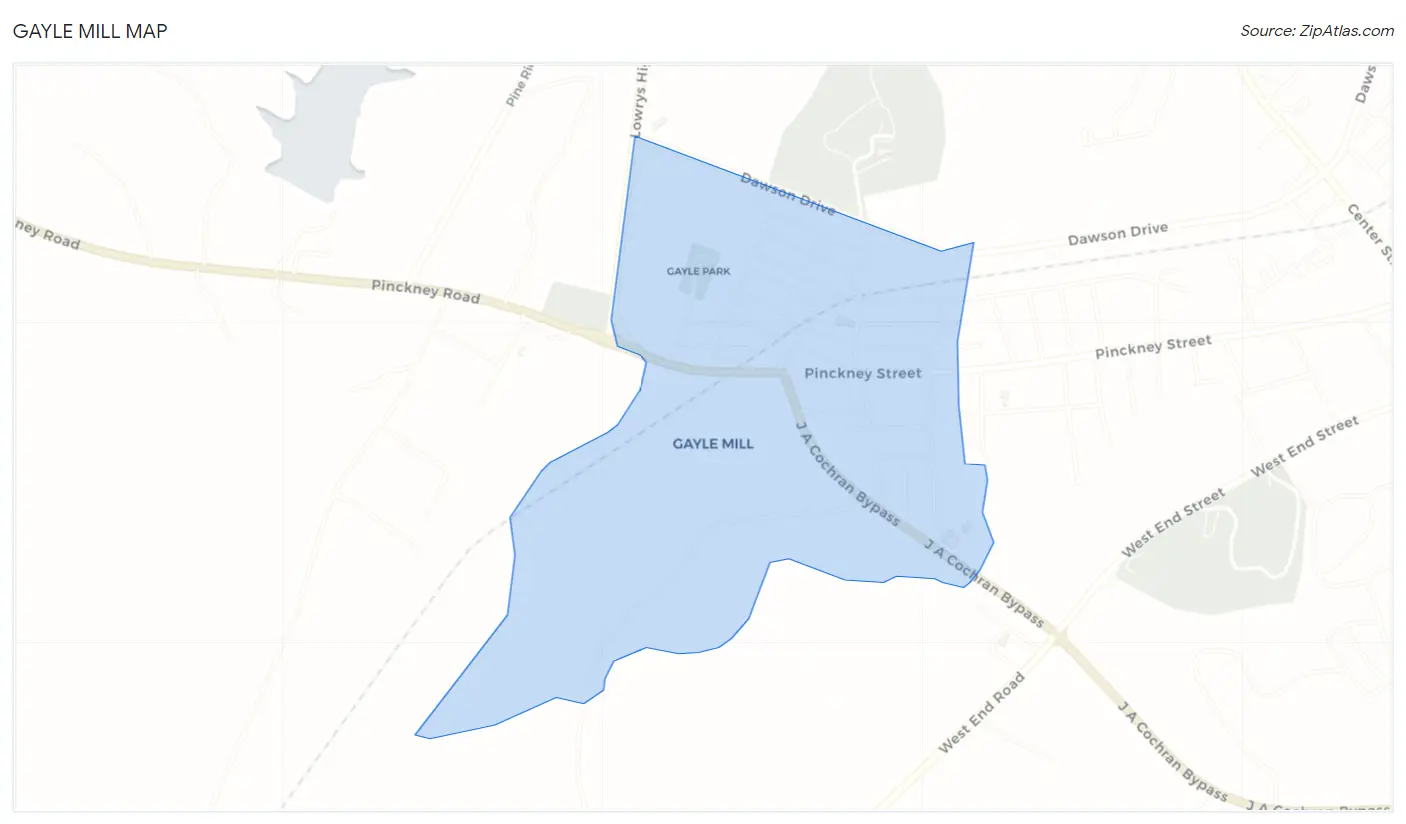
Gayle Mill Overview
$17,947
PER CAPITA INCOME
$73,662
AVG FAMILY INCOME
$74,022
AVG HOUSEHOLD INCOME
37.1%
WAGE / INCOME GAP [ % ]
62.9¢/ $1
WAGE / INCOME GAP [ $ ]
0.28
INEQUALITY / GINI INDEX
1,082
TOTAL POPULATION
503
MALE POPULATION
579
FEMALE POPULATION
86.87
MALES / 100 FEMALES
115.11
FEMALES / 100 MALES
25.6
MEDIAN AGE
3.8
AVG FAMILY SIZE
3.2
AVG HOUSEHOLD SIZE
553
LABOR FORCE [ PEOPLE ]
65.8%
PERCENT IN LABOR FORCE
1.1%
UNEMPLOYMENT RATE
Income in Gayle Mill
Income Overview in Gayle Mill
Per Capita Income in Gayle Mill is $17,947, while median incomes of families and households are $73,662 and $74,022 respectively.
| Characteristic | Number | Measure |
| Per Capita Income | 1,082 | $17,947 |
| Median Family Income | 227 | $73,662 |
| Mean Family Income | 227 | $69,262 |
| Median Household Income | 334 | $74,022 |
| Mean Household Income | 334 | $59,691 |
| Income Deficit | 227 | $0 |
| Wage / Income Gap (%) | 1,082 | 37.12% |
| Wage / Income Gap ($) | 1,082 | 62.88¢ per $1 |
| Gini / Inequality Index | 1,082 | 0.28 |
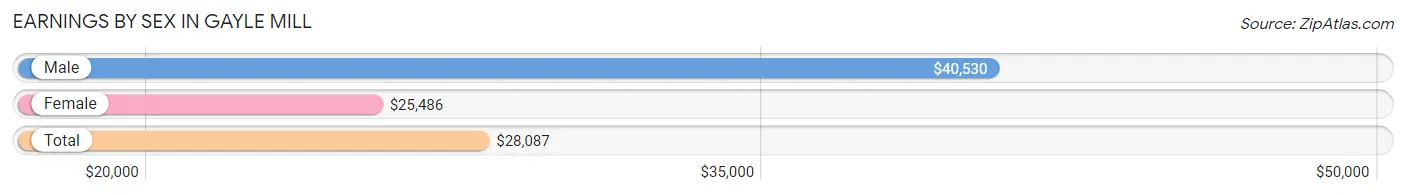
Earnings by Sex in Gayle Mill
Average Earnings in Gayle Mill are $28,087, $40,530 for men and $25,486 for women, a difference of 37.1%.
| Sex | Number | Average Earnings |
| Male | 224 (39.7%) | $40,530 |
| Female | 341 (60.4%) | $25,486 |
| Total | 565 (100.0%) | $28,087 |
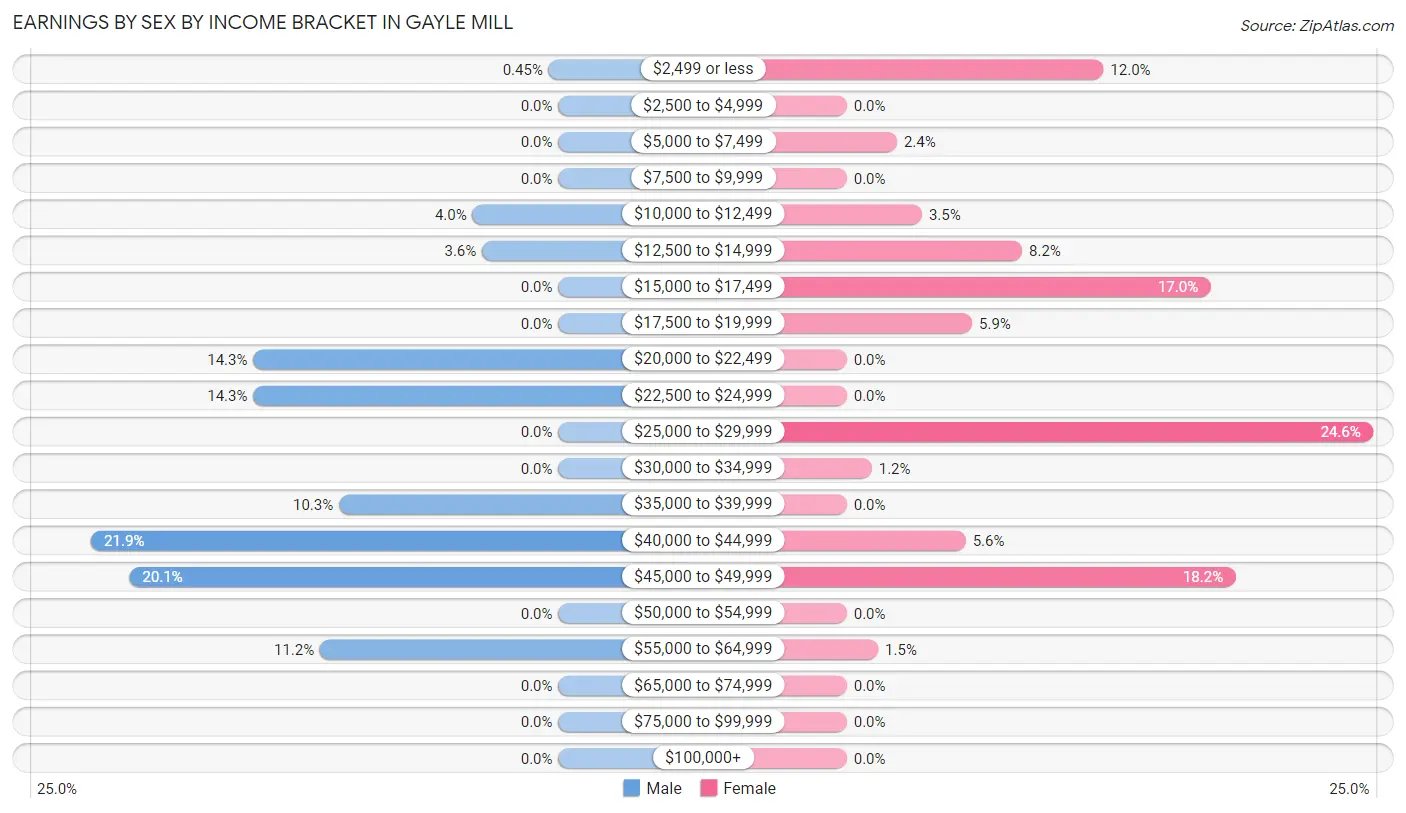
Earnings by Sex by Income Bracket in Gayle Mill
The most common earnings brackets in Gayle Mill are $40,000 to $44,999 for men (49 | 21.9%) and $25,000 to $29,999 for women (84 | 24.6%).
| Income | Male | Female |
| $2,499 or less | 1 (0.4%) | 41 (12.0%) |
| $2,500 to $4,999 | 0 (0.0%) | 0 (0.0%) |
| $5,000 to $7,499 | 0 (0.0%) | 8 (2.4%) |
| $7,500 to $9,999 | 0 (0.0%) | 0 (0.0%) |
| $10,000 to $12,499 | 9 (4.0%) | 12 (3.5%) |
| $12,500 to $14,999 | 8 (3.6%) | 28 (8.2%) |
| $15,000 to $17,499 | 0 (0.0%) | 58 (17.0%) |
| $17,500 to $19,999 | 0 (0.0%) | 20 (5.9%) |
| $20,000 to $22,499 | 32 (14.3%) | 0 (0.0%) |
| $22,500 to $24,999 | 32 (14.3%) | 0 (0.0%) |
| $25,000 to $29,999 | 0 (0.0%) | 84 (24.6%) |
| $30,000 to $34,999 | 0 (0.0%) | 4 (1.2%) |
| $35,000 to $39,999 | 23 (10.3%) | 0 (0.0%) |
| $40,000 to $44,999 | 49 (21.9%) | 19 (5.6%) |
| $45,000 to $49,999 | 45 (20.1%) | 62 (18.2%) |
| $50,000 to $54,999 | 0 (0.0%) | 0 (0.0%) |
| $55,000 to $64,999 | 25 (11.2%) | 5 (1.5%) |
| $65,000 to $74,999 | 0 (0.0%) | 0 (0.0%) |
| $75,000 to $99,999 | 0 (0.0%) | 0 (0.0%) |
| $100,000+ | 0 (0.0%) | 0 (0.0%) |
| Total | 224 (100.0%) | 341 (100.0%) |
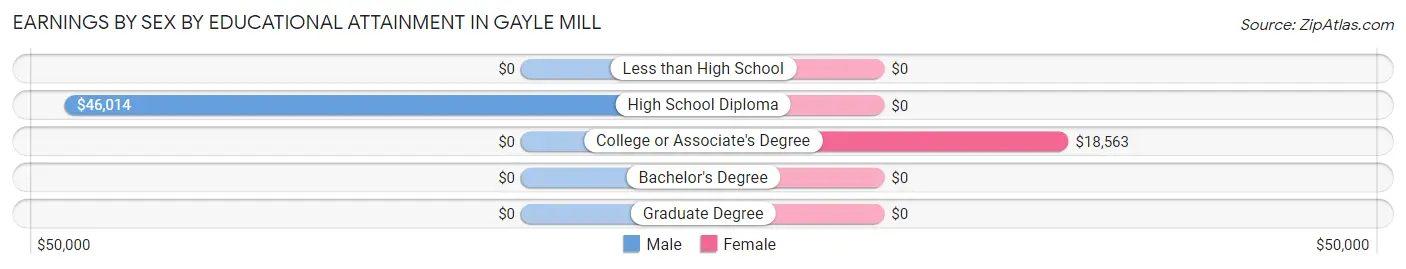
Earnings by Sex by Educational Attainment in Gayle Mill
Average earnings in Gayle Mill are $44,141 for men and $27,727 for women, a difference of 37.2%. Men with an educational attainment of high school diploma enjoy the highest average annual earnings of $46,014, while those with high school diploma education earn the least with $46,014. Women with an educational attainment of college or associate's degree earn the most with the average annual earnings of $18,563, while those with college or associate's degree education have the smallest earnings of $18,563.
| Educational Attainment | Male Income | Female Income |
| Less than High School | - | - |
| High School Diploma | $46,014 | $0 |
| College or Associate's Degree | - | - |
| Bachelor's Degree | - | - |
| Graduate Degree | - | - |
| Total | $44,141 | $27,727 |
Family Income in Gayle Mill
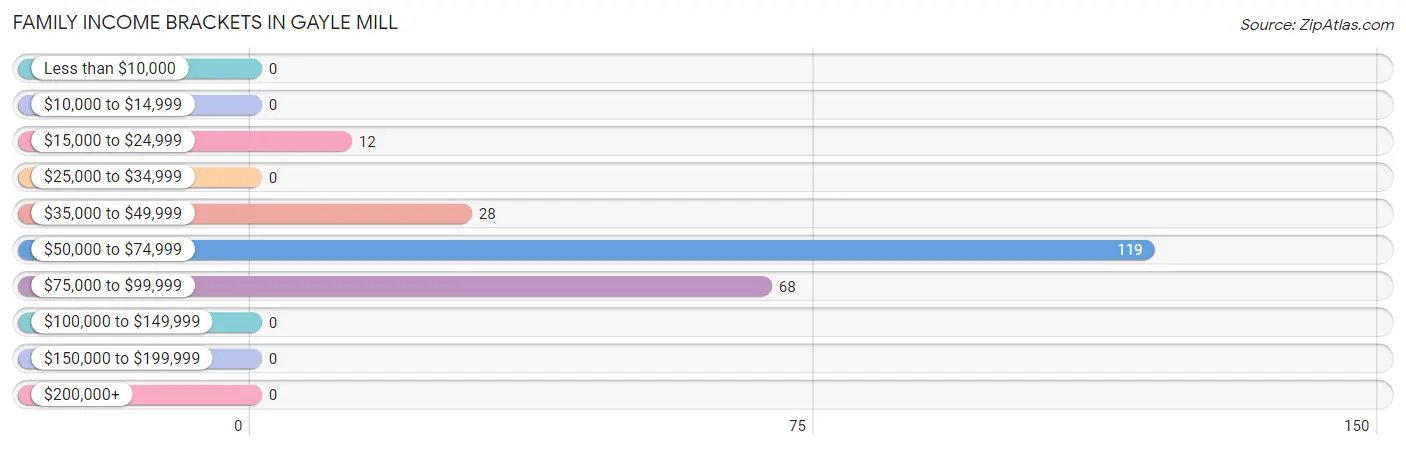
Family Income Brackets in Gayle Mill
According to the Gayle Mill family income data, there are 119 families falling into the $50,000 to $74,999 income range, which is the most common income bracket and makes up 52.4% of all families.
| Income Bracket | # Families | % Families |
| Less than $10,000 | 0 | 0.0% |
| $10,000 to $14,999 | 0 | 0.0% |
| $15,000 to $24,999 | 12 | 5.3% |
| $25,000 to $34,999 | 0 | 0.0% |
| $35,000 to $49,999 | 28 | 12.3% |
| $50,000 to $74,999 | 119 | 52.4% |
| $75,000 to $99,999 | 68 | 30.0% |
| $100,000 to $149,999 | 0 | 0.0% |
| $150,000 to $199,999 | 0 | 0.0% |
| $200,000+ | 0 | 0.0% |
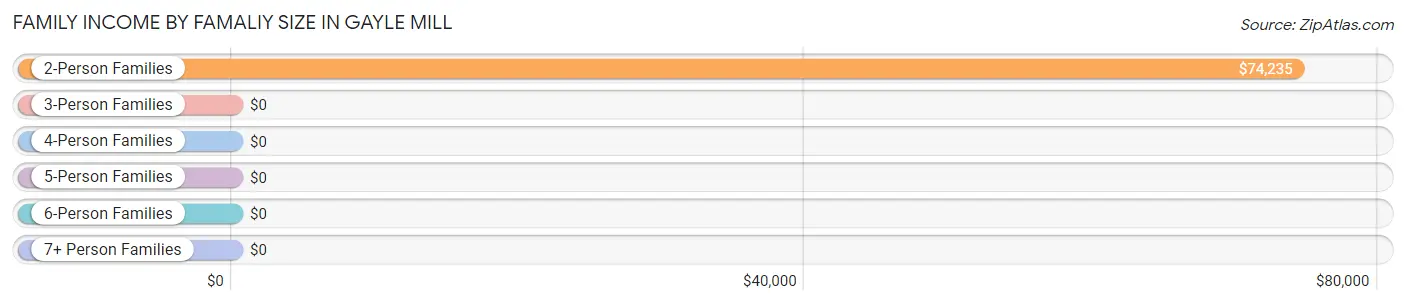
Family Income by Famaliy Size in Gayle Mill
2-person families (154 | 67.8%) account for the highest median family income in Gayle Mill with $74,235 per family, while 2-person families (154 | 67.8%) have the highest median income of $37,118 per family member.
| Income Bracket | # Families | Median Income |
| 2-Person Families | 154 (67.8%) | $74,235 |
| 3-Person Families | 24 (10.6%) | $0 |
| 4-Person Families | 0 (0.0%) | $0 |
| 5-Person Families | 32 (14.1%) | $0 |
| 6-Person Families | 12 (5.3%) | $0 |
| 7+ Person Families | 5 (2.2%) | $0 |
| Total | 227 (100.0%) | $73,662 |
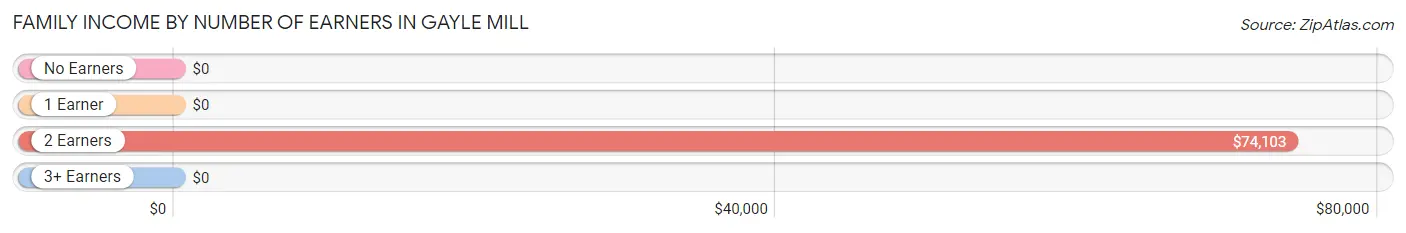
Family Income by Number of Earners in Gayle Mill
| Number of Earners | # Families | Median Income |
| No Earners | 0 (0.0%) | $0 |
| 1 Earner | 30 (13.2%) | $0 |
| 2 Earners | 197 (86.8%) | $74,103 |
| 3+ Earners | 0 (0.0%) | $0 |
| Total | 227 (100.0%) | $73,662 |
Household Income in Gayle Mill
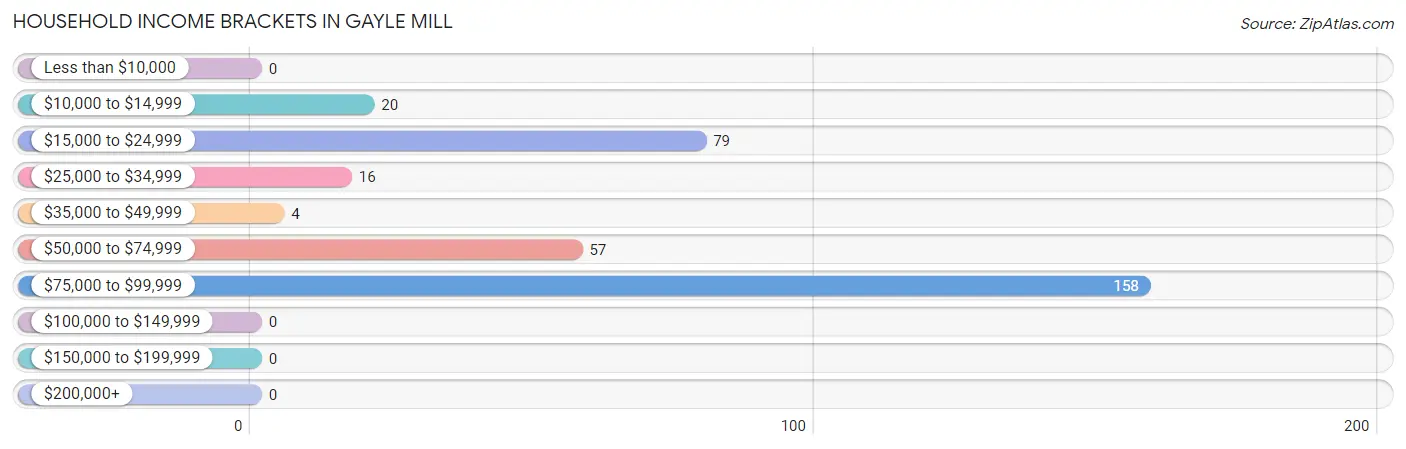
Household Income Brackets in Gayle Mill
With 158 households falling in the category, the $75,000 to $99,999 income range is the most frequent in Gayle Mill, accounting for 47.3% of all households.
| Income Bracket | # Households | % Households |
| Less than $10,000 | 0 | 0.0% |
| $10,000 to $14,999 | 20 | 6.0% |
| $15,000 to $24,999 | 79 | 23.7% |
| $25,000 to $34,999 | 16 | 4.8% |
| $35,000 to $49,999 | 4 | 1.2% |
| $50,000 to $74,999 | 57 | 17.1% |
| $75,000 to $99,999 | 158 | 47.3% |
| $100,000 to $149,999 | 0 | 0.0% |
| $150,000 to $199,999 | 0 | 0.0% |
| $200,000+ | 0 | 0.0% |
Household Income by Householder Age in Gayle Mill
The median household income in Gayle Mill is $74,022, with the highest median household income of $90,580 found in the 25 to 44 years age bracket for the primary householder. A total of 61 households (18.3%) fall into this category. Meanwhile, the 15 to 24 years age bracket for the primary householder has the lowest median household income of $0, with 32 households (9.6%) in this group.
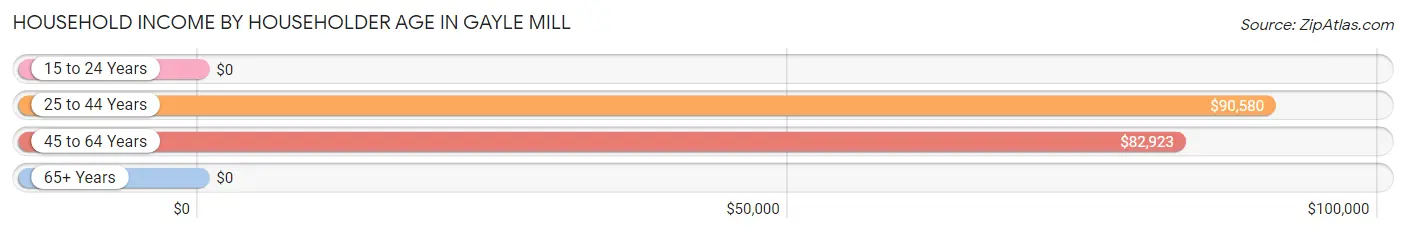
| Income Bracket | # Households | Median Income |
| 15 to 24 Years | 32 (9.6%) | $0 |
| 25 to 44 Years | 61 (18.3%) | $90,580 |
| 45 to 64 Years | 156 (46.7%) | $82,923 |
| 65+ Years | 85 (25.5%) | $0 |
| Total | 334 (100.0%) | $74,022 |
Poverty in Gayle Mill
Income Below Poverty by Sex and Age in Gayle Mill
With 31.2% poverty level for males and 18.5% for females among the residents of Gayle Mill, 16 and 17 year old males and 15 year old females are the most vulnerable to poverty, with 83 males (90.2%) and 42 females (100.0%) in their respective age groups living below the poverty level.
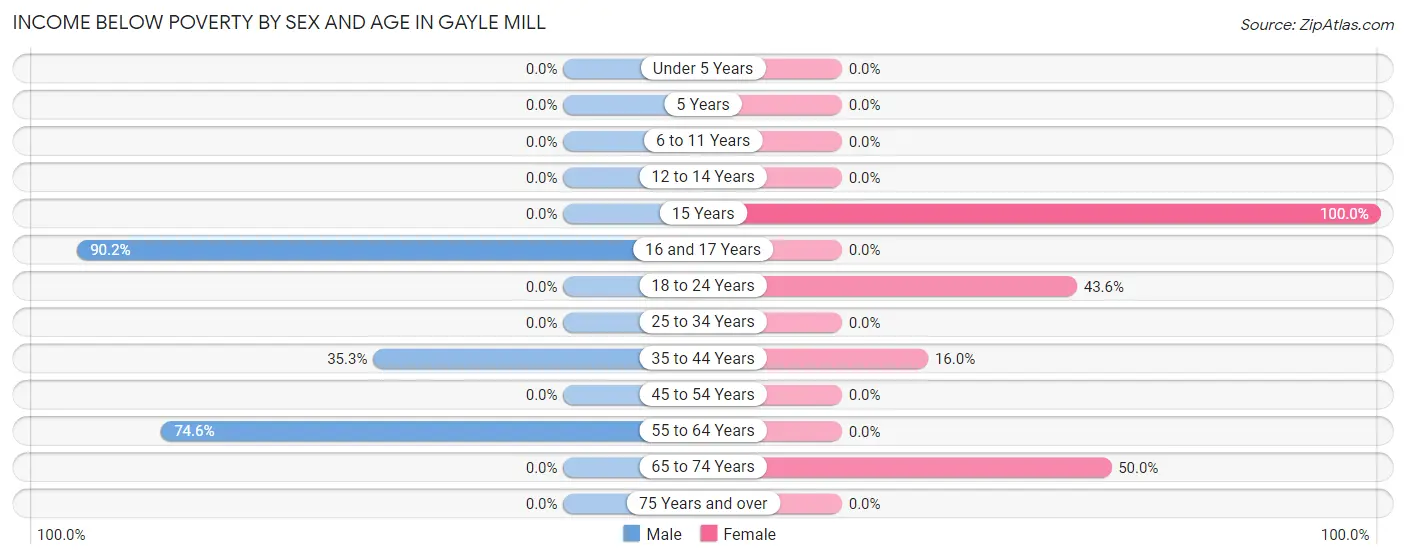
| Age Bracket | Male | Female |
| Under 5 Years | 0 (0.0%) | 0 (0.0%) |
| 5 Years | 0 (0.0%) | 0 (0.0%) |
| 6 to 11 Years | 0 (0.0%) | 0 (0.0%) |
| 12 to 14 Years | 0 (0.0%) | 0 (0.0%) |
| 15 Years | 0 (0.0%) | 42 (100.0%) |
| 16 and 17 Years | 83 (90.2%) | 0 (0.0%) |
| 18 to 24 Years | 0 (0.0%) | 41 (43.6%) |
| 25 to 34 Years | 0 (0.0%) | 0 (0.0%) |
| 35 to 44 Years | 24 (35.3%) | 12 (16.0%) |
| 45 to 54 Years | 0 (0.0%) | 0 (0.0%) |
| 55 to 64 Years | 50 (74.6%) | 0 (0.0%) |
| 65 to 74 Years | 0 (0.0%) | 12 (50.0%) |
| 75 Years and over | 0 (0.0%) | 0 (0.0%) |
| Total | 157 (31.2%) | 107 (18.5%) |
Income Above Poverty by Sex and Age in Gayle Mill
According to the poverty statistics in Gayle Mill, males aged under 5 years and females aged under 5 years are the age groups that are most secure financially, with 100.0% of males and 100.0% of females in these age groups living above the poverty line.
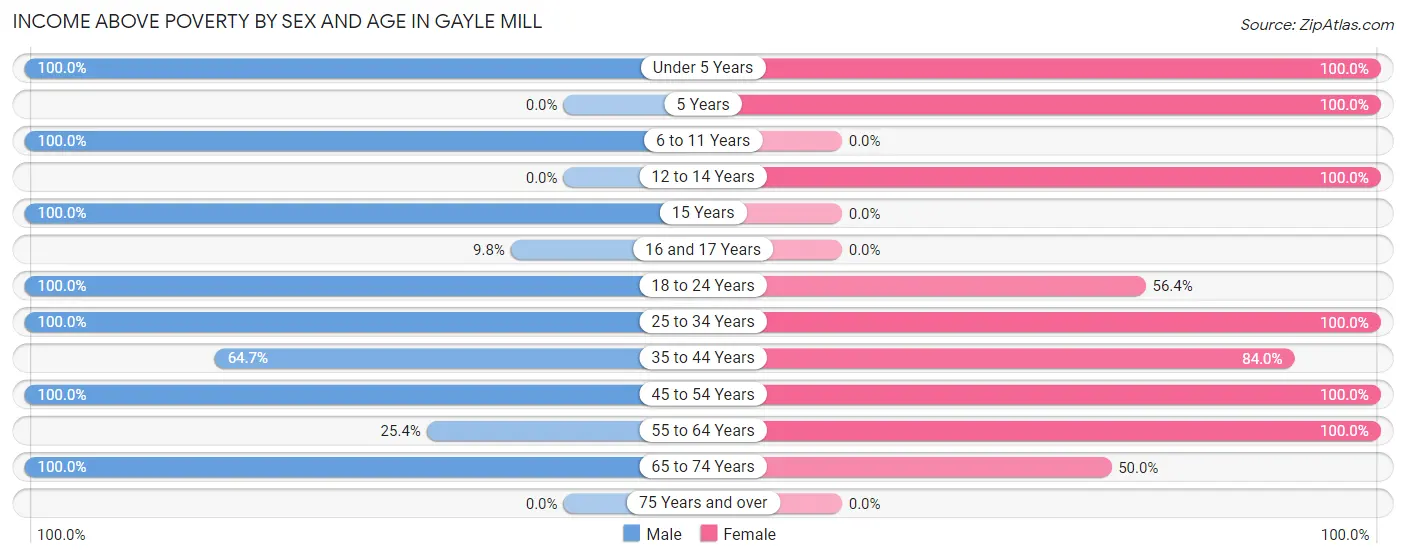
| Age Bracket | Male | Female |
| Under 5 Years | 69 (100.0%) | 55 (100.0%) |
| 5 Years | 0 (0.0%) | 13 (100.0%) |
| 6 to 11 Years | 16 (100.0%) | 0 (0.0%) |
| 12 to 14 Years | 0 (0.0%) | 41 (100.0%) |
| 15 Years | 6 (100.0%) | 0 (0.0%) |
| 16 and 17 Years | 9 (9.8%) | 0 (0.0%) |
| 18 to 24 Years | 76 (100.0%) | 53 (56.4%) |
| 25 to 34 Years | 6 (100.0%) | 58 (100.0%) |
| 35 to 44 Years | 44 (64.7%) | 63 (84.0%) |
| 45 to 54 Years | 34 (100.0%) | 104 (100.0%) |
| 55 to 64 Years | 17 (25.4%) | 73 (100.0%) |
| 65 to 74 Years | 69 (100.0%) | 12 (50.0%) |
| 75 Years and over | 0 (0.0%) | 0 (0.0%) |
| Total | 346 (68.8%) | 472 (81.5%) |
Income Below Poverty Among Married-Couple Families in Gayle Mill
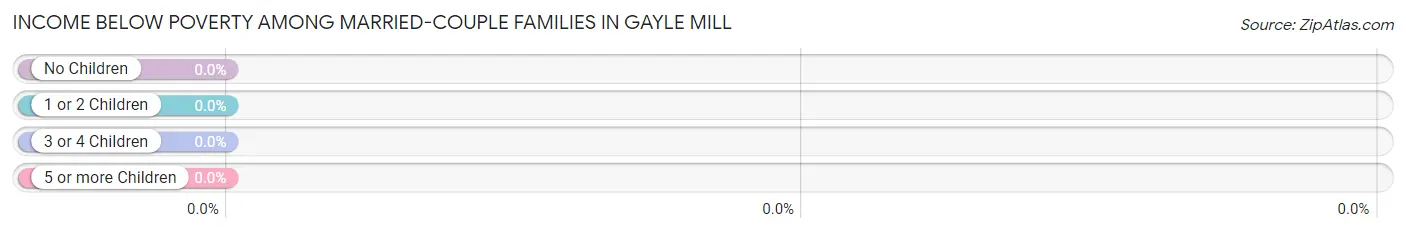
| Children | Above Poverty | Below Poverty |
| No Children | 83 (100.0%) | 0 (0.0%) |
| 1 or 2 Children | 20 (100.0%) | 0 (0.0%) |
| 3 or 4 Children | 0 (0.0%) | 0 (0.0%) |
| 5 or more Children | 0 (0.0%) | 0 (0.0%) |
| Total | 103 (100.0%) | 0 (0.0%) |
Income Below Poverty Among Single-Parent Households in Gayle Mill
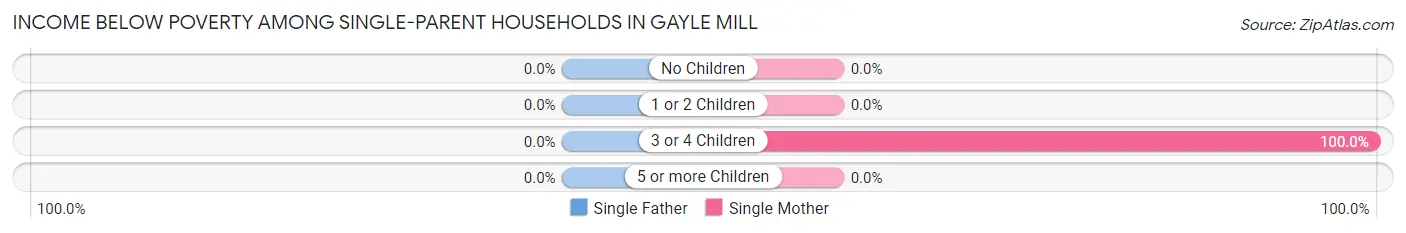
| Children | Single Father | Single Mother |
| No Children | 0 (0.0%) | 0 (0.0%) |
| 1 or 2 Children | 0 (0.0%) | 0 (0.0%) |
| 3 or 4 Children | 0 (0.0%) | 12 (100.0%) |
| 5 or more Children | 0 (0.0%) | 0 (0.0%) |
| Total | 0 (0.0%) | 12 (10.4%) |
Income Below Poverty Among Married-Couple vs Single-Parent Households in Gayle Mill
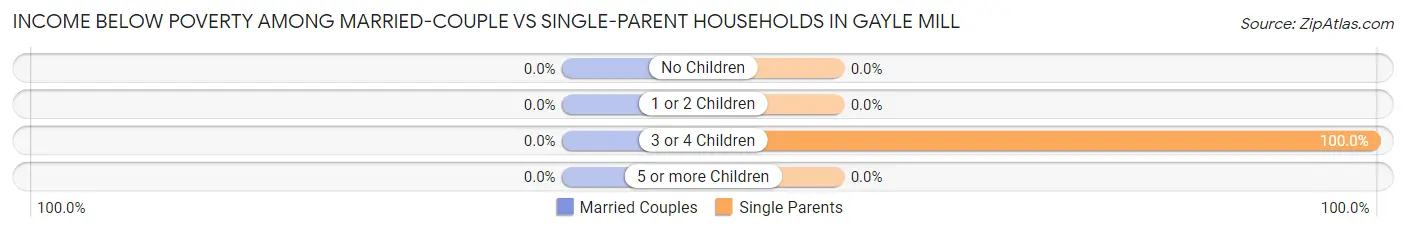
| Children | Married-Couple Families | Single-Parent Households |
| No Children | 0 (0.0%) | 0 (0.0%) |
| 1 or 2 Children | 0 (0.0%) | 0 (0.0%) |
| 3 or 4 Children | 0 (0.0%) | 12 (100.0%) |
| 5 or more Children | 0 (0.0%) | 0 (0.0%) |
| Total | 0 (0.0%) | 12 (9.7%) |
Race in Gayle Mill
The most populous races in Gayle Mill are White / Caucasian (589 | 54.4%), Black / African American (493 | 45.6%), and Hispanic or Latino (149 | 13.8%).
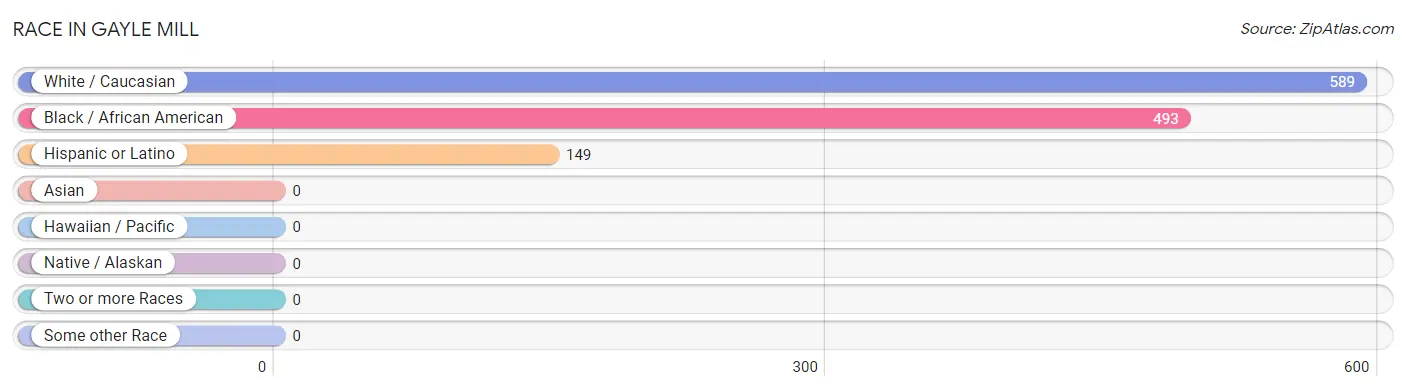
| Race | # Population | % Population |
| Asian | 0 | 0.0% |
| Black / African American | 493 | 45.6% |
| Hawaiian / Pacific | 0 | 0.0% |
| Hispanic or Latino | 149 | 13.8% |
| Native / Alaskan | 0 | 0.0% |
| White / Caucasian | 589 | 54.4% |
| Two or more Races | 0 | 0.0% |
| Some other Race | 0 | 0.0% |
| Total | 1,082 | 100.0% |
Ancestry in Gayle Mill
The most populous ancestries reported in Gayle Mill are African (286 | 26.4%), Subsaharan African (286 | 26.4%), English (227 | 21.0%), Mexican (149 | 13.8%), and German (111 | 10.3%), together accounting for 97.9% of all Gayle Mill residents.
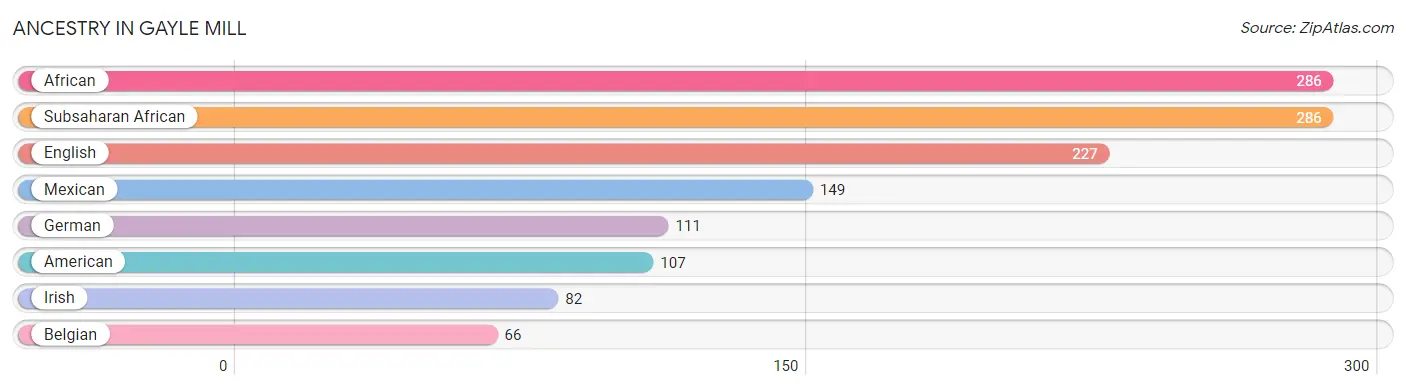
| Ancestry | # Population | % Population |
| African | 286 | 26.4% |
| American | 107 | 9.9% |
| Belgian | 66 | 6.1% |
| English | 227 | 21.0% |
| German | 111 | 10.3% |
| Irish | 82 | 7.6% |
| Mexican | 149 | 13.8% |
| Subsaharan African | 286 | 26.4% | View All 8 Rows |
Immigrants in Gayle Mill

| Immigration Origin | # Population | % Population | View All 0 Rows |
Sex and Age in Gayle Mill
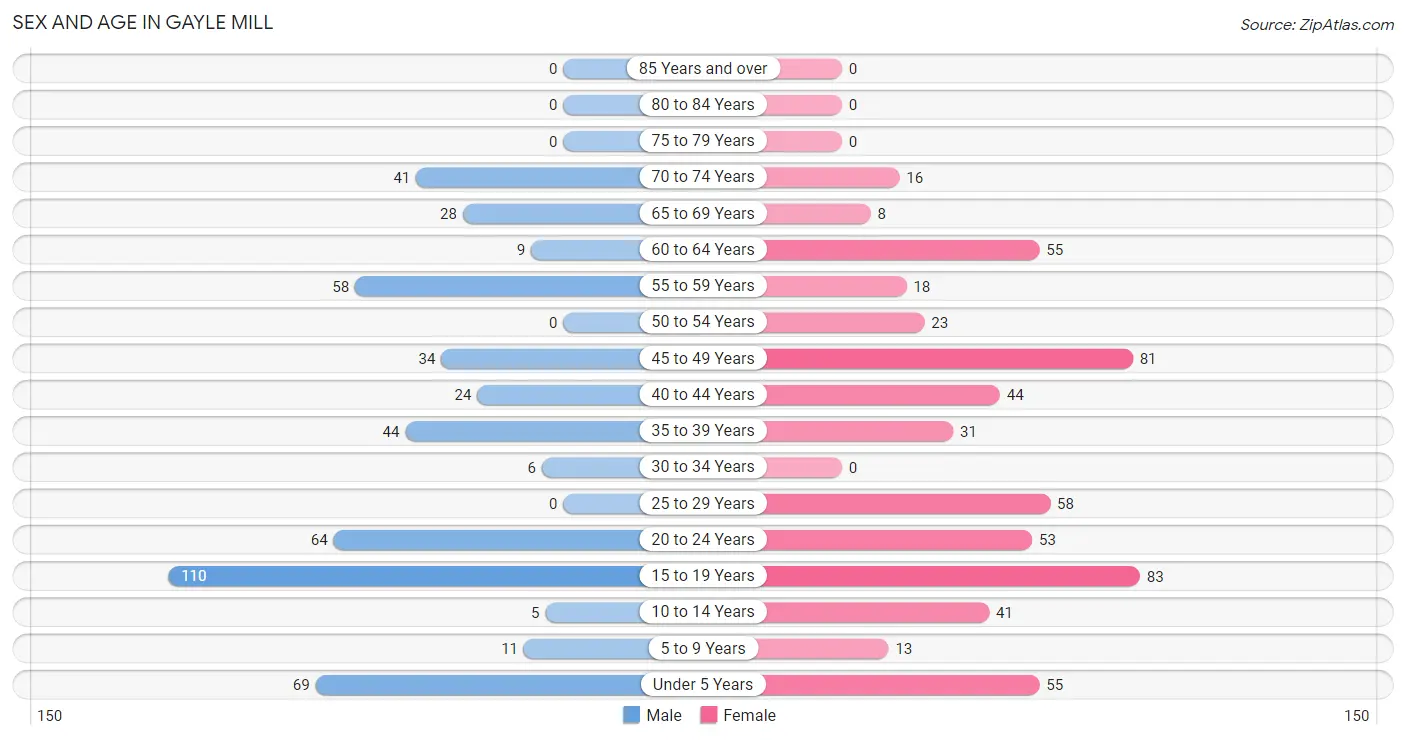
Sex and Age in Gayle Mill
The most populous age groups in Gayle Mill are 15 to 19 Years (110 | 21.9%) for men and 15 to 19 Years (83 | 14.3%) for women.
| Age Bracket | Male | Female |
| Under 5 Years | 69 (13.7%) | 55 (9.5%) |
| 5 to 9 Years | 11 (2.2%) | 13 (2.2%) |
| 10 to 14 Years | 5 (1.0%) | 41 (7.1%) |
| 15 to 19 Years | 110 (21.9%) | 83 (14.3%) |
| 20 to 24 Years | 64 (12.7%) | 53 (9.1%) |
| 25 to 29 Years | 0 (0.0%) | 58 (10.0%) |
| 30 to 34 Years | 6 (1.2%) | 0 (0.0%) |
| 35 to 39 Years | 44 (8.7%) | 31 (5.3%) |
| 40 to 44 Years | 24 (4.8%) | 44 (7.6%) |
| 45 to 49 Years | 34 (6.8%) | 81 (14.0%) |
| 50 to 54 Years | 0 (0.0%) | 23 (4.0%) |
| 55 to 59 Years | 58 (11.5%) | 18 (3.1%) |
| 60 to 64 Years | 9 (1.8%) | 55 (9.5%) |
| 65 to 69 Years | 28 (5.6%) | 8 (1.4%) |
| 70 to 74 Years | 41 (8.2%) | 16 (2.8%) |
| 75 to 79 Years | 0 (0.0%) | 0 (0.0%) |
| 80 to 84 Years | 0 (0.0%) | 0 (0.0%) |
| 85 Years and over | 0 (0.0%) | 0 (0.0%) |
| Total | 503 (100.0%) | 579 (100.0%) |
Families and Households in Gayle Mill
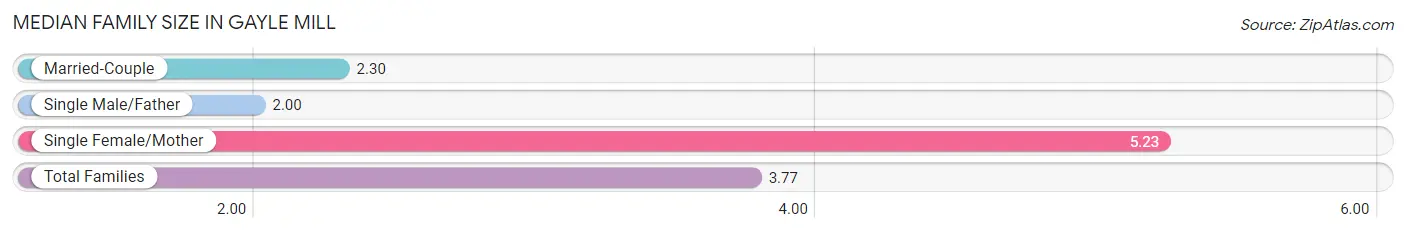
Median Family Size in Gayle Mill
The median family size in Gayle Mill is 3.77 persons per family, with single female/mother families (115 | 50.7%) accounting for the largest median family size of 5.23 persons per family. On the other hand, single male/father families (9 | 4.0%) represent the smallest median family size with 2.00 persons per family.
| Family Type | # Families | Family Size |
| Married-Couple | 103 (45.4%) | 2.30 |
| Single Male/Father | 9 (4.0%) | 2.00 |
| Single Female/Mother | 115 (50.7%) | 5.23 |
| Total Families | 227 (100.0%) | 3.77 |
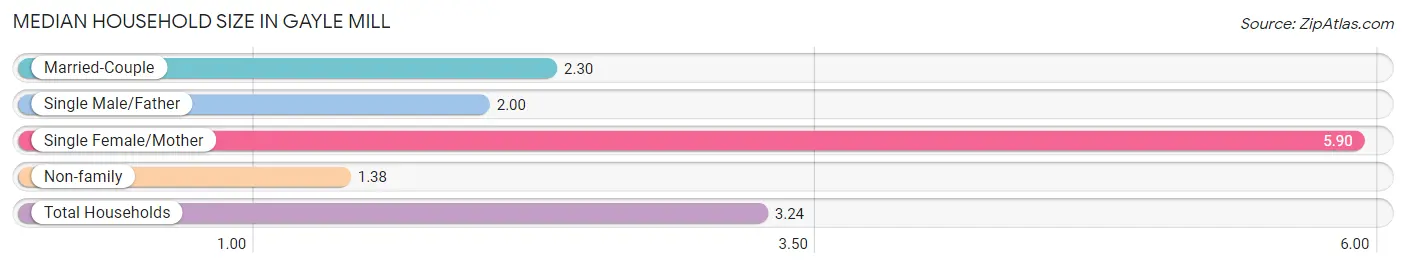
Median Household Size in Gayle Mill
The median household size in Gayle Mill is 3.24 persons per household, with single female/mother households (115 | 34.4%) accounting for the largest median household size of 5.9 persons per household. non-family households (107 | 32.0%) represent the smallest median household size with 1.38 persons per household.
| Household Type | # Households | Household Size |
| Married-Couple | 103 (30.8%) | 2.30 |
| Single Male/Father | 9 (2.7%) | 2.00 |
| Single Female/Mother | 115 (34.4%) | 5.90 |
| Non-family | 107 (32.0%) | 1.38 |
| Total Households | 334 (100.0%) | 3.24 |
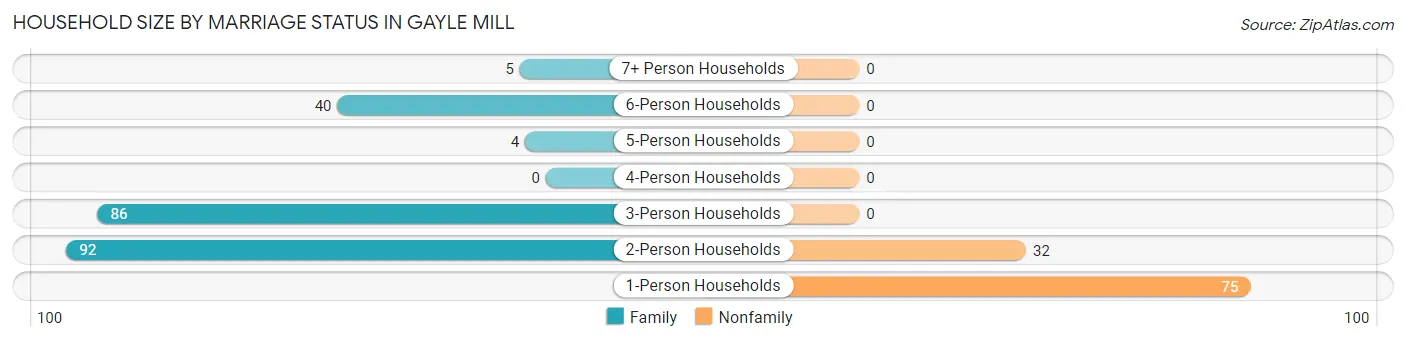
Household Size by Marriage Status in Gayle Mill
Out of a total of 334 households in Gayle Mill, 227 (68.0%) are family households, while 107 (32.0%) are nonfamily households. The most numerous type of family households are 2-person households, comprising 92, and the most common type of nonfamily households are 1-person households, comprising 75.
| Household Size | Family Households | Nonfamily Households |
| 1-Person Households | - | 75 (22.5%) |
| 2-Person Households | 92 (27.5%) | 32 (9.6%) |
| 3-Person Households | 86 (25.8%) | 0 (0.0%) |
| 4-Person Households | 0 (0.0%) | 0 (0.0%) |
| 5-Person Households | 4 (1.2%) | 0 (0.0%) |
| 6-Person Households | 40 (12.0%) | 0 (0.0%) |
| 7+ Person Households | 5 (1.5%) | 0 (0.0%) |
| Total | 227 (68.0%) | 107 (32.0%) |
Female Fertility in Gayle Mill
Fertility by Age in Gayle Mill
Average fertility rate in Gayle Mill is 166.0 births per 1,000 women. Women in the age bracket of 20 to 34 years have the highest fertility rate with 477.0 births per 1,000 women. Women in the age bracket of 20 to 34 years acount for 91.4% of all women with births.
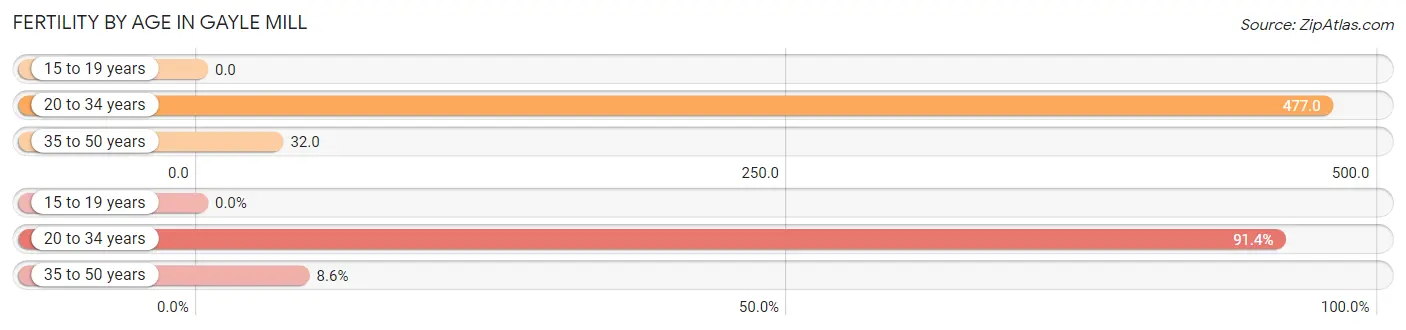
| Age Bracket | Women with Births | Births / 1,000 Women |
| 15 to 19 years | 0 (0.0%) | 0.0 |
| 20 to 34 years | 53 (91.4%) | 477.0 |
| 35 to 50 years | 5 (8.6%) | 32.0 |
| Total | 58 (100.0%) | 166.0 |
Fertility by Age by Marriage Status in Gayle Mill
8.6% of women with births (58) in Gayle Mill are married. The highest percentage of unmarried women with births falls into 20 to 34 years age bracket with 100.0% of them unmarried at the time of birth, while the lowest percentage of unmarried women with births belong to 35 to 50 years age bracket with 0.0% of them unmarried.
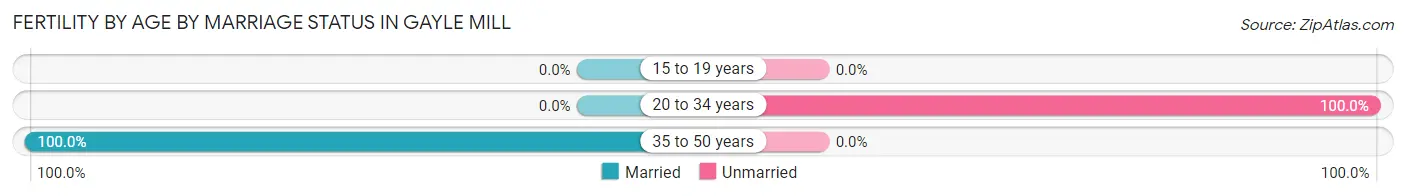
| Age Bracket | Married | Unmarried |
| 15 to 19 years | 0 (0.0%) | 0 (0.0%) |
| 20 to 34 years | 0 (0.0%) | 53 (100.0%) |
| 35 to 50 years | 5 (100.0%) | 0 (0.0%) |
| Total | 5 (8.6%) | 53 (91.4%) |
Fertility by Education in Gayle Mill
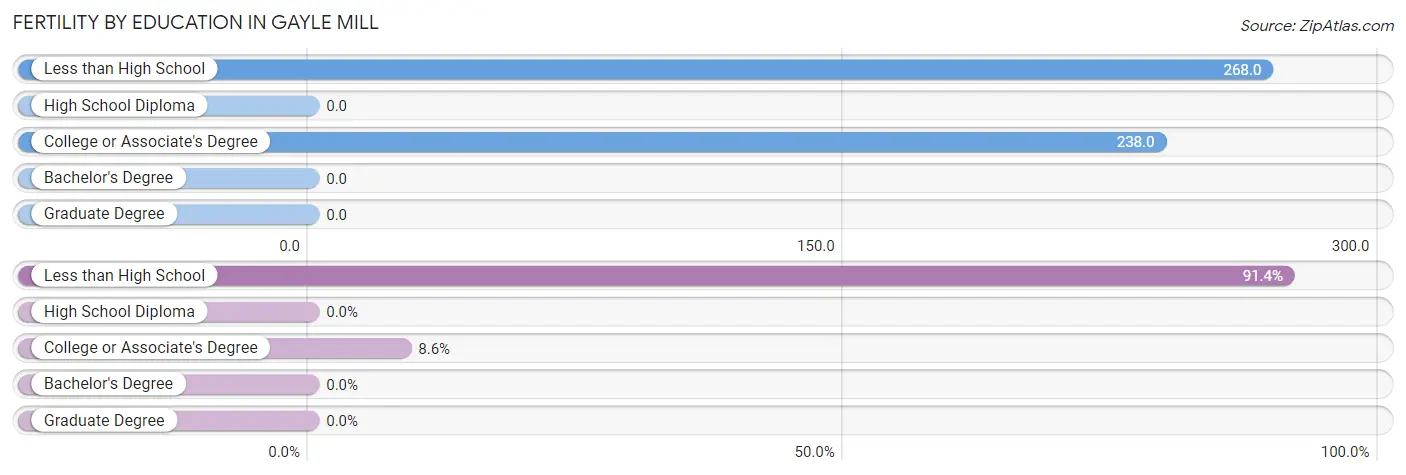
| Educational Attainment | Women with Births | Births / 1,000 Women |
| Less than High School | 53 (91.4%) | 268.0 |
| High School Diploma | 0 (0.0%) | 0.0 |
| College or Associate's Degree | 5 (8.6%) | 238.0 |
| Bachelor's Degree | 0 (0.0%) | 0.0 |
| Graduate Degree | 0 (0.0%) | 0.0 |
| Total | 58 (100.0%) | 166.0 |
Fertility by Education by Marriage Status in Gayle Mill
91.4% of women with births in Gayle Mill are unmarried. Women with the educational attainment of college or associate's degree are most likely to be married with 100.0% of them married at childbirth, while women with the educational attainment of less than high school are least likely to be married with 100.0% of them unmarried at childbirth.
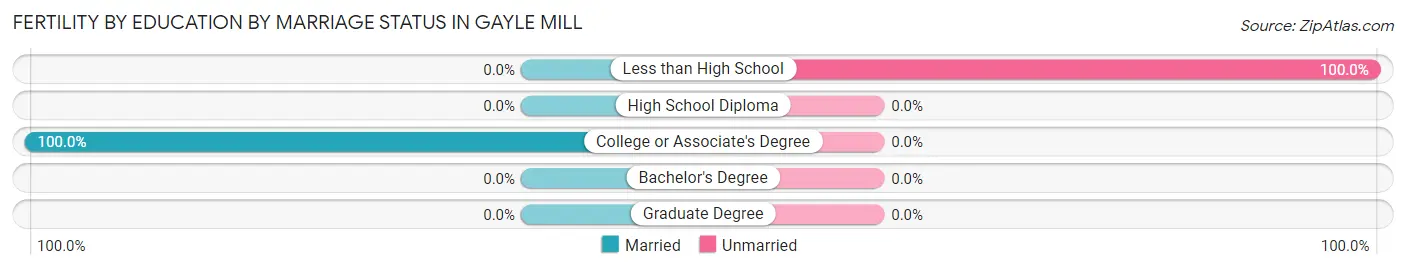
| Educational Attainment | Married | Unmarried |
| Less than High School | 0 (0.0%) | 53 (100.0%) |
| High School Diploma | 0 (0.0%) | 0 (0.0%) |
| College or Associate's Degree | 5 (100.0%) | 0 (0.0%) |
| Bachelor's Degree | 0 (0.0%) | 0 (0.0%) |
| Graduate Degree | 0 (0.0%) | 0 (0.0%) |
| Total | 5 (8.6%) | 53 (91.4%) |
Employment Characteristics in Gayle Mill
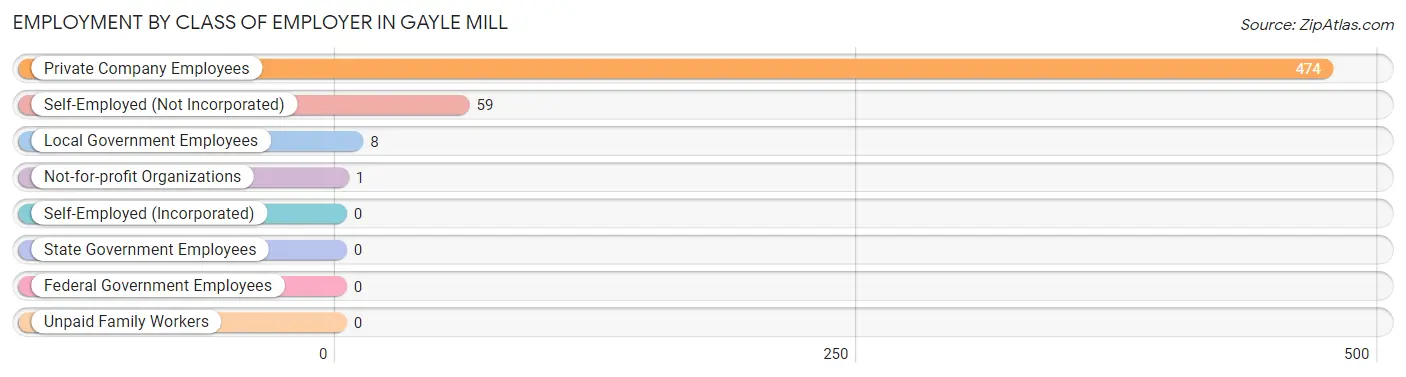
Employment by Class of Employer in Gayle Mill
Among the 542 employed individuals in Gayle Mill, private company employees (474 | 87.5%), self-employed (not incorporated) (59 | 10.9%), and local government employees (8 | 1.5%) make up the most common classes of employment.
| Employer Class | # Employees | % Employees |
| Private Company Employees | 474 | 87.5% |
| Self-Employed (Incorporated) | 0 | 0.0% |
| Self-Employed (Not Incorporated) | 59 | 10.9% |
| Not-for-profit Organizations | 1 | 0.2% |
| Local Government Employees | 8 | 1.5% |
| State Government Employees | 0 | 0.0% |
| Federal Government Employees | 0 | 0.0% |
| Unpaid Family Workers | 0 | 0.0% |
| Total | 542 | 100.0% |
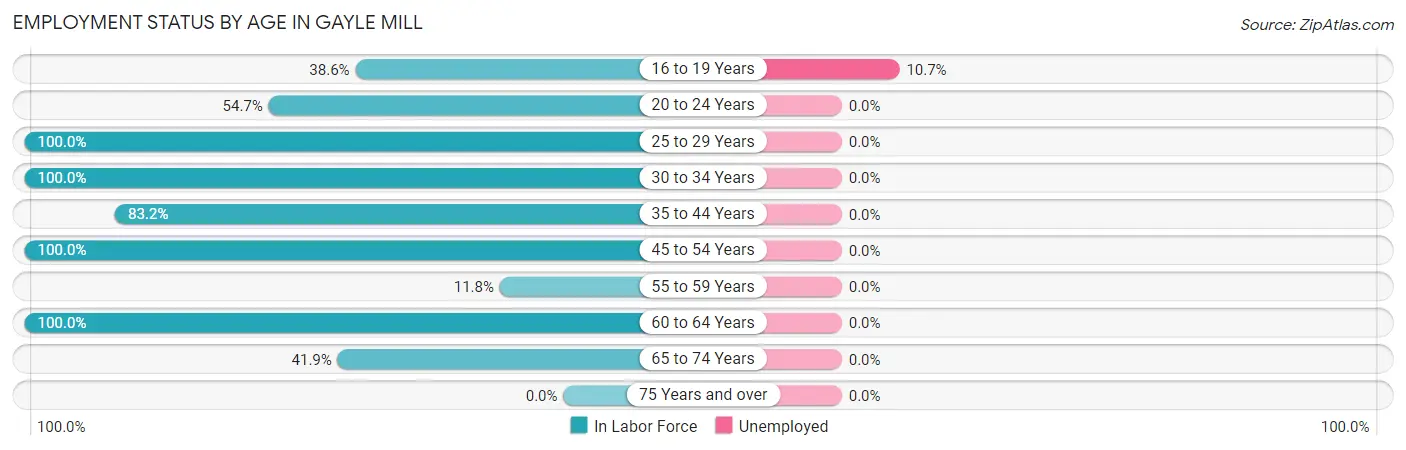
Employment Status by Age in Gayle Mill
According to the labor force statistics for Gayle Mill, out of the total population over 16 years of age (840), 65.8% or 553 individuals are in the labor force, with 1.1% or 6 of them unemployed. The age group with the highest labor force participation rate is 25 to 29 years, with 100.0% or 58 individuals in the labor force. Within the labor force, the 16 to 19 years age range has the highest percentage of unemployed individuals, with 10.7% or 6 of them being unemployed.
| Age Bracket | In Labor Force | Unemployed |
| 16 to 19 Years | 56 (38.6%) | 6 (10.7%) |
| 20 to 24 Years | 64 (54.7%) | 0 (0.0%) |
| 25 to 29 Years | 58 (100.0%) | 0 (0.0%) |
| 30 to 34 Years | 6 (100.0%) | 0 (0.0%) |
| 35 to 44 Years | 119 (83.2%) | 0 (0.0%) |
| 45 to 54 Years | 138 (100.0%) | 0 (0.0%) |
| 55 to 59 Years | 9 (11.8%) | 0 (0.0%) |
| 60 to 64 Years | 64 (100.0%) | 0 (0.0%) |
| 65 to 74 Years | 39 (41.9%) | 0 (0.0%) |
| 75 Years and over | 0 (0.0%) | 0 (0.0%) |
| Total | 553 (65.8%) | 6 (1.1%) |
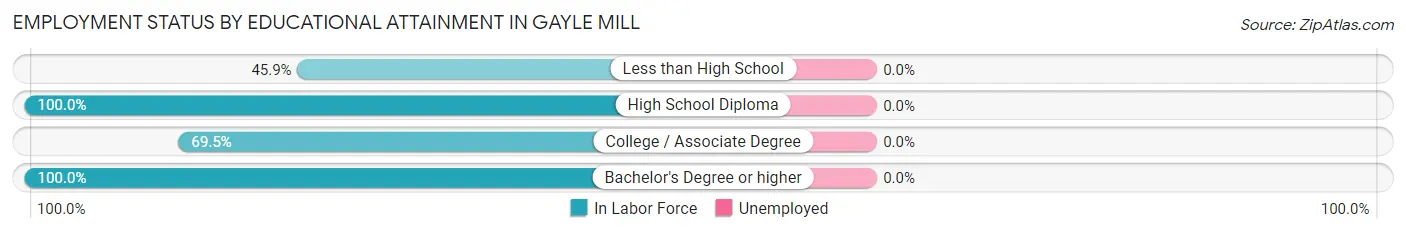
Employment Status by Educational Attainment in Gayle Mill
| Educational Attainment | In Labor Force | Unemployed |
| Less than High School | 62 (45.9%) | 0 (0.0%) |
| High School Diploma | 272 (100.0%) | 0 (0.0%) |
| College / Associate Degree | 41 (69.5%) | 0 (0.0%) |
| Bachelor's Degree or higher | 19 (100.0%) | 0 (0.0%) |
| Total | 394 (81.2%) | 0 (0.0%) |
Employment Occupations by Sex in Gayle Mill
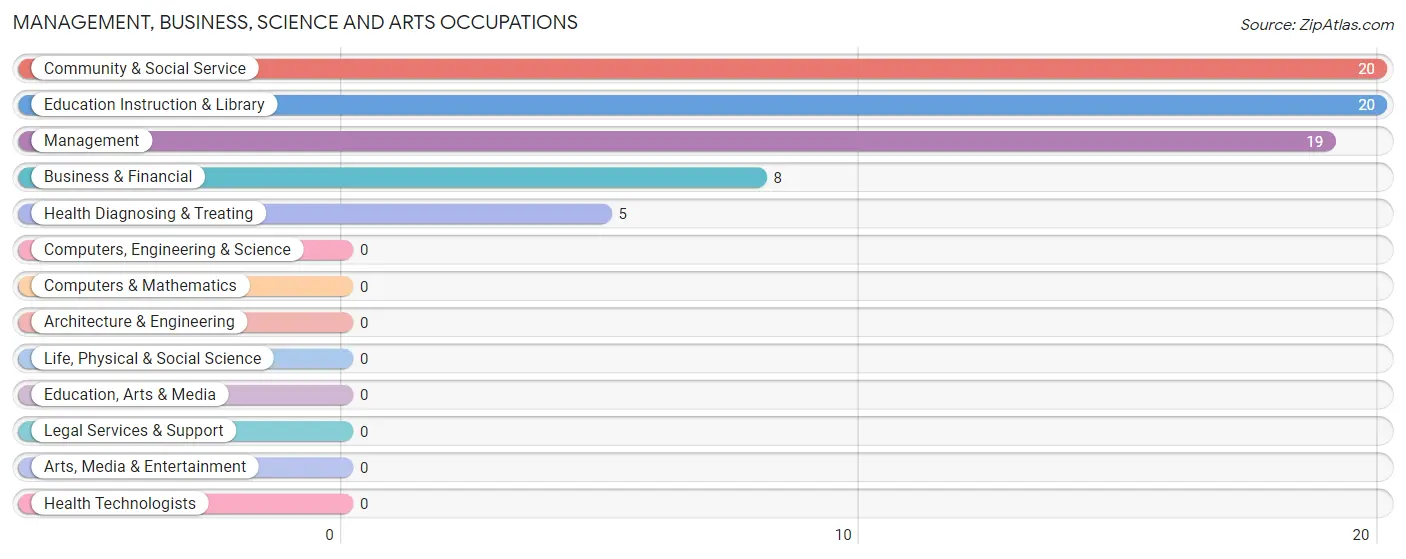
Management, Business, Science and Arts Occupations
The most common Management, Business, Science and Arts occupations in Gayle Mill are Community & Social Service (20 | 3.7%), Education Instruction & Library (20 | 3.7%), Management (19 | 3.5%), Business & Financial (8 | 1.5%), and Health Diagnosing & Treating (5 | 0.9%).
Management, Business, Science and Arts Occupations by Sex
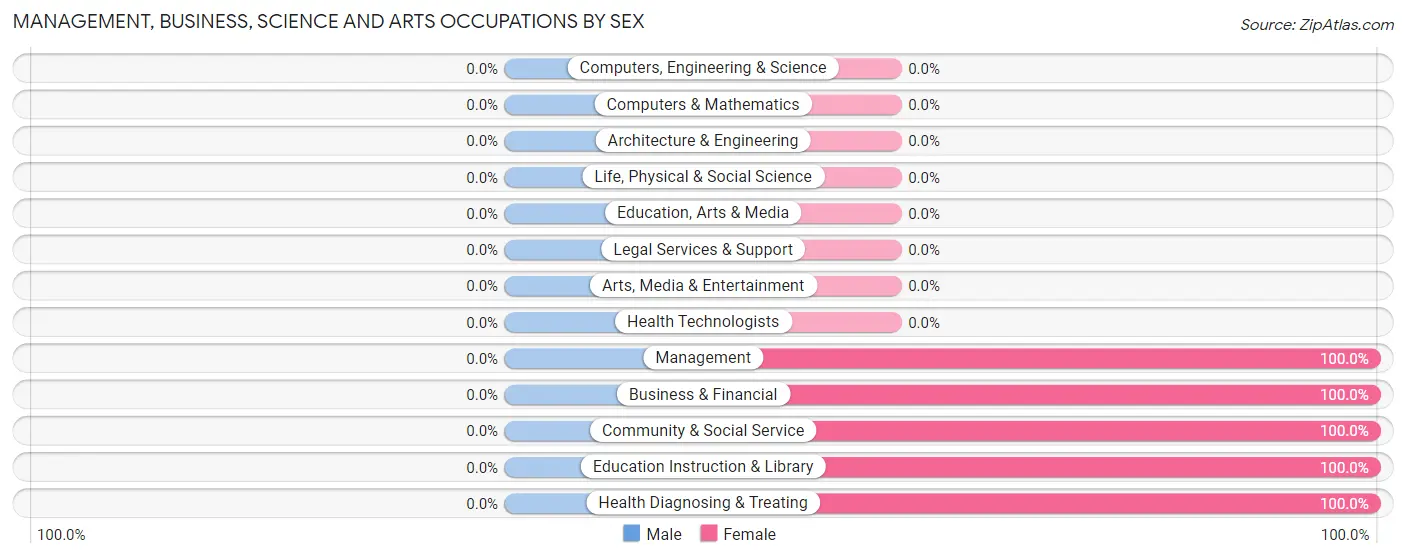
| Occupation | Male | Female |
| Management | 0 (0.0%) | 19 (100.0%) |
| Business & Financial | 0 (0.0%) | 8 (100.0%) |
| Computers, Engineering & Science | 0 (0.0%) | 0 (0.0%) |
| Computers & Mathematics | 0 (0.0%) | 0 (0.0%) |
| Architecture & Engineering | 0 (0.0%) | 0 (0.0%) |
| Life, Physical & Social Science | 0 (0.0%) | 0 (0.0%) |
| Community & Social Service | 0 (0.0%) | 20 (100.0%) |
| Education, Arts & Media | 0 (0.0%) | 0 (0.0%) |
| Legal Services & Support | 0 (0.0%) | 0 (0.0%) |
| Education Instruction & Library | 0 (0.0%) | 20 (100.0%) |
| Arts, Media & Entertainment | 0 (0.0%) | 0 (0.0%) |
| Health Diagnosing & Treating | 0 (0.0%) | 5 (100.0%) |
| Health Technologists | 0 (0.0%) | 0 (0.0%) |
| Total (Category) | 0 (0.0%) | 52 (100.0%) |
| Total (Overall) | 206 (37.7%) | 341 (62.3%) |
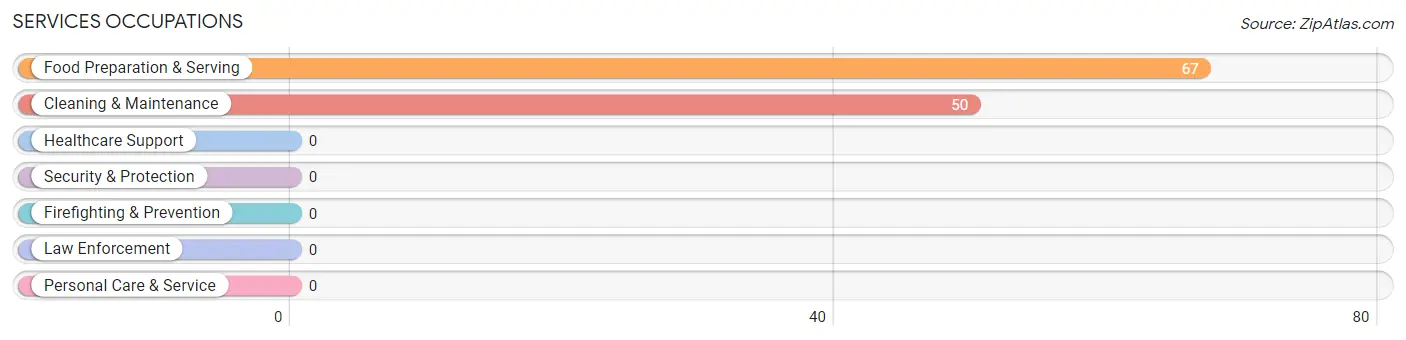
Services Occupations
The most common Services occupations in Gayle Mill are Food Preparation & Serving (67 | 12.2%), and Cleaning & Maintenance (50 | 9.1%).
Services Occupations by Sex
Within the Services occupations in Gayle Mill, the most male-oriented occupations are Food Preparation & Serving (47.8%), and Cleaning & Maintenance (18.0%), while the most female-oriented occupations are Cleaning & Maintenance (82.0%), and Food Preparation & Serving (52.2%).
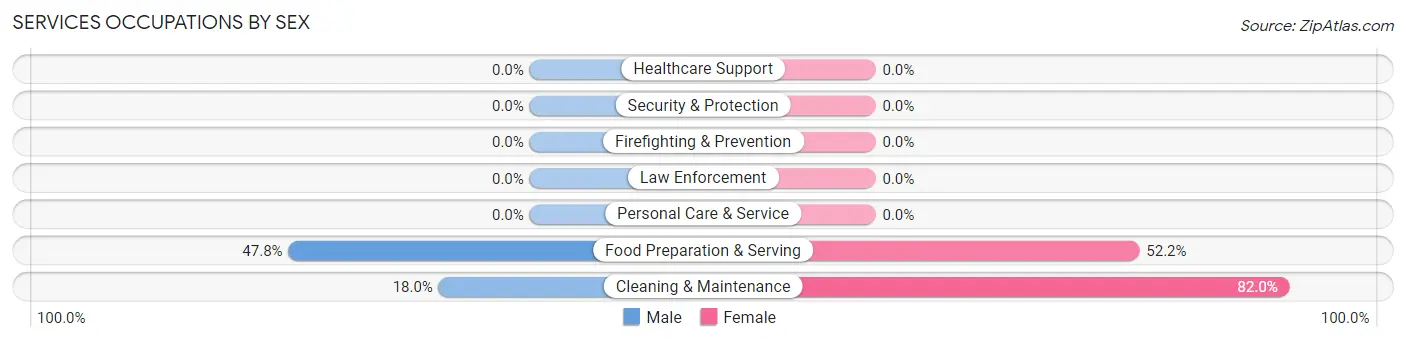
| Occupation | Male | Female |
| Healthcare Support | 0 (0.0%) | 0 (0.0%) |
| Security & Protection | 0 (0.0%) | 0 (0.0%) |
| Firefighting & Prevention | 0 (0.0%) | 0 (0.0%) |
| Law Enforcement | 0 (0.0%) | 0 (0.0%) |
| Food Preparation & Serving | 32 (47.8%) | 35 (52.2%) |
| Cleaning & Maintenance | 9 (18.0%) | 41 (82.0%) |
| Personal Care & Service | 0 (0.0%) | 0 (0.0%) |
| Total (Category) | 41 (35.0%) | 76 (65.0%) |
| Total (Overall) | 206 (37.7%) | 341 (62.3%) |
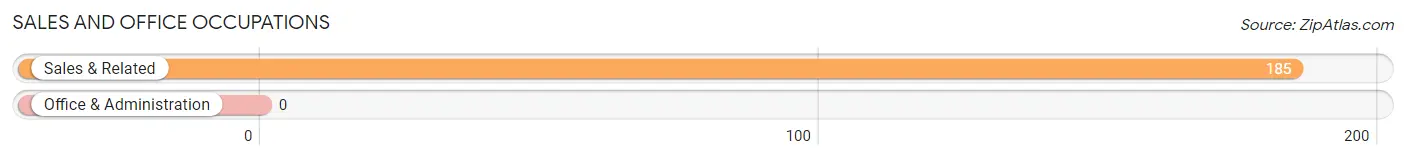
Sales and Office Occupations
The most common Sales and Office occupations in Gayle Mill are , and Sales & Related (185 | 33.8%).
Sales and Office Occupations by Sex
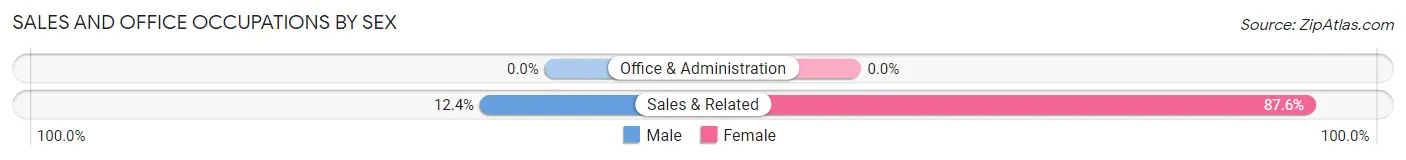
| Occupation | Male | Female |
| Sales & Related | 23 (12.4%) | 162 (87.6%) |
| Office & Administration | 0 (0.0%) | 0 (0.0%) |
| Total (Category) | 23 (12.4%) | 162 (87.6%) |
| Total (Overall) | 206 (37.7%) | 341 (62.3%) |
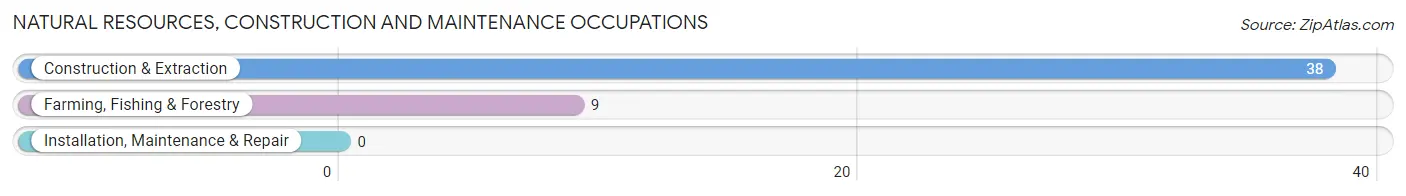
Natural Resources, Construction and Maintenance Occupations
The most common Natural Resources, Construction and Maintenance occupations in Gayle Mill are Construction & Extraction (38 | 7.0%), and Farming, Fishing & Forestry (9 | 1.7%).
Natural Resources, Construction and Maintenance Occupations by Sex
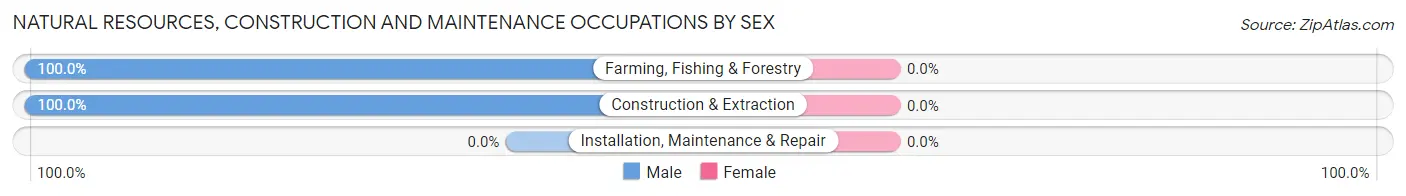
| Occupation | Male | Female |
| Farming, Fishing & Forestry | 9 (100.0%) | 0 (0.0%) |
| Construction & Extraction | 38 (100.0%) | 0 (0.0%) |
| Installation, Maintenance & Repair | 0 (0.0%) | 0 (0.0%) |
| Total (Category) | 47 (100.0%) | 0 (0.0%) |
| Total (Overall) | 206 (37.7%) | 341 (62.3%) |
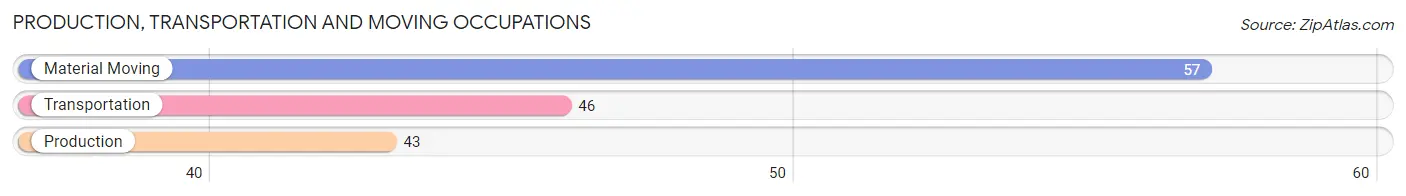
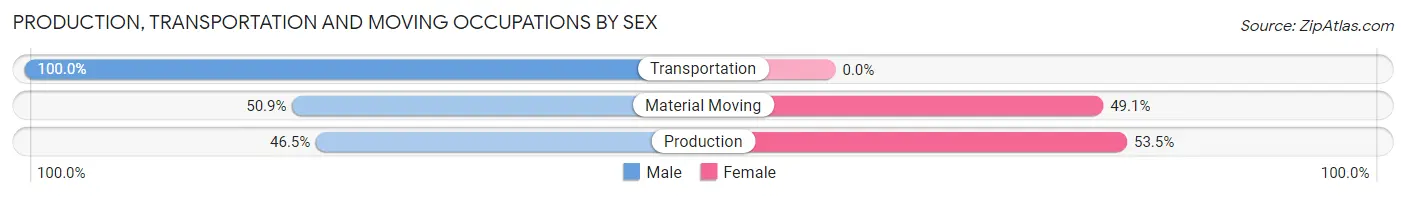
Production, Transportation and Moving Occupations
The most common Production, Transportation and Moving occupations in Gayle Mill are Material Moving (57 | 10.4%), Transportation (46 | 8.4%), and Production (43 | 7.9%).
Production, Transportation and Moving Occupations by Sex
| Occupation | Male | Female |
| Production | 20 (46.5%) | 23 (53.5%) |
| Transportation | 46 (100.0%) | 0 (0.0%) |
| Material Moving | 29 (50.9%) | 28 (49.1%) |
| Total (Category) | 95 (65.1%) | 51 (34.9%) |
| Total (Overall) | 206 (37.7%) | 341 (62.3%) |
Employment Industries by Sex in Gayle Mill
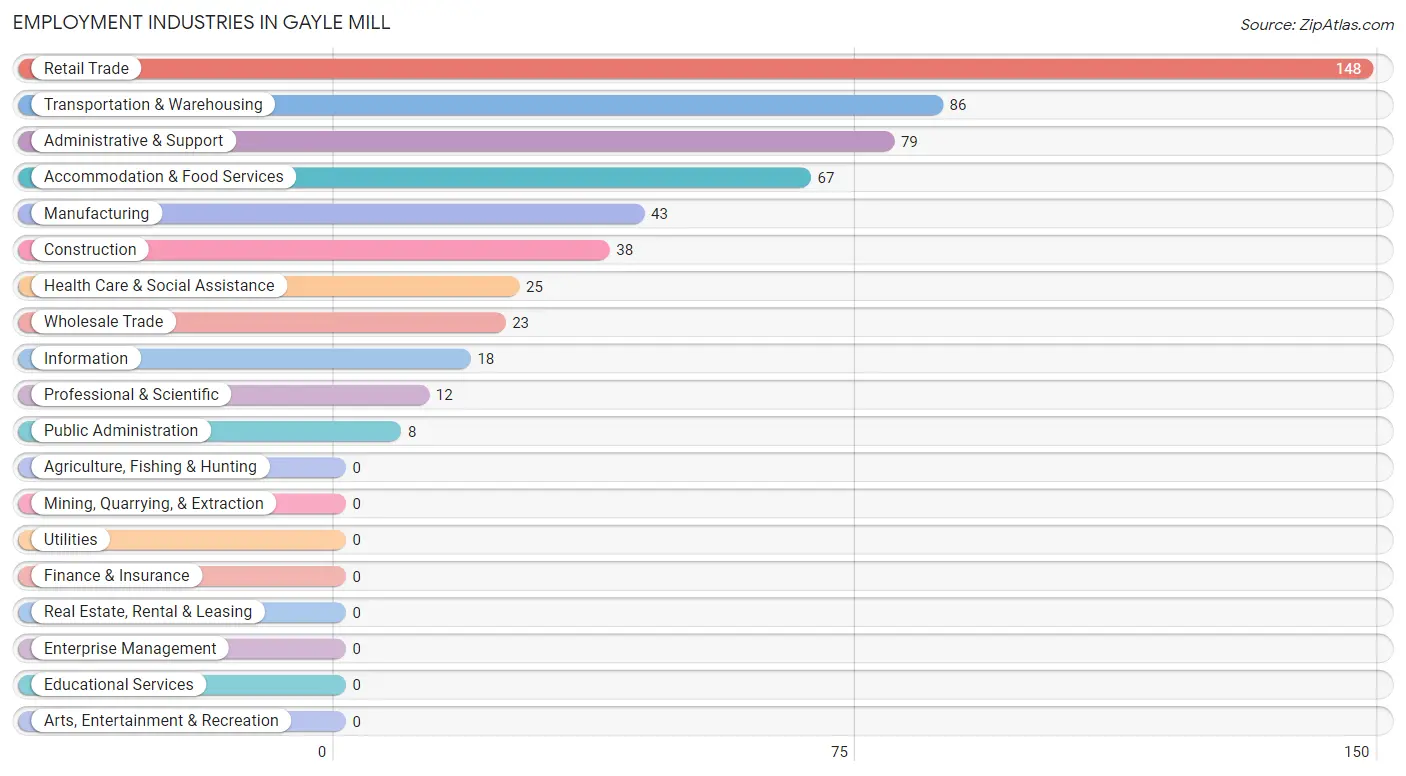
Employment Industries in Gayle Mill
The major employment industries in Gayle Mill include Retail Trade (148 | 27.1%), Transportation & Warehousing (86 | 15.7%), Administrative & Support (79 | 14.4%), Accommodation & Food Services (67 | 12.2%), and Manufacturing (43 | 7.9%).
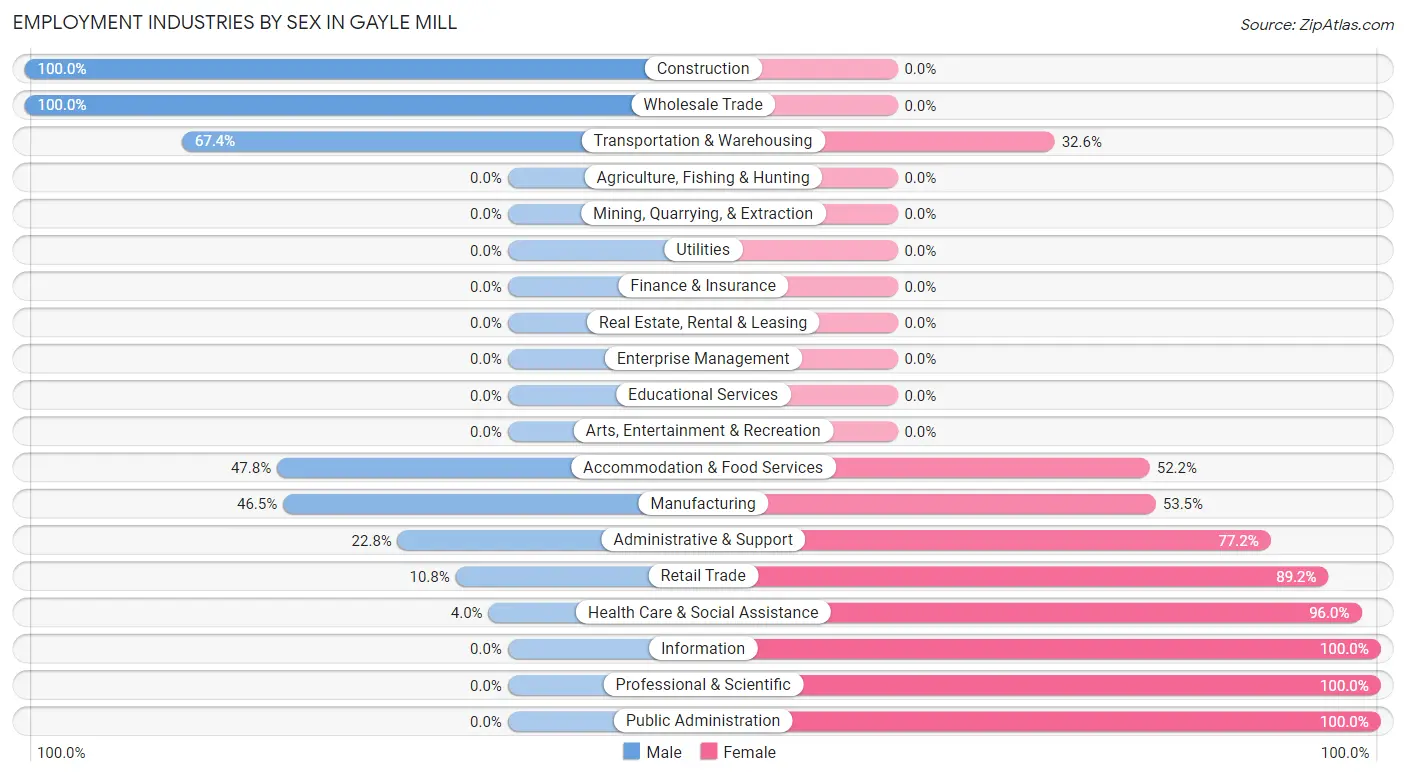
Employment Industries by Sex in Gayle Mill
The Gayle Mill industries that see more men than women are Construction (100.0%), Wholesale Trade (100.0%), and Transportation & Warehousing (67.4%), whereas the industries that tend to have a higher number of women are Information (100.0%), Professional & Scientific (100.0%), and Public Administration (100.0%).
| Industry | Male | Female |
| Agriculture, Fishing & Hunting | 0 (0.0%) | 0 (0.0%) |
| Mining, Quarrying, & Extraction | 0 (0.0%) | 0 (0.0%) |
| Construction | 38 (100.0%) | 0 (0.0%) |
| Manufacturing | 20 (46.5%) | 23 (53.5%) |
| Wholesale Trade | 23 (100.0%) | 0 (0.0%) |
| Retail Trade | 16 (10.8%) | 132 (89.2%) |
| Transportation & Warehousing | 58 (67.4%) | 28 (32.6%) |
| Utilities | 0 (0.0%) | 0 (0.0%) |
| Information | 0 (0.0%) | 18 (100.0%) |
| Finance & Insurance | 0 (0.0%) | 0 (0.0%) |
| Real Estate, Rental & Leasing | 0 (0.0%) | 0 (0.0%) |
| Professional & Scientific | 0 (0.0%) | 12 (100.0%) |
| Enterprise Management | 0 (0.0%) | 0 (0.0%) |
| Administrative & Support | 18 (22.8%) | 61 (77.2%) |
| Educational Services | 0 (0.0%) | 0 (0.0%) |
| Health Care & Social Assistance | 1 (4.0%) | 24 (96.0%) |
| Arts, Entertainment & Recreation | 0 (0.0%) | 0 (0.0%) |
| Accommodation & Food Services | 32 (47.8%) | 35 (52.2%) |
| Public Administration | 0 (0.0%) | 8 (100.0%) |
| Total | 206 (37.7%) | 341 (62.3%) |
Education in Gayle Mill
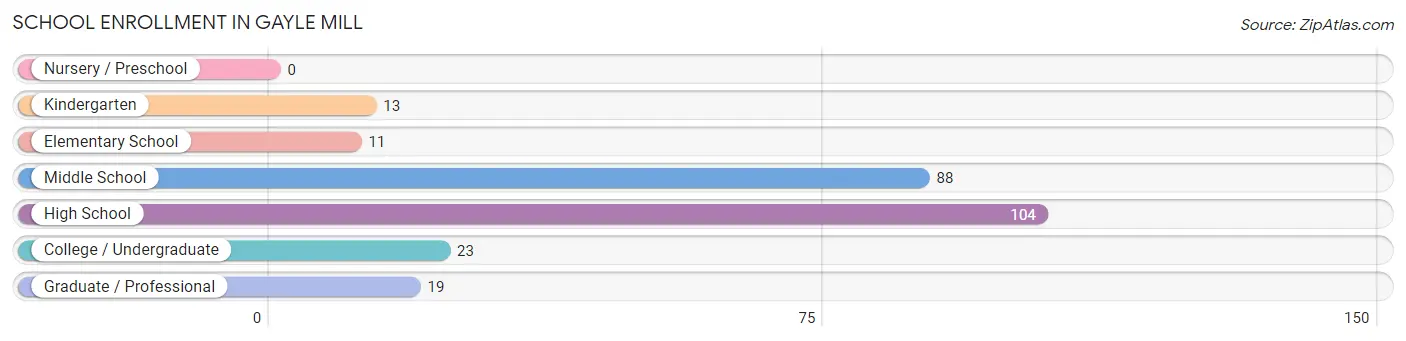
School Enrollment in Gayle Mill
The most common levels of schooling among the 258 students in Gayle Mill are high school (104 | 40.3%), middle school (88 | 34.1%), and college / undergraduate (23 | 8.9%).
| School Level | # Students | % Students |
| Nursery / Preschool | 0 | 0.0% |
| Kindergarten | 13 | 5.0% |
| Elementary School | 11 | 4.3% |
| Middle School | 88 | 34.1% |
| High School | 104 | 40.3% |
| College / Undergraduate | 23 | 8.9% |
| Graduate / Professional | 19 | 7.4% |
| Total | 258 | 100.0% |
School Enrollment by Age by Funding Source in Gayle Mill
Out of a total of 258 students who are enrolled in schools in Gayle Mill, 28 (10.9%) attend a private institution, while the remaining 230 (89.1%) are enrolled in public schools. The age group of 35 years and over has the highest likelihood of being enrolled in private schools, with 19 (45.2% in the age bracket) enrolled. Conversely, the age group of 5 to 9 year old has the lowest likelihood of being enrolled in a private school, with 24 (100.0% in the age bracket) attending a public institution.
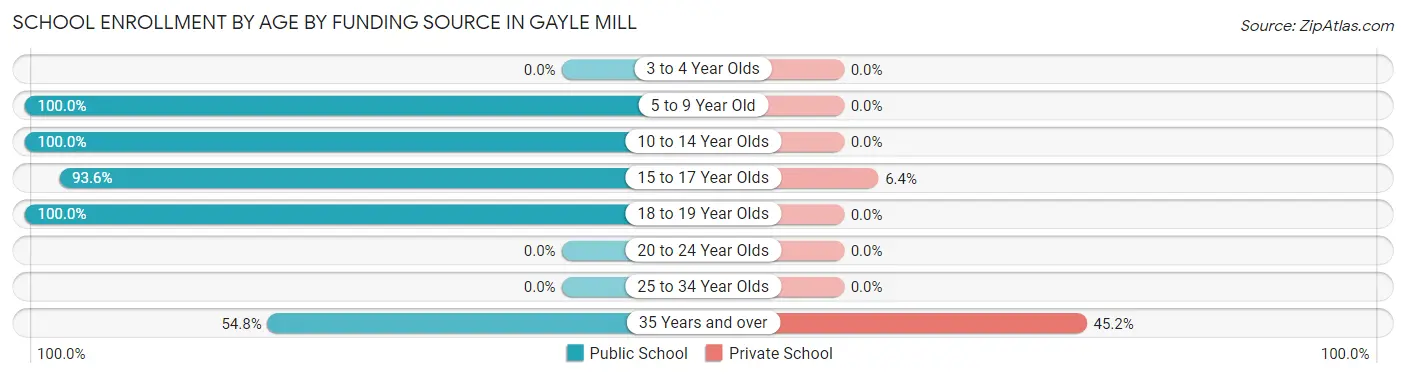
| Age Bracket | Public School | Private School |
| 3 to 4 Year Olds | 0 (0.0%) | 0 (0.0%) |
| 5 to 9 Year Old | 24 (100.0%) | 0 (0.0%) |
| 10 to 14 Year Olds | 46 (100.0%) | 0 (0.0%) |
| 15 to 17 Year Olds | 131 (93.6%) | 9 (6.4%) |
| 18 to 19 Year Olds | 6 (100.0%) | 0 (0.0%) |
| 20 to 24 Year Olds | 0 (0.0%) | 0 (0.0%) |
| 25 to 34 Year Olds | 0 (0.0%) | 0 (0.0%) |
| 35 Years and over | 23 (54.8%) | 19 (45.2%) |
| Total | 230 (89.1%) | 28 (10.9%) |
Educational Attainment by Field of Study in Gayle Mill
, and business (19 | 100.0%) are the most common fields of study among 19 individuals in Gayle Mill who have obtained a bachelor's degree or higher.
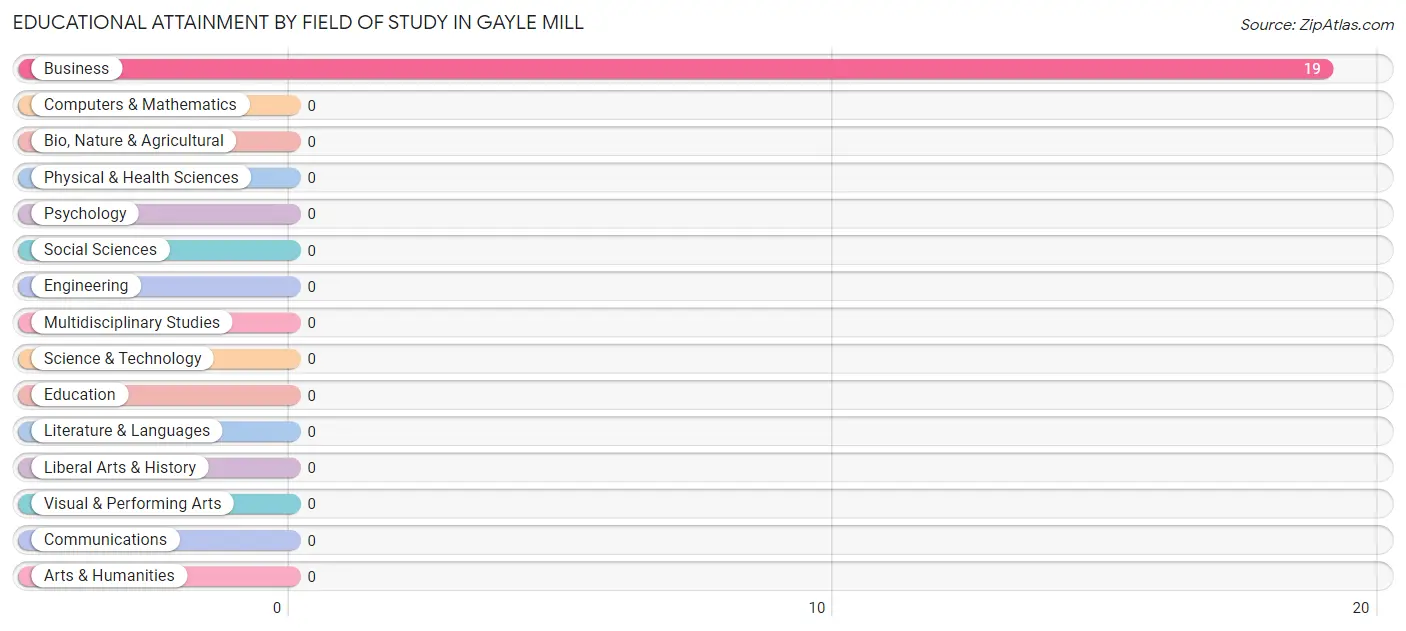
| Field of Study | # Graduates | % Graduates |
| Computers & Mathematics | 0 | 0.0% |
| Bio, Nature & Agricultural | 0 | 0.0% |
| Physical & Health Sciences | 0 | 0.0% |
| Psychology | 0 | 0.0% |
| Social Sciences | 0 | 0.0% |
| Engineering | 0 | 0.0% |
| Multidisciplinary Studies | 0 | 0.0% |
| Science & Technology | 0 | 0.0% |
| Business | 19 | 100.0% |
| Education | 0 | 0.0% |
| Literature & Languages | 0 | 0.0% |
| Liberal Arts & History | 0 | 0.0% |
| Visual & Performing Arts | 0 | 0.0% |
| Communications | 0 | 0.0% |
| Arts & Humanities | 0 | 0.0% |
| Total | 19 | 100.0% |
Transportation & Commute in Gayle Mill
Vehicle Availability by Sex in Gayle Mill
The most prevalent vehicle ownership categories in Gayle Mill are males with 2 vehicles (121, accounting for 59.0%) and females with 2 vehicles (168, making up 36.0%).
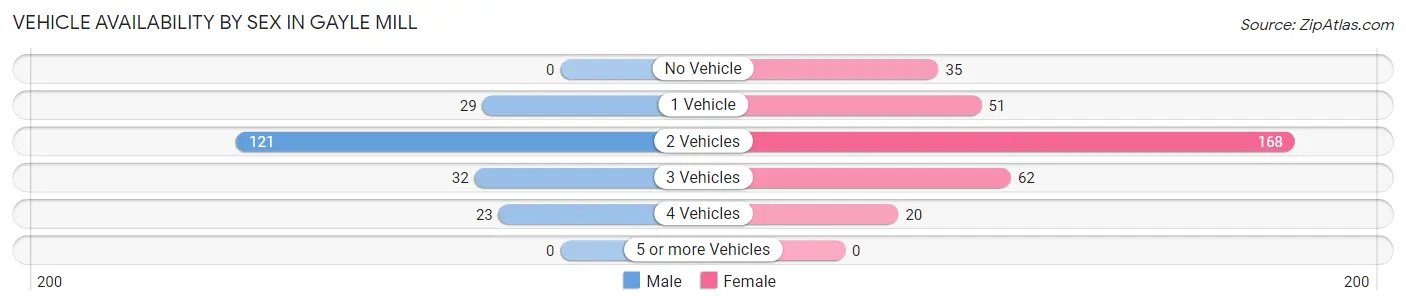
| Vehicles Available | Male | Female |
| No Vehicle | 0 (0.0%) | 35 (10.4%) |
| 1 Vehicle | 29 (14.1%) | 51 (15.2%) |
| 2 Vehicles | 121 (59.0%) | 168 (50.0%) |
| 3 Vehicles | 32 (15.6%) | 62 (18.4%) |
| 4 Vehicles | 23 (11.2%) | 20 (5.9%) |
| 5 or more Vehicles | 0 (0.0%) | 0 (0.0%) |
| Total | 205 (100.0%) | 336 (100.0%) |
Commute Time in Gayle Mill
The most frequently occuring commute durations in Gayle Mill are 45 to 59 minutes (126 commuters, 24.0%), 30 to 34 minutes (105 commuters, 20.0%), and 20 to 24 minutes (70 commuters, 13.4%).
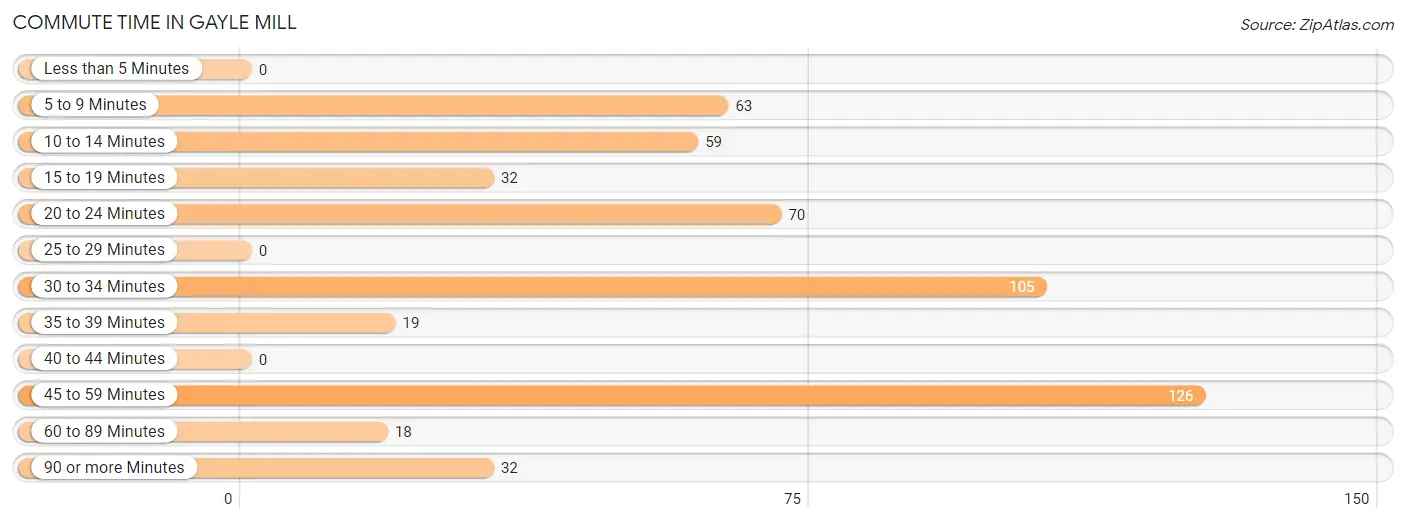
| Commute Time | # Commuters | % Commuters |
| Less than 5 Minutes | 0 | 0.0% |
| 5 to 9 Minutes | 63 | 12.0% |
| 10 to 14 Minutes | 59 | 11.3% |
| 15 to 19 Minutes | 32 | 6.1% |
| 20 to 24 Minutes | 70 | 13.4% |
| 25 to 29 Minutes | 0 | 0.0% |
| 30 to 34 Minutes | 105 | 20.0% |
| 35 to 39 Minutes | 19 | 3.6% |
| 40 to 44 Minutes | 0 | 0.0% |
| 45 to 59 Minutes | 126 | 24.0% |
| 60 to 89 Minutes | 18 | 3.4% |
| 90 or more Minutes | 32 | 6.1% |
Commute Time by Sex in Gayle Mill
The most common commute times in Gayle Mill are 45 to 59 minutes (65 commuters, 31.6%) for males and 20 to 24 minutes (62 commuters, 19.5%) for females.
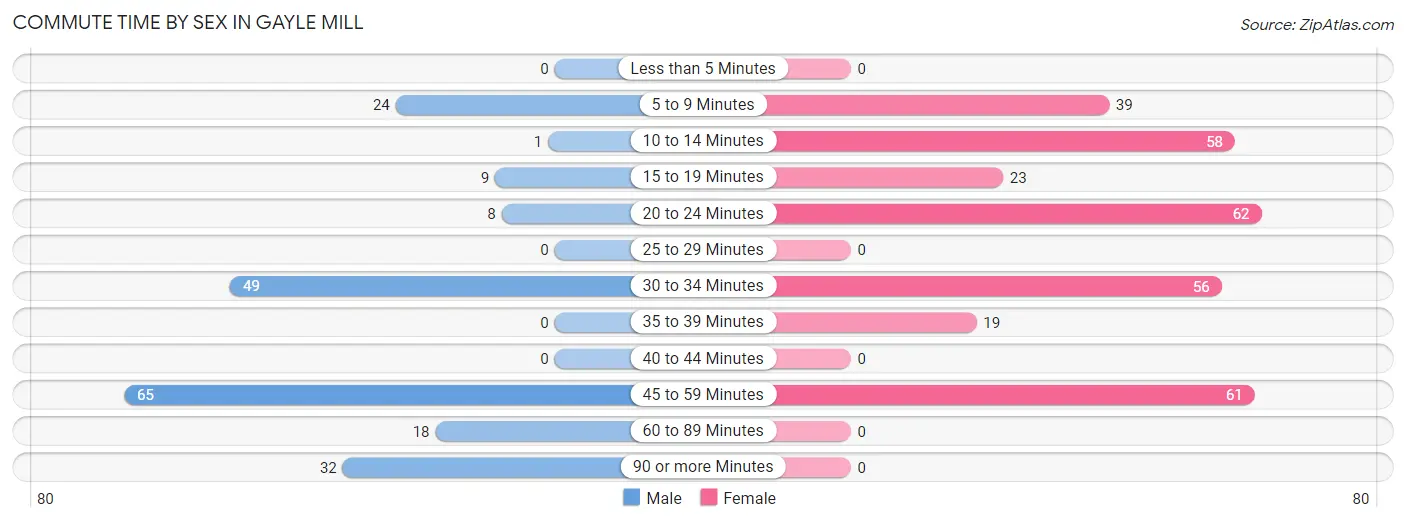
| Commute Time | Male | Female |
| Less than 5 Minutes | 0 (0.0%) | 0 (0.0%) |
| 5 to 9 Minutes | 24 (11.7%) | 39 (12.3%) |
| 10 to 14 Minutes | 1 (0.5%) | 58 (18.2%) |
| 15 to 19 Minutes | 9 (4.4%) | 23 (7.2%) |
| 20 to 24 Minutes | 8 (3.9%) | 62 (19.5%) |
| 25 to 29 Minutes | 0 (0.0%) | 0 (0.0%) |
| 30 to 34 Minutes | 49 (23.8%) | 56 (17.6%) |
| 35 to 39 Minutes | 0 (0.0%) | 19 (6.0%) |
| 40 to 44 Minutes | 0 (0.0%) | 0 (0.0%) |
| 45 to 59 Minutes | 65 (31.6%) | 61 (19.2%) |
| 60 to 89 Minutes | 18 (8.7%) | 0 (0.0%) |
| 90 or more Minutes | 32 (15.5%) | 0 (0.0%) |
Time of Departure to Work by Sex in Gayle Mill
The most frequent times of departure to work in Gayle Mill are 6:30 AM to 6:59 AM (53, 25.7%) for males and 7:00 AM to 7:29 AM (68, 21.4%) for females.
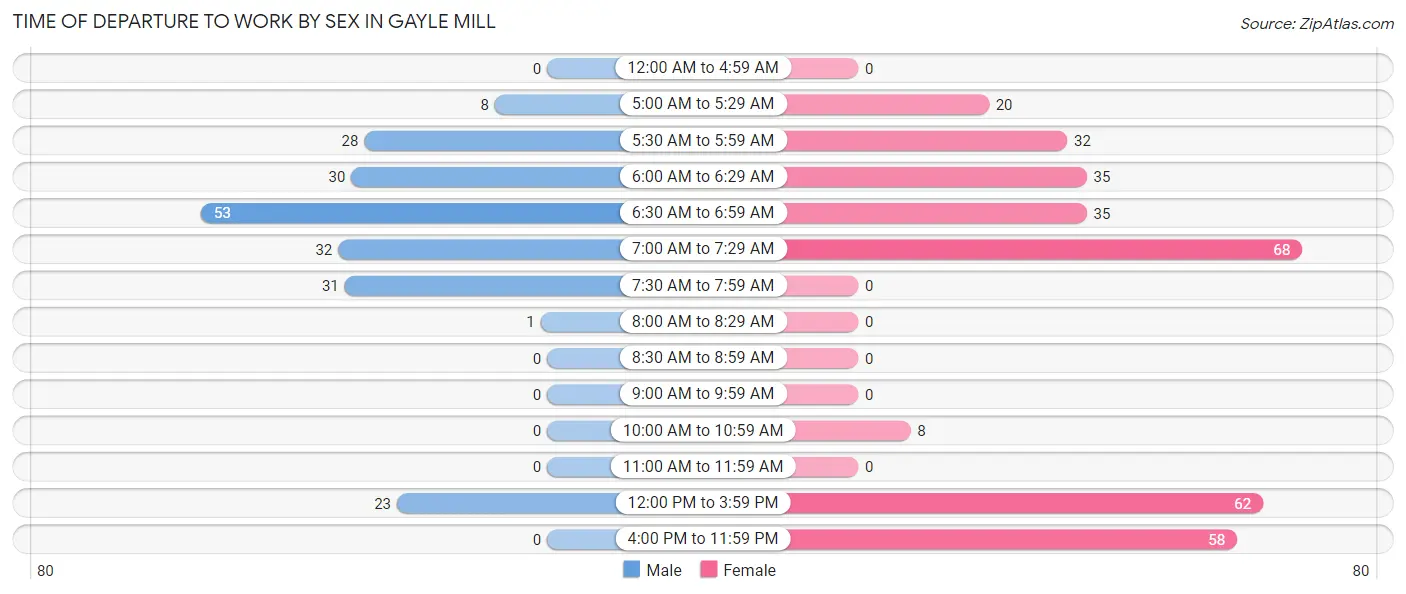
| Time of Departure | Male | Female |
| 12:00 AM to 4:59 AM | 0 (0.0%) | 0 (0.0%) |
| 5:00 AM to 5:29 AM | 8 (3.9%) | 20 (6.3%) |
| 5:30 AM to 5:59 AM | 28 (13.6%) | 32 (10.1%) |
| 6:00 AM to 6:29 AM | 30 (14.6%) | 35 (11.0%) |
| 6:30 AM to 6:59 AM | 53 (25.7%) | 35 (11.0%) |
| 7:00 AM to 7:29 AM | 32 (15.5%) | 68 (21.4%) |
| 7:30 AM to 7:59 AM | 31 (15.0%) | 0 (0.0%) |
| 8:00 AM to 8:29 AM | 1 (0.5%) | 0 (0.0%) |
| 8:30 AM to 8:59 AM | 0 (0.0%) | 0 (0.0%) |
| 9:00 AM to 9:59 AM | 0 (0.0%) | 0 (0.0%) |
| 10:00 AM to 10:59 AM | 0 (0.0%) | 8 (2.5%) |
| 11:00 AM to 11:59 AM | 0 (0.0%) | 0 (0.0%) |
| 12:00 PM to 3:59 PM | 23 (11.2%) | 62 (19.5%) |
| 4:00 PM to 11:59 PM | 0 (0.0%) | 58 (18.2%) |
| Total | 206 (100.0%) | 318 (100.0%) |
Housing Occupancy in Gayle Mill
Occupancy by Ownership in Gayle Mill
Of the total 334 dwellings in Gayle Mill, owner-occupied units account for 188 (56.3%), while renter-occupied units make up 146 (43.7%).
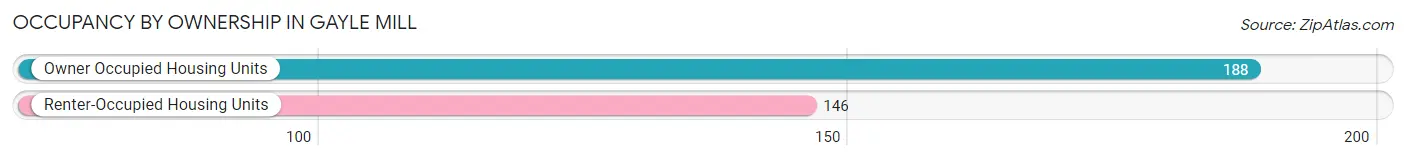
| Occupancy | # Housing Units | % Housing Units |
| Owner Occupied Housing Units | 188 | 56.3% |
| Renter-Occupied Housing Units | 146 | 43.7% |
| Total Occupied Housing Units | 334 | 100.0% |
Occupancy by Household Size in Gayle Mill
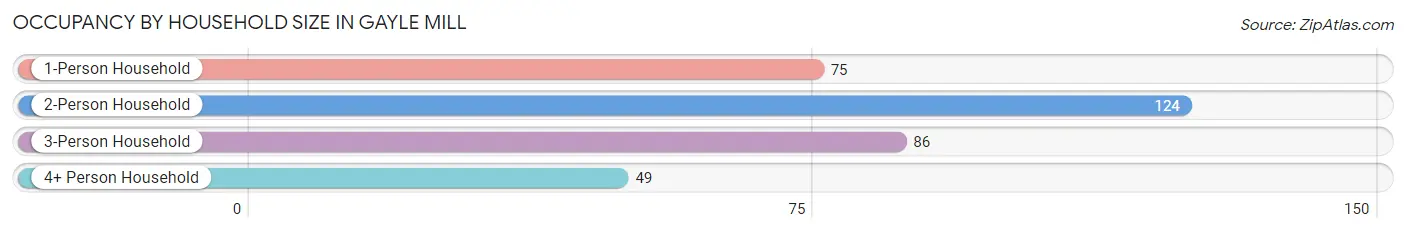
| Household Size | # Housing Units | % Housing Units |
| 1-Person Household | 75 | 22.5% |
| 2-Person Household | 124 | 37.1% |
| 3-Person Household | 86 | 25.8% |
| 4+ Person Household | 49 | 14.7% |
| Total Housing Units | 334 | 100.0% |
Occupancy by Ownership by Household Size in Gayle Mill
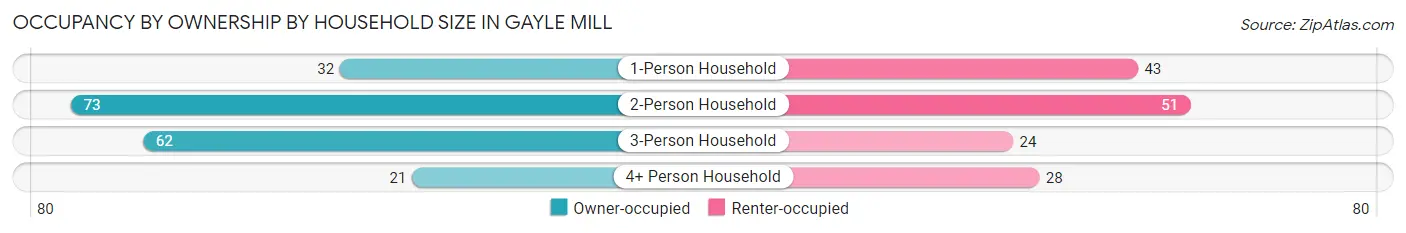
| Household Size | Owner-occupied | Renter-occupied |
| 1-Person Household | 32 (42.7%) | 43 (57.3%) |
| 2-Person Household | 73 (58.9%) | 51 (41.1%) |
| 3-Person Household | 62 (72.1%) | 24 (27.9%) |
| 4+ Person Household | 21 (42.9%) | 28 (57.1%) |
| Total Housing Units | 188 (56.3%) | 146 (43.7%) |
Occupancy by Educational Attainment in Gayle Mill
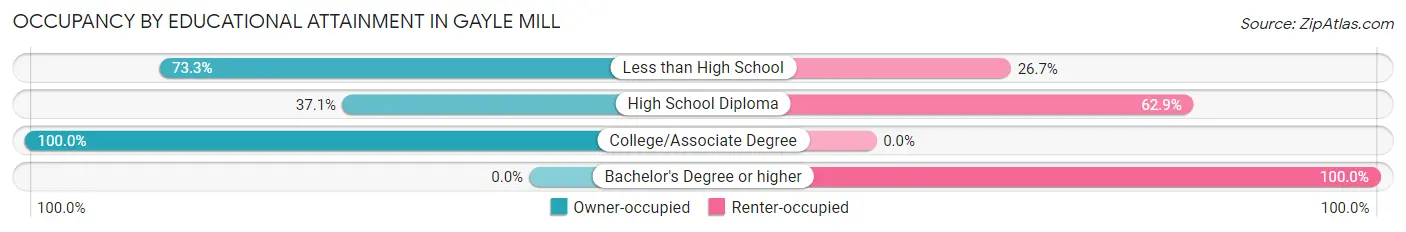
| Household Size | Owner-occupied | Renter-occupied |
| Less than High School | 88 (73.3%) | 32 (26.7%) |
| High School Diploma | 56 (37.1%) | 95 (62.9%) |
| College/Associate Degree | 44 (100.0%) | 0 (0.0%) |
| Bachelor's Degree or higher | 0 (0.0%) | 19 (100.0%) |
Occupancy by Age of Householder in Gayle Mill
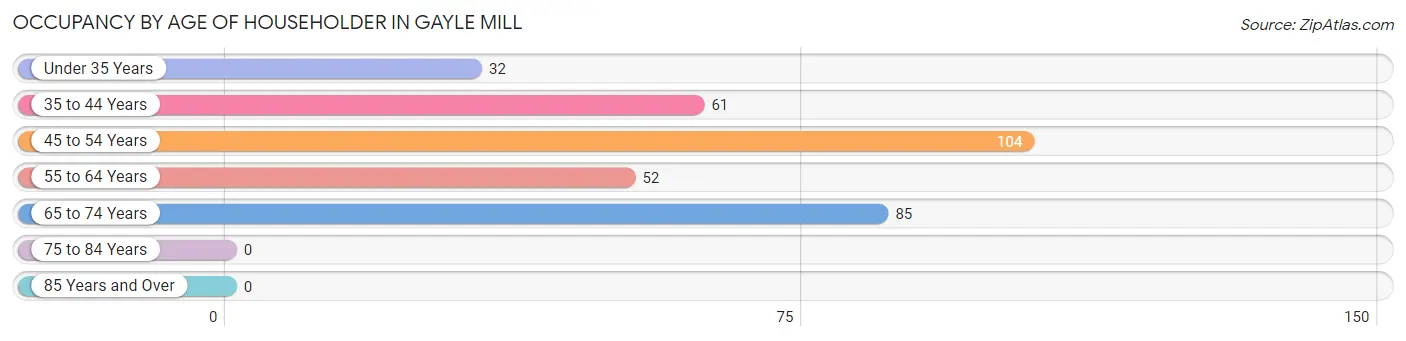
| Age Bracket | # Households | % Households |
| Under 35 Years | 32 | 9.6% |
| 35 to 44 Years | 61 | 18.3% |
| 45 to 54 Years | 104 | 31.1% |
| 55 to 64 Years | 52 | 15.6% |
| 65 to 74 Years | 85 | 25.5% |
| 75 to 84 Years | 0 | 0.0% |
| 85 Years and Over | 0 | 0.0% |
| Total | 334 | 100.0% |
Housing Finances in Gayle Mill
Median Income by Occupancy in Gayle Mill
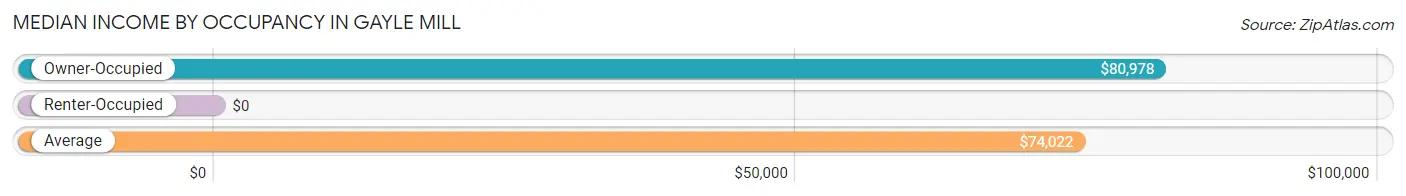
| Occupancy Type | # Households | Median Income |
| Owner-Occupied | 188 (56.3%) | $80,978 |
| Renter-Occupied | 146 (43.7%) | $0 |
| Average | 334 (100.0%) | $74,022 |
Occupancy by Householder Income Bracket in Gayle Mill
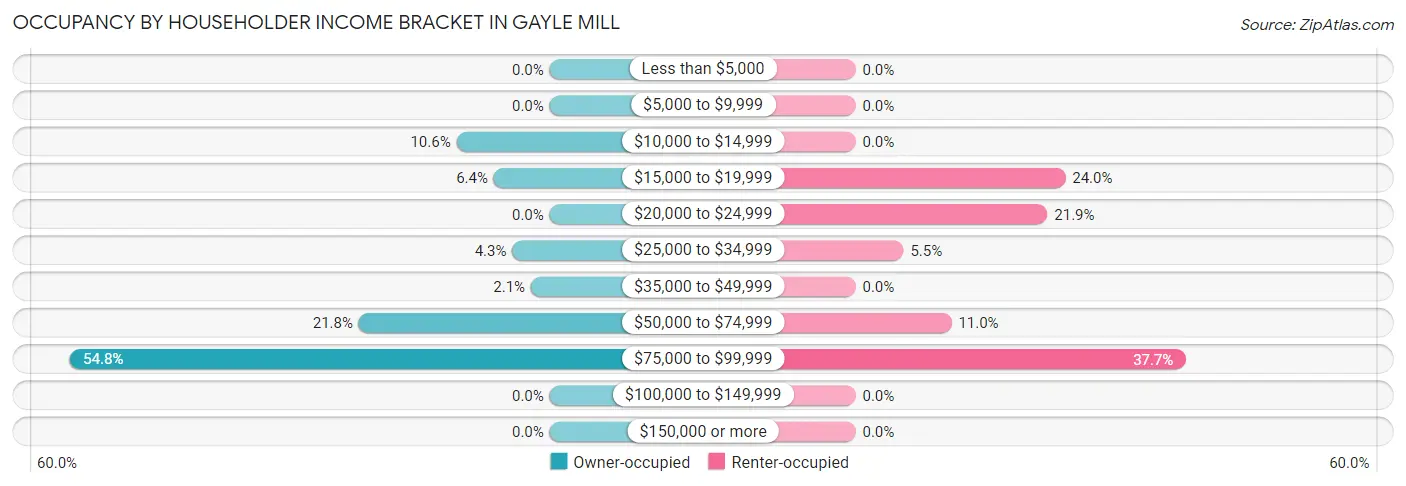
| Income Bracket | Owner-occupied | Renter-occupied |
| Less than $5,000 | 0 (0.0%) | 0 (0.0%) |
| $5,000 to $9,999 | 0 (0.0%) | 0 (0.0%) |
| $10,000 to $14,999 | 20 (10.6%) | 0 (0.0%) |
| $15,000 to $19,999 | 12 (6.4%) | 35 (24.0%) |
| $20,000 to $24,999 | 0 (0.0%) | 32 (21.9%) |
| $25,000 to $34,999 | 8 (4.3%) | 8 (5.5%) |
| $35,000 to $49,999 | 4 (2.1%) | 0 (0.0%) |
| $50,000 to $74,999 | 41 (21.8%) | 16 (11.0%) |
| $75,000 to $99,999 | 103 (54.8%) | 55 (37.7%) |
| $100,000 to $149,999 | 0 (0.0%) | 0 (0.0%) |
| $150,000 or more | 0 (0.0%) | 0 (0.0%) |
| Total | 188 (100.0%) | 146 (100.0%) |
Monthly Housing Cost Tiers in Gayle Mill
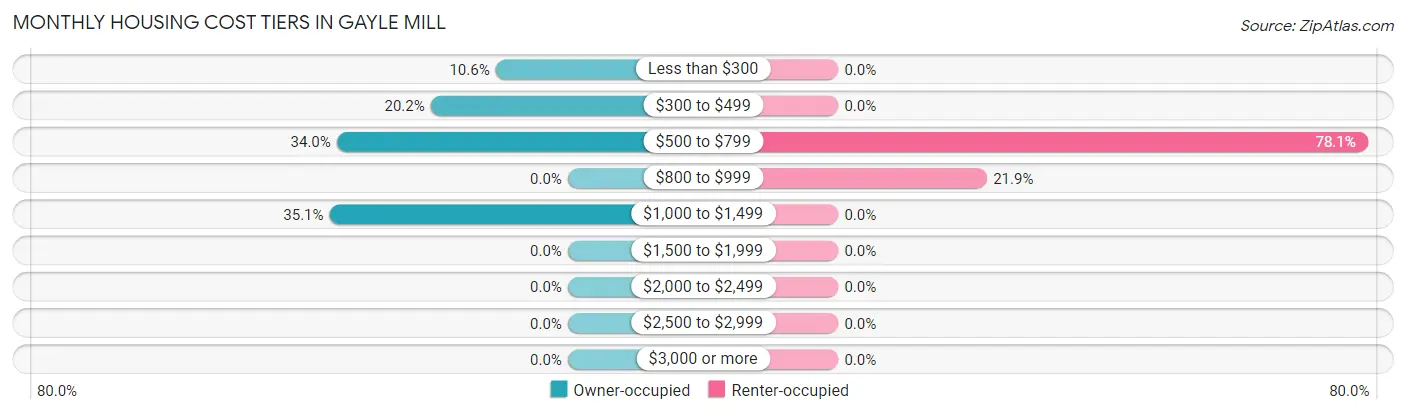
| Monthly Cost | Owner-occupied | Renter-occupied |
| Less than $300 | 20 (10.6%) | 0 (0.0%) |
| $300 to $499 | 38 (20.2%) | 0 (0.0%) |
| $500 to $799 | 64 (34.0%) | 114 (78.1%) |
| $800 to $999 | 0 (0.0%) | 32 (21.9%) |
| $1,000 to $1,499 | 66 (35.1%) | 0 (0.0%) |
| $1,500 to $1,999 | 0 (0.0%) | 0 (0.0%) |
| $2,000 to $2,499 | 0 (0.0%) | 0 (0.0%) |
| $2,500 to $2,999 | 0 (0.0%) | 0 (0.0%) |
| $3,000 or more | 0 (0.0%) | 0 (0.0%) |
| Total | 188 (100.0%) | 146 (100.0%) |
Physical Housing Characteristics in Gayle Mill
Housing Structures in Gayle Mill
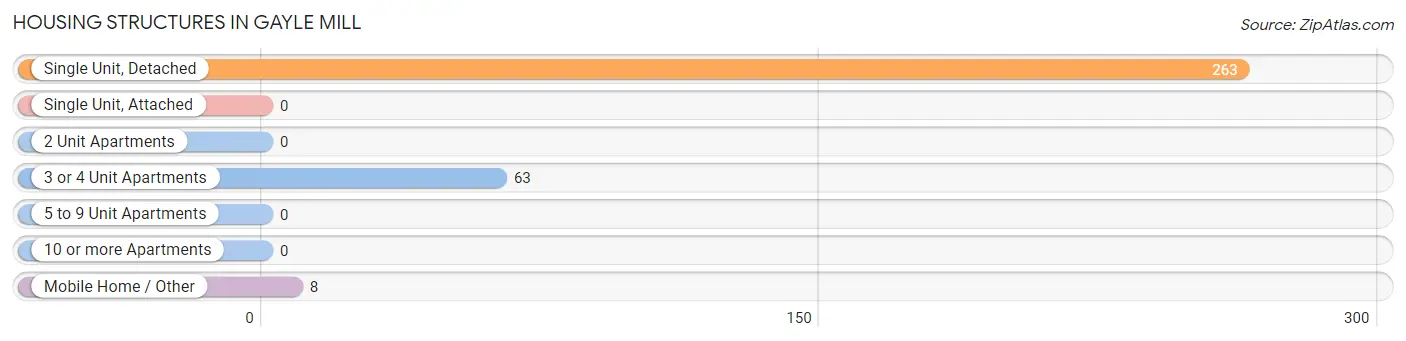
| Structure Type | # Housing Units | % Housing Units |
| Single Unit, Detached | 263 | 78.7% |
| Single Unit, Attached | 0 | 0.0% |
| 2 Unit Apartments | 0 | 0.0% |
| 3 or 4 Unit Apartments | 63 | 18.9% |
| 5 to 9 Unit Apartments | 0 | 0.0% |
| 10 or more Apartments | 0 | 0.0% |
| Mobile Home / Other | 8 | 2.4% |
| Total | 334 | 100.0% |
Housing Structures by Occupancy in Gayle Mill
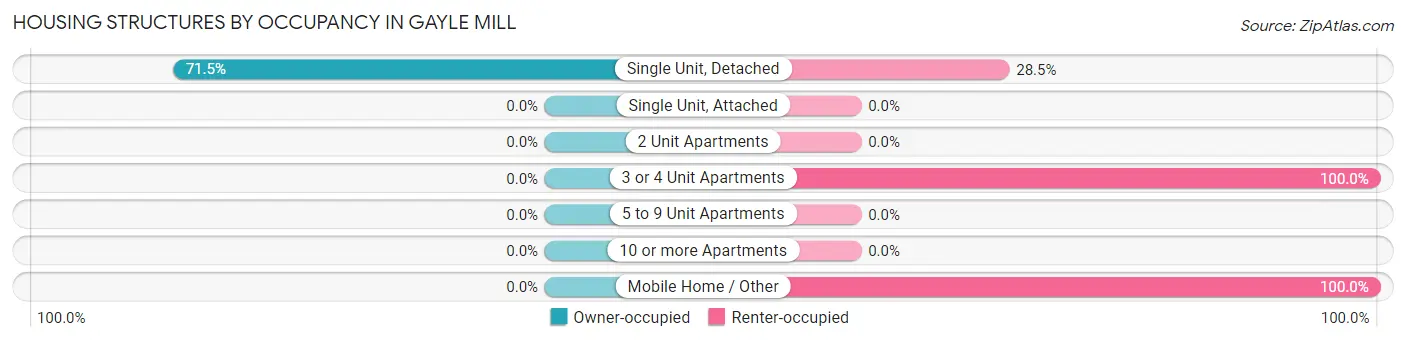
| Structure Type | Owner-occupied | Renter-occupied |
| Single Unit, Detached | 188 (71.5%) | 75 (28.5%) |
| Single Unit, Attached | 0 (0.0%) | 0 (0.0%) |
| 2 Unit Apartments | 0 (0.0%) | 0 (0.0%) |
| 3 or 4 Unit Apartments | 0 (0.0%) | 63 (100.0%) |
| 5 to 9 Unit Apartments | 0 (0.0%) | 0 (0.0%) |
| 10 or more Apartments | 0 (0.0%) | 0 (0.0%) |
| Mobile Home / Other | 0 (0.0%) | 8 (100.0%) |
| Total | 188 (56.3%) | 146 (43.7%) |
Housing Structures by Number of Rooms in Gayle Mill
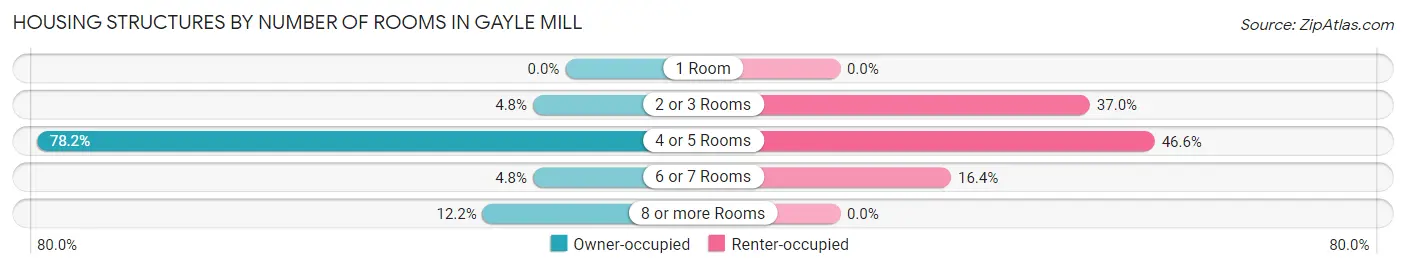
| Number of Rooms | Owner-occupied | Renter-occupied |
| 1 Room | 0 (0.0%) | 0 (0.0%) |
| 2 or 3 Rooms | 9 (4.8%) | 54 (37.0%) |
| 4 or 5 Rooms | 147 (78.2%) | 68 (46.6%) |
| 6 or 7 Rooms | 9 (4.8%) | 24 (16.4%) |
| 8 or more Rooms | 23 (12.2%) | 0 (0.0%) |
| Total | 188 (100.0%) | 146 (100.0%) |
Housing Structure by Heating Type in Gayle Mill
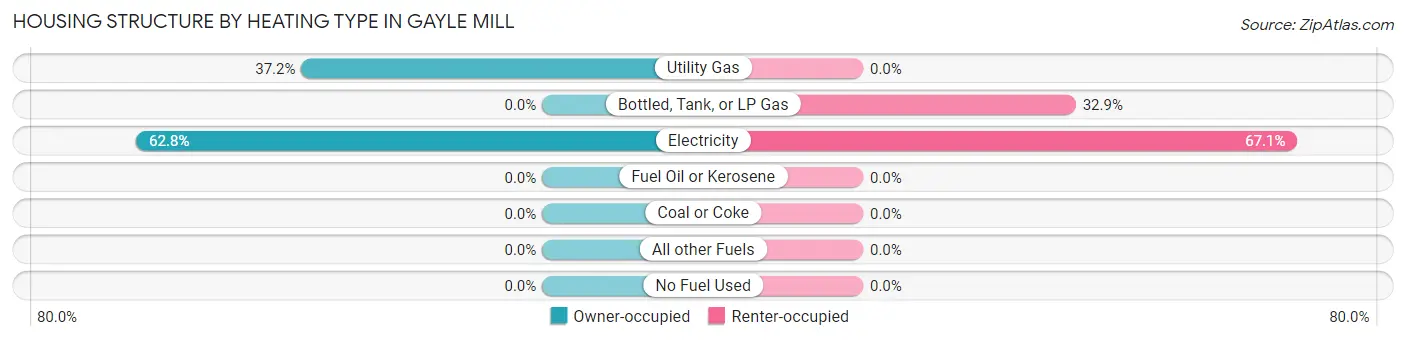
| Heating Type | Owner-occupied | Renter-occupied |
| Utility Gas | 70 (37.2%) | 0 (0.0%) |
| Bottled, Tank, or LP Gas | 0 (0.0%) | 48 (32.9%) |
| Electricity | 118 (62.8%) | 98 (67.1%) |
| Fuel Oil or Kerosene | 0 (0.0%) | 0 (0.0%) |
| Coal or Coke | 0 (0.0%) | 0 (0.0%) |
| All other Fuels | 0 (0.0%) | 0 (0.0%) |
| No Fuel Used | 0 (0.0%) | 0 (0.0%) |
| Total | 188 (100.0%) | 146 (100.0%) |
Household Vehicle Usage in Gayle Mill
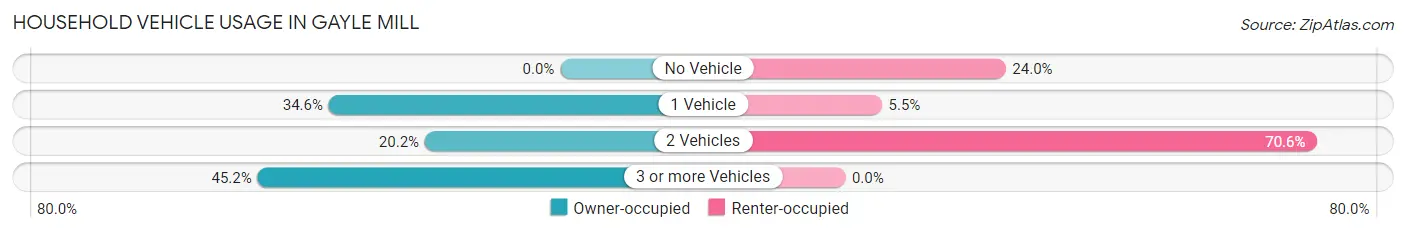
| Vehicles per Household | Owner-occupied | Renter-occupied |
| No Vehicle | 0 (0.0%) | 35 (24.0%) |
| 1 Vehicle | 65 (34.6%) | 8 (5.5%) |
| 2 Vehicles | 38 (20.2%) | 103 (70.6%) |
| 3 or more Vehicles | 85 (45.2%) | 0 (0.0%) |
| Total | 188 (100.0%) | 146 (100.0%) |
Real Estate & Mortgages in Gayle Mill
Real Estate and Mortgage Overview in Gayle Mill
| Characteristic | Without Mortgage | With Mortgage |
| Housing Units | 109 | 79 |
| Median Property Value | $27,600 | $27,900 |
| Median Household Income | $62,014 | $0 |
| Monthly Housing Costs | $481 | $0 |
| Real Estate Taxes | - | - |
Property Value by Mortgage Status in Gayle Mill
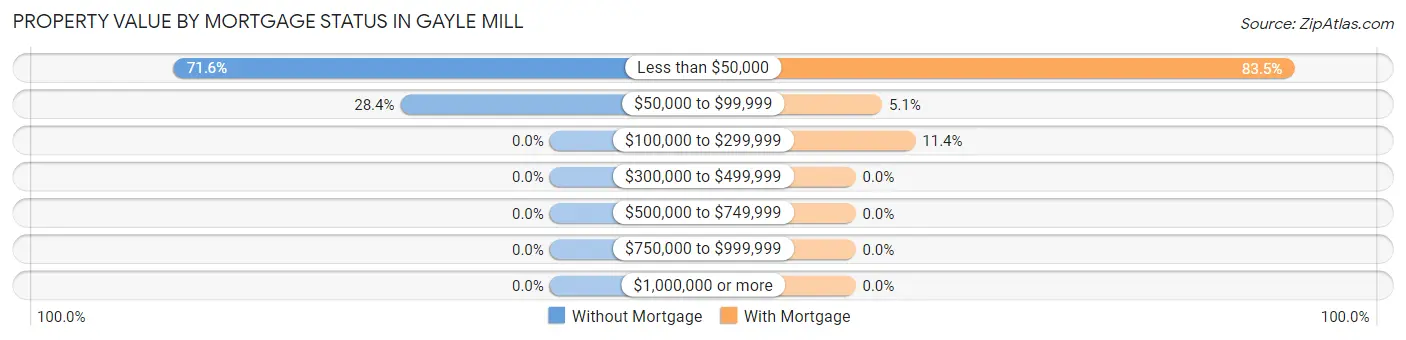
| Property Value | Without Mortgage | With Mortgage |
| Less than $50,000 | 78 (71.6%) | 66 (83.5%) |
| $50,000 to $99,999 | 31 (28.4%) | 4 (5.1%) |
| $100,000 to $299,999 | 0 (0.0%) | 9 (11.4%) |
| $300,000 to $499,999 | 0 (0.0%) | 0 (0.0%) |
| $500,000 to $749,999 | 0 (0.0%) | 0 (0.0%) |
| $750,000 to $999,999 | 0 (0.0%) | 0 (0.0%) |
| $1,000,000 or more | 0 (0.0%) | 0 (0.0%) |
| Total | 109 (100.0%) | 79 (100.0%) |
Household Income by Mortgage Status in Gayle Mill
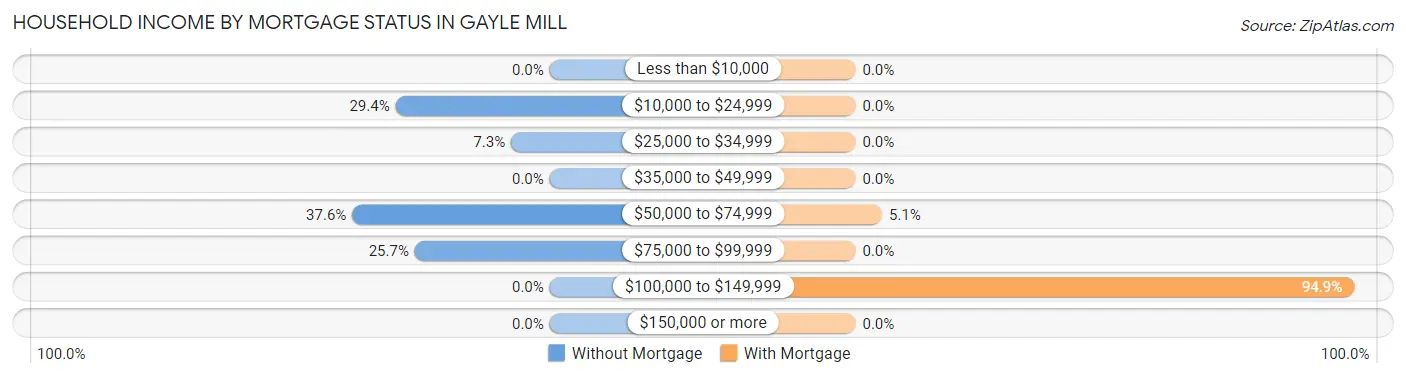
| Household Income | Without Mortgage | With Mortgage |
| Less than $10,000 | 0 (0.0%) | 0 (0.0%) |
| $10,000 to $24,999 | 32 (29.4%) | 0 (0.0%) |
| $25,000 to $34,999 | 8 (7.3%) | 0 (0.0%) |
| $35,000 to $49,999 | 0 (0.0%) | 0 (0.0%) |
| $50,000 to $74,999 | 41 (37.6%) | 4 (5.1%) |
| $75,000 to $99,999 | 28 (25.7%) | 0 (0.0%) |
| $100,000 to $149,999 | 0 (0.0%) | 75 (94.9%) |
| $150,000 or more | 0 (0.0%) | 0 (0.0%) |
| Total | 109 (100.0%) | 79 (100.0%) |
Property Value to Household Income Ratio in Gayle Mill
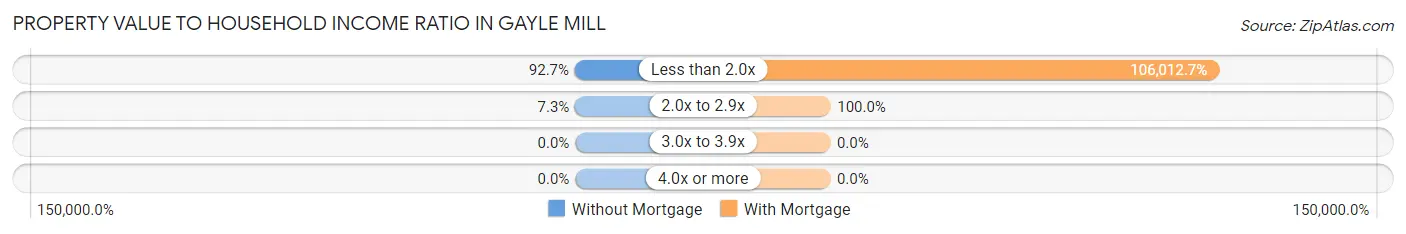
| Value-to-Income Ratio | Without Mortgage | With Mortgage |
| Less than 2.0x | 101 (92.7%) | 83,750 (106,012.7%) |
| 2.0x to 2.9x | 8 (7.3%) | 79 (100.0%) |
| 3.0x to 3.9x | 0 (0.0%) | 0 (0.0%) |
| 4.0x or more | 0 (0.0%) | 0 (0.0%) |
| Total | 109 (100.0%) | 79 (100.0%) |
Real Estate Taxes by Mortgage Status in Gayle Mill
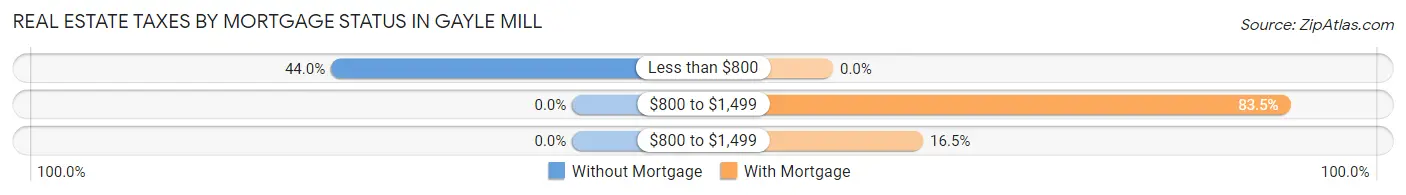
| Property Taxes | Without Mortgage | With Mortgage |
| Less than $800 | 48 (44.0%) | 0 (0.0%) |
| $800 to $1,499 | 0 (0.0%) | 66 (83.5%) |
| $800 to $1,499 | 0 (0.0%) | 13 (16.5%) |
| Total | 109 (100.0%) | 79 (100.0%) |
Health & Disability in Gayle Mill
Health Insurance Coverage by Age in Gayle Mill
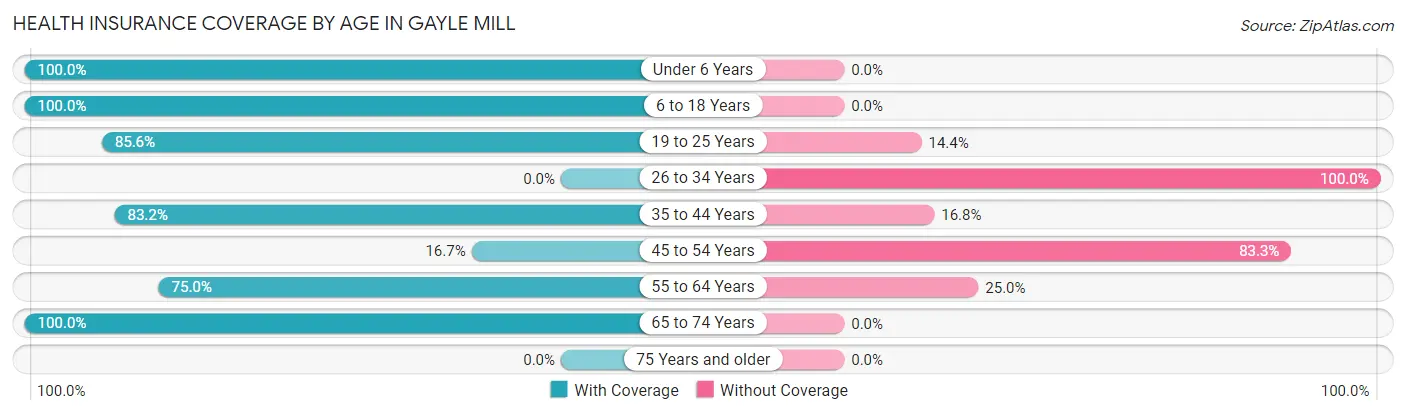
| Age Bracket | With Coverage | Without Coverage |
| Under 6 Years | 137 (100.0%) | 0 (0.0%) |
| 6 to 18 Years | 203 (100.0%) | 0 (0.0%) |
| 19 to 25 Years | 190 (85.6%) | 32 (14.4%) |
| 26 to 34 Years | 0 (0.0%) | 6 (100.0%) |
| 35 to 44 Years | 119 (83.2%) | 24 (16.8%) |
| 45 to 54 Years | 23 (16.7%) | 115 (83.3%) |
| 55 to 64 Years | 105 (75.0%) | 35 (25.0%) |
| 65 to 74 Years | 93 (100.0%) | 0 (0.0%) |
| 75 Years and older | 0 (0.0%) | 0 (0.0%) |
| Total | 870 (80.4%) | 212 (19.6%) |
Health Insurance Coverage by Citizenship Status in Gayle Mill
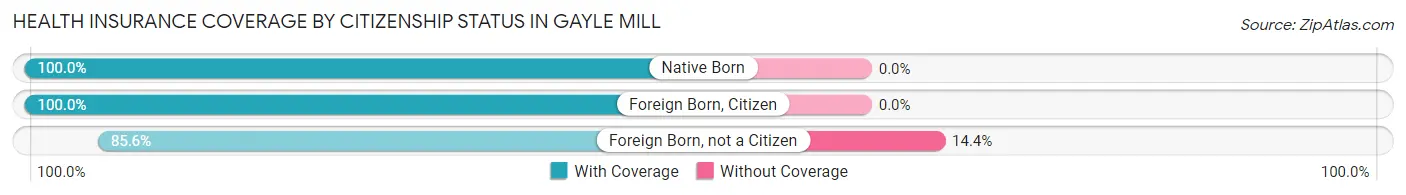
| Citizenship Status | With Coverage | Without Coverage |
| Native Born | 137 (100.0%) | 0 (0.0%) |
| Foreign Born, Citizen | 203 (100.0%) | 0 (0.0%) |
| Foreign Born, not a Citizen | 190 (85.6%) | 32 (14.4%) |
Health Insurance Coverage by Household Income in Gayle Mill
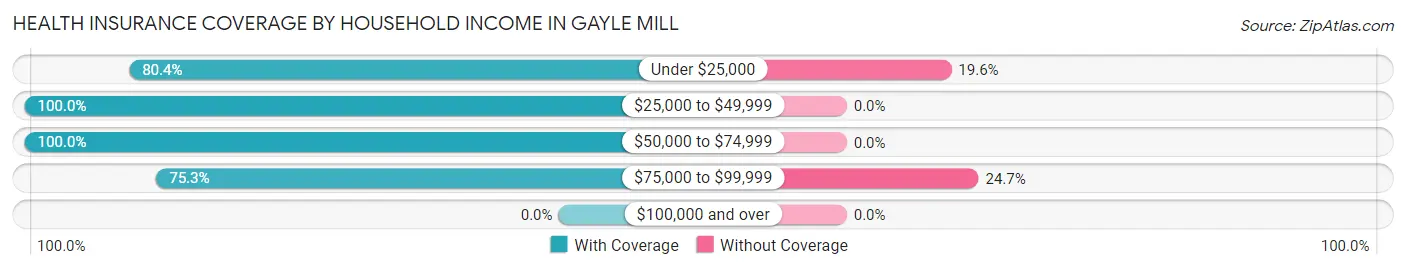
| Household Income | With Coverage | Without Coverage |
| Under $25,000 | 242 (80.4%) | 59 (19.6%) |
| $25,000 to $49,999 | 20 (100.0%) | 0 (0.0%) |
| $50,000 to $74,999 | 140 (100.0%) | 0 (0.0%) |
| $75,000 to $99,999 | 467 (75.3%) | 153 (24.7%) |
| $100,000 and over | 0 (0.0%) | 0 (0.0%) |
Public vs Private Health Insurance Coverage by Age in Gayle Mill
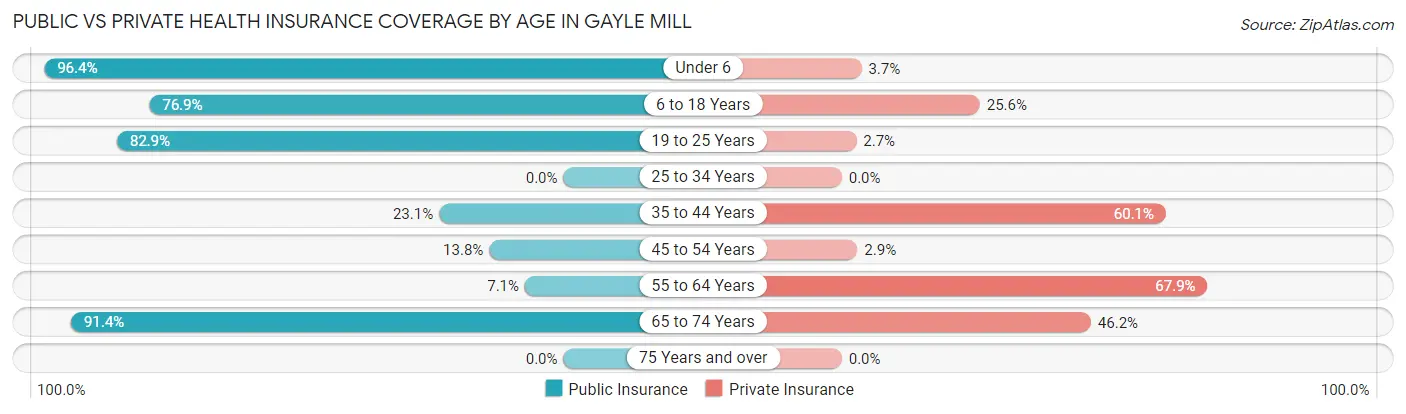
| Age Bracket | Public Insurance | Private Insurance |
| Under 6 | 132 (96.4%) | 5 (3.6%) |
| 6 to 18 Years | 156 (76.8%) | 52 (25.6%) |
| 19 to 25 Years | 184 (82.9%) | 6 (2.7%) |
| 25 to 34 Years | 0 (0.0%) | 0 (0.0%) |
| 35 to 44 Years | 33 (23.1%) | 86 (60.1%) |
| 45 to 54 Years | 19 (13.8%) | 4 (2.9%) |
| 55 to 64 Years | 10 (7.1%) | 95 (67.9%) |
| 65 to 74 Years | 85 (91.4%) | 43 (46.2%) |
| 75 Years and over | 0 (0.0%) | 0 (0.0%) |
| Total | 619 (57.2%) | 291 (26.9%) |
Disability Status by Sex by Age in Gayle Mill
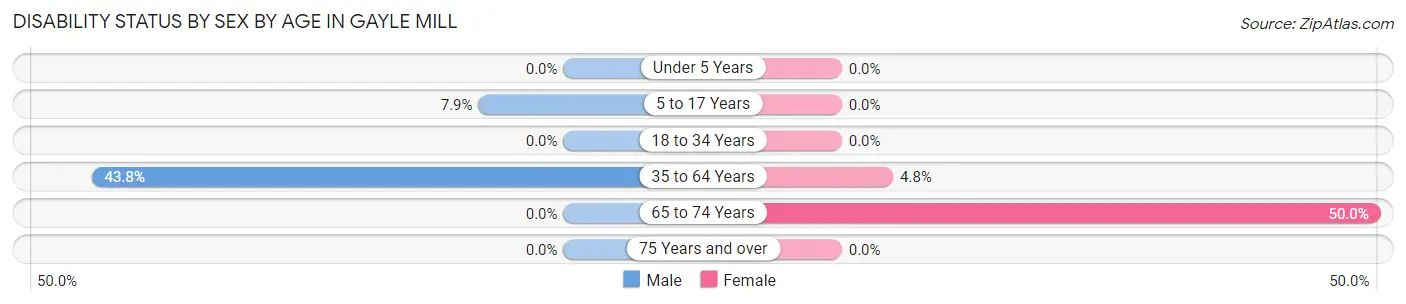
| Age Bracket | Male | Female |
| Under 5 Years | 0 (0.0%) | 0 (0.0%) |
| 5 to 17 Years | 9 (7.9%) | 0 (0.0%) |
| 18 to 34 Years | 0 (0.0%) | 0 (0.0%) |
| 35 to 64 Years | 74 (43.8%) | 12 (4.8%) |
| 65 to 74 Years | 0 (0.0%) | 12 (50.0%) |
| 75 Years and over | 0 (0.0%) | 0 (0.0%) |
Disability Class by Sex by Age in Gayle Mill
Disability Class: Hearing Difficulty
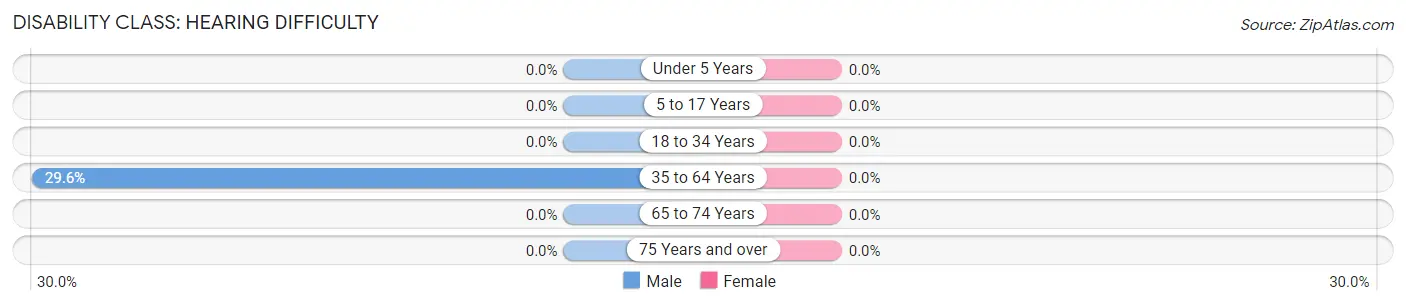
| Age Bracket | Male | Female |
| Under 5 Years | 0 (0.0%) | 0 (0.0%) |
| 5 to 17 Years | 0 (0.0%) | 0 (0.0%) |
| 18 to 34 Years | 0 (0.0%) | 0 (0.0%) |
| 35 to 64 Years | 50 (29.6%) | 0 (0.0%) |
| 65 to 74 Years | 0 (0.0%) | 0 (0.0%) |
| 75 Years and over | 0 (0.0%) | 0 (0.0%) |
Disability Class: Vision Difficulty
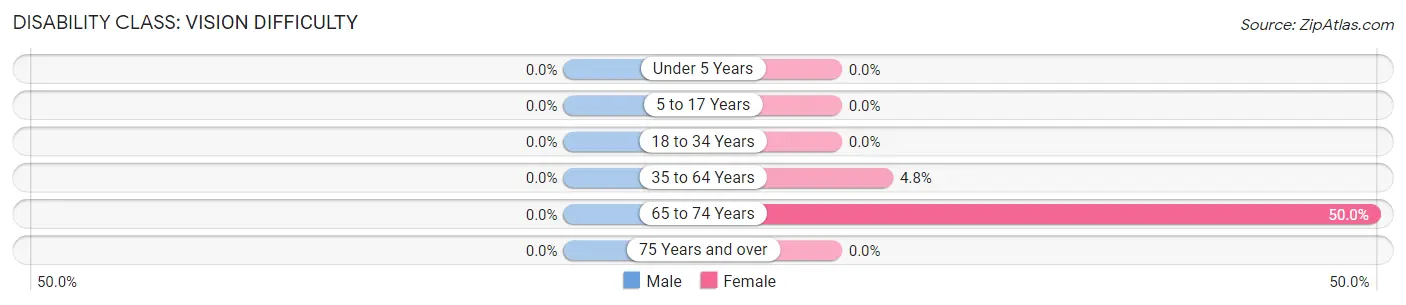
| Age Bracket | Male | Female |
| Under 5 Years | 0 (0.0%) | 0 (0.0%) |
| 5 to 17 Years | 0 (0.0%) | 0 (0.0%) |
| 18 to 34 Years | 0 (0.0%) | 0 (0.0%) |
| 35 to 64 Years | 0 (0.0%) | 12 (4.8%) |
| 65 to 74 Years | 0 (0.0%) | 12 (50.0%) |
| 75 Years and over | 0 (0.0%) | 0 (0.0%) |
Disability Class: Cognitive Difficulty
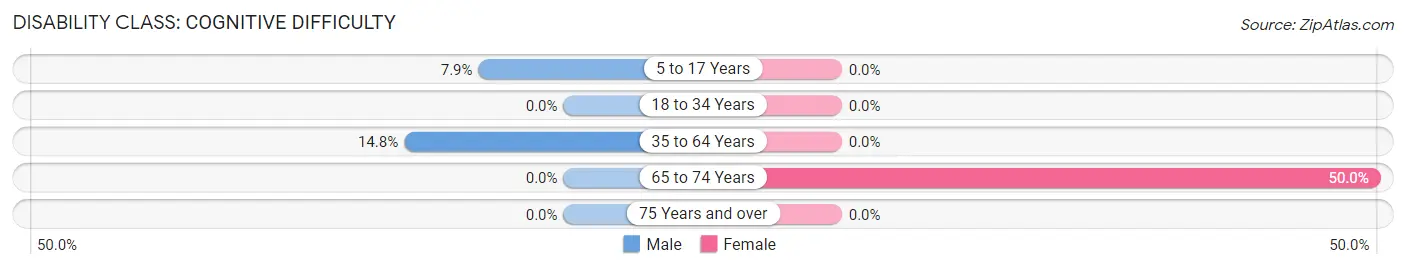
| Age Bracket | Male | Female |
| 5 to 17 Years | 9 (7.9%) | 0 (0.0%) |
| 18 to 34 Years | 0 (0.0%) | 0 (0.0%) |
| 35 to 64 Years | 25 (14.8%) | 0 (0.0%) |
| 65 to 74 Years | 0 (0.0%) | 12 (50.0%) |
| 75 Years and over | 0 (0.0%) | 0 (0.0%) |
Disability Class: Ambulatory Difficulty
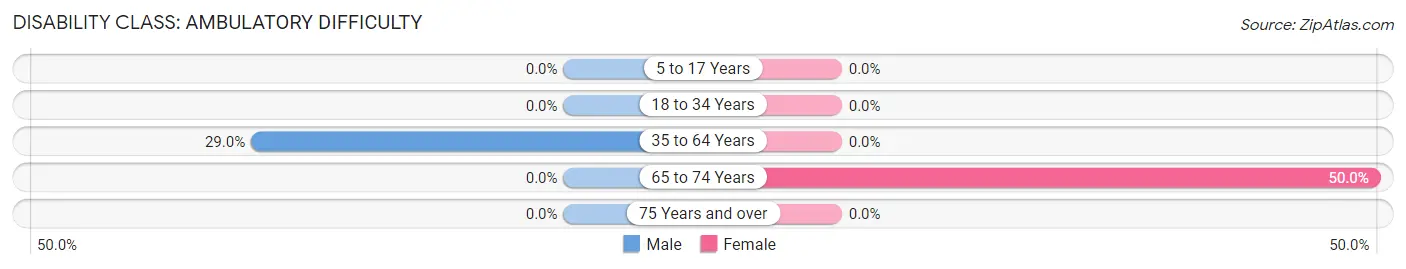
| Age Bracket | Male | Female |
| 5 to 17 Years | 0 (0.0%) | 0 (0.0%) |
| 18 to 34 Years | 0 (0.0%) | 0 (0.0%) |
| 35 to 64 Years | 49 (29.0%) | 0 (0.0%) |
| 65 to 74 Years | 0 (0.0%) | 12 (50.0%) |
| 75 Years and over | 0 (0.0%) | 0 (0.0%) |
Disability Class: Self-Care Difficulty
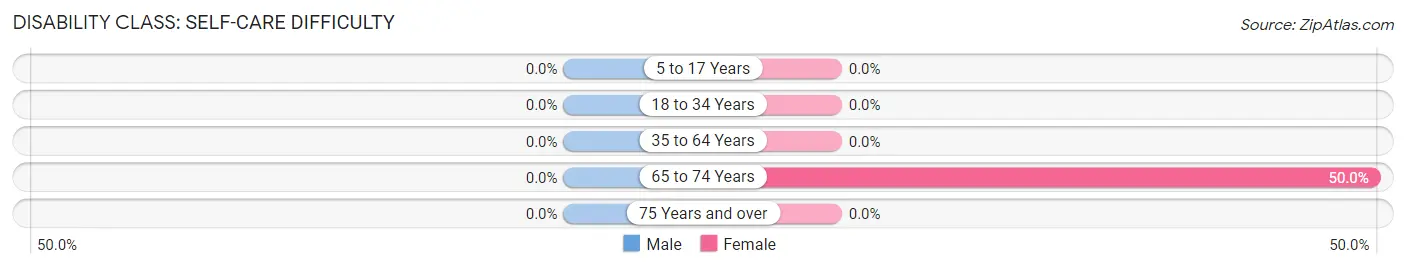
| Age Bracket | Male | Female |
| 5 to 17 Years | 0 (0.0%) | 0 (0.0%) |
| 18 to 34 Years | 0 (0.0%) | 0 (0.0%) |
| 35 to 64 Years | 0 (0.0%) | 0 (0.0%) |
| 65 to 74 Years | 0 (0.0%) | 12 (50.0%) |
| 75 Years and over | 0 (0.0%) | 0 (0.0%) |
Technology Access in Gayle Mill
Computing Device Access in Gayle Mill
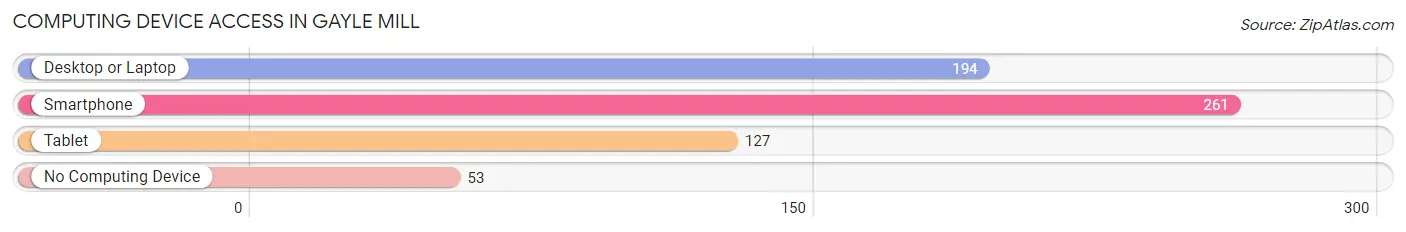
| Device Type | # Households | % Households |
| Desktop or Laptop | 194 | 58.1% |
| Smartphone | 261 | 78.1% |
| Tablet | 127 | 38.0% |
| No Computing Device | 53 | 15.9% |
| Total | 334 | 100.0% |
Internet Access in Gayle Mill
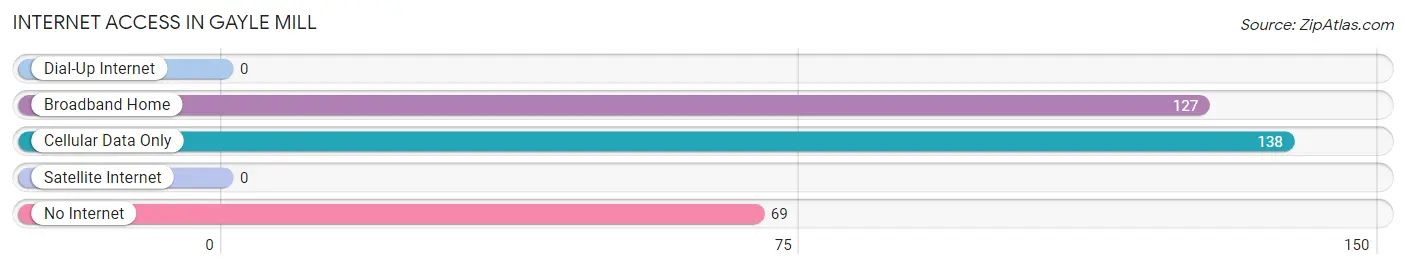
| Internet Type | # Households | % Households |
| Dial-Up Internet | 0 | 0.0% |
| Broadband Home | 127 | 38.0% |
| Cellular Data Only | 138 | 41.3% |
| Satellite Internet | 0 | 0.0% |
| No Internet | 69 | 20.7% |
| Total | 334 | 100.0% |
Gayle Mill Summary
The small town of Gayle Mill, South Carolina is located in the northwestern corner of the state, in the foothills of the Blue Ridge Mountains. It is a rural community with a population of just over 1,000 people, and is part of the larger Greenville-Spartanburg-Anderson metropolitan area. The town is known for its scenic beauty, and is home to a number of historic sites, including the Gayle Mill Covered Bridge, which is listed on the National Register of Historic Places.
Geography
Gayle Mill is located in the northwestern corner of South Carolina, in the foothills of the Blue Ridge Mountains. The town is situated in the Piedmont region of the state, and is part of the larger Greenville-Spartanburg-Anderson metropolitan area. The town is located at an elevation of 890 feet above sea level, and is surrounded by rolling hills and forests. The nearest major city is Greenville, which is located about 25 miles to the southeast.
Climate
Gayle Mill has a humid subtropical climate, with hot, humid summers and mild winters. The average annual temperature is around 61°F, with an average high of 79°F in the summer and an average low of 43°F in the winter. The town receives an average of 48 inches of precipitation per year, with most of it falling in the form of rain.
Demographics
As of the 2010 census, the population of Gayle Mill was 1,072. The racial makeup of the town was 94.3% White, 3.2% African American, 0.3% Native American, 0.3% Asian, 0.2% from other races, and 1.7% from two or more races. Hispanic or Latino of any race were 1.2% of the population.
Economy
The economy of Gayle Mill is largely based on agriculture and forestry. The town is home to several farms, as well as a sawmill and a lumber mill. The town also has a few small businesses, including a grocery store, a hardware store, and a few restaurants.
Education
Gayle Mill is served by the Greenville County School District. The town has one public school, Gayle Mill Elementary School, which serves students in grades K-5. The nearest high school is located in nearby Travelers Rest.
Conclusion
Gayle Mill is a small, rural town located in the northwestern corner of South Carolina. The town is known for its scenic beauty and historic sites, and is home to a number of farms and small businesses. The town has a humid subtropical climate, with hot, humid summers and mild winters. The population of Gayle Mill is just over 1,000 people, and the town is served by the Greenville County School District. The economy of Gayle Mill is largely based on agriculture and forestry, and the town has a few small businesses.
Common Questions
What is Per Capita Income in Gayle Mill?
Per Capita income in Gayle Mill is $17,947.
What is the Median Family Income in Gayle Mill?
Median Family Income in Gayle Mill is $73,662.
What is the Median Household income in Gayle Mill?
Median Household Income in Gayle Mill is $74,022.
What is Income or Wage Gap in Gayle Mill?
Income or Wage Gap in Gayle Mill is 37.1%.
Women in Gayle Mill earn 62.9 cents for every dollar earned by a man.
What is Inequality or Gini Index in Gayle Mill?
Inequality or Gini Index in Gayle Mill is 0.28.
What is the Total Population of Gayle Mill?
Total Population of Gayle Mill is 1,082.
What is the Total Male Population of Gayle Mill?
Total Male Population of Gayle Mill is 503.
What is the Total Female Population of Gayle Mill?
Total Female Population of Gayle Mill is 579.
What is the Ratio of Males per 100 Females in Gayle Mill?
There are 86.87 Males per 100 Females in Gayle Mill.
What is the Ratio of Females per 100 Males in Gayle Mill?
There are 115.11 Females per 100 Males in Gayle Mill.
What is the Median Population Age in Gayle Mill?
Median Population Age in Gayle Mill is 25.6 Years.
What is the Average Family Size in Gayle Mill
Average Family Size in Gayle Mill is 3.8 People.
What is the Average Household Size in Gayle Mill
Average Household Size in Gayle Mill is 3.2 People.
How Large is the Labor Force in Gayle Mill?
There are 553 People in the Labor Forcein in Gayle Mill.
What is the Percentage of People in the Labor Force in Gayle Mill?
65.8% of People are in the Labor Force in Gayle Mill.
What is the Unemployment Rate in Gayle Mill?
Unemployment Rate in Gayle Mill is 1.1%.