Red Hill, SC Map & Demographics
Red Hill Map
Red Hill Overview
$27,934
PER CAPITA INCOME
$61,685
AVG FAMILY INCOME
$56,204
AVG HOUSEHOLD INCOME
8.4%
WAGE / INCOME GAP [ % ]
91.6¢/ $1
WAGE / INCOME GAP [ $ ]
$7,936
FAMILY INCOME DEFICIT
0.42
INEQUALITY / GINI INDEX
15,585
TOTAL POPULATION
7,428
MALE POPULATION
8,157
FEMALE POPULATION
91.06
MALES / 100 FEMALES
109.81
FEMALES / 100 MALES
43.1
MEDIAN AGE
3.0
AVG FAMILY SIZE
2.7
AVG HOUSEHOLD SIZE
6,973
LABOR FORCE [ PEOPLE ]
53.3%
PERCENT IN LABOR FORCE
6.3%
UNEMPLOYMENT RATE
Income in Red Hill
Income Overview in Red Hill
Per Capita Income in Red Hill is $27,934, while median incomes of families and households are $61,685 and $56,204 respectively.
| Characteristic | Number | Measure |
| Per Capita Income | 15,585 | $27,934 |
| Median Family Income | 3,930 | $61,685 |
| Mean Family Income | 3,930 | $78,147 |
| Median Household Income | 5,742 | $56,204 |
| Mean Household Income | 5,742 | $69,758 |
| Income Deficit | 3,930 | $7,936 |
| Wage / Income Gap (%) | 15,585 | 8.44% |
| Wage / Income Gap ($) | 15,585 | 91.56¢ per $1 |
| Gini / Inequality Index | 15,585 | 0.42 |
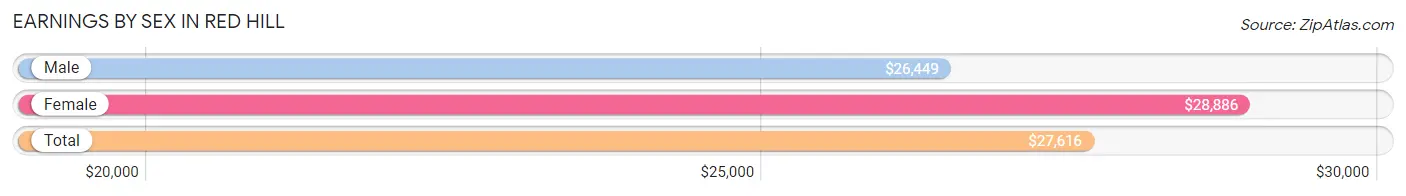
Earnings by Sex in Red Hill
Average Earnings in Red Hill are $27,616, $26,449 for men and $28,886 for women, a difference of 8.4%.
| Sex | Number | Average Earnings |
| Male | 4,136 (54.4%) | $26,449 |
| Female | 3,465 (45.6%) | $28,886 |
| Total | 7,601 (100.0%) | $27,616 |
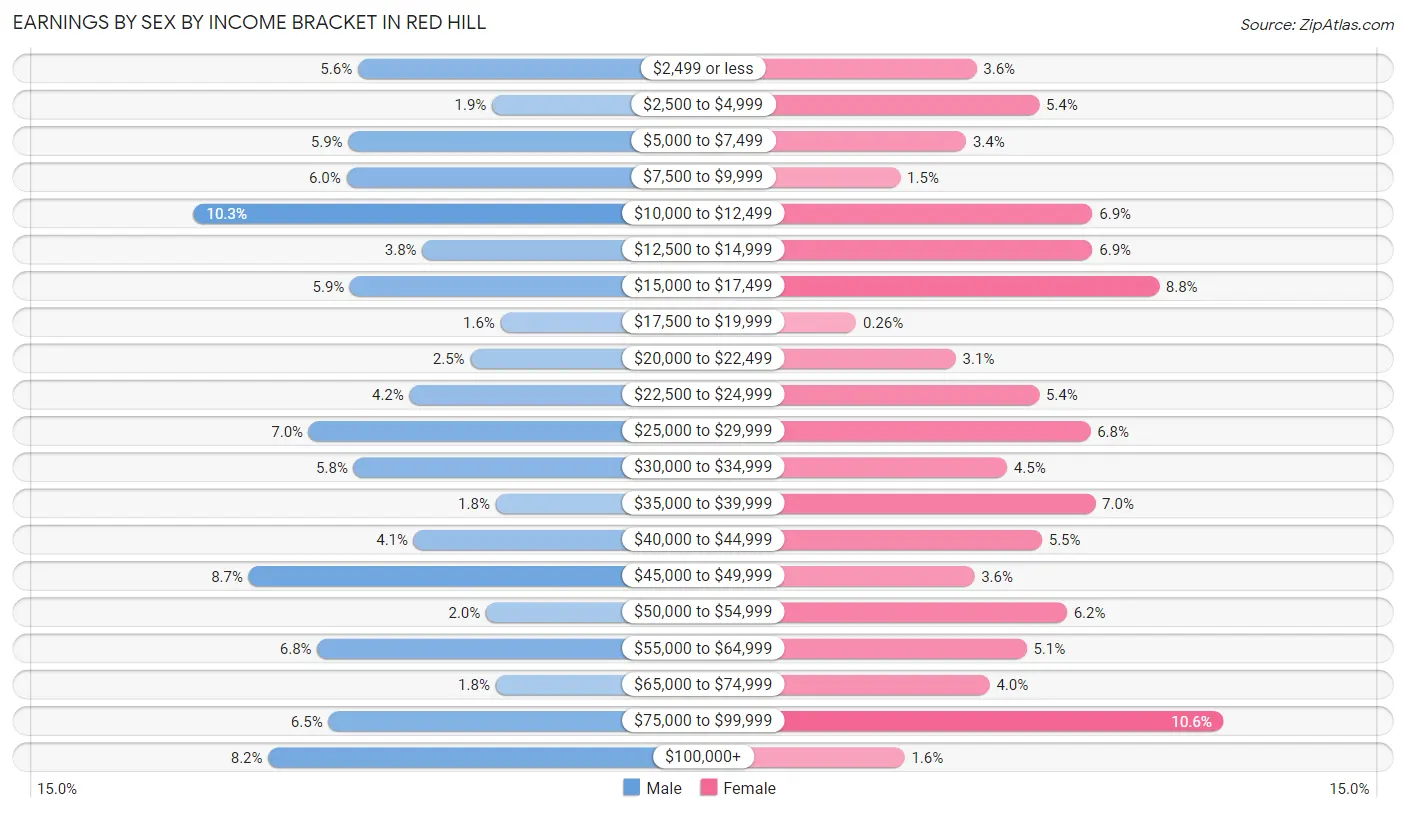
Earnings by Sex by Income Bracket in Red Hill
The most common earnings brackets in Red Hill are $10,000 to $12,499 for men (424 | 10.2%) and $75,000 to $99,999 for women (367 | 10.6%).
| Income | Male | Female |
| $2,499 or less | 233 (5.6%) | 126 (3.6%) |
| $2,500 to $4,999 | 77 (1.9%) | 187 (5.4%) |
| $5,000 to $7,499 | 244 (5.9%) | 116 (3.4%) |
| $7,500 to $9,999 | 246 (5.9%) | 52 (1.5%) |
| $10,000 to $12,499 | 424 (10.2%) | 239 (6.9%) |
| $12,500 to $14,999 | 158 (3.8%) | 239 (6.9%) |
| $15,000 to $17,499 | 242 (5.9%) | 304 (8.8%) |
| $17,500 to $19,999 | 67 (1.6%) | 9 (0.3%) |
| $20,000 to $22,499 | 102 (2.5%) | 106 (3.1%) |
| $22,500 to $24,999 | 173 (4.2%) | 187 (5.4%) |
| $25,000 to $29,999 | 290 (7.0%) | 237 (6.8%) |
| $30,000 to $34,999 | 238 (5.8%) | 156 (4.5%) |
| $35,000 to $39,999 | 73 (1.8%) | 242 (7.0%) |
| $40,000 to $44,999 | 168 (4.1%) | 190 (5.5%) |
| $45,000 to $49,999 | 360 (8.7%) | 124 (3.6%) |
| $50,000 to $54,999 | 84 (2.0%) | 214 (6.2%) |
| $55,000 to $64,999 | 280 (6.8%) | 175 (5.1%) |
| $65,000 to $74,999 | 73 (1.8%) | 139 (4.0%) |
| $75,000 to $99,999 | 267 (6.5%) | 367 (10.6%) |
| $100,000+ | 337 (8.2%) | 56 (1.6%) |
| Total | 4,136 (100.0%) | 3,465 (100.0%) |
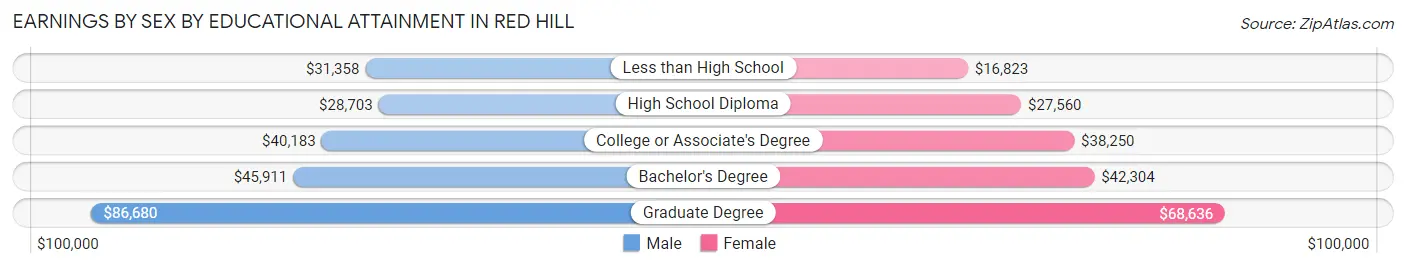
Earnings by Sex by Educational Attainment in Red Hill
Average earnings in Red Hill are $37,997 for men and $35,833 for women, a difference of 5.7%. Men with an educational attainment of graduate degree enjoy the highest average annual earnings of $86,680, while those with high school diploma education earn the least with $28,703. Women with an educational attainment of graduate degree earn the most with the average annual earnings of $68,636, while those with less than high school education have the smallest earnings of $16,823.
| Educational Attainment | Male Income | Female Income |
| Less than High School | $31,358 | $16,823 |
| High School Diploma | $28,703 | $27,560 |
| College or Associate's Degree | $40,183 | $38,250 |
| Bachelor's Degree | $45,911 | $42,304 |
| Graduate Degree | $86,680 | $68,636 |
| Total | $37,997 | $35,833 |
Family Income in Red Hill
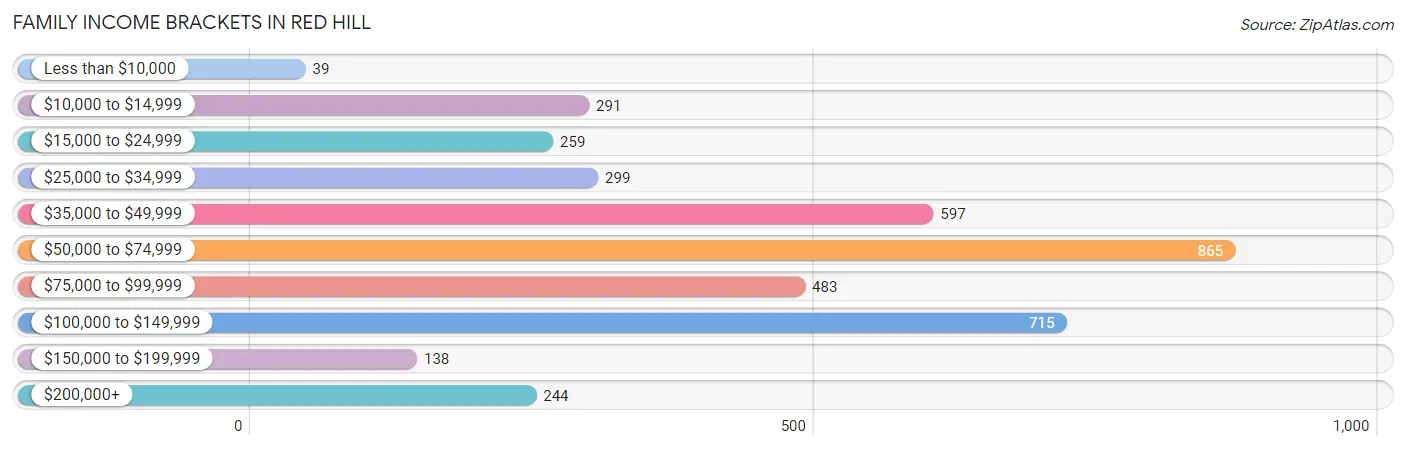
Family Income Brackets in Red Hill
According to the Red Hill family income data, there are 865 families falling into the $50,000 to $74,999 income range, which is the most common income bracket and makes up 22.0% of all families. Conversely, the less than $10,000 income bracket is the least frequent group with only 39 families (1.0%) belonging to this category.
| Income Bracket | # Families | % Families |
| Less than $10,000 | 39 | 1.0% |
| $10,000 to $14,999 | 291 | 7.4% |
| $15,000 to $24,999 | 259 | 6.6% |
| $25,000 to $34,999 | 299 | 7.6% |
| $35,000 to $49,999 | 597 | 15.2% |
| $50,000 to $74,999 | 865 | 22.0% |
| $75,000 to $99,999 | 483 | 12.3% |
| $100,000 to $149,999 | 715 | 18.2% |
| $150,000 to $199,999 | 138 | 3.5% |
| $200,000+ | 244 | 6.2% |
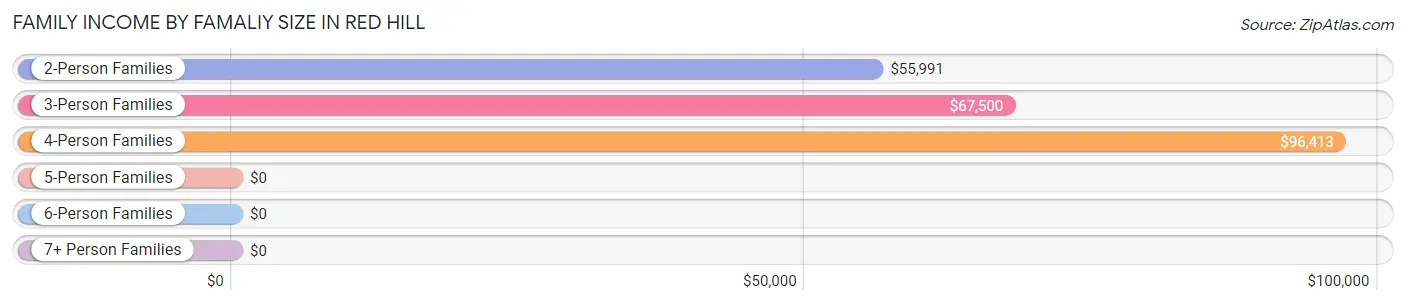
Family Income by Famaliy Size in Red Hill
4-person families (560 | 14.2%) account for the highest median family income in Red Hill with $96,413 per family, while 2-person families (2,266 | 57.7%) have the highest median income of $27,996 per family member.
| Income Bracket | # Families | Median Income |
| 2-Person Families | 2,266 (57.7%) | $55,991 |
| 3-Person Families | 932 (23.7%) | $67,500 |
| 4-Person Families | 560 (14.2%) | $96,413 |
| 5-Person Families | 165 (4.2%) | $0 |
| 6-Person Families | 7 (0.2%) | $0 |
| 7+ Person Families | 0 (0.0%) | $0 |
| Total | 3,930 (100.0%) | $61,685 |
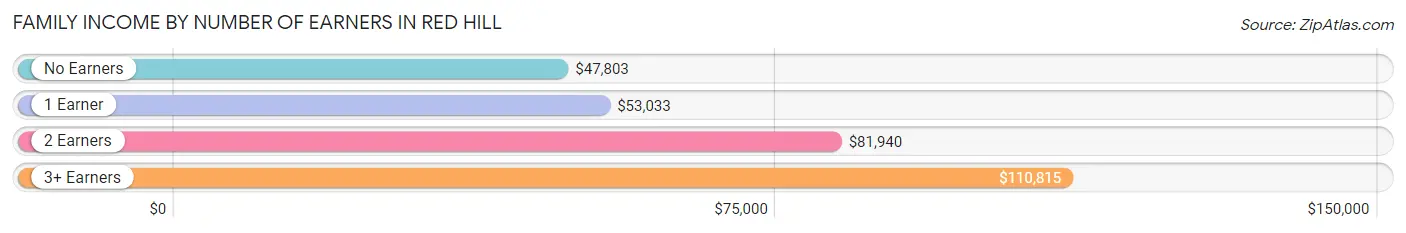
Family Income by Number of Earners in Red Hill
The median family income in Red Hill is $61,685, with families comprising 3+ earners (323) having the highest median family income of $110,815, while families with no earners (994) have the lowest median family income of $47,803, accounting for 8.2% and 25.3% of families, respectively.
| Number of Earners | # Families | Median Income |
| No Earners | 994 (25.3%) | $47,803 |
| 1 Earner | 1,459 (37.1%) | $53,033 |
| 2 Earners | 1,154 (29.4%) | $81,940 |
| 3+ Earners | 323 (8.2%) | $110,815 |
| Total | 3,930 (100.0%) | $61,685 |
Household Income in Red Hill
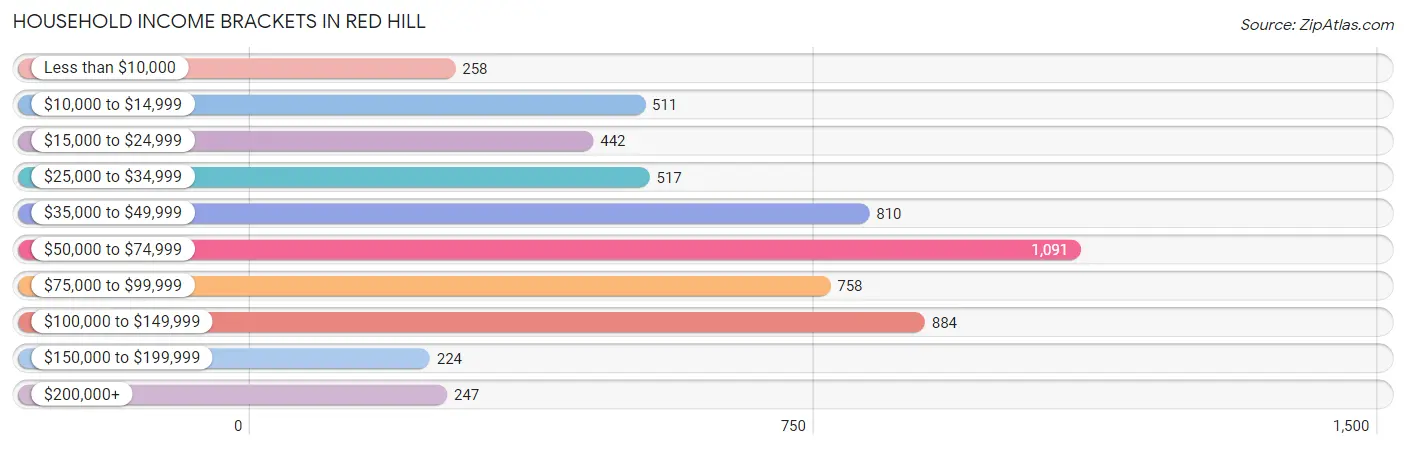
Household Income Brackets in Red Hill
With 1,091 households falling in the category, the $50,000 to $74,999 income range is the most frequent in Red Hill, accounting for 19.0% of all households. In contrast, only 224 households (3.9%) fall into the $150,000 to $199,999 income bracket, making it the least populous group.
| Income Bracket | # Households | % Households |
| Less than $10,000 | 258 | 4.5% |
| $10,000 to $14,999 | 511 | 8.9% |
| $15,000 to $24,999 | 442 | 7.7% |
| $25,000 to $34,999 | 517 | 9.0% |
| $35,000 to $49,999 | 810 | 14.1% |
| $50,000 to $74,999 | 1,091 | 19.0% |
| $75,000 to $99,999 | 758 | 13.2% |
| $100,000 to $149,999 | 884 | 15.4% |
| $150,000 to $199,999 | 224 | 3.9% |
| $200,000+ | 247 | 4.3% |
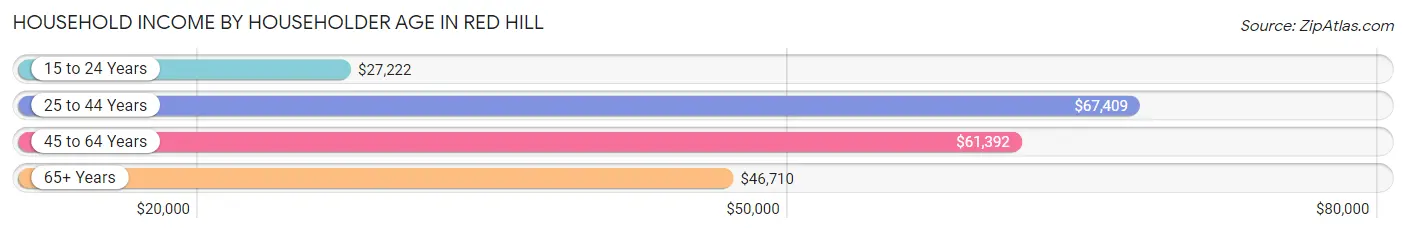
Household Income by Householder Age in Red Hill
The median household income in Red Hill is $56,204, with the highest median household income of $67,409 found in the 25 to 44 years age bracket for the primary householder. A total of 1,577 households (27.5%) fall into this category. Meanwhile, the 15 to 24 years age bracket for the primary householder has the lowest median household income of $27,222, with 212 households (3.7%) in this group.
| Income Bracket | # Households | Median Income |
| 15 to 24 Years | 212 (3.7%) | $27,222 |
| 25 to 44 Years | 1,577 (27.5%) | $67,409 |
| 45 to 64 Years | 1,925 (33.5%) | $61,392 |
| 65+ Years | 2,028 (35.3%) | $46,710 |
| Total | 5,742 (100.0%) | $56,204 |
Poverty in Red Hill
Income Below Poverty by Sex and Age in Red Hill
With 17.5% poverty level for males and 23.5% for females among the residents of Red Hill, 18 to 24 year old males and 18 to 24 year old females are the most vulnerable to poverty, with 374 males (38.4%) and 425 females (61.8%) in their respective age groups living below the poverty level.
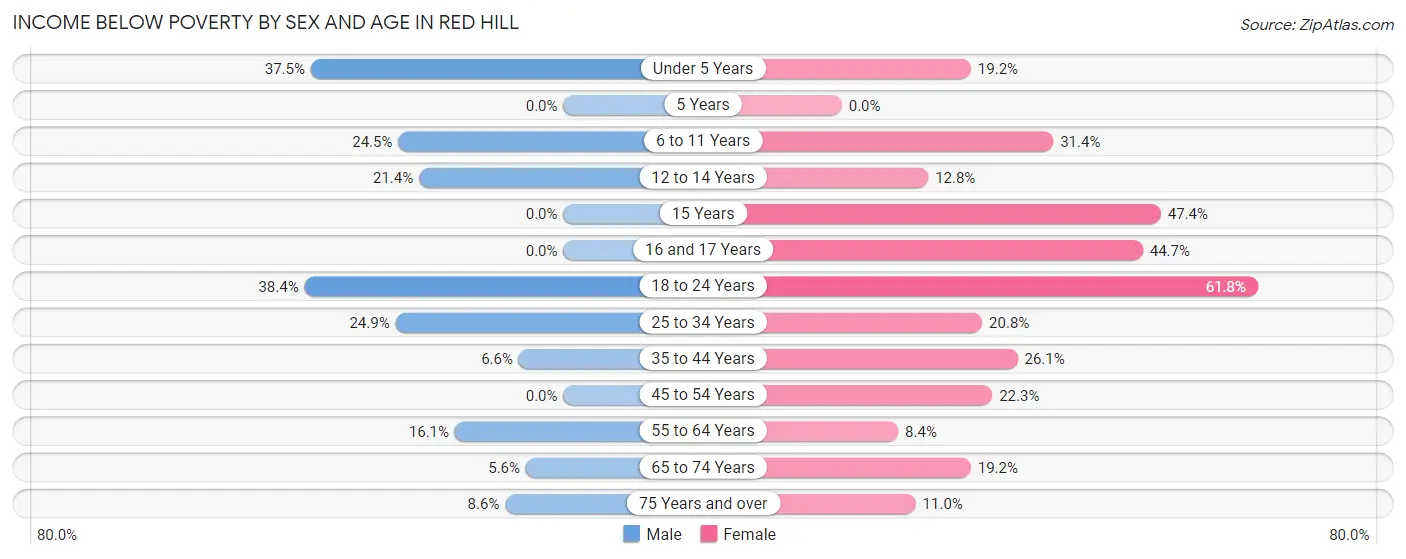
| Age Bracket | Male | Female |
| Under 5 Years | 144 (37.5%) | 106 (19.2%) |
| 5 Years | 0 (0.0%) | 0 (0.0%) |
| 6 to 11 Years | 125 (24.5%) | 135 (31.4%) |
| 12 to 14 Years | 54 (21.4%) | 24 (12.8%) |
| 15 Years | 0 (0.0%) | 36 (47.4%) |
| 16 and 17 Years | 0 (0.0%) | 122 (44.7%) |
| 18 to 24 Years | 374 (38.4%) | 425 (61.8%) |
| 25 to 34 Years | 252 (24.9%) | 169 (20.8%) |
| 35 to 44 Years | 54 (6.6%) | 207 (26.1%) |
| 45 to 54 Years | 0 (0.0%) | 307 (22.3%) |
| 55 to 64 Years | 184 (16.1%) | 87 (8.4%) |
| 65 to 74 Years | 49 (5.6%) | 196 (19.2%) |
| 75 Years and over | 48 (8.6%) | 97 (11.0%) |
| Total | 1,284 (17.5%) | 1,911 (23.5%) |
Income Above Poverty by Sex and Age in Red Hill
According to the poverty statistics in Red Hill, males aged 5 years and females aged 5 years are the age groups that are most secure financially, with 100.0% of males and 100.0% of females in these age groups living above the poverty line.
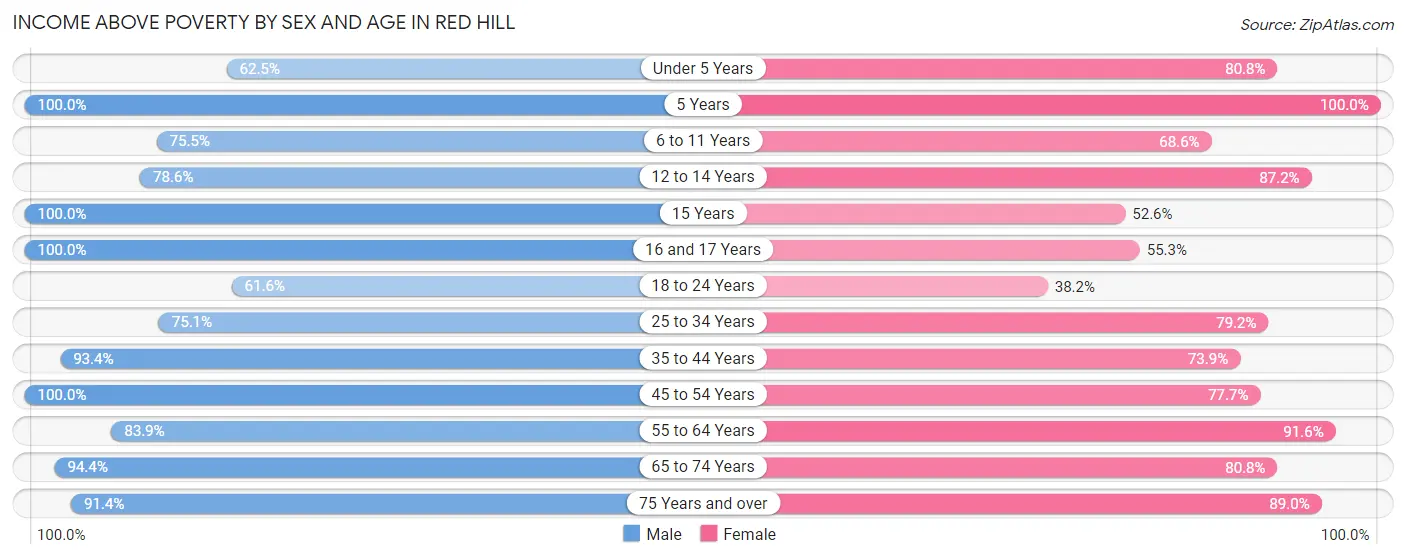
| Age Bracket | Male | Female |
| Under 5 Years | 240 (62.5%) | 447 (80.8%) |
| 5 Years | 40 (100.0%) | 10 (100.0%) |
| 6 to 11 Years | 385 (75.5%) | 295 (68.6%) |
| 12 to 14 Years | 198 (78.6%) | 163 (87.2%) |
| 15 Years | 29 (100.0%) | 40 (52.6%) |
| 16 and 17 Years | 159 (100.0%) | 151 (55.3%) |
| 18 to 24 Years | 599 (61.6%) | 263 (38.2%) |
| 25 to 34 Years | 759 (75.1%) | 642 (79.2%) |
| 35 to 44 Years | 762 (93.4%) | 586 (73.9%) |
| 45 to 54 Years | 595 (100.0%) | 1,067 (77.7%) |
| 55 to 64 Years | 958 (83.9%) | 952 (91.6%) |
| 65 to 74 Years | 830 (94.4%) | 827 (80.8%) |
| 75 Years and over | 508 (91.4%) | 787 (89.0%) |
| Total | 6,062 (82.5%) | 6,230 (76.5%) |
Income Below Poverty Among Married-Couple Families in Red Hill
The poverty statistics for married-couple families in Red Hill show that 3.7% or 98 of the total 2,658 families live below the poverty line. Families with 3 or 4 children have the highest poverty rate of 21.3%, comprising of 26 families. On the other hand, families with no children have the lowest poverty rate of 2.8%, which includes 54 families.
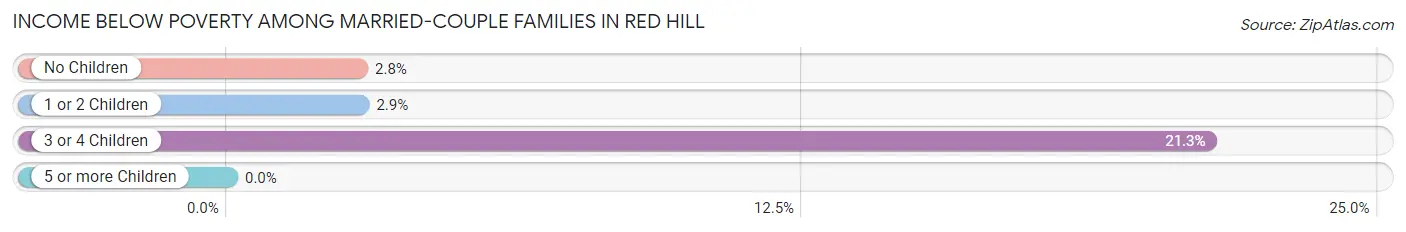
| Children | Above Poverty | Below Poverty |
| No Children | 1,852 (97.2%) | 54 (2.8%) |
| 1 or 2 Children | 612 (97.1%) | 18 (2.9%) |
| 3 or 4 Children | 96 (78.7%) | 26 (21.3%) |
| 5 or more Children | 0 (0.0%) | 0 (0.0%) |
| Total | 2,560 (96.3%) | 98 (3.7%) |
Income Below Poverty Among Single-Parent Households in Red Hill
According to the poverty data in Red Hill, 35.0% or 106 single-father households and 30.7% or 298 single-mother households are living below the poverty line. Among single-father households, those with no children have the highest poverty rate, with 106 households (77.4%) experiencing poverty. Likewise, among single-mother households, those with 3 or 4 children have the highest poverty rate, with 68 households (65.4%) falling below the poverty line.
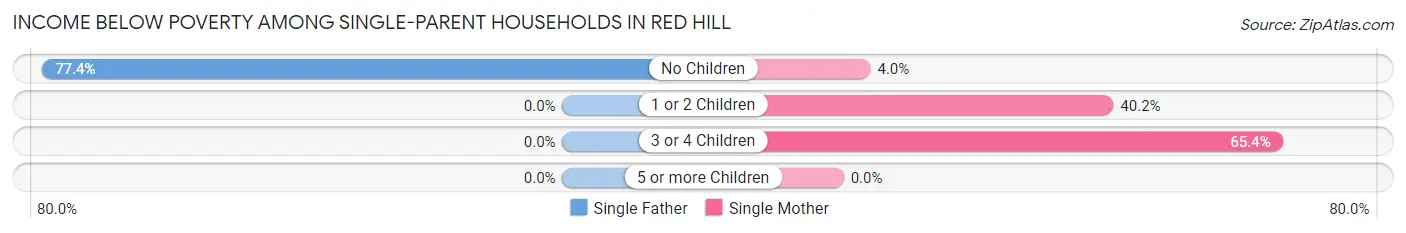
| Children | Single Father | Single Mother |
| No Children | 106 (77.4%) | 13 (4.0%) |
| 1 or 2 Children | 0 (0.0%) | 217 (40.2%) |
| 3 or 4 Children | 0 (0.0%) | 68 (65.4%) |
| 5 or more Children | 0 (0.0%) | 0 (0.0%) |
| Total | 106 (35.0%) | 298 (30.7%) |
Income Below Poverty Among Married-Couple vs Single-Parent Households in Red Hill
The poverty data for Red Hill shows that 98 of the married-couple family households (3.7%) and 404 of the single-parent households (31.8%) are living below the poverty level. Within the married-couple family households, those with 3 or 4 children have the highest poverty rate, with 26 households (21.3%) falling below the poverty line. Among the single-parent households, those with 3 or 4 children have the highest poverty rate, with 68 household (65.4%) living below poverty.
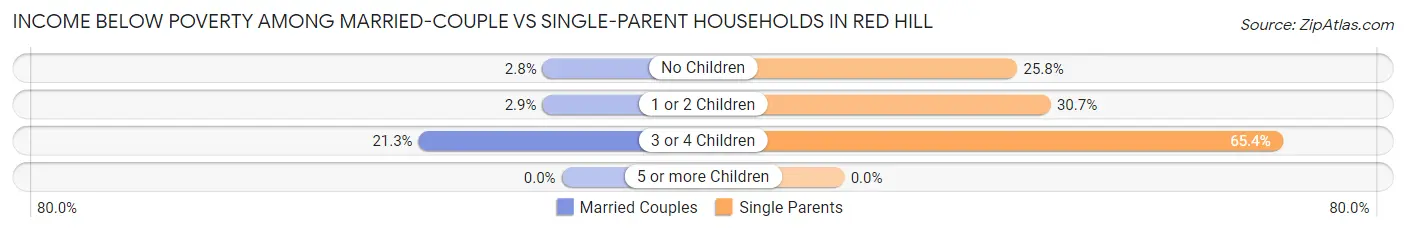
| Children | Married-Couple Families | Single-Parent Households |
| No Children | 54 (2.8%) | 119 (25.8%) |
| 1 or 2 Children | 18 (2.9%) | 217 (30.7%) |
| 3 or 4 Children | 26 (21.3%) | 68 (65.4%) |
| 5 or more Children | 0 (0.0%) | 0 (0.0%) |
| Total | 98 (3.7%) | 404 (31.8%) |
Race in Red Hill
The most populous races in Red Hill are White / Caucasian (11,918 | 76.5%), Black / African American (1,813 | 11.6%), and Hispanic or Latino (1,598 | 10.2%).
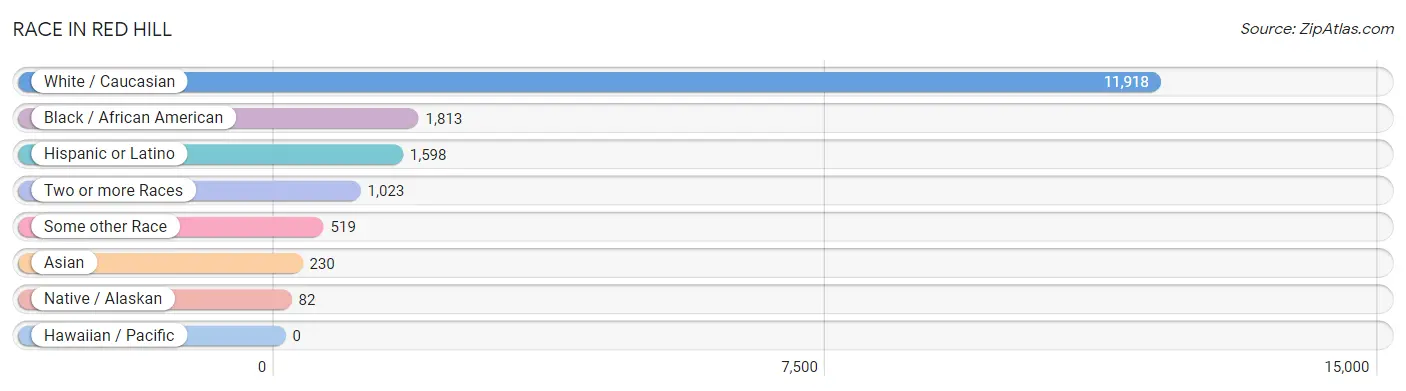
| Race | # Population | % Population |
| Asian | 230 | 1.5% |
| Black / African American | 1,813 | 11.6% |
| Hawaiian / Pacific | 0 | 0.0% |
| Hispanic or Latino | 1,598 | 10.2% |
| Native / Alaskan | 82 | 0.5% |
| White / Caucasian | 11,918 | 76.5% |
| Two or more Races | 1,023 | 6.6% |
| Some other Race | 519 | 3.3% |
| Total | 15,585 | 100.0% |
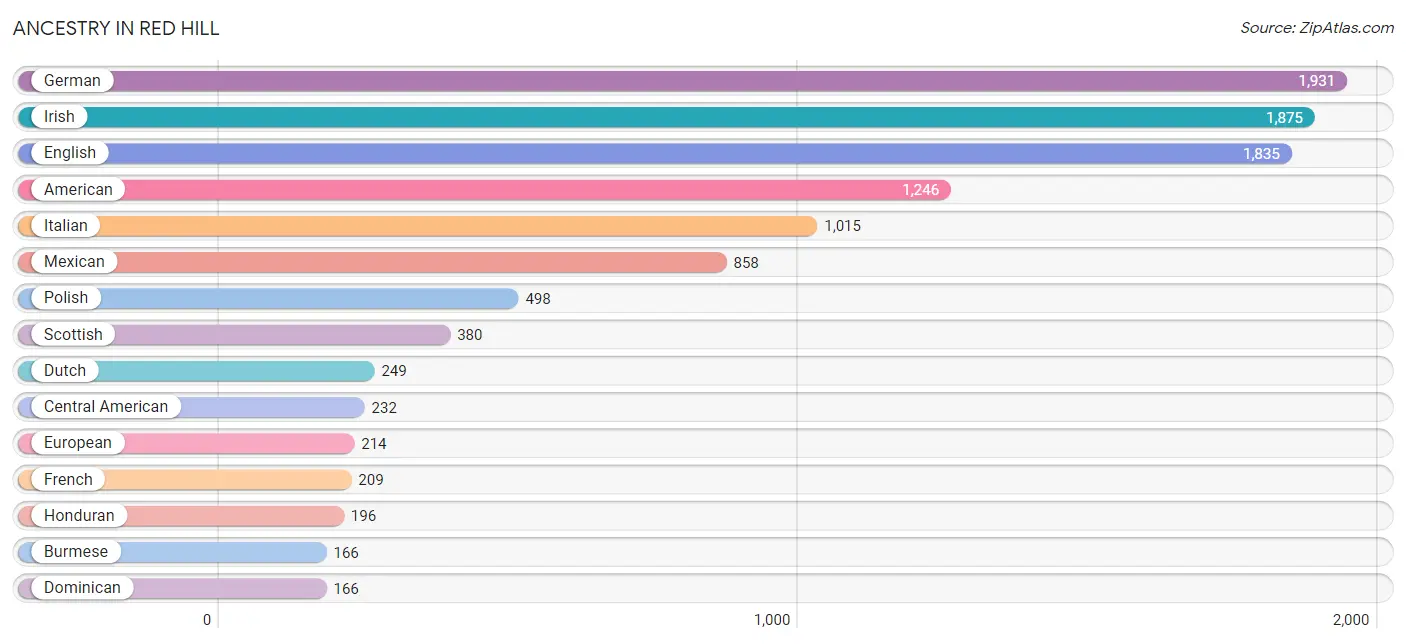
Ancestry in Red Hill
The most populous ancestries reported in Red Hill are German (1,931 | 12.4%), Irish (1,875 | 12.0%), English (1,835 | 11.8%), American (1,246 | 8.0%), and Italian (1,015 | 6.5%), together accounting for 50.7% of all Red Hill residents.
| Ancestry | # Population | % Population |
| African | 62 | 0.4% |
| American | 1,246 | 8.0% |
| Apache | 5 | 0.0% |
| Austrian | 8 | 0.1% |
| Bhutanese | 57 | 0.4% |
| British | 105 | 0.7% |
| Burmese | 166 | 1.1% |
| Canadian | 16 | 0.1% |
| Central American | 232 | 1.5% |
| Cherokee | 83 | 0.5% |
| Chilean | 8 | 0.1% |
| Choctaw | 33 | 0.2% |
| Colombian | 26 | 0.2% |
| Cuban | 33 | 0.2% |
| Czech | 20 | 0.1% |
| Danish | 9 | 0.1% |
| Dominican | 166 | 1.1% |
| Dutch | 249 | 1.6% |
| Eastern European | 82 | 0.5% |
| Ecuadorian | 18 | 0.1% |
| English | 1,835 | 11.8% |
| European | 214 | 1.4% |
| Finnish | 13 | 0.1% |
| French | 209 | 1.3% |
| French Canadian | 40 | 0.3% |
| German | 1,931 | 12.4% |
| Greek | 25 | 0.2% |
| Honduran | 196 | 1.3% |
| Hungarian | 92 | 0.6% |
| Indian (Asian) | 16 | 0.1% |
| Inupiat | 1 | 0.0% |
| Irish | 1,875 | 12.0% |
| Italian | 1,015 | 6.5% |
| Japanese | 115 | 0.7% |
| Korean | 78 | 0.5% |
| Lithuanian | 27 | 0.2% |
| Mexican | 858 | 5.5% |
| Mexican American Indian | 12 | 0.1% |
| Norwegian | 44 | 0.3% |
| Polish | 498 | 3.2% |
| Puerto Rican | 116 | 0.7% |
| Romanian | 9 | 0.1% |
| Russian | 9 | 0.1% |
| Salvadoran | 36 | 0.2% |
| Scandinavian | 10 | 0.1% |
| Scotch-Irish | 158 | 1.0% |
| Scottish | 380 | 2.4% |
| Slovak | 3 | 0.0% |
| South American | 66 | 0.4% |
| Spaniard | 28 | 0.2% |
| Spanish | 24 | 0.2% |
| Subsaharan African | 62 | 0.4% |
| Swedish | 71 | 0.5% |
| Thai | 16 | 0.1% |
| Trinidadian and Tobagonian | 18 | 0.1% |
| Venezuelan | 14 | 0.1% |
| Welsh | 143 | 0.9% | View All 57 Rows |
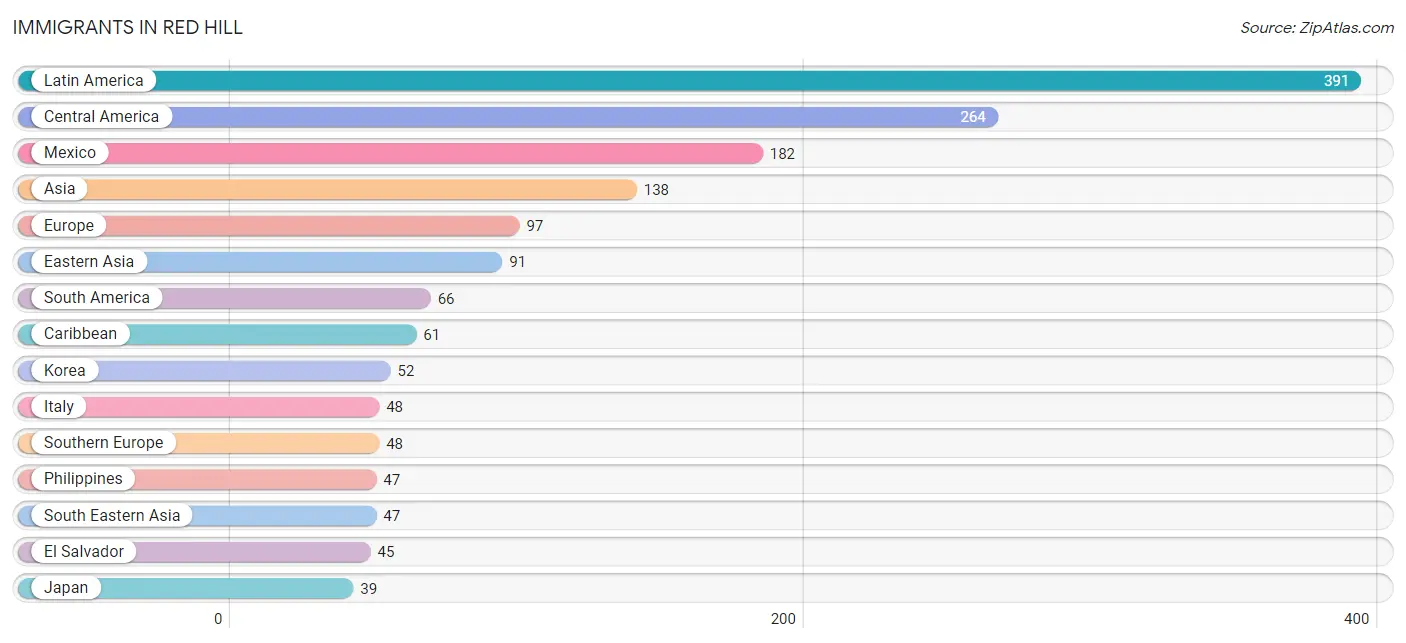
Immigrants in Red Hill
The most numerous immigrant groups reported in Red Hill came from Latin America (391 | 2.5%), Central America (264 | 1.7%), Mexico (182 | 1.2%), Asia (138 | 0.9%), and Europe (97 | 0.6%), together accounting for 6.9% of all Red Hill residents.
| Immigration Origin | # Population | % Population |
| Asia | 138 | 0.9% |
| Canada | 13 | 0.1% |
| Caribbean | 61 | 0.4% |
| Central America | 264 | 1.7% |
| Chile | 8 | 0.1% |
| Colombia | 26 | 0.2% |
| Dominican Republic | 27 | 0.2% |
| Eastern Asia | 91 | 0.6% |
| Ecuador | 18 | 0.1% |
| El Salvador | 45 | 0.3% |
| England | 15 | 0.1% |
| Europe | 97 | 0.6% |
| Germany | 22 | 0.1% |
| Honduras | 37 | 0.2% |
| Italy | 48 | 0.3% |
| Japan | 39 | 0.3% |
| Korea | 52 | 0.3% |
| Latin America | 391 | 2.5% |
| Mexico | 182 | 1.2% |
| Netherlands | 6 | 0.0% |
| Northern Europe | 21 | 0.1% |
| Philippines | 47 | 0.3% |
| South America | 66 | 0.4% |
| South Eastern Asia | 47 | 0.3% |
| Southern Europe | 48 | 0.3% |
| Trinidad and Tobago | 34 | 0.2% |
| Venezuela | 14 | 0.1% |
| Western Europe | 28 | 0.2% | View All 28 Rows |
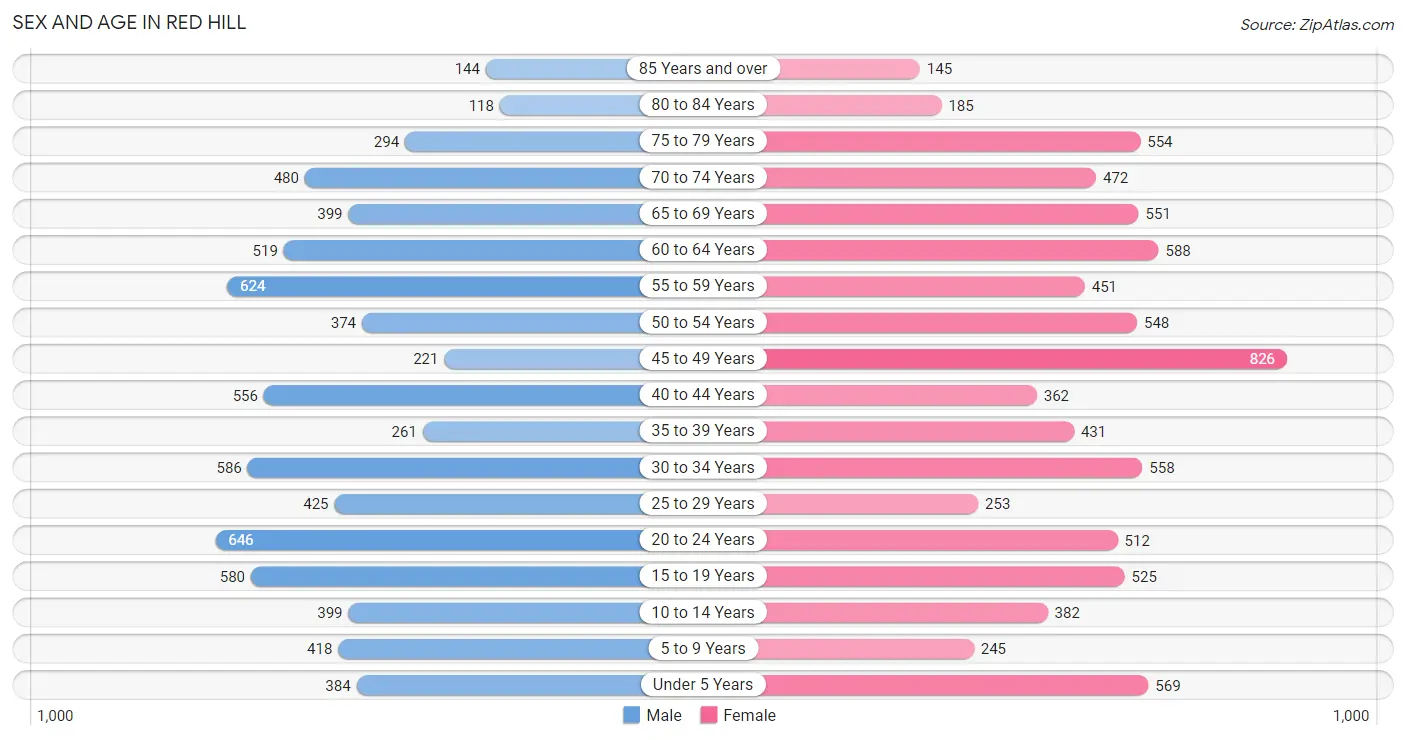
Sex and Age in Red Hill
Sex and Age in Red Hill
The most populous age groups in Red Hill are 20 to 24 Years (646 | 8.7%) for men and 45 to 49 Years (826 | 10.1%) for women.
| Age Bracket | Male | Female |
| Under 5 Years | 384 (5.2%) | 569 (7.0%) |
| 5 to 9 Years | 418 (5.6%) | 245 (3.0%) |
| 10 to 14 Years | 399 (5.4%) | 382 (4.7%) |
| 15 to 19 Years | 580 (7.8%) | 525 (6.4%) |
| 20 to 24 Years | 646 (8.7%) | 512 (6.3%) |
| 25 to 29 Years | 425 (5.7%) | 253 (3.1%) |
| 30 to 34 Years | 586 (7.9%) | 558 (6.8%) |
| 35 to 39 Years | 261 (3.5%) | 431 (5.3%) |
| 40 to 44 Years | 556 (7.5%) | 362 (4.4%) |
| 45 to 49 Years | 221 (3.0%) | 826 (10.1%) |
| 50 to 54 Years | 374 (5.0%) | 548 (6.7%) |
| 55 to 59 Years | 624 (8.4%) | 451 (5.5%) |
| 60 to 64 Years | 519 (7.0%) | 588 (7.2%) |
| 65 to 69 Years | 399 (5.4%) | 551 (6.8%) |
| 70 to 74 Years | 480 (6.5%) | 472 (5.8%) |
| 75 to 79 Years | 294 (4.0%) | 554 (6.8%) |
| 80 to 84 Years | 118 (1.6%) | 185 (2.3%) |
| 85 Years and over | 144 (1.9%) | 145 (1.8%) |
| Total | 7,428 (100.0%) | 8,157 (100.0%) |
Families and Households in Red Hill
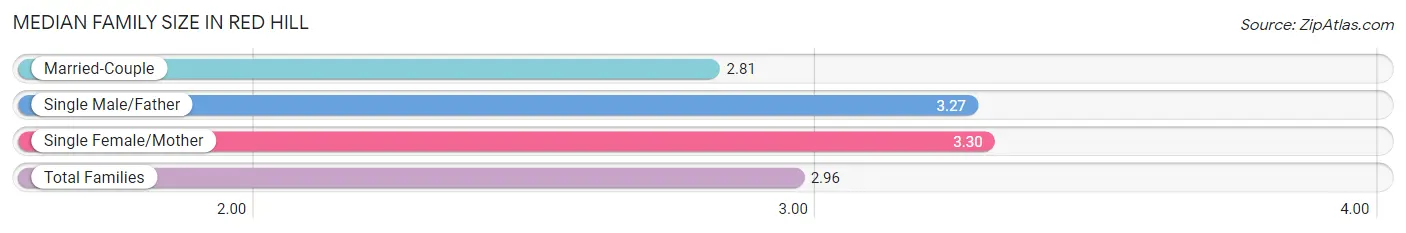
Median Family Size in Red Hill
The median family size in Red Hill is 2.96 persons per family, with single female/mother families (969 | 24.7%) accounting for the largest median family size of 3.3 persons per family. On the other hand, married-couple families (2,658 | 67.6%) represent the smallest median family size with 2.81 persons per family.
| Family Type | # Families | Family Size |
| Married-Couple | 2,658 (67.6%) | 2.81 |
| Single Male/Father | 303 (7.7%) | 3.27 |
| Single Female/Mother | 969 (24.7%) | 3.30 |
| Total Families | 3,930 (100.0%) | 2.96 |
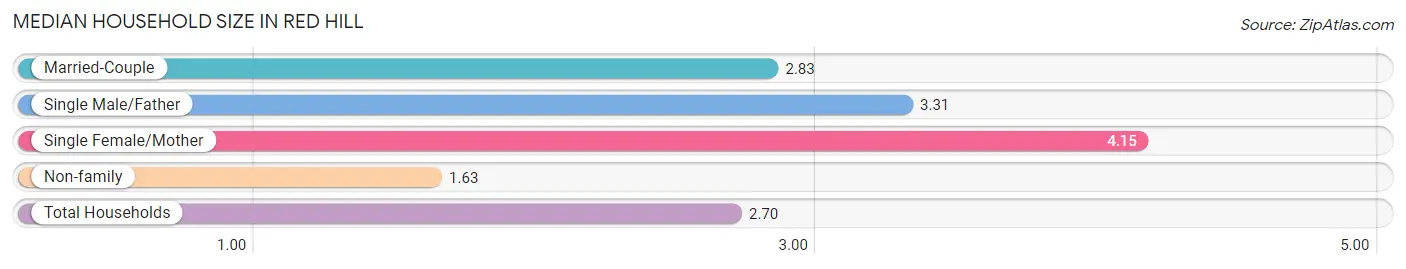
Median Household Size in Red Hill
The median household size in Red Hill is 2.70 persons per household, with single female/mother households (969 | 16.9%) accounting for the largest median household size of 4.15 persons per household. non-family households (1,812 | 31.6%) represent the smallest median household size with 1.63 persons per household.
| Household Type | # Households | Household Size |
| Married-Couple | 2,658 (46.3%) | 2.83 |
| Single Male/Father | 303 (5.3%) | 3.31 |
| Single Female/Mother | 969 (16.9%) | 4.15 |
| Non-family | 1,812 (31.6%) | 1.63 |
| Total Households | 5,742 (100.0%) | 2.70 |
Household Size by Marriage Status in Red Hill
Out of a total of 5,742 households in Red Hill, 3,930 (68.4%) are family households, while 1,812 (31.6%) are nonfamily households. The most numerous type of family households are 2-person households, comprising 2,078, and the most common type of nonfamily households are 1-person households, comprising 1,356.
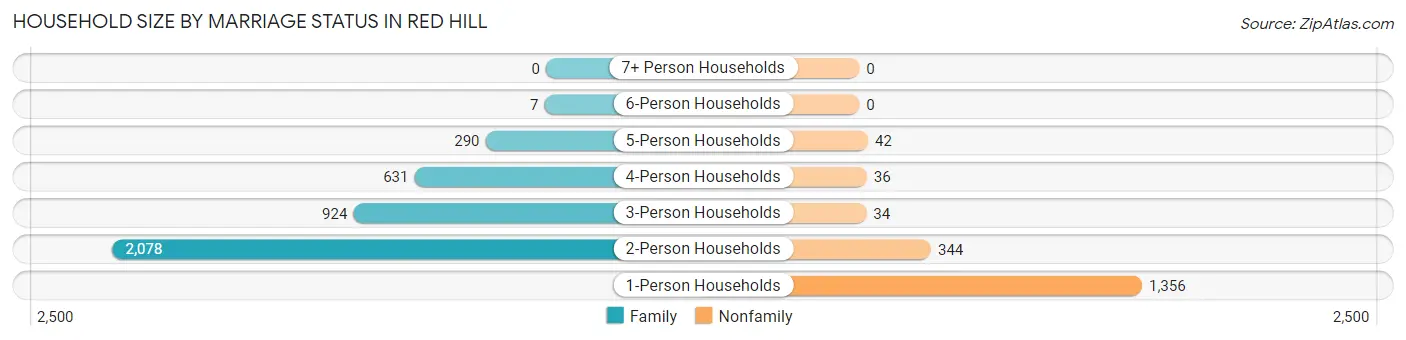
| Household Size | Family Households | Nonfamily Households |
| 1-Person Households | - | 1,356 (23.6%) |
| 2-Person Households | 2,078 (36.2%) | 344 (6.0%) |
| 3-Person Households | 924 (16.1%) | 34 (0.6%) |
| 4-Person Households | 631 (11.0%) | 36 (0.6%) |
| 5-Person Households | 290 (5.1%) | 42 (0.7%) |
| 6-Person Households | 7 (0.1%) | 0 (0.0%) |
| 7+ Person Households | 0 (0.0%) | 0 (0.0%) |
| Total | 3,930 (68.4%) | 1,812 (31.6%) |
Female Fertility in Red Hill
Fertility by Age in Red Hill
Average fertility rate in Red Hill is 52.0 births per 1,000 women. Women in the age bracket of 20 to 34 years have the highest fertility rate with 122.0 births per 1,000 women. Women in the age bracket of 20 to 34 years acount for 88.0% of all women with births.
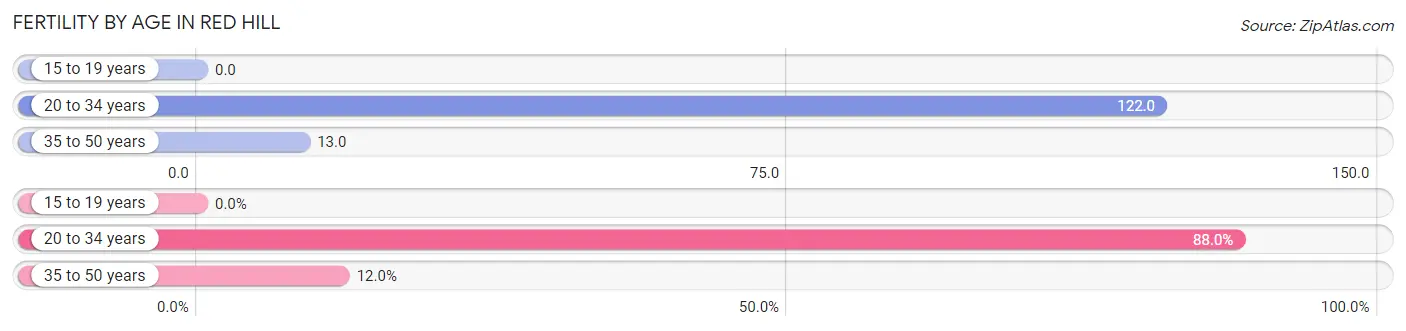
| Age Bracket | Women with Births | Births / 1,000 Women |
| 15 to 19 years | 0 (0.0%) | 0.0 |
| 20 to 34 years | 161 (88.0%) | 122.0 |
| 35 to 50 years | 22 (12.0%) | 13.0 |
| Total | 183 (100.0%) | 52.0 |
Fertility by Age by Marriage Status in Red Hill
79.8% of women with births (183) in Red Hill are married. The highest percentage of unmarried women with births falls into 20 to 34 years age bracket with 23.0% of them unmarried at the time of birth, while the lowest percentage of unmarried women with births belong to 35 to 50 years age bracket with 0.0% of them unmarried.
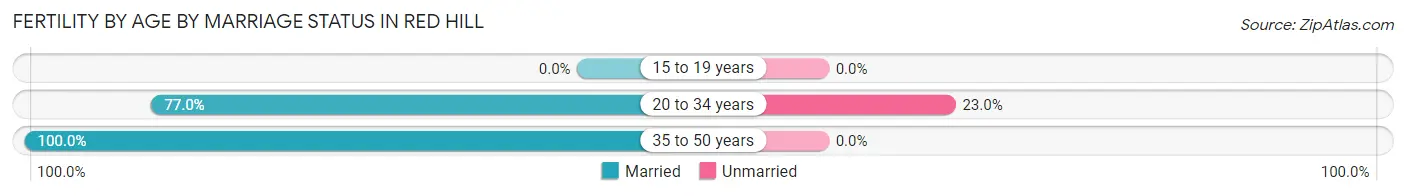
| Age Bracket | Married | Unmarried |
| 15 to 19 years | 0 (0.0%) | 0 (0.0%) |
| 20 to 34 years | 124 (77.0%) | 37 (23.0%) |
| 35 to 50 years | 22 (100.0%) | 0 (0.0%) |
| Total | 146 (79.8%) | 37 (20.2%) |
Fertility by Education in Red Hill
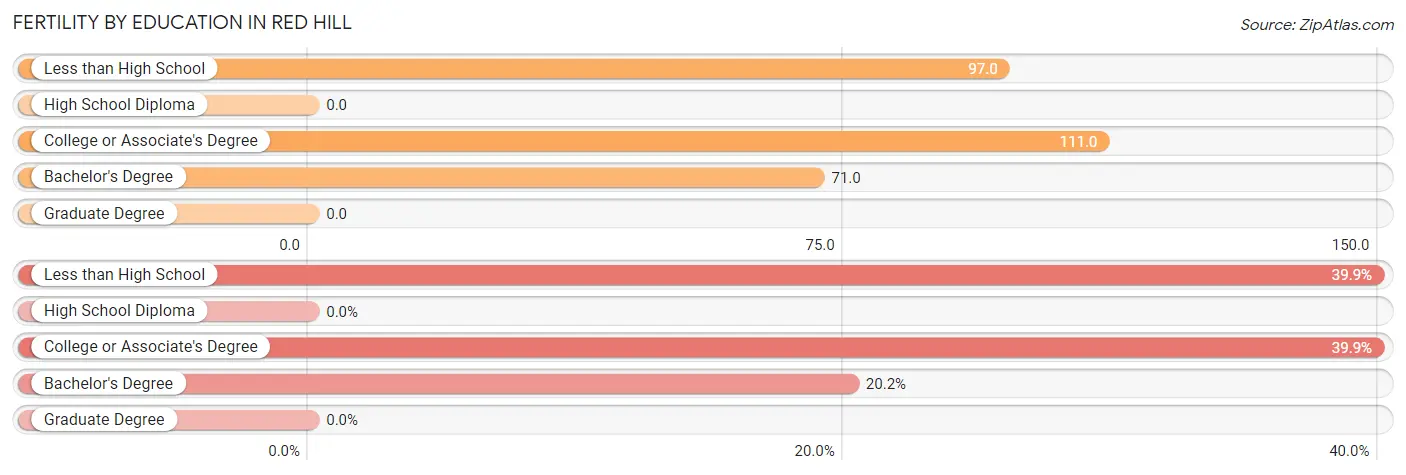
| Educational Attainment | Women with Births | Births / 1,000 Women |
| Less than High School | 73 (39.9%) | 97.0 |
| High School Diploma | 0 (0.0%) | 0.0 |
| College or Associate's Degree | 73 (39.9%) | 111.0 |
| Bachelor's Degree | 37 (20.2%) | 71.0 |
| Graduate Degree | 0 (0.0%) | 0.0 |
| Total | 183 (100.0%) | 52.0 |
Fertility by Education by Marriage Status in Red Hill
20.2% of women with births in Red Hill are unmarried. Women with the educational attainment of college or associate's degree are most likely to be married with 100.0% of them married at childbirth, while women with the educational attainment of less than high school are least likely to be married with 50.7% of them unmarried at childbirth.
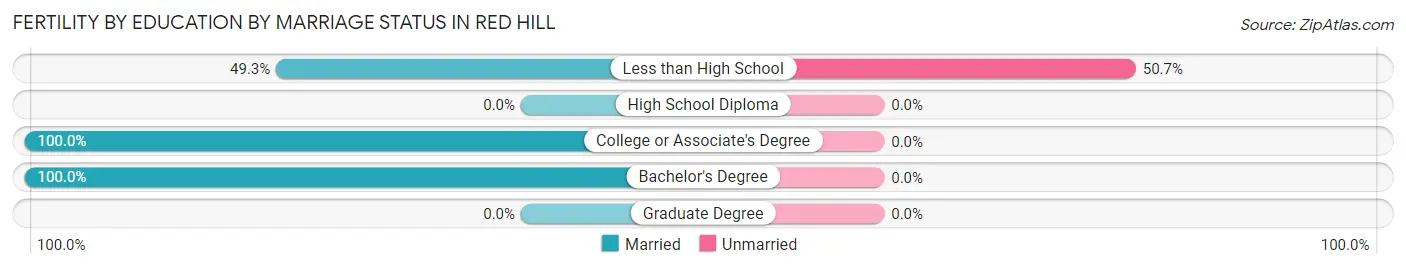
| Educational Attainment | Married | Unmarried |
| Less than High School | 36 (49.3%) | 37 (50.7%) |
| High School Diploma | 0 (0.0%) | 0 (0.0%) |
| College or Associate's Degree | 73 (100.0%) | 0 (0.0%) |
| Bachelor's Degree | 37 (100.0%) | 0 (0.0%) |
| Graduate Degree | 0 (0.0%) | 0 (0.0%) |
| Total | 146 (79.8%) | 37 (20.2%) |
Employment Characteristics in Red Hill
Employment by Class of Employer in Red Hill
Among the 6,485 employed individuals in Red Hill, private company employees (4,107 | 63.3%), state government employees (758 | 11.7%), and local government employees (497 | 7.7%) make up the most common classes of employment.
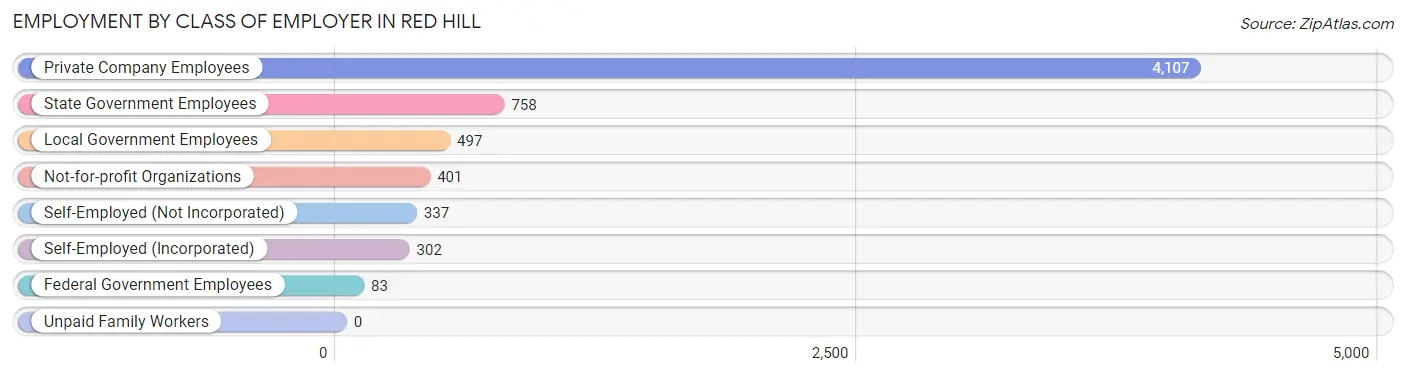
| Employer Class | # Employees | % Employees |
| Private Company Employees | 4,107 | 63.3% |
| Self-Employed (Incorporated) | 302 | 4.7% |
| Self-Employed (Not Incorporated) | 337 | 5.2% |
| Not-for-profit Organizations | 401 | 6.2% |
| Local Government Employees | 497 | 7.7% |
| State Government Employees | 758 | 11.7% |
| Federal Government Employees | 83 | 1.3% |
| Unpaid Family Workers | 0 | 0.0% |
| Total | 6,485 | 100.0% |
Employment Status by Age in Red Hill
According to the labor force statistics for Red Hill, out of the total population over 16 years of age (13,083), 53.3% or 6,973 individuals are in the labor force, with 6.3% or 439 of them unemployed. The age group with the highest labor force participation rate is 30 to 34 years, with 93.0% or 1,064 individuals in the labor force. Within the labor force, the 75 years and over age range has the highest percentage of unemployed individuals, with 25.7% or 18 of them being unemployed.
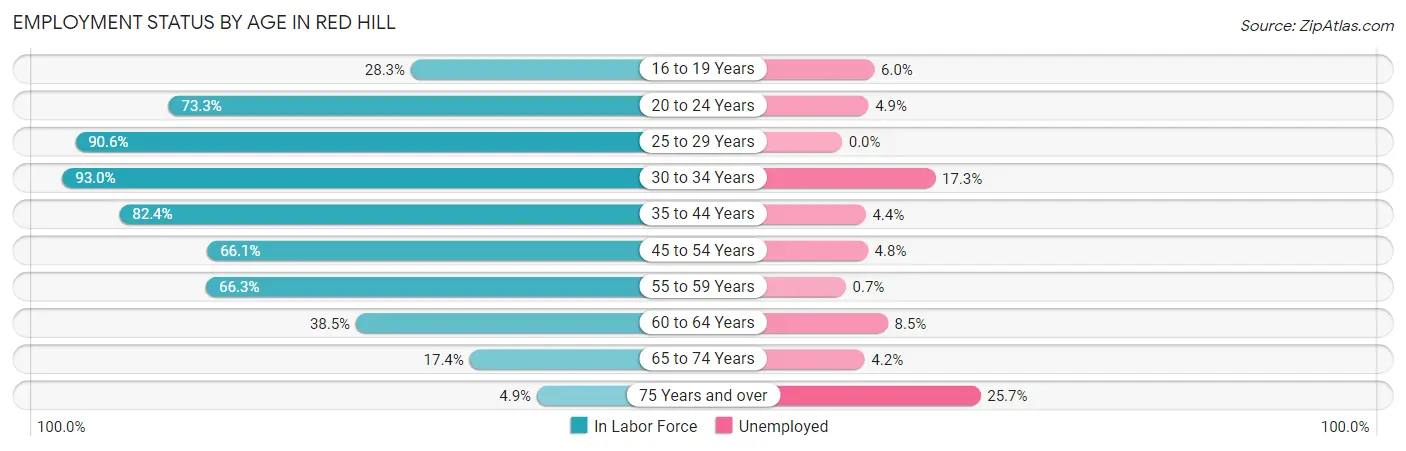
| Age Bracket | In Labor Force | Unemployed |
| 16 to 19 Years | 283 (28.3%) | 17 (6.0%) |
| 20 to 24 Years | 849 (73.3%) | 42 (4.9%) |
| 25 to 29 Years | 614 (90.6%) | 0 (0.0%) |
| 30 to 34 Years | 1,064 (93.0%) | 184 (17.3%) |
| 35 to 44 Years | 1,327 (82.4%) | 58 (4.4%) |
| 45 to 54 Years | 1,302 (66.1%) | 62 (4.8%) |
| 55 to 59 Years | 713 (66.3%) | 5 (0.7%) |
| 60 to 64 Years | 426 (38.5%) | 36 (8.5%) |
| 65 to 74 Years | 331 (17.4%) | 14 (4.2%) |
| 75 Years and over | 71 (4.9%) | 18 (25.7%) |
| Total | 6,973 (53.3%) | 439 (6.3%) |
Employment Status by Educational Attainment in Red Hill
According to labor force statistics for Red Hill, 71.8% of individuals (5,445) out of the total population between 25 and 64 years of age (7,583) are in the labor force, with 6.4% or 348 of them being unemployed. The group with the highest labor force participation rate are those with the educational attainment of bachelor's degree or higher, with 81.0% or 1,384 individuals in the labor force. Within the labor force, individuals with college / associate degree education have the highest percentage of unemployment, with 8.1% or 122 of them being unemployed.
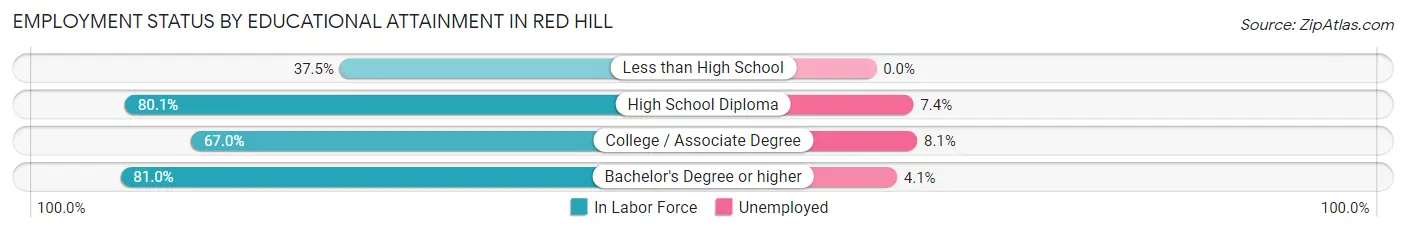
| Educational Attainment | In Labor Force | Unemployed |
| Less than High School | 307 (37.5%) | 0 (0.0%) |
| High School Diploma | 2,244 (80.1%) | 207 (7.4%) |
| College / Associate Degree | 1,510 (67.0%) | 183 (8.1%) |
| Bachelor's Degree or higher | 1,384 (81.0%) | 70 (4.1%) |
| Total | 5,445 (71.8%) | 485 (6.4%) |
Employment Occupations by Sex in Red Hill
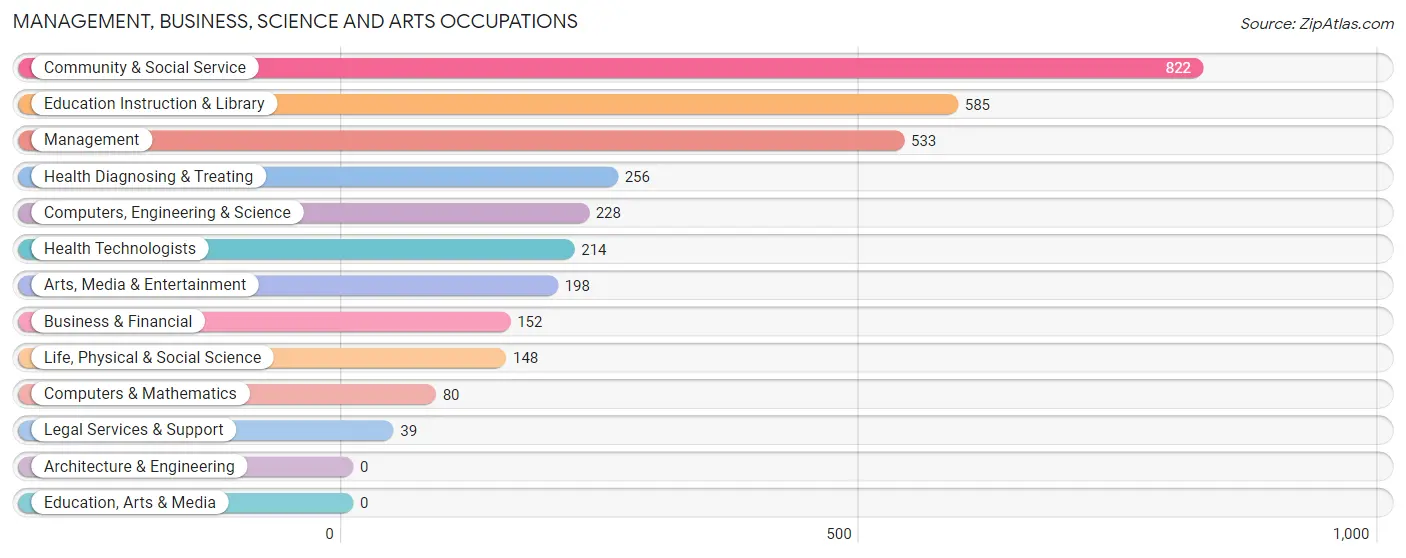
Management, Business, Science and Arts Occupations
The most common Management, Business, Science and Arts occupations in Red Hill are Community & Social Service (822 | 12.6%), Education Instruction & Library (585 | 8.9%), Management (533 | 8.2%), Health Diagnosing & Treating (256 | 3.9%), and Computers, Engineering & Science (228 | 3.5%).
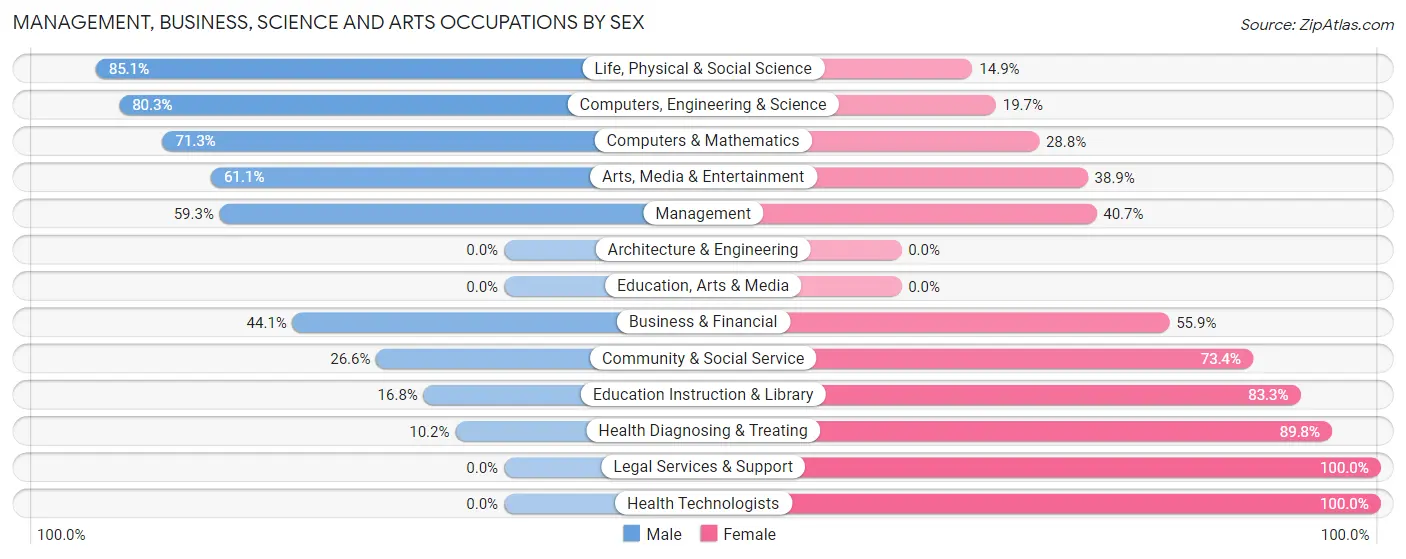
Management, Business, Science and Arts Occupations by Sex
Within the Management, Business, Science and Arts occupations in Red Hill, the most male-oriented occupations are Life, Physical & Social Science (85.1%), Computers, Engineering & Science (80.3%), and Computers & Mathematics (71.3%), while the most female-oriented occupations are Legal Services & Support (100.0%), Health Technologists (100.0%), and Health Diagnosing & Treating (89.8%).
| Occupation | Male | Female |
| Management | 316 (59.3%) | 217 (40.7%) |
| Business & Financial | 67 (44.1%) | 85 (55.9%) |
| Computers, Engineering & Science | 183 (80.3%) | 45 (19.7%) |
| Computers & Mathematics | 57 (71.3%) | 23 (28.7%) |
| Architecture & Engineering | 0 (0.0%) | 0 (0.0%) |
| Life, Physical & Social Science | 126 (85.1%) | 22 (14.9%) |
| Community & Social Service | 219 (26.6%) | 603 (73.4%) |
| Education, Arts & Media | 0 (0.0%) | 0 (0.0%) |
| Legal Services & Support | 0 (0.0%) | 39 (100.0%) |
| Education Instruction & Library | 98 (16.8%) | 487 (83.3%) |
| Arts, Media & Entertainment | 121 (61.1%) | 77 (38.9%) |
| Health Diagnosing & Treating | 26 (10.2%) | 230 (89.8%) |
| Health Technologists | 0 (0.0%) | 214 (100.0%) |
| Total (Category) | 811 (40.7%) | 1,180 (59.3%) |
| Total (Overall) | 3,488 (53.3%) | 3,052 (46.7%) |
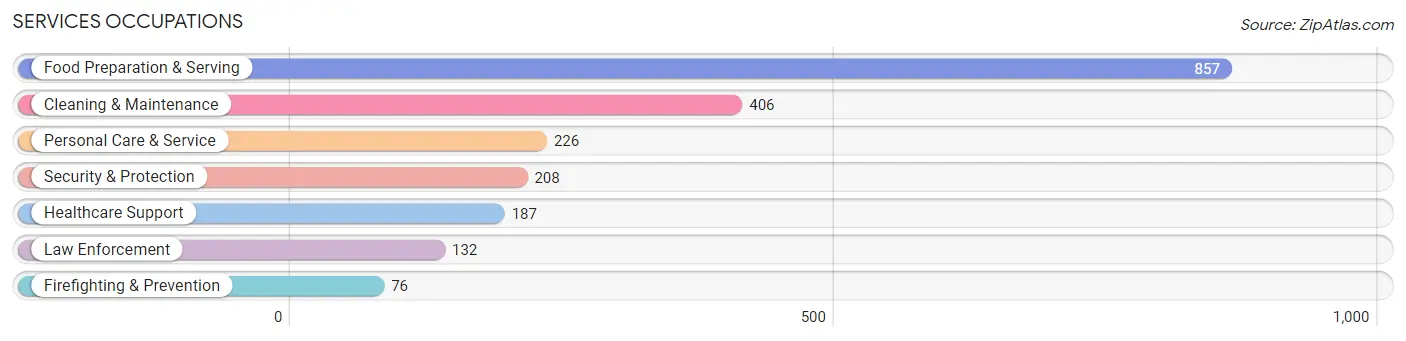
Services Occupations
The most common Services occupations in Red Hill are Food Preparation & Serving (857 | 13.1%), Cleaning & Maintenance (406 | 6.2%), Personal Care & Service (226 | 3.5%), Security & Protection (208 | 3.2%), and Healthcare Support (187 | 2.9%).
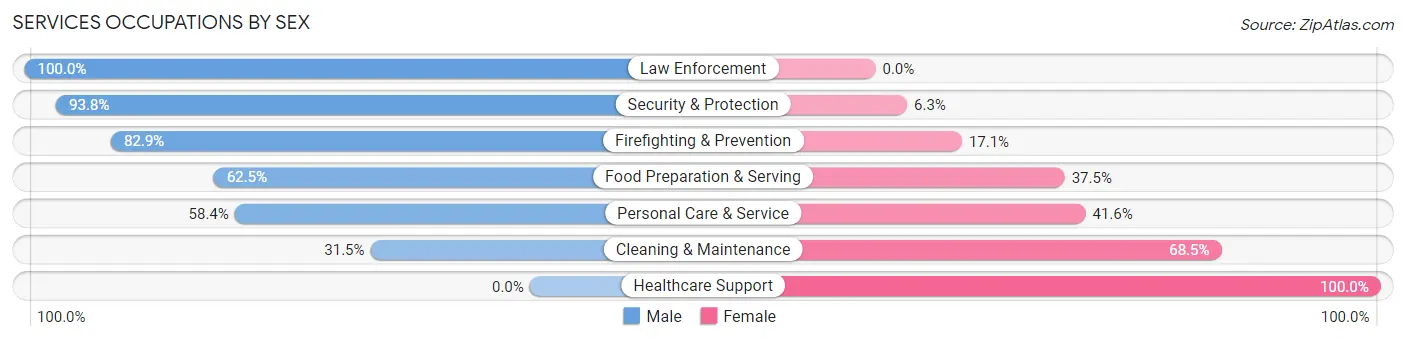
Services Occupations by Sex
Within the Services occupations in Red Hill, the most male-oriented occupations are Law Enforcement (100.0%), Security & Protection (93.8%), and Firefighting & Prevention (82.9%), while the most female-oriented occupations are Healthcare Support (100.0%), Cleaning & Maintenance (68.5%), and Personal Care & Service (41.6%).
| Occupation | Male | Female |
| Healthcare Support | 0 (0.0%) | 187 (100.0%) |
| Security & Protection | 195 (93.8%) | 13 (6.2%) |
| Firefighting & Prevention | 63 (82.9%) | 13 (17.1%) |
| Law Enforcement | 132 (100.0%) | 0 (0.0%) |
| Food Preparation & Serving | 536 (62.5%) | 321 (37.5%) |
| Cleaning & Maintenance | 128 (31.5%) | 278 (68.5%) |
| Personal Care & Service | 132 (58.4%) | 94 (41.6%) |
| Total (Category) | 991 (52.6%) | 893 (47.4%) |
| Total (Overall) | 3,488 (53.3%) | 3,052 (46.7%) |
Sales and Office Occupations
The most common Sales and Office occupations in Red Hill are Sales & Related (752 | 11.5%), and Office & Administration (717 | 11.0%).
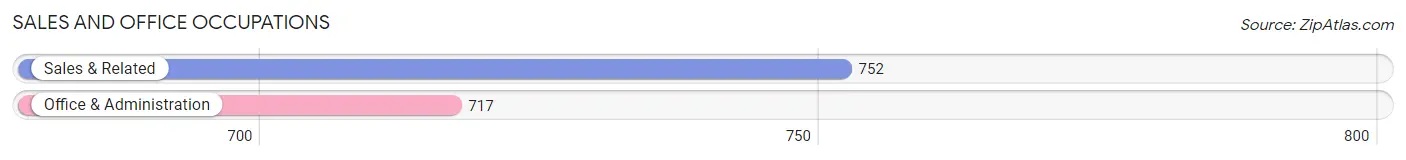
Sales and Office Occupations by Sex

| Occupation | Male | Female |
| Sales & Related | 352 (46.8%) | 400 (53.2%) |
| Office & Administration | 314 (43.8%) | 403 (56.2%) |
| Total (Category) | 666 (45.3%) | 803 (54.7%) |
| Total (Overall) | 3,488 (53.3%) | 3,052 (46.7%) |
Natural Resources, Construction and Maintenance Occupations
The most common Natural Resources, Construction and Maintenance occupations in Red Hill are Construction & Extraction (480 | 7.3%), and Installation, Maintenance & Repair (121 | 1.8%).
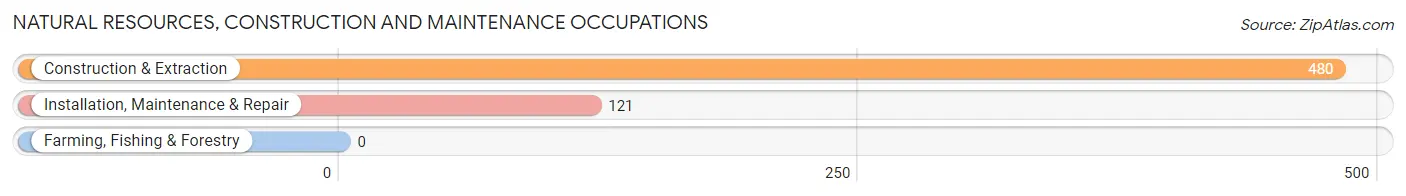
Natural Resources, Construction and Maintenance Occupations by Sex
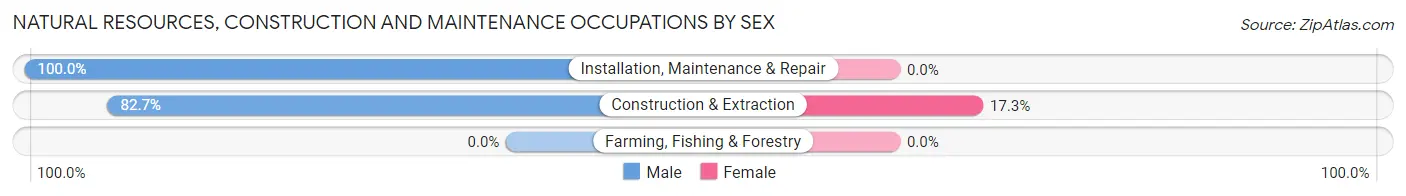
| Occupation | Male | Female |
| Farming, Fishing & Forestry | 0 (0.0%) | 0 (0.0%) |
| Construction & Extraction | 397 (82.7%) | 83 (17.3%) |
| Installation, Maintenance & Repair | 121 (100.0%) | 0 (0.0%) |
| Total (Category) | 518 (86.2%) | 83 (13.8%) |
| Total (Overall) | 3,488 (53.3%) | 3,052 (46.7%) |
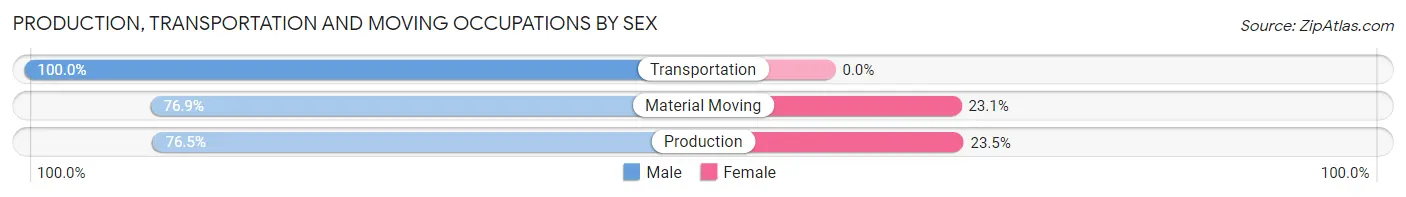
Production, Transportation and Moving Occupations
The most common Production, Transportation and Moving occupations in Red Hill are Material Moving (251 | 3.8%), Transportation (195 | 3.0%), and Production (149 | 2.3%).
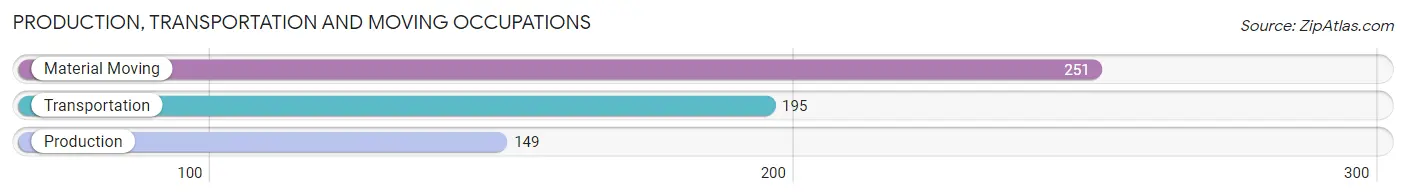
Production, Transportation and Moving Occupations by Sex
| Occupation | Male | Female |
| Production | 114 (76.5%) | 35 (23.5%) |
| Transportation | 195 (100.0%) | 0 (0.0%) |
| Material Moving | 193 (76.9%) | 58 (23.1%) |
| Total (Category) | 502 (84.4%) | 93 (15.6%) |
| Total (Overall) | 3,488 (53.3%) | 3,052 (46.7%) |
Employment Industries by Sex in Red Hill
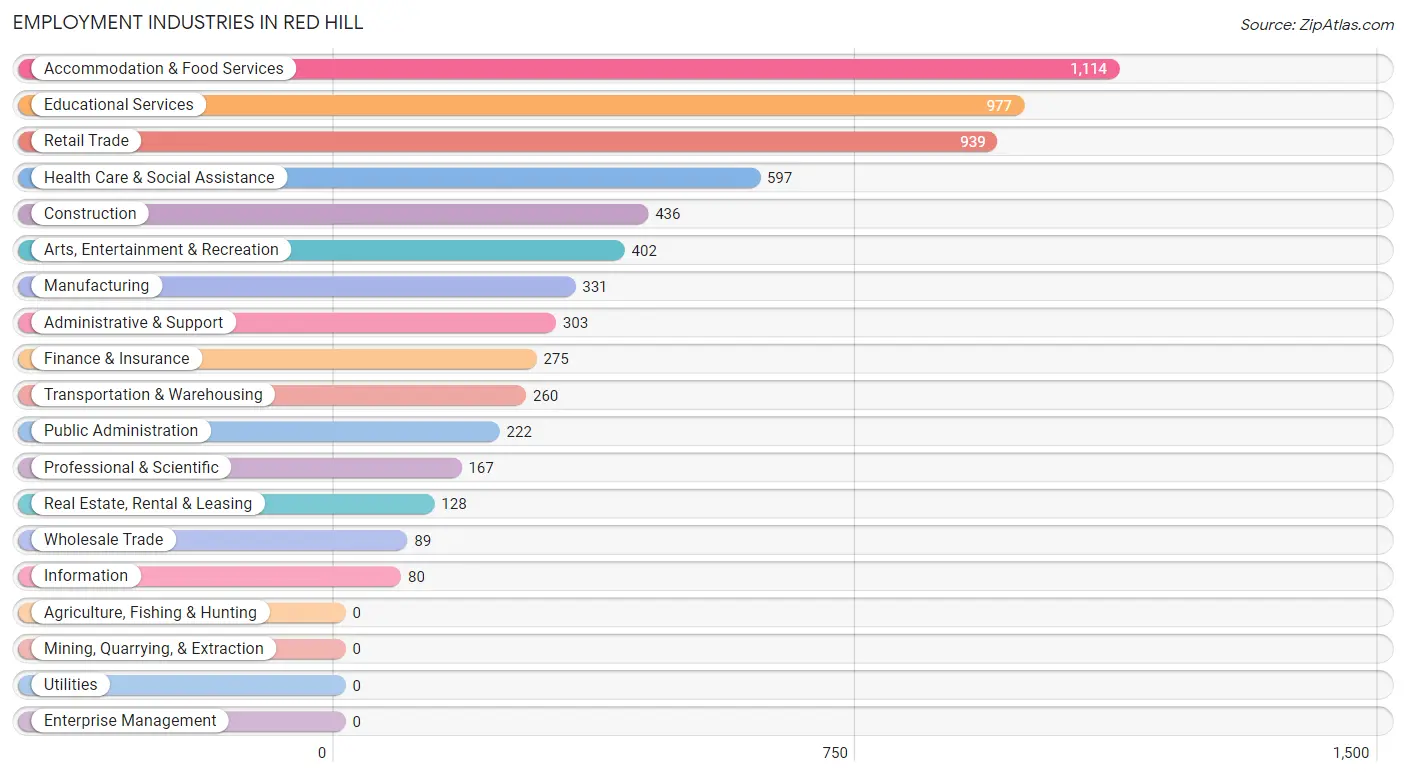
Employment Industries in Red Hill
The major employment industries in Red Hill include Accommodation & Food Services (1,114 | 17.0%), Educational Services (977 | 14.9%), Retail Trade (939 | 14.4%), Health Care & Social Assistance (597 | 9.1%), and Construction (436 | 6.7%).
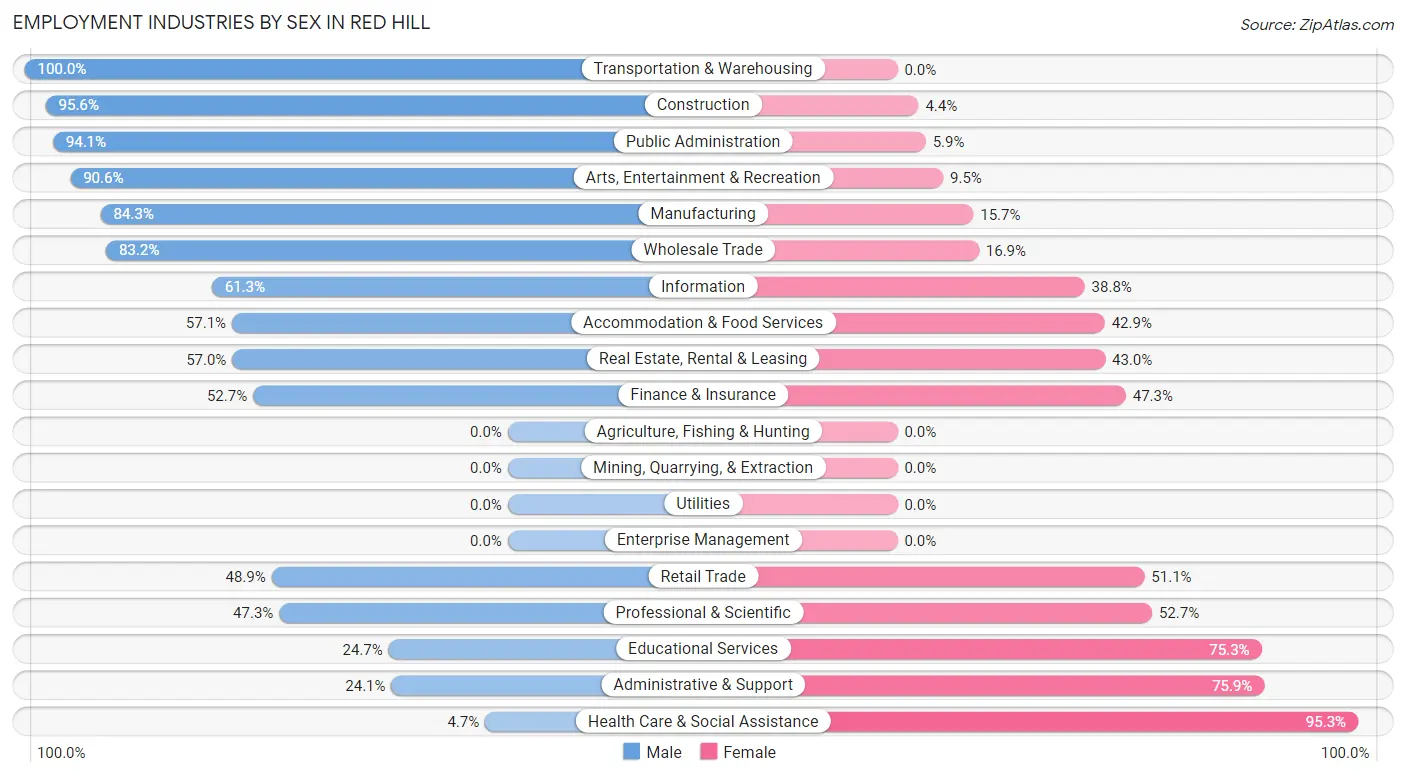
Employment Industries by Sex in Red Hill
The Red Hill industries that see more men than women are Transportation & Warehousing (100.0%), Construction (95.6%), and Public Administration (94.1%), whereas the industries that tend to have a higher number of women are Health Care & Social Assistance (95.3%), Administrative & Support (75.9%), and Educational Services (75.3%).
| Industry | Male | Female |
| Agriculture, Fishing & Hunting | 0 (0.0%) | 0 (0.0%) |
| Mining, Quarrying, & Extraction | 0 (0.0%) | 0 (0.0%) |
| Construction | 417 (95.6%) | 19 (4.4%) |
| Manufacturing | 279 (84.3%) | 52 (15.7%) |
| Wholesale Trade | 74 (83.2%) | 15 (16.9%) |
| Retail Trade | 459 (48.9%) | 480 (51.1%) |
| Transportation & Warehousing | 260 (100.0%) | 0 (0.0%) |
| Utilities | 0 (0.0%) | 0 (0.0%) |
| Information | 49 (61.3%) | 31 (38.8%) |
| Finance & Insurance | 145 (52.7%) | 130 (47.3%) |
| Real Estate, Rental & Leasing | 73 (57.0%) | 55 (43.0%) |
| Professional & Scientific | 79 (47.3%) | 88 (52.7%) |
| Enterprise Management | 0 (0.0%) | 0 (0.0%) |
| Administrative & Support | 73 (24.1%) | 230 (75.9%) |
| Educational Services | 241 (24.7%) | 736 (75.3%) |
| Health Care & Social Assistance | 28 (4.7%) | 569 (95.3%) |
| Arts, Entertainment & Recreation | 364 (90.5%) | 38 (9.5%) |
| Accommodation & Food Services | 636 (57.1%) | 478 (42.9%) |
| Public Administration | 209 (94.1%) | 13 (5.9%) |
| Total | 3,488 (53.3%) | 3,052 (46.7%) |
Education in Red Hill
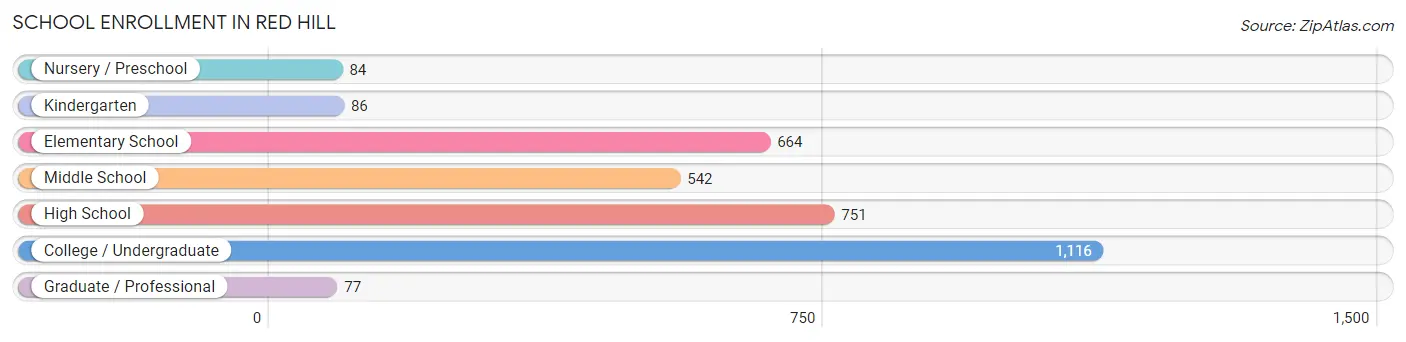
School Enrollment in Red Hill
The most common levels of schooling among the 3,320 students in Red Hill are college / undergraduate (1,116 | 33.6%), high school (751 | 22.6%), and elementary school (664 | 20.0%).
| School Level | # Students | % Students |
| Nursery / Preschool | 84 | 2.5% |
| Kindergarten | 86 | 2.6% |
| Elementary School | 664 | 20.0% |
| Middle School | 542 | 16.3% |
| High School | 751 | 22.6% |
| College / Undergraduate | 1,116 | 33.6% |
| Graduate / Professional | 77 | 2.3% |
| Total | 3,320 | 100.0% |
School Enrollment by Age by Funding Source in Red Hill
Out of a total of 3,320 students who are enrolled in schools in Red Hill, 637 (19.2%) attend a private institution, while the remaining 2,683 (80.8%) are enrolled in public schools. The age group of 5 to 9 year old has the highest likelihood of being enrolled in private schools, with 215 (33.8% in the age bracket) enrolled. Conversely, the age group of 15 to 17 year olds has the lowest likelihood of being enrolled in a private school, with 500 (100.0% in the age bracket) attending a public institution.
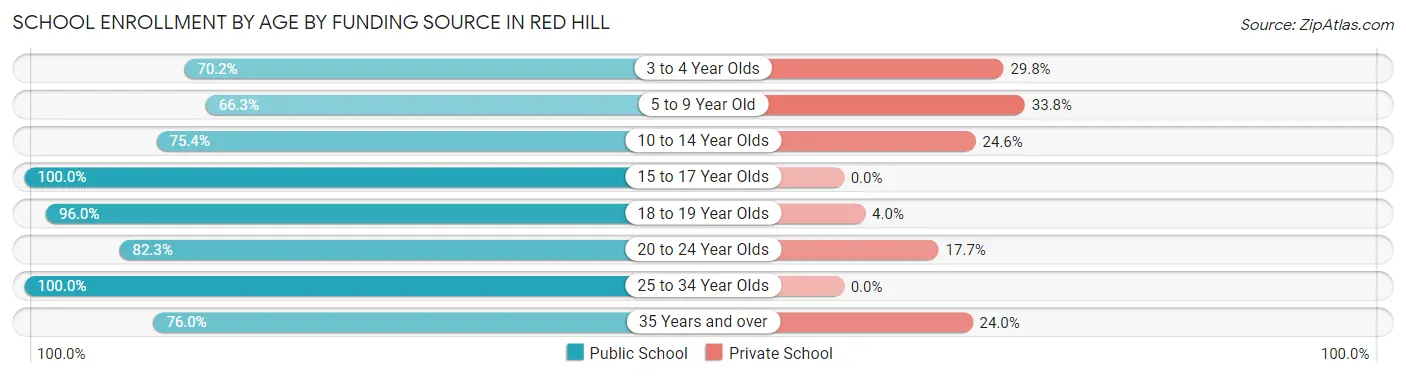
| Age Bracket | Public School | Private School |
| 3 to 4 Year Olds | 59 (70.2%) | 25 (29.8%) |
| 5 to 9 Year Old | 422 (66.2%) | 215 (33.8%) |
| 10 to 14 Year Olds | 589 (75.4%) | 192 (24.6%) |
| 15 to 17 Year Olds | 500 (100.0%) | 0 (0.0%) |
| 18 to 19 Year Olds | 240 (96.0%) | 10 (4.0%) |
| 20 to 24 Year Olds | 605 (82.3%) | 130 (17.7%) |
| 25 to 34 Year Olds | 54 (100.0%) | 0 (0.0%) |
| 35 Years and over | 212 (76.0%) | 67 (24.0%) |
| Total | 2,683 (80.8%) | 637 (19.2%) |
Educational Attainment by Field of Study in Red Hill
Business (595 | 20.6%), education (557 | 19.3%), science & technology (354 | 12.3%), bio, nature & agricultural (232 | 8.0%), and arts & humanities (221 | 7.7%) are the most common fields of study among 2,887 individuals in Red Hill who have obtained a bachelor's degree or higher.
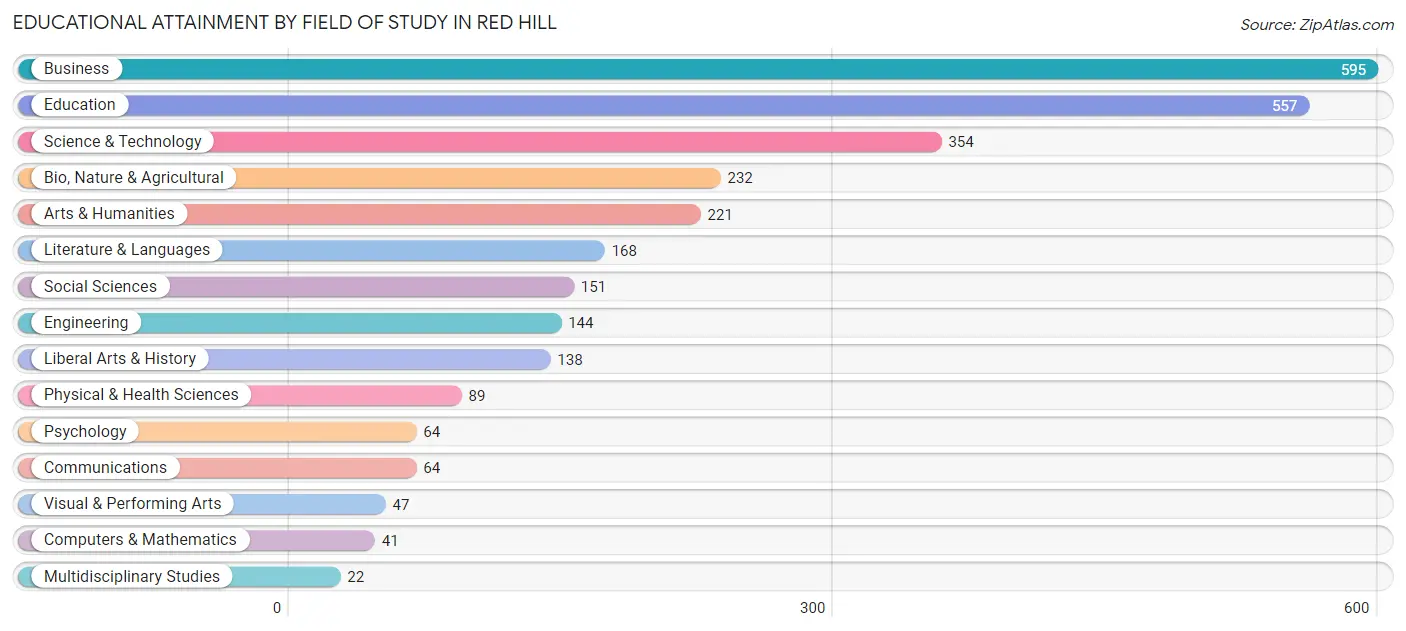
| Field of Study | # Graduates | % Graduates |
| Computers & Mathematics | 41 | 1.4% |
| Bio, Nature & Agricultural | 232 | 8.0% |
| Physical & Health Sciences | 89 | 3.1% |
| Psychology | 64 | 2.2% |
| Social Sciences | 151 | 5.2% |
| Engineering | 144 | 5.0% |
| Multidisciplinary Studies | 22 | 0.8% |
| Science & Technology | 354 | 12.3% |
| Business | 595 | 20.6% |
| Education | 557 | 19.3% |
| Literature & Languages | 168 | 5.8% |
| Liberal Arts & History | 138 | 4.8% |
| Visual & Performing Arts | 47 | 1.6% |
| Communications | 64 | 2.2% |
| Arts & Humanities | 221 | 7.7% |
| Total | 2,887 | 100.0% |
Transportation & Commute in Red Hill
Vehicle Availability by Sex in Red Hill
The most prevalent vehicle ownership categories in Red Hill are males with 2 vehicles (1,372, accounting for 39.6%) and females with 2 vehicles (905, making up 45.8%).
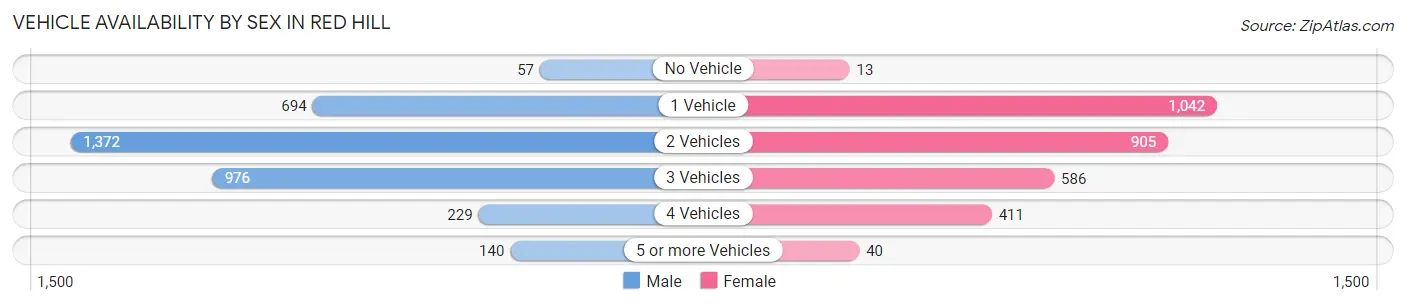
| Vehicles Available | Male | Female |
| No Vehicle | 57 (1.6%) | 13 (0.4%) |
| 1 Vehicle | 694 (20.0%) | 1,042 (34.8%) |
| 2 Vehicles | 1,372 (39.6%) | 905 (30.2%) |
| 3 Vehicles | 976 (28.1%) | 586 (19.6%) |
| 4 Vehicles | 229 (6.6%) | 411 (13.7%) |
| 5 or more Vehicles | 140 (4.0%) | 40 (1.3%) |
| Total | 3,468 (100.0%) | 2,997 (100.0%) |
Commute Time in Red Hill
The most frequently occuring commute durations in Red Hill are 20 to 24 minutes (1,363 commuters, 22.0%), 15 to 19 minutes (1,281 commuters, 20.7%), and 30 to 34 minutes (1,091 commuters, 17.6%).
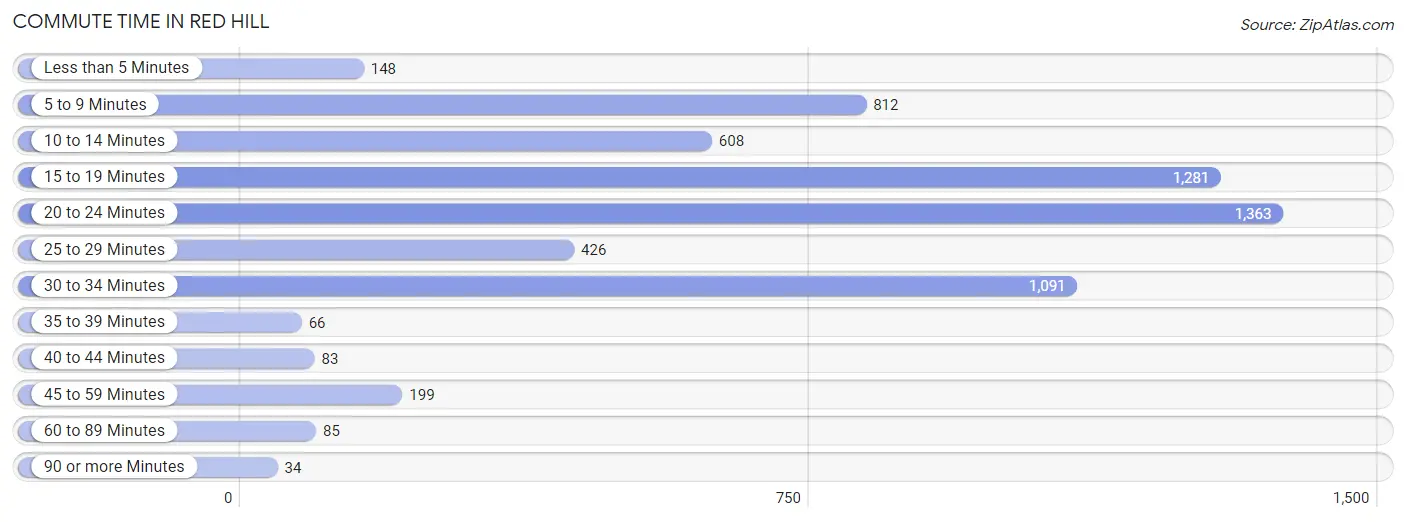
| Commute Time | # Commuters | % Commuters |
| Less than 5 Minutes | 148 | 2.4% |
| 5 to 9 Minutes | 812 | 13.1% |
| 10 to 14 Minutes | 608 | 9.8% |
| 15 to 19 Minutes | 1,281 | 20.7% |
| 20 to 24 Minutes | 1,363 | 22.0% |
| 25 to 29 Minutes | 426 | 6.9% |
| 30 to 34 Minutes | 1,091 | 17.6% |
| 35 to 39 Minutes | 66 | 1.1% |
| 40 to 44 Minutes | 83 | 1.3% |
| 45 to 59 Minutes | 199 | 3.2% |
| 60 to 89 Minutes | 85 | 1.4% |
| 90 or more Minutes | 34 | 0.5% |
Commute Time by Sex in Red Hill
The most common commute times in Red Hill are 20 to 24 minutes (741 commuters, 22.4%) for males and 20 to 24 minutes (622 commuters, 21.5%) for females.
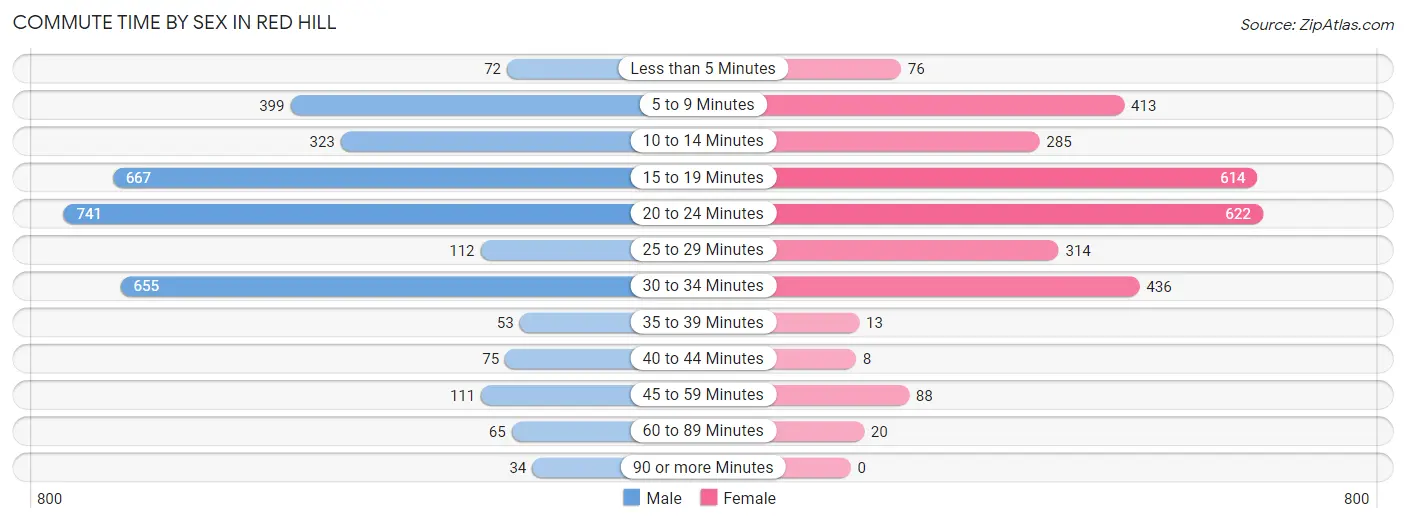
| Commute Time | Male | Female |
| Less than 5 Minutes | 72 (2.2%) | 76 (2.6%) |
| 5 to 9 Minutes | 399 (12.1%) | 413 (14.3%) |
| 10 to 14 Minutes | 323 (9.8%) | 285 (9.9%) |
| 15 to 19 Minutes | 667 (20.2%) | 614 (21.2%) |
| 20 to 24 Minutes | 741 (22.4%) | 622 (21.5%) |
| 25 to 29 Minutes | 112 (3.4%) | 314 (10.9%) |
| 30 to 34 Minutes | 655 (19.8%) | 436 (15.1%) |
| 35 to 39 Minutes | 53 (1.6%) | 13 (0.4%) |
| 40 to 44 Minutes | 75 (2.3%) | 8 (0.3%) |
| 45 to 59 Minutes | 111 (3.4%) | 88 (3.0%) |
| 60 to 89 Minutes | 65 (2.0%) | 20 (0.7%) |
| 90 or more Minutes | 34 (1.0%) | 0 (0.0%) |
Time of Departure to Work by Sex in Red Hill
The most frequent times of departure to work in Red Hill are 7:00 AM to 7:29 AM (736, 22.3%) for males and 7:00 AM to 7:29 AM (512, 17.7%) for females.
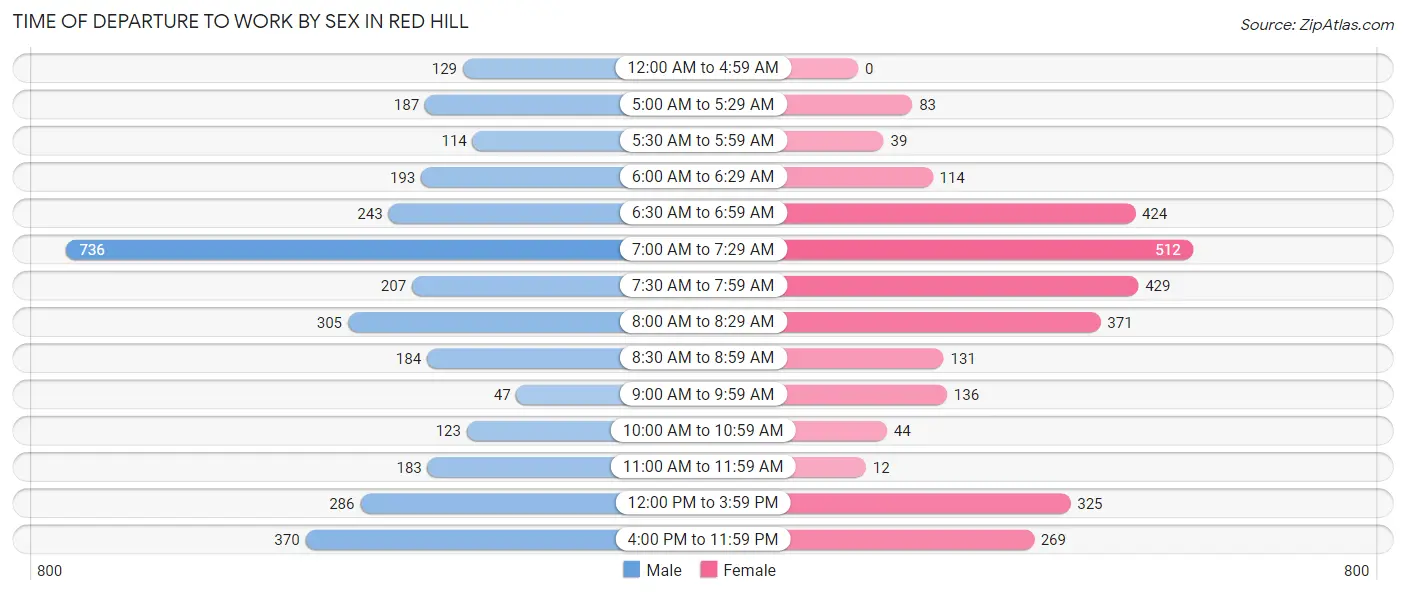
| Time of Departure | Male | Female |
| 12:00 AM to 4:59 AM | 129 (3.9%) | 0 (0.0%) |
| 5:00 AM to 5:29 AM | 187 (5.7%) | 83 (2.9%) |
| 5:30 AM to 5:59 AM | 114 (3.5%) | 39 (1.3%) |
| 6:00 AM to 6:29 AM | 193 (5.8%) | 114 (4.0%) |
| 6:30 AM to 6:59 AM | 243 (7.3%) | 424 (14.7%) |
| 7:00 AM to 7:29 AM | 736 (22.3%) | 512 (17.7%) |
| 7:30 AM to 7:59 AM | 207 (6.3%) | 429 (14.8%) |
| 8:00 AM to 8:29 AM | 305 (9.2%) | 371 (12.8%) |
| 8:30 AM to 8:59 AM | 184 (5.6%) | 131 (4.5%) |
| 9:00 AM to 9:59 AM | 47 (1.4%) | 136 (4.7%) |
| 10:00 AM to 10:59 AM | 123 (3.7%) | 44 (1.5%) |
| 11:00 AM to 11:59 AM | 183 (5.5%) | 12 (0.4%) |
| 12:00 PM to 3:59 PM | 286 (8.6%) | 325 (11.3%) |
| 4:00 PM to 11:59 PM | 370 (11.2%) | 269 (9.3%) |
| Total | 3,307 (100.0%) | 2,889 (100.0%) |
Housing Occupancy in Red Hill
Occupancy by Ownership in Red Hill
Of the total 5,742 dwellings in Red Hill, owner-occupied units account for 4,227 (73.6%), while renter-occupied units make up 1,515 (26.4%).
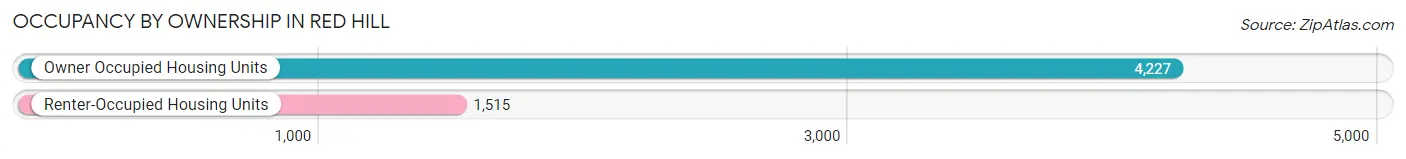
| Occupancy | # Housing Units | % Housing Units |
| Owner Occupied Housing Units | 4,227 | 73.6% |
| Renter-Occupied Housing Units | 1,515 | 26.4% |
| Total Occupied Housing Units | 5,742 | 100.0% |
Occupancy by Household Size in Red Hill
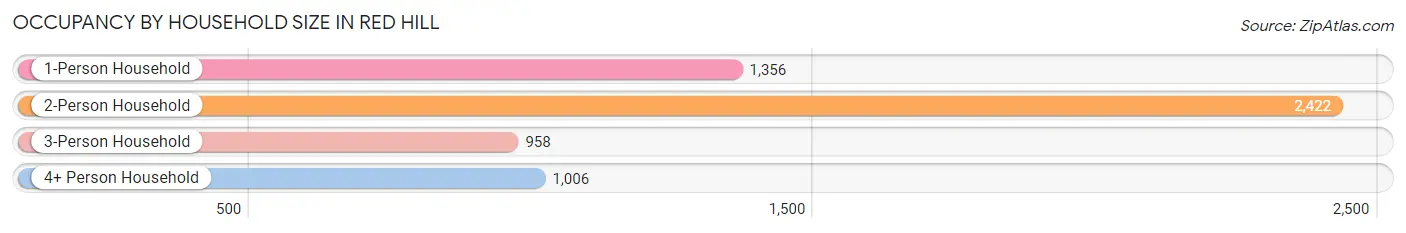
| Household Size | # Housing Units | % Housing Units |
| 1-Person Household | 1,356 | 23.6% |
| 2-Person Household | 2,422 | 42.2% |
| 3-Person Household | 958 | 16.7% |
| 4+ Person Household | 1,006 | 17.5% |
| Total Housing Units | 5,742 | 100.0% |
Occupancy by Ownership by Household Size in Red Hill
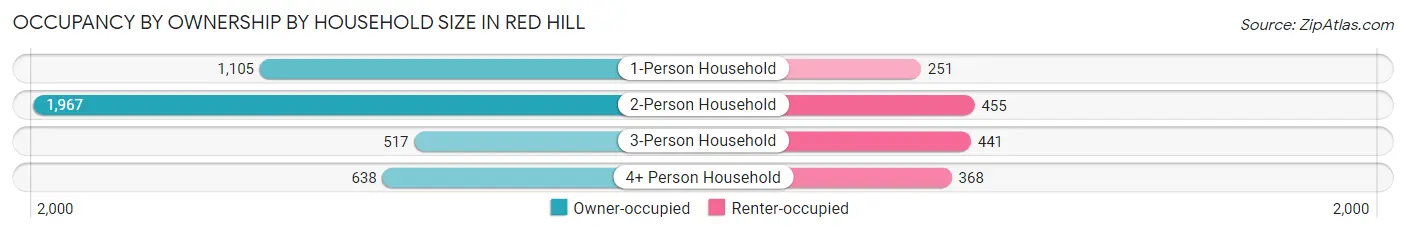
| Household Size | Owner-occupied | Renter-occupied |
| 1-Person Household | 1,105 (81.5%) | 251 (18.5%) |
| 2-Person Household | 1,967 (81.2%) | 455 (18.8%) |
| 3-Person Household | 517 (54.0%) | 441 (46.0%) |
| 4+ Person Household | 638 (63.4%) | 368 (36.6%) |
| Total Housing Units | 4,227 (73.6%) | 1,515 (26.4%) |
Occupancy by Educational Attainment in Red Hill
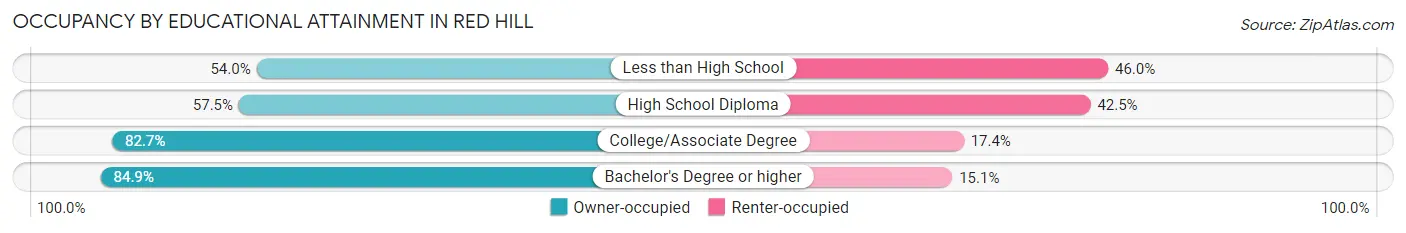
| Household Size | Owner-occupied | Renter-occupied |
| Less than High School | 242 (54.0%) | 206 (46.0%) |
| High School Diploma | 971 (57.5%) | 717 (42.5%) |
| College/Associate Degree | 1,758 (82.7%) | 369 (17.3%) |
| Bachelor's Degree or higher | 1,256 (84.9%) | 223 (15.1%) |
Occupancy by Age of Householder in Red Hill
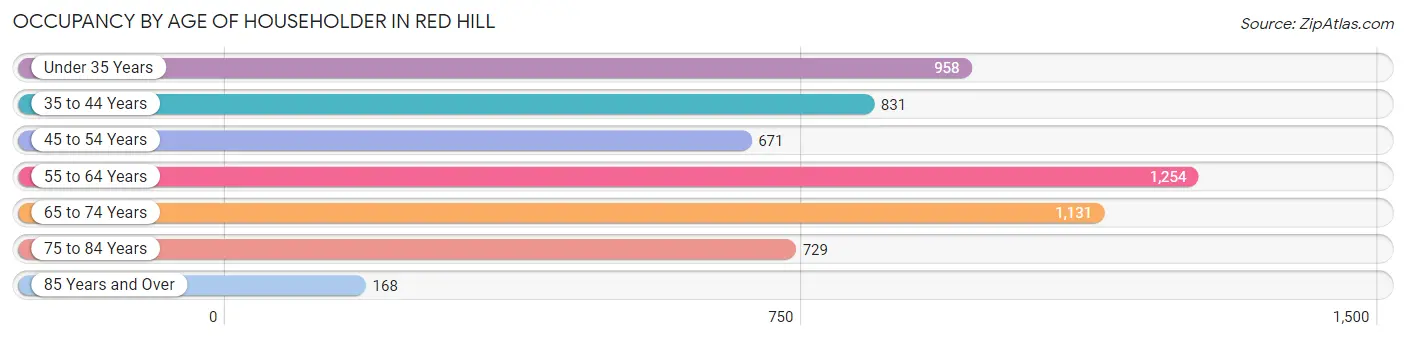
| Age Bracket | # Households | % Households |
| Under 35 Years | 958 | 16.7% |
| 35 to 44 Years | 831 | 14.5% |
| 45 to 54 Years | 671 | 11.7% |
| 55 to 64 Years | 1,254 | 21.8% |
| 65 to 74 Years | 1,131 | 19.7% |
| 75 to 84 Years | 729 | 12.7% |
| 85 Years and Over | 168 | 2.9% |
| Total | 5,742 | 100.0% |
Housing Finances in Red Hill
Median Income by Occupancy in Red Hill
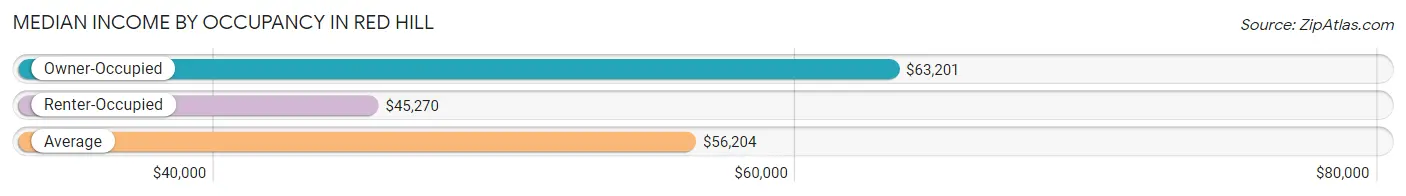
| Occupancy Type | # Households | Median Income |
| Owner-Occupied | 4,227 (73.6%) | $63,201 |
| Renter-Occupied | 1,515 (26.4%) | $45,270 |
| Average | 5,742 (100.0%) | $56,204 |
Occupancy by Householder Income Bracket in Red Hill
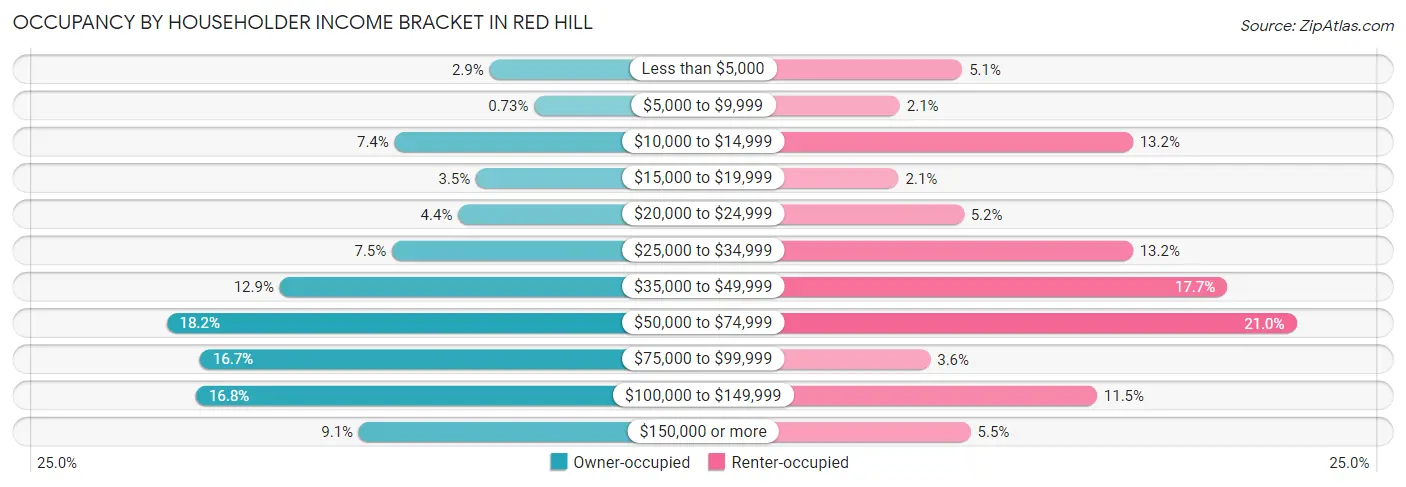
| Income Bracket | Owner-occupied | Renter-occupied |
| Less than $5,000 | 121 (2.9%) | 77 (5.1%) |
| $5,000 to $9,999 | 31 (0.7%) | 32 (2.1%) |
| $10,000 to $14,999 | 312 (7.4%) | 200 (13.2%) |
| $15,000 to $19,999 | 148 (3.5%) | 31 (2.1%) |
| $20,000 to $24,999 | 184 (4.3%) | 78 (5.1%) |
| $25,000 to $34,999 | 317 (7.5%) | 200 (13.2%) |
| $35,000 to $49,999 | 543 (12.9%) | 268 (17.7%) |
| $50,000 to $74,999 | 771 (18.2%) | 318 (21.0%) |
| $75,000 to $99,999 | 704 (16.7%) | 54 (3.6%) |
| $100,000 to $149,999 | 712 (16.8%) | 174 (11.5%) |
| $150,000 or more | 384 (9.1%) | 83 (5.5%) |
| Total | 4,227 (100.0%) | 1,515 (100.0%) |
Monthly Housing Cost Tiers in Red Hill
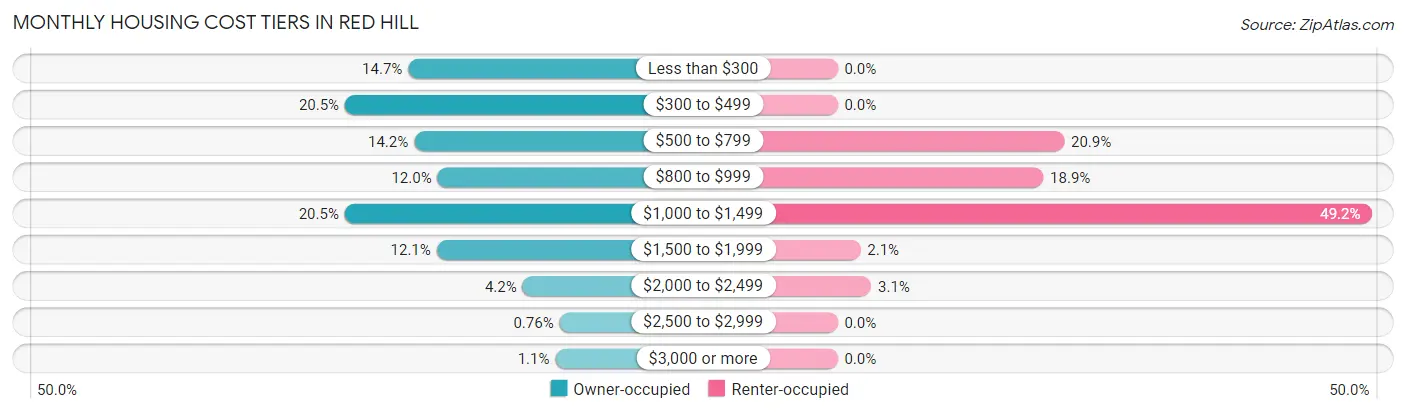
| Monthly Cost | Owner-occupied | Renter-occupied |
| Less than $300 | 621 (14.7%) | 0 (0.0%) |
| $300 to $499 | 867 (20.5%) | 0 (0.0%) |
| $500 to $799 | 598 (14.1%) | 316 (20.9%) |
| $800 to $999 | 507 (12.0%) | 287 (18.9%) |
| $1,000 to $1,499 | 868 (20.5%) | 746 (49.2%) |
| $1,500 to $1,999 | 510 (12.1%) | 32 (2.1%) |
| $2,000 to $2,499 | 176 (4.2%) | 47 (3.1%) |
| $2,500 to $2,999 | 32 (0.8%) | 0 (0.0%) |
| $3,000 or more | 48 (1.1%) | 0 (0.0%) |
| Total | 4,227 (100.0%) | 1,515 (100.0%) |
Physical Housing Characteristics in Red Hill
Housing Structures in Red Hill
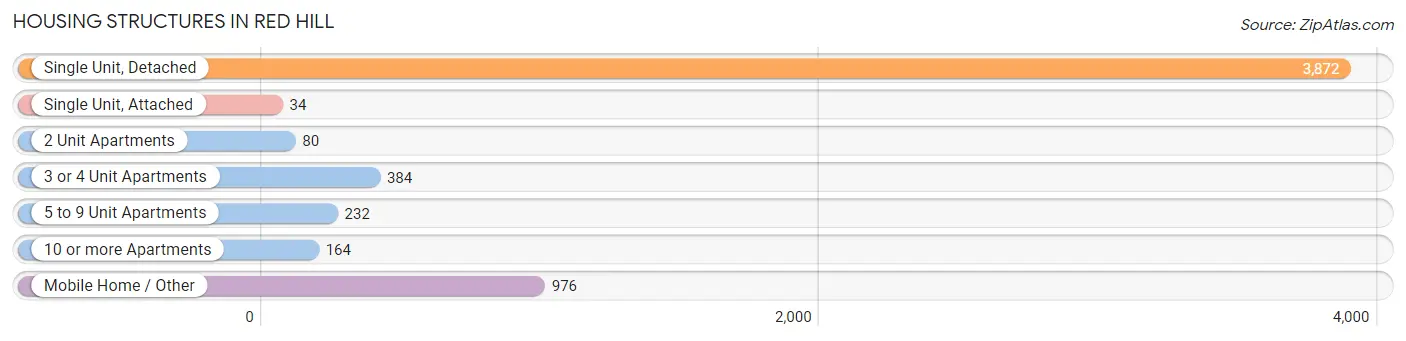
| Structure Type | # Housing Units | % Housing Units |
| Single Unit, Detached | 3,872 | 67.4% |
| Single Unit, Attached | 34 | 0.6% |
| 2 Unit Apartments | 80 | 1.4% |
| 3 or 4 Unit Apartments | 384 | 6.7% |
| 5 to 9 Unit Apartments | 232 | 4.0% |
| 10 or more Apartments | 164 | 2.9% |
| Mobile Home / Other | 976 | 17.0% |
| Total | 5,742 | 100.0% |
Housing Structures by Occupancy in Red Hill
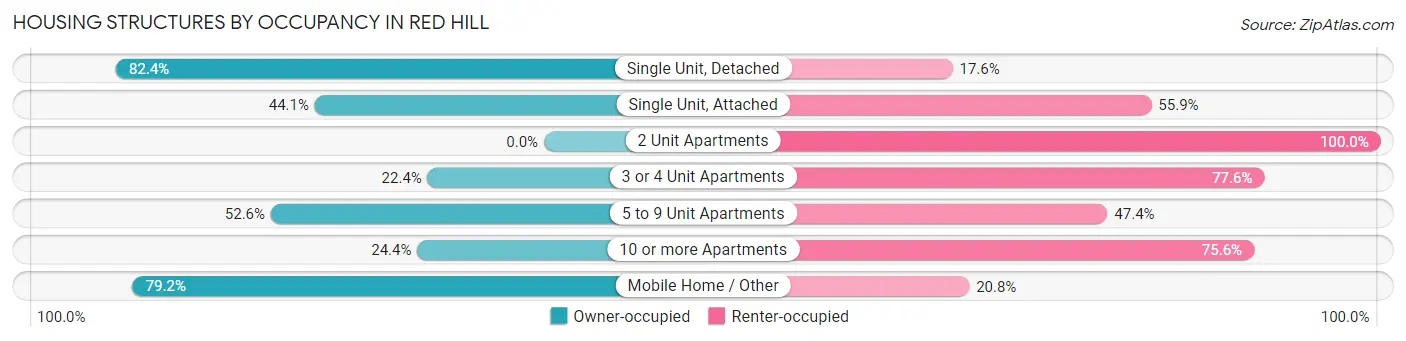
| Structure Type | Owner-occupied | Renter-occupied |
| Single Unit, Detached | 3,191 (82.4%) | 681 (17.6%) |
| Single Unit, Attached | 15 (44.1%) | 19 (55.9%) |
| 2 Unit Apartments | 0 (0.0%) | 80 (100.0%) |
| 3 or 4 Unit Apartments | 86 (22.4%) | 298 (77.6%) |
| 5 to 9 Unit Apartments | 122 (52.6%) | 110 (47.4%) |
| 10 or more Apartments | 40 (24.4%) | 124 (75.6%) |
| Mobile Home / Other | 773 (79.2%) | 203 (20.8%) |
| Total | 4,227 (73.6%) | 1,515 (26.4%) |
Housing Structures by Number of Rooms in Red Hill
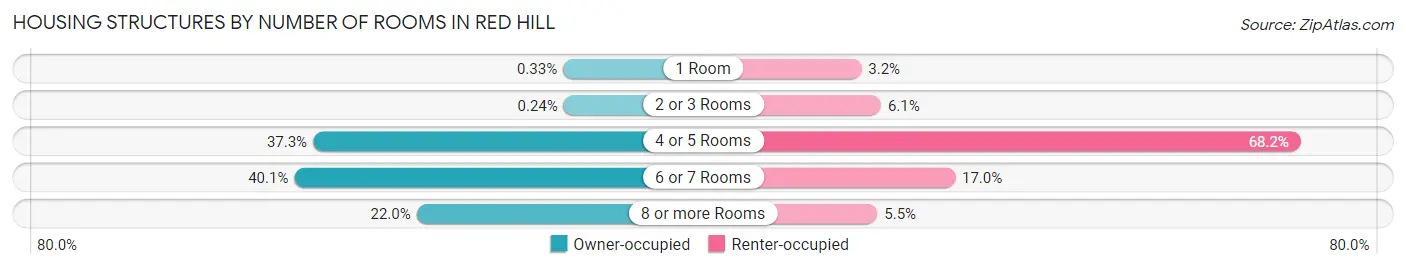
| Number of Rooms | Owner-occupied | Renter-occupied |
| 1 Room | 14 (0.3%) | 48 (3.2%) |
| 2 or 3 Rooms | 10 (0.2%) | 92 (6.1%) |
| 4 or 5 Rooms | 1,578 (37.3%) | 1,033 (68.2%) |
| 6 or 7 Rooms | 1,695 (40.1%) | 258 (17.0%) |
| 8 or more Rooms | 930 (22.0%) | 84 (5.5%) |
| Total | 4,227 (100.0%) | 1,515 (100.0%) |
Housing Structure by Heating Type in Red Hill
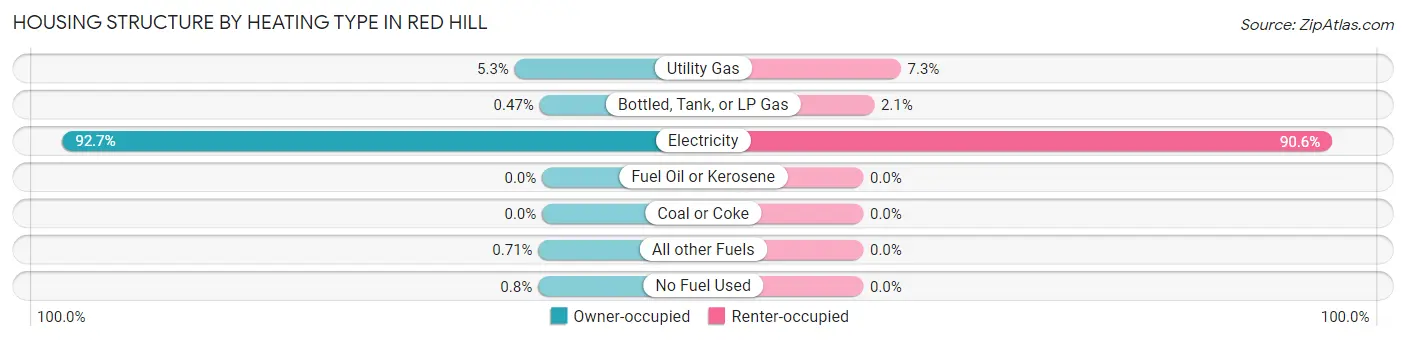
| Heating Type | Owner-occupied | Renter-occupied |
| Utility Gas | 224 (5.3%) | 110 (7.3%) |
| Bottled, Tank, or LP Gas | 20 (0.5%) | 32 (2.1%) |
| Electricity | 3,919 (92.7%) | 1,373 (90.6%) |
| Fuel Oil or Kerosene | 0 (0.0%) | 0 (0.0%) |
| Coal or Coke | 0 (0.0%) | 0 (0.0%) |
| All other Fuels | 30 (0.7%) | 0 (0.0%) |
| No Fuel Used | 34 (0.8%) | 0 (0.0%) |
| Total | 4,227 (100.0%) | 1,515 (100.0%) |
Household Vehicle Usage in Red Hill
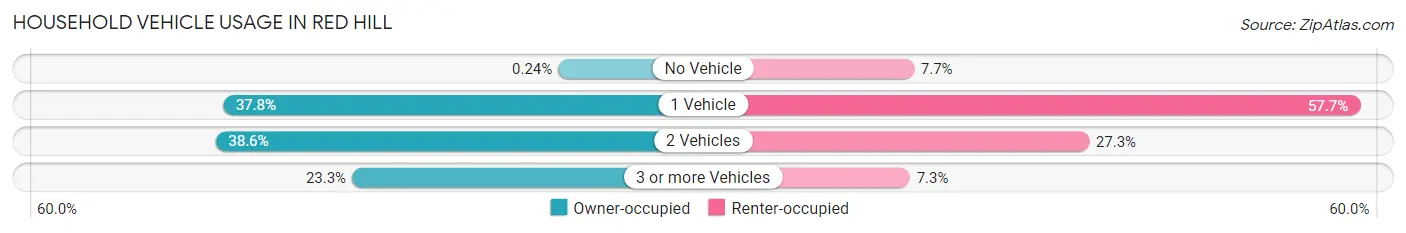
| Vehicles per Household | Owner-occupied | Renter-occupied |
| No Vehicle | 10 (0.2%) | 117 (7.7%) |
| 1 Vehicle | 1,598 (37.8%) | 874 (57.7%) |
| 2 Vehicles | 1,633 (38.6%) | 414 (27.3%) |
| 3 or more Vehicles | 986 (23.3%) | 110 (7.3%) |
| Total | 4,227 (100.0%) | 1,515 (100.0%) |
Real Estate & Mortgages in Red Hill
Real Estate and Mortgage Overview in Red Hill
| Characteristic | Without Mortgage | With Mortgage |
| Housing Units | 1,979 | 2,248 |
| Median Property Value | $187,600 | $229,800 |
| Median Household Income | $48,661 | $201 |
| Monthly Housing Costs | $355 | $48 |
| Real Estate Taxes | $555 | $60 |
Property Value by Mortgage Status in Red Hill
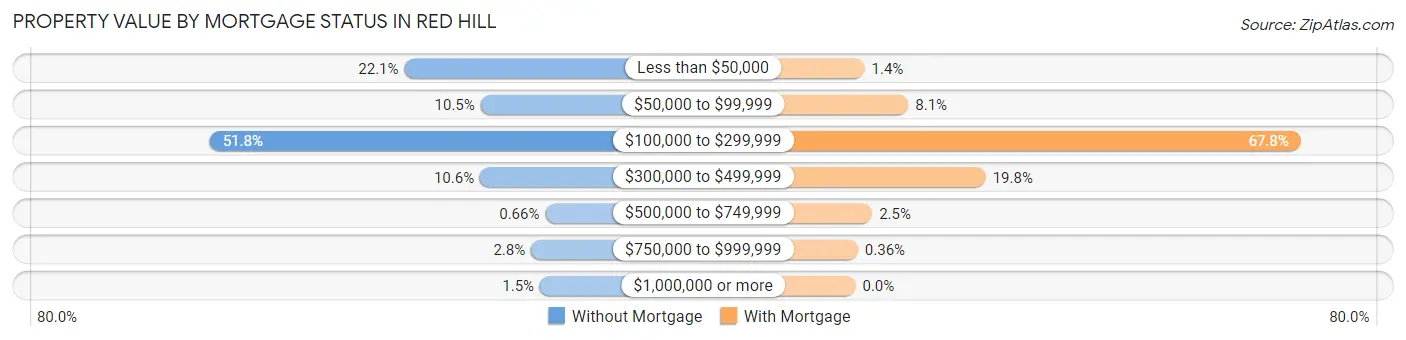
| Property Value | Without Mortgage | With Mortgage |
| Less than $50,000 | 438 (22.1%) | 31 (1.4%) |
| $50,000 to $99,999 | 208 (10.5%) | 181 (8.1%) |
| $100,000 to $299,999 | 1,025 (51.8%) | 1,525 (67.8%) |
| $300,000 to $499,999 | 210 (10.6%) | 446 (19.8%) |
| $500,000 to $749,999 | 13 (0.7%) | 57 (2.5%) |
| $750,000 to $999,999 | 56 (2.8%) | 8 (0.4%) |
| $1,000,000 or more | 29 (1.5%) | 0 (0.0%) |
| Total | 1,979 (100.0%) | 2,248 (100.0%) |
Household Income by Mortgage Status in Red Hill
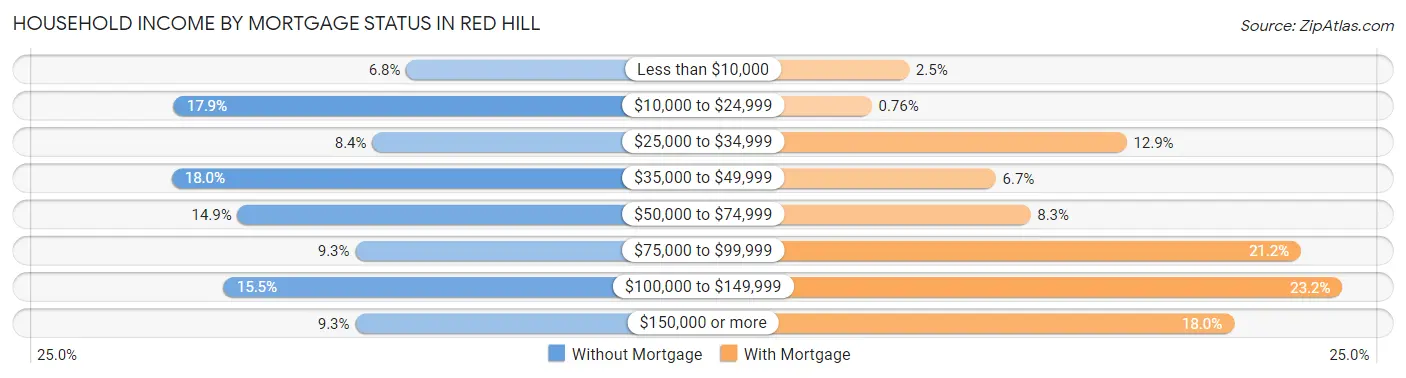
| Household Income | Without Mortgage | With Mortgage |
| Less than $10,000 | 135 (6.8%) | 57 (2.5%) |
| $10,000 to $24,999 | 354 (17.9%) | 17 (0.8%) |
| $25,000 to $34,999 | 167 (8.4%) | 290 (12.9%) |
| $35,000 to $49,999 | 356 (18.0%) | 150 (6.7%) |
| $50,000 to $74,999 | 294 (14.9%) | 187 (8.3%) |
| $75,000 to $99,999 | 183 (9.2%) | 477 (21.2%) |
| $100,000 to $149,999 | 307 (15.5%) | 521 (23.2%) |
| $150,000 or more | 183 (9.2%) | 405 (18.0%) |
| Total | 1,979 (100.0%) | 2,248 (100.0%) |
Property Value to Household Income Ratio in Red Hill
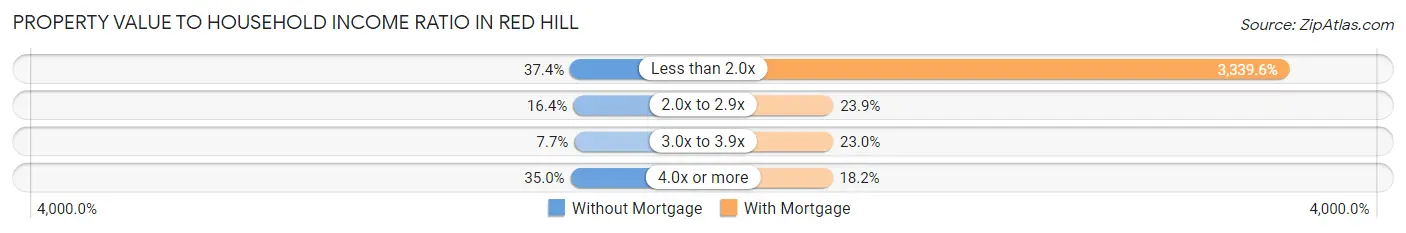
| Value-to-Income Ratio | Without Mortgage | With Mortgage |
| Less than 2.0x | 741 (37.4%) | 75,073 (3,339.5%) |
| 2.0x to 2.9x | 325 (16.4%) | 538 (23.9%) |
| 3.0x to 3.9x | 153 (7.7%) | 516 (23.0%) |
| 4.0x or more | 692 (35.0%) | 409 (18.2%) |
| Total | 1,979 (100.0%) | 2,248 (100.0%) |
Real Estate Taxes by Mortgage Status in Red Hill
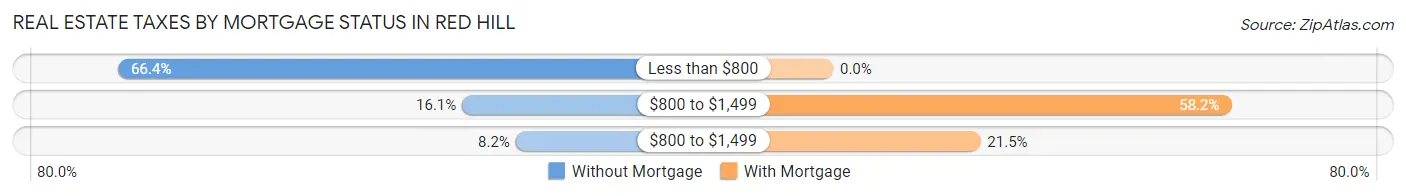
| Property Taxes | Without Mortgage | With Mortgage |
| Less than $800 | 1,313 (66.3%) | 0 (0.0%) |
| $800 to $1,499 | 318 (16.1%) | 1,308 (58.2%) |
| $800 to $1,499 | 163 (8.2%) | 484 (21.5%) |
| Total | 1,979 (100.0%) | 2,248 (100.0%) |
Health & Disability in Red Hill
Health Insurance Coverage by Age in Red Hill
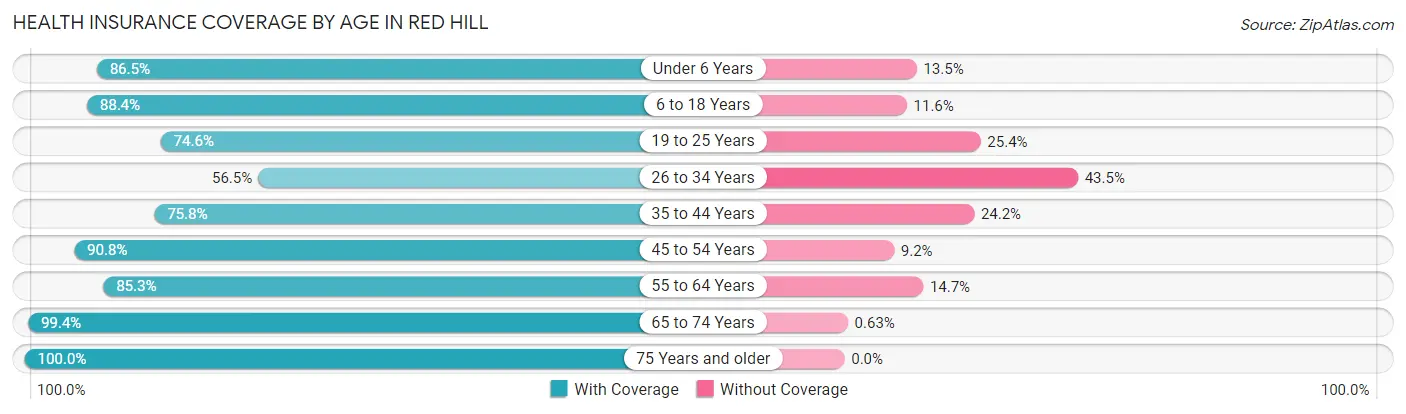
| Age Bracket | With Coverage | Without Coverage |
| Under 6 Years | 868 (86.5%) | 135 (13.5%) |
| 6 to 18 Years | 1,978 (88.4%) | 260 (11.6%) |
| 19 to 25 Years | 1,144 (74.6%) | 389 (25.4%) |
| 26 to 34 Years | 964 (56.5%) | 743 (43.5%) |
| 35 to 44 Years | 1,220 (75.8%) | 389 (24.2%) |
| 45 to 54 Years | 1,787 (90.8%) | 182 (9.2%) |
| 55 to 64 Years | 1,861 (85.3%) | 320 (14.7%) |
| 65 to 74 Years | 1,890 (99.4%) | 12 (0.6%) |
| 75 Years and older | 1,440 (100.0%) | 0 (0.0%) |
| Total | 13,152 (84.4%) | 2,430 (15.6%) |
Health Insurance Coverage by Citizenship Status in Red Hill
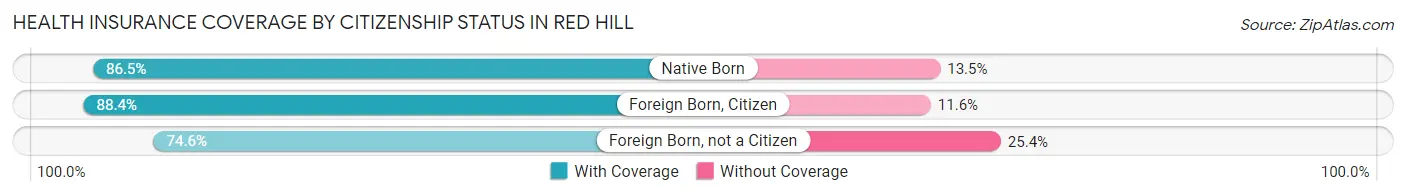
| Citizenship Status | With Coverage | Without Coverage |
| Native Born | 868 (86.5%) | 135 (13.5%) |
| Foreign Born, Citizen | 1,978 (88.4%) | 260 (11.6%) |
| Foreign Born, not a Citizen | 1,144 (74.6%) | 389 (25.4%) |
Health Insurance Coverage by Household Income in Red Hill
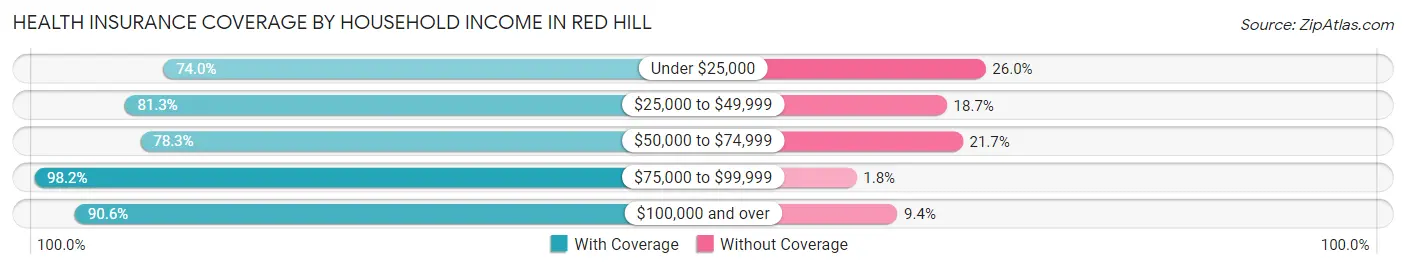
| Household Income | With Coverage | Without Coverage |
| Under $25,000 | 1,859 (74.0%) | 652 (26.0%) |
| $25,000 to $49,999 | 2,659 (81.3%) | 612 (18.7%) |
| $50,000 to $74,999 | 2,542 (78.3%) | 704 (21.7%) |
| $75,000 to $99,999 | 1,916 (98.2%) | 35 (1.8%) |
| $100,000 and over | 4,091 (90.6%) | 426 (9.4%) |
Public vs Private Health Insurance Coverage by Age in Red Hill
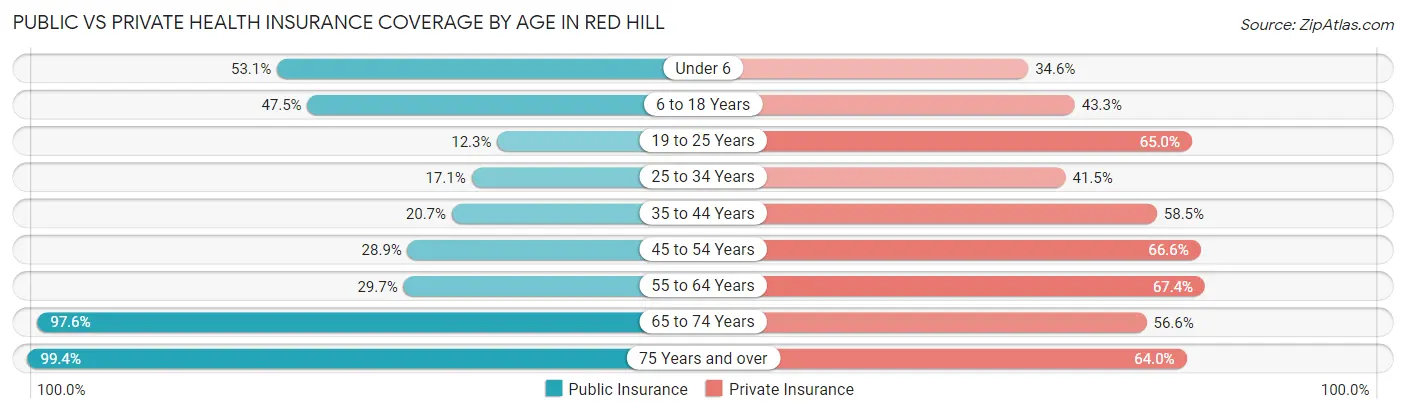
| Age Bracket | Public Insurance | Private Insurance |
| Under 6 | 533 (53.1%) | 347 (34.6%) |
| 6 to 18 Years | 1,063 (47.5%) | 968 (43.2%) |
| 19 to 25 Years | 188 (12.3%) | 996 (65.0%) |
| 25 to 34 Years | 291 (17.1%) | 709 (41.5%) |
| 35 to 44 Years | 333 (20.7%) | 941 (58.5%) |
| 45 to 54 Years | 569 (28.9%) | 1,311 (66.6%) |
| 55 to 64 Years | 647 (29.7%) | 1,470 (67.4%) |
| 65 to 74 Years | 1,857 (97.6%) | 1,076 (56.6%) |
| 75 Years and over | 1,432 (99.4%) | 921 (64.0%) |
| Total | 6,913 (44.4%) | 8,739 (56.1%) |
Disability Status by Sex by Age in Red Hill
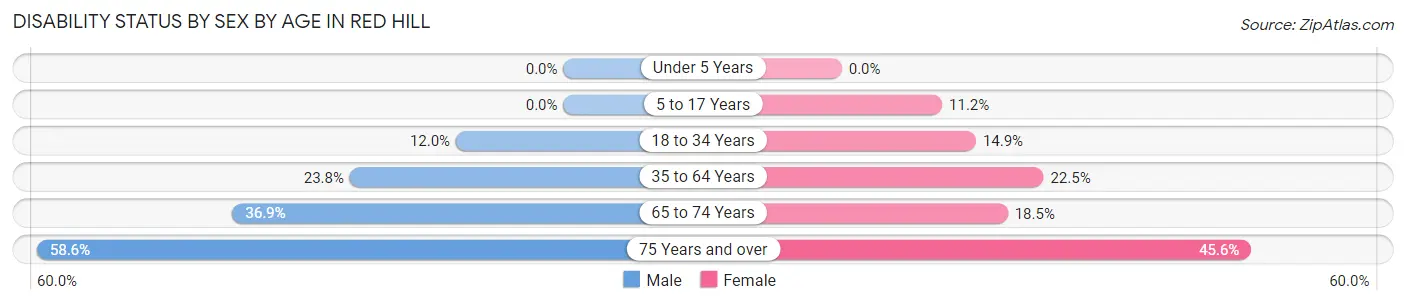
| Age Bracket | Male | Female |
| Under 5 Years | 0 (0.0%) | 0 (0.0%) |
| 5 to 17 Years | 0 (0.0%) | 109 (11.2%) |
| 18 to 34 Years | 243 (12.0%) | 224 (14.9%) |
| 35 to 64 Years | 607 (23.8%) | 720 (22.5%) |
| 65 to 74 Years | 324 (36.9%) | 189 (18.5%) |
| 75 Years and over | 326 (58.6%) | 403 (45.6%) |
Disability Class by Sex by Age in Red Hill
Disability Class: Hearing Difficulty
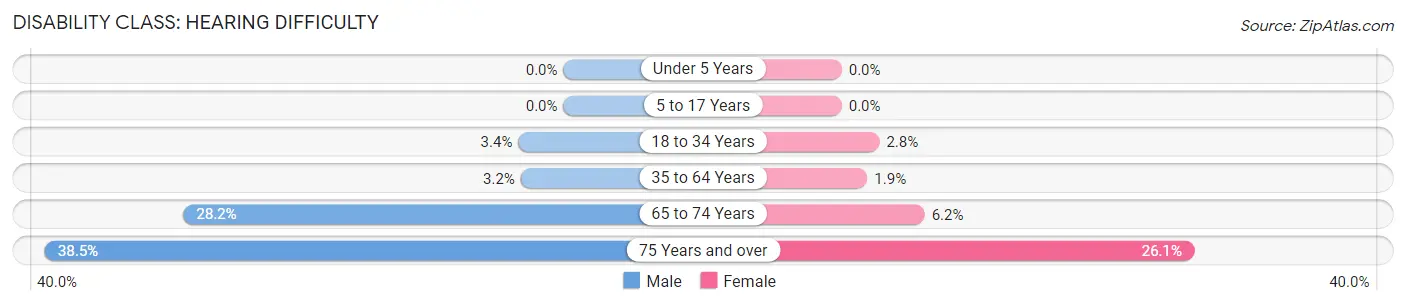
| Age Bracket | Male | Female |
| Under 5 Years | 0 (0.0%) | 0 (0.0%) |
| 5 to 17 Years | 0 (0.0%) | 0 (0.0%) |
| 18 to 34 Years | 68 (3.4%) | 42 (2.8%) |
| 35 to 64 Years | 81 (3.2%) | 61 (1.9%) |
| 65 to 74 Years | 248 (28.2%) | 63 (6.2%) |
| 75 Years and over | 214 (38.5%) | 231 (26.1%) |
Disability Class: Vision Difficulty
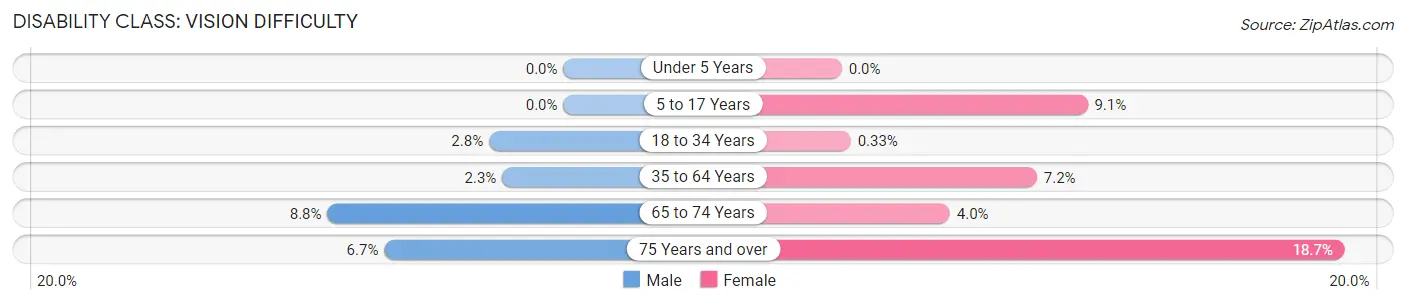
| Age Bracket | Male | Female |
| Under 5 Years | 0 (0.0%) | 0 (0.0%) |
| 5 to 17 Years | 0 (0.0%) | 89 (9.1%) |
| 18 to 34 Years | 56 (2.8%) | 5 (0.3%) |
| 35 to 64 Years | 58 (2.3%) | 232 (7.2%) |
| 65 to 74 Years | 77 (8.8%) | 41 (4.0%) |
| 75 Years and over | 37 (6.7%) | 165 (18.7%) |
Disability Class: Cognitive Difficulty
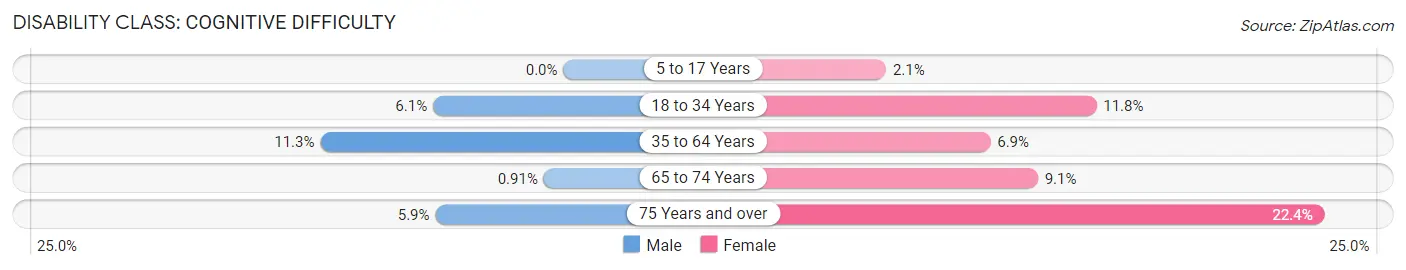
| Age Bracket | Male | Female |
| 5 to 17 Years | 0 (0.0%) | 20 (2.1%) |
| 18 to 34 Years | 123 (6.0%) | 177 (11.8%) |
| 35 to 64 Years | 288 (11.3%) | 221 (6.9%) |
| 65 to 74 Years | 8 (0.9%) | 93 (9.1%) |
| 75 Years and over | 33 (5.9%) | 198 (22.4%) |
Disability Class: Ambulatory Difficulty
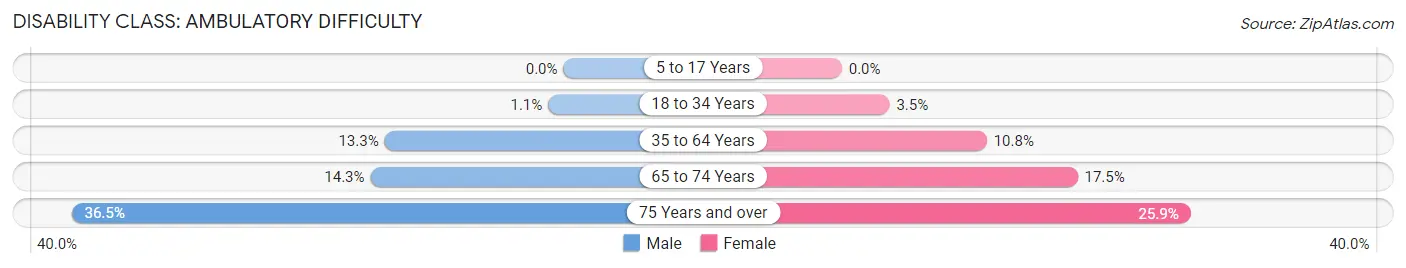
| Age Bracket | Male | Female |
| 5 to 17 Years | 0 (0.0%) | 0 (0.0%) |
| 18 to 34 Years | 23 (1.1%) | 53 (3.5%) |
| 35 to 64 Years | 339 (13.3%) | 345 (10.8%) |
| 65 to 74 Years | 126 (14.3%) | 179 (17.5%) |
| 75 Years and over | 203 (36.5%) | 229 (25.9%) |
Disability Class: Self-Care Difficulty
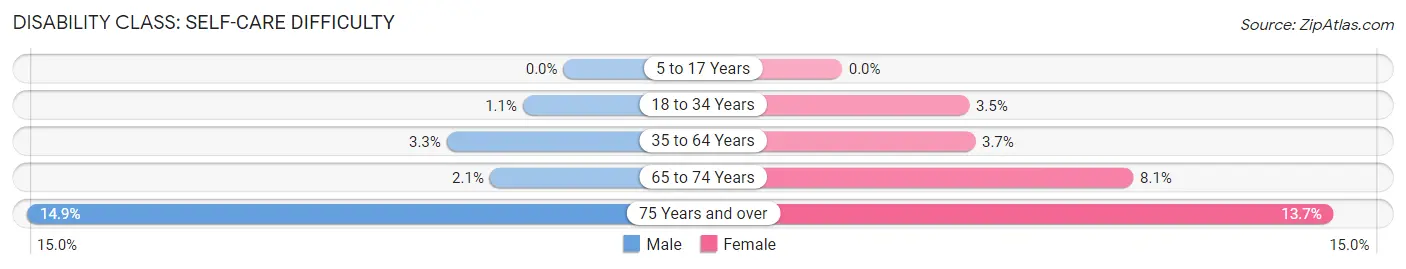
| Age Bracket | Male | Female |
| 5 to 17 Years | 0 (0.0%) | 0 (0.0%) |
| 18 to 34 Years | 23 (1.1%) | 53 (3.5%) |
| 35 to 64 Years | 83 (3.3%) | 119 (3.7%) |
| 65 to 74 Years | 18 (2.1%) | 83 (8.1%) |
| 75 Years and over | 83 (14.9%) | 121 (13.7%) |
Technology Access in Red Hill
Computing Device Access in Red Hill
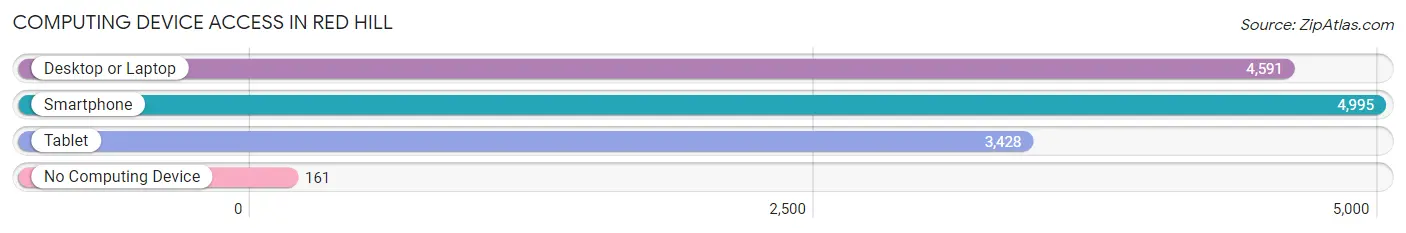
| Device Type | # Households | % Households |
| Desktop or Laptop | 4,591 | 79.9% |
| Smartphone | 4,995 | 87.0% |
| Tablet | 3,428 | 59.7% |
| No Computing Device | 161 | 2.8% |
| Total | 5,742 | 100.0% |
Internet Access in Red Hill
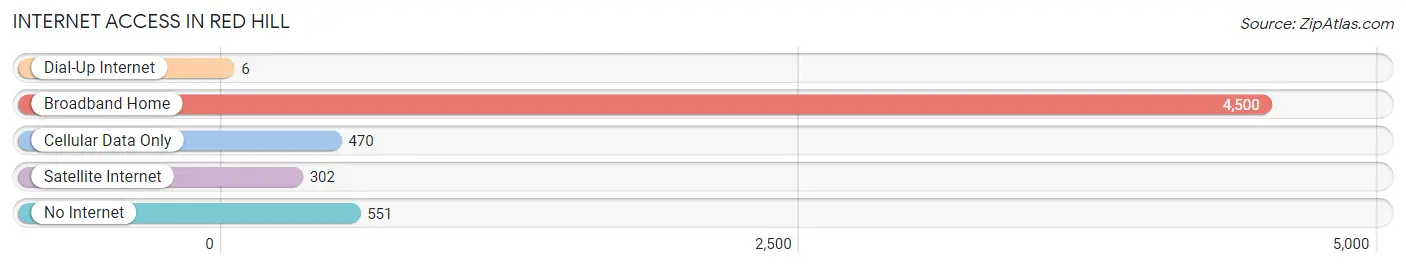
| Internet Type | # Households | % Households |
| Dial-Up Internet | 6 | 0.1% |
| Broadband Home | 4,500 | 78.4% |
| Cellular Data Only | 470 | 8.2% |
| Satellite Internet | 302 | 5.3% |
| No Internet | 551 | 9.6% |
| Total | 5,742 | 100.0% |
Red Hill Summary
History
Red Hill is a small unincorporated community located in the northern part of Anderson County, South Carolina. It is situated along the banks of the Saluda River, and is bordered by the towns of Belton and Honea Path. The area was first settled in the early 1800s by a group of settlers from North Carolina. The town was originally known as “Red Hill” due to the red clay soil in the area.
The town was officially incorporated in 1883, and the first post office was established in 1884. The town was named after the red clay soil, and the name was chosen by the first postmaster, William H. Redding. The town was a thriving agricultural community, and the main crops grown were cotton, corn, and tobacco.
In the early 1900s, the town began to experience a period of growth and development. The first school was built in 1906, and the first bank was established in 1908. The town also had a cotton gin, a grist mill, and a sawmill.
In the 1920s, the town experienced a period of decline due to the Great Depression. Many of the businesses in the town closed, and the population decreased. However, the town was able to survive and eventually began to experience a period of growth and development in the 1950s.
The town experienced a period of growth and development in the 1960s and 1970s. The population increased, and new businesses opened in the town. The town also experienced a period of growth and development in the 1980s and 1990s.
Geography
Red Hill is located in the northern part of Anderson County, South Carolina. It is situated along the banks of the Saluda River, and is bordered by the towns of Belton and Honea Path. The town is located at an elevation of approximately 500 feet above sea level.
The town is located in a rural area, and the terrain is mostly flat. The climate is mild, with temperatures ranging from the mid-50s in the winter to the mid-80s in the summer. The town receives an average of 48 inches of rain per year.
Economy
The economy of Red Hill is largely based on agriculture. The main crops grown in the area are cotton, corn, and tobacco. The town also has a few small businesses, including a grocery store, a hardware store, and a few restaurants.
The town is also home to a few manufacturing companies, including a furniture factory and a textile mill. The town also has a few small service businesses, including a gas station and a few auto repair shops.
Demographics
As of the 2010 census, the population of Red Hill was 1,845. The racial makeup of the town was 94.3% White, 3.3% African American, 0.3% Native American, 0.2% Asian, 0.1% Pacific Islander, and 1.8% from other races. The median household income was $31,250, and the median family income was $37,500. The per capita income was $17,845.
Conclusion
Red Hill is a small unincorporated community located in the northern part of Anderson County, South Carolina. It is situated along the banks of the Saluda River, and is bordered by the towns of Belton and Honea Path. The town was originally settled in the early 1800s, and was officially incorporated in 1883. The town has a largely agricultural economy, and the main crops grown are cotton, corn, and tobacco. The town also has a few small businesses, including a grocery store, a hardware store, and a few restaurants. As of the 2010 census, the population of Red Hill was 1,845. The racial makeup of the town was 94.3% White, 3.3% African American, 0.3% Native American, 0.2% Asian, 0.1% Pacific Islander, and 1.8% from other races. The median household income was $31,250, and the median family income was $37,500. The per capita income was $17,845.
Common Questions
What is Per Capita Income in Red Hill?
Per Capita income in Red Hill is $27,934.
What is the Median Family Income in Red Hill?
Median Family Income in Red Hill is $61,685.
What is the Median Household income in Red Hill?
Median Household Income in Red Hill is $56,204.
What is Income or Wage Gap in Red Hill?
Income or Wage Gap in Red Hill is 8.4%.
Women in Red Hill earn 91.6 cents for every dollar earned by a man.
What is Family Income Deficit in Red Hill?
Family Income Deficit in Red Hill is $7,936.
Families that are below poverty line in Red Hill earn $7,936 less on average than the poverty threshold level.
What is Inequality or Gini Index in Red Hill?
Inequality or Gini Index in Red Hill is 0.42.
What is the Total Population of Red Hill?
Total Population of Red Hill is 15,585.
What is the Total Male Population of Red Hill?
Total Male Population of Red Hill is 7,428.
What is the Total Female Population of Red Hill?
Total Female Population of Red Hill is 8,157.
What is the Ratio of Males per 100 Females in Red Hill?
There are 91.06 Males per 100 Females in Red Hill.
What is the Ratio of Females per 100 Males in Red Hill?
There are 109.81 Females per 100 Males in Red Hill.
What is the Median Population Age in Red Hill?
Median Population Age in Red Hill is 43.1 Years.
What is the Average Family Size in Red Hill
Average Family Size in Red Hill is 3.0 People.
What is the Average Household Size in Red Hill
Average Household Size in Red Hill is 2.7 People.
How Large is the Labor Force in Red Hill?
There are 6,973 People in the Labor Forcein in Red Hill.
What is the Percentage of People in the Labor Force in Red Hill?
53.3% of People are in the Labor Force in Red Hill.
What is the Unemployment Rate in Red Hill?
Unemployment Rate in Red Hill is 6.3%.