Wilkinson Heights, SC Map & Demographics
Wilkinson Heights Map
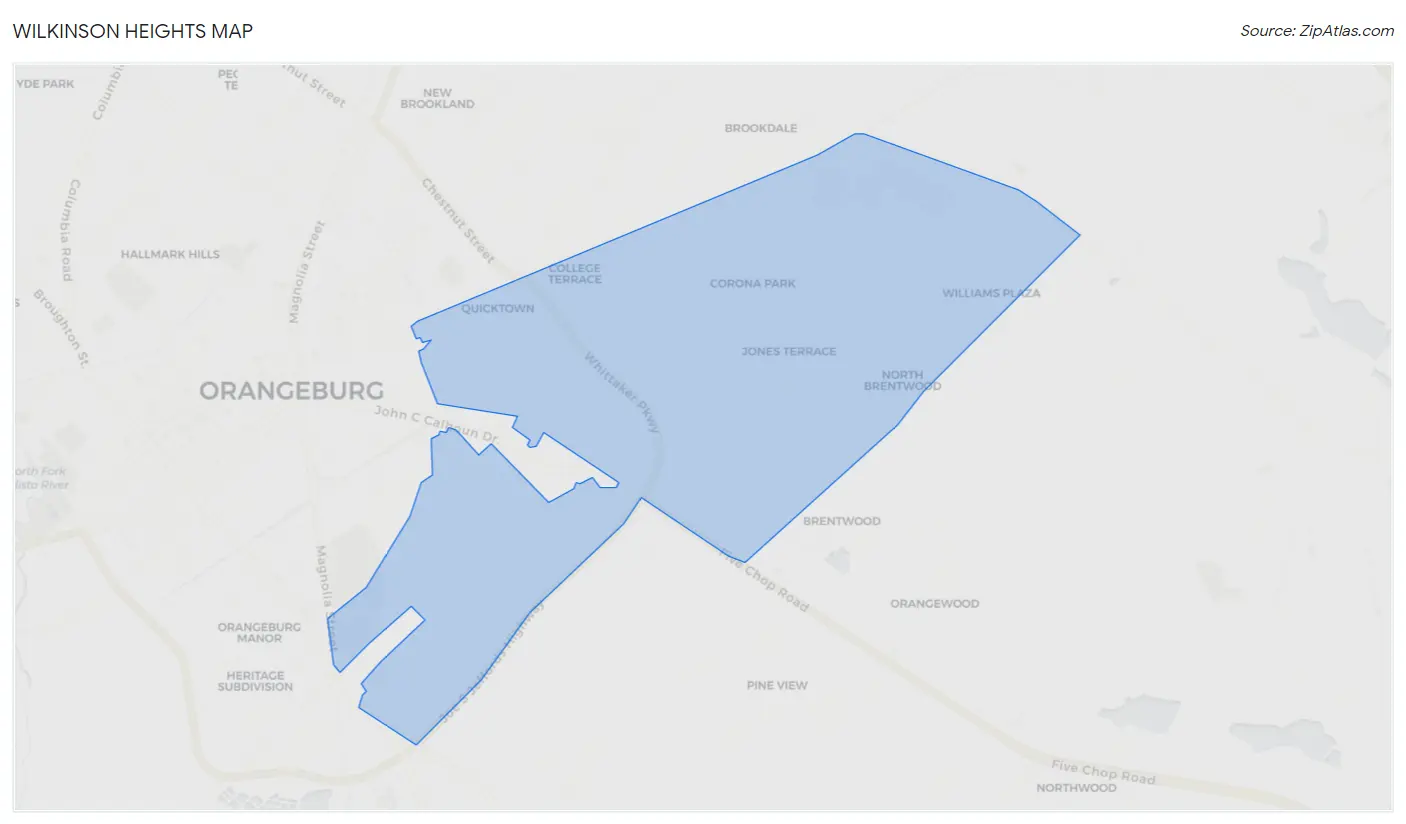
Wilkinson Heights Overview
$15,046
PER CAPITA INCOME
$47,292
AVG FAMILY INCOME
$22,730
AVG HOUSEHOLD INCOME
38.7%
WAGE / INCOME GAP [ % ]
61.3¢/ $1
WAGE / INCOME GAP [ $ ]
0.43
INEQUALITY / GINI INDEX
1,919
TOTAL POPULATION
770
MALE POPULATION
1,149
FEMALE POPULATION
67.01
MALES / 100 FEMALES
149.22
FEMALES / 100 MALES
32.0
MEDIAN AGE
3.4
AVG FAMILY SIZE
2.0
AVG HOUSEHOLD SIZE
776
LABOR FORCE [ PEOPLE ]
48.1%
PERCENT IN LABOR FORCE
12.6%
UNEMPLOYMENT RATE
Income in Wilkinson Heights
Income Overview in Wilkinson Heights
Per Capita Income in Wilkinson Heights is $15,046, while median incomes of families and households are $47,292 and $22,730 respectively.
| Characteristic | Number | Measure |
| Per Capita Income | 1,919 | $15,046 |
| Median Family Income | 360 | $47,292 |
| Mean Family Income | 360 | $50,772 |
| Median Household Income | 936 | $22,730 |
| Mean Household Income | 936 | $30,646 |
| Income Deficit | 360 | $0 |
| Wage / Income Gap (%) | 1,919 | 38.67% |
| Wage / Income Gap ($) | 1,919 | 61.33¢ per $1 |
| Gini / Inequality Index | 1,919 | 0.43 |
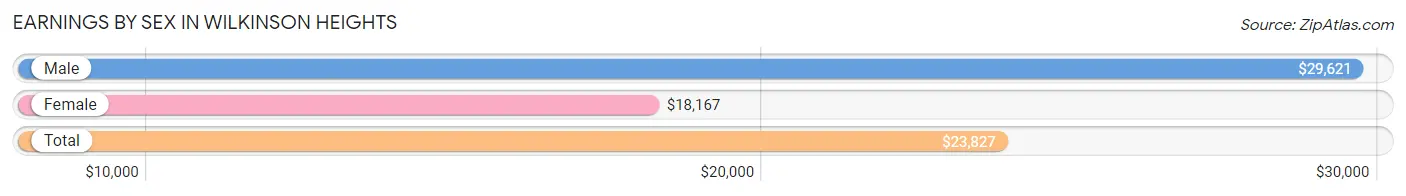
Earnings by Sex in Wilkinson Heights
Average Earnings in Wilkinson Heights are $23,827, $29,621 for men and $18,167 for women, a difference of 38.7%.
| Sex | Number | Average Earnings |
| Male | 376 (48.8%) | $29,621 |
| Female | 394 (51.2%) | $18,167 |
| Total | 770 (100.0%) | $23,827 |
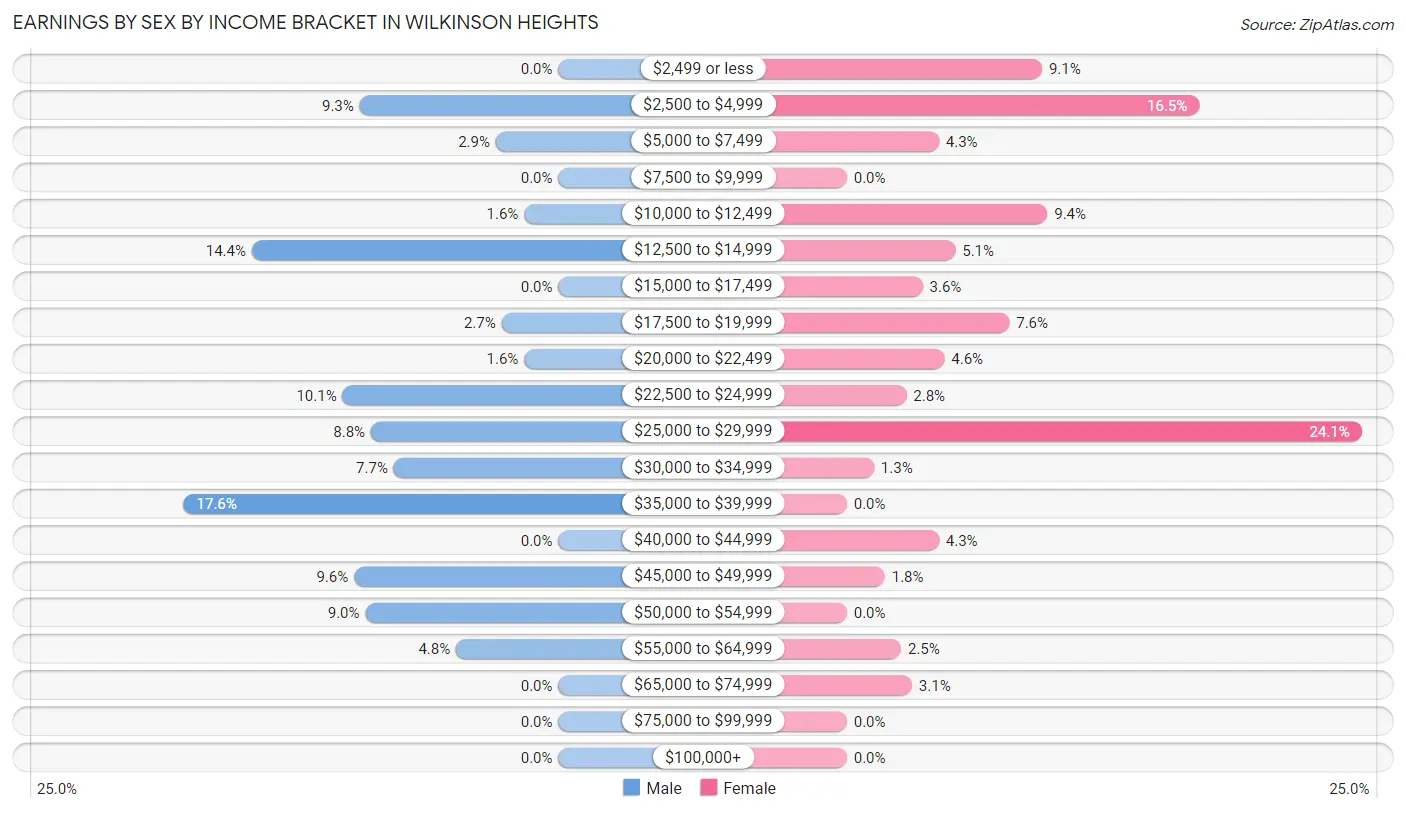
Earnings by Sex by Income Bracket in Wilkinson Heights
The most common earnings brackets in Wilkinson Heights are $35,000 to $39,999 for men (66 | 17.5%) and $25,000 to $29,999 for women (95 | 24.1%).
| Income | Male | Female |
| $2,499 or less | 0 (0.0%) | 36 (9.1%) |
| $2,500 to $4,999 | 35 (9.3%) | 65 (16.5%) |
| $5,000 to $7,499 | 11 (2.9%) | 17 (4.3%) |
| $7,500 to $9,999 | 0 (0.0%) | 0 (0.0%) |
| $10,000 to $12,499 | 6 (1.6%) | 37 (9.4%) |
| $12,500 to $14,999 | 54 (14.4%) | 20 (5.1%) |
| $15,000 to $17,499 | 0 (0.0%) | 14 (3.5%) |
| $17,500 to $19,999 | 10 (2.7%) | 30 (7.6%) |
| $20,000 to $22,499 | 6 (1.6%) | 18 (4.6%) |
| $22,500 to $24,999 | 38 (10.1%) | 11 (2.8%) |
| $25,000 to $29,999 | 33 (8.8%) | 95 (24.1%) |
| $30,000 to $34,999 | 29 (7.7%) | 5 (1.3%) |
| $35,000 to $39,999 | 66 (17.5%) | 0 (0.0%) |
| $40,000 to $44,999 | 0 (0.0%) | 17 (4.3%) |
| $45,000 to $49,999 | 36 (9.6%) | 7 (1.8%) |
| $50,000 to $54,999 | 34 (9.0%) | 0 (0.0%) |
| $55,000 to $64,999 | 18 (4.8%) | 10 (2.5%) |
| $65,000 to $74,999 | 0 (0.0%) | 12 (3.0%) |
| $75,000 to $99,999 | 0 (0.0%) | 0 (0.0%) |
| $100,000+ | 0 (0.0%) | 0 (0.0%) |
| Total | 376 (100.0%) | 394 (100.0%) |
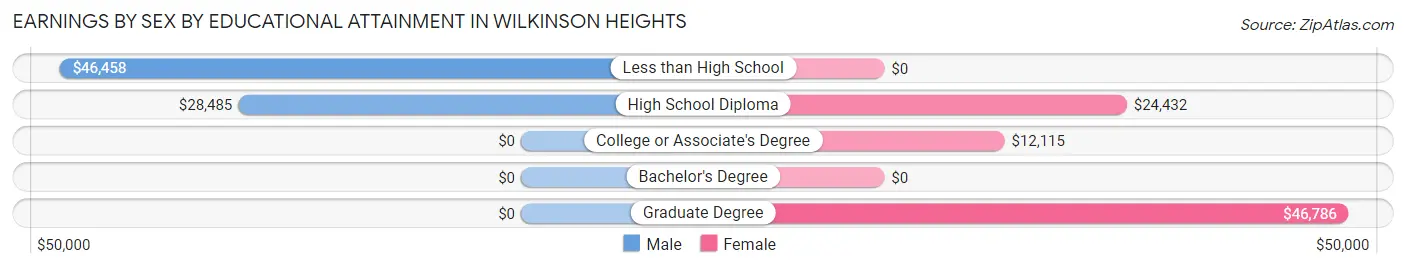
Earnings by Sex by Educational Attainment in Wilkinson Heights
Average earnings in Wilkinson Heights are $31,583 for men and $19,125 for women, a difference of 39.5%. Men with an educational attainment of less than high school enjoy the highest average annual earnings of $46,458, while those with high school diploma education earn the least with $28,485. Women with an educational attainment of graduate degree earn the most with the average annual earnings of $46,786, while those with college or associate's degree education have the smallest earnings of $12,115.
| Educational Attainment | Male Income | Female Income |
| Less than High School | $46,458 | $0 |
| High School Diploma | $28,485 | $24,432 |
| College or Associate's Degree | - | - |
| Bachelor's Degree | - | - |
| Graduate Degree | - | - |
| Total | $31,583 | $19,125 |
Family Income in Wilkinson Heights
Family Income Brackets in Wilkinson Heights
According to the Wilkinson Heights family income data, there are 114 families falling into the $50,000 to $74,999 income range, which is the most common income bracket and makes up 31.7% of all families.
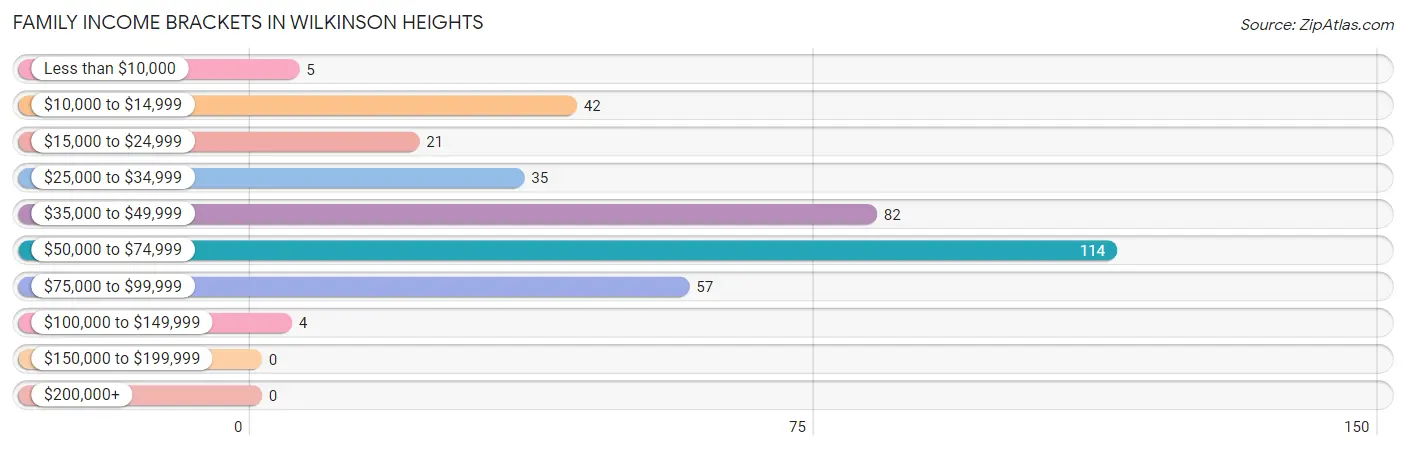
| Income Bracket | # Families | % Families |
| Less than $10,000 | 5 | 1.4% |
| $10,000 to $14,999 | 42 | 11.7% |
| $15,000 to $24,999 | 21 | 5.8% |
| $25,000 to $34,999 | 35 | 9.7% |
| $35,000 to $49,999 | 82 | 22.8% |
| $50,000 to $74,999 | 114 | 31.7% |
| $75,000 to $99,999 | 57 | 15.8% |
| $100,000 to $149,999 | 4 | 1.1% |
| $150,000 to $199,999 | 0 | 0.0% |
| $200,000+ | 0 | 0.0% |
Family Income by Famaliy Size in Wilkinson Heights
3-person families (99 | 27.5%) account for the highest median family income in Wilkinson Heights with $54,261 per family, while 2-person families (182 | 50.6%) have the highest median income of $22,750 per family member.
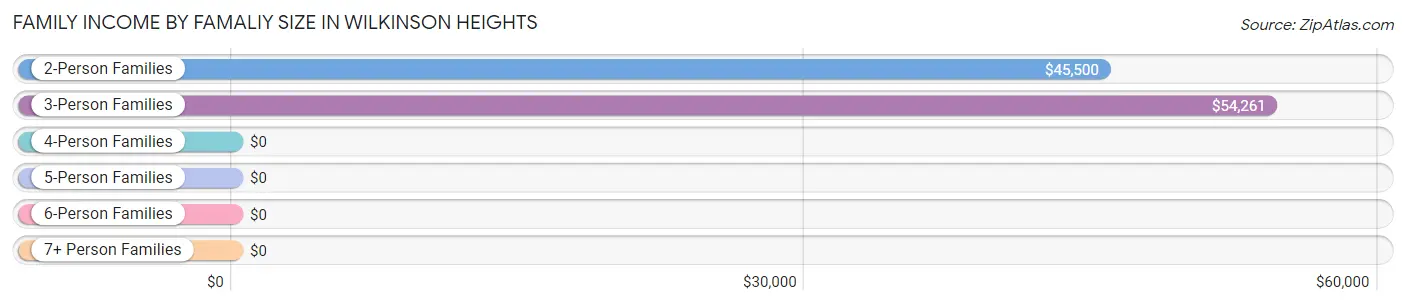
| Income Bracket | # Families | Median Income |
| 2-Person Families | 182 (50.6%) | $45,500 |
| 3-Person Families | 99 (27.5%) | $54,261 |
| 4-Person Families | 0 (0.0%) | $0 |
| 5-Person Families | 44 (12.2%) | $0 |
| 6-Person Families | 12 (3.3%) | $0 |
| 7+ Person Families | 23 (6.4%) | $0 |
| Total | 360 (100.0%) | $47,292 |
Family Income by Number of Earners in Wilkinson Heights
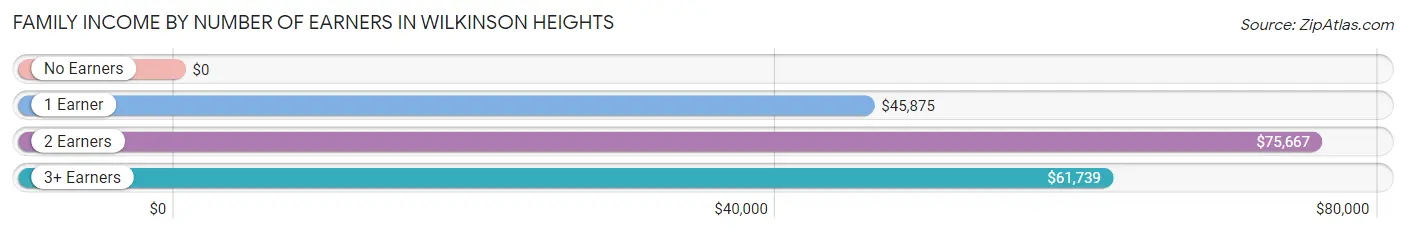
| Number of Earners | # Families | Median Income |
| No Earners | 14 (3.9%) | $0 |
| 1 Earner | 204 (56.7%) | $45,875 |
| 2 Earners | 88 (24.4%) | $75,667 |
| 3+ Earners | 54 (15.0%) | $61,739 |
| Total | 360 (100.0%) | $47,292 |
Household Income in Wilkinson Heights
Household Income Brackets in Wilkinson Heights
With 227 households falling in the category, the less than $10,000 income range is the most frequent in Wilkinson Heights, accounting for 24.2% of all households.
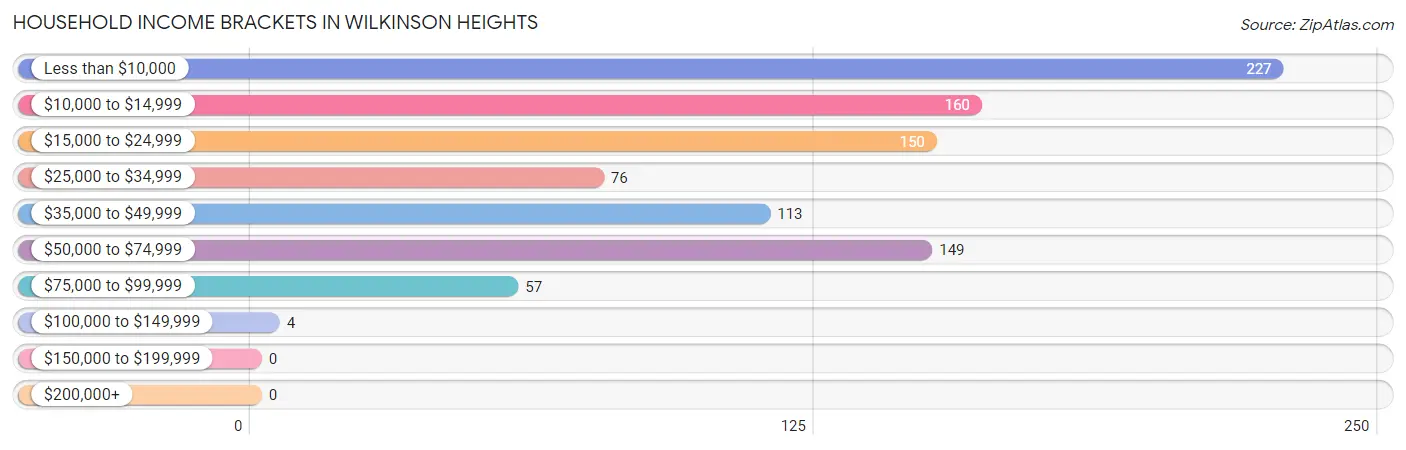
| Income Bracket | # Households | % Households |
| Less than $10,000 | 227 | 24.3% |
| $10,000 to $14,999 | 160 | 17.1% |
| $15,000 to $24,999 | 150 | 16.0% |
| $25,000 to $34,999 | 76 | 8.1% |
| $35,000 to $49,999 | 113 | 12.1% |
| $50,000 to $74,999 | 149 | 15.9% |
| $75,000 to $99,999 | 57 | 6.1% |
| $100,000 to $149,999 | 4 | 0.4% |
| $150,000 to $199,999 | 0 | 0.0% |
| $200,000+ | 0 | 0.0% |
Household Income by Householder Age in Wilkinson Heights
The median household income in Wilkinson Heights is $22,730, with the highest median household income of $24,839 found in the 65+ years age bracket for the primary householder. A total of 236 households (25.2%) fall into this category. Meanwhile, the 15 to 24 years age bracket for the primary householder has the lowest median household income of $0, with 53 households (5.7%) in this group.
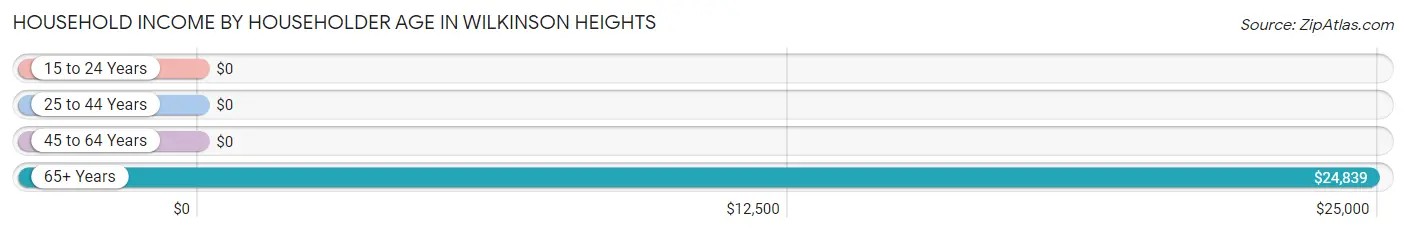
| Income Bracket | # Households | Median Income |
| 15 to 24 Years | 53 (5.7%) | $0 |
| 25 to 44 Years | 256 (27.4%) | $0 |
| 45 to 64 Years | 391 (41.8%) | $0 |
| 65+ Years | 236 (25.2%) | $24,839 |
| Total | 936 (100.0%) | $22,730 |
Poverty in Wilkinson Heights
Income Below Poverty by Sex and Age in Wilkinson Heights
With 32.1% poverty level for males and 35.1% for females among the residents of Wilkinson Heights, 6 to 11 year old males and 12 to 14 year old females are the most vulnerable to poverty, with 15 males (100.0%) and 6 females (100.0%) in their respective age groups living below the poverty level.
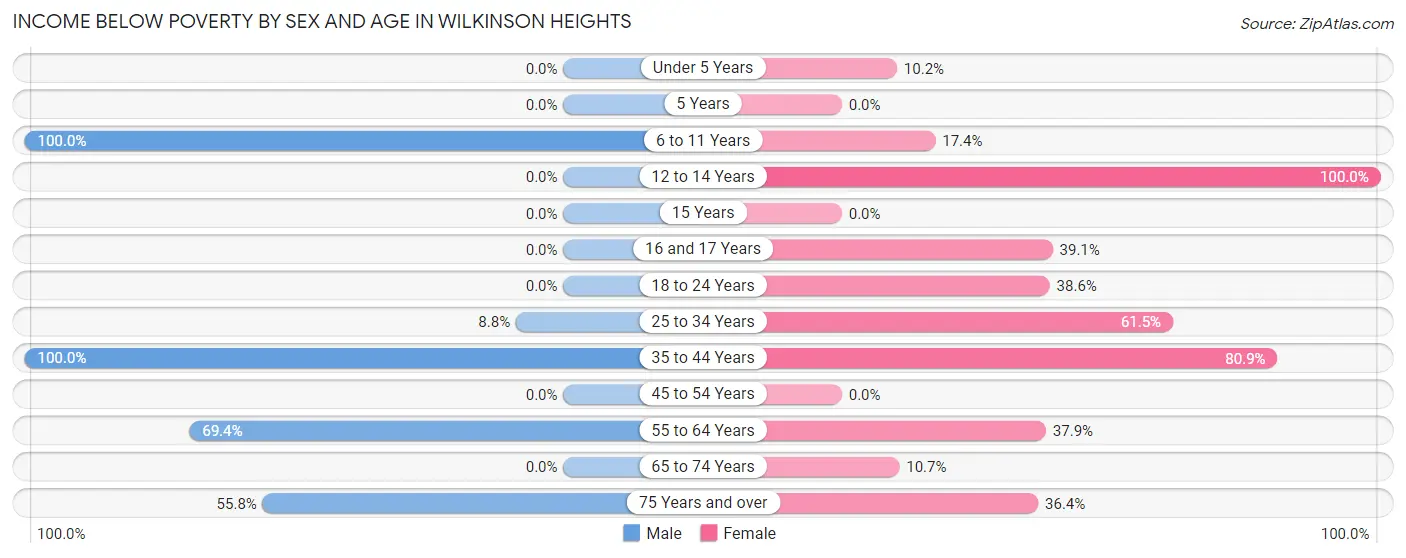
| Age Bracket | Male | Female |
| Under 5 Years | 0 (0.0%) | 9 (10.2%) |
| 5 Years | 0 (0.0%) | 0 (0.0%) |
| 6 to 11 Years | 15 (100.0%) | 21 (17.4%) |
| 12 to 14 Years | 0 (0.0%) | 6 (100.0%) |
| 15 Years | 0 (0.0%) | 0 (0.0%) |
| 16 and 17 Years | 0 (0.0%) | 36 (39.1%) |
| 18 to 24 Years | 0 (0.0%) | 49 (38.6%) |
| 25 to 34 Years | 24 (8.8%) | 118 (61.5%) |
| 35 to 44 Years | 25 (100.0%) | 38 (80.8%) |
| 45 to 54 Years | 0 (0.0%) | 0 (0.0%) |
| 55 to 64 Years | 159 (69.4%) | 72 (37.9%) |
| 65 to 74 Years | 0 (0.0%) | 11 (10.7%) |
| 75 Years and over | 24 (55.8%) | 43 (36.4%) |
| Total | 247 (32.1%) | 403 (35.1%) |
Income Above Poverty by Sex and Age in Wilkinson Heights
According to the poverty statistics in Wilkinson Heights, males aged under 5 years and females aged 45 to 54 years are the age groups that are most secure financially, with 100.0% of males and 100.0% of females in these age groups living above the poverty line.
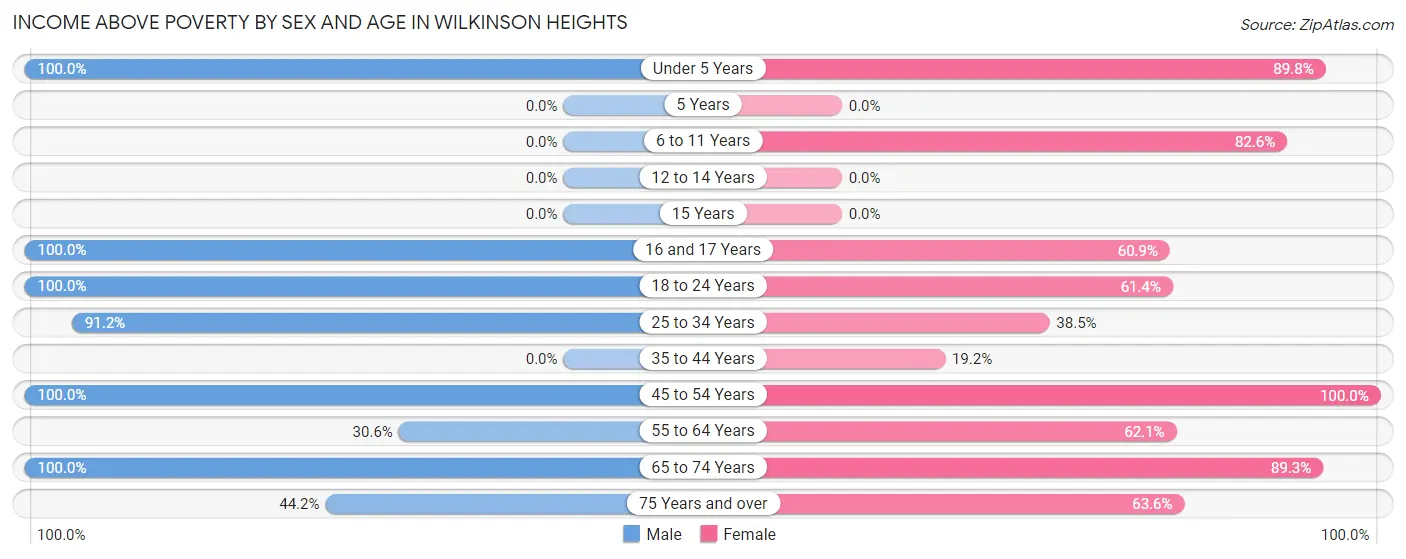
| Age Bracket | Male | Female |
| Under 5 Years | 76 (100.0%) | 79 (89.8%) |
| 5 Years | 0 (0.0%) | 0 (0.0%) |
| 6 to 11 Years | 0 (0.0%) | 100 (82.6%) |
| 12 to 14 Years | 0 (0.0%) | 0 (0.0%) |
| 15 Years | 0 (0.0%) | 0 (0.0%) |
| 16 and 17 Years | 46 (100.0%) | 56 (60.9%) |
| 18 to 24 Years | 14 (100.0%) | 78 (61.4%) |
| 25 to 34 Years | 249 (91.2%) | 74 (38.5%) |
| 35 to 44 Years | 0 (0.0%) | 9 (19.2%) |
| 45 to 54 Years | 18 (100.0%) | 65 (100.0%) |
| 55 to 64 Years | 70 (30.6%) | 118 (62.1%) |
| 65 to 74 Years | 31 (100.0%) | 92 (89.3%) |
| 75 Years and over | 19 (44.2%) | 75 (63.6%) |
| Total | 523 (67.9%) | 746 (64.9%) |
Income Below Poverty Among Married-Couple Families in Wilkinson Heights
The poverty statistics for married-couple families in Wilkinson Heights show that 15.0% or 12 of the total 80 families live below the poverty line. Families with 3 or 4 children have the highest poverty rate of 100.0%, comprising of 12 families. On the other hand, families with no children have the lowest poverty rate of 0.0%, which includes 0 families.
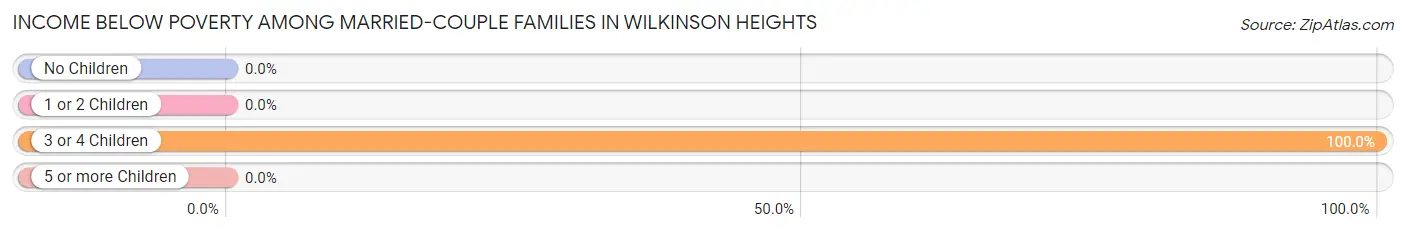
| Children | Above Poverty | Below Poverty |
| No Children | 53 (100.0%) | 0 (0.0%) |
| 1 or 2 Children | 15 (100.0%) | 0 (0.0%) |
| 3 or 4 Children | 0 (0.0%) | 12 (100.0%) |
| 5 or more Children | 0 (0.0%) | 0 (0.0%) |
| Total | 68 (85.0%) | 12 (15.0%) |
Income Below Poverty Among Single-Parent Households in Wilkinson Heights
According to the poverty data in Wilkinson Heights, 12.5% or 10 single-father households and 23.0% or 46 single-mother households are living below the poverty line. Among single-father households, those with 1 or 2 children have the highest poverty rate, with 10 households (17.5%) experiencing poverty. Likewise, among single-mother households, those with 1 or 2 children have the highest poverty rate, with 31 households (33.0%) falling below the poverty line.
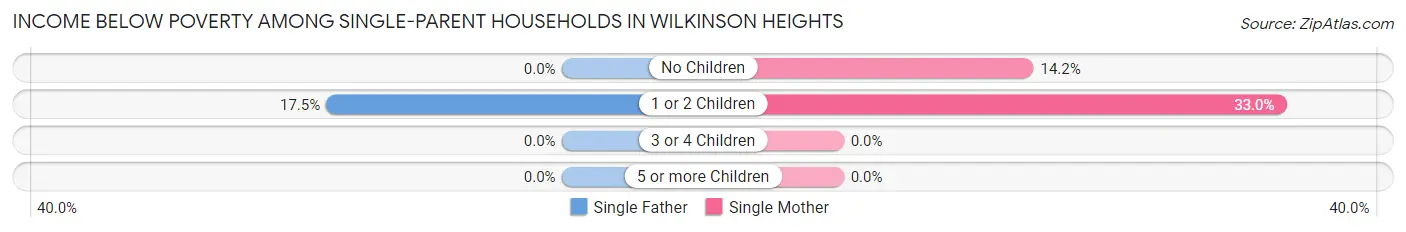
| Children | Single Father | Single Mother |
| No Children | 0 (0.0%) | 15 (14.1%) |
| 1 or 2 Children | 10 (17.5%) | 31 (33.0%) |
| 3 or 4 Children | 0 (0.0%) | 0 (0.0%) |
| 5 or more Children | 0 (0.0%) | 0 (0.0%) |
| Total | 10 (12.5%) | 46 (23.0%) |
Income Below Poverty Among Married-Couple vs Single-Parent Households in Wilkinson Heights
The poverty data for Wilkinson Heights shows that 12 of the married-couple family households (15.0%) and 56 of the single-parent households (20.0%) are living below the poverty level. Within the married-couple family households, those with 3 or 4 children have the highest poverty rate, with 12 households (100.0%) falling below the poverty line. Among the single-parent households, those with 1 or 2 children have the highest poverty rate, with 41 household (27.2%) living below poverty.
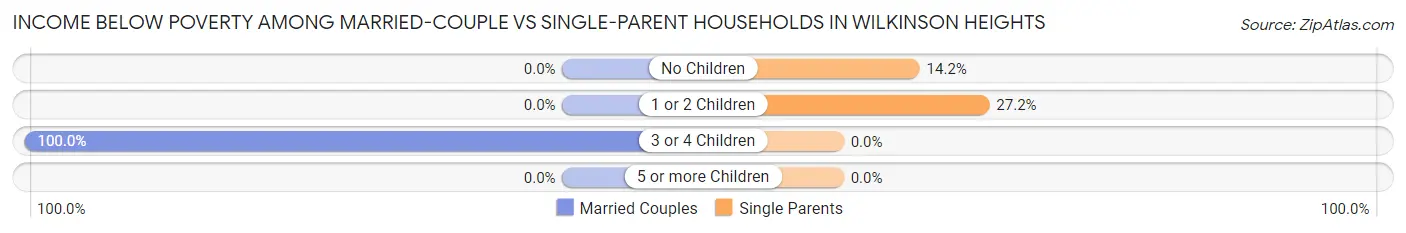
| Children | Married-Couple Families | Single-Parent Households |
| No Children | 0 (0.0%) | 15 (14.1%) |
| 1 or 2 Children | 0 (0.0%) | 41 (27.2%) |
| 3 or 4 Children | 12 (100.0%) | 0 (0.0%) |
| 5 or more Children | 0 (0.0%) | 0 (0.0%) |
| Total | 12 (15.0%) | 56 (20.0%) |
Race in Wilkinson Heights
The most populous races in Wilkinson Heights are Black / African American (1,611 | 84.0%), White / Caucasian (308 | 16.1%), and Hispanic or Latino (220 | 11.5%).
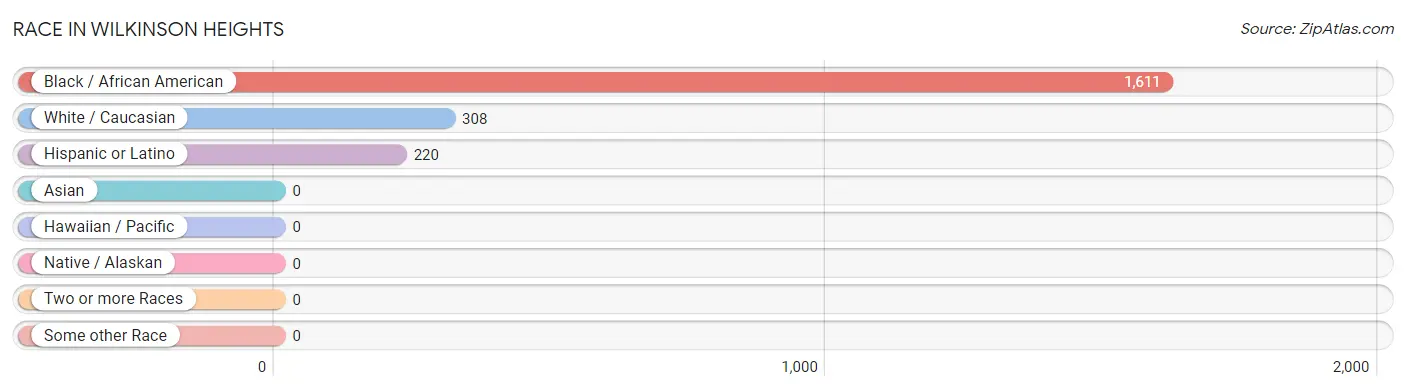
| Race | # Population | % Population |
| Asian | 0 | 0.0% |
| Black / African American | 1,611 | 84.0% |
| Hawaiian / Pacific | 0 | 0.0% |
| Hispanic or Latino | 220 | 11.5% |
| Native / Alaskan | 0 | 0.0% |
| White / Caucasian | 308 | 16.1% |
| Two or more Races | 0 | 0.0% |
| Some other Race | 0 | 0.0% |
| Total | 1,919 | 100.0% |
Ancestry in Wilkinson Heights
The most populous ancestries reported in Wilkinson Heights are Mexican (220 | 11.5%), African (62 | 3.2%), Subsaharan African (62 | 3.2%), and American (45 | 2.3%), together accounting for 20.3% of all Wilkinson Heights residents.
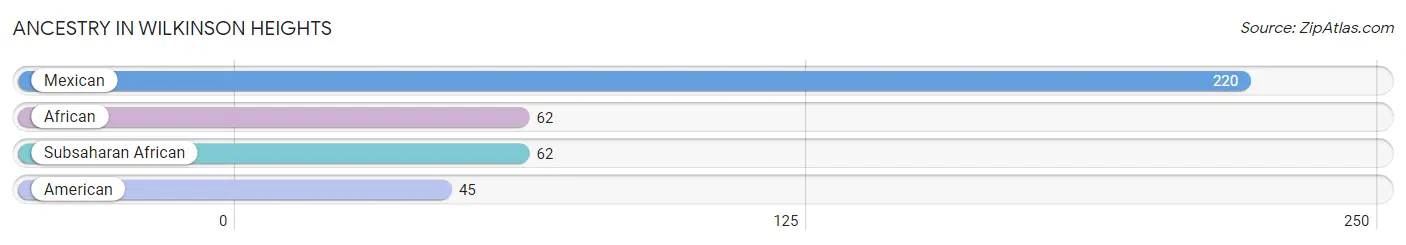
| Ancestry | # Population | % Population |
| African | 62 | 3.2% |
| American | 45 | 2.3% |
| Mexican | 220 | 11.5% |
| Subsaharan African | 62 | 3.2% | View All 4 Rows |
Immigrants in Wilkinson Heights
The most numerous immigrant groups reported in Wilkinson Heights came from Central America (59 | 3.1%), Latin America (59 | 3.1%), and Mexico (59 | 3.1%), together accounting for 9.2% of all Wilkinson Heights residents.
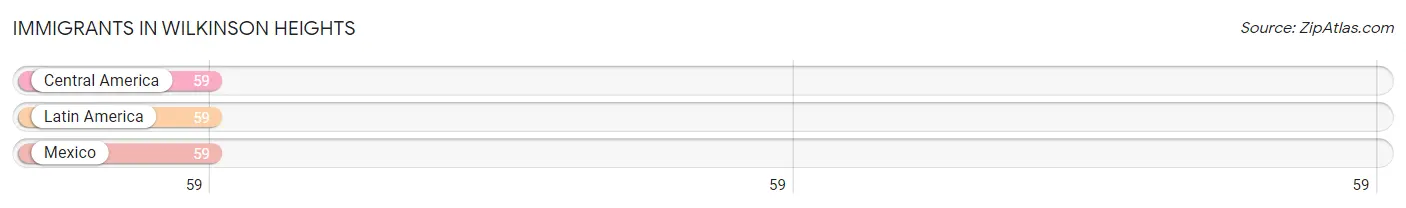
| Immigration Origin | # Population | % Population |
| Central America | 59 | 3.1% |
| Latin America | 59 | 3.1% |
| Mexico | 59 | 3.1% | View All 3 Rows |
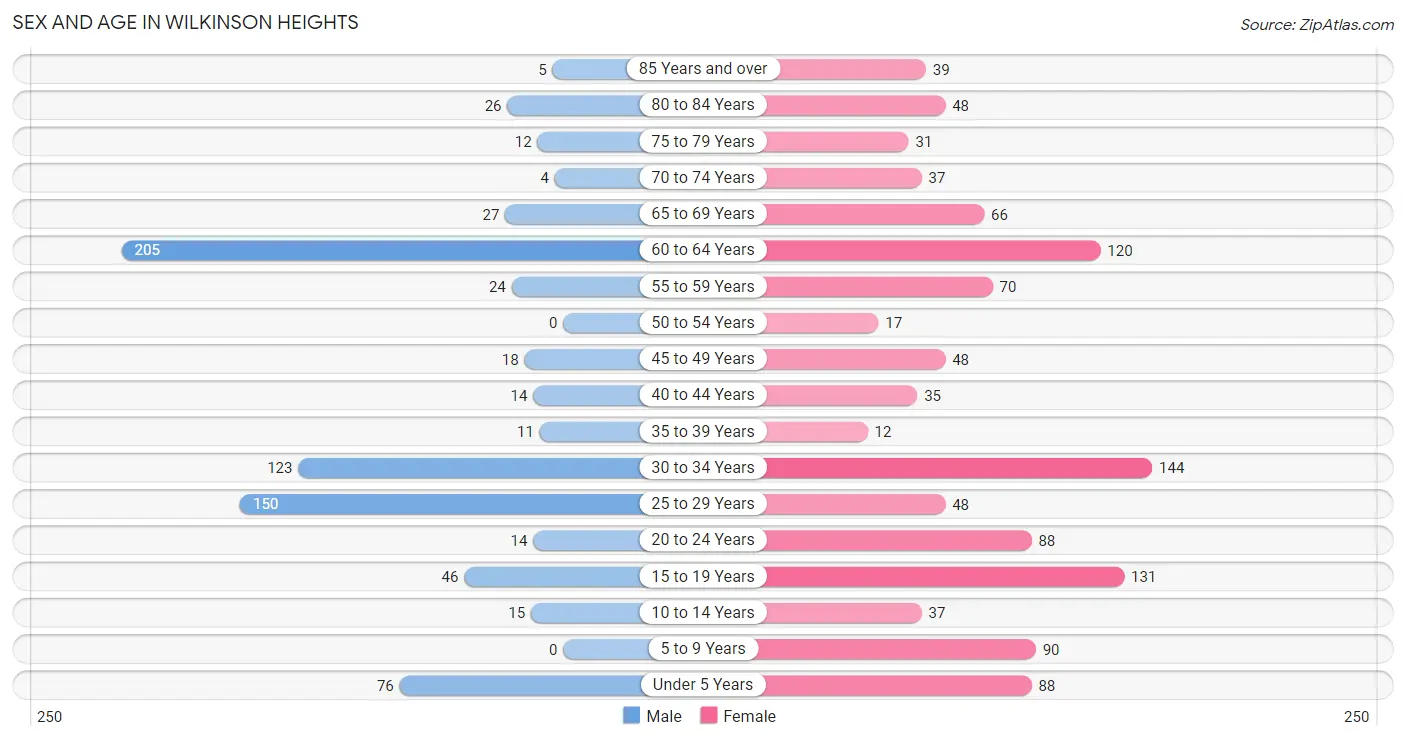
Sex and Age in Wilkinson Heights
Sex and Age in Wilkinson Heights
The most populous age groups in Wilkinson Heights are 60 to 64 Years (205 | 26.6%) for men and 30 to 34 Years (144 | 12.5%) for women.
| Age Bracket | Male | Female |
| Under 5 Years | 76 (9.9%) | 88 (7.7%) |
| 5 to 9 Years | 0 (0.0%) | 90 (7.8%) |
| 10 to 14 Years | 15 (1.9%) | 37 (3.2%) |
| 15 to 19 Years | 46 (6.0%) | 131 (11.4%) |
| 20 to 24 Years | 14 (1.8%) | 88 (7.7%) |
| 25 to 29 Years | 150 (19.5%) | 48 (4.2%) |
| 30 to 34 Years | 123 (16.0%) | 144 (12.5%) |
| 35 to 39 Years | 11 (1.4%) | 12 (1.0%) |
| 40 to 44 Years | 14 (1.8%) | 35 (3.0%) |
| 45 to 49 Years | 18 (2.3%) | 48 (4.2%) |
| 50 to 54 Years | 0 (0.0%) | 17 (1.5%) |
| 55 to 59 Years | 24 (3.1%) | 70 (6.1%) |
| 60 to 64 Years | 205 (26.6%) | 120 (10.4%) |
| 65 to 69 Years | 27 (3.5%) | 66 (5.7%) |
| 70 to 74 Years | 4 (0.5%) | 37 (3.2%) |
| 75 to 79 Years | 12 (1.6%) | 31 (2.7%) |
| 80 to 84 Years | 26 (3.4%) | 48 (4.2%) |
| 85 Years and over | 5 (0.6%) | 39 (3.4%) |
| Total | 770 (100.0%) | 1,149 (100.0%) |
Families and Households in Wilkinson Heights
Median Family Size in Wilkinson Heights
The median family size in Wilkinson Heights is 3.41 persons per family, with single male/father families (80 | 22.2%) accounting for the largest median family size of 3.99 persons per family. On the other hand, single female/mother families (200 | 55.6%) represent the smallest median family size with 3.25 persons per family.
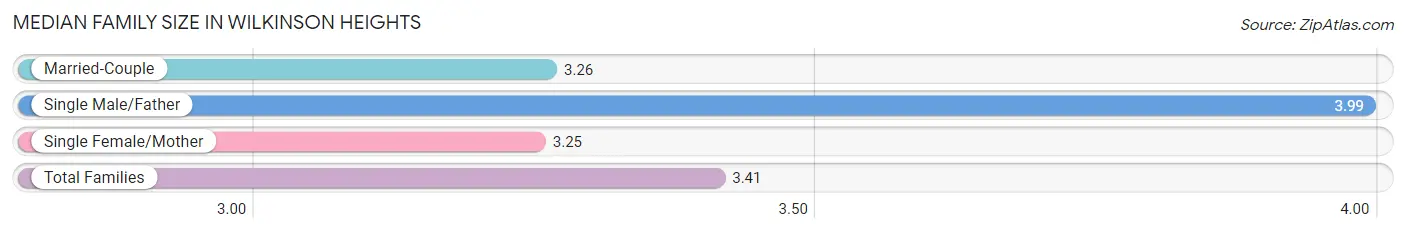
| Family Type | # Families | Family Size |
| Married-Couple | 80 (22.2%) | 3.26 |
| Single Male/Father | 80 (22.2%) | 3.99 |
| Single Female/Mother | 200 (55.6%) | 3.25 |
| Total Families | 360 (100.0%) | 3.41 |
Median Household Size in Wilkinson Heights
The median household size in Wilkinson Heights is 2.05 persons per household, with single male/father households (80 | 8.6%) accounting for the largest median household size of 4.84 persons per household. non-family households (576 | 61.5%) represent the smallest median household size with 1.08 persons per household.
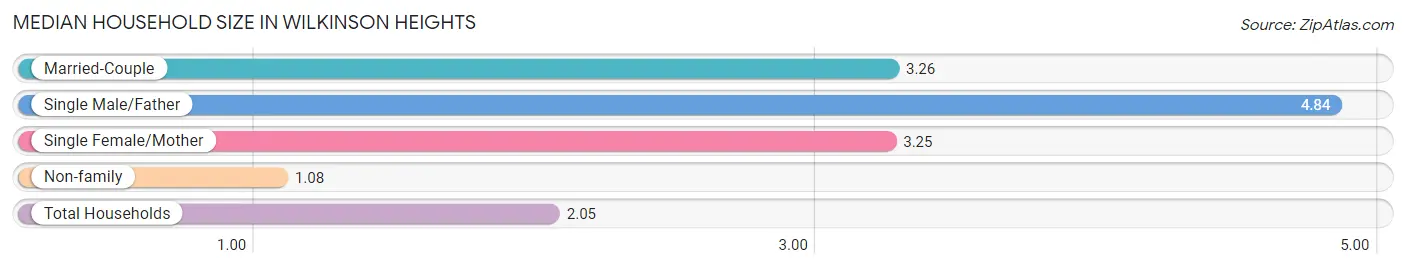
| Household Type | # Households | Household Size |
| Married-Couple | 80 (8.6%) | 3.26 |
| Single Male/Father | 80 (8.6%) | 4.84 |
| Single Female/Mother | 200 (21.4%) | 3.25 |
| Non-family | 576 (61.5%) | 1.08 |
| Total Households | 936 (100.0%) | 2.05 |
Household Size by Marriage Status in Wilkinson Heights
Out of a total of 936 households in Wilkinson Heights, 360 (38.5%) are family households, while 576 (61.5%) are nonfamily households. The most numerous type of family households are 3-person households, comprising 145, and the most common type of nonfamily households are 1-person households, comprising 538.
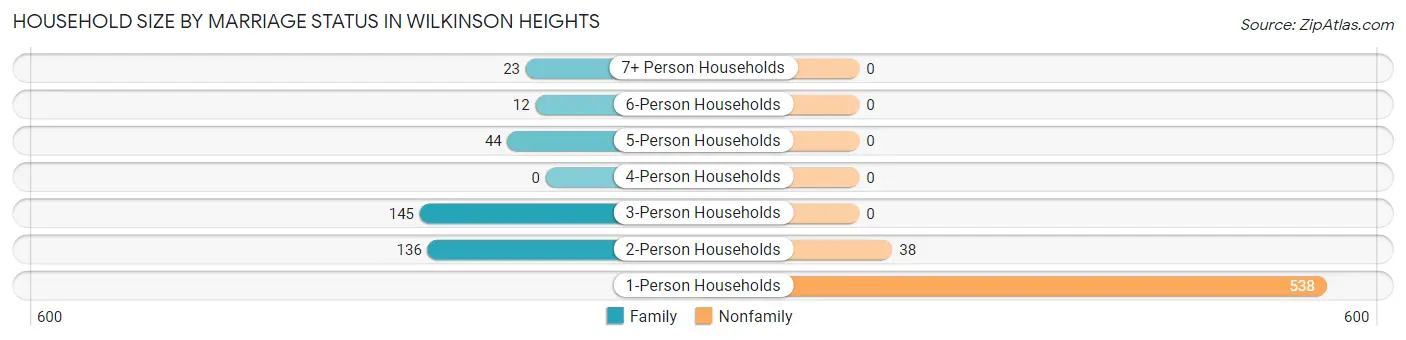
| Household Size | Family Households | Nonfamily Households |
| 1-Person Households | - | 538 (57.5%) |
| 2-Person Households | 136 (14.5%) | 38 (4.1%) |
| 3-Person Households | 145 (15.5%) | 0 (0.0%) |
| 4-Person Households | 0 (0.0%) | 0 (0.0%) |
| 5-Person Households | 44 (4.7%) | 0 (0.0%) |
| 6-Person Households | 12 (1.3%) | 0 (0.0%) |
| 7+ Person Households | 23 (2.5%) | 0 (0.0%) |
| Total | 360 (38.5%) | 576 (61.5%) |
Female Fertility in Wilkinson Heights
Fertility by Age in Wilkinson Heights
Average fertility rate in Wilkinson Heights is 82.0 births per 1,000 women. Women in the age bracket of 20 to 34 years have the highest fertility rate with 150.0 births per 1,000 women. Women in the age bracket of 20 to 34 years acount for 100.0% of all women with births.
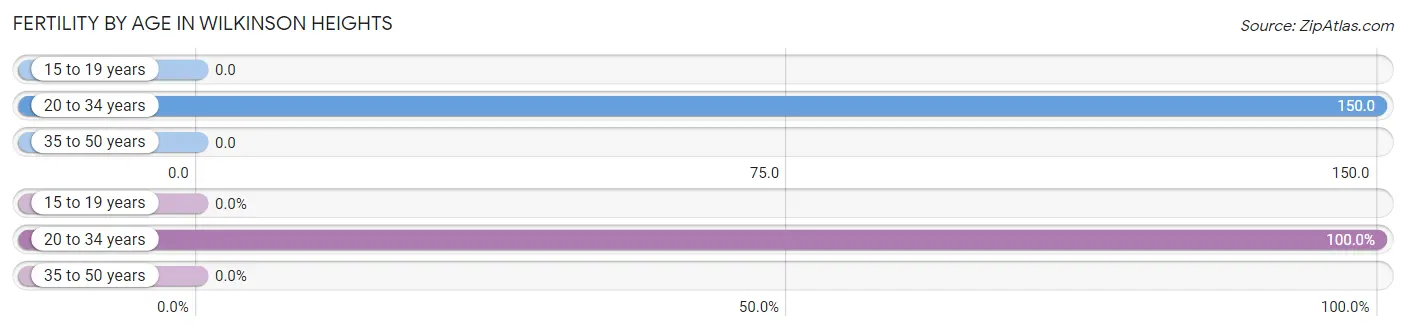
| Age Bracket | Women with Births | Births / 1,000 Women |
| 15 to 19 years | 0 (0.0%) | 0.0 |
| 20 to 34 years | 42 (100.0%) | 150.0 |
| 35 to 50 years | 0 (0.0%) | 0.0 |
| Total | 42 (100.0%) | 82.0 |
Fertility by Age by Marriage Status in Wilkinson Heights
42.9% of women with births (42) in Wilkinson Heights are married. The highest percentage of unmarried women with births falls into 20 to 34 years age bracket with 57.1% of them unmarried at the time of birth, while the lowest percentage of unmarried women with births belong to 20 to 34 years age bracket with 57.1% of them unmarried.
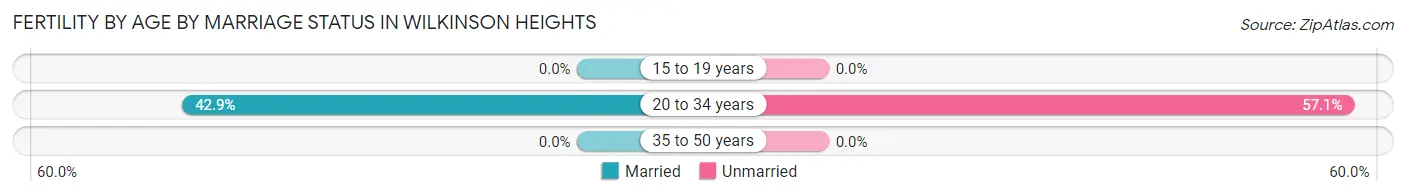
| Age Bracket | Married | Unmarried |
| 15 to 19 years | 0 (0.0%) | 0 (0.0%) |
| 20 to 34 years | 18 (42.9%) | 24 (57.1%) |
| 35 to 50 years | 0 (0.0%) | 0 (0.0%) |
| Total | 18 (42.9%) | 24 (57.1%) |
Fertility by Education in Wilkinson Heights
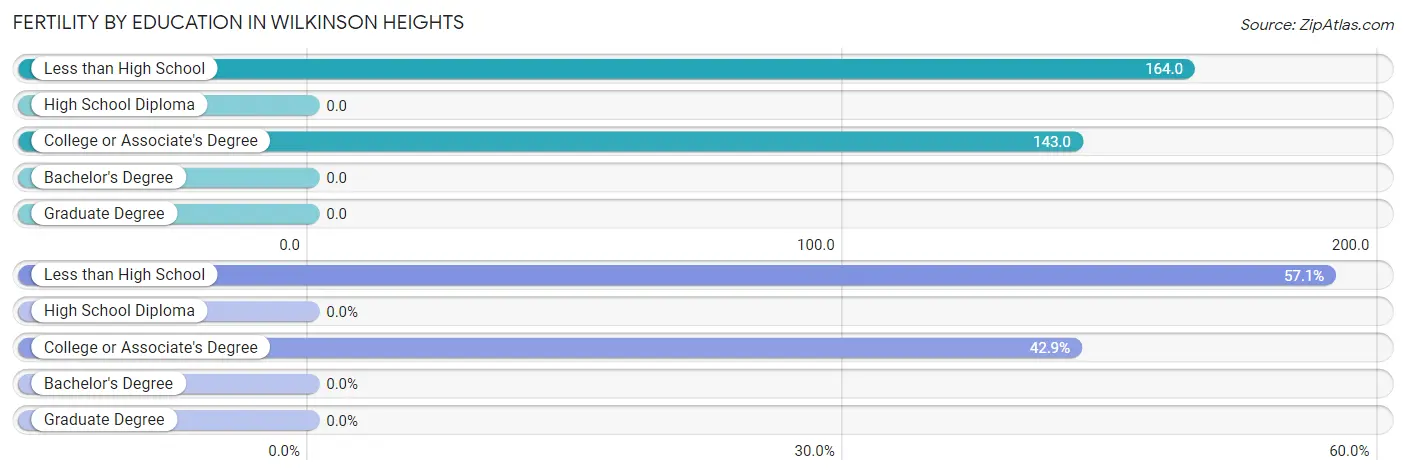
| Educational Attainment | Women with Births | Births / 1,000 Women |
| Less than High School | 24 (57.1%) | 164.0 |
| High School Diploma | 0 (0.0%) | 0.0 |
| College or Associate's Degree | 18 (42.9%) | 143.0 |
| Bachelor's Degree | 0 (0.0%) | 0.0 |
| Graduate Degree | 0 (0.0%) | 0.0 |
| Total | 42 (100.0%) | 82.0 |
Fertility by Education by Marriage Status in Wilkinson Heights
57.1% of women with births in Wilkinson Heights are unmarried. Women with the educational attainment of college or associate's degree are most likely to be married with 100.0% of them married at childbirth, while women with the educational attainment of less than high school are least likely to be married with 100.0% of them unmarried at childbirth.
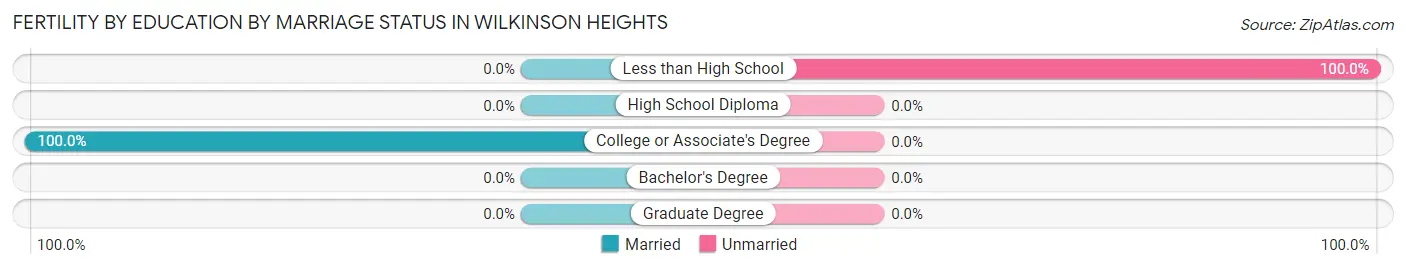
| Educational Attainment | Married | Unmarried |
| Less than High School | 0 (0.0%) | 24 (100.0%) |
| High School Diploma | 0 (0.0%) | 0 (0.0%) |
| College or Associate's Degree | 18 (100.0%) | 0 (0.0%) |
| Bachelor's Degree | 0 (0.0%) | 0 (0.0%) |
| Graduate Degree | 0 (0.0%) | 0 (0.0%) |
| Total | 18 (42.9%) | 24 (57.1%) |
Employment Characteristics in Wilkinson Heights
Employment by Class of Employer in Wilkinson Heights
Among the 678 employed individuals in Wilkinson Heights, private company employees (530 | 78.2%), self-employed (not incorporated) (38 | 5.6%), and local government employees (37 | 5.5%) make up the most common classes of employment.
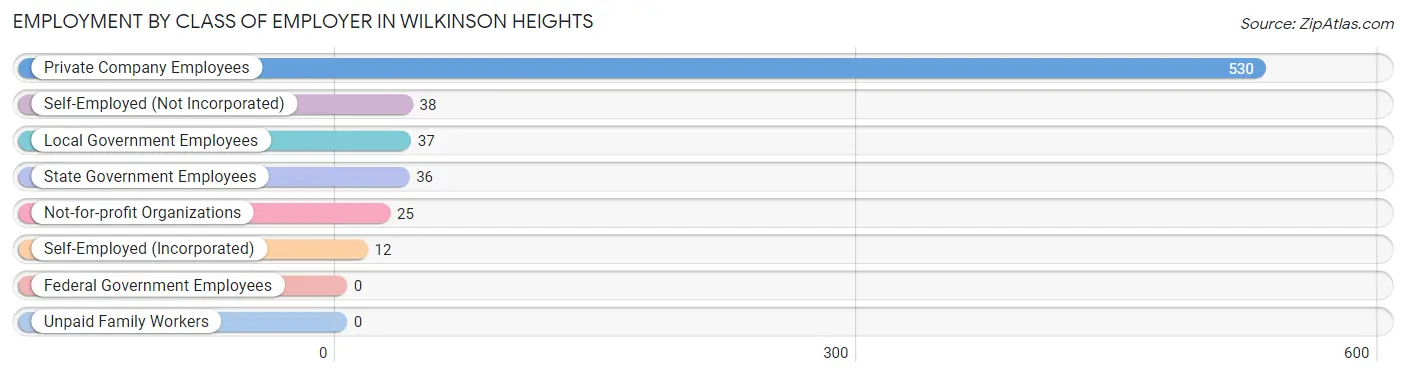
| Employer Class | # Employees | % Employees |
| Private Company Employees | 530 | 78.2% |
| Self-Employed (Incorporated) | 12 | 1.8% |
| Self-Employed (Not Incorporated) | 38 | 5.6% |
| Not-for-profit Organizations | 25 | 3.7% |
| Local Government Employees | 37 | 5.5% |
| State Government Employees | 36 | 5.3% |
| Federal Government Employees | 0 | 0.0% |
| Unpaid Family Workers | 0 | 0.0% |
| Total | 678 | 100.0% |
Employment Status by Age in Wilkinson Heights
According to the labor force statistics for Wilkinson Heights, out of the total population over 16 years of age (1,613), 48.1% or 776 individuals are in the labor force, with 12.6% or 98 of them unemployed. The age group with the highest labor force participation rate is 25 to 29 years, with 100.0% or 198 individuals in the labor force. Within the labor force, the 35 to 44 years age range has the highest percentage of unemployed individuals, with 56.5% or 26 of them being unemployed.
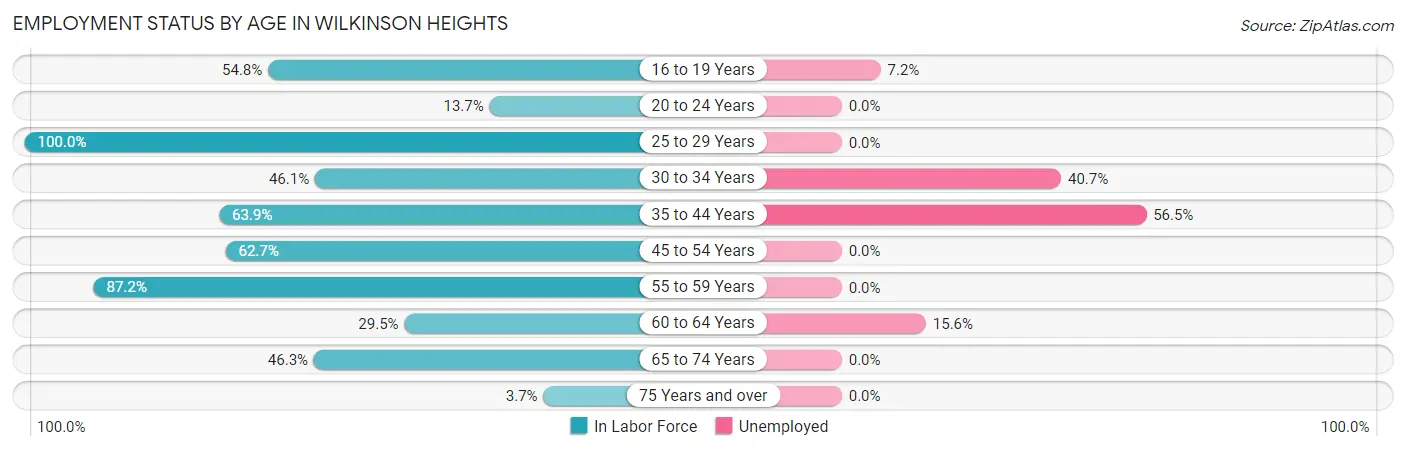
| Age Bracket | In Labor Force | Unemployed |
| 16 to 19 Years | 97 (54.8%) | 7 (7.2%) |
| 20 to 24 Years | 14 (13.7%) | 0 (0.0%) |
| 25 to 29 Years | 198 (100.0%) | 0 (0.0%) |
| 30 to 34 Years | 123 (46.1%) | 50 (40.7%) |
| 35 to 44 Years | 46 (63.9%) | 26 (56.5%) |
| 45 to 54 Years | 52 (62.7%) | 0 (0.0%) |
| 55 to 59 Years | 82 (87.2%) | 0 (0.0%) |
| 60 to 64 Years | 96 (29.5%) | 15 (15.6%) |
| 65 to 74 Years | 62 (46.3%) | 0 (0.0%) |
| 75 Years and over | 6 (3.7%) | 0 (0.0%) |
| Total | 776 (48.1%) | 98 (12.6%) |
Employment Status by Educational Attainment in Wilkinson Heights
According to labor force statistics for Wilkinson Heights, 57.5% of individuals (597) out of the total population between 25 and 64 years of age (1,039) are in the labor force, with 15.2% or 91 of them being unemployed. The group with the highest labor force participation rate are those with the educational attainment of bachelor's degree or higher, with 94.2% or 113 individuals in the labor force. Within the labor force, individuals with less than high school education have the highest percentage of unemployment, with 24.1% or 28 of them being unemployed.
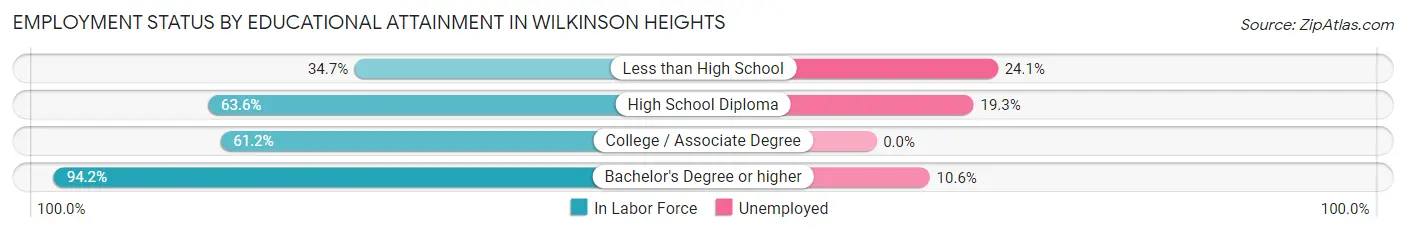
| Educational Attainment | In Labor Force | Unemployed |
| Less than High School | 116 (34.7%) | 80 (24.1%) |
| High School Diploma | 264 (63.6%) | 80 (19.3%) |
| College / Associate Degree | 104 (61.2%) | 0 (0.0%) |
| Bachelor's Degree or higher | 113 (94.2%) | 13 (10.6%) |
| Total | 597 (57.5%) | 158 (15.2%) |
Employment Occupations by Sex in Wilkinson Heights
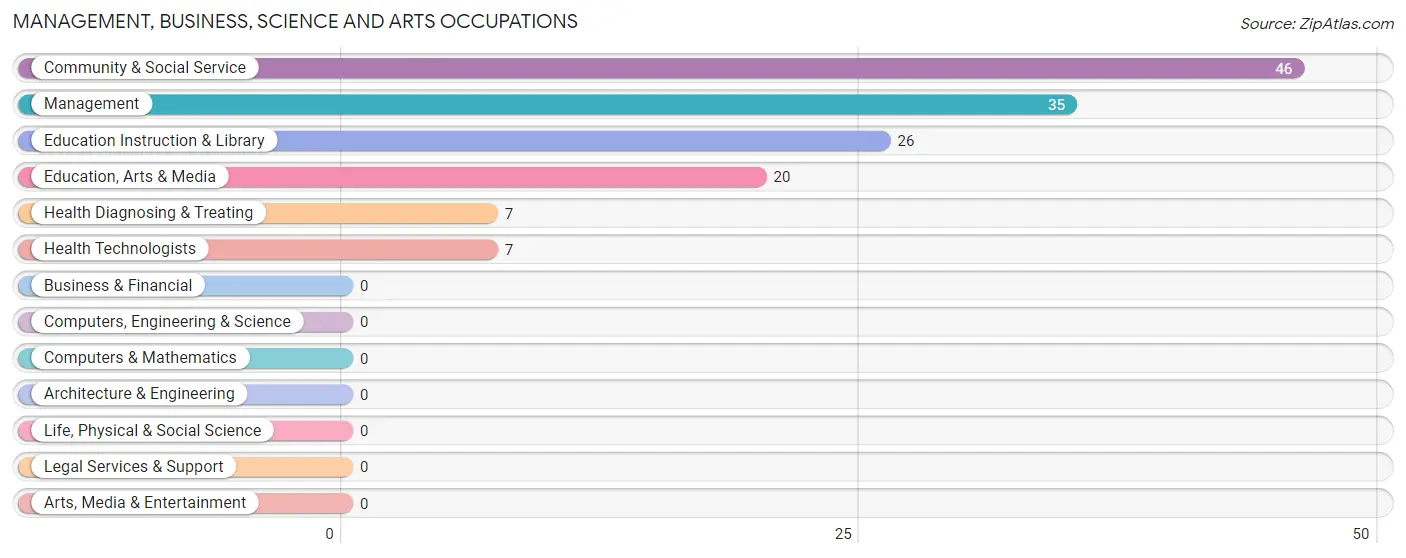
Management, Business, Science and Arts Occupations
The most common Management, Business, Science and Arts occupations in Wilkinson Heights are Community & Social Service (46 | 6.8%), Management (35 | 5.2%), Education Instruction & Library (26 | 3.8%), Education, Arts & Media (20 | 2.9%), and Health Diagnosing & Treating (7 | 1.0%).
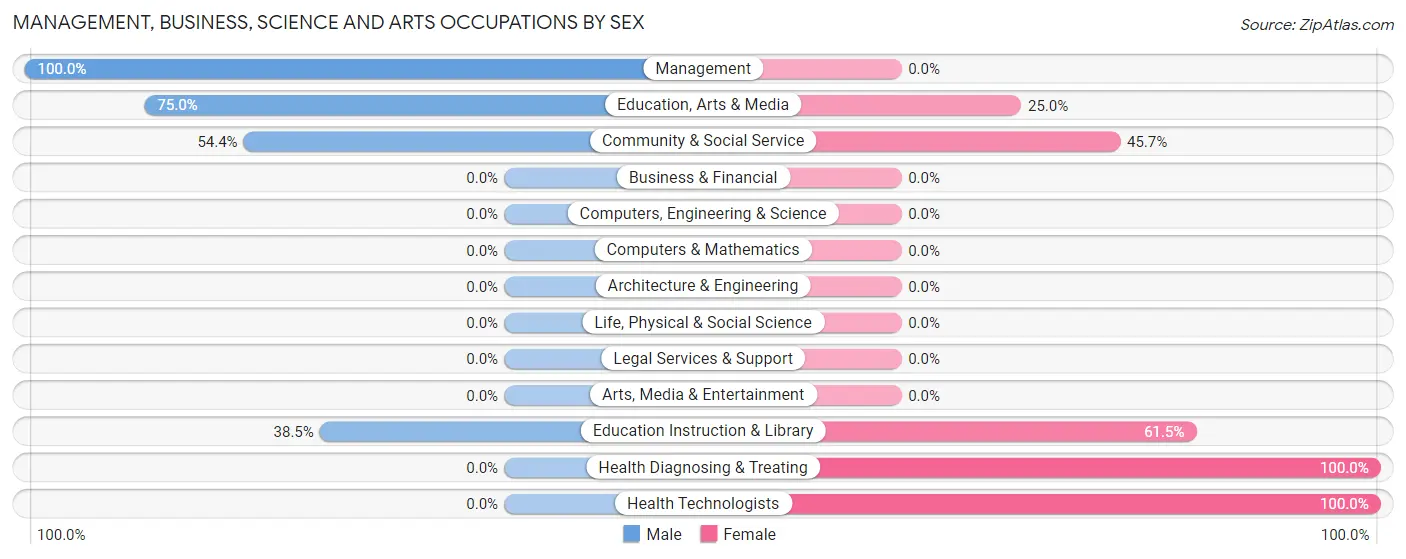
Management, Business, Science and Arts Occupations by Sex
Within the Management, Business, Science and Arts occupations in Wilkinson Heights, the most male-oriented occupations are Management (100.0%), Education, Arts & Media (75.0%), and Community & Social Service (54.3%), while the most female-oriented occupations are Health Diagnosing & Treating (100.0%), Health Technologists (100.0%), and Education Instruction & Library (61.5%).
| Occupation | Male | Female |
| Management | 35 (100.0%) | 0 (0.0%) |
| Business & Financial | 0 (0.0%) | 0 (0.0%) |
| Computers, Engineering & Science | 0 (0.0%) | 0 (0.0%) |
| Computers & Mathematics | 0 (0.0%) | 0 (0.0%) |
| Architecture & Engineering | 0 (0.0%) | 0 (0.0%) |
| Life, Physical & Social Science | 0 (0.0%) | 0 (0.0%) |
| Community & Social Service | 25 (54.3%) | 21 (45.7%) |
| Education, Arts & Media | 15 (75.0%) | 5 (25.0%) |
| Legal Services & Support | 0 (0.0%) | 0 (0.0%) |
| Education Instruction & Library | 10 (38.5%) | 16 (61.5%) |
| Arts, Media & Entertainment | 0 (0.0%) | 0 (0.0%) |
| Health Diagnosing & Treating | 0 (0.0%) | 7 (100.0%) |
| Health Technologists | 0 (0.0%) | 7 (100.0%) |
| Total (Category) | 60 (68.2%) | 28 (31.8%) |
| Total (Overall) | 340 (50.1%) | 338 (49.8%) |
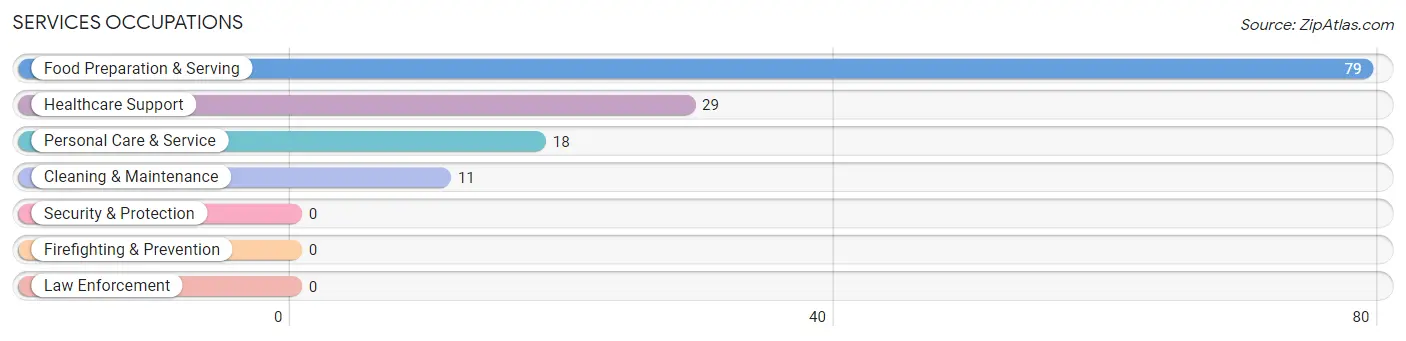
Services Occupations
The most common Services occupations in Wilkinson Heights are Food Preparation & Serving (79 | 11.7%), Healthcare Support (29 | 4.3%), Personal Care & Service (18 | 2.6%), and Cleaning & Maintenance (11 | 1.6%).
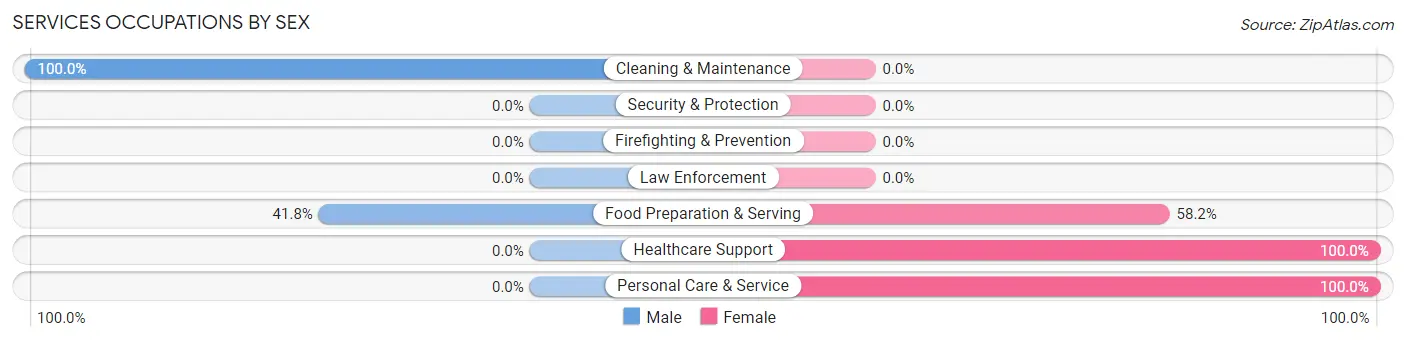
Services Occupations by Sex
Within the Services occupations in Wilkinson Heights, the most male-oriented occupations are Cleaning & Maintenance (100.0%), and Food Preparation & Serving (41.8%), while the most female-oriented occupations are Healthcare Support (100.0%), Personal Care & Service (100.0%), and Food Preparation & Serving (58.2%).
| Occupation | Male | Female |
| Healthcare Support | 0 (0.0%) | 29 (100.0%) |
| Security & Protection | 0 (0.0%) | 0 (0.0%) |
| Firefighting & Prevention | 0 (0.0%) | 0 (0.0%) |
| Law Enforcement | 0 (0.0%) | 0 (0.0%) |
| Food Preparation & Serving | 33 (41.8%) | 46 (58.2%) |
| Cleaning & Maintenance | 11 (100.0%) | 0 (0.0%) |
| Personal Care & Service | 0 (0.0%) | 18 (100.0%) |
| Total (Category) | 44 (32.1%) | 93 (67.9%) |
| Total (Overall) | 340 (50.1%) | 338 (49.8%) |
Sales and Office Occupations
The most common Sales and Office occupations in Wilkinson Heights are Sales & Related (95 | 14.0%), and Office & Administration (66 | 9.7%).
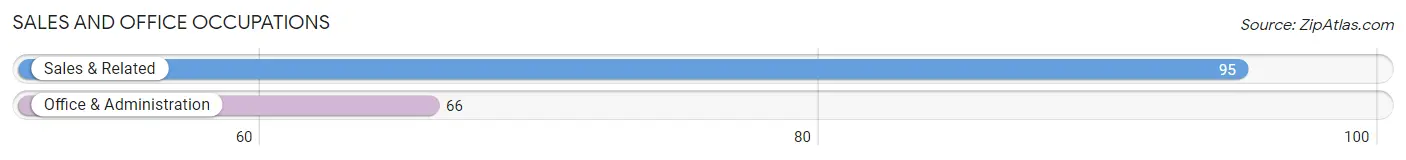
Sales and Office Occupations by Sex
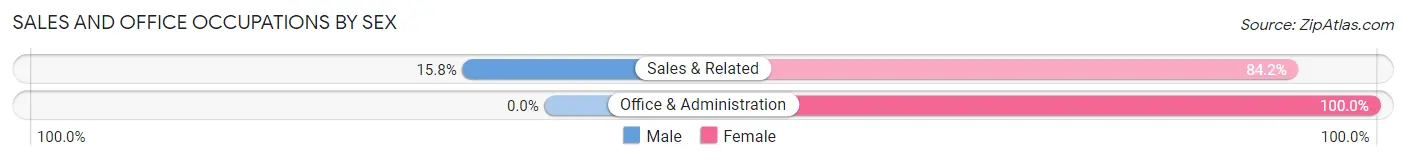
| Occupation | Male | Female |
| Sales & Related | 15 (15.8%) | 80 (84.2%) |
| Office & Administration | 0 (0.0%) | 66 (100.0%) |
| Total (Category) | 15 (9.3%) | 146 (90.7%) |
| Total (Overall) | 340 (50.1%) | 338 (49.8%) |
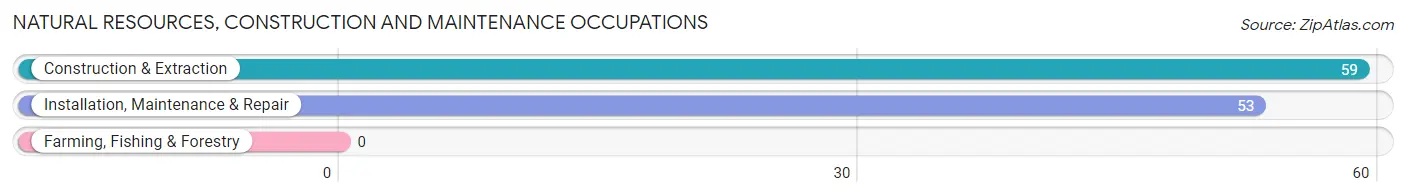
Natural Resources, Construction and Maintenance Occupations
The most common Natural Resources, Construction and Maintenance occupations in Wilkinson Heights are Construction & Extraction (59 | 8.7%), and Installation, Maintenance & Repair (53 | 7.8%).
Natural Resources, Construction and Maintenance Occupations by Sex
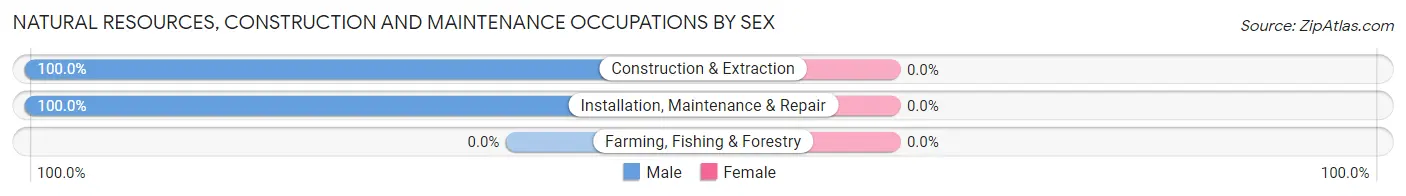
| Occupation | Male | Female |
| Farming, Fishing & Forestry | 0 (0.0%) | 0 (0.0%) |
| Construction & Extraction | 59 (100.0%) | 0 (0.0%) |
| Installation, Maintenance & Repair | 53 (100.0%) | 0 (0.0%) |
| Total (Category) | 112 (100.0%) | 0 (0.0%) |
| Total (Overall) | 340 (50.1%) | 338 (49.8%) |
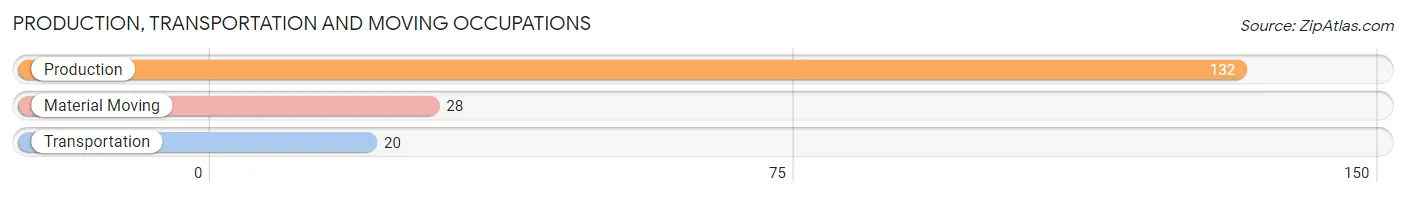
Production, Transportation and Moving Occupations
The most common Production, Transportation and Moving occupations in Wilkinson Heights are Production (132 | 19.5%), Material Moving (28 | 4.1%), and Transportation (20 | 2.9%).
Production, Transportation and Moving Occupations by Sex
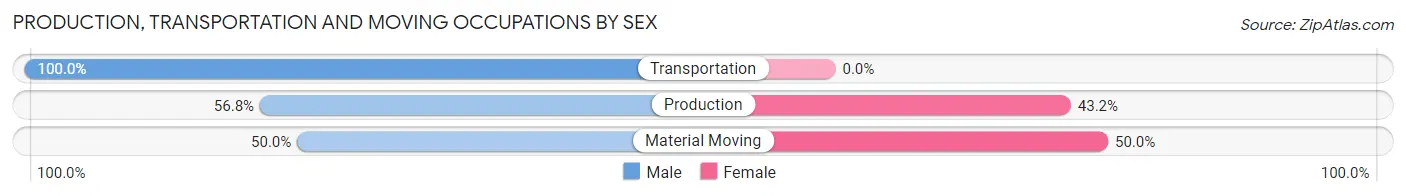
| Occupation | Male | Female |
| Production | 75 (56.8%) | 57 (43.2%) |
| Transportation | 20 (100.0%) | 0 (0.0%) |
| Material Moving | 14 (50.0%) | 14 (50.0%) |
| Total (Category) | 109 (60.6%) | 71 (39.4%) |
| Total (Overall) | 340 (50.1%) | 338 (49.8%) |
Employment Industries by Sex in Wilkinson Heights
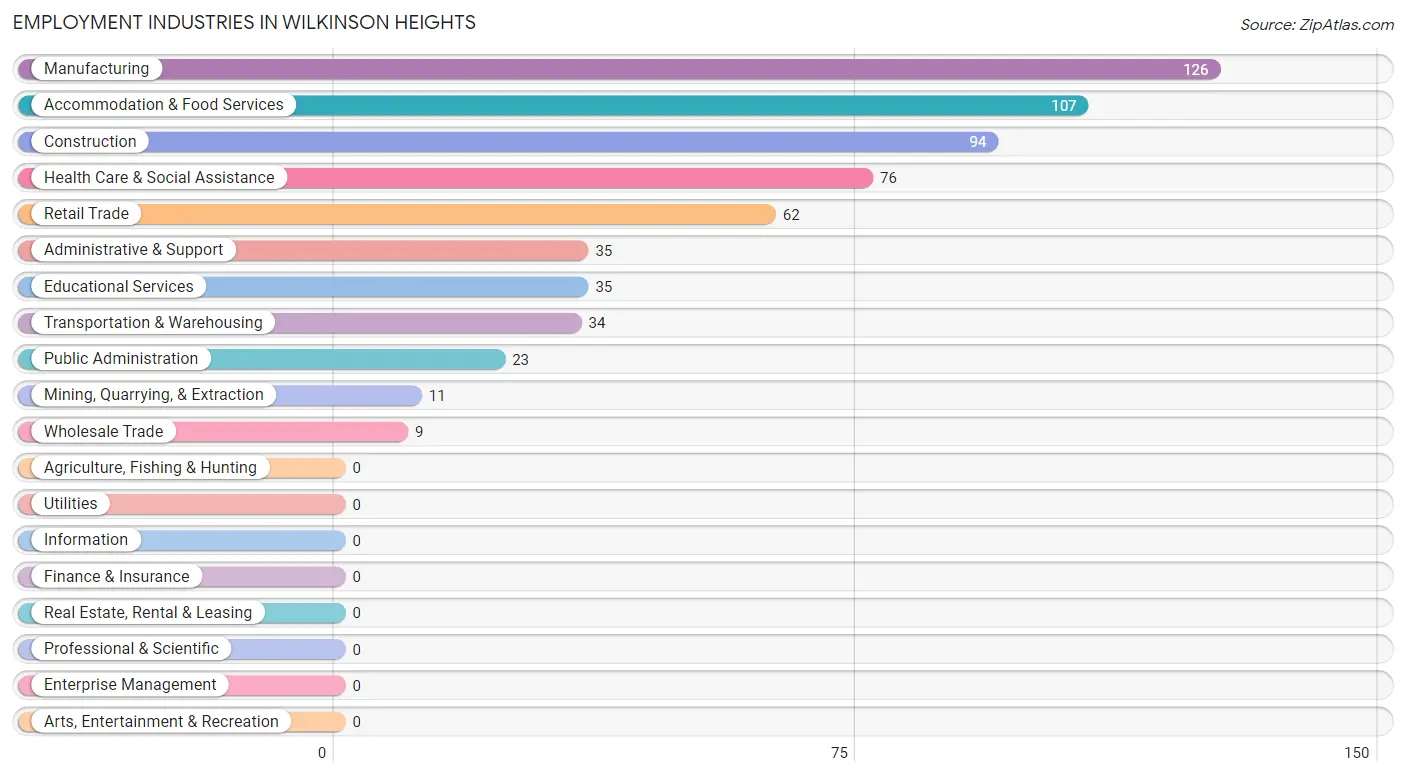
Employment Industries in Wilkinson Heights
The major employment industries in Wilkinson Heights include Manufacturing (126 | 18.6%), Accommodation & Food Services (107 | 15.8%), Construction (94 | 13.9%), Health Care & Social Assistance (76 | 11.2%), and Retail Trade (62 | 9.1%).
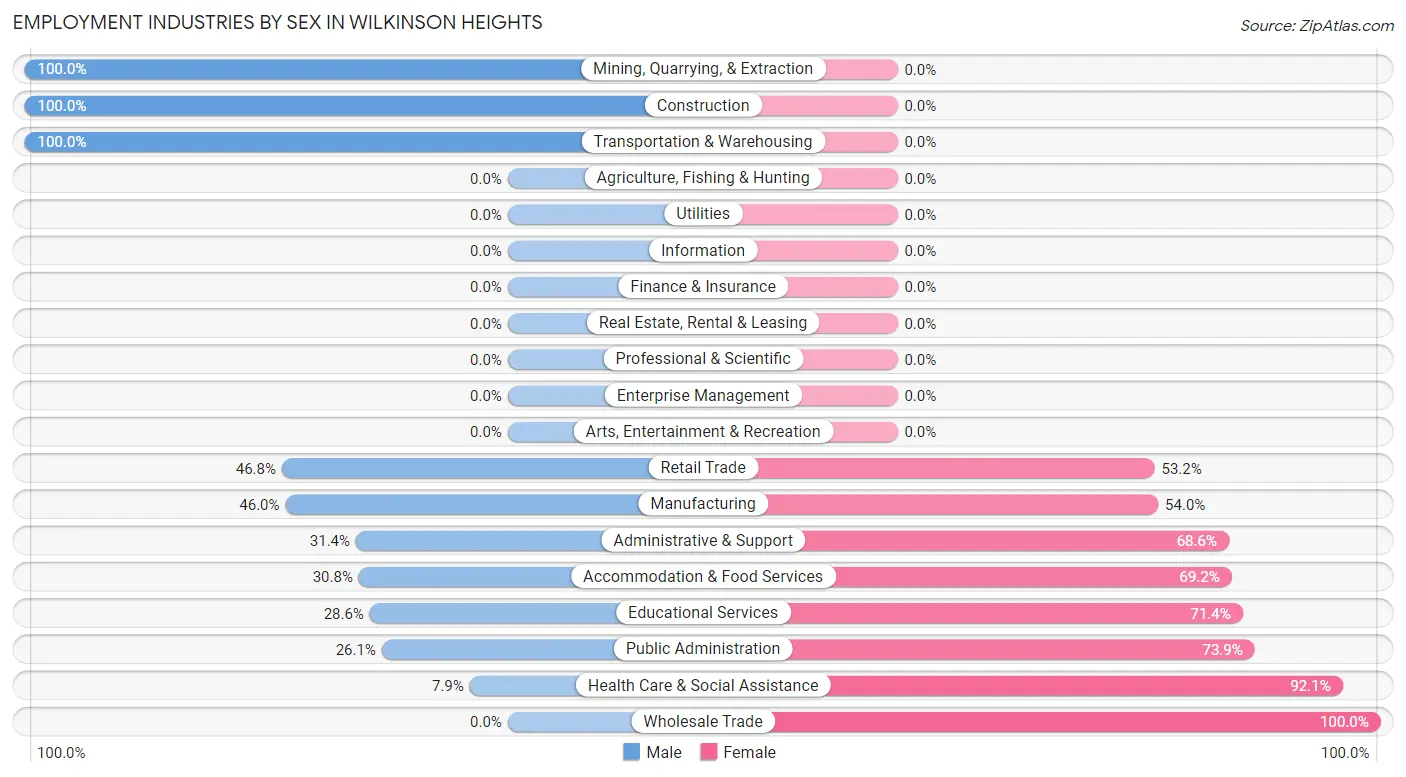
Employment Industries by Sex in Wilkinson Heights
The Wilkinson Heights industries that see more men than women are Mining, Quarrying, & Extraction (100.0%), Construction (100.0%), and Transportation & Warehousing (100.0%), whereas the industries that tend to have a higher number of women are Wholesale Trade (100.0%), Health Care & Social Assistance (92.1%), and Public Administration (73.9%).
| Industry | Male | Female |
| Agriculture, Fishing & Hunting | 0 (0.0%) | 0 (0.0%) |
| Mining, Quarrying, & Extraction | 11 (100.0%) | 0 (0.0%) |
| Construction | 94 (100.0%) | 0 (0.0%) |
| Manufacturing | 58 (46.0%) | 68 (54.0%) |
| Wholesale Trade | 0 (0.0%) | 9 (100.0%) |
| Retail Trade | 29 (46.8%) | 33 (53.2%) |
| Transportation & Warehousing | 34 (100.0%) | 0 (0.0%) |
| Utilities | 0 (0.0%) | 0 (0.0%) |
| Information | 0 (0.0%) | 0 (0.0%) |
| Finance & Insurance | 0 (0.0%) | 0 (0.0%) |
| Real Estate, Rental & Leasing | 0 (0.0%) | 0 (0.0%) |
| Professional & Scientific | 0 (0.0%) | 0 (0.0%) |
| Enterprise Management | 0 (0.0%) | 0 (0.0%) |
| Administrative & Support | 11 (31.4%) | 24 (68.6%) |
| Educational Services | 10 (28.6%) | 25 (71.4%) |
| Health Care & Social Assistance | 6 (7.9%) | 70 (92.1%) |
| Arts, Entertainment & Recreation | 0 (0.0%) | 0 (0.0%) |
| Accommodation & Food Services | 33 (30.8%) | 74 (69.2%) |
| Public Administration | 6 (26.1%) | 17 (73.9%) |
| Total | 340 (50.1%) | 338 (49.8%) |
Education in Wilkinson Heights
School Enrollment in Wilkinson Heights
The most common levels of schooling among the 354 students in Wilkinson Heights are high school (142 | 40.1%), elementary school (116 | 32.8%), and college / undergraduate (39 | 11.0%).
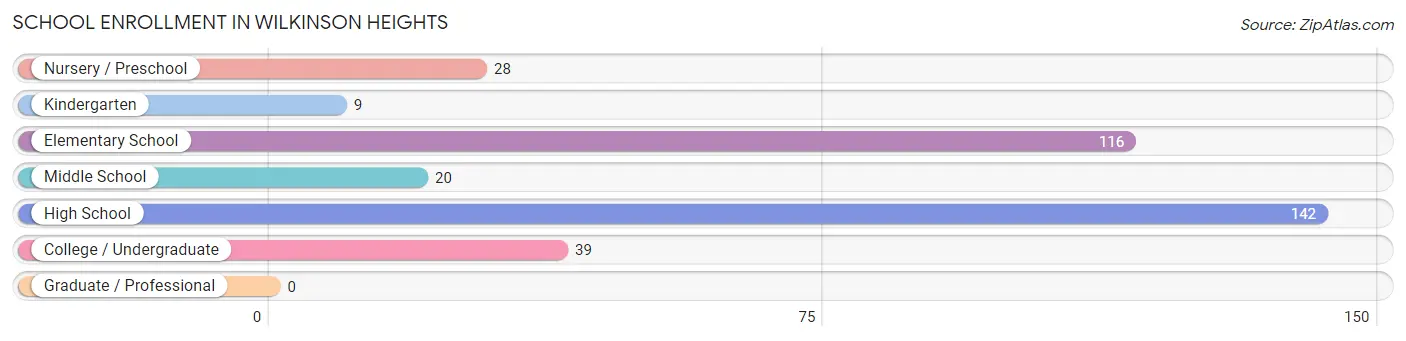
| School Level | # Students | % Students |
| Nursery / Preschool | 28 | 7.9% |
| Kindergarten | 9 | 2.5% |
| Elementary School | 116 | 32.8% |
| Middle School | 20 | 5.7% |
| High School | 142 | 40.1% |
| College / Undergraduate | 39 | 11.0% |
| Graduate / Professional | 0 | 0.0% |
| Total | 354 | 100.0% |
School Enrollment by Age by Funding Source in Wilkinson Heights
Out of a total of 354 students who are enrolled in schools in Wilkinson Heights, 80 (22.6%) attend a private institution, while the remaining 274 (77.4%) are enrolled in public schools. The age group of 3 to 4 year olds has the highest likelihood of being enrolled in private schools, with 28 (75.7% in the age bracket) enrolled. Conversely, the age group of 15 to 17 year olds has the lowest likelihood of being enrolled in a private school, with 123 (100.0% in the age bracket) attending a public institution.
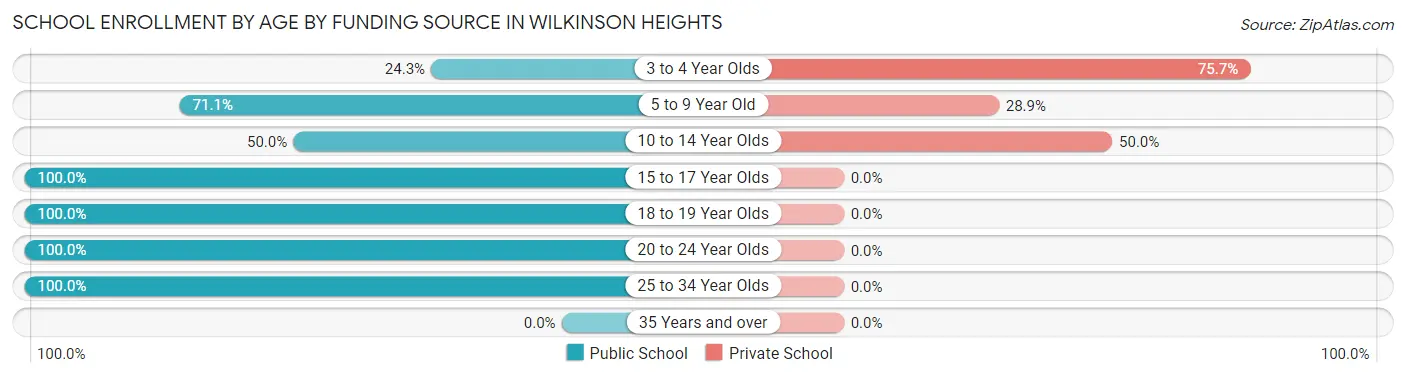
| Age Bracket | Public School | Private School |
| 3 to 4 Year Olds | 9 (24.3%) | 28 (75.7%) |
| 5 to 9 Year Old | 64 (71.1%) | 26 (28.9%) |
| 10 to 14 Year Olds | 26 (50.0%) | 26 (50.0%) |
| 15 to 17 Year Olds | 123 (100.0%) | 0 (0.0%) |
| 18 to 19 Year Olds | 13 (100.0%) | 0 (0.0%) |
| 20 to 24 Year Olds | 33 (100.0%) | 0 (0.0%) |
| 25 to 34 Year Olds | 6 (100.0%) | 0 (0.0%) |
| 35 Years and over | 0 (0.0%) | 0 (0.0%) |
| Total | 274 (77.4%) | 80 (22.6%) |
Educational Attainment by Field of Study in Wilkinson Heights
Business (43 | 29.7%), arts & humanities (40 | 27.6%), psychology (24 | 16.6%), literature & languages (11 | 7.6%), and education (10 | 6.9%) are the most common fields of study among 145 individuals in Wilkinson Heights who have obtained a bachelor's degree or higher.
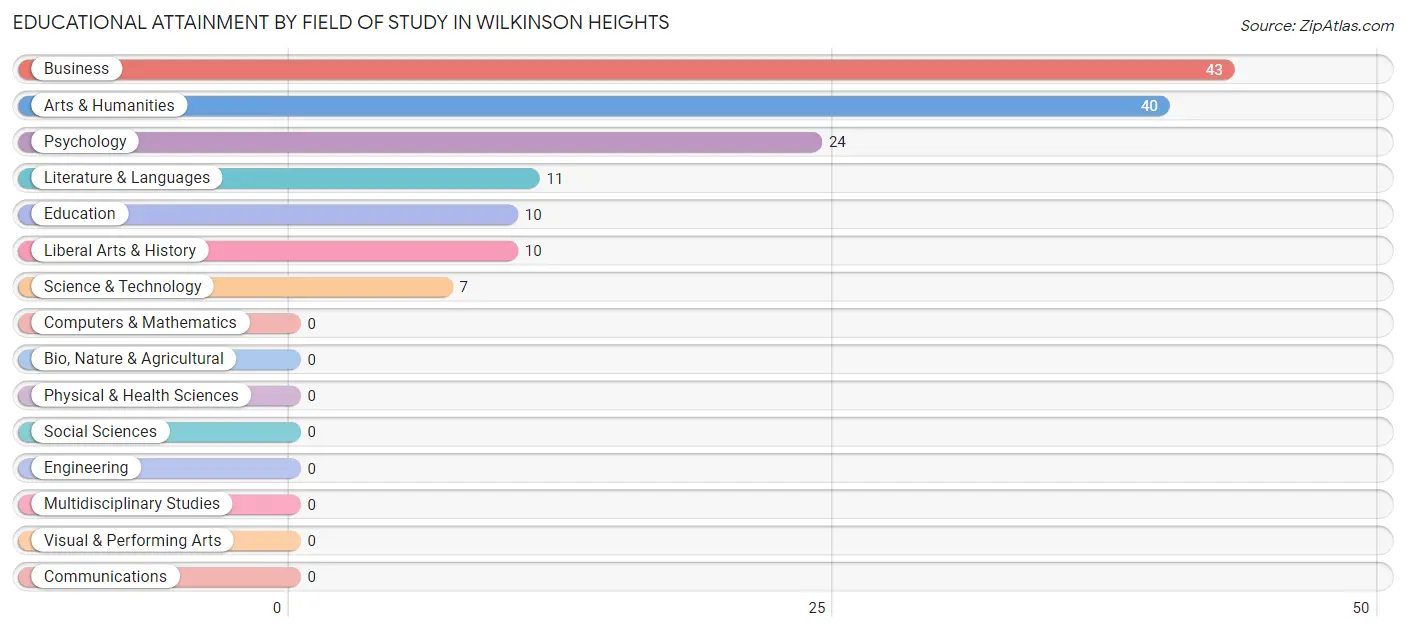
| Field of Study | # Graduates | % Graduates |
| Computers & Mathematics | 0 | 0.0% |
| Bio, Nature & Agricultural | 0 | 0.0% |
| Physical & Health Sciences | 0 | 0.0% |
| Psychology | 24 | 16.6% |
| Social Sciences | 0 | 0.0% |
| Engineering | 0 | 0.0% |
| Multidisciplinary Studies | 0 | 0.0% |
| Science & Technology | 7 | 4.8% |
| Business | 43 | 29.7% |
| Education | 10 | 6.9% |
| Literature & Languages | 11 | 7.6% |
| Liberal Arts & History | 10 | 6.9% |
| Visual & Performing Arts | 0 | 0.0% |
| Communications | 0 | 0.0% |
| Arts & Humanities | 40 | 27.6% |
| Total | 145 | 100.0% |
Transportation & Commute in Wilkinson Heights
Vehicle Availability by Sex in Wilkinson Heights
The most prevalent vehicle ownership categories in Wilkinson Heights are males with 2 vehicles (123, accounting for 36.2%) and females with 2 vehicles (152, making up 36.4%).
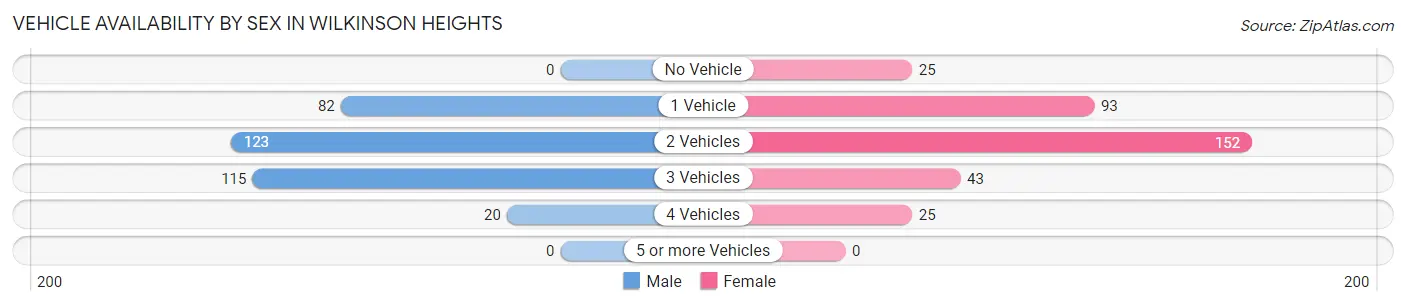
| Vehicles Available | Male | Female |
| No Vehicle | 0 (0.0%) | 25 (7.4%) |
| 1 Vehicle | 82 (24.1%) | 93 (27.5%) |
| 2 Vehicles | 123 (36.2%) | 152 (45.0%) |
| 3 Vehicles | 115 (33.8%) | 43 (12.7%) |
| 4 Vehicles | 20 (5.9%) | 25 (7.4%) |
| 5 or more Vehicles | 0 (0.0%) | 0 (0.0%) |
| Total | 340 (100.0%) | 338 (100.0%) |
Commute Time in Wilkinson Heights
The most frequently occuring commute durations in Wilkinson Heights are 10 to 14 minutes (206 commuters, 30.4%), 15 to 19 minutes (197 commuters, 29.1%), and 60 to 89 minutes (77 commuters, 11.4%).
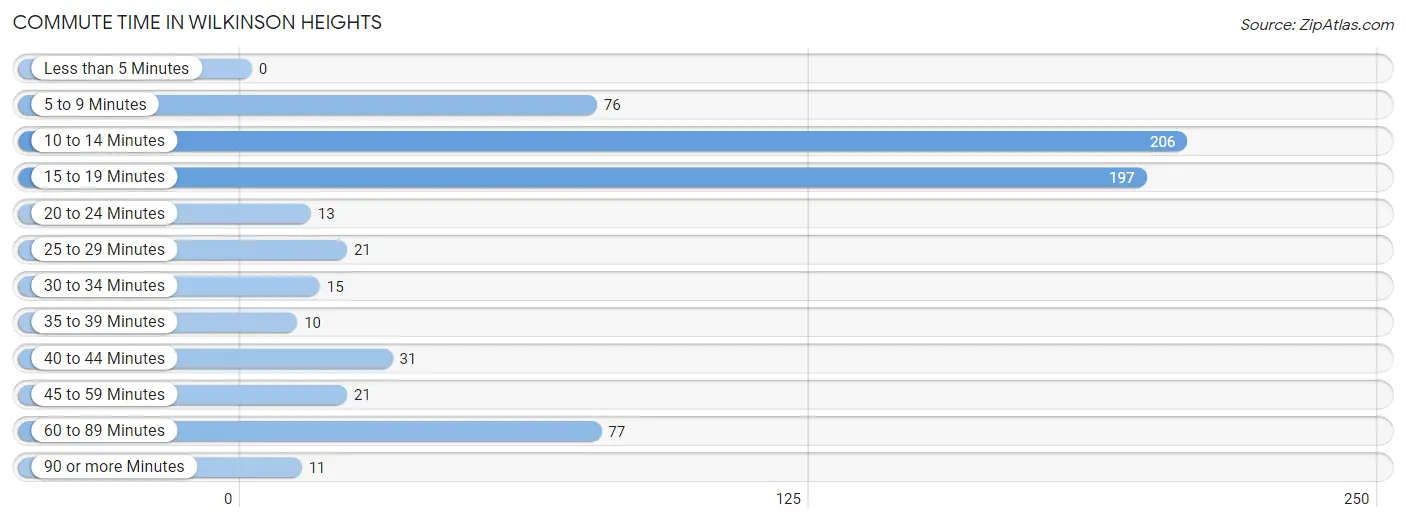
| Commute Time | # Commuters | % Commuters |
| Less than 5 Minutes | 0 | 0.0% |
| 5 to 9 Minutes | 76 | 11.2% |
| 10 to 14 Minutes | 206 | 30.4% |
| 15 to 19 Minutes | 197 | 29.1% |
| 20 to 24 Minutes | 13 | 1.9% |
| 25 to 29 Minutes | 21 | 3.1% |
| 30 to 34 Minutes | 15 | 2.2% |
| 35 to 39 Minutes | 10 | 1.5% |
| 40 to 44 Minutes | 31 | 4.6% |
| 45 to 59 Minutes | 21 | 3.1% |
| 60 to 89 Minutes | 77 | 11.4% |
| 90 or more Minutes | 11 | 1.6% |
Commute Time by Sex in Wilkinson Heights
The most common commute times in Wilkinson Heights are 15 to 19 minutes (96 commuters, 28.2%) for males and 10 to 14 minutes (137 commuters, 40.5%) for females.
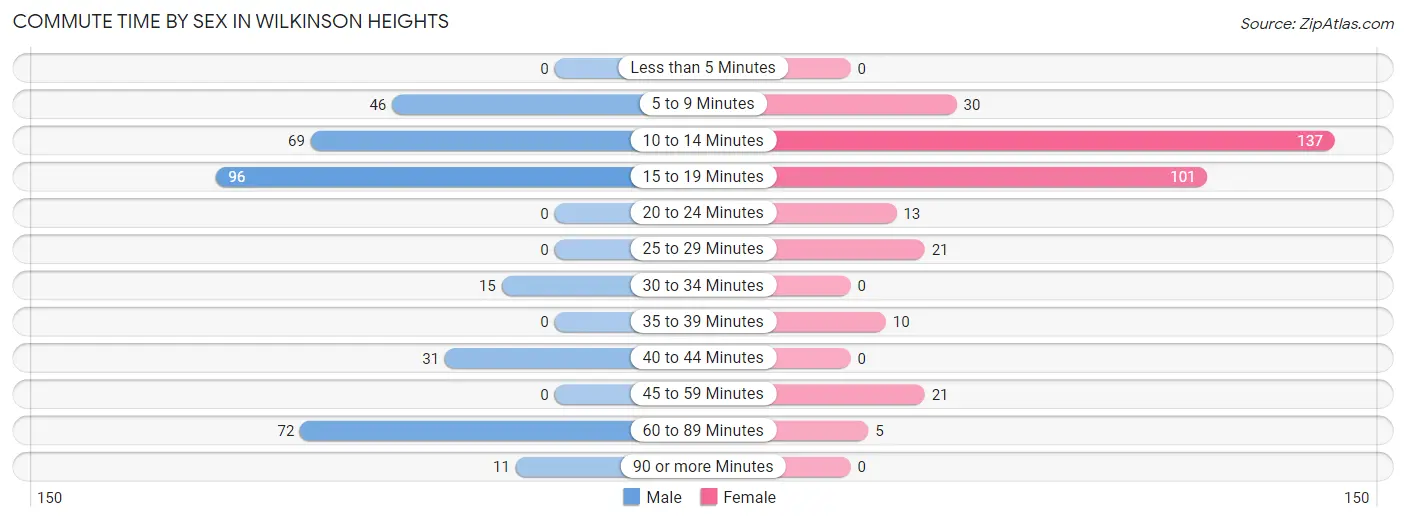
| Commute Time | Male | Female |
| Less than 5 Minutes | 0 (0.0%) | 0 (0.0%) |
| 5 to 9 Minutes | 46 (13.5%) | 30 (8.9%) |
| 10 to 14 Minutes | 69 (20.3%) | 137 (40.5%) |
| 15 to 19 Minutes | 96 (28.2%) | 101 (29.9%) |
| 20 to 24 Minutes | 0 (0.0%) | 13 (3.8%) |
| 25 to 29 Minutes | 0 (0.0%) | 21 (6.2%) |
| 30 to 34 Minutes | 15 (4.4%) | 0 (0.0%) |
| 35 to 39 Minutes | 0 (0.0%) | 10 (3.0%) |
| 40 to 44 Minutes | 31 (9.1%) | 0 (0.0%) |
| 45 to 59 Minutes | 0 (0.0%) | 21 (6.2%) |
| 60 to 89 Minutes | 72 (21.2%) | 5 (1.5%) |
| 90 or more Minutes | 11 (3.2%) | 0 (0.0%) |
Time of Departure to Work by Sex in Wilkinson Heights
The most frequent times of departure to work in Wilkinson Heights are 9:00 AM to 9:59 AM (80, 23.5%) for males and 6:00 AM to 6:29 AM (59, 17.5%) for females.
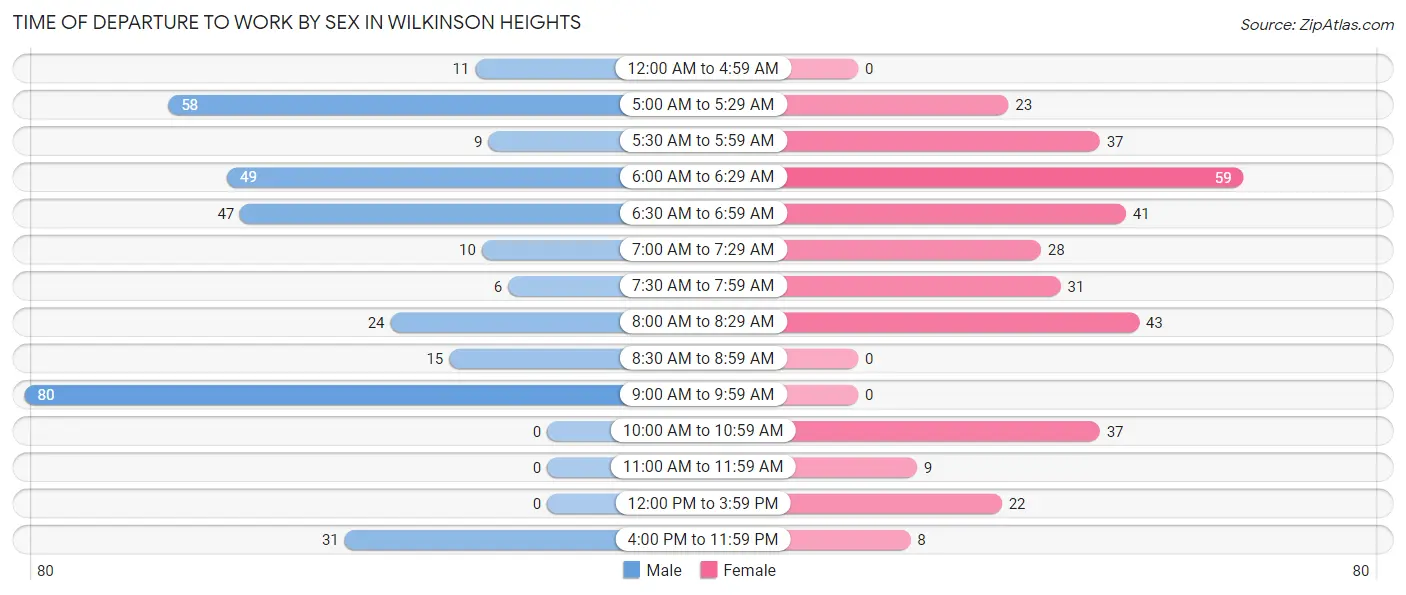
| Time of Departure | Male | Female |
| 12:00 AM to 4:59 AM | 11 (3.2%) | 0 (0.0%) |
| 5:00 AM to 5:29 AM | 58 (17.1%) | 23 (6.8%) |
| 5:30 AM to 5:59 AM | 9 (2.6%) | 37 (11.0%) |
| 6:00 AM to 6:29 AM | 49 (14.4%) | 59 (17.5%) |
| 6:30 AM to 6:59 AM | 47 (13.8%) | 41 (12.1%) |
| 7:00 AM to 7:29 AM | 10 (2.9%) | 28 (8.3%) |
| 7:30 AM to 7:59 AM | 6 (1.8%) | 31 (9.2%) |
| 8:00 AM to 8:29 AM | 24 (7.1%) | 43 (12.7%) |
| 8:30 AM to 8:59 AM | 15 (4.4%) | 0 (0.0%) |
| 9:00 AM to 9:59 AM | 80 (23.5%) | 0 (0.0%) |
| 10:00 AM to 10:59 AM | 0 (0.0%) | 37 (11.0%) |
| 11:00 AM to 11:59 AM | 0 (0.0%) | 9 (2.7%) |
| 12:00 PM to 3:59 PM | 0 (0.0%) | 22 (6.5%) |
| 4:00 PM to 11:59 PM | 31 (9.1%) | 8 (2.4%) |
| Total | 340 (100.0%) | 338 (100.0%) |
Housing Occupancy in Wilkinson Heights
Occupancy by Ownership in Wilkinson Heights
Of the total 936 dwellings in Wilkinson Heights, owner-occupied units account for 299 (31.9%), while renter-occupied units make up 637 (68.1%).
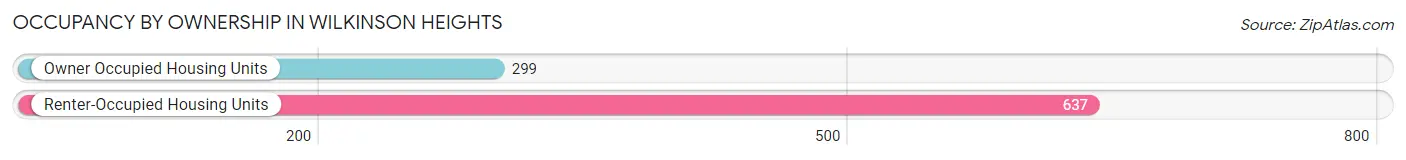
| Occupancy | # Housing Units | % Housing Units |
| Owner Occupied Housing Units | 299 | 31.9% |
| Renter-Occupied Housing Units | 637 | 68.1% |
| Total Occupied Housing Units | 936 | 100.0% |
Occupancy by Household Size in Wilkinson Heights
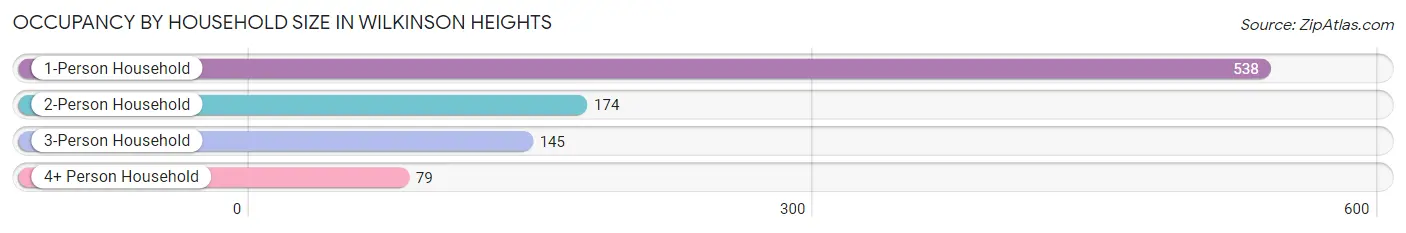
| Household Size | # Housing Units | % Housing Units |
| 1-Person Household | 538 | 57.5% |
| 2-Person Household | 174 | 18.6% |
| 3-Person Household | 145 | 15.5% |
| 4+ Person Household | 79 | 8.4% |
| Total Housing Units | 936 | 100.0% |
Occupancy by Ownership by Household Size in Wilkinson Heights
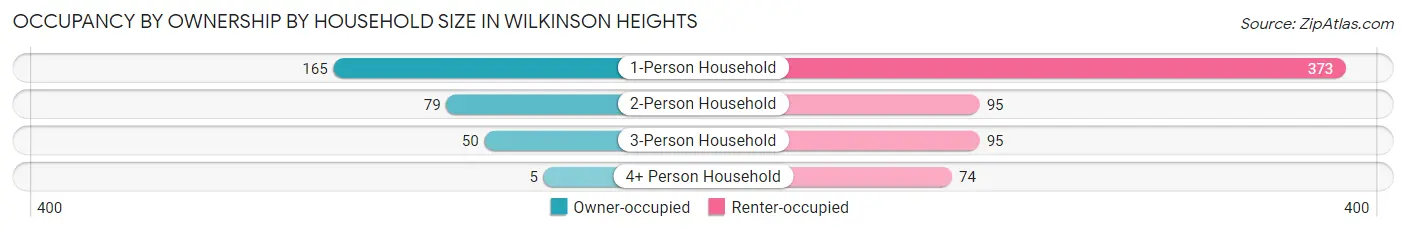
| Household Size | Owner-occupied | Renter-occupied |
| 1-Person Household | 165 (30.7%) | 373 (69.3%) |
| 2-Person Household | 79 (45.4%) | 95 (54.6%) |
| 3-Person Household | 50 (34.5%) | 95 (65.5%) |
| 4+ Person Household | 5 (6.3%) | 74 (93.7%) |
| Total Housing Units | 299 (31.9%) | 637 (68.1%) |
Occupancy by Educational Attainment in Wilkinson Heights
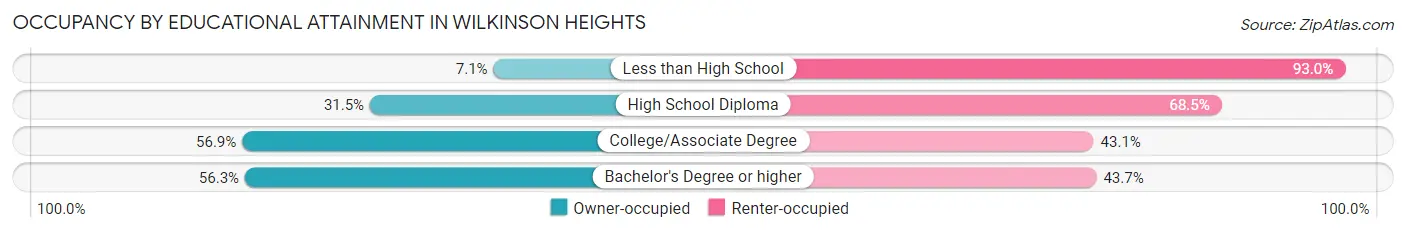
| Household Size | Owner-occupied | Renter-occupied |
| Less than High School | 21 (7.0%) | 277 (92.9%) |
| High School Diploma | 105 (31.5%) | 228 (68.5%) |
| College/Associate Degree | 124 (56.9%) | 94 (43.1%) |
| Bachelor's Degree or higher | 49 (56.3%) | 38 (43.7%) |
Occupancy by Age of Householder in Wilkinson Heights
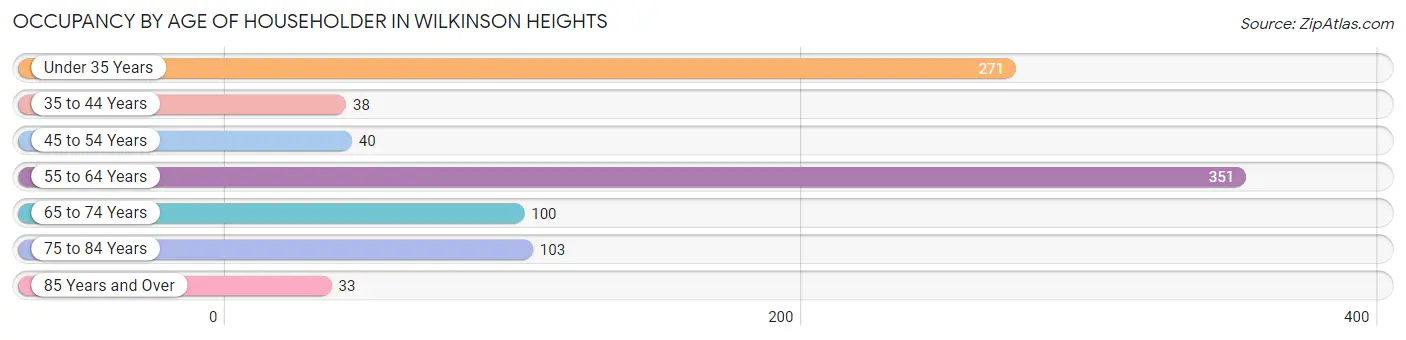
| Age Bracket | # Households | % Households |
| Under 35 Years | 271 | 28.9% |
| 35 to 44 Years | 38 | 4.1% |
| 45 to 54 Years | 40 | 4.3% |
| 55 to 64 Years | 351 | 37.5% |
| 65 to 74 Years | 100 | 10.7% |
| 75 to 84 Years | 103 | 11.0% |
| 85 Years and Over | 33 | 3.5% |
| Total | 936 | 100.0% |
Housing Finances in Wilkinson Heights
Median Income by Occupancy in Wilkinson Heights
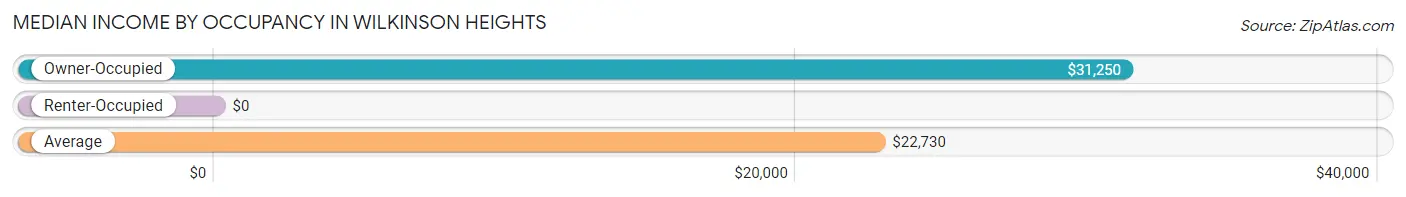
| Occupancy Type | # Households | Median Income |
| Owner-Occupied | 299 (31.9%) | $31,250 |
| Renter-Occupied | 637 (68.1%) | $0 |
| Average | 936 (100.0%) | $22,730 |
Occupancy by Householder Income Bracket in Wilkinson Heights
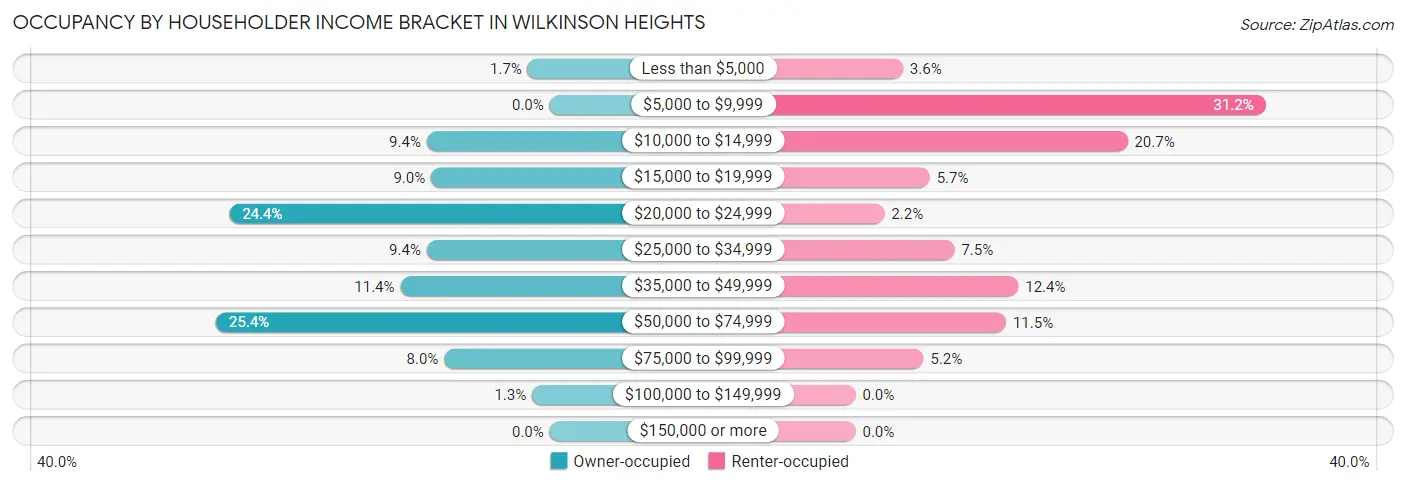
| Income Bracket | Owner-occupied | Renter-occupied |
| Less than $5,000 | 5 (1.7%) | 23 (3.6%) |
| $5,000 to $9,999 | 0 (0.0%) | 199 (31.2%) |
| $10,000 to $14,999 | 28 (9.4%) | 132 (20.7%) |
| $15,000 to $19,999 | 27 (9.0%) | 36 (5.7%) |
| $20,000 to $24,999 | 73 (24.4%) | 14 (2.2%) |
| $25,000 to $34,999 | 28 (9.4%) | 48 (7.5%) |
| $35,000 to $49,999 | 34 (11.4%) | 79 (12.4%) |
| $50,000 to $74,999 | 76 (25.4%) | 73 (11.5%) |
| $75,000 to $99,999 | 24 (8.0%) | 33 (5.2%) |
| $100,000 to $149,999 | 4 (1.3%) | 0 (0.0%) |
| $150,000 or more | 0 (0.0%) | 0 (0.0%) |
| Total | 299 (100.0%) | 637 (100.0%) |
Monthly Housing Cost Tiers in Wilkinson Heights
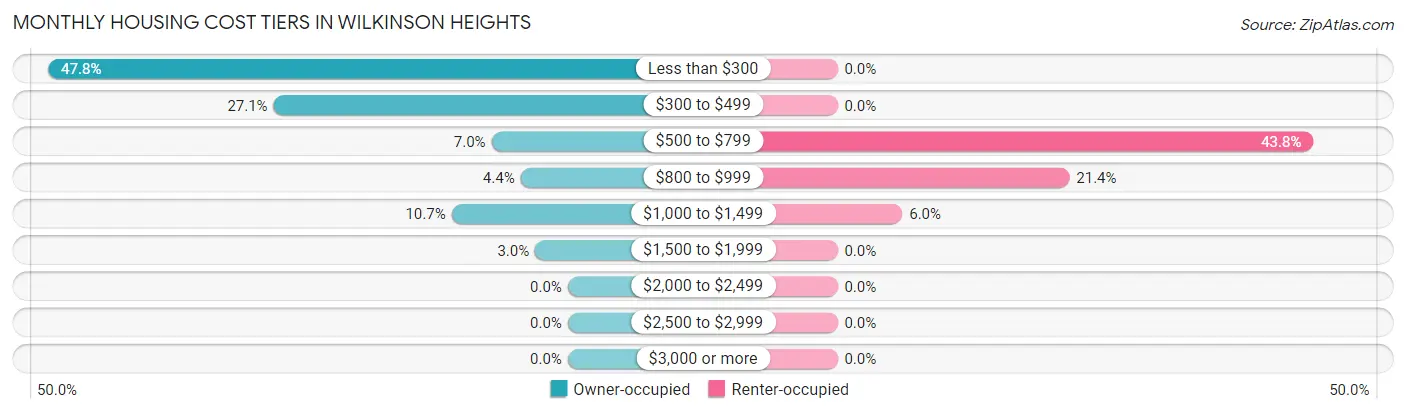
| Monthly Cost | Owner-occupied | Renter-occupied |
| Less than $300 | 143 (47.8%) | 0 (0.0%) |
| $300 to $499 | 81 (27.1%) | 0 (0.0%) |
| $500 to $799 | 21 (7.0%) | 279 (43.8%) |
| $800 to $999 | 13 (4.3%) | 136 (21.3%) |
| $1,000 to $1,499 | 32 (10.7%) | 38 (6.0%) |
| $1,500 to $1,999 | 9 (3.0%) | 0 (0.0%) |
| $2,000 to $2,499 | 0 (0.0%) | 0 (0.0%) |
| $2,500 to $2,999 | 0 (0.0%) | 0 (0.0%) |
| $3,000 or more | 0 (0.0%) | 0 (0.0%) |
| Total | 299 (100.0%) | 637 (100.0%) |
Physical Housing Characteristics in Wilkinson Heights
Housing Structures in Wilkinson Heights
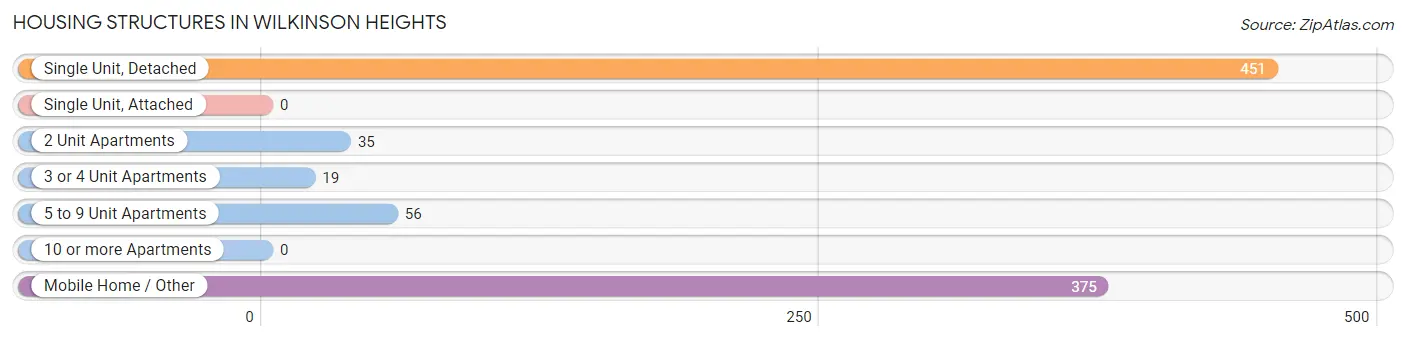
| Structure Type | # Housing Units | % Housing Units |
| Single Unit, Detached | 451 | 48.2% |
| Single Unit, Attached | 0 | 0.0% |
| 2 Unit Apartments | 35 | 3.7% |
| 3 or 4 Unit Apartments | 19 | 2.0% |
| 5 to 9 Unit Apartments | 56 | 6.0% |
| 10 or more Apartments | 0 | 0.0% |
| Mobile Home / Other | 375 | 40.1% |
| Total | 936 | 100.0% |
Housing Structures by Occupancy in Wilkinson Heights
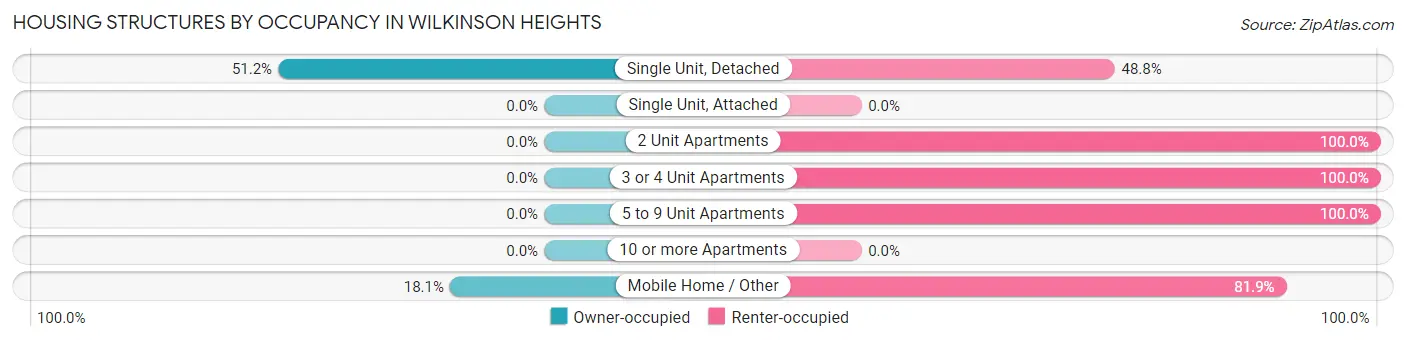
| Structure Type | Owner-occupied | Renter-occupied |
| Single Unit, Detached | 231 (51.2%) | 220 (48.8%) |
| Single Unit, Attached | 0 (0.0%) | 0 (0.0%) |
| 2 Unit Apartments | 0 (0.0%) | 35 (100.0%) |
| 3 or 4 Unit Apartments | 0 (0.0%) | 19 (100.0%) |
| 5 to 9 Unit Apartments | 0 (0.0%) | 56 (100.0%) |
| 10 or more Apartments | 0 (0.0%) | 0 (0.0%) |
| Mobile Home / Other | 68 (18.1%) | 307 (81.9%) |
| Total | 299 (31.9%) | 637 (68.1%) |
Housing Structures by Number of Rooms in Wilkinson Heights
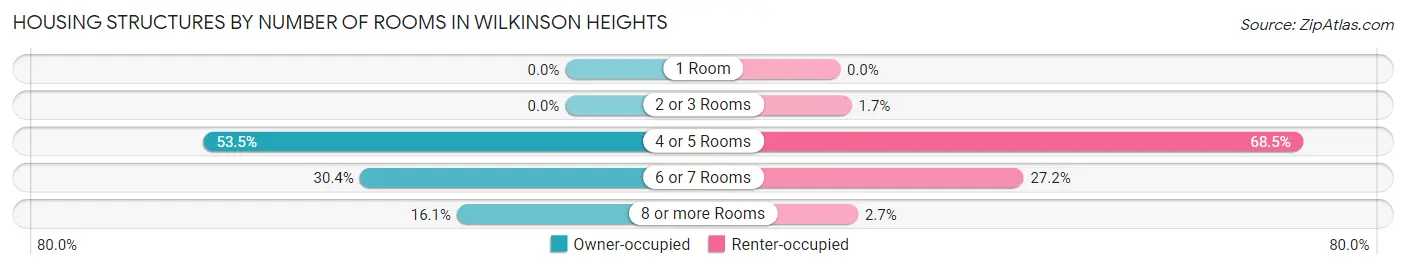
| Number of Rooms | Owner-occupied | Renter-occupied |
| 1 Room | 0 (0.0%) | 0 (0.0%) |
| 2 or 3 Rooms | 0 (0.0%) | 11 (1.7%) |
| 4 or 5 Rooms | 160 (53.5%) | 436 (68.4%) |
| 6 or 7 Rooms | 91 (30.4%) | 173 (27.2%) |
| 8 or more Rooms | 48 (16.1%) | 17 (2.7%) |
| Total | 299 (100.0%) | 637 (100.0%) |
Housing Structure by Heating Type in Wilkinson Heights
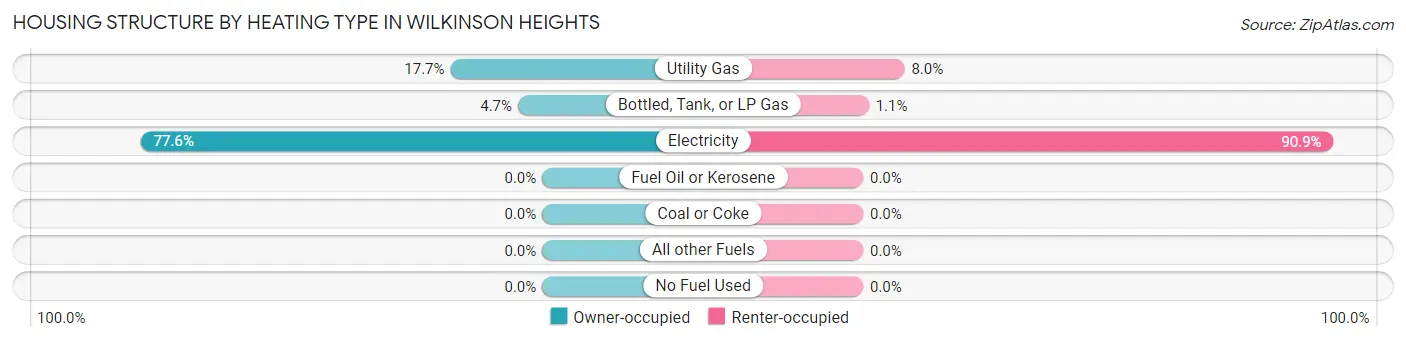
| Heating Type | Owner-occupied | Renter-occupied |
| Utility Gas | 53 (17.7%) | 51 (8.0%) |
| Bottled, Tank, or LP Gas | 14 (4.7%) | 7 (1.1%) |
| Electricity | 232 (77.6%) | 579 (90.9%) |
| Fuel Oil or Kerosene | 0 (0.0%) | 0 (0.0%) |
| Coal or Coke | 0 (0.0%) | 0 (0.0%) |
| All other Fuels | 0 (0.0%) | 0 (0.0%) |
| No Fuel Used | 0 (0.0%) | 0 (0.0%) |
| Total | 299 (100.0%) | 637 (100.0%) |
Household Vehicle Usage in Wilkinson Heights
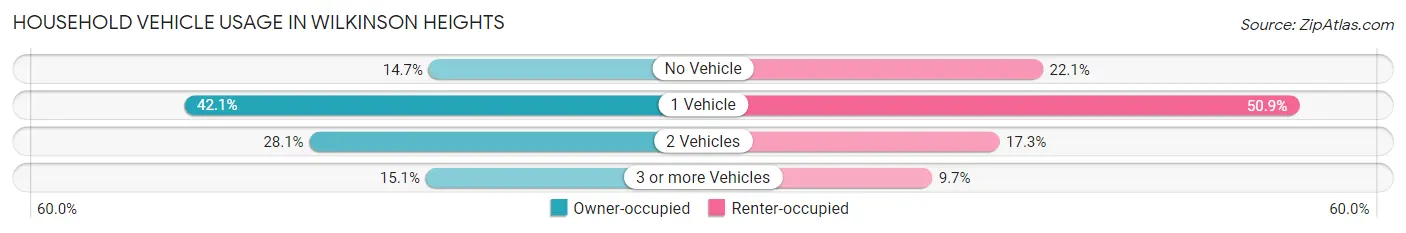
| Vehicles per Household | Owner-occupied | Renter-occupied |
| No Vehicle | 44 (14.7%) | 141 (22.1%) |
| 1 Vehicle | 126 (42.1%) | 324 (50.9%) |
| 2 Vehicles | 84 (28.1%) | 110 (17.3%) |
| 3 or more Vehicles | 45 (15.0%) | 62 (9.7%) |
| Total | 299 (100.0%) | 637 (100.0%) |
Real Estate & Mortgages in Wilkinson Heights
Real Estate and Mortgage Overview in Wilkinson Heights
| Characteristic | Without Mortgage | With Mortgage |
| Housing Units | 245 | 54 |
| Median Property Value | $83,600 | $81,400 |
| Median Household Income | $30,694 | $0 |
| Monthly Housing Costs | $287 | $0 |
| Real Estate Taxes | $334 | $0 |
Property Value by Mortgage Status in Wilkinson Heights
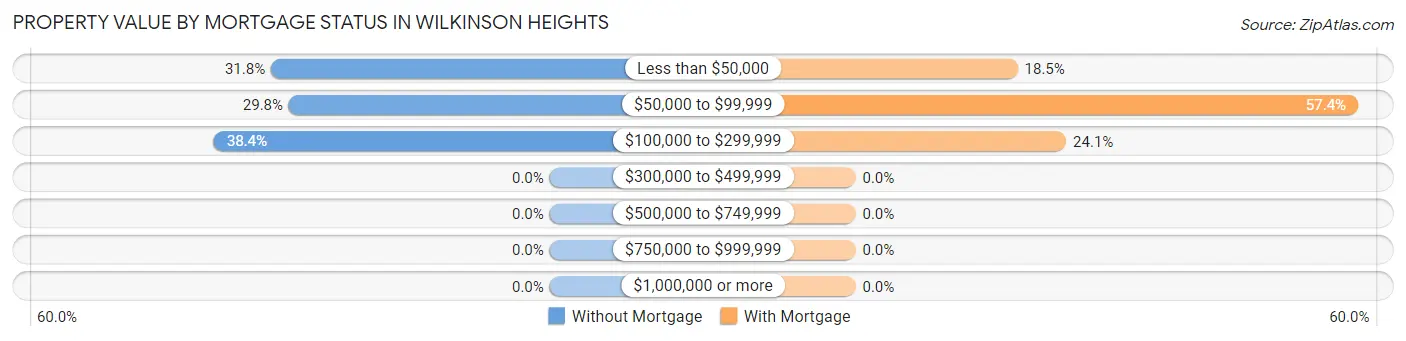
| Property Value | Without Mortgage | With Mortgage |
| Less than $50,000 | 78 (31.8%) | 10 (18.5%) |
| $50,000 to $99,999 | 73 (29.8%) | 31 (57.4%) |
| $100,000 to $299,999 | 94 (38.4%) | 13 (24.1%) |
| $300,000 to $499,999 | 0 (0.0%) | 0 (0.0%) |
| $500,000 to $749,999 | 0 (0.0%) | 0 (0.0%) |
| $750,000 to $999,999 | 0 (0.0%) | 0 (0.0%) |
| $1,000,000 or more | 0 (0.0%) | 0 (0.0%) |
| Total | 245 (100.0%) | 54 (100.0%) |
Household Income by Mortgage Status in Wilkinson Heights
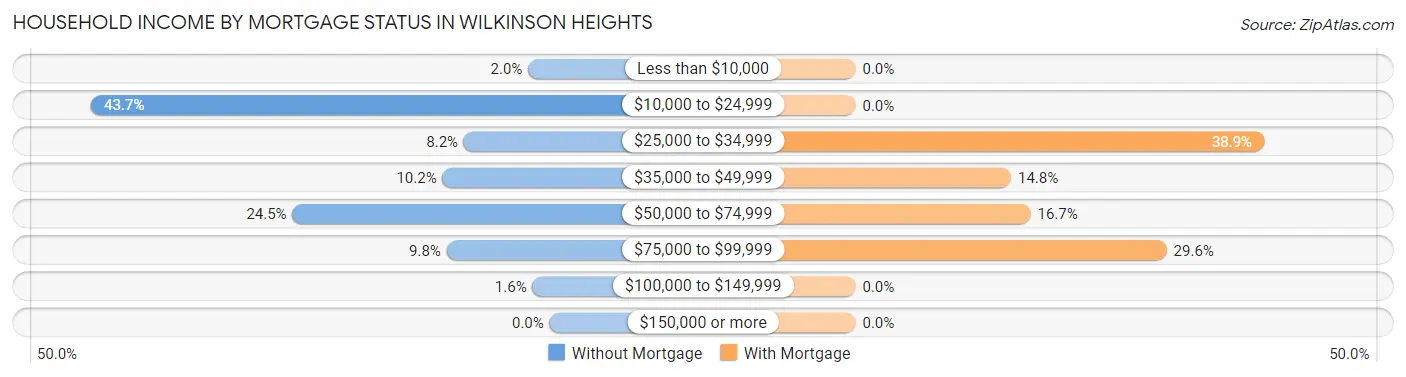
| Household Income | Without Mortgage | With Mortgage |
| Less than $10,000 | 5 (2.0%) | 0 (0.0%) |
| $10,000 to $24,999 | 107 (43.7%) | 0 (0.0%) |
| $25,000 to $34,999 | 20 (8.2%) | 21 (38.9%) |
| $35,000 to $49,999 | 25 (10.2%) | 8 (14.8%) |
| $50,000 to $74,999 | 60 (24.5%) | 9 (16.7%) |
| $75,000 to $99,999 | 24 (9.8%) | 16 (29.6%) |
| $100,000 to $149,999 | 4 (1.6%) | 0 (0.0%) |
| $150,000 or more | 0 (0.0%) | 0 (0.0%) |
| Total | 245 (100.0%) | 54 (100.0%) |
Property Value to Household Income Ratio in Wilkinson Heights
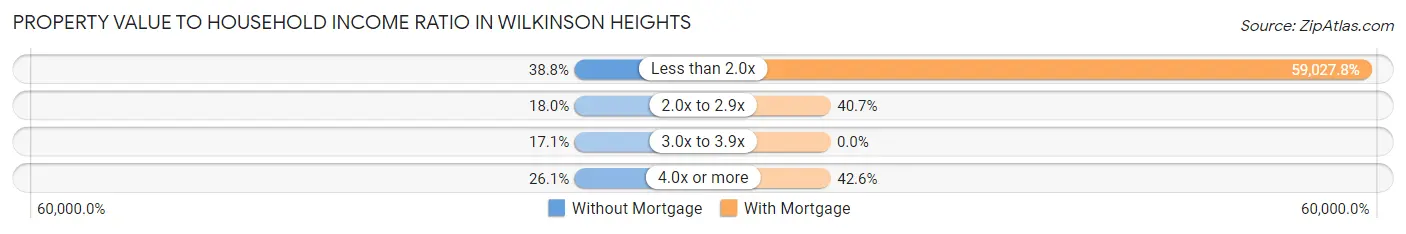
| Value-to-Income Ratio | Without Mortgage | With Mortgage |
| Less than 2.0x | 95 (38.8%) | 31,875 (59,027.8%) |
| 2.0x to 2.9x | 44 (18.0%) | 22 (40.7%) |
| 3.0x to 3.9x | 42 (17.1%) | 0 (0.0%) |
| 4.0x or more | 64 (26.1%) | 23 (42.6%) |
| Total | 245 (100.0%) | 54 (100.0%) |
Real Estate Taxes by Mortgage Status in Wilkinson Heights
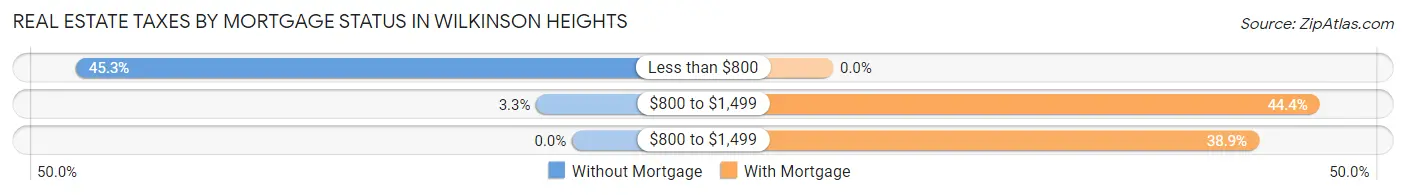
| Property Taxes | Without Mortgage | With Mortgage |
| Less than $800 | 111 (45.3%) | 0 (0.0%) |
| $800 to $1,499 | 8 (3.3%) | 24 (44.4%) |
| $800 to $1,499 | 0 (0.0%) | 21 (38.9%) |
| Total | 245 (100.0%) | 54 (100.0%) |
Health & Disability in Wilkinson Heights
Health Insurance Coverage by Age in Wilkinson Heights
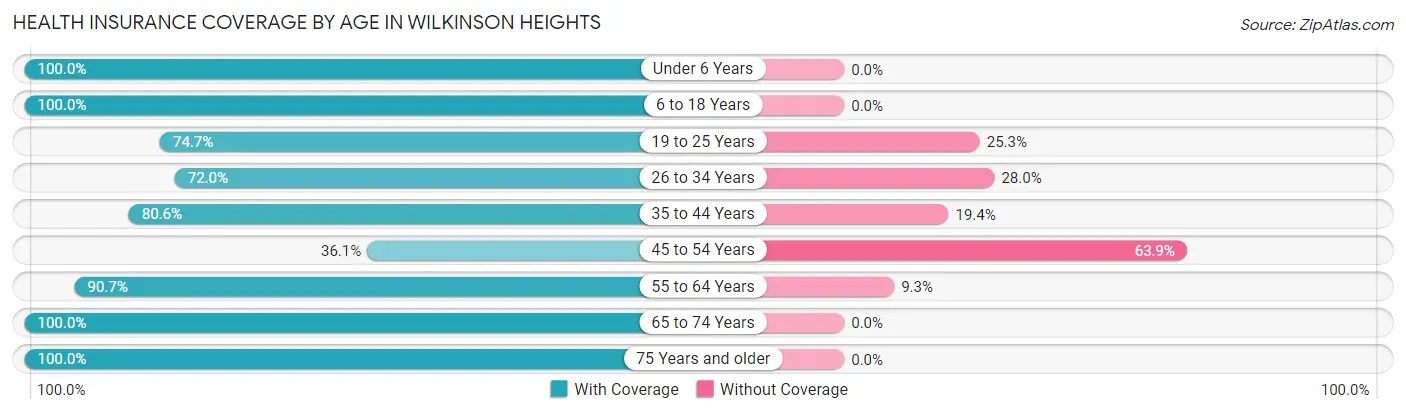
| Age Bracket | With Coverage | Without Coverage |
| Under 6 Years | 164 (100.0%) | 0 (0.0%) |
| 6 to 18 Years | 293 (100.0%) | 0 (0.0%) |
| 19 to 25 Years | 139 (74.7%) | 47 (25.3%) |
| 26 to 34 Years | 293 (72.0%) | 114 (28.0%) |
| 35 to 44 Years | 58 (80.6%) | 14 (19.4%) |
| 45 to 54 Years | 30 (36.1%) | 53 (63.9%) |
| 55 to 64 Years | 380 (90.7%) | 39 (9.3%) |
| 65 to 74 Years | 134 (100.0%) | 0 (0.0%) |
| 75 Years and older | 161 (100.0%) | 0 (0.0%) |
| Total | 1,652 (86.1%) | 267 (13.9%) |
Health Insurance Coverage by Citizenship Status in Wilkinson Heights
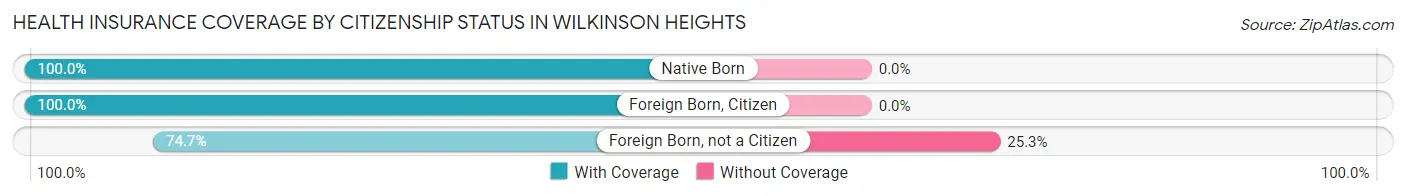
| Citizenship Status | With Coverage | Without Coverage |
| Native Born | 164 (100.0%) | 0 (0.0%) |
| Foreign Born, Citizen | 293 (100.0%) | 0 (0.0%) |
| Foreign Born, not a Citizen | 139 (74.7%) | 47 (25.3%) |
Health Insurance Coverage by Household Income in Wilkinson Heights
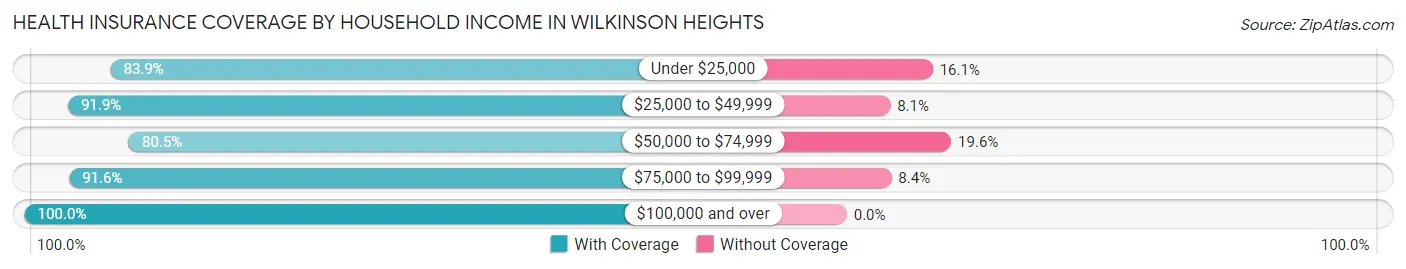
| Household Income | With Coverage | Without Coverage |
| Under $25,000 | 579 (83.9%) | 111 (16.1%) |
| $25,000 to $49,999 | 407 (91.9%) | 36 (8.1%) |
| $50,000 to $74,999 | 395 (80.4%) | 96 (19.6%) |
| $75,000 to $99,999 | 263 (91.6%) | 24 (8.4%) |
| $100,000 and over | 8 (100.0%) | 0 (0.0%) |
Public vs Private Health Insurance Coverage by Age in Wilkinson Heights
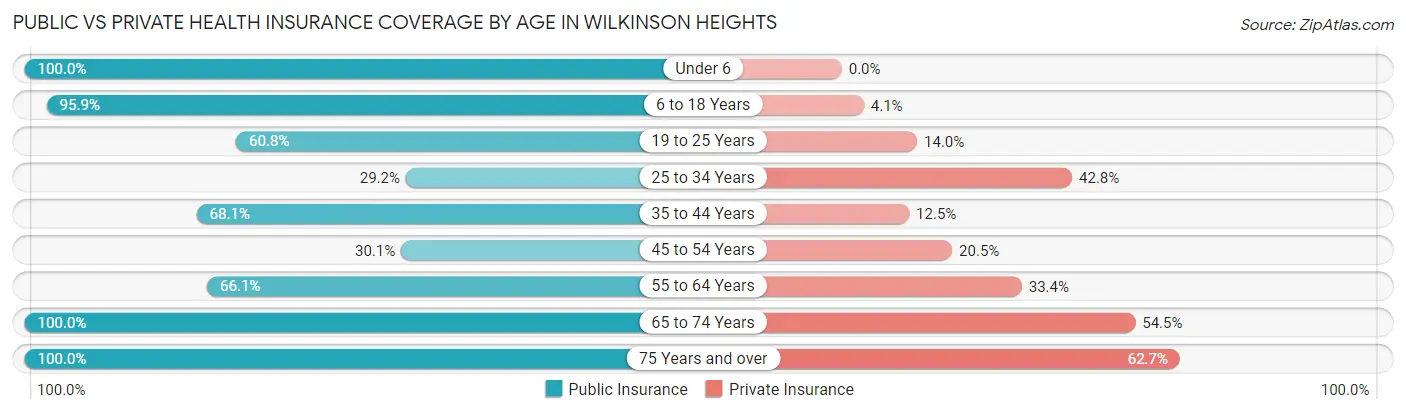
| Age Bracket | Public Insurance | Private Insurance |
| Under 6 | 164 (100.0%) | 0 (0.0%) |
| 6 to 18 Years | 281 (95.9%) | 12 (4.1%) |
| 19 to 25 Years | 113 (60.8%) | 26 (14.0%) |
| 25 to 34 Years | 119 (29.2%) | 174 (42.7%) |
| 35 to 44 Years | 49 (68.1%) | 9 (12.5%) |
| 45 to 54 Years | 25 (30.1%) | 17 (20.5%) |
| 55 to 64 Years | 277 (66.1%) | 140 (33.4%) |
| 65 to 74 Years | 134 (100.0%) | 73 (54.5%) |
| 75 Years and over | 161 (100.0%) | 101 (62.7%) |
| Total | 1,323 (68.9%) | 552 (28.8%) |
Disability Status by Sex by Age in Wilkinson Heights
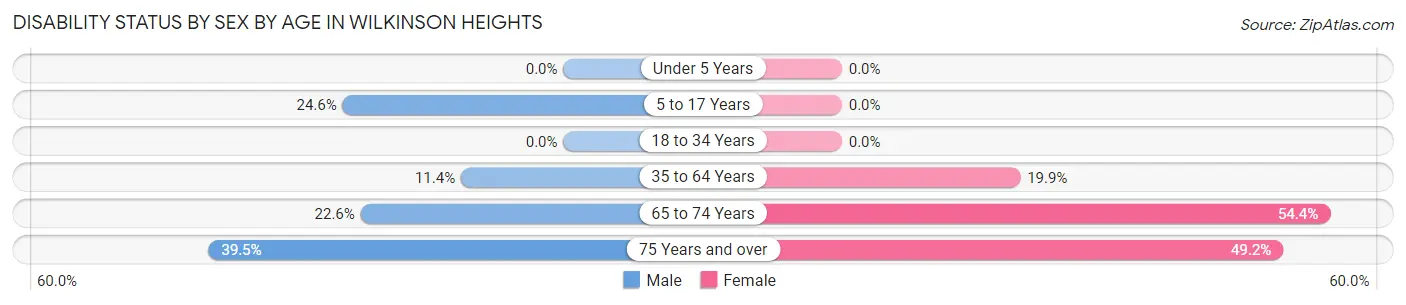
| Age Bracket | Male | Female |
| Under 5 Years | 0 (0.0%) | 0 (0.0%) |
| 5 to 17 Years | 15 (24.6%) | 0 (0.0%) |
| 18 to 34 Years | 0 (0.0%) | 0 (0.0%) |
| 35 to 64 Years | 31 (11.4%) | 60 (19.9%) |
| 65 to 74 Years | 7 (22.6%) | 56 (54.4%) |
| 75 Years and over | 17 (39.5%) | 58 (49.1%) |
Disability Class by Sex by Age in Wilkinson Heights
Disability Class: Hearing Difficulty
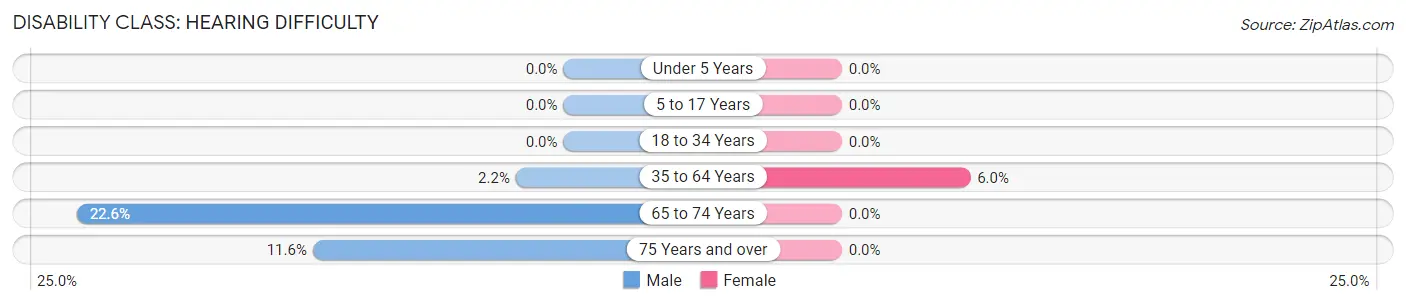
| Age Bracket | Male | Female |
| Under 5 Years | 0 (0.0%) | 0 (0.0%) |
| 5 to 17 Years | 0 (0.0%) | 0 (0.0%) |
| 18 to 34 Years | 0 (0.0%) | 0 (0.0%) |
| 35 to 64 Years | 6 (2.2%) | 18 (6.0%) |
| 65 to 74 Years | 7 (22.6%) | 0 (0.0%) |
| 75 Years and over | 5 (11.6%) | 0 (0.0%) |
Disability Class: Vision Difficulty
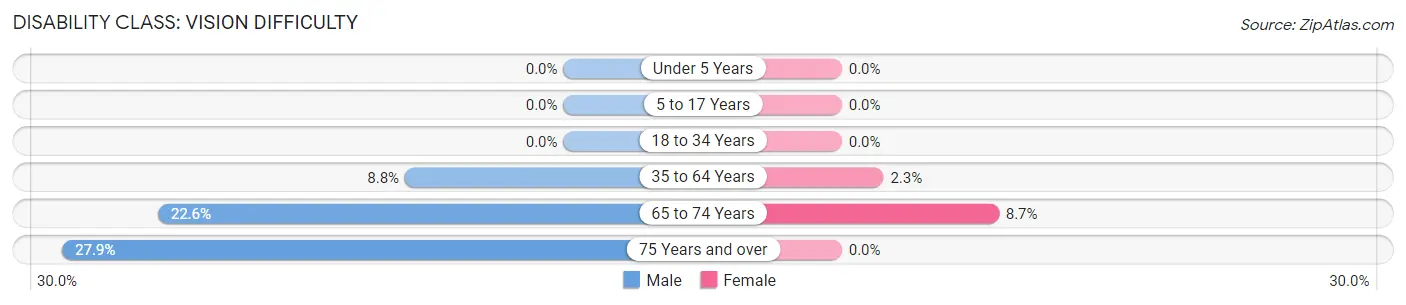
| Age Bracket | Male | Female |
| Under 5 Years | 0 (0.0%) | 0 (0.0%) |
| 5 to 17 Years | 0 (0.0%) | 0 (0.0%) |
| 18 to 34 Years | 0 (0.0%) | 0 (0.0%) |
| 35 to 64 Years | 24 (8.8%) | 7 (2.3%) |
| 65 to 74 Years | 7 (22.6%) | 9 (8.7%) |
| 75 Years and over | 12 (27.9%) | 0 (0.0%) |
Disability Class: Cognitive Difficulty
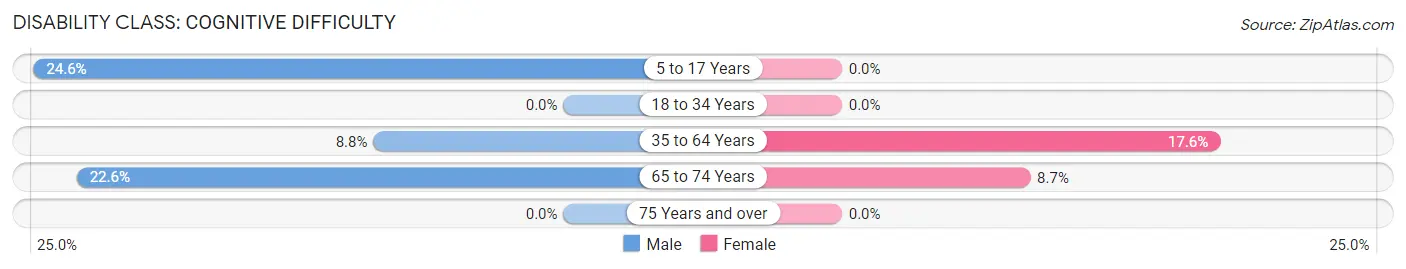
| Age Bracket | Male | Female |
| 5 to 17 Years | 15 (24.6%) | 0 (0.0%) |
| 18 to 34 Years | 0 (0.0%) | 0 (0.0%) |
| 35 to 64 Years | 24 (8.8%) | 53 (17.5%) |
| 65 to 74 Years | 7 (22.6%) | 9 (8.7%) |
| 75 Years and over | 0 (0.0%) | 0 (0.0%) |
Disability Class: Ambulatory Difficulty
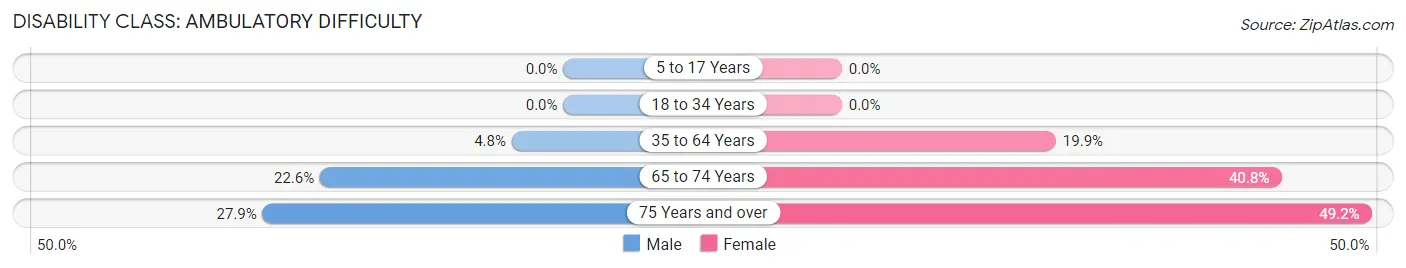
| Age Bracket | Male | Female |
| 5 to 17 Years | 0 (0.0%) | 0 (0.0%) |
| 18 to 34 Years | 0 (0.0%) | 0 (0.0%) |
| 35 to 64 Years | 13 (4.8%) | 60 (19.9%) |
| 65 to 74 Years | 7 (22.6%) | 42 (40.8%) |
| 75 Years and over | 12 (27.9%) | 58 (49.1%) |
Disability Class: Self-Care Difficulty
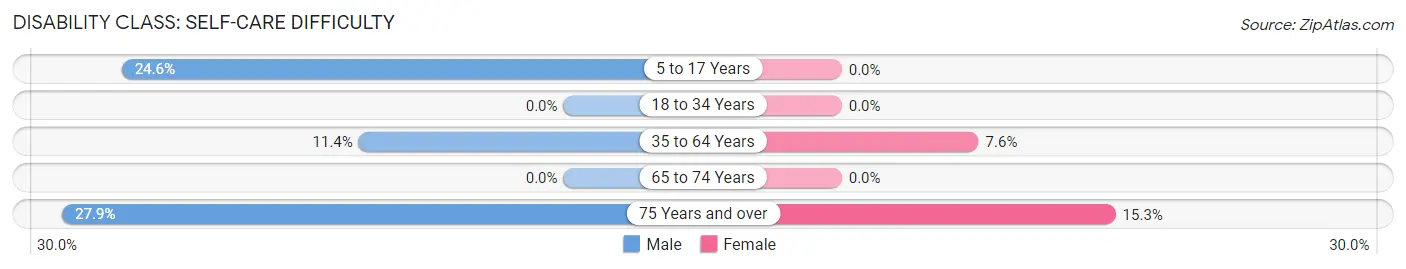
| Age Bracket | Male | Female |
| 5 to 17 Years | 15 (24.6%) | 0 (0.0%) |
| 18 to 34 Years | 0 (0.0%) | 0 (0.0%) |
| 35 to 64 Years | 31 (11.4%) | 23 (7.6%) |
| 65 to 74 Years | 0 (0.0%) | 0 (0.0%) |
| 75 Years and over | 12 (27.9%) | 18 (15.2%) |
Technology Access in Wilkinson Heights
Computing Device Access in Wilkinson Heights
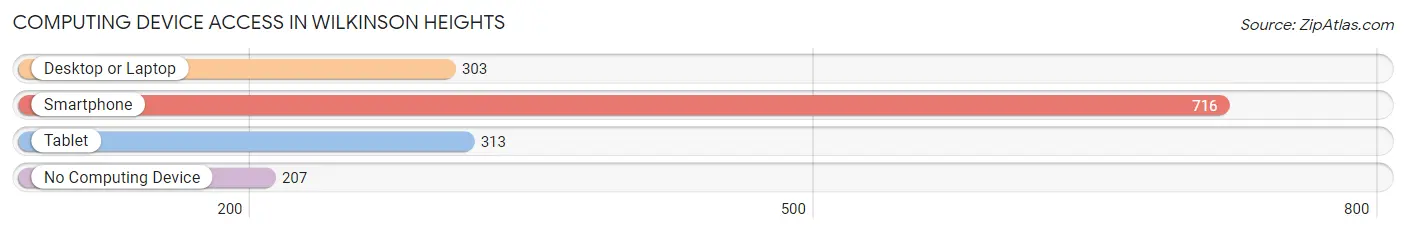
| Device Type | # Households | % Households |
| Desktop or Laptop | 303 | 32.4% |
| Smartphone | 716 | 76.5% |
| Tablet | 313 | 33.4% |
| No Computing Device | 207 | 22.1% |
| Total | 936 | 100.0% |
Internet Access in Wilkinson Heights
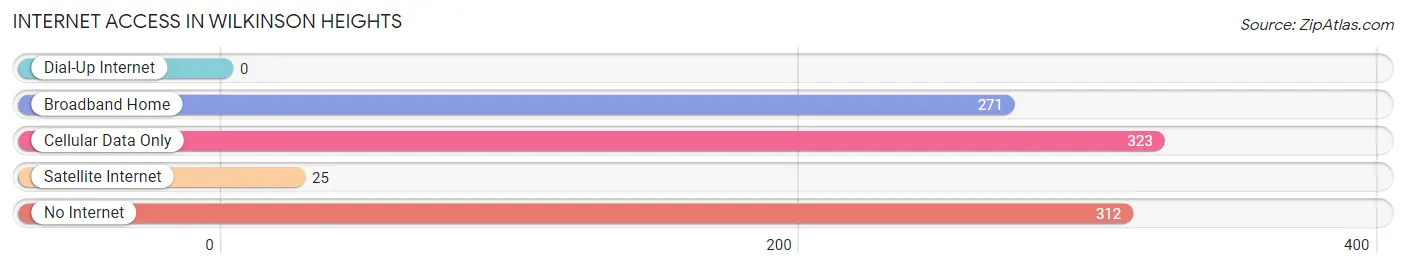
| Internet Type | # Households | % Households |
| Dial-Up Internet | 0 | 0.0% |
| Broadband Home | 271 | 28.9% |
| Cellular Data Only | 323 | 34.5% |
| Satellite Internet | 25 | 2.7% |
| No Internet | 312 | 33.3% |
| Total | 936 | 100.0% |
Wilkinson Heights Summary
Wilkinson Heights is a small town located in the state of South Carolina, United States. It is situated in the Midlands region of the state, approximately 20 miles south of Columbia, the state capital. The town is located in Richland County and is part of the Columbia Metropolitan Statistical Area. As of the 2010 census, the population of Wilkinson Heights was 1,845.
History
The area that is now Wilkinson Heights was first settled in the late 1700s by a group of settlers from Virginia. The town was originally known as “Wilkinson’s Crossroads”, named after the family that owned the land. In 1820, the town was officially incorporated as “Wilkinson Heights”.
The town grew slowly over the next few decades, but it was not until the late 1800s that it began to experience significant growth. This was due to the construction of the Columbia, Newberry and Laurens Railroad, which ran through the town. The railroad brought new businesses and industries to the area, and the population of Wilkinson Heights began to grow rapidly.
By the early 1900s, the town had become a thriving community with a variety of businesses and industries. The town was home to several cotton mills, a brickyard, a sawmill, and a variety of other businesses. The town also had a number of churches, schools, and other civic organizations.
Geography
Wilkinson Heights is located in the Midlands region of South Carolina, approximately 20 miles south of Columbia. The town is situated in Richland County, and is part of the Columbia Metropolitan Statistical Area. The town is located on the banks of the Congaree River, and is surrounded by rolling hills and forests.
The climate in Wilkinson Heights is humid subtropical, with hot, humid summers and mild winters. The average annual temperature is around 70 degrees Fahrenheit, and the average annual precipitation is around 48 inches.
Economy
The economy of Wilkinson Heights is largely based on agriculture and manufacturing. The town is home to several cotton mills, a brickyard, a sawmill, and a variety of other businesses. The town also has a number of churches, schools, and other civic organizations.
The town is also home to several small businesses, including restaurants, retail stores, and other services. The town is also home to a number of tourist attractions, including the Congaree National Park, the South Carolina State Museum, and the Columbia Zoo.
Demographics
As of the 2010 census, the population of Wilkinson Heights was 1,845. The racial makeup of the town was 79.3% White, 16.2% African American, 0.3% Native American, 0.7% Asian, 0.1% Pacific Islander, 1.2% from other races, and 2.4% from two or more races. Hispanic or Latino of any race were 3.2% of the population.
The median income for a household in Wilkinson Heights was $37,917, and the median income for a family was $45,938. The per capita income for the town was $19,945. About 11.2% of families and 14.2% of the population were below the poverty line, including 19.2% of those under age 18 and 8.2% of those age 65 or over.
Common Questions
What is Per Capita Income in Wilkinson Heights?
Per Capita income in Wilkinson Heights is $15,046.
What is the Median Family Income in Wilkinson Heights?
Median Family Income in Wilkinson Heights is $47,292.
What is the Median Household income in Wilkinson Heights?
Median Household Income in Wilkinson Heights is $22,730.
What is Income or Wage Gap in Wilkinson Heights?
Income or Wage Gap in Wilkinson Heights is 38.7%.
Women in Wilkinson Heights earn 61.3 cents for every dollar earned by a man.
What is Inequality or Gini Index in Wilkinson Heights?
Inequality or Gini Index in Wilkinson Heights is 0.43.
What is the Total Population of Wilkinson Heights?
Total Population of Wilkinson Heights is 1,919.
What is the Total Male Population of Wilkinson Heights?
Total Male Population of Wilkinson Heights is 770.
What is the Total Female Population of Wilkinson Heights?
Total Female Population of Wilkinson Heights is 1,149.
What is the Ratio of Males per 100 Females in Wilkinson Heights?
There are 67.01 Males per 100 Females in Wilkinson Heights.
What is the Ratio of Females per 100 Males in Wilkinson Heights?
There are 149.22 Females per 100 Males in Wilkinson Heights.
What is the Median Population Age in Wilkinson Heights?
Median Population Age in Wilkinson Heights is 32.0 Years.
What is the Average Family Size in Wilkinson Heights
Average Family Size in Wilkinson Heights is 3.4 People.
What is the Average Household Size in Wilkinson Heights
Average Household Size in Wilkinson Heights is 2.0 People.
How Large is the Labor Force in Wilkinson Heights?
There are 776 People in the Labor Forcein in Wilkinson Heights.
What is the Percentage of People in the Labor Force in Wilkinson Heights?
48.1% of People are in the Labor Force in Wilkinson Heights.
What is the Unemployment Rate in Wilkinson Heights?
Unemployment Rate in Wilkinson Heights is 12.6%.