Edgefield, SC Map & Demographics
Edgefield Map
Edgefield Overview
$26,074
PER CAPITA INCOME
$63,438
AVG FAMILY INCOME
$32,200
AVG HOUSEHOLD INCOME
35.5%
WAGE / INCOME GAP [ % ]
64.5¢/ $1
WAGE / INCOME GAP [ $ ]
0.53
INEQUALITY / GINI INDEX
2,504
TOTAL POPULATION
1,236
MALE POPULATION
1,268
FEMALE POPULATION
97.48
MALES / 100 FEMALES
102.59
FEMALES / 100 MALES
39.9
MEDIAN AGE
2.9
AVG FAMILY SIZE
2.3
AVG HOUSEHOLD SIZE
1,199
LABOR FORCE [ PEOPLE ]
55.6%
PERCENT IN LABOR FORCE
16.9%
UNEMPLOYMENT RATE
Edgefield Zip Codes
Edgefield Area Codes
Income in Edgefield
Income Overview in Edgefield
Per Capita Income in Edgefield is $26,074, while median incomes of families and households are $63,438 and $32,200 respectively.
| Characteristic | Number | Measure |
| Per Capita Income | 2,504 | $26,074 |
| Median Family Income | 682 | $63,438 |
| Mean Family Income | 682 | $72,242 |
| Median Household Income | 1,050 | $32,200 |
| Mean Household Income | 1,050 | $55,917 |
| Income Deficit | 682 | $0 |
| Wage / Income Gap (%) | 2,504 | 35.45% |
| Wage / Income Gap ($) | 2,504 | 64.55¢ per $1 |
| Gini / Inequality Index | 2,504 | 0.53 |
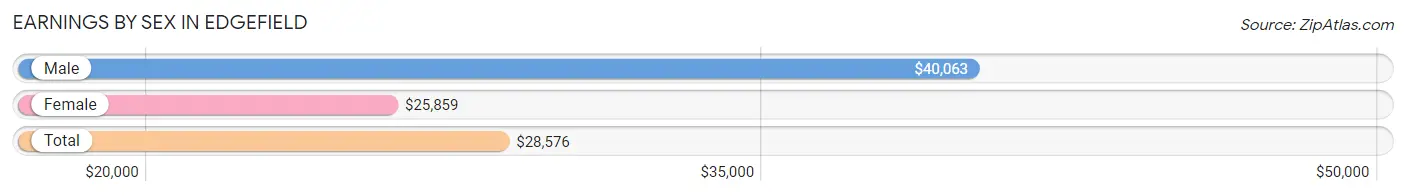
Earnings by Sex in Edgefield
Average Earnings in Edgefield are $28,576, $40,063 for men and $25,859 for women, a difference of 35.4%.
| Sex | Number | Average Earnings |
| Male | 589 (51.1%) | $40,063 |
| Female | 563 (48.9%) | $25,859 |
| Total | 1,152 (100.0%) | $28,576 |
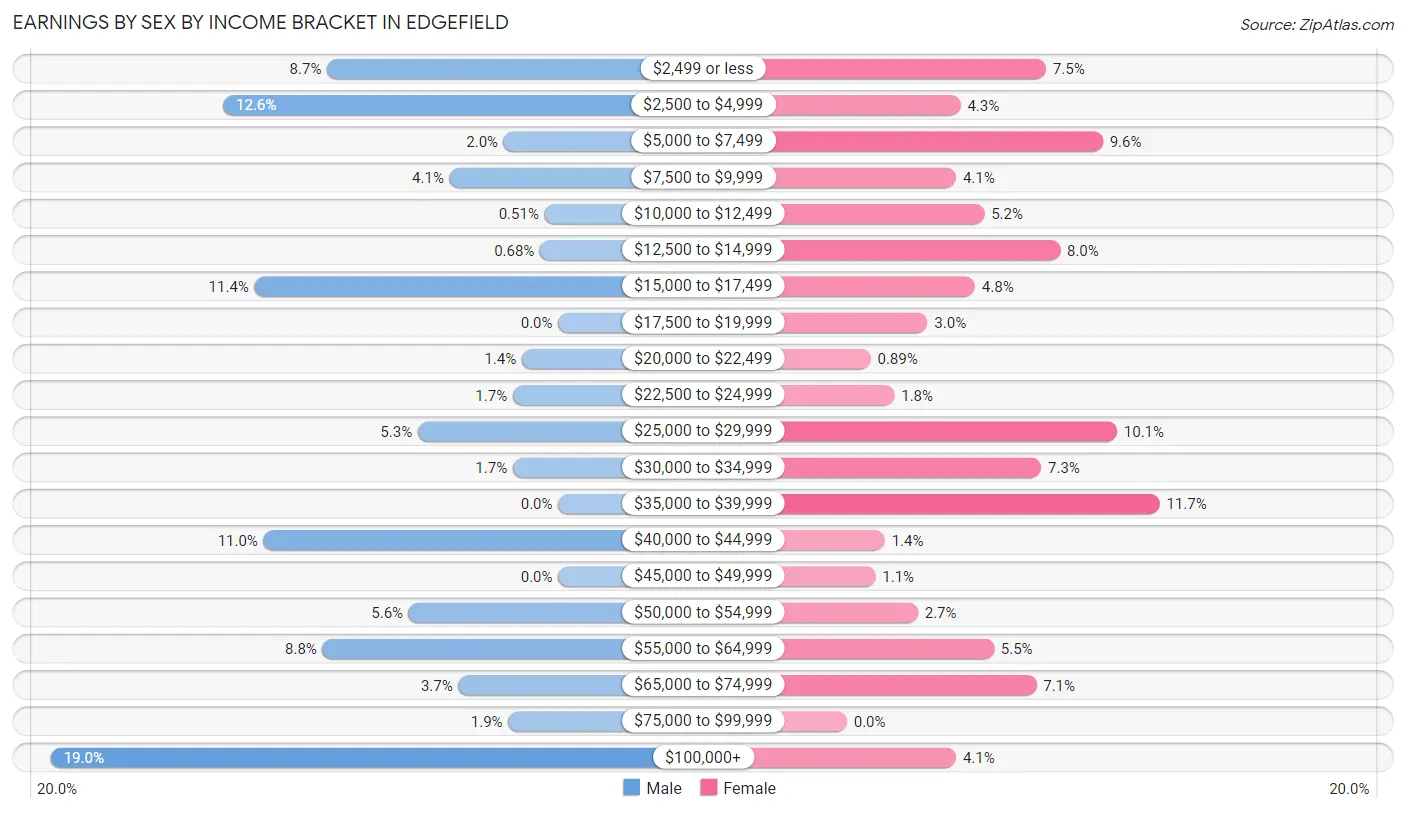
Earnings by Sex by Income Bracket in Edgefield
The most common earnings brackets in Edgefield are $100,000+ for men (112 | 19.0%) and $35,000 to $39,999 for women (66 | 11.7%).
| Income | Male | Female |
| $2,499 or less | 51 (8.7%) | 42 (7.5%) |
| $2,500 to $4,999 | 74 (12.6%) | 24 (4.3%) |
| $5,000 to $7,499 | 12 (2.0%) | 54 (9.6%) |
| $7,500 to $9,999 | 24 (4.1%) | 23 (4.1%) |
| $10,000 to $12,499 | 3 (0.5%) | 29 (5.1%) |
| $12,500 to $14,999 | 4 (0.7%) | 45 (8.0%) |
| $15,000 to $17,499 | 67 (11.4%) | 27 (4.8%) |
| $17,500 to $19,999 | 0 (0.0%) | 17 (3.0%) |
| $20,000 to $22,499 | 8 (1.4%) | 5 (0.9%) |
| $22,500 to $24,999 | 10 (1.7%) | 10 (1.8%) |
| $25,000 to $29,999 | 31 (5.3%) | 57 (10.1%) |
| $30,000 to $34,999 | 10 (1.7%) | 41 (7.3%) |
| $35,000 to $39,999 | 0 (0.0%) | 66 (11.7%) |
| $40,000 to $44,999 | 65 (11.0%) | 8 (1.4%) |
| $45,000 to $49,999 | 0 (0.0%) | 6 (1.1%) |
| $50,000 to $54,999 | 33 (5.6%) | 15 (2.7%) |
| $55,000 to $64,999 | 52 (8.8%) | 31 (5.5%) |
| $65,000 to $74,999 | 22 (3.7%) | 40 (7.1%) |
| $75,000 to $99,999 | 11 (1.9%) | 0 (0.0%) |
| $100,000+ | 112 (19.0%) | 23 (4.1%) |
| Total | 589 (100.0%) | 563 (100.0%) |
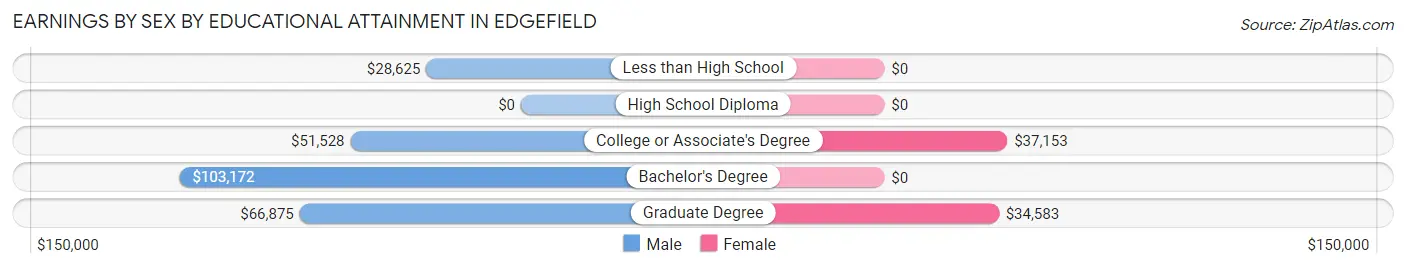
Earnings by Sex by Educational Attainment in Edgefield
Average earnings in Edgefield are $55,588 for men and $32,000 for women, a difference of 42.4%. Men with an educational attainment of bachelor's degree enjoy the highest average annual earnings of $103,172, while those with less than high school education earn the least with $28,625. Women with an educational attainment of college or associate's degree earn the most with the average annual earnings of $37,153, while those with graduate degree education have the smallest earnings of $34,583.
| Educational Attainment | Male Income | Female Income |
| Less than High School | $28,625 | $0 |
| High School Diploma | - | - |
| College or Associate's Degree | $51,528 | $37,153 |
| Bachelor's Degree | $103,172 | $0 |
| Graduate Degree | $66,875 | $34,583 |
| Total | $55,588 | $32,000 |
Family Income in Edgefield
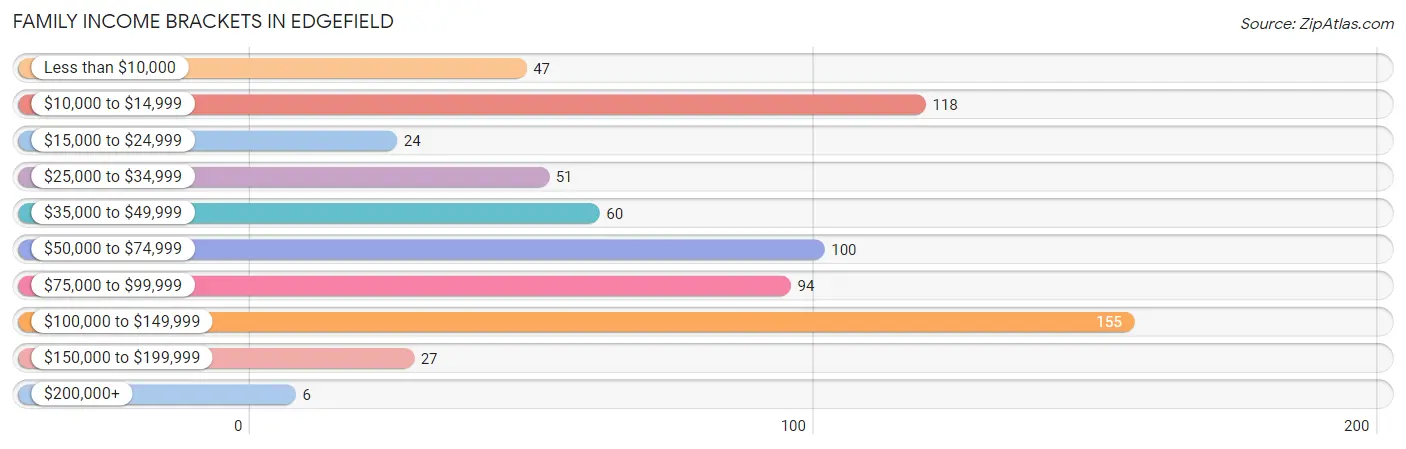
Family Income Brackets in Edgefield
According to the Edgefield family income data, there are 155 families falling into the $100,000 to $149,999 income range, which is the most common income bracket and makes up 22.7% of all families. Conversely, the $200,000+ income bracket is the least frequent group with only 6 families (0.9%) belonging to this category.
| Income Bracket | # Families | % Families |
| Less than $10,000 | 47 | 6.9% |
| $10,000 to $14,999 | 118 | 17.3% |
| $15,000 to $24,999 | 24 | 3.5% |
| $25,000 to $34,999 | 51 | 7.5% |
| $35,000 to $49,999 | 60 | 8.8% |
| $50,000 to $74,999 | 100 | 14.7% |
| $75,000 to $99,999 | 94 | 13.8% |
| $100,000 to $149,999 | 155 | 22.7% |
| $150,000 to $199,999 | 27 | 4.0% |
| $200,000+ | 6 | 0.9% |
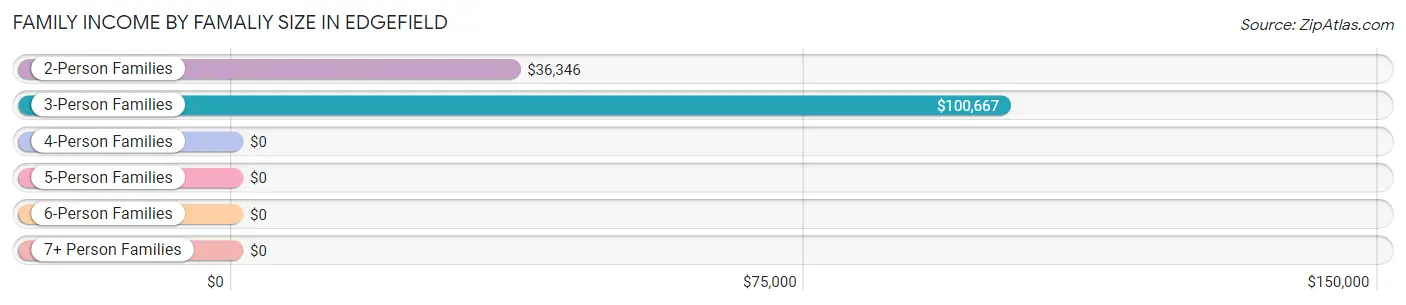
Family Income by Famaliy Size in Edgefield
3-person families (260 | 38.1%) account for the highest median family income in Edgefield with $100,667 per family, while 3-person families (260 | 38.1%) have the highest median income of $33,556 per family member.
| Income Bracket | # Families | Median Income |
| 2-Person Families | 304 (44.6%) | $36,346 |
| 3-Person Families | 260 (38.1%) | $100,667 |
| 4-Person Families | 68 (10.0%) | $0 |
| 5-Person Families | 46 (6.7%) | $0 |
| 6-Person Families | 0 (0.0%) | $0 |
| 7+ Person Families | 4 (0.6%) | $0 |
| Total | 682 (100.0%) | $63,438 |
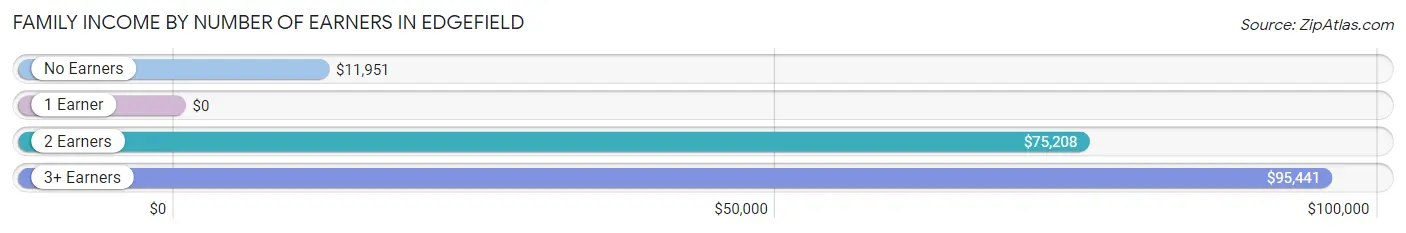
Family Income by Number of Earners in Edgefield
| Number of Earners | # Families | Median Income |
| No Earners | 198 (29.0%) | $11,951 |
| 1 Earner | 202 (29.6%) | $0 |
| 2 Earners | 204 (29.9%) | $75,208 |
| 3+ Earners | 78 (11.4%) | $95,441 |
| Total | 682 (100.0%) | $63,438 |
Household Income in Edgefield
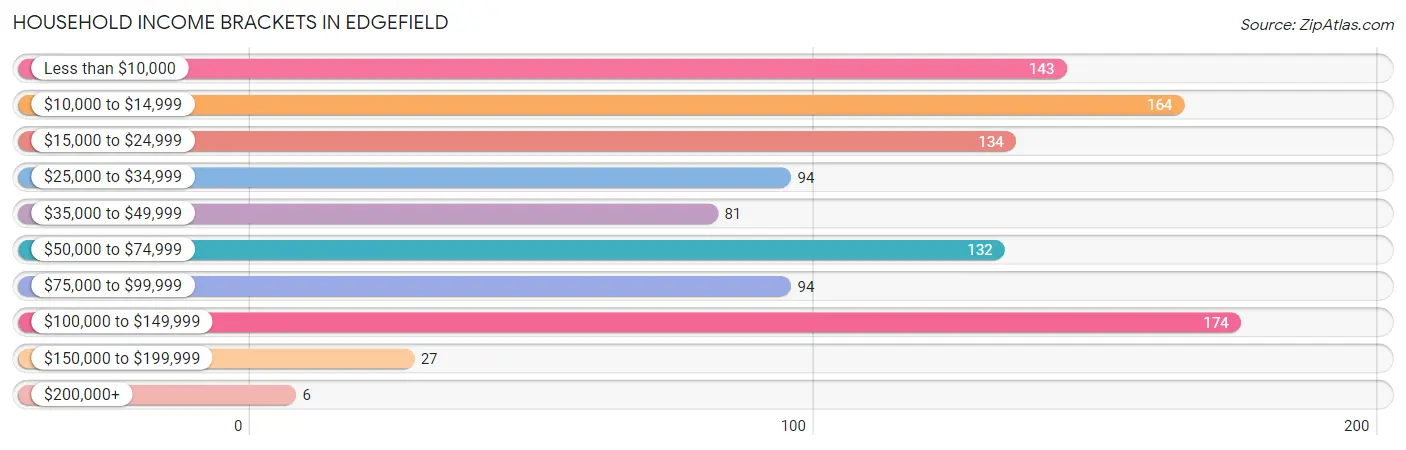
Household Income Brackets in Edgefield
With 174 households falling in the category, the $100,000 to $149,999 income range is the most frequent in Edgefield, accounting for 16.6% of all households. In contrast, only 6 households (0.6%) fall into the $200,000+ income bracket, making it the least populous group.
| Income Bracket | # Households | % Households |
| Less than $10,000 | 143 | 13.6% |
| $10,000 to $14,999 | 164 | 15.6% |
| $15,000 to $24,999 | 134 | 12.8% |
| $25,000 to $34,999 | 94 | 9.0% |
| $35,000 to $49,999 | 81 | 7.7% |
| $50,000 to $74,999 | 132 | 12.6% |
| $75,000 to $99,999 | 94 | 9.0% |
| $100,000 to $149,999 | 174 | 16.6% |
| $150,000 to $199,999 | 27 | 2.6% |
| $200,000+ | 6 | 0.6% |
Household Income by Householder Age in Edgefield
The median household income in Edgefield is $32,200, with the highest median household income of $57,969 found in the 45 to 64 years age bracket for the primary householder. A total of 473 households (45.1%) fall into this category. Meanwhile, the 15 to 24 years age bracket for the primary householder has the lowest median household income of $0, with 34 households (3.2%) in this group.
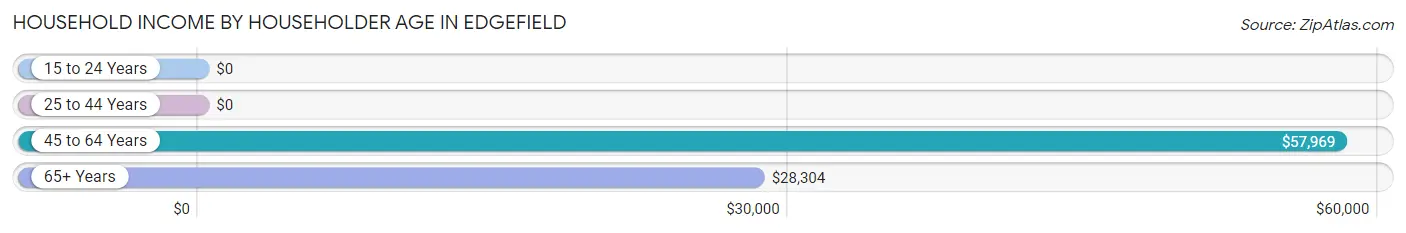
| Income Bracket | # Households | Median Income |
| 15 to 24 Years | 34 (3.2%) | $0 |
| 25 to 44 Years | 264 (25.1%) | $0 |
| 45 to 64 Years | 473 (45.1%) | $57,969 |
| 65+ Years | 279 (26.6%) | $28,304 |
| Total | 1,050 (100.0%) | $32,200 |
Poverty in Edgefield
Income Below Poverty by Sex and Age in Edgefield
With 27.0% poverty level for males and 32.3% for females among the residents of Edgefield, under 5 year old males and 5 year old females are the most vulnerable to poverty, with 29 males (87.9%) and 12 females (100.0%) in their respective age groups living below the poverty level.
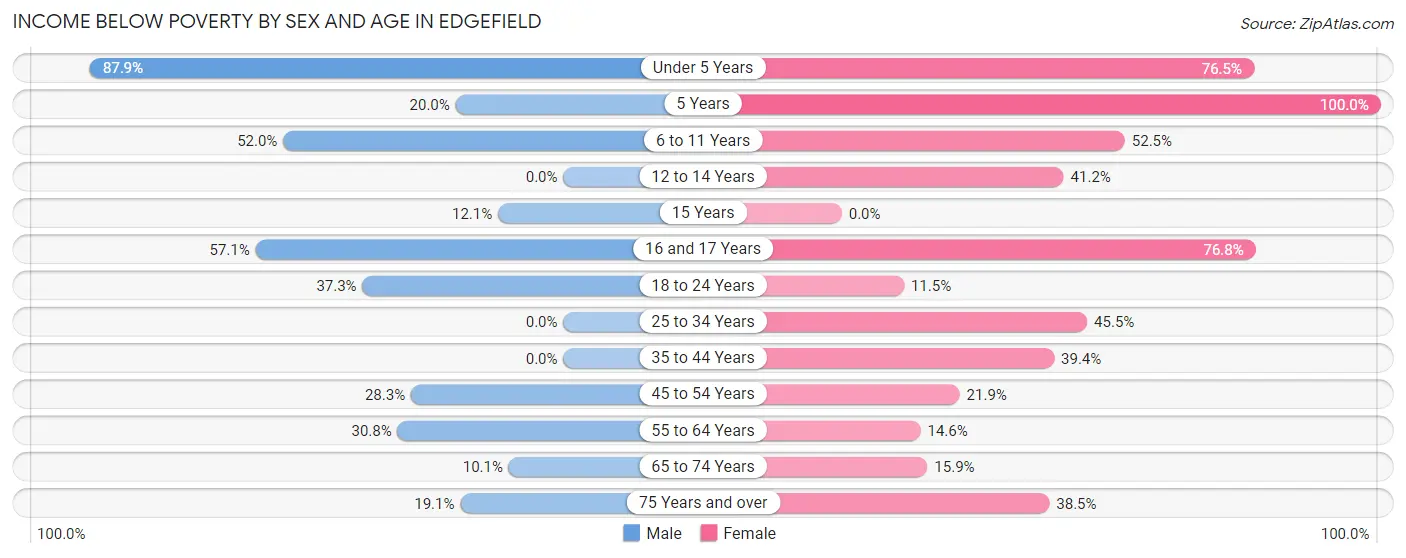
| Age Bracket | Male | Female |
| Under 5 Years | 29 (87.9%) | 13 (76.5%) |
| 5 Years | 5 (20.0%) | 12 (100.0%) |
| 6 to 11 Years | 52 (52.0%) | 31 (52.5%) |
| 12 to 14 Years | 0 (0.0%) | 21 (41.2%) |
| 15 Years | 4 (12.1%) | 0 (0.0%) |
| 16 and 17 Years | 4 (57.1%) | 43 (76.8%) |
| 18 to 24 Years | 88 (37.3%) | 15 (11.5%) |
| 25 to 34 Years | 0 (0.0%) | 46 (45.5%) |
| 35 to 44 Years | 0 (0.0%) | 106 (39.4%) |
| 45 to 54 Years | 41 (28.3%) | 21 (21.9%) |
| 55 to 64 Years | 72 (30.8%) | 25 (14.6%) |
| 65 to 74 Years | 8 (10.1%) | 24 (15.9%) |
| 75 Years and over | 13 (19.1%) | 42 (38.5%) |
| Total | 316 (27.0%) | 399 (32.3%) |
Income Above Poverty by Sex and Age in Edgefield
According to the poverty statistics in Edgefield, males aged 12 to 14 years and females aged 15 years are the age groups that are most secure financially, with 100.0% of males and 100.0% of females in these age groups living above the poverty line.
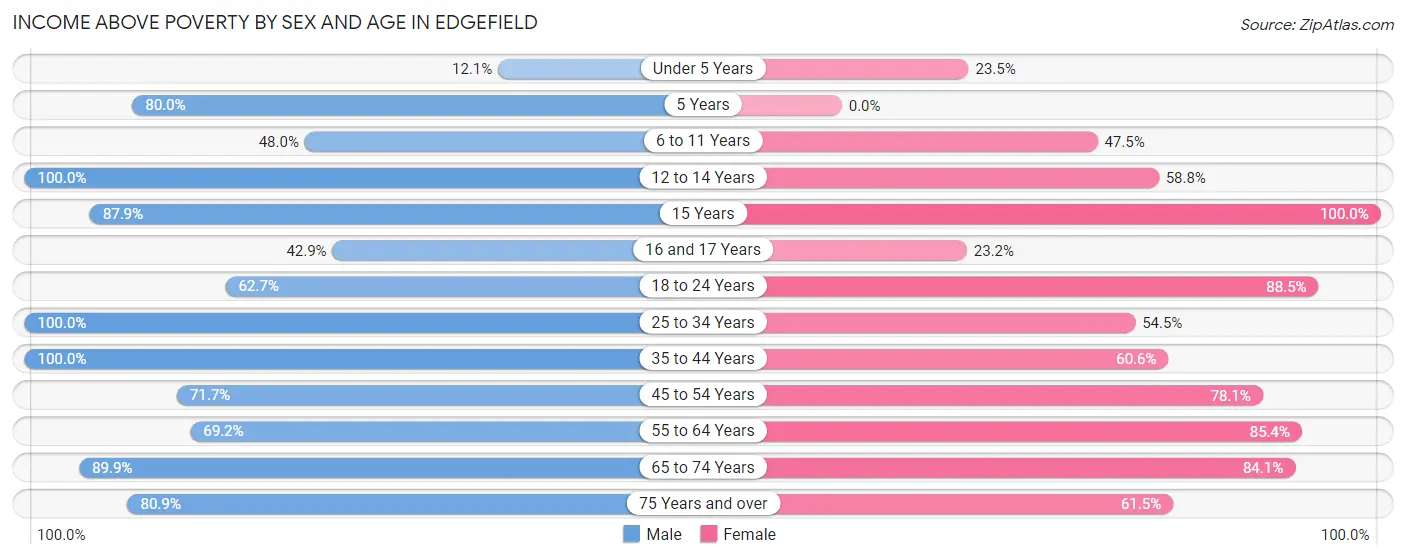
| Age Bracket | Male | Female |
| Under 5 Years | 4 (12.1%) | 4 (23.5%) |
| 5 Years | 20 (80.0%) | 0 (0.0%) |
| 6 to 11 Years | 48 (48.0%) | 28 (47.5%) |
| 12 to 14 Years | 3 (100.0%) | 30 (58.8%) |
| 15 Years | 29 (87.9%) | 14 (100.0%) |
| 16 and 17 Years | 3 (42.9%) | 13 (23.2%) |
| 18 to 24 Years | 148 (62.7%) | 115 (88.5%) |
| 25 to 34 Years | 146 (100.0%) | 55 (54.5%) |
| 35 to 44 Years | 61 (100.0%) | 163 (60.6%) |
| 45 to 54 Years | 104 (71.7%) | 75 (78.1%) |
| 55 to 64 Years | 162 (69.2%) | 146 (85.4%) |
| 65 to 74 Years | 71 (89.9%) | 127 (84.1%) |
| 75 Years and over | 55 (80.9%) | 67 (61.5%) |
| Total | 854 (73.0%) | 837 (67.7%) |
Income Below Poverty Among Married-Couple Families in Edgefield
The poverty statistics for married-couple families in Edgefield show that 2.6% or 9 of the total 348 families live below the poverty line. Families with no children have the highest poverty rate of 3.7%, comprising of 9 families. On the other hand, families with 1 or 2 children have the lowest poverty rate of 0.0%, which includes 0 families.
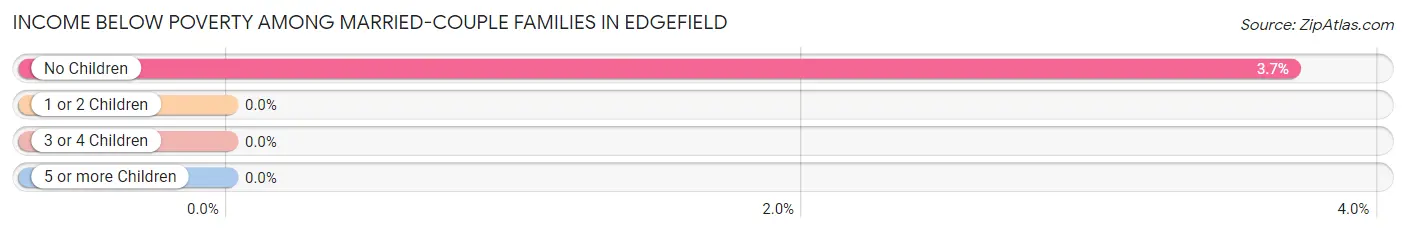
| Children | Above Poverty | Below Poverty |
| No Children | 234 (96.3%) | 9 (3.7%) |
| 1 or 2 Children | 101 (100.0%) | 0 (0.0%) |
| 3 or 4 Children | 0 (0.0%) | 0 (0.0%) |
| 5 or more Children | 4 (100.0%) | 0 (0.0%) |
| Total | 339 (97.4%) | 9 (2.6%) |
Income Below Poverty Among Single-Parent Households in Edgefield
According to the poverty data in Edgefield, 31.4% or 11 single-father households and 56.9% or 170 single-mother households are living below the poverty line. Among single-father households, those with 1 or 2 children have the highest poverty rate, with 11 households (100.0%) experiencing poverty. Likewise, among single-mother households, those with 3 or 4 children have the highest poverty rate, with 14 households (100.0%) falling below the poverty line.
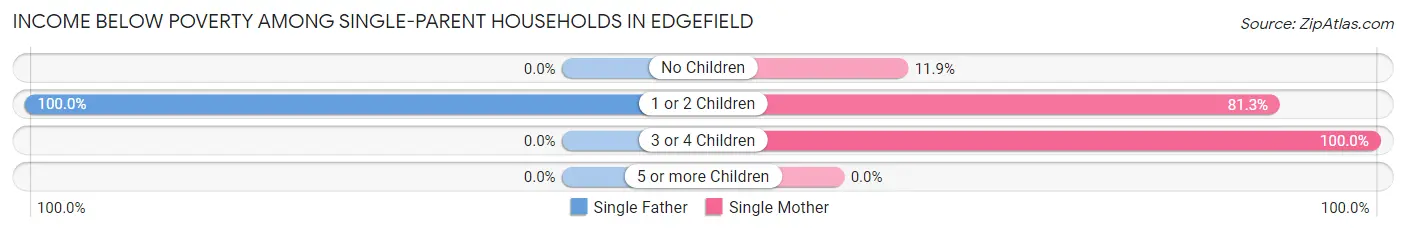
| Children | Single Father | Single Mother |
| No Children | 0 (0.0%) | 13 (11.9%) |
| 1 or 2 Children | 11 (100.0%) | 143 (81.2%) |
| 3 or 4 Children | 0 (0.0%) | 14 (100.0%) |
| 5 or more Children | 0 (0.0%) | 0 (0.0%) |
| Total | 11 (31.4%) | 170 (56.9%) |
Income Below Poverty Among Married-Couple vs Single-Parent Households in Edgefield
The poverty data for Edgefield shows that 9 of the married-couple family households (2.6%) and 181 of the single-parent households (54.2%) are living below the poverty level. Within the married-couple family households, those with no children have the highest poverty rate, with 9 households (3.7%) falling below the poverty line. Among the single-parent households, those with 3 or 4 children have the highest poverty rate, with 14 household (100.0%) living below poverty.
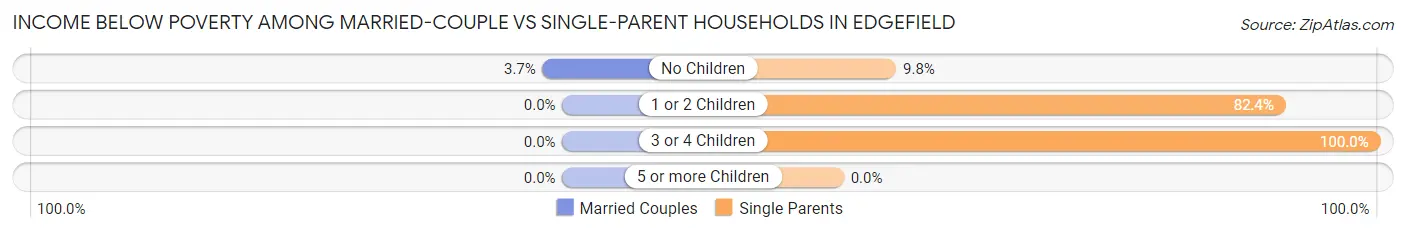
| Children | Married-Couple Families | Single-Parent Households |
| No Children | 9 (3.7%) | 13 (9.8%) |
| 1 or 2 Children | 0 (0.0%) | 154 (82.4%) |
| 3 or 4 Children | 0 (0.0%) | 14 (100.0%) |
| 5 or more Children | 0 (0.0%) | 0 (0.0%) |
| Total | 9 (2.6%) | 181 (54.2%) |
Race in Edgefield
The most populous races in Edgefield are Black / African American (1,352 | 54.0%), White / Caucasian (929 | 37.1%), and Hispanic or Latino (177 | 7.1%).
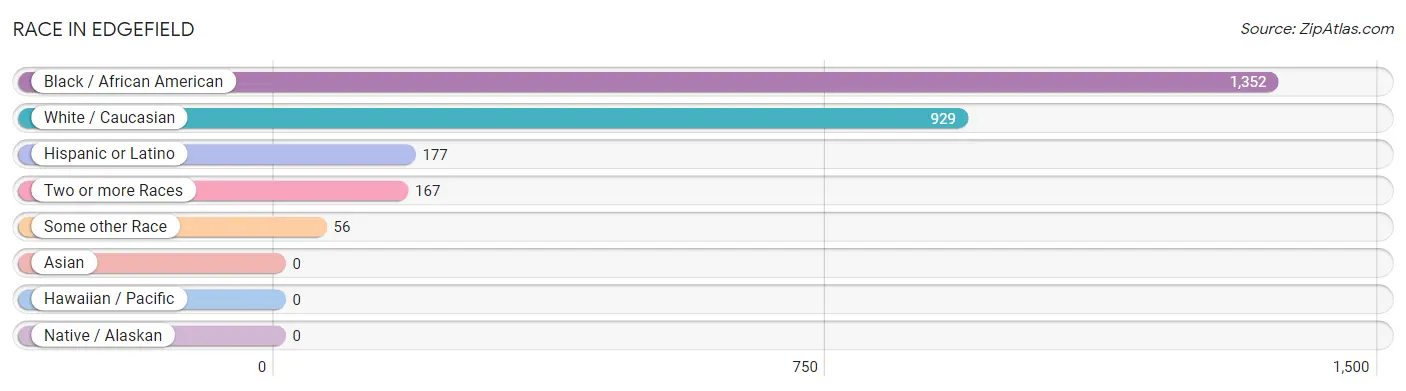
| Race | # Population | % Population |
| Asian | 0 | 0.0% |
| Black / African American | 1,352 | 54.0% |
| Hawaiian / Pacific | 0 | 0.0% |
| Hispanic or Latino | 177 | 7.1% |
| Native / Alaskan | 0 | 0.0% |
| White / Caucasian | 929 | 37.1% |
| Two or more Races | 167 | 6.7% |
| Some other Race | 56 | 2.2% |
| Total | 2,504 | 100.0% |
Ancestry in Edgefield
The most populous ancestries reported in Edgefield are American (405 | 16.2%), Mexican (125 | 5.0%), English (102 | 4.1%), Irish (83 | 3.3%), and German (69 | 2.8%), together accounting for 31.3% of all Edgefield residents.
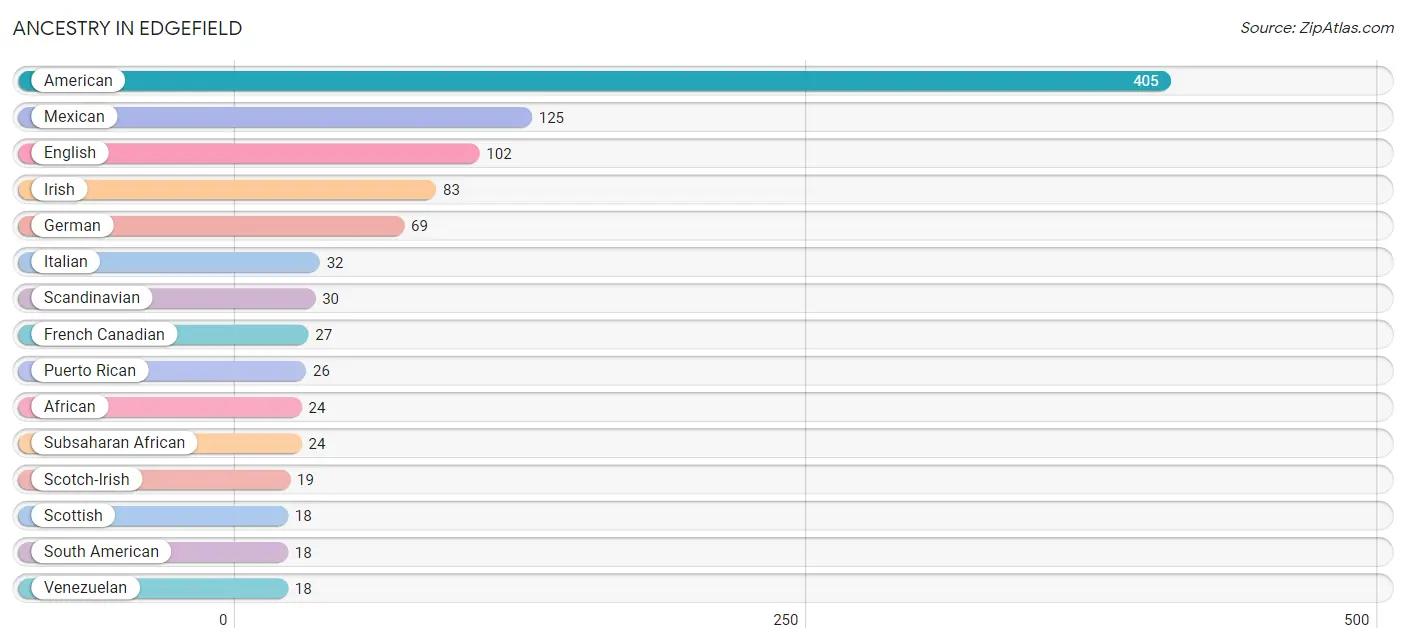
| Ancestry | # Population | % Population |
| African | 24 | 1.0% |
| American | 405 | 16.2% |
| British | 9 | 0.4% |
| Central American | 5 | 0.2% |
| Danish | 4 | 0.2% |
| English | 102 | 4.1% |
| European | 17 | 0.7% |
| French Canadian | 27 | 1.1% |
| German | 69 | 2.8% |
| Haitian | 7 | 0.3% |
| Iranian | 1 | 0.0% |
| Irish | 83 | 3.3% |
| Italian | 32 | 1.3% |
| Malaysian | 5 | 0.2% |
| Mexican | 125 | 5.0% |
| Panamanian | 5 | 0.2% |
| Puerto Rican | 26 | 1.0% |
| Scandinavian | 30 | 1.2% |
| Scotch-Irish | 19 | 0.8% |
| Scottish | 18 | 0.7% |
| South American | 18 | 0.7% |
| Subsaharan African | 24 | 1.0% |
| Swedish | 5 | 0.2% |
| Venezuelan | 18 | 0.7% |
| Welsh | 12 | 0.5% | View All 25 Rows |
Immigrants in Edgefield
The most numerous immigrant groups reported in Edgefield came from Latin America (123 | 4.9%), Central America (105 | 4.2%), Mexico (100 | 4.0%), South America (18 | 0.7%), and Venezuela (18 | 0.7%), together accounting for 14.5% of all Edgefield residents.
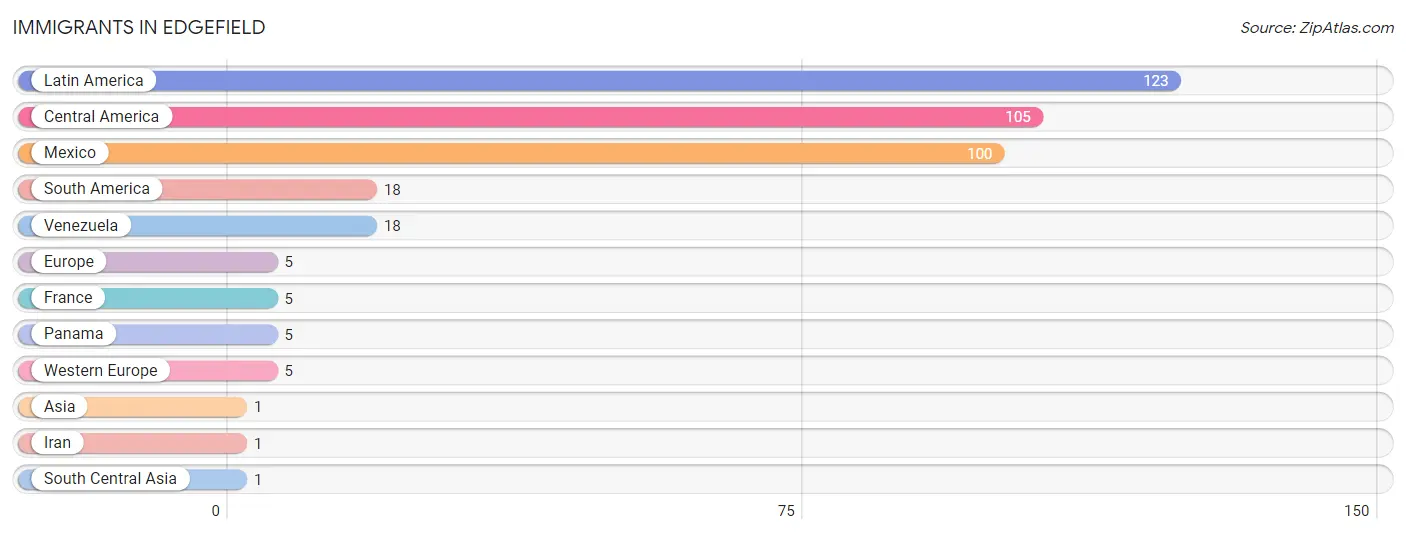
| Immigration Origin | # Population | % Population |
| Asia | 1 | 0.0% |
| Central America | 105 | 4.2% |
| Europe | 5 | 0.2% |
| France | 5 | 0.2% |
| Iran | 1 | 0.0% |
| Latin America | 123 | 4.9% |
| Mexico | 100 | 4.0% |
| Panama | 5 | 0.2% |
| South America | 18 | 0.7% |
| South Central Asia | 1 | 0.0% |
| Venezuela | 18 | 0.7% |
| Western Europe | 5 | 0.2% | View All 12 Rows |
Sex and Age in Edgefield
Sex and Age in Edgefield
The most populous age groups in Edgefield are 20 to 24 Years (174 | 14.1%) for men and 15 to 19 Years (154 | 12.1%) for women.
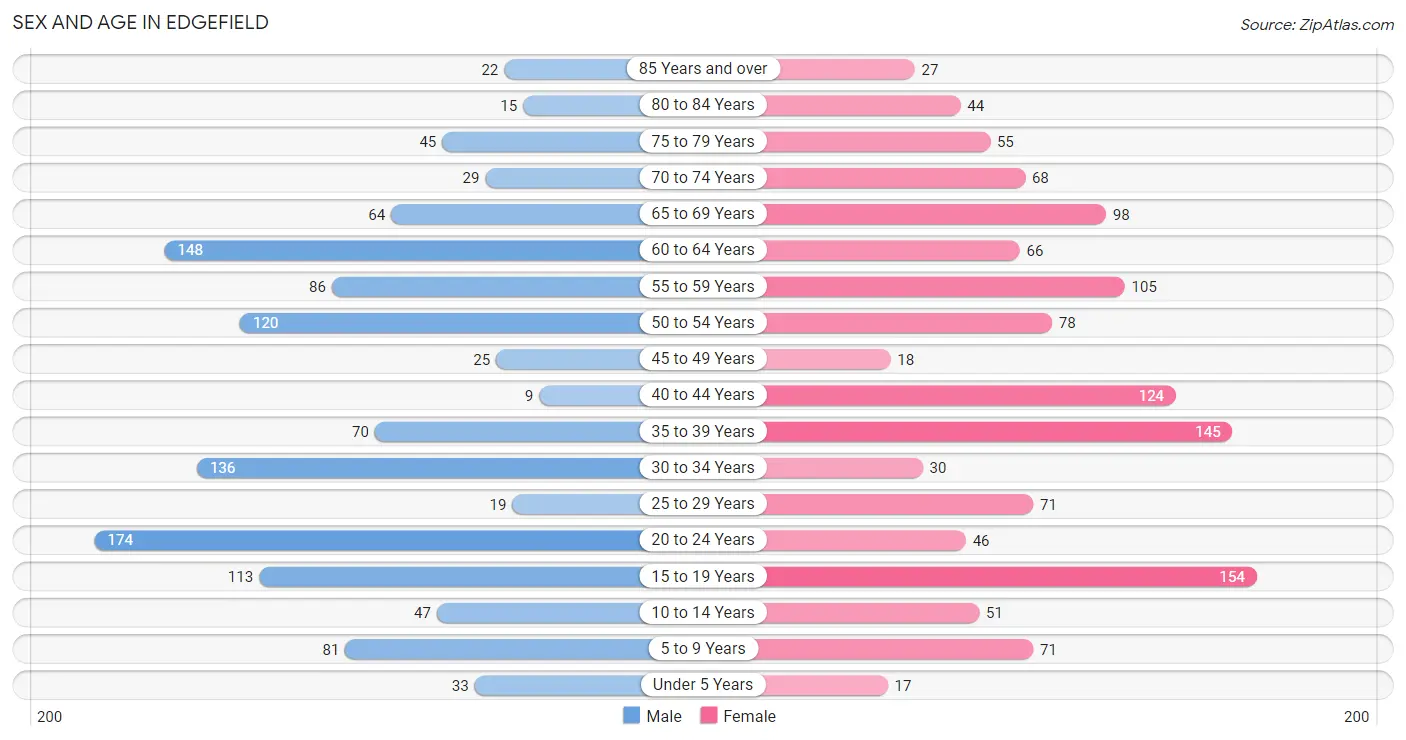
| Age Bracket | Male | Female |
| Under 5 Years | 33 (2.7%) | 17 (1.3%) |
| 5 to 9 Years | 81 (6.6%) | 71 (5.6%) |
| 10 to 14 Years | 47 (3.8%) | 51 (4.0%) |
| 15 to 19 Years | 113 (9.1%) | 154 (12.1%) |
| 20 to 24 Years | 174 (14.1%) | 46 (3.6%) |
| 25 to 29 Years | 19 (1.5%) | 71 (5.6%) |
| 30 to 34 Years | 136 (11.0%) | 30 (2.4%) |
| 35 to 39 Years | 70 (5.7%) | 145 (11.4%) |
| 40 to 44 Years | 9 (0.7%) | 124 (9.8%) |
| 45 to 49 Years | 25 (2.0%) | 18 (1.4%) |
| 50 to 54 Years | 120 (9.7%) | 78 (6.1%) |
| 55 to 59 Years | 86 (7.0%) | 105 (8.3%) |
| 60 to 64 Years | 148 (12.0%) | 66 (5.2%) |
| 65 to 69 Years | 64 (5.2%) | 98 (7.7%) |
| 70 to 74 Years | 29 (2.4%) | 68 (5.4%) |
| 75 to 79 Years | 45 (3.6%) | 55 (4.3%) |
| 80 to 84 Years | 15 (1.2%) | 44 (3.5%) |
| 85 Years and over | 22 (1.8%) | 27 (2.1%) |
| Total | 1,236 (100.0%) | 1,268 (100.0%) |
Families and Households in Edgefield
Median Family Size in Edgefield
The median family size in Edgefield is 2.85 persons per family, with single male/father families (35 | 5.1%) accounting for the largest median family size of 3.43 persons per family. On the other hand, single female/mother families (299 | 43.8%) represent the smallest median family size with 2.80 persons per family.
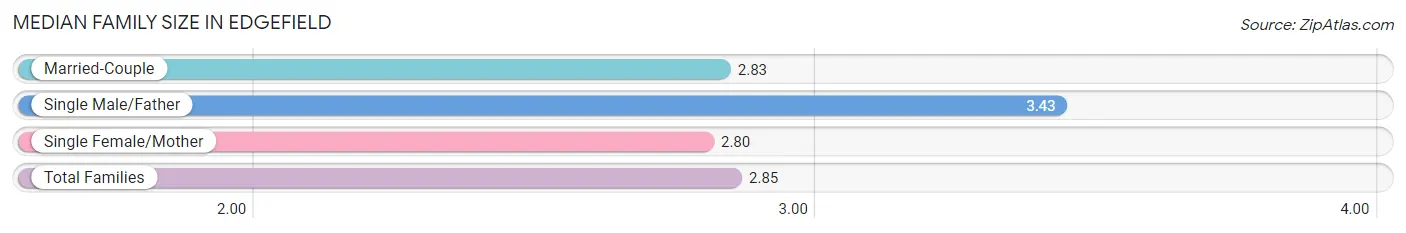
| Family Type | # Families | Family Size |
| Married-Couple | 348 (51.0%) | 2.83 |
| Single Male/Father | 35 (5.1%) | 3.43 |
| Single Female/Mother | 299 (43.8%) | 2.80 |
| Total Families | 682 (100.0%) | 2.85 |
Median Household Size in Edgefield
The median household size in Edgefield is 2.26 persons per household, with single male/father households (35 | 3.3%) accounting for the largest median household size of 3.43 persons per household. non-family households (368 | 35.0%) represent the smallest median household size with 1.08 persons per household.
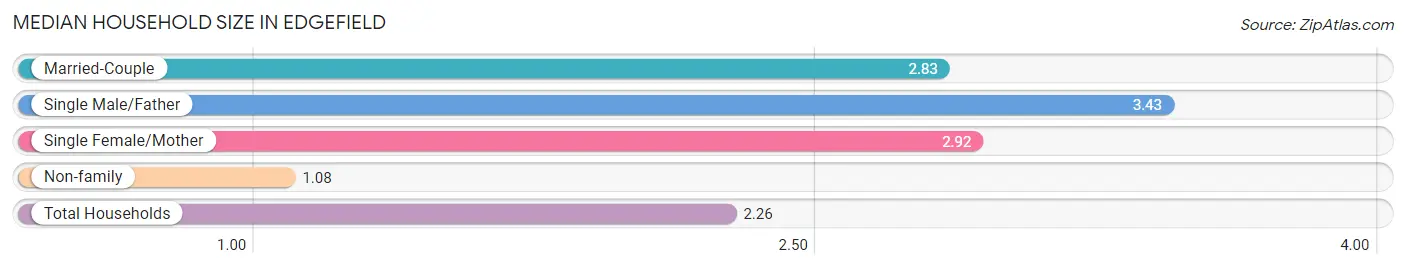
| Household Type | # Households | Household Size |
| Married-Couple | 348 (33.1%) | 2.83 |
| Single Male/Father | 35 (3.3%) | 3.43 |
| Single Female/Mother | 299 (28.5%) | 2.92 |
| Non-family | 368 (35.0%) | 1.08 |
| Total Households | 1,050 (100.0%) | 2.26 |
Household Size by Marriage Status in Edgefield
Out of a total of 1,050 households in Edgefield, 682 (64.9%) are family households, while 368 (35.0%) are nonfamily households. The most numerous type of family households are 2-person households, comprising 304, and the most common type of nonfamily households are 1-person households, comprising 314.
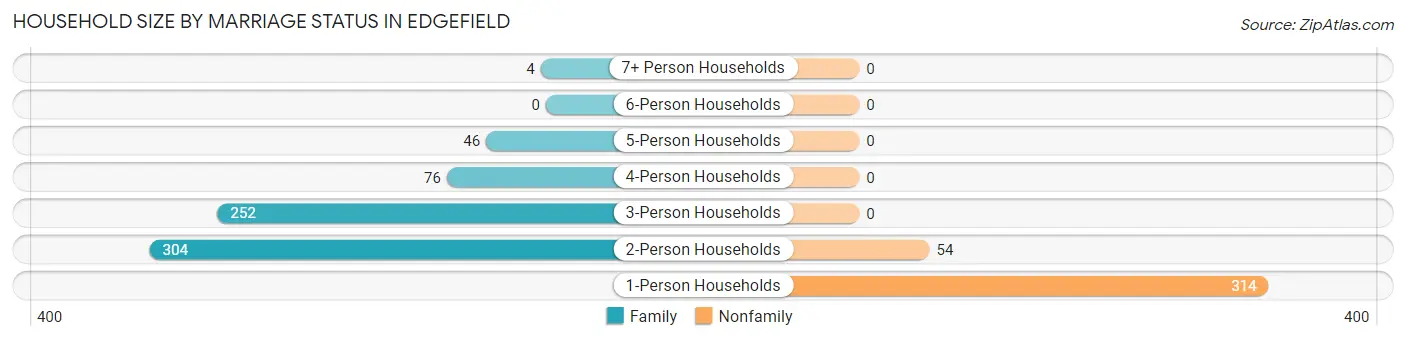
| Household Size | Family Households | Nonfamily Households |
| 1-Person Households | - | 314 (29.9%) |
| 2-Person Households | 304 (28.9%) | 54 (5.1%) |
| 3-Person Households | 252 (24.0%) | 0 (0.0%) |
| 4-Person Households | 76 (7.2%) | 0 (0.0%) |
| 5-Person Households | 46 (4.4%) | 0 (0.0%) |
| 6-Person Households | 0 (0.0%) | 0 (0.0%) |
| 7+ Person Households | 4 (0.4%) | 0 (0.0%) |
| Total | 682 (64.9%) | 368 (35.0%) |
Female Fertility in Edgefield
Fertility by Age in Edgefield
| Age Bracket | Women with Births | Births / 1,000 Women |
| 15 to 19 years | 0 (0.0%) | 0.0 |
| 20 to 34 years | 0 (0.0%) | 0.0 |
| 35 to 50 years | 0 (0.0%) | 0.0 |
| Total | 0 (0.0%) | 0.0 |
Fertility by Age by Marriage Status in Edgefield
| Age Bracket | Married | Unmarried |
| 15 to 19 years | 0 (0.0%) | 0 (0.0%) |
| 20 to 34 years | 0 (0.0%) | 0 (0.0%) |
| 35 to 50 years | 0 (0.0%) | 0 (0.0%) |
| Total | 0 (0.0%) | 0 (0.0%) |
Fertility by Education in Edgefield
| Educational Attainment | Women with Births | Births / 1,000 Women |
| Less than High School | 0 (0.0%) | 0.0 |
| High School Diploma | 0 (0.0%) | 0.0 |
| College or Associate's Degree | 0 (0.0%) | 0.0 |
| Bachelor's Degree | 0 (0.0%) | 0.0 |
| Graduate Degree | 0 (0.0%) | 0.0 |
| Total | 0 (0.0%) | 0.0 |
Fertility by Education by Marriage Status in Edgefield
| Educational Attainment | Married | Unmarried |
| Less than High School | 0 (0.0%) | 0 (0.0%) |
| High School Diploma | 0 (0.0%) | 0 (0.0%) |
| College or Associate's Degree | 0 (0.0%) | 0 (0.0%) |
| Bachelor's Degree | 0 (0.0%) | 0 (0.0%) |
| Graduate Degree | 0 (0.0%) | 0 (0.0%) |
| Total | 0 (0.0%) | 0 (0.0%) |
Employment Characteristics in Edgefield
Employment by Class of Employer in Edgefield
Among the 992 employed individuals in Edgefield, private company employees (625 | 63.0%), federal government employees (113 | 11.4%), and not-for-profit organizations (79 | 8.0%) make up the most common classes of employment.
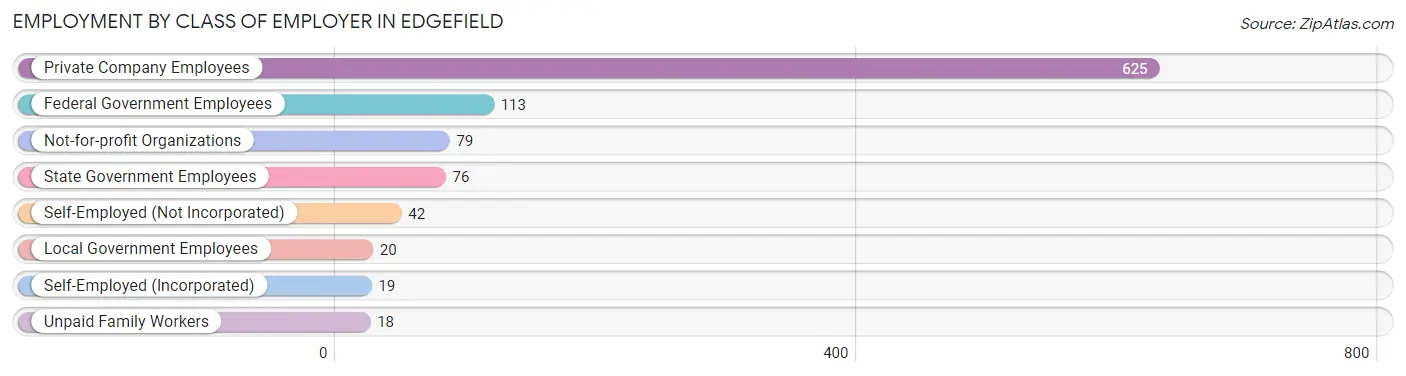
| Employer Class | # Employees | % Employees |
| Private Company Employees | 625 | 63.0% |
| Self-Employed (Incorporated) | 19 | 1.9% |
| Self-Employed (Not Incorporated) | 42 | 4.2% |
| Not-for-profit Organizations | 79 | 8.0% |
| Local Government Employees | 20 | 2.0% |
| State Government Employees | 76 | 7.7% |
| Federal Government Employees | 113 | 11.4% |
| Unpaid Family Workers | 18 | 1.8% |
| Total | 992 | 100.0% |
Employment Status by Age in Edgefield
According to the labor force statistics for Edgefield, out of the total population over 16 years of age (2,157), 55.6% or 1,199 individuals are in the labor force, with 16.9% or 203 of them unemployed. The age group with the highest labor force participation rate is 30 to 34 years, with 83.7% or 139 individuals in the labor force. Within the labor force, the 30 to 34 years age range has the highest percentage of unemployed individuals, with 58.3% or 81 of them being unemployed.
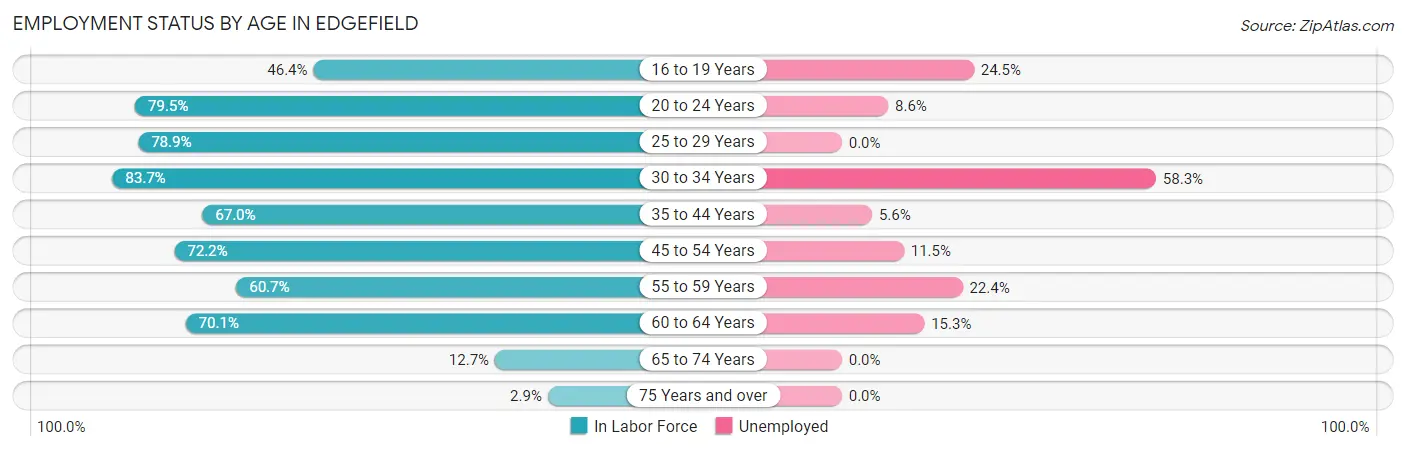
| Age Bracket | In Labor Force | Unemployed |
| 16 to 19 Years | 102 (46.4%) | 25 (24.5%) |
| 20 to 24 Years | 175 (79.5%) | 15 (8.6%) |
| 25 to 29 Years | 71 (78.9%) | 0 (0.0%) |
| 30 to 34 Years | 139 (83.7%) | 81 (58.3%) |
| 35 to 44 Years | 233 (67.0%) | 13 (5.6%) |
| 45 to 54 Years | 174 (72.2%) | 20 (11.5%) |
| 55 to 59 Years | 116 (60.7%) | 26 (22.4%) |
| 60 to 64 Years | 150 (70.1%) | 23 (15.3%) |
| 65 to 74 Years | 33 (12.7%) | 0 (0.0%) |
| 75 Years and over | 6 (2.9%) | 0 (0.0%) |
| Total | 1,199 (55.6%) | 203 (16.9%) |
Employment Status by Educational Attainment in Edgefield
According to labor force statistics for Edgefield, 70.6% of individuals (882) out of the total population between 25 and 64 years of age (1,250) are in the labor force, with 18.5% or 163 of them being unemployed. The group with the highest labor force participation rate are those with the educational attainment of bachelor's degree or higher, with 91.6% or 250 individuals in the labor force. Within the labor force, individuals with less than high school education have the highest percentage of unemployment, with 75.6% or 124 of them being unemployed.
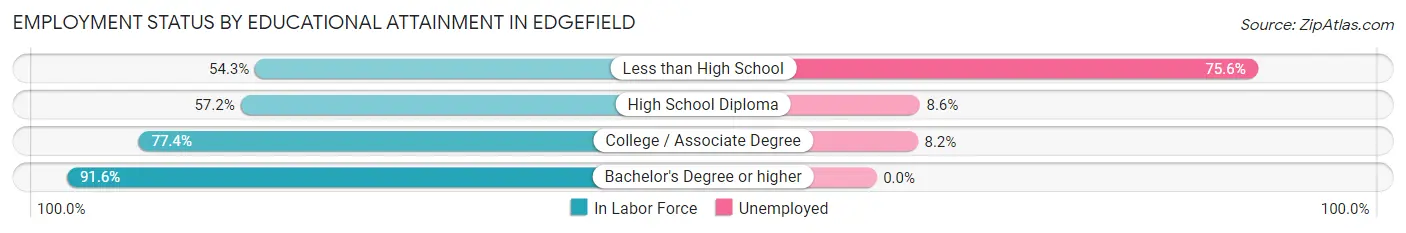
| Educational Attainment | In Labor Force | Unemployed |
| Less than High School | 164 (54.3%) | 228 (75.6%) |
| High School Diploma | 151 (57.2%) | 23 (8.6%) |
| College / Associate Degree | 318 (77.4%) | 34 (8.2%) |
| Bachelor's Degree or higher | 250 (91.6%) | 0 (0.0%) |
| Total | 882 (70.6%) | 231 (18.5%) |
Employment Occupations by Sex in Edgefield
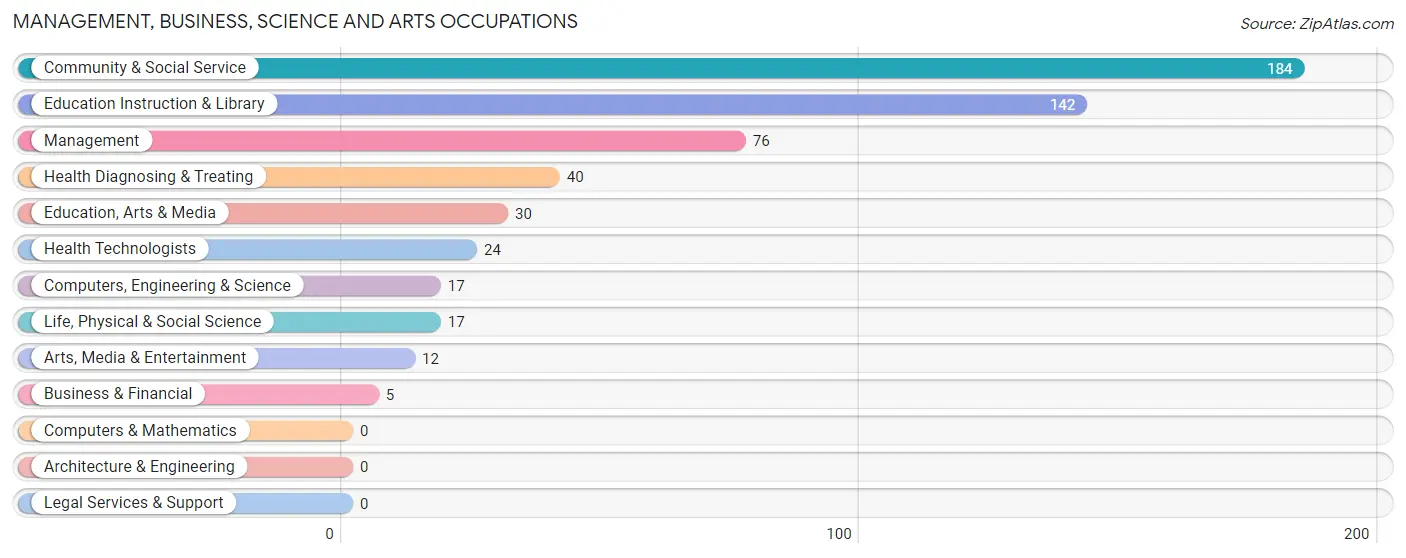
Management, Business, Science and Arts Occupations
The most common Management, Business, Science and Arts occupations in Edgefield are Community & Social Service (184 | 18.5%), Education Instruction & Library (142 | 14.3%), Management (76 | 7.6%), Health Diagnosing & Treating (40 | 4.0%), and Education, Arts & Media (30 | 3.0%).
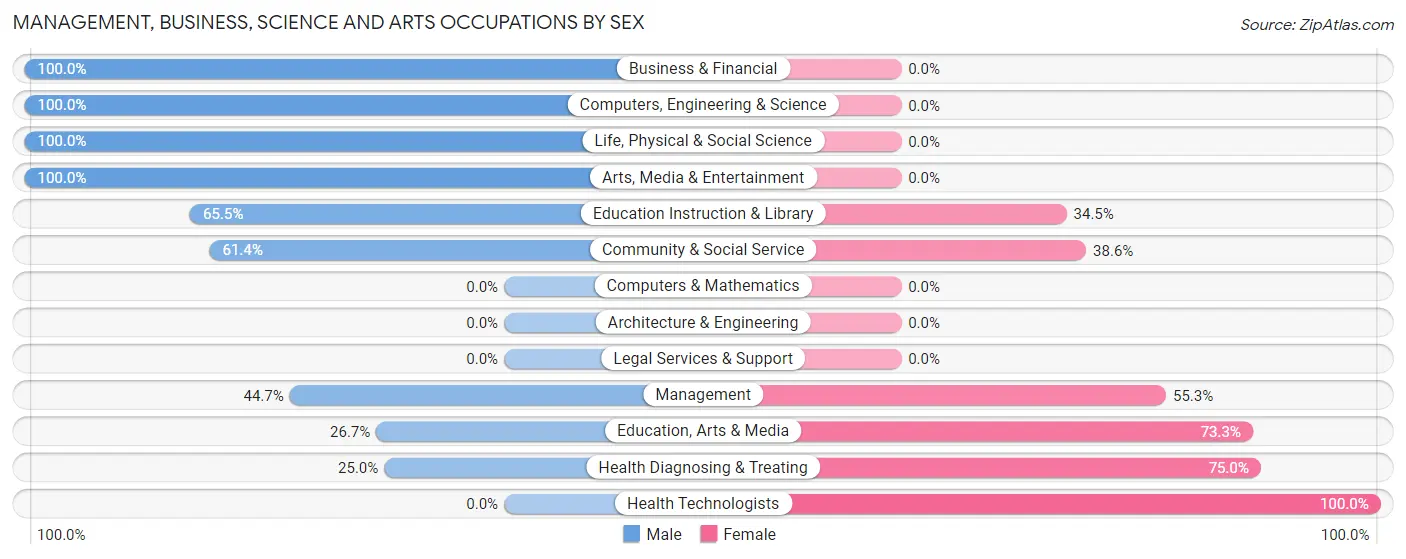
Management, Business, Science and Arts Occupations by Sex
Within the Management, Business, Science and Arts occupations in Edgefield, the most male-oriented occupations are Business & Financial (100.0%), Computers, Engineering & Science (100.0%), and Life, Physical & Social Science (100.0%), while the most female-oriented occupations are Health Technologists (100.0%), Health Diagnosing & Treating (75.0%), and Education, Arts & Media (73.3%).
| Occupation | Male | Female |
| Management | 34 (44.7%) | 42 (55.3%) |
| Business & Financial | 5 (100.0%) | 0 (0.0%) |
| Computers, Engineering & Science | 17 (100.0%) | 0 (0.0%) |
| Computers & Mathematics | 0 (0.0%) | 0 (0.0%) |
| Architecture & Engineering | 0 (0.0%) | 0 (0.0%) |
| Life, Physical & Social Science | 17 (100.0%) | 0 (0.0%) |
| Community & Social Service | 113 (61.4%) | 71 (38.6%) |
| Education, Arts & Media | 8 (26.7%) | 22 (73.3%) |
| Legal Services & Support | 0 (0.0%) | 0 (0.0%) |
| Education Instruction & Library | 93 (65.5%) | 49 (34.5%) |
| Arts, Media & Entertainment | 12 (100.0%) | 0 (0.0%) |
| Health Diagnosing & Treating | 10 (25.0%) | 30 (75.0%) |
| Health Technologists | 0 (0.0%) | 24 (100.0%) |
| Total (Category) | 179 (55.6%) | 143 (44.4%) |
| Total (Overall) | 517 (51.9%) | 479 (48.1%) |
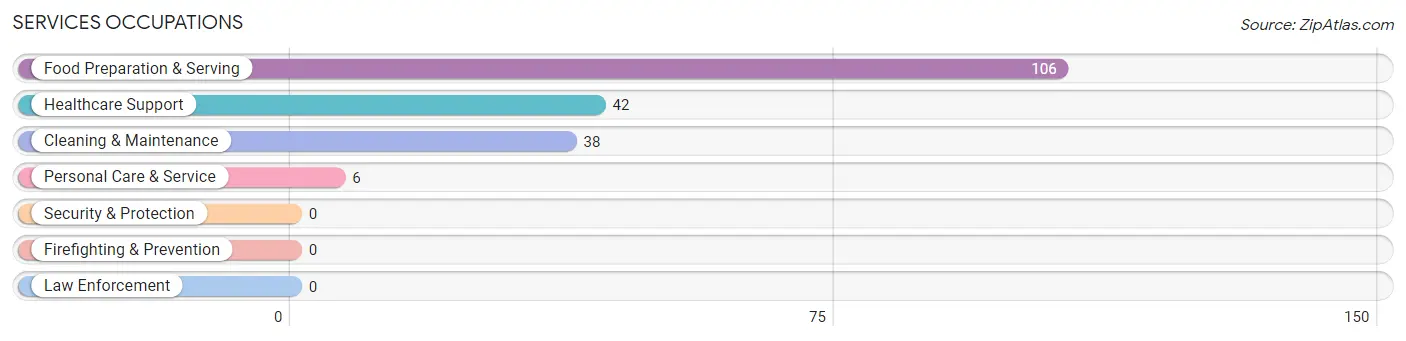
Services Occupations
The most common Services occupations in Edgefield are Food Preparation & Serving (106 | 10.6%), Healthcare Support (42 | 4.2%), Cleaning & Maintenance (38 | 3.8%), and Personal Care & Service (6 | 0.6%).
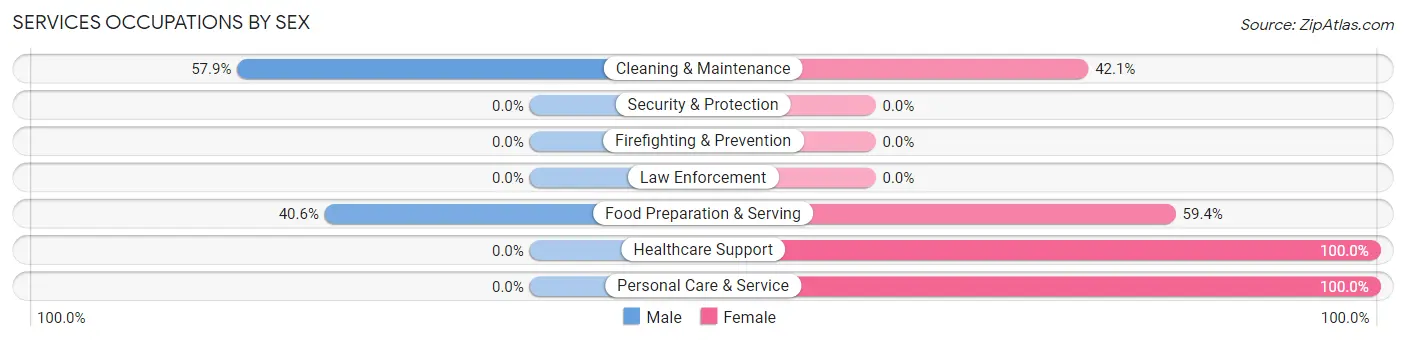
Services Occupations by Sex
Within the Services occupations in Edgefield, the most male-oriented occupations are Cleaning & Maintenance (57.9%), and Food Preparation & Serving (40.6%), while the most female-oriented occupations are Healthcare Support (100.0%), Personal Care & Service (100.0%), and Food Preparation & Serving (59.4%).
| Occupation | Male | Female |
| Healthcare Support | 0 (0.0%) | 42 (100.0%) |
| Security & Protection | 0 (0.0%) | 0 (0.0%) |
| Firefighting & Prevention | 0 (0.0%) | 0 (0.0%) |
| Law Enforcement | 0 (0.0%) | 0 (0.0%) |
| Food Preparation & Serving | 43 (40.6%) | 63 (59.4%) |
| Cleaning & Maintenance | 22 (57.9%) | 16 (42.1%) |
| Personal Care & Service | 0 (0.0%) | 6 (100.0%) |
| Total (Category) | 65 (33.9%) | 127 (66.1%) |
| Total (Overall) | 517 (51.9%) | 479 (48.1%) |
Sales and Office Occupations
The most common Sales and Office occupations in Edgefield are Sales & Related (127 | 12.8%), and Office & Administration (126 | 12.7%).
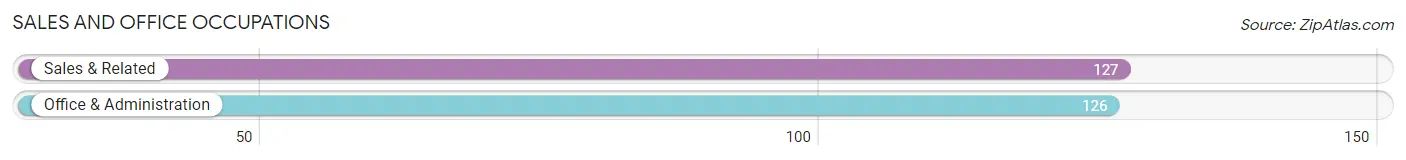
Sales and Office Occupations by Sex
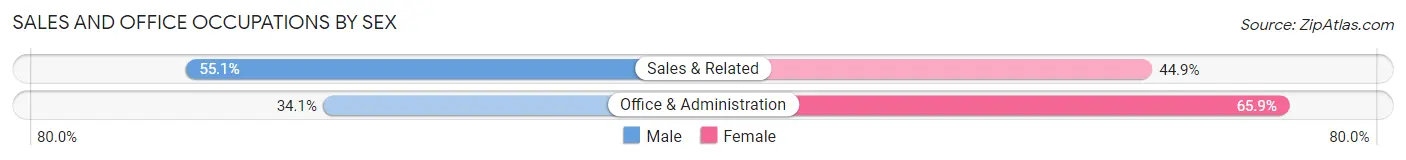
| Occupation | Male | Female |
| Sales & Related | 70 (55.1%) | 57 (44.9%) |
| Office & Administration | 43 (34.1%) | 83 (65.9%) |
| Total (Category) | 113 (44.7%) | 140 (55.3%) |
| Total (Overall) | 517 (51.9%) | 479 (48.1%) |
Natural Resources, Construction and Maintenance Occupations
The most common Natural Resources, Construction and Maintenance occupations in Edgefield are Construction & Extraction (15 | 1.5%), and Farming, Fishing & Forestry (9 | 0.9%).
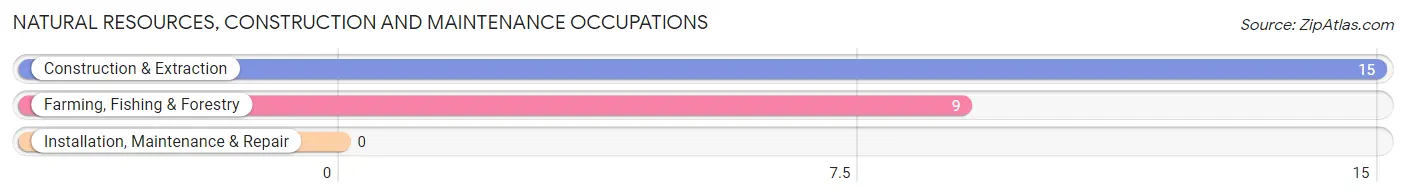
Natural Resources, Construction and Maintenance Occupations by Sex
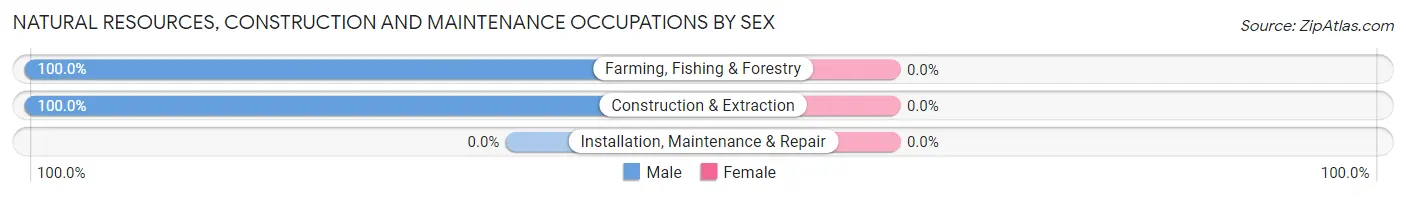
| Occupation | Male | Female |
| Farming, Fishing & Forestry | 9 (100.0%) | 0 (0.0%) |
| Construction & Extraction | 15 (100.0%) | 0 (0.0%) |
| Installation, Maintenance & Repair | 0 (0.0%) | 0 (0.0%) |
| Total (Category) | 24 (100.0%) | 0 (0.0%) |
| Total (Overall) | 517 (51.9%) | 479 (48.1%) |
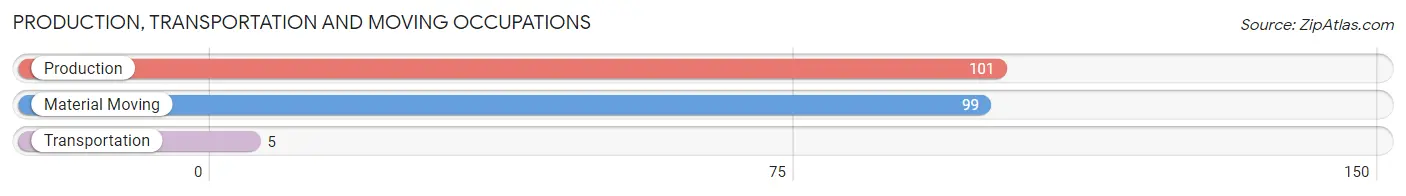
Production, Transportation and Moving Occupations
The most common Production, Transportation and Moving occupations in Edgefield are Production (101 | 10.1%), Material Moving (99 | 9.9%), and Transportation (5 | 0.5%).
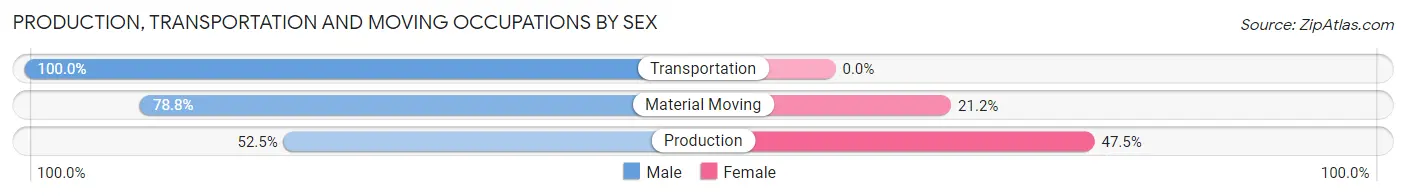
Production, Transportation and Moving Occupations by Sex
| Occupation | Male | Female |
| Production | 53 (52.5%) | 48 (47.5%) |
| Transportation | 5 (100.0%) | 0 (0.0%) |
| Material Moving | 78 (78.8%) | 21 (21.2%) |
| Total (Category) | 136 (66.3%) | 69 (33.7%) |
| Total (Overall) | 517 (51.9%) | 479 (48.1%) |
Employment Industries by Sex in Edgefield
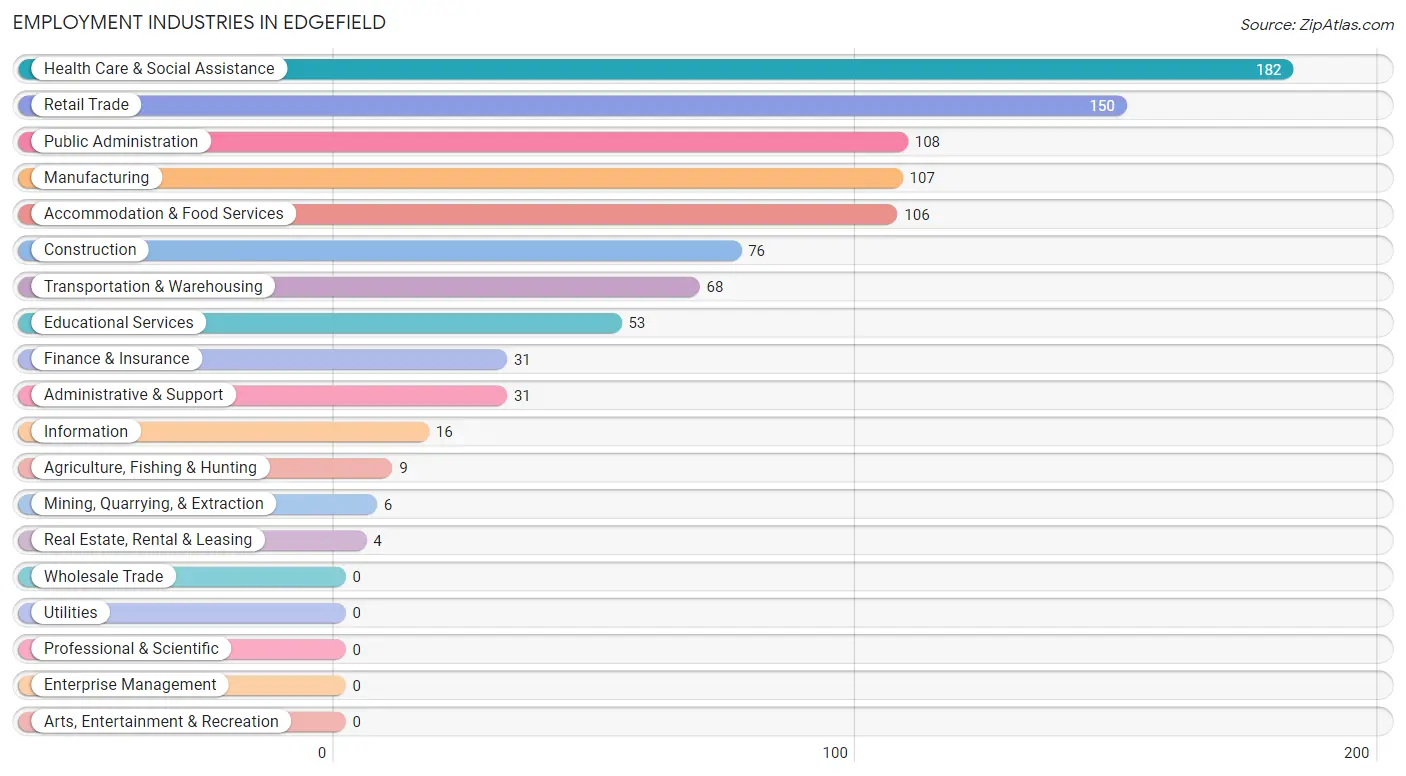
Employment Industries in Edgefield
The major employment industries in Edgefield include Health Care & Social Assistance (182 | 18.3%), Retail Trade (150 | 15.1%), Public Administration (108 | 10.8%), Manufacturing (107 | 10.7%), and Accommodation & Food Services (106 | 10.6%).
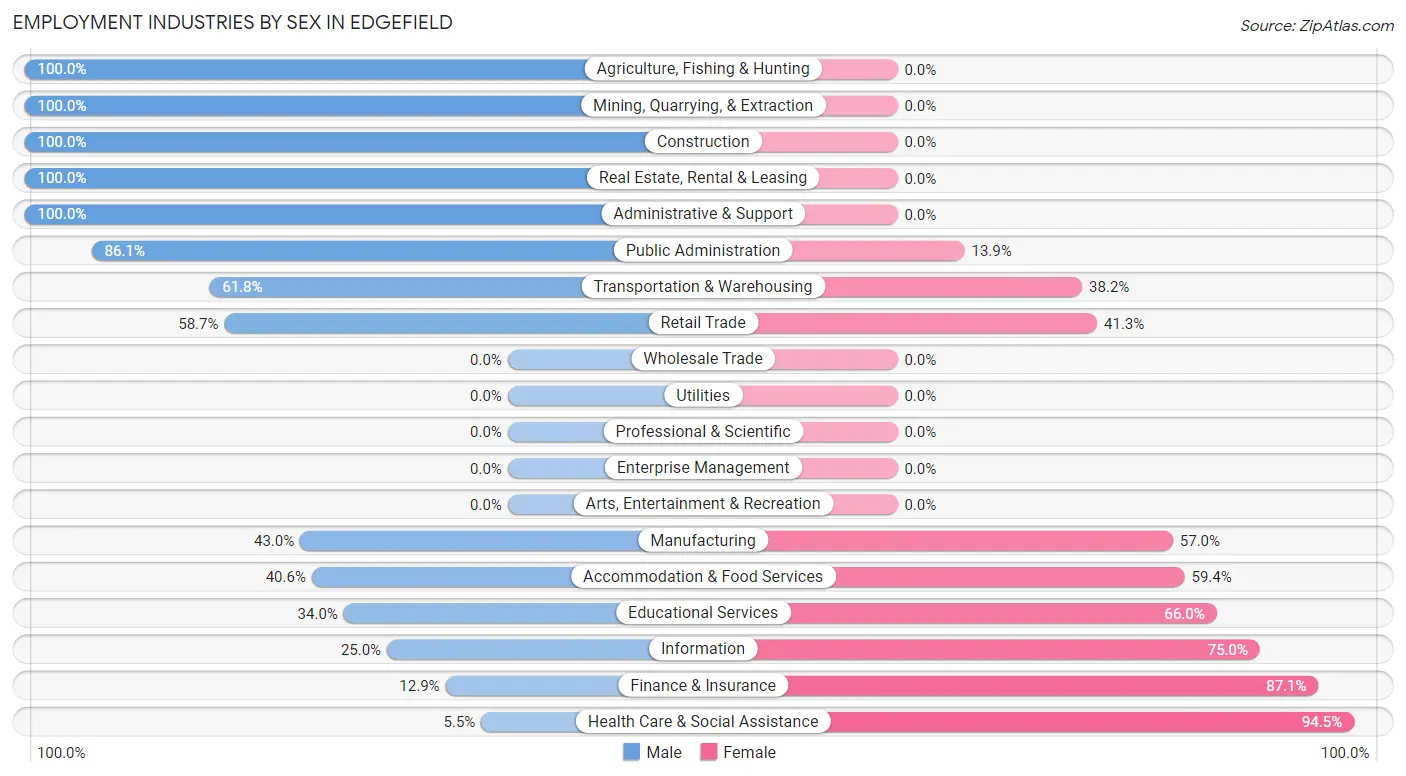
Employment Industries by Sex in Edgefield
The Edgefield industries that see more men than women are Agriculture, Fishing & Hunting (100.0%), Mining, Quarrying, & Extraction (100.0%), and Construction (100.0%), whereas the industries that tend to have a higher number of women are Health Care & Social Assistance (94.5%), Finance & Insurance (87.1%), and Information (75.0%).
| Industry | Male | Female |
| Agriculture, Fishing & Hunting | 9 (100.0%) | 0 (0.0%) |
| Mining, Quarrying, & Extraction | 6 (100.0%) | 0 (0.0%) |
| Construction | 76 (100.0%) | 0 (0.0%) |
| Manufacturing | 46 (43.0%) | 61 (57.0%) |
| Wholesale Trade | 0 (0.0%) | 0 (0.0%) |
| Retail Trade | 88 (58.7%) | 62 (41.3%) |
| Transportation & Warehousing | 42 (61.8%) | 26 (38.2%) |
| Utilities | 0 (0.0%) | 0 (0.0%) |
| Information | 4 (25.0%) | 12 (75.0%) |
| Finance & Insurance | 4 (12.9%) | 27 (87.1%) |
| Real Estate, Rental & Leasing | 4 (100.0%) | 0 (0.0%) |
| Professional & Scientific | 0 (0.0%) | 0 (0.0%) |
| Enterprise Management | 0 (0.0%) | 0 (0.0%) |
| Administrative & Support | 31 (100.0%) | 0 (0.0%) |
| Educational Services | 18 (34.0%) | 35 (66.0%) |
| Health Care & Social Assistance | 10 (5.5%) | 172 (94.5%) |
| Arts, Entertainment & Recreation | 0 (0.0%) | 0 (0.0%) |
| Accommodation & Food Services | 43 (40.6%) | 63 (59.4%) |
| Public Administration | 93 (86.1%) | 15 (13.9%) |
| Total | 517 (51.9%) | 479 (48.1%) |
Education in Edgefield
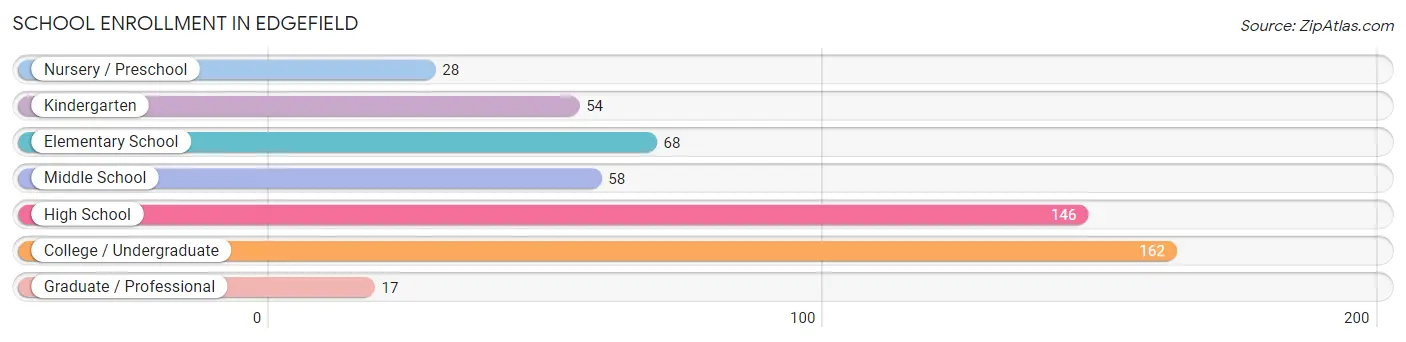
School Enrollment in Edgefield
The most common levels of schooling among the 533 students in Edgefield are college / undergraduate (162 | 30.4%), high school (146 | 27.4%), and elementary school (68 | 12.8%).
| School Level | # Students | % Students |
| Nursery / Preschool | 28 | 5.2% |
| Kindergarten | 54 | 10.1% |
| Elementary School | 68 | 12.8% |
| Middle School | 58 | 10.9% |
| High School | 146 | 27.4% |
| College / Undergraduate | 162 | 30.4% |
| Graduate / Professional | 17 | 3.2% |
| Total | 533 | 100.0% |
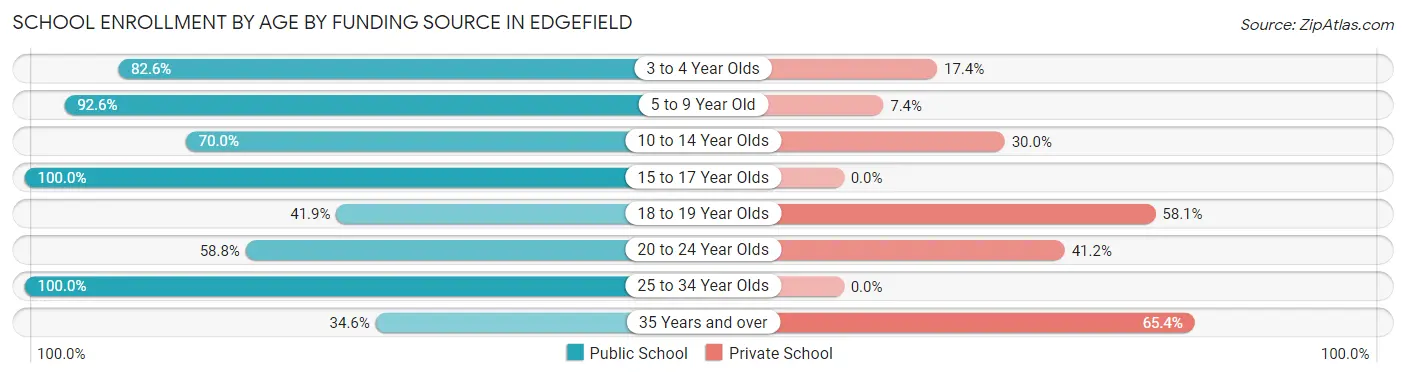
School Enrollment by Age by Funding Source in Edgefield
Out of a total of 533 students who are enrolled in schools in Edgefield, 124 (23.3%) attend a private institution, while the remaining 409 (76.7%) are enrolled in public schools. The age group of 35 years and over has the highest likelihood of being enrolled in private schools, with 17 (65.4% in the age bracket) enrolled. Conversely, the age group of 15 to 17 year olds has the lowest likelihood of being enrolled in a private school, with 106 (100.0% in the age bracket) attending a public institution.
| Age Bracket | Public School | Private School |
| 3 to 4 Year Olds | 19 (82.6%) | 4 (17.4%) |
| 5 to 9 Year Old | 113 (92.6%) | 9 (7.4%) |
| 10 to 14 Year Olds | 63 (70.0%) | 27 (30.0%) |
| 15 to 17 Year Olds | 106 (100.0%) | 0 (0.0%) |
| 18 to 19 Year Olds | 13 (41.9%) | 18 (58.1%) |
| 20 to 24 Year Olds | 70 (58.8%) | 49 (41.2%) |
| 25 to 34 Year Olds | 16 (100.0%) | 0 (0.0%) |
| 35 Years and over | 9 (34.6%) | 17 (65.4%) |
| Total | 409 (76.7%) | 124 (23.3%) |
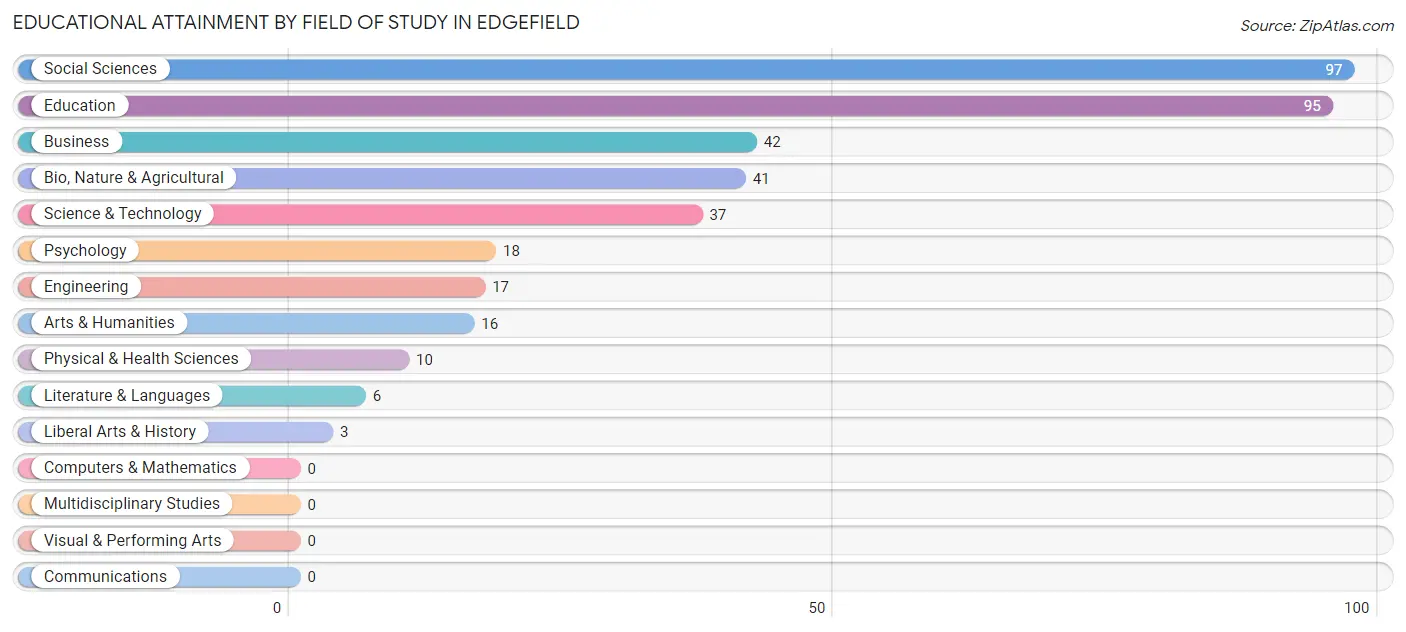
Educational Attainment by Field of Study in Edgefield
Social sciences (97 | 25.4%), education (95 | 24.9%), business (42 | 11.0%), bio, nature & agricultural (41 | 10.7%), and science & technology (37 | 9.7%) are the most common fields of study among 382 individuals in Edgefield who have obtained a bachelor's degree or higher.
| Field of Study | # Graduates | % Graduates |
| Computers & Mathematics | 0 | 0.0% |
| Bio, Nature & Agricultural | 41 | 10.7% |
| Physical & Health Sciences | 10 | 2.6% |
| Psychology | 18 | 4.7% |
| Social Sciences | 97 | 25.4% |
| Engineering | 17 | 4.4% |
| Multidisciplinary Studies | 0 | 0.0% |
| Science & Technology | 37 | 9.7% |
| Business | 42 | 11.0% |
| Education | 95 | 24.9% |
| Literature & Languages | 6 | 1.6% |
| Liberal Arts & History | 3 | 0.8% |
| Visual & Performing Arts | 0 | 0.0% |
| Communications | 0 | 0.0% |
| Arts & Humanities | 16 | 4.2% |
| Total | 382 | 100.0% |
Transportation & Commute in Edgefield
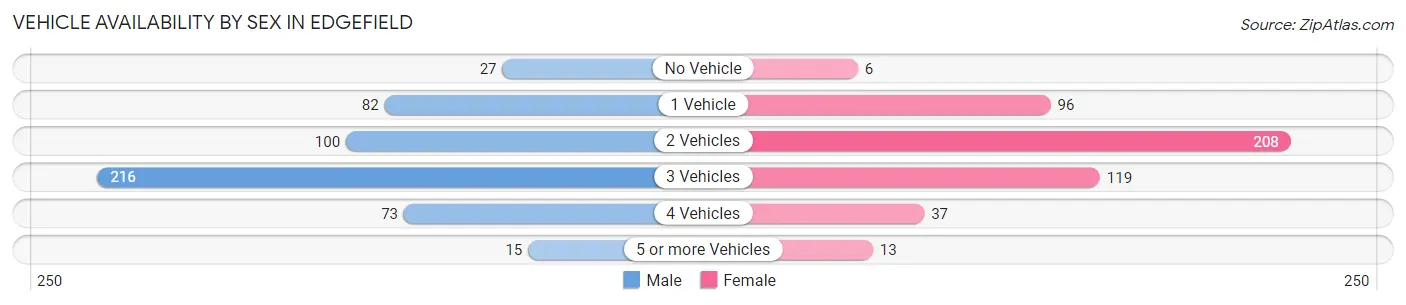
Vehicle Availability by Sex in Edgefield
The most prevalent vehicle ownership categories in Edgefield are males with 3 vehicles (216, accounting for 42.1%) and females with 3 vehicles (119, making up 45.1%).
| Vehicles Available | Male | Female |
| No Vehicle | 27 (5.3%) | 6 (1.3%) |
| 1 Vehicle | 82 (16.0%) | 96 (20.0%) |
| 2 Vehicles | 100 (19.5%) | 208 (43.4%) |
| 3 Vehicles | 216 (42.1%) | 119 (24.8%) |
| 4 Vehicles | 73 (14.2%) | 37 (7.7%) |
| 5 or more Vehicles | 15 (2.9%) | 13 (2.7%) |
| Total | 513 (100.0%) | 479 (100.0%) |
Commute Time in Edgefield
The most frequently occuring commute durations in Edgefield are 10 to 14 minutes (146 commuters, 15.1%), 5 to 9 minutes (130 commuters, 13.4%), and 15 to 19 minutes (112 commuters, 11.6%).
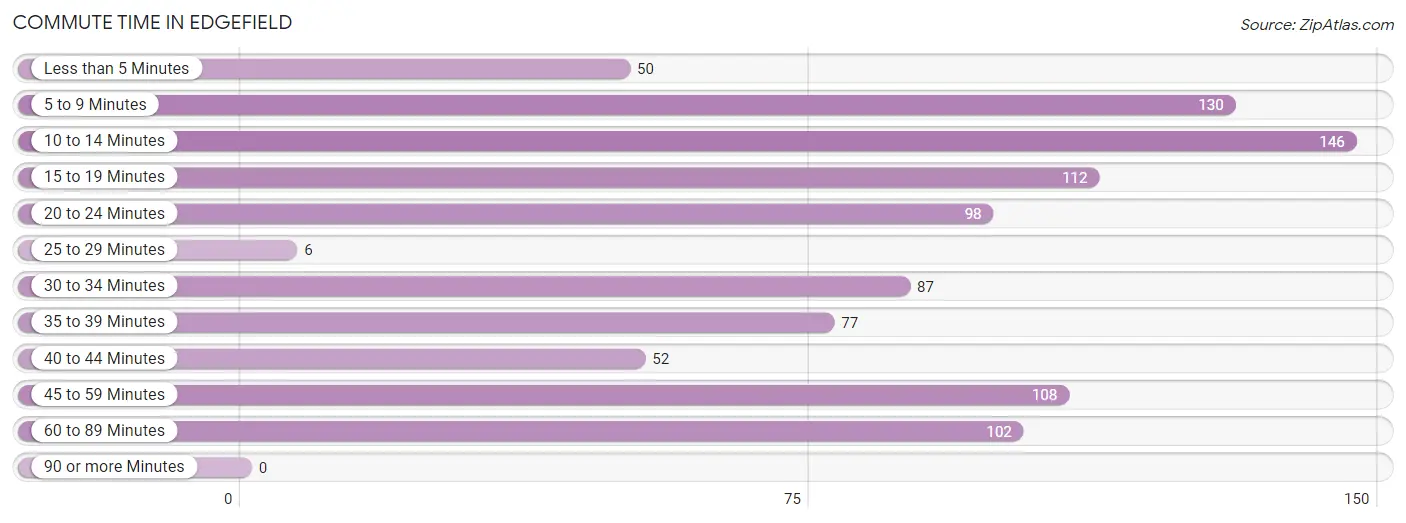
| Commute Time | # Commuters | % Commuters |
| Less than 5 Minutes | 50 | 5.2% |
| 5 to 9 Minutes | 130 | 13.4% |
| 10 to 14 Minutes | 146 | 15.1% |
| 15 to 19 Minutes | 112 | 11.6% |
| 20 to 24 Minutes | 98 | 10.1% |
| 25 to 29 Minutes | 6 | 0.6% |
| 30 to 34 Minutes | 87 | 9.0% |
| 35 to 39 Minutes | 77 | 8.0% |
| 40 to 44 Minutes | 52 | 5.4% |
| 45 to 59 Minutes | 108 | 11.2% |
| 60 to 89 Minutes | 102 | 10.5% |
| 90 or more Minutes | 0 | 0.0% |
Commute Time by Sex in Edgefield
The most common commute times in Edgefield are 60 to 89 minutes (99 commuters, 20.3%) for males and 10 to 14 minutes (115 commuters, 24.0%) for females.
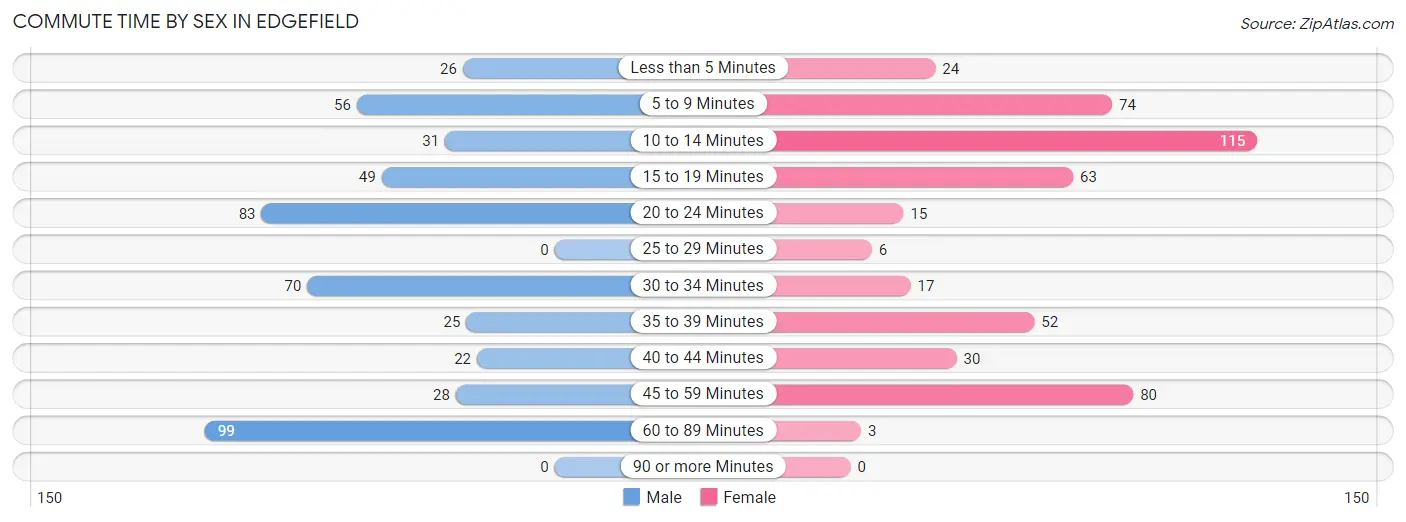
| Commute Time | Male | Female |
| Less than 5 Minutes | 26 (5.3%) | 24 (5.0%) |
| 5 to 9 Minutes | 56 (11.5%) | 74 (15.4%) |
| 10 to 14 Minutes | 31 (6.3%) | 115 (24.0%) |
| 15 to 19 Minutes | 49 (10.0%) | 63 (13.2%) |
| 20 to 24 Minutes | 83 (17.0%) | 15 (3.1%) |
| 25 to 29 Minutes | 0 (0.0%) | 6 (1.3%) |
| 30 to 34 Minutes | 70 (14.3%) | 17 (3.5%) |
| 35 to 39 Minutes | 25 (5.1%) | 52 (10.9%) |
| 40 to 44 Minutes | 22 (4.5%) | 30 (6.3%) |
| 45 to 59 Minutes | 28 (5.7%) | 80 (16.7%) |
| 60 to 89 Minutes | 99 (20.3%) | 3 (0.6%) |
| 90 or more Minutes | 0 (0.0%) | 0 (0.0%) |
Time of Departure to Work by Sex in Edgefield
The most frequent times of departure to work in Edgefield are 5:30 AM to 5:59 AM (126, 25.8%) for males and 7:00 AM to 7:29 AM (80, 16.7%) for females.
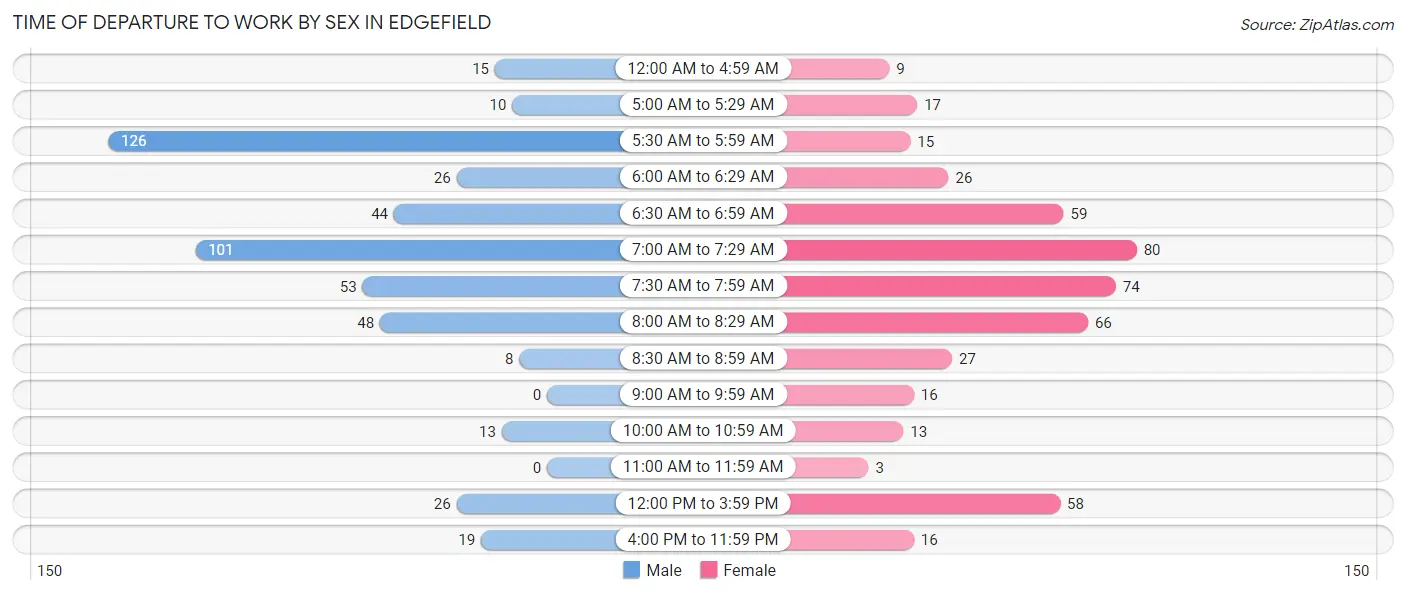
| Time of Departure | Male | Female |
| 12:00 AM to 4:59 AM | 15 (3.1%) | 9 (1.9%) |
| 5:00 AM to 5:29 AM | 10 (2.0%) | 17 (3.5%) |
| 5:30 AM to 5:59 AM | 126 (25.8%) | 15 (3.1%) |
| 6:00 AM to 6:29 AM | 26 (5.3%) | 26 (5.4%) |
| 6:30 AM to 6:59 AM | 44 (9.0%) | 59 (12.3%) |
| 7:00 AM to 7:29 AM | 101 (20.6%) | 80 (16.7%) |
| 7:30 AM to 7:59 AM | 53 (10.8%) | 74 (15.4%) |
| 8:00 AM to 8:29 AM | 48 (9.8%) | 66 (13.8%) |
| 8:30 AM to 8:59 AM | 8 (1.6%) | 27 (5.6%) |
| 9:00 AM to 9:59 AM | 0 (0.0%) | 16 (3.3%) |
| 10:00 AM to 10:59 AM | 13 (2.7%) | 13 (2.7%) |
| 11:00 AM to 11:59 AM | 0 (0.0%) | 3 (0.6%) |
| 12:00 PM to 3:59 PM | 26 (5.3%) | 58 (12.1%) |
| 4:00 PM to 11:59 PM | 19 (3.9%) | 16 (3.3%) |
| Total | 489 (100.0%) | 479 (100.0%) |
Housing Occupancy in Edgefield
Occupancy by Ownership in Edgefield
Of the total 1,050 dwellings in Edgefield, owner-occupied units account for 522 (49.7%), while renter-occupied units make up 528 (50.3%).
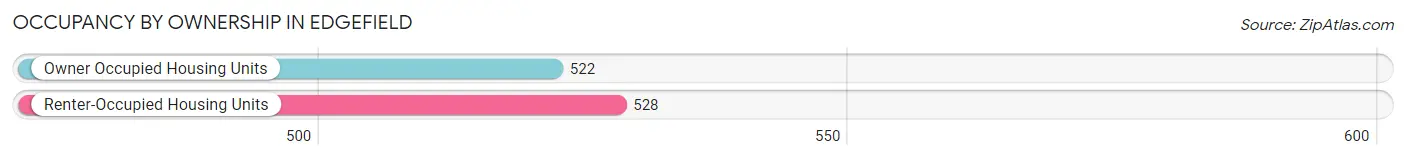
| Occupancy | # Housing Units | % Housing Units |
| Owner Occupied Housing Units | 522 | 49.7% |
| Renter-Occupied Housing Units | 528 | 50.3% |
| Total Occupied Housing Units | 1,050 | 100.0% |
Occupancy by Household Size in Edgefield
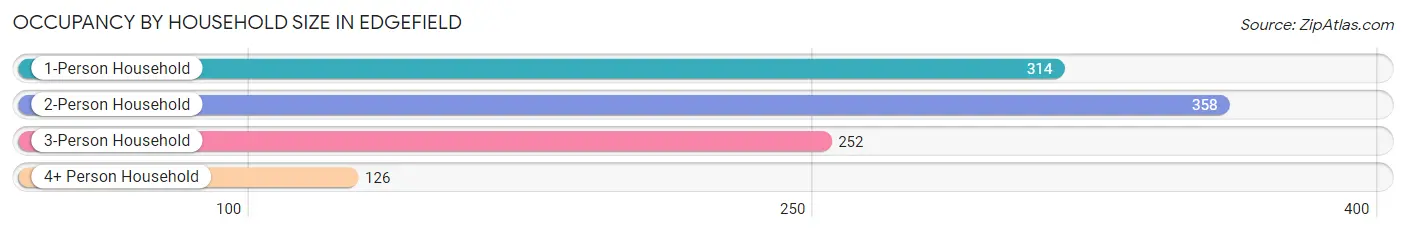
| Household Size | # Housing Units | % Housing Units |
| 1-Person Household | 314 | 29.9% |
| 2-Person Household | 358 | 34.1% |
| 3-Person Household | 252 | 24.0% |
| 4+ Person Household | 126 | 12.0% |
| Total Housing Units | 1,050 | 100.0% |
Occupancy by Ownership by Household Size in Edgefield
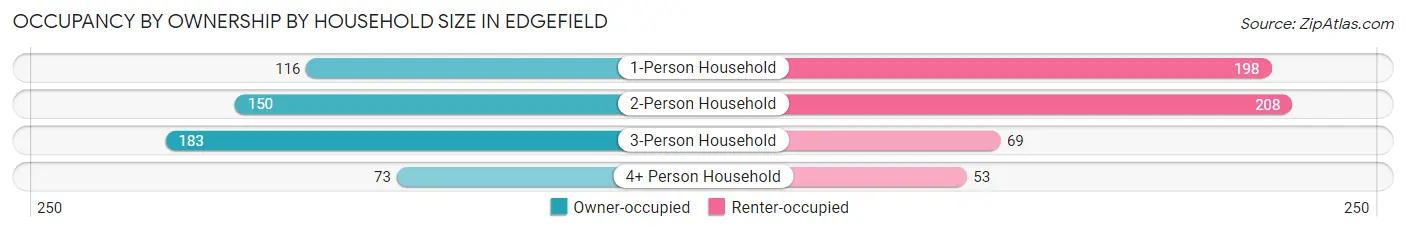
| Household Size | Owner-occupied | Renter-occupied |
| 1-Person Household | 116 (36.9%) | 198 (63.1%) |
| 2-Person Household | 150 (41.9%) | 208 (58.1%) |
| 3-Person Household | 183 (72.6%) | 69 (27.4%) |
| 4+ Person Household | 73 (57.9%) | 53 (42.1%) |
| Total Housing Units | 522 (49.7%) | 528 (50.3%) |
Occupancy by Educational Attainment in Edgefield
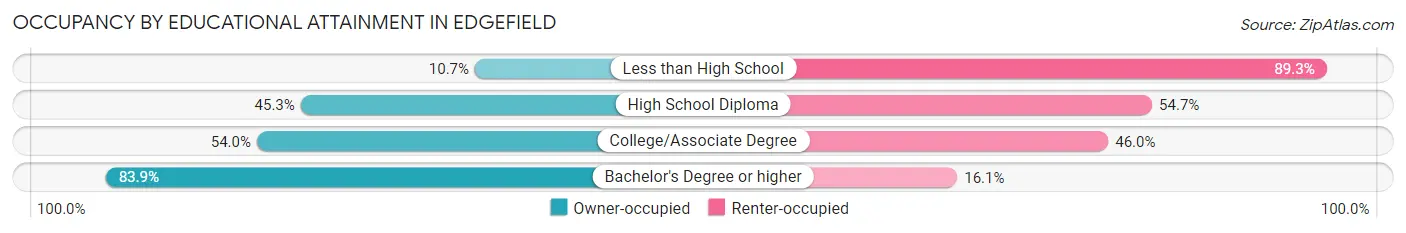
| Household Size | Owner-occupied | Renter-occupied |
| Less than High School | 25 (10.7%) | 208 (89.3%) |
| High School Diploma | 115 (45.3%) | 139 (54.7%) |
| College/Associate Degree | 163 (54.0%) | 139 (46.0%) |
| Bachelor's Degree or higher | 219 (83.9%) | 42 (16.1%) |
Occupancy by Age of Householder in Edgefield
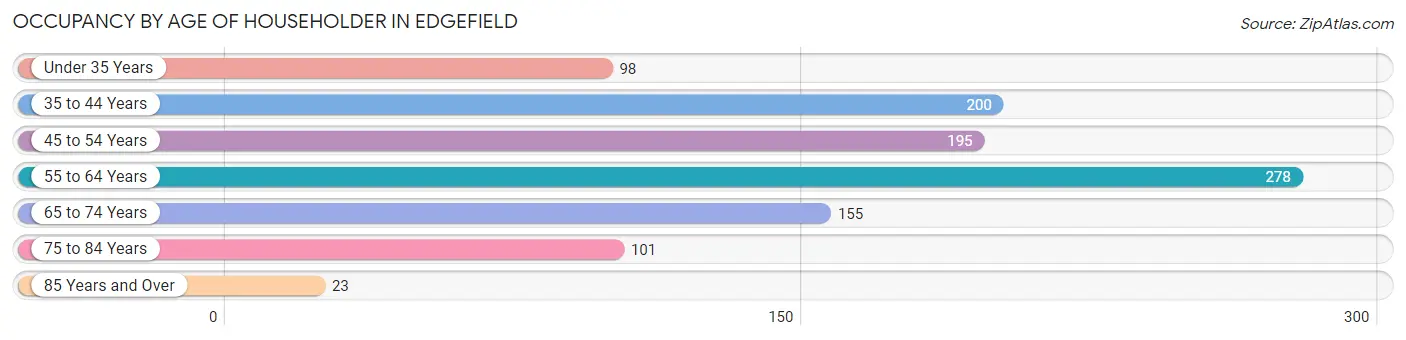
| Age Bracket | # Households | % Households |
| Under 35 Years | 98 | 9.3% |
| 35 to 44 Years | 200 | 19.1% |
| 45 to 54 Years | 195 | 18.6% |
| 55 to 64 Years | 278 | 26.5% |
| 65 to 74 Years | 155 | 14.8% |
| 75 to 84 Years | 101 | 9.6% |
| 85 Years and Over | 23 | 2.2% |
| Total | 1,050 | 100.0% |
Housing Finances in Edgefield
Median Income by Occupancy in Edgefield
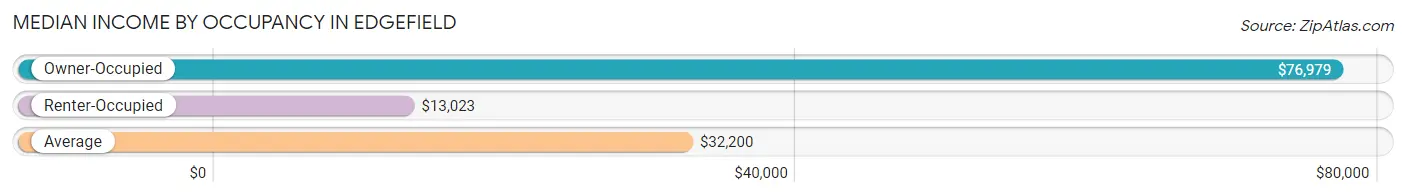
| Occupancy Type | # Households | Median Income |
| Owner-Occupied | 522 (49.7%) | $76,979 |
| Renter-Occupied | 528 (50.3%) | $13,023 |
| Average | 1,050 (100.0%) | $32,200 |
Occupancy by Householder Income Bracket in Edgefield
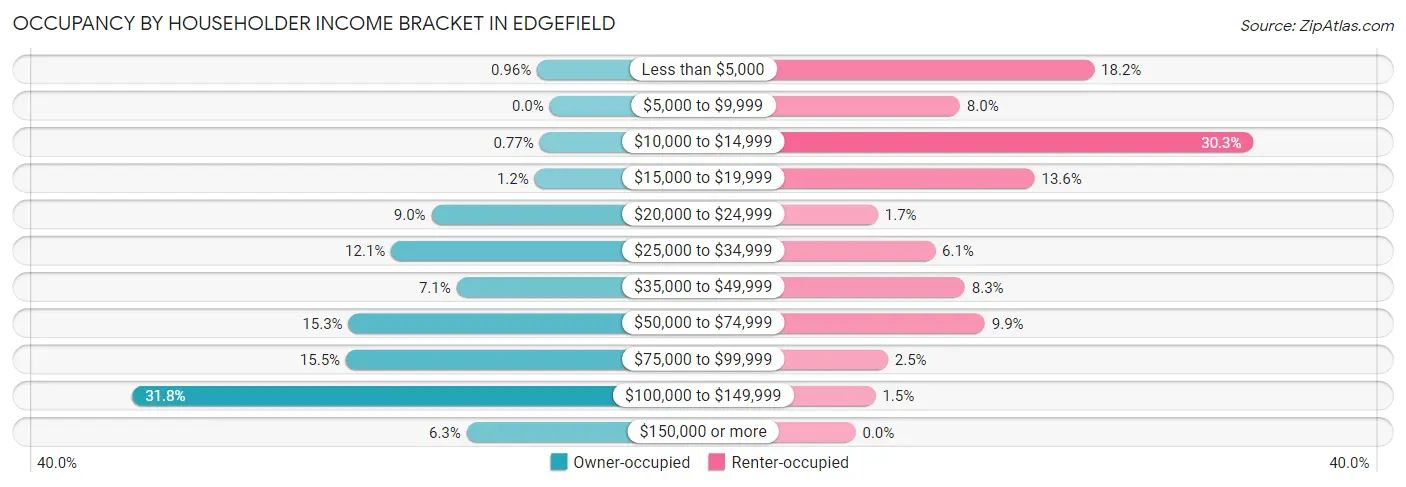
| Income Bracket | Owner-occupied | Renter-occupied |
| Less than $5,000 | 5 (1.0%) | 96 (18.2%) |
| $5,000 to $9,999 | 0 (0.0%) | 42 (8.0%) |
| $10,000 to $14,999 | 4 (0.8%) | 160 (30.3%) |
| $15,000 to $19,999 | 6 (1.1%) | 72 (13.6%) |
| $20,000 to $24,999 | 47 (9.0%) | 9 (1.7%) |
| $25,000 to $34,999 | 63 (12.1%) | 32 (6.1%) |
| $35,000 to $49,999 | 37 (7.1%) | 44 (8.3%) |
| $50,000 to $74,999 | 80 (15.3%) | 52 (9.9%) |
| $75,000 to $99,999 | 81 (15.5%) | 13 (2.5%) |
| $100,000 to $149,999 | 166 (31.8%) | 8 (1.5%) |
| $150,000 or more | 33 (6.3%) | 0 (0.0%) |
| Total | 522 (100.0%) | 528 (100.0%) |
Monthly Housing Cost Tiers in Edgefield
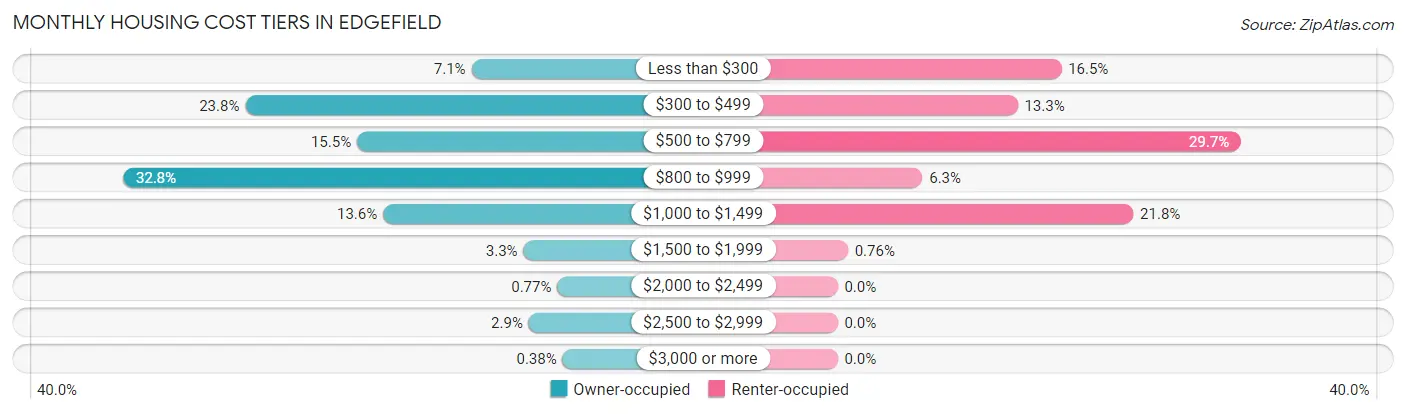
| Monthly Cost | Owner-occupied | Renter-occupied |
| Less than $300 | 37 (7.1%) | 87 (16.5%) |
| $300 to $499 | 124 (23.7%) | 70 (13.3%) |
| $500 to $799 | 81 (15.5%) | 157 (29.7%) |
| $800 to $999 | 171 (32.8%) | 33 (6.2%) |
| $1,000 to $1,499 | 71 (13.6%) | 115 (21.8%) |
| $1,500 to $1,999 | 17 (3.3%) | 4 (0.8%) |
| $2,000 to $2,499 | 4 (0.8%) | 0 (0.0%) |
| $2,500 to $2,999 | 15 (2.9%) | 0 (0.0%) |
| $3,000 or more | 2 (0.4%) | 0 (0.0%) |
| Total | 522 (100.0%) | 528 (100.0%) |
Physical Housing Characteristics in Edgefield
Housing Structures in Edgefield
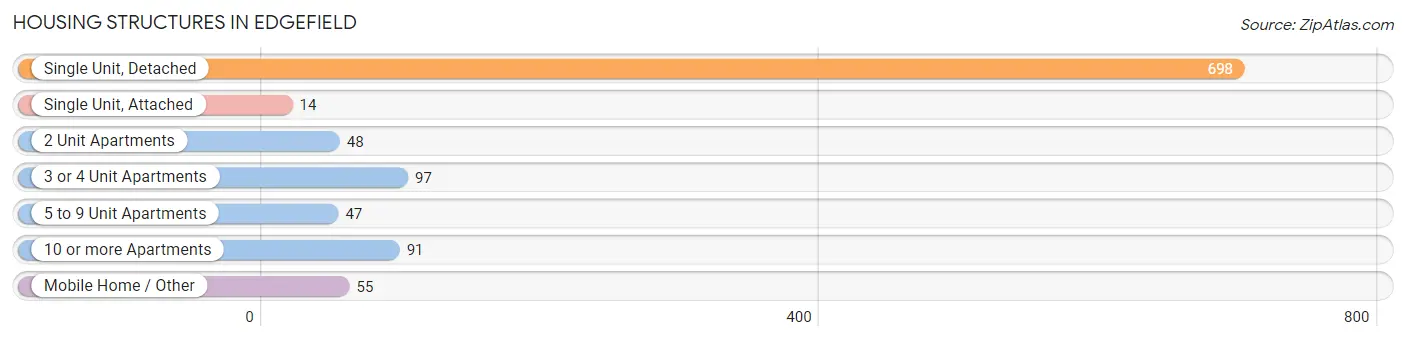
| Structure Type | # Housing Units | % Housing Units |
| Single Unit, Detached | 698 | 66.5% |
| Single Unit, Attached | 14 | 1.3% |
| 2 Unit Apartments | 48 | 4.6% |
| 3 or 4 Unit Apartments | 97 | 9.2% |
| 5 to 9 Unit Apartments | 47 | 4.5% |
| 10 or more Apartments | 91 | 8.7% |
| Mobile Home / Other | 55 | 5.2% |
| Total | 1,050 | 100.0% |
Housing Structures by Occupancy in Edgefield
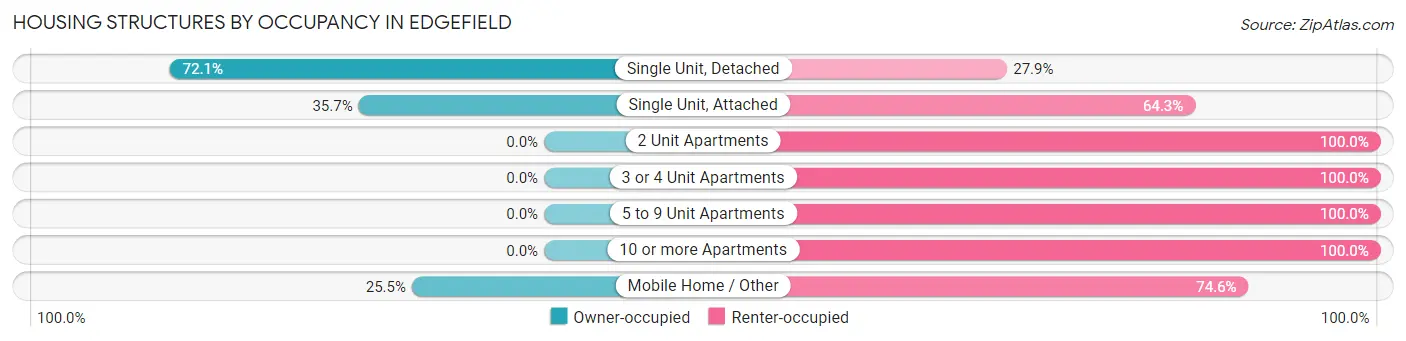
| Structure Type | Owner-occupied | Renter-occupied |
| Single Unit, Detached | 503 (72.1%) | 195 (27.9%) |
| Single Unit, Attached | 5 (35.7%) | 9 (64.3%) |
| 2 Unit Apartments | 0 (0.0%) | 48 (100.0%) |
| 3 or 4 Unit Apartments | 0 (0.0%) | 97 (100.0%) |
| 5 to 9 Unit Apartments | 0 (0.0%) | 47 (100.0%) |
| 10 or more Apartments | 0 (0.0%) | 91 (100.0%) |
| Mobile Home / Other | 14 (25.5%) | 41 (74.6%) |
| Total | 522 (49.7%) | 528 (50.3%) |
Housing Structures by Number of Rooms in Edgefield
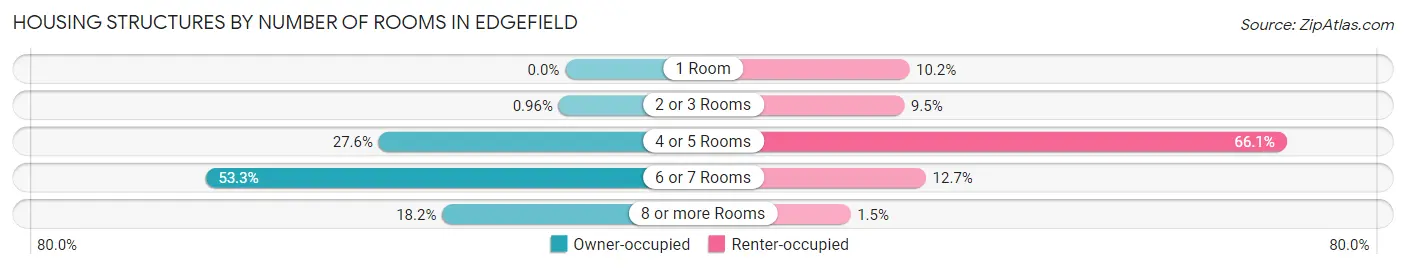
| Number of Rooms | Owner-occupied | Renter-occupied |
| 1 Room | 0 (0.0%) | 54 (10.2%) |
| 2 or 3 Rooms | 5 (1.0%) | 50 (9.5%) |
| 4 or 5 Rooms | 144 (27.6%) | 349 (66.1%) |
| 6 or 7 Rooms | 278 (53.3%) | 67 (12.7%) |
| 8 or more Rooms | 95 (18.2%) | 8 (1.5%) |
| Total | 522 (100.0%) | 528 (100.0%) |
Housing Structure by Heating Type in Edgefield
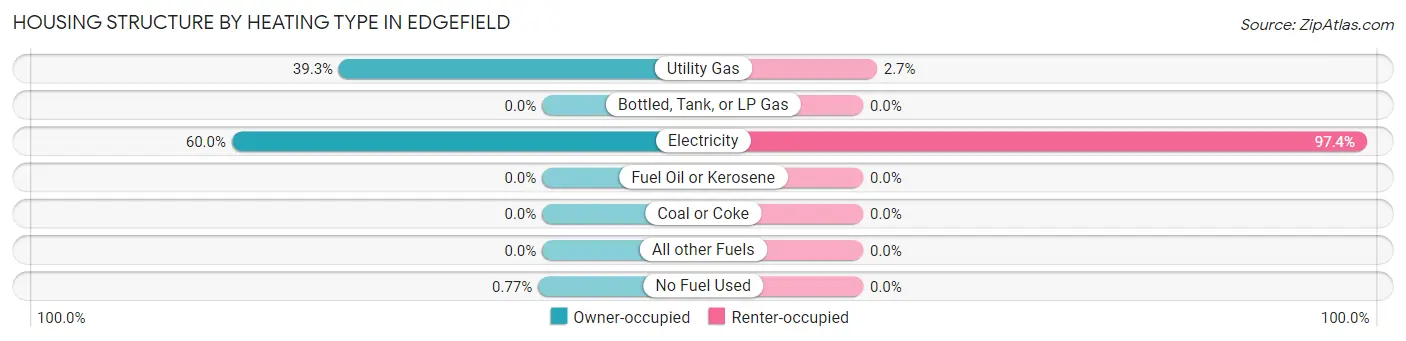
| Heating Type | Owner-occupied | Renter-occupied |
| Utility Gas | 205 (39.3%) | 14 (2.6%) |
| Bottled, Tank, or LP Gas | 0 (0.0%) | 0 (0.0%) |
| Electricity | 313 (60.0%) | 514 (97.4%) |
| Fuel Oil or Kerosene | 0 (0.0%) | 0 (0.0%) |
| Coal or Coke | 0 (0.0%) | 0 (0.0%) |
| All other Fuels | 0 (0.0%) | 0 (0.0%) |
| No Fuel Used | 4 (0.8%) | 0 (0.0%) |
| Total | 522 (100.0%) | 528 (100.0%) |
Household Vehicle Usage in Edgefield
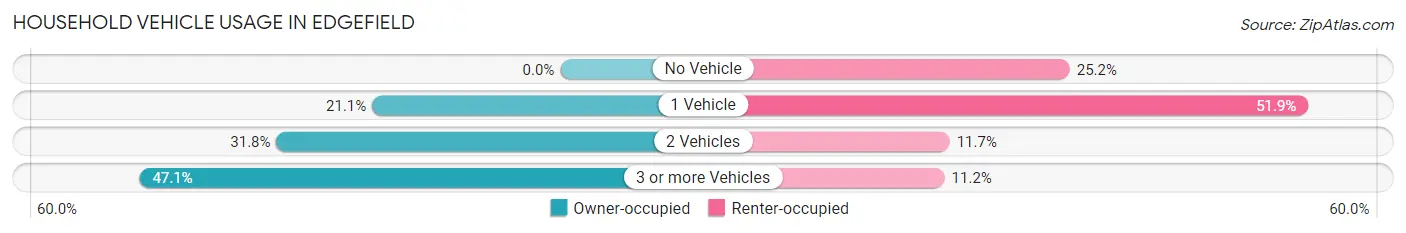
| Vehicles per Household | Owner-occupied | Renter-occupied |
| No Vehicle | 0 (0.0%) | 133 (25.2%) |
| 1 Vehicle | 110 (21.1%) | 274 (51.9%) |
| 2 Vehicles | 166 (31.8%) | 62 (11.7%) |
| 3 or more Vehicles | 246 (47.1%) | 59 (11.2%) |
| Total | 522 (100.0%) | 528 (100.0%) |
Real Estate & Mortgages in Edgefield
Real Estate and Mortgage Overview in Edgefield
| Characteristic | Without Mortgage | With Mortgage |
| Housing Units | 237 | 285 |
| Median Property Value | $101,300 | $96,300 |
| Median Household Income | $61,458 | $6 |
| Monthly Housing Costs | $449 | $0 |
| Real Estate Taxes | $594 | $0 |
Property Value by Mortgage Status in Edgefield
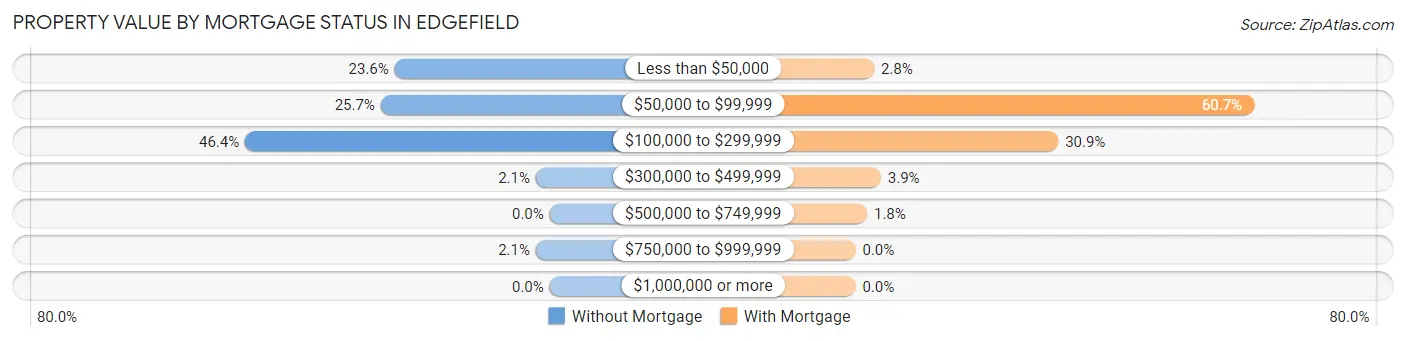
| Property Value | Without Mortgage | With Mortgage |
| Less than $50,000 | 56 (23.6%) | 8 (2.8%) |
| $50,000 to $99,999 | 61 (25.7%) | 173 (60.7%) |
| $100,000 to $299,999 | 110 (46.4%) | 88 (30.9%) |
| $300,000 to $499,999 | 5 (2.1%) | 11 (3.9%) |
| $500,000 to $749,999 | 0 (0.0%) | 5 (1.8%) |
| $750,000 to $999,999 | 5 (2.1%) | 0 (0.0%) |
| $1,000,000 or more | 0 (0.0%) | 0 (0.0%) |
| Total | 237 (100.0%) | 285 (100.0%) |
Household Income by Mortgage Status in Edgefield
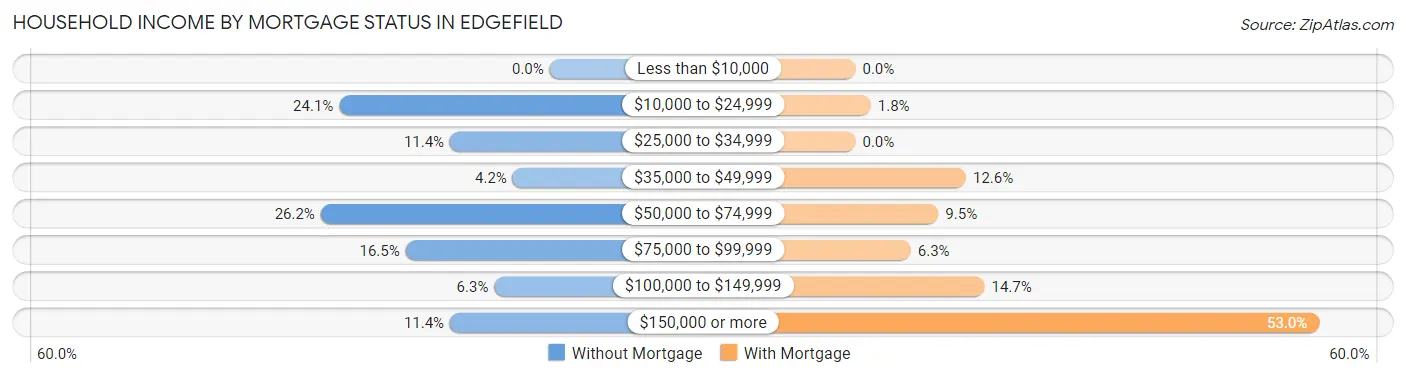
| Household Income | Without Mortgage | With Mortgage |
| Less than $10,000 | 0 (0.0%) | 0 (0.0%) |
| $10,000 to $24,999 | 57 (24.0%) | 5 (1.8%) |
| $25,000 to $34,999 | 27 (11.4%) | 0 (0.0%) |
| $35,000 to $49,999 | 10 (4.2%) | 36 (12.6%) |
| $50,000 to $74,999 | 62 (26.2%) | 27 (9.5%) |
| $75,000 to $99,999 | 39 (16.5%) | 18 (6.3%) |
| $100,000 to $149,999 | 15 (6.3%) | 42 (14.7%) |
| $150,000 or more | 27 (11.4%) | 151 (53.0%) |
| Total | 237 (100.0%) | 285 (100.0%) |
Property Value to Household Income Ratio in Edgefield
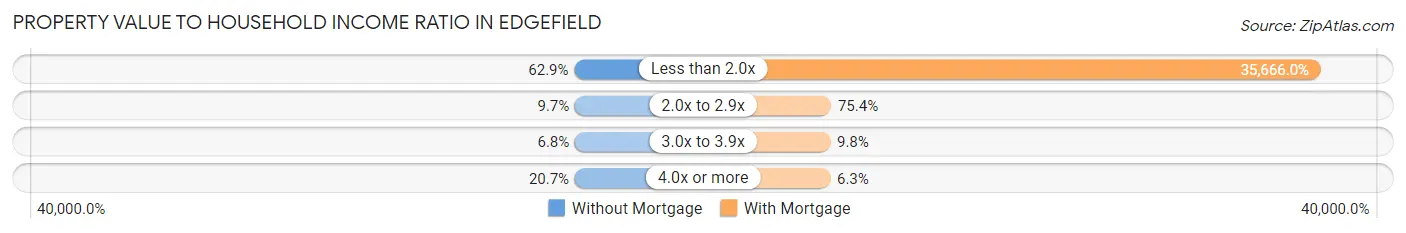
| Value-to-Income Ratio | Without Mortgage | With Mortgage |
| Less than 2.0x | 149 (62.9%) | 101,648 (35,666.0%) |
| 2.0x to 2.9x | 23 (9.7%) | 215 (75.4%) |
| 3.0x to 3.9x | 16 (6.8%) | 28 (9.8%) |
| 4.0x or more | 49 (20.7%) | 18 (6.3%) |
| Total | 237 (100.0%) | 285 (100.0%) |
Real Estate Taxes by Mortgage Status in Edgefield

| Property Taxes | Without Mortgage | With Mortgage |
| Less than $800 | 145 (61.2%) | 0 (0.0%) |
| $800 to $1,499 | 78 (32.9%) | 225 (78.9%) |
| $800 to $1,499 | 9 (3.8%) | 33 (11.6%) |
| Total | 237 (100.0%) | 285 (100.0%) |
Health & Disability in Edgefield
Health Insurance Coverage by Age in Edgefield
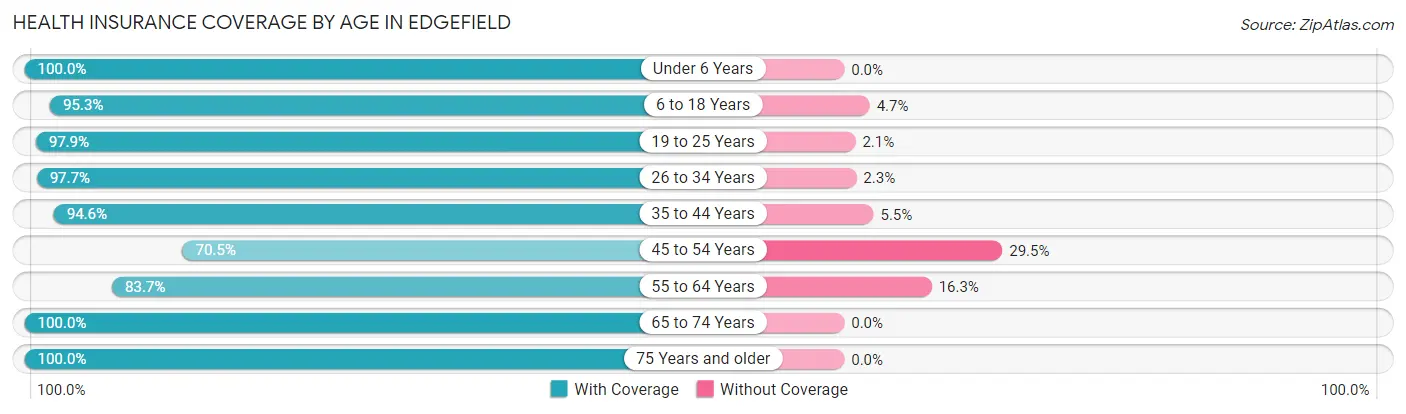
| Age Bracket | With Coverage | Without Coverage |
| Under 6 Years | 87 (100.0%) | 0 (0.0%) |
| 6 to 18 Years | 362 (95.3%) | 18 (4.7%) |
| 19 to 25 Years | 328 (97.9%) | 7 (2.1%) |
| 26 to 34 Years | 216 (97.7%) | 5 (2.3%) |
| 35 to 44 Years | 312 (94.6%) | 18 (5.4%) |
| 45 to 54 Years | 170 (70.5%) | 71 (29.5%) |
| 55 to 64 Years | 339 (83.7%) | 66 (16.3%) |
| 65 to 74 Years | 230 (100.0%) | 0 (0.0%) |
| 75 Years and older | 177 (100.0%) | 0 (0.0%) |
| Total | 2,221 (92.3%) | 185 (7.7%) |
Health Insurance Coverage by Citizenship Status in Edgefield
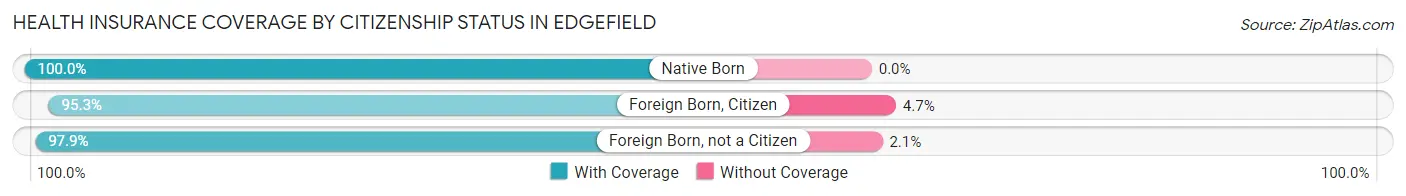
| Citizenship Status | With Coverage | Without Coverage |
| Native Born | 87 (100.0%) | 0 (0.0%) |
| Foreign Born, Citizen | 362 (95.3%) | 18 (4.7%) |
| Foreign Born, not a Citizen | 328 (97.9%) | 7 (2.1%) |
Health Insurance Coverage by Household Income in Edgefield
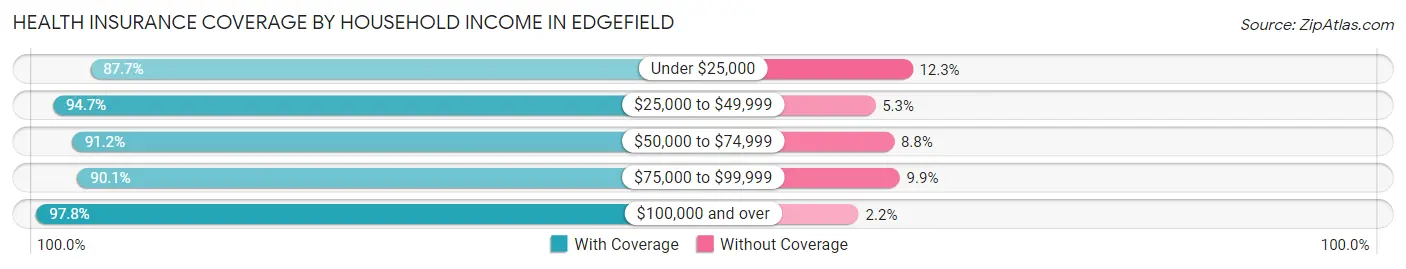
| Household Income | With Coverage | Without Coverage |
| Under $25,000 | 613 (87.7%) | 86 (12.3%) |
| $25,000 to $49,999 | 445 (94.7%) | 25 (5.3%) |
| $50,000 to $74,999 | 330 (91.2%) | 32 (8.8%) |
| $75,000 to $99,999 | 273 (90.1%) | 30 (9.9%) |
| $100,000 and over | 528 (97.8%) | 12 (2.2%) |
Public vs Private Health Insurance Coverage by Age in Edgefield
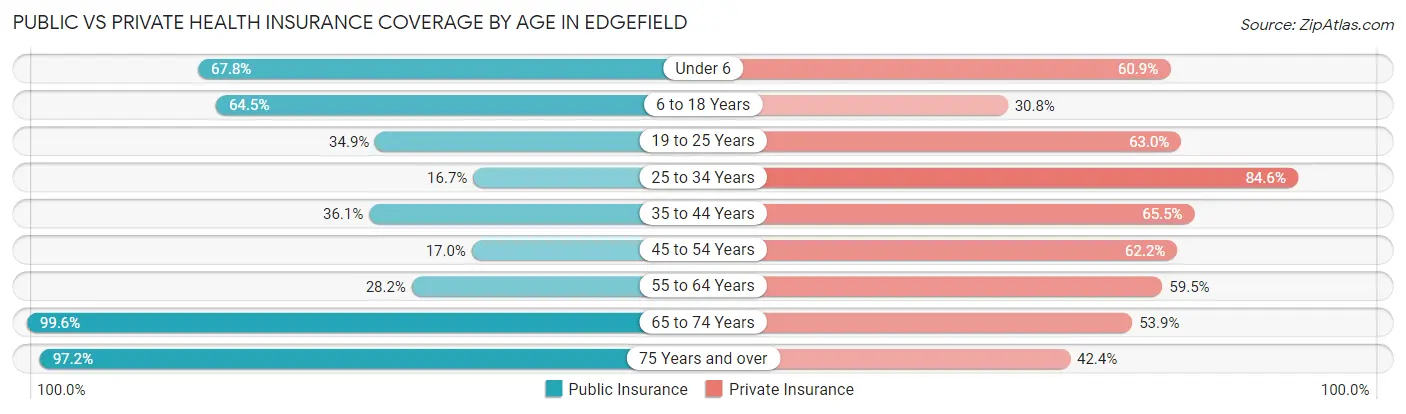
| Age Bracket | Public Insurance | Private Insurance |
| Under 6 | 59 (67.8%) | 53 (60.9%) |
| 6 to 18 Years | 245 (64.5%) | 117 (30.8%) |
| 19 to 25 Years | 117 (34.9%) | 211 (63.0%) |
| 25 to 34 Years | 37 (16.7%) | 187 (84.6%) |
| 35 to 44 Years | 119 (36.1%) | 216 (65.4%) |
| 45 to 54 Years | 41 (17.0%) | 150 (62.2%) |
| 55 to 64 Years | 114 (28.1%) | 241 (59.5%) |
| 65 to 74 Years | 229 (99.6%) | 124 (53.9%) |
| 75 Years and over | 172 (97.2%) | 75 (42.4%) |
| Total | 1,133 (47.1%) | 1,374 (57.1%) |
Disability Status by Sex by Age in Edgefield
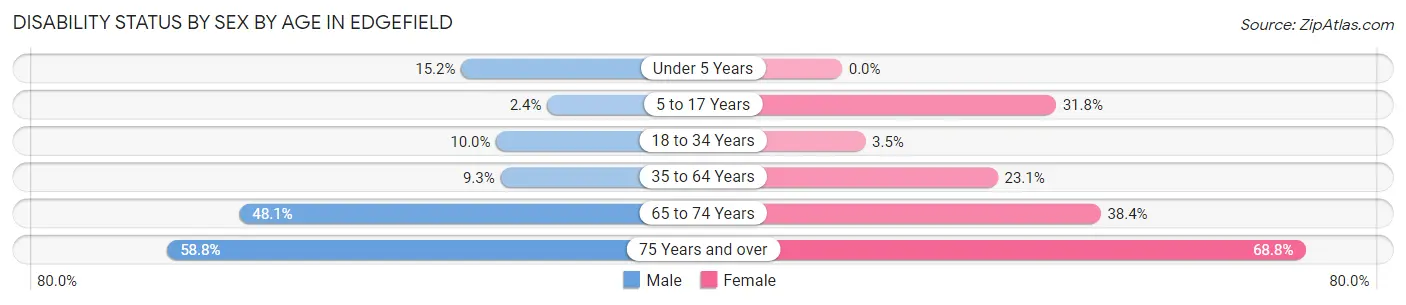
| Age Bracket | Male | Female |
| Under 5 Years | 5 (15.1%) | 0 (0.0%) |
| 5 to 17 Years | 4 (2.4%) | 61 (31.8%) |
| 18 to 34 Years | 38 (10.0%) | 8 (3.5%) |
| 35 to 64 Years | 41 (9.3%) | 124 (23.1%) |
| 65 to 74 Years | 38 (48.1%) | 58 (38.4%) |
| 75 Years and over | 40 (58.8%) | 75 (68.8%) |
Disability Class by Sex by Age in Edgefield
Disability Class: Hearing Difficulty
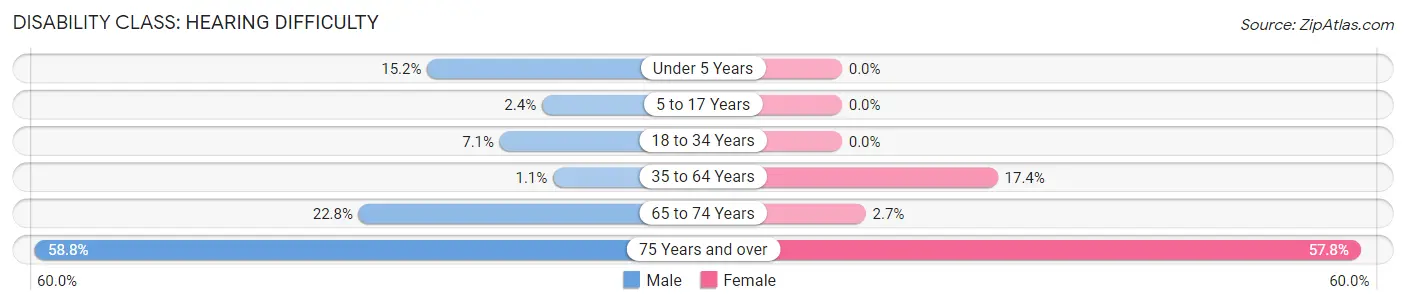
| Age Bracket | Male | Female |
| Under 5 Years | 5 (15.1%) | 0 (0.0%) |
| 5 to 17 Years | 4 (2.4%) | 0 (0.0%) |
| 18 to 34 Years | 27 (7.1%) | 0 (0.0%) |
| 35 to 64 Years | 5 (1.1%) | 93 (17.3%) |
| 65 to 74 Years | 18 (22.8%) | 4 (2.6%) |
| 75 Years and over | 40 (58.8%) | 63 (57.8%) |
Disability Class: Vision Difficulty
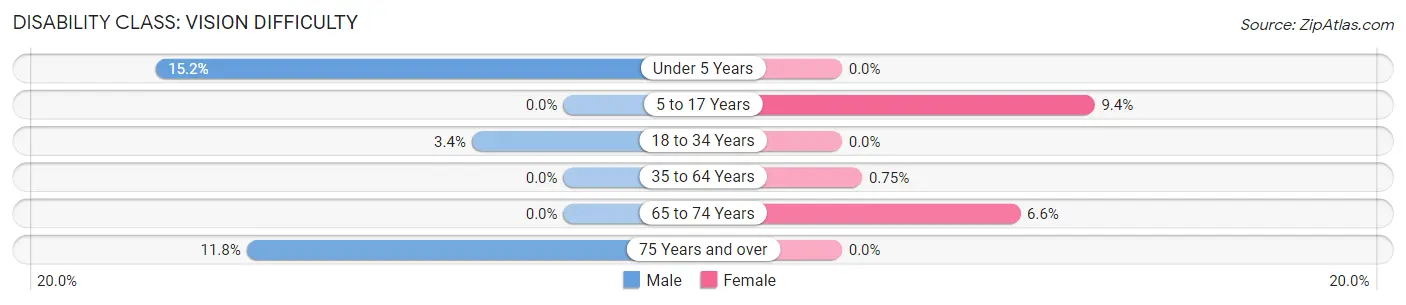
| Age Bracket | Male | Female |
| Under 5 Years | 5 (15.1%) | 0 (0.0%) |
| 5 to 17 Years | 0 (0.0%) | 18 (9.4%) |
| 18 to 34 Years | 13 (3.4%) | 0 (0.0%) |
| 35 to 64 Years | 0 (0.0%) | 4 (0.7%) |
| 65 to 74 Years | 0 (0.0%) | 10 (6.6%) |
| 75 Years and over | 8 (11.8%) | 0 (0.0%) |
Disability Class: Cognitive Difficulty
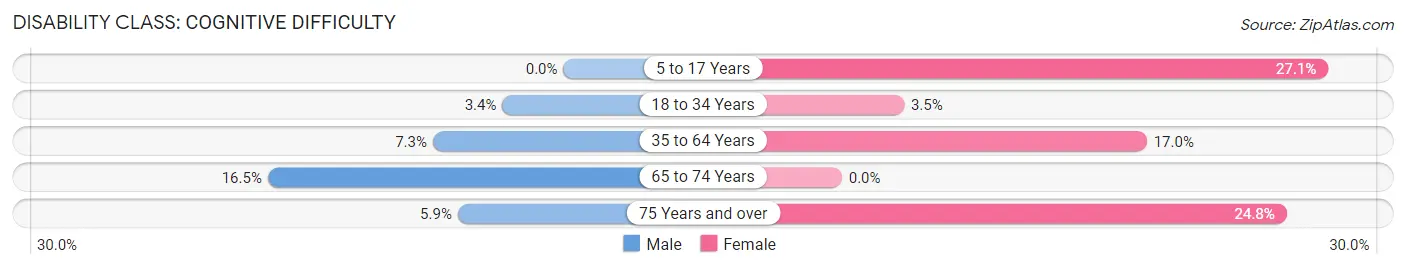
| Age Bracket | Male | Female |
| 5 to 17 Years | 0 (0.0%) | 52 (27.1%) |
| 18 to 34 Years | 13 (3.4%) | 8 (3.5%) |
| 35 to 64 Years | 32 (7.3%) | 91 (17.0%) |
| 65 to 74 Years | 13 (16.5%) | 0 (0.0%) |
| 75 Years and over | 4 (5.9%) | 27 (24.8%) |
Disability Class: Ambulatory Difficulty
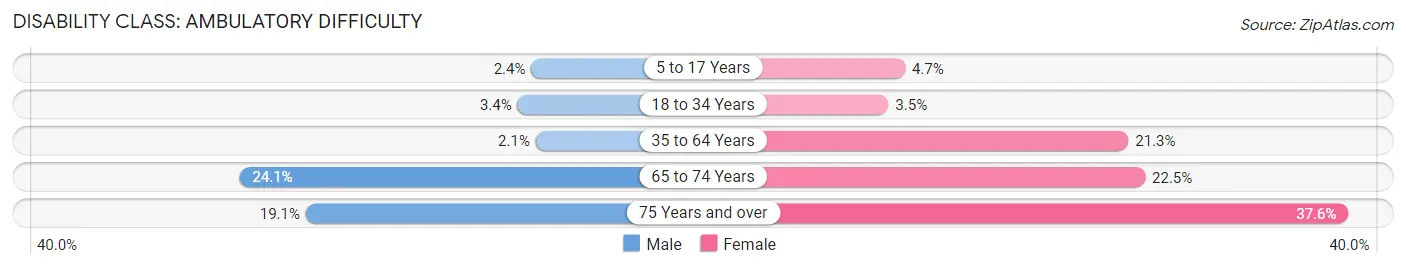
| Age Bracket | Male | Female |
| 5 to 17 Years | 4 (2.4%) | 9 (4.7%) |
| 18 to 34 Years | 13 (3.4%) | 8 (3.5%) |
| 35 to 64 Years | 9 (2.1%) | 114 (21.3%) |
| 65 to 74 Years | 19 (24.0%) | 34 (22.5%) |
| 75 Years and over | 13 (19.1%) | 41 (37.6%) |
Disability Class: Self-Care Difficulty
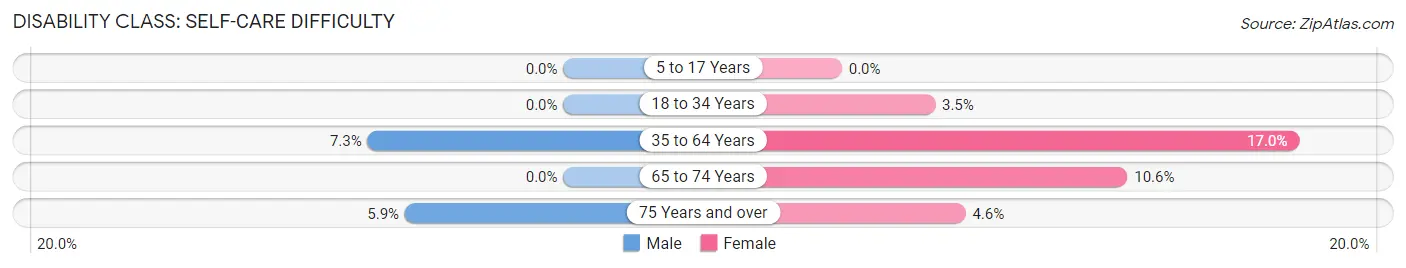
| Age Bracket | Male | Female |
| 5 to 17 Years | 0 (0.0%) | 0 (0.0%) |
| 18 to 34 Years | 0 (0.0%) | 8 (3.5%) |
| 35 to 64 Years | 32 (7.3%) | 91 (17.0%) |
| 65 to 74 Years | 0 (0.0%) | 16 (10.6%) |
| 75 Years and over | 4 (5.9%) | 5 (4.6%) |
Technology Access in Edgefield
Computing Device Access in Edgefield
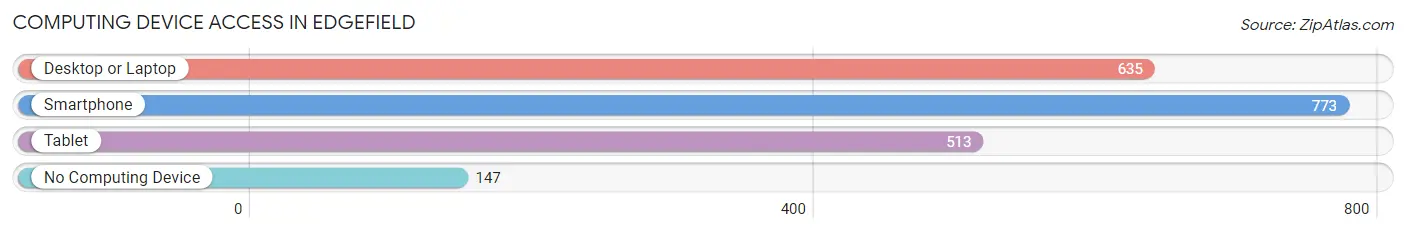
| Device Type | # Households | % Households |
| Desktop or Laptop | 635 | 60.5% |
| Smartphone | 773 | 73.6% |
| Tablet | 513 | 48.9% |
| No Computing Device | 147 | 14.0% |
| Total | 1,050 | 100.0% |
Internet Access in Edgefield
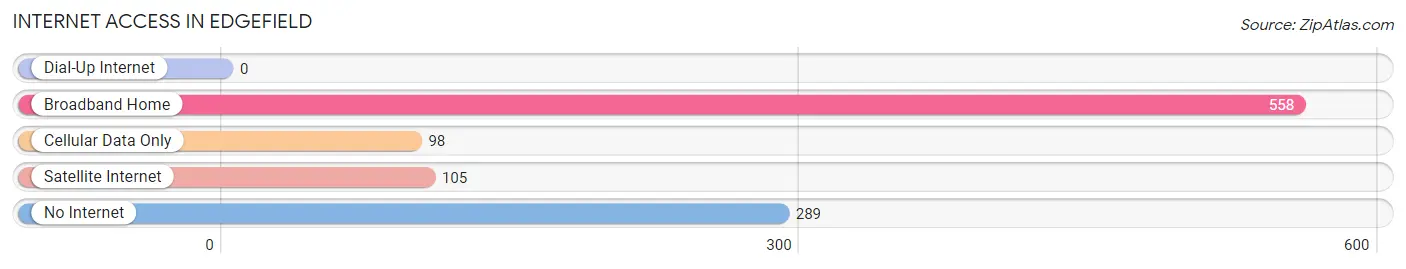
| Internet Type | # Households | % Households |
| Dial-Up Internet | 0 | 0.0% |
| Broadband Home | 558 | 53.1% |
| Cellular Data Only | 98 | 9.3% |
| Satellite Internet | 105 | 10.0% |
| No Internet | 289 | 27.5% |
| Total | 1,050 | 100.0% |
Edgefield Summary
Edgefield, South Carolina is a small town located in the western part of the state, about 25 miles from Augusta, Georgia. It is the county seat of Edgefield County and is part of the Augusta-Aiken metropolitan area. The town has a population of 4,750 people, according to the 2010 census.
History
Edgefield was founded in 1785 by General John Edge, a Revolutionary War hero. Edgefield was originally part of the Ninety-Six District, which was created in 1769. Edgefield was the site of the first court house in the district, and the town was named after General Edge.
Edgefield was an important center of commerce and industry in the 19th century. It was home to several cotton mills, a grist mill, and a sawmill. The town was also the site of the first cotton gin in the United States, which was invented by Eli Whitney in 1793.
Edgefield was also the site of several important events in South Carolina history. In 1868, the state's first constitutional convention was held in Edgefield. The convention resulted in the adoption of the state's first constitution, which abolished slavery and established universal male suffrage.
Geography
Edgefield is located in the western part of South Carolina, about 25 miles from Augusta, Georgia. The town is situated in the Piedmont region of the state, and is surrounded by rolling hills and forests. The town is located on the Savannah River, which forms the border between South Carolina and Georgia.
The climate in Edgefield is mild and humid, with hot summers and mild winters. The average annual temperature is around 70 degrees Fahrenheit. The town receives an average of 48 inches of rain per year.
Economy
Edgefield's economy is largely based on agriculture and manufacturing. The town is home to several large farms, which produce cotton, corn, soybeans, and other crops. The town is also home to several manufacturing companies, which produce textiles, furniture, and other products.
Edgefield is also home to several small businesses, including restaurants, shops, and other services. The town is also home to several historic sites, including the Edgefield County Courthouse, which was built in 1825.
Demographics
As of the 2010 census, Edgefield had a population of 4,750 people. The racial makeup of the town was 79.3% White, 17.7% African American, 0.3% Native American, 0.7% Asian, and 2.0% from other races. The median household income was $31,250, and the median family income was $41,250.
Conclusion
Edgefield, South Carolina is a small town with a rich history and a vibrant economy. The town is home to several farms and manufacturing companies, as well as a variety of small businesses. The town has a diverse population, with a mix of races and ethnicities. Edgefield is an important part of South Carolina's history and culture, and is a great place to live and work.
Common Questions
What is Per Capita Income in Edgefield?
Per Capita income in Edgefield is $26,074.
What is the Median Family Income in Edgefield?
Median Family Income in Edgefield is $63,438.
What is the Median Household income in Edgefield?
Median Household Income in Edgefield is $32,200.
What is Income or Wage Gap in Edgefield?
Income or Wage Gap in Edgefield is 35.5%.
Women in Edgefield earn 64.5 cents for every dollar earned by a man.
What is Inequality or Gini Index in Edgefield?
Inequality or Gini Index in Edgefield is 0.53.
What is the Total Population of Edgefield?
Total Population of Edgefield is 2,504.
What is the Total Male Population of Edgefield?
Total Male Population of Edgefield is 1,236.
What is the Total Female Population of Edgefield?
Total Female Population of Edgefield is 1,268.
What is the Ratio of Males per 100 Females in Edgefield?
There are 97.48 Males per 100 Females in Edgefield.
What is the Ratio of Females per 100 Males in Edgefield?
There are 102.59 Females per 100 Males in Edgefield.
What is the Median Population Age in Edgefield?
Median Population Age in Edgefield is 39.9 Years.
What is the Average Family Size in Edgefield
Average Family Size in Edgefield is 2.9 People.
What is the Average Household Size in Edgefield
Average Household Size in Edgefield is 2.3 People.
How Large is the Labor Force in Edgefield?
There are 1,199 People in the Labor Forcein in Edgefield.
What is the Percentage of People in the Labor Force in Edgefield?
55.6% of People are in the Labor Force in Edgefield.
What is the Unemployment Rate in Edgefield?
Unemployment Rate in Edgefield is 16.9%.