Zip Codes with the Highest Percentage of Population Employed in Food Preparation & Serving in Greer, SC
RELATED REPORTS & OPTIONS
Food Preparation & Serving
Greer
Compare Zip Codes
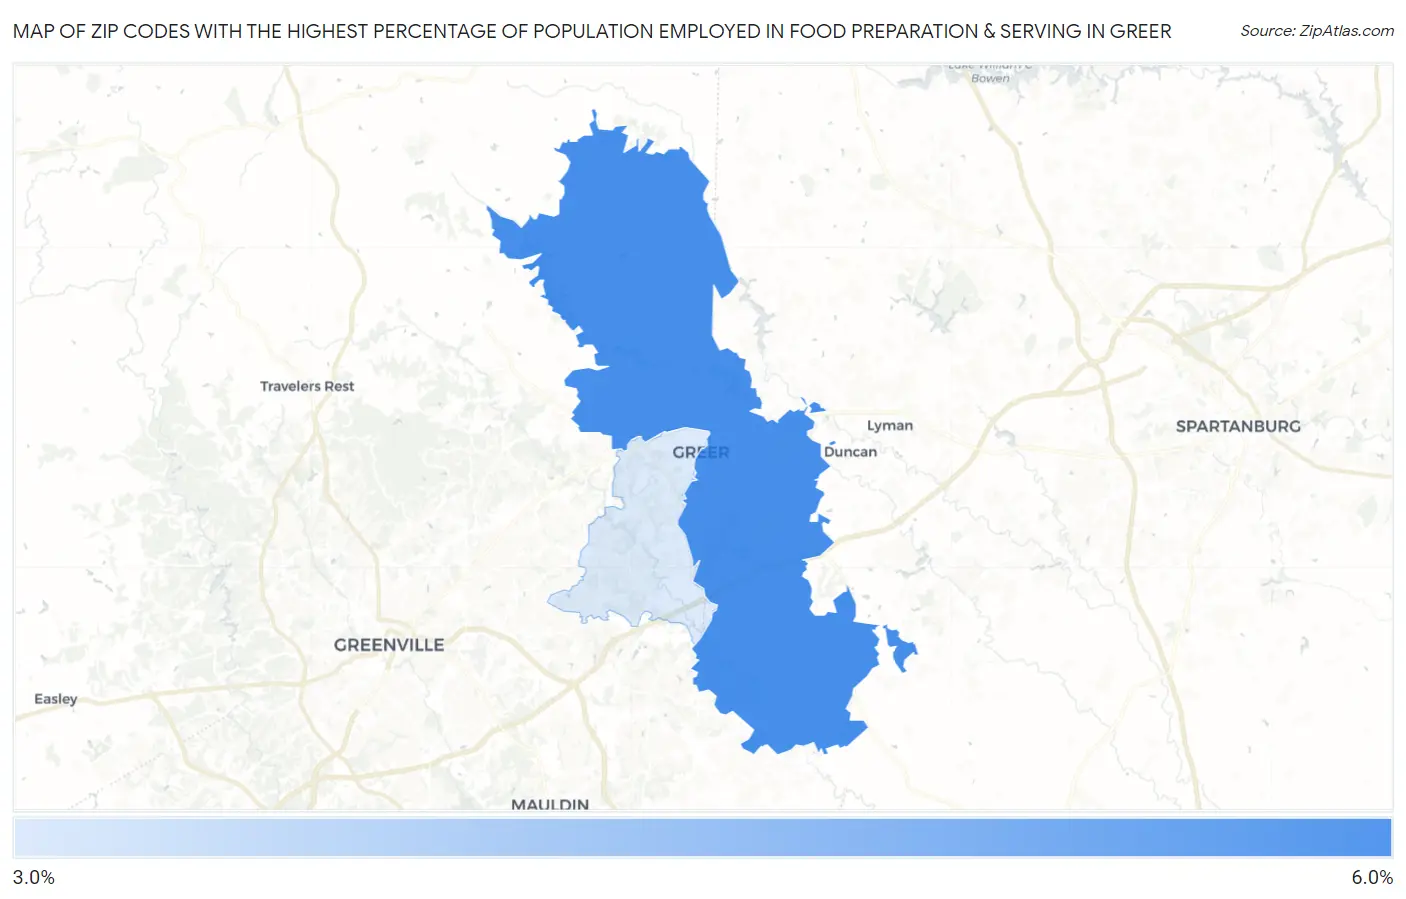
Map of Zip Codes with the Highest Percentage of Population Employed in Food Preparation & Serving in Greer
3.2%
5.4%
Zip Codes with the Highest Percentage of Population Employed in Food Preparation & Serving in Greer, SC
| Zip Code | % Employed | vs State | vs National | |
| 1. | 29651 | 5.4% | 5.8%(-0.345)#180 | 5.3%(+0.138)#11,326 |
| 2. | 29650 | 3.2% | 5.8%(-2.62)#297 | 5.3%(-2.14)#20,655 |
1
Common Questions
What are the Top Zip Codes with the Highest Percentage of Population Employed in Food Preparation & Serving in Greer, SC?
Top Zip Codes with the Highest Percentage of Population Employed in Food Preparation & Serving in Greer, SC are:
What zip code has the Highest Percentage of Population Employed in Food Preparation & Serving in Greer, SC?
29651 has the Highest Percentage of Population Employed in Food Preparation & Serving in Greer, SC with 5.4%.
What is the Percentage of Population Employed in Food Preparation & Serving in Greer, SC?
Percentage of Population Employed in Food Preparation & Serving in Greer is 5.7%.
What is the Percentage of Population Employed in Food Preparation & Serving in South Carolina?
Percentage of Population Employed in Food Preparation & Serving in South Carolina is 5.8%.
What is the Percentage of Population Employed in Food Preparation & Serving in the United States?
Percentage of Population Employed in Food Preparation & Serving in the United States is 5.3%.