Inman Mills, SC Map & Demographics
Inman Mills Map
Inman Mills Overview
$20,836
PER CAPITA INCOME
$58,087
AVG FAMILY INCOME
$41,007
AVG HOUSEHOLD INCOME
30.4%
WAGE / INCOME GAP [ % ]
69.6¢/ $1
WAGE / INCOME GAP [ $ ]
0.32
INEQUALITY / GINI INDEX
956
TOTAL POPULATION
522
MALE POPULATION
434
FEMALE POPULATION
120.28
MALES / 100 FEMALES
83.14
FEMALES / 100 MALES
51.2
MEDIAN AGE
2.8
AVG FAMILY SIZE
1.8
AVG HOUSEHOLD SIZE
355
LABOR FORCE [ PEOPLE ]
41.3%
PERCENT IN LABOR FORCE
Income in Inman Mills
Income Overview in Inman Mills
Per Capita Income in Inman Mills is $20,836, while median incomes of families and households are $58,087 and $41,007 respectively.
| Characteristic | Number | Measure |
| Per Capita Income | 956 | $20,836 |
| Median Family Income | 163 | $58,087 |
| Mean Family Income | 163 | $62,237 |
| Median Household Income | 373 | $41,007 |
| Mean Household Income | 373 | $43,391 |
| Income Deficit | 163 | $0 |
| Wage / Income Gap (%) | 956 | 30.40% |
| Wage / Income Gap ($) | 956 | 69.60¢ per $1 |
| Gini / Inequality Index | 956 | 0.32 |
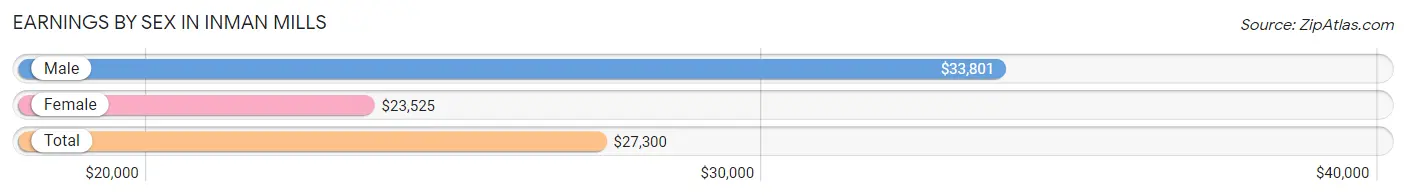
Earnings by Sex in Inman Mills
Average Earnings in Inman Mills are $27,300, $33,801 for men and $23,525 for women, a difference of 30.4%.
| Sex | Number | Average Earnings |
| Male | 273 (68.6%) | $33,801 |
| Female | 125 (31.4%) | $23,525 |
| Total | 398 (100.0%) | $27,300 |
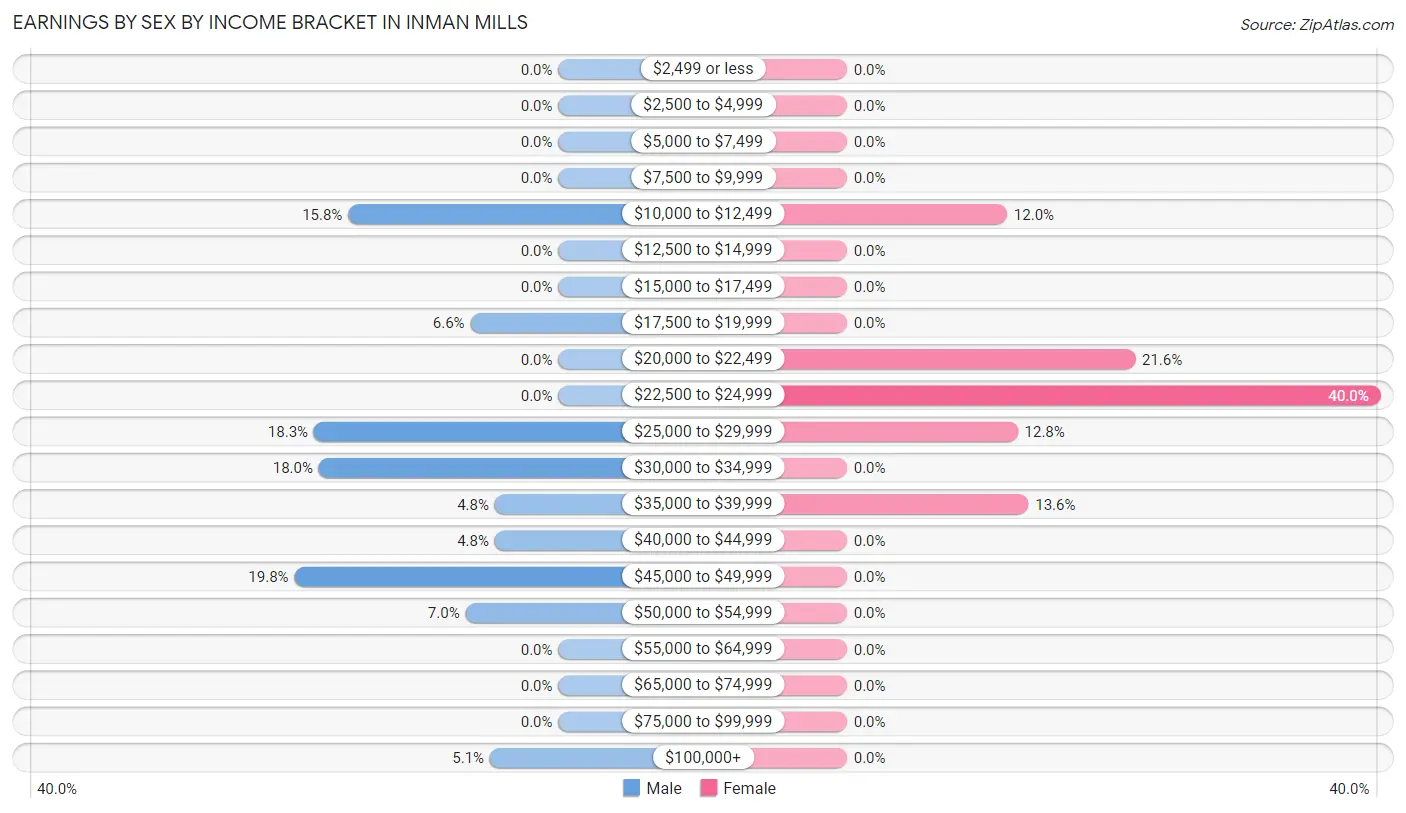
Earnings by Sex by Income Bracket in Inman Mills
The most common earnings brackets in Inman Mills are $45,000 to $49,999 for men (54 | 19.8%) and $22,500 to $24,999 for women (50 | 40.0%).
| Income | Male | Female |
| $2,499 or less | 0 (0.0%) | 0 (0.0%) |
| $2,500 to $4,999 | 0 (0.0%) | 0 (0.0%) |
| $5,000 to $7,499 | 0 (0.0%) | 0 (0.0%) |
| $7,500 to $9,999 | 0 (0.0%) | 0 (0.0%) |
| $10,000 to $12,499 | 43 (15.8%) | 15 (12.0%) |
| $12,500 to $14,999 | 0 (0.0%) | 0 (0.0%) |
| $15,000 to $17,499 | 0 (0.0%) | 0 (0.0%) |
| $17,500 to $19,999 | 18 (6.6%) | 0 (0.0%) |
| $20,000 to $22,499 | 0 (0.0%) | 27 (21.6%) |
| $22,500 to $24,999 | 0 (0.0%) | 50 (40.0%) |
| $25,000 to $29,999 | 50 (18.3%) | 16 (12.8%) |
| $30,000 to $34,999 | 49 (17.9%) | 0 (0.0%) |
| $35,000 to $39,999 | 13 (4.8%) | 17 (13.6%) |
| $40,000 to $44,999 | 13 (4.8%) | 0 (0.0%) |
| $45,000 to $49,999 | 54 (19.8%) | 0 (0.0%) |
| $50,000 to $54,999 | 19 (7.0%) | 0 (0.0%) |
| $55,000 to $64,999 | 0 (0.0%) | 0 (0.0%) |
| $65,000 to $74,999 | 0 (0.0%) | 0 (0.0%) |
| $75,000 to $99,999 | 0 (0.0%) | 0 (0.0%) |
| $100,000+ | 14 (5.1%) | 0 (0.0%) |
| Total | 273 (100.0%) | 125 (100.0%) |
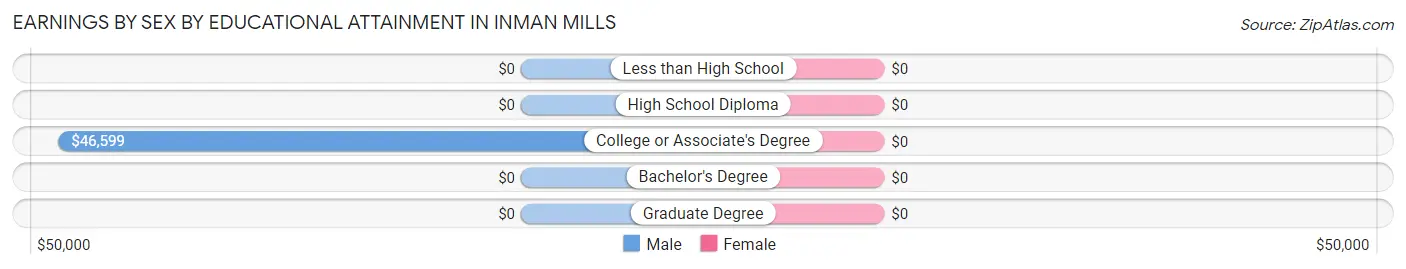
Earnings by Sex by Educational Attainment in Inman Mills
| Educational Attainment | Male Income | Female Income |
| Less than High School | - | - |
| High School Diploma | - | - |
| College or Associate's Degree | $46,599 | $0 |
| Bachelor's Degree | - | - |
| Graduate Degree | - | - |
| Total | $33,469 | $23,500 |
Family Income in Inman Mills
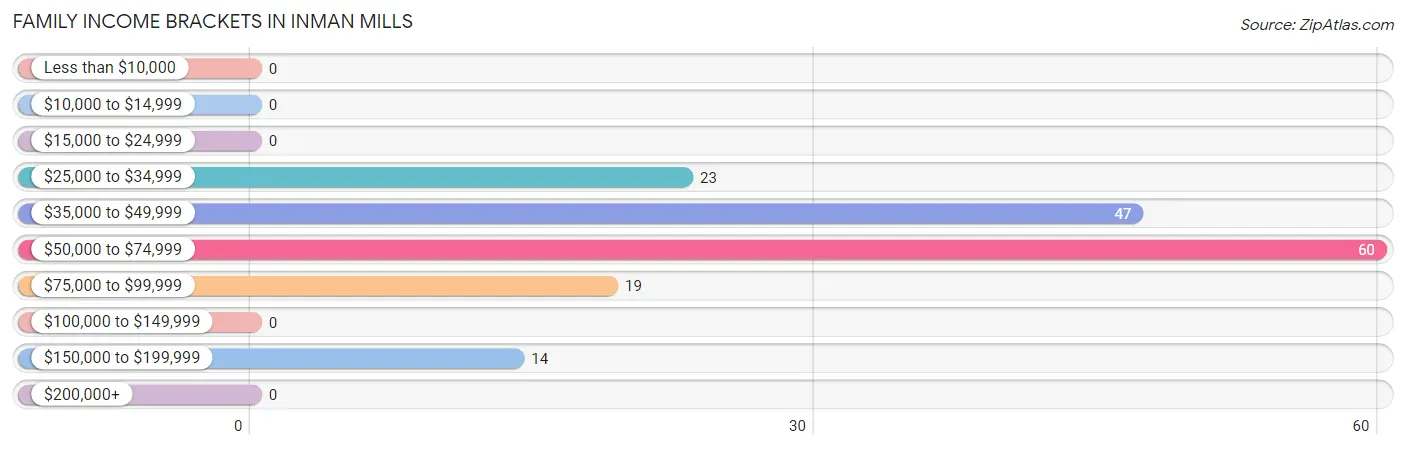
Family Income Brackets in Inman Mills
According to the Inman Mills family income data, there are 60 families falling into the $50,000 to $74,999 income range, which is the most common income bracket and makes up 36.8% of all families.
| Income Bracket | # Families | % Families |
| Less than $10,000 | 0 | 0.0% |
| $10,000 to $14,999 | 0 | 0.0% |
| $15,000 to $24,999 | 0 | 0.0% |
| $25,000 to $34,999 | 23 | 14.1% |
| $35,000 to $49,999 | 47 | 28.8% |
| $50,000 to $74,999 | 60 | 36.8% |
| $75,000 to $99,999 | 19 | 11.7% |
| $100,000 to $149,999 | 0 | 0.0% |
| $150,000 to $199,999 | 14 | 8.6% |
| $200,000+ | 0 | 0.0% |
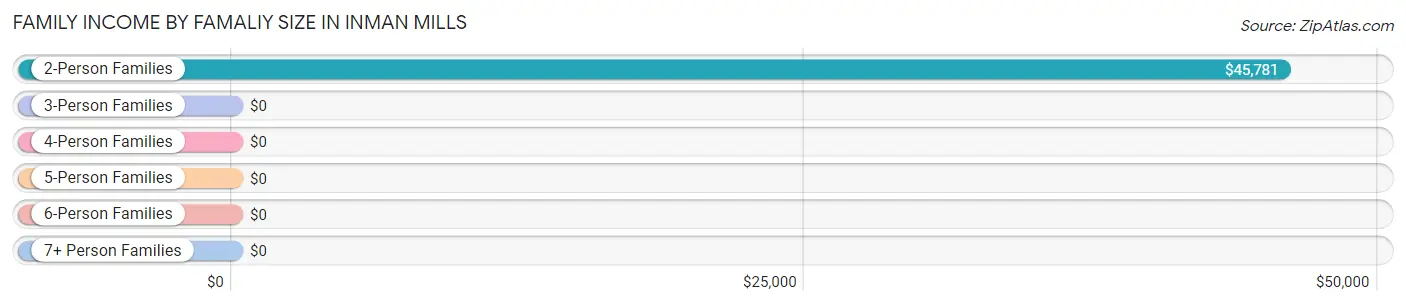
Family Income by Famaliy Size in Inman Mills
2-person families (82 | 50.3%) account for the highest median family income in Inman Mills with $45,781 per family, while 2-person families (82 | 50.3%) have the highest median income of $22,890 per family member.
| Income Bracket | # Families | Median Income |
| 2-Person Families | 82 (50.3%) | $45,781 |
| 3-Person Families | 49 (30.1%) | $0 |
| 4-Person Families | 18 (11.0%) | $0 |
| 5-Person Families | 14 (8.6%) | $0 |
| 6-Person Families | 0 (0.0%) | $0 |
| 7+ Person Families | 0 (0.0%) | $0 |
| Total | 163 (100.0%) | $58,087 |
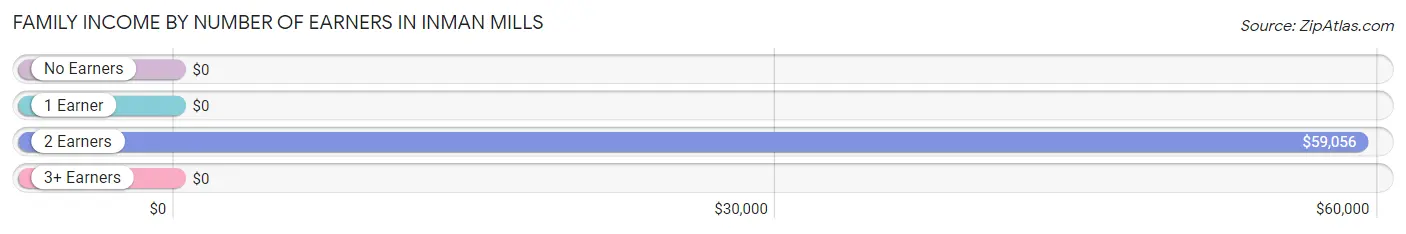
Family Income by Number of Earners in Inman Mills
| Number of Earners | # Families | Median Income |
| No Earners | 16 (9.8%) | $0 |
| 1 Earner | 36 (22.1%) | $0 |
| 2 Earners | 97 (59.5%) | $59,056 |
| 3+ Earners | 14 (8.6%) | $0 |
| Total | 163 (100.0%) | $58,087 |
Household Income in Inman Mills
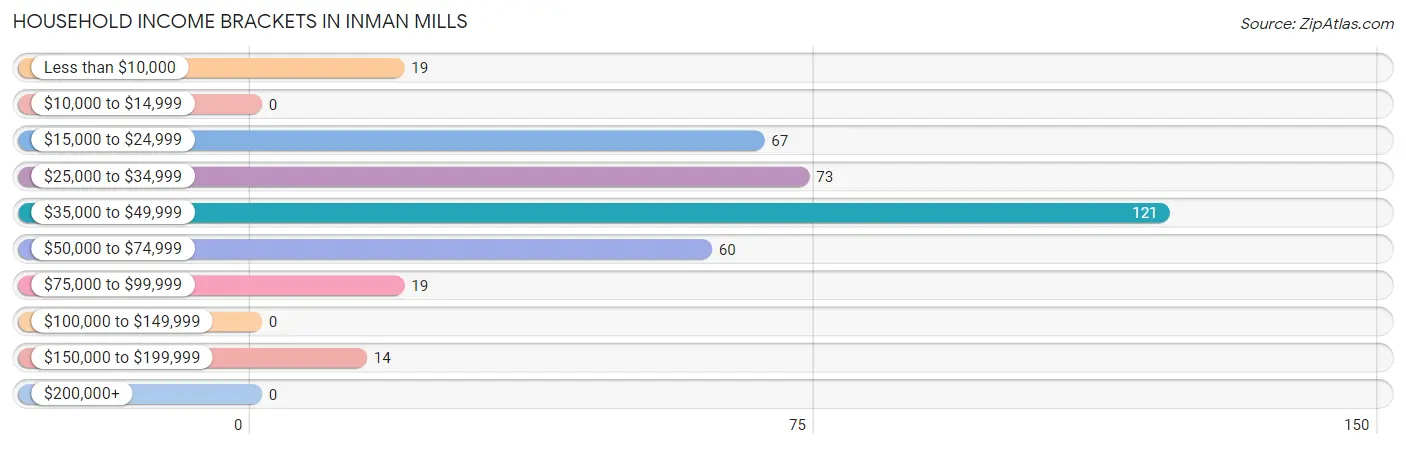
Household Income Brackets in Inman Mills
With 121 households falling in the category, the $35,000 to $49,999 income range is the most frequent in Inman Mills, accounting for 32.4% of all households.
| Income Bracket | # Households | % Households |
| Less than $10,000 | 19 | 5.1% |
| $10,000 to $14,999 | 0 | 0.0% |
| $15,000 to $24,999 | 67 | 18.0% |
| $25,000 to $34,999 | 73 | 19.6% |
| $35,000 to $49,999 | 121 | 32.4% |
| $50,000 to $74,999 | 60 | 16.1% |
| $75,000 to $99,999 | 19 | 5.1% |
| $100,000 to $149,999 | 0 | 0.0% |
| $150,000 to $199,999 | 14 | 3.8% |
| $200,000+ | 0 | 0.0% |
Household Income by Householder Age in Inman Mills
The median household income in Inman Mills is $41,007, with the highest median household income of $46,105 found in the 45 to 64 years age bracket for the primary householder. A total of 168 households (45.0%) fall into this category. Meanwhile, the 15 to 24 years age bracket for the primary householder has the lowest median household income of $0, with 13 households (3.5%) in this group.
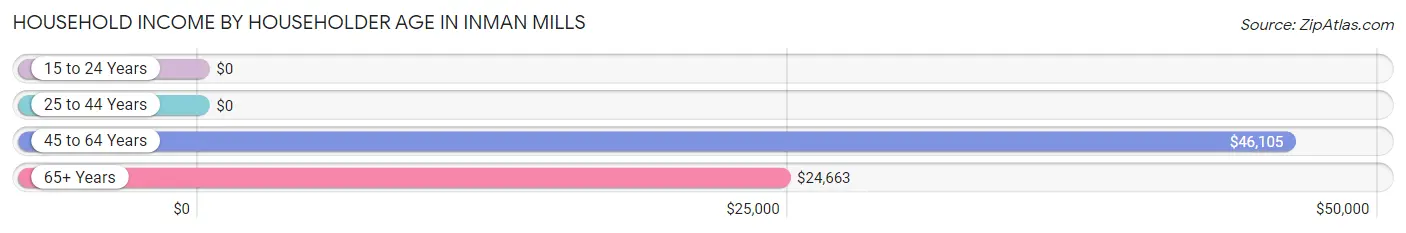
| Income Bracket | # Households | Median Income |
| 15 to 24 Years | 13 (3.5%) | $0 |
| 25 to 44 Years | 64 (17.2%) | $0 |
| 45 to 64 Years | 168 (45.0%) | $46,105 |
| 65+ Years | 128 (34.3%) | $24,663 |
| Total | 373 (100.0%) | $41,007 |
Poverty in Inman Mills
Income Below Poverty by Sex and Age in Inman Mills
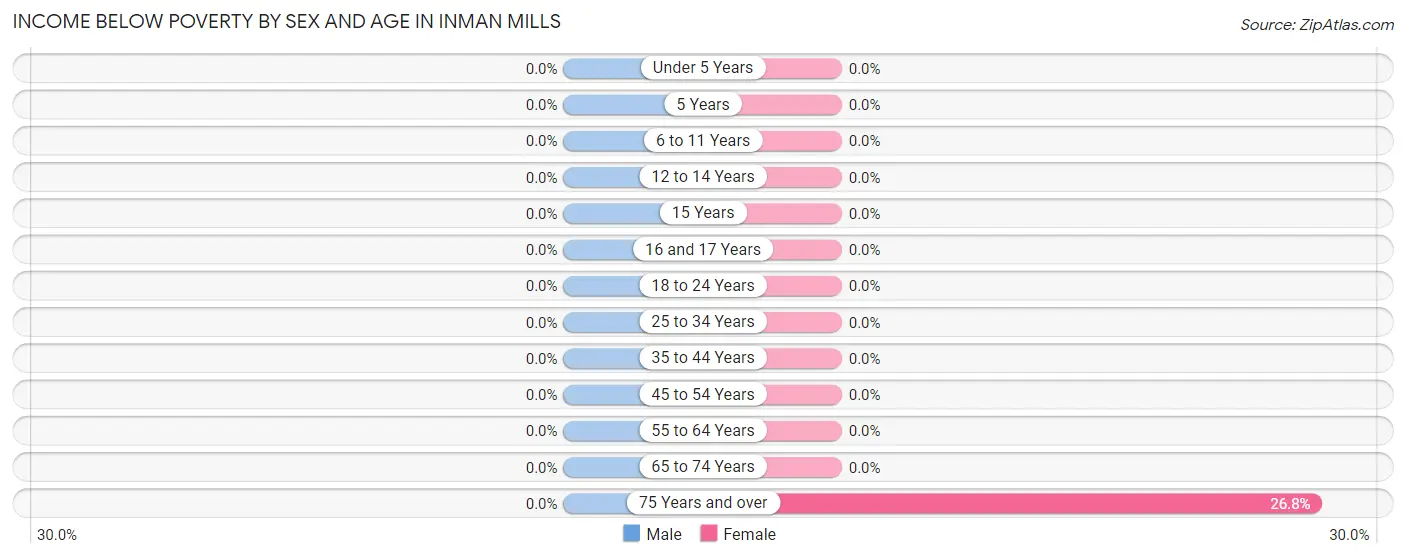
| Age Bracket | Male | Female |
| Under 5 Years | 0 (0.0%) | 0 (0.0%) |
| 5 Years | 0 (0.0%) | 0 (0.0%) |
| 6 to 11 Years | 0 (0.0%) | 0 (0.0%) |
| 12 to 14 Years | 0 (0.0%) | 0 (0.0%) |
| 15 Years | 0 (0.0%) | 0 (0.0%) |
| 16 and 17 Years | 0 (0.0%) | 0 (0.0%) |
| 18 to 24 Years | 0 (0.0%) | 0 (0.0%) |
| 25 to 34 Years | 0 (0.0%) | 0 (0.0%) |
| 35 to 44 Years | 0 (0.0%) | 0 (0.0%) |
| 45 to 54 Years | 0 (0.0%) | 0 (0.0%) |
| 55 to 64 Years | 0 (0.0%) | 0 (0.0%) |
| 65 to 74 Years | 0 (0.0%) | 0 (0.0%) |
| 75 Years and over | 0 (0.0%) | 19 (26.8%) |
| Total | 0 (0.0%) | 19 (7.3%) |
Income Above Poverty by Sex and Age in Inman Mills
According to the poverty statistics in Inman Mills, males aged 6 to 11 years and females aged 16 and 17 years are the age groups that are most secure financially, with 100.0% of males and 100.0% of females in these age groups living above the poverty line.
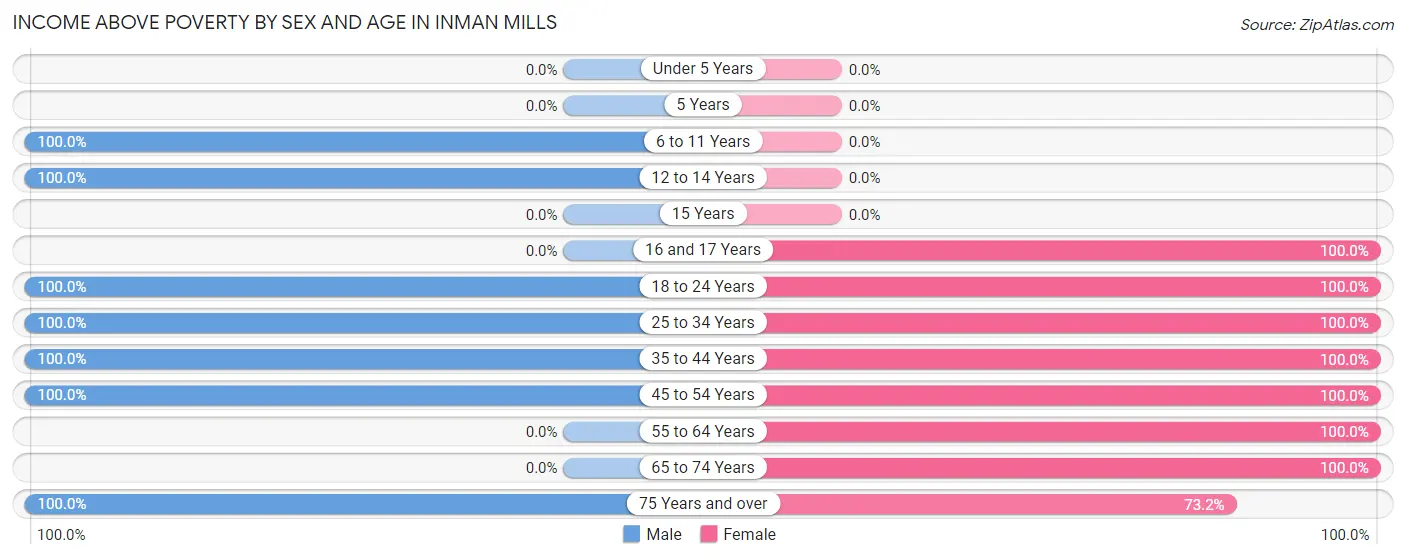
| Age Bracket | Male | Female |
| Under 5 Years | 0 (0.0%) | 0 (0.0%) |
| 5 Years | 0 (0.0%) | 0 (0.0%) |
| 6 to 11 Years | 25 (100.0%) | 0 (0.0%) |
| 12 to 14 Years | 71 (100.0%) | 0 (0.0%) |
| 15 Years | 0 (0.0%) | 0 (0.0%) |
| 16 and 17 Years | 0 (0.0%) | 15 (100.0%) |
| 18 to 24 Years | 13 (100.0%) | 16 (100.0%) |
| 25 to 34 Years | 32 (100.0%) | 29 (100.0%) |
| 35 to 44 Years | 32 (100.0%) | 16 (100.0%) |
| 45 to 54 Years | 196 (100.0%) | 65 (100.0%) |
| 55 to 64 Years | 0 (0.0%) | 11 (100.0%) |
| 65 to 74 Years | 0 (0.0%) | 38 (100.0%) |
| 75 Years and over | 34 (100.0%) | 52 (73.2%) |
| Total | 403 (100.0%) | 242 (92.7%) |
Income Below Poverty Among Married-Couple Families in Inman Mills
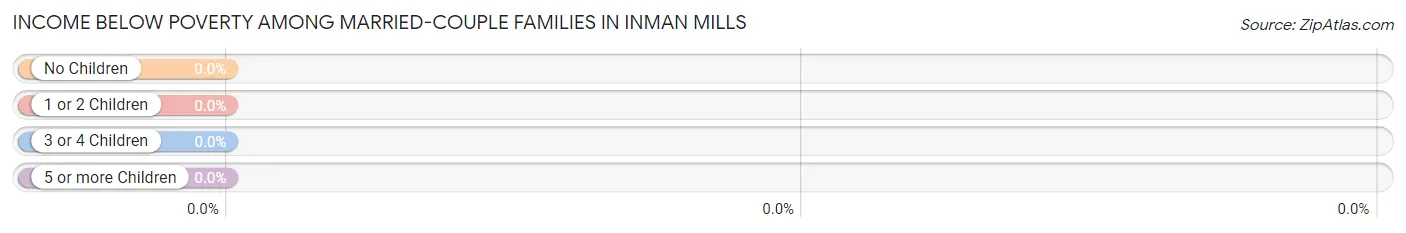
| Children | Above Poverty | Below Poverty |
| No Children | 59 (100.0%) | 0 (0.0%) |
| 1 or 2 Children | 67 (100.0%) | 0 (0.0%) |
| 3 or 4 Children | 0 (0.0%) | 0 (0.0%) |
| 5 or more Children | 0 (0.0%) | 0 (0.0%) |
| Total | 126 (100.0%) | 0 (0.0%) |
Income Below Poverty Among Single-Parent Households in Inman Mills
| Children | Single Father | Single Mother |
| No Children | 0 (0.0%) | 0 (0.0%) |
| 1 or 2 Children | 0 (0.0%) | 0 (0.0%) |
| 3 or 4 Children | 0 (0.0%) | 0 (0.0%) |
| 5 or more Children | 0 (0.0%) | 0 (0.0%) |
| Total | 0 (0.0%) | 0 (0.0%) |
Income Below Poverty Among Married-Couple vs Single-Parent Households in Inman Mills
| Children | Married-Couple Families | Single-Parent Households |
| No Children | 0 (0.0%) | 0 (0.0%) |
| 1 or 2 Children | 0 (0.0%) | 0 (0.0%) |
| 3 or 4 Children | 0 (0.0%) | 0 (0.0%) |
| 5 or more Children | 0 (0.0%) | 0 (0.0%) |
| Total | 0 (0.0%) | 0 (0.0%) |
Race in Inman Mills
The most populous races in Inman Mills are White / Caucasian (732 | 76.6%), Black / African American (159 | 16.6%), and Asian (56 | 5.9%).
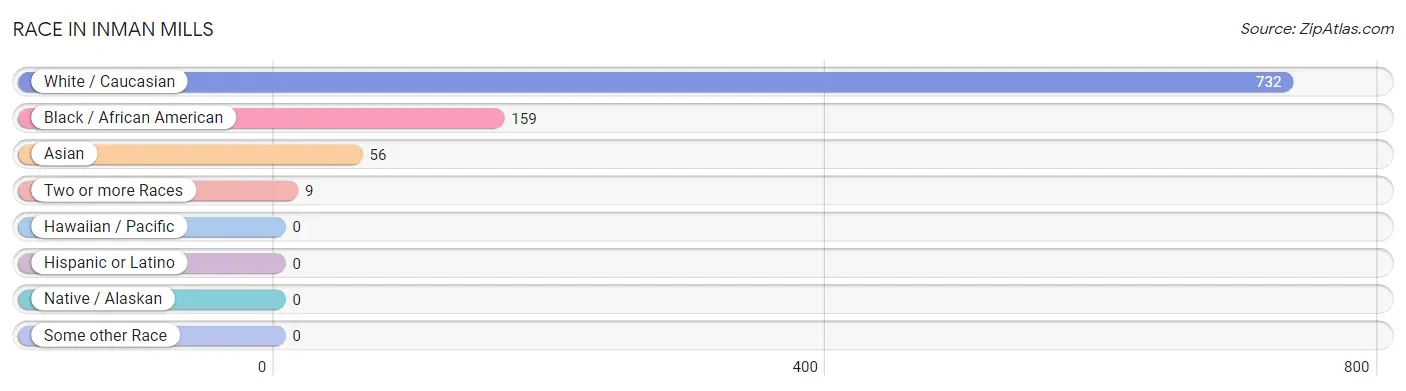
| Race | # Population | % Population |
| Asian | 56 | 5.9% |
| Black / African American | 159 | 16.6% |
| Hawaiian / Pacific | 0 | 0.0% |
| Hispanic or Latino | 0 | 0.0% |
| Native / Alaskan | 0 | 0.0% |
| White / Caucasian | 732 | 76.6% |
| Two or more Races | 9 | 0.9% |
| Some other Race | 0 | 0.0% |
| Total | 956 | 100.0% |
Ancestry in Inman Mills
The most populous ancestries reported in Inman Mills are English (78 | 8.2%), Irish (78 | 8.2%), American (56 | 5.9%), Indian (Asian) (56 | 5.9%), and German (50 | 5.2%), together accounting for 33.3% of all Inman Mills residents.
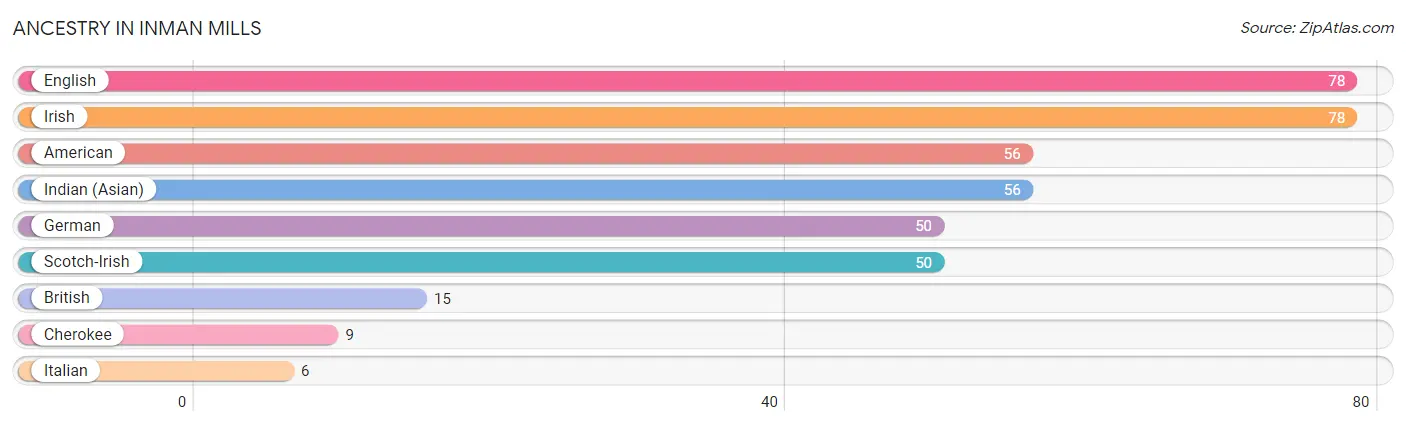
| Ancestry | # Population | % Population |
| American | 56 | 5.9% |
| British | 15 | 1.6% |
| Cherokee | 9 | 0.9% |
| English | 78 | 8.2% |
| German | 50 | 5.2% |
| Indian (Asian) | 56 | 5.9% |
| Irish | 78 | 8.2% |
| Italian | 6 | 0.6% |
| Scotch-Irish | 50 | 5.2% | View All 9 Rows |
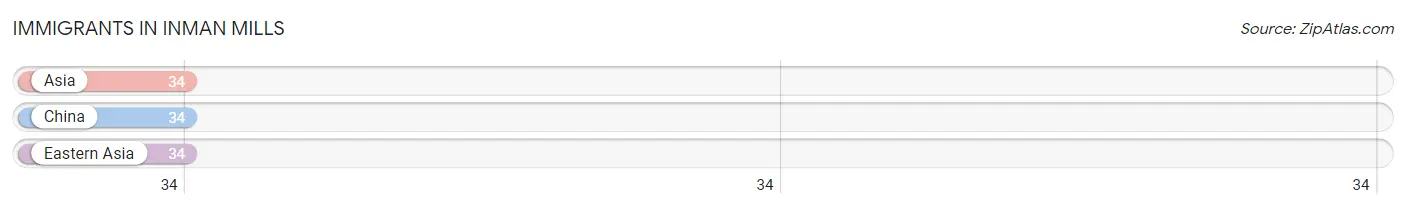
Immigrants in Inman Mills
The most numerous immigrant groups reported in Inman Mills came from Asia (34 | 3.6%), China (34 | 3.6%), and Eastern Asia (34 | 3.6%), together accounting for 10.7% of all Inman Mills residents.
| Immigration Origin | # Population | % Population |
| Asia | 34 | 3.6% |
| China | 34 | 3.6% |
| Eastern Asia | 34 | 3.6% | View All 3 Rows |
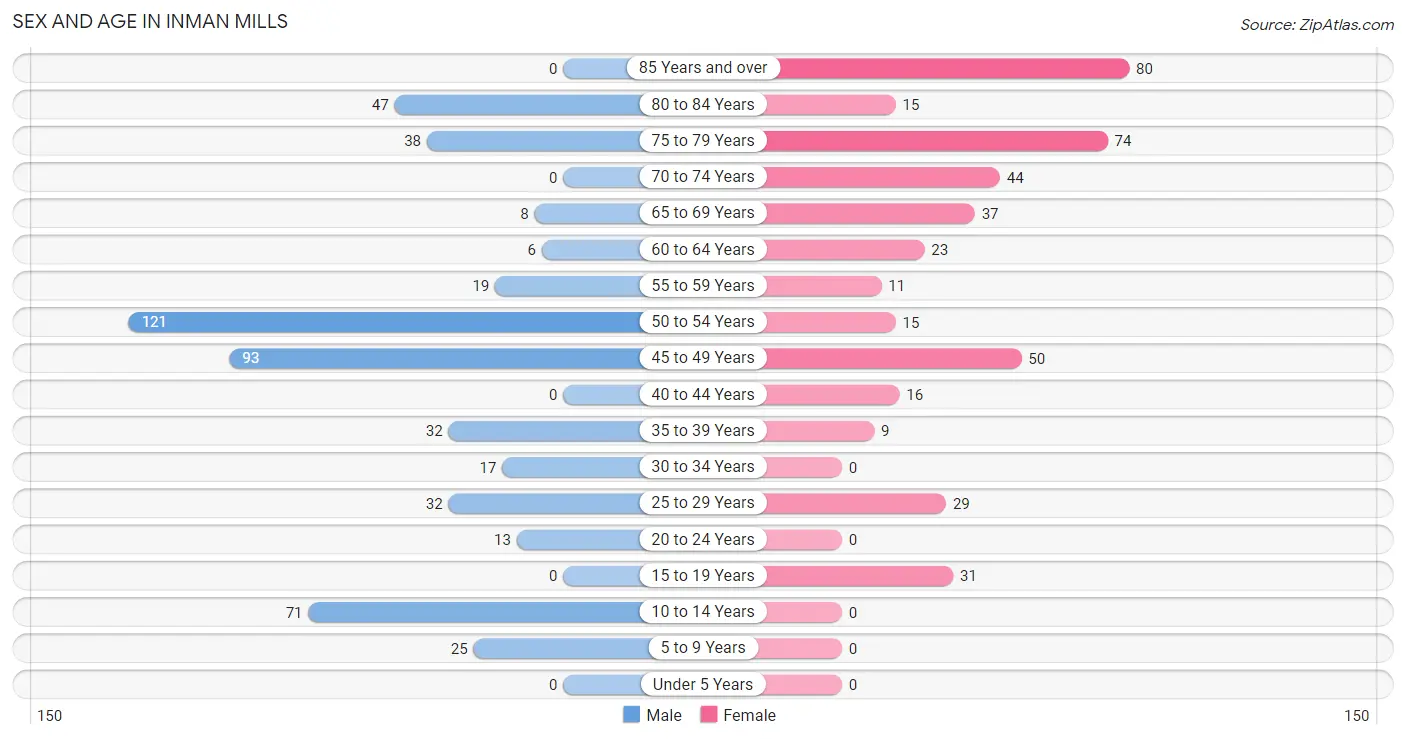
Sex and Age in Inman Mills
Sex and Age in Inman Mills
The most populous age groups in Inman Mills are 50 to 54 Years (121 | 23.2%) for men and 85 Years and over (80 | 18.4%) for women.
| Age Bracket | Male | Female |
| Under 5 Years | 0 (0.0%) | 0 (0.0%) |
| 5 to 9 Years | 25 (4.8%) | 0 (0.0%) |
| 10 to 14 Years | 71 (13.6%) | 0 (0.0%) |
| 15 to 19 Years | 0 (0.0%) | 31 (7.1%) |
| 20 to 24 Years | 13 (2.5%) | 0 (0.0%) |
| 25 to 29 Years | 32 (6.1%) | 29 (6.7%) |
| 30 to 34 Years | 17 (3.3%) | 0 (0.0%) |
| 35 to 39 Years | 32 (6.1%) | 9 (2.1%) |
| 40 to 44 Years | 0 (0.0%) | 16 (3.7%) |
| 45 to 49 Years | 93 (17.8%) | 50 (11.5%) |
| 50 to 54 Years | 121 (23.2%) | 15 (3.5%) |
| 55 to 59 Years | 19 (3.6%) | 11 (2.5%) |
| 60 to 64 Years | 6 (1.1%) | 23 (5.3%) |
| 65 to 69 Years | 8 (1.5%) | 37 (8.5%) |
| 70 to 74 Years | 0 (0.0%) | 44 (10.1%) |
| 75 to 79 Years | 38 (7.3%) | 74 (17.1%) |
| 80 to 84 Years | 47 (9.0%) | 15 (3.5%) |
| 85 Years and over | 0 (0.0%) | 80 (18.4%) |
| Total | 522 (100.0%) | 434 (100.0%) |
Families and Households in Inman Mills
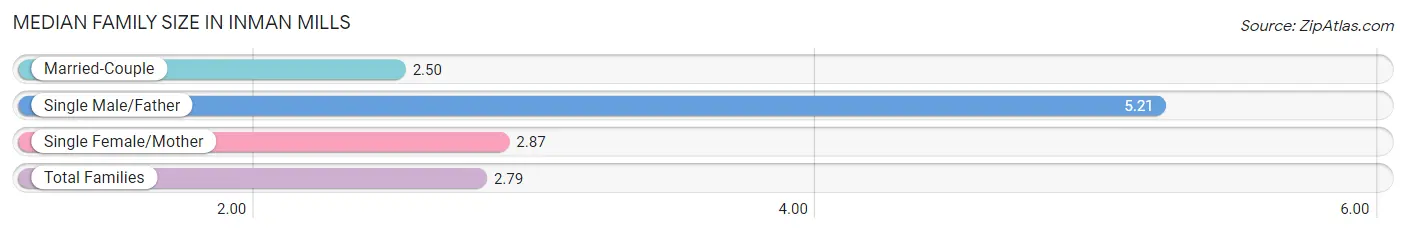
Median Family Size in Inman Mills
The median family size in Inman Mills is 2.79 persons per family, with single male/father families (14 | 8.6%) accounting for the largest median family size of 5.21 persons per family. On the other hand, married-couple families (126 | 77.3%) represent the smallest median family size with 2.50 persons per family.
| Family Type | # Families | Family Size |
| Married-Couple | 126 (77.3%) | 2.50 |
| Single Male/Father | 14 (8.6%) | 5.21 |
| Single Female/Mother | 23 (14.1%) | 2.87 |
| Total Families | 163 (100.0%) | 2.79 |
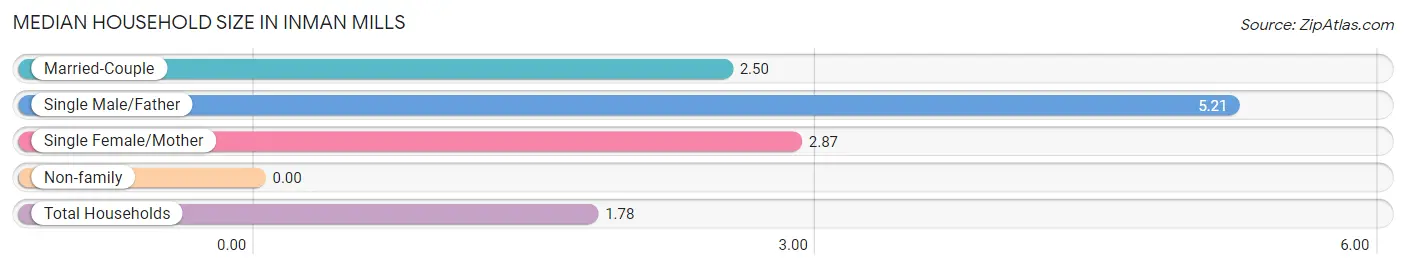
Median Household Size in Inman Mills
| Household Type | # Households | Household Size |
| Married-Couple | 126 (33.8%) | 2.50 |
| Single Male/Father | 14 (3.7%) | 5.21 |
| Single Female/Mother | 23 (6.2%) | 2.87 |
| Non-family | 210 (56.3%) | - |
| Total Households | 373 (100.0%) | 1.78 |
Household Size by Marriage Status in Inman Mills
Out of a total of 373 households in Inman Mills, 163 (43.7%) are family households, while 210 (56.3%) are nonfamily households. The most numerous type of family households are 2-person households, comprising 82, and the most common type of nonfamily households are 1-person households, comprising 210.
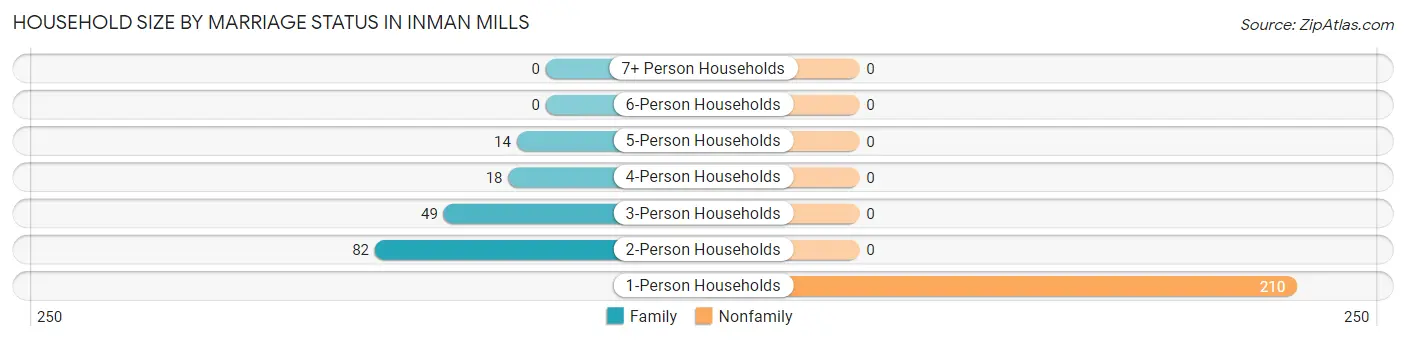
| Household Size | Family Households | Nonfamily Households |
| 1-Person Households | - | 210 (56.3%) |
| 2-Person Households | 82 (22.0%) | 0 (0.0%) |
| 3-Person Households | 49 (13.1%) | 0 (0.0%) |
| 4-Person Households | 18 (4.8%) | 0 (0.0%) |
| 5-Person Households | 14 (3.7%) | 0 (0.0%) |
| 6-Person Households | 0 (0.0%) | 0 (0.0%) |
| 7+ Person Households | 0 (0.0%) | 0 (0.0%) |
| Total | 163 (43.7%) | 210 (56.3%) |
Female Fertility in Inman Mills
Fertility by Age in Inman Mills
| Age Bracket | Women with Births | Births / 1,000 Women |
| 15 to 19 years | 0 (0.0%) | 0.0 |
| 20 to 34 years | 0 (0.0%) | 0.0 |
| 35 to 50 years | 0 (0.0%) | 0.0 |
| Total | 0 (0.0%) | 0.0 |
Fertility by Age by Marriage Status in Inman Mills
| Age Bracket | Married | Unmarried |
| 15 to 19 years | 0 (0.0%) | 0 (0.0%) |
| 20 to 34 years | 0 (0.0%) | 0 (0.0%) |
| 35 to 50 years | 0 (0.0%) | 0 (0.0%) |
| Total | 0 (0.0%) | 0 (0.0%) |
Fertility by Education in Inman Mills
| Educational Attainment | Women with Births | Births / 1,000 Women |
| Less than High School | 0 (0.0%) | 0.0 |
| High School Diploma | 0 (0.0%) | 0.0 |
| College or Associate's Degree | 0 (0.0%) | 0.0 |
| Bachelor's Degree | 0 (0.0%) | 0.0 |
| Graduate Degree | 0 (0.0%) | 0.0 |
| Total | 0 (0.0%) | 0.0 |
Fertility by Education by Marriage Status in Inman Mills
| Educational Attainment | Married | Unmarried |
| Less than High School | 0 (0.0%) | 0 (0.0%) |
| High School Diploma | 0 (0.0%) | 0 (0.0%) |
| College or Associate's Degree | 0 (0.0%) | 0 (0.0%) |
| Bachelor's Degree | 0 (0.0%) | 0 (0.0%) |
| Graduate Degree | 0 (0.0%) | 0 (0.0%) |
| Total | 0 (0.0%) | 0 (0.0%) |
Employment Characteristics in Inman Mills
Employment by Class of Employer in Inman Mills
Among the 355 employed individuals in Inman Mills, private company employees (258 | 72.7%), not-for-profit organizations (50 | 14.1%), and self-employed (not incorporated) (34 | 9.6%) make up the most common classes of employment.
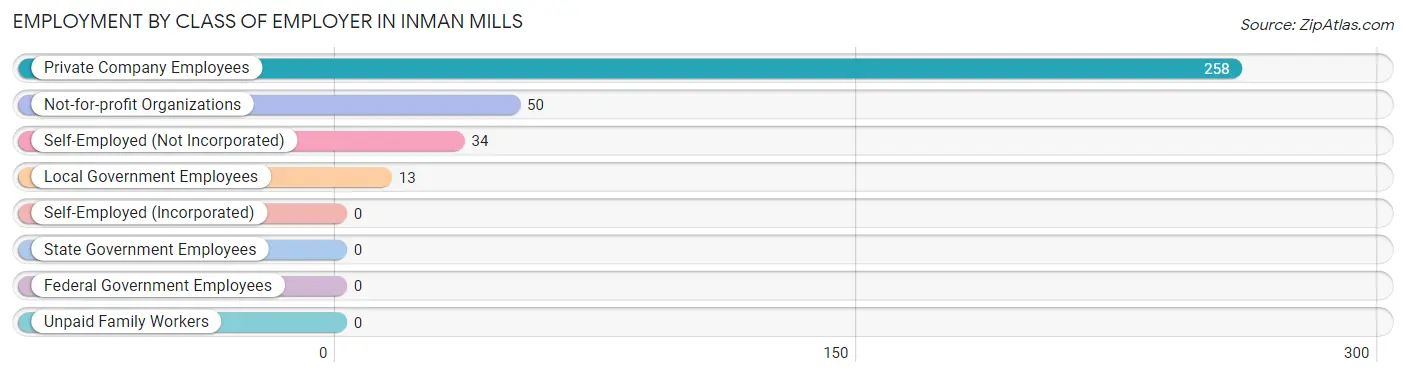
| Employer Class | # Employees | % Employees |
| Private Company Employees | 258 | 72.7% |
| Self-Employed (Incorporated) | 0 | 0.0% |
| Self-Employed (Not Incorporated) | 34 | 9.6% |
| Not-for-profit Organizations | 50 | 14.1% |
| Local Government Employees | 13 | 3.7% |
| State Government Employees | 0 | 0.0% |
| Federal Government Employees | 0 | 0.0% |
| Unpaid Family Workers | 0 | 0.0% |
| Total | 355 | 100.0% |
Employment Status by Age in Inman Mills
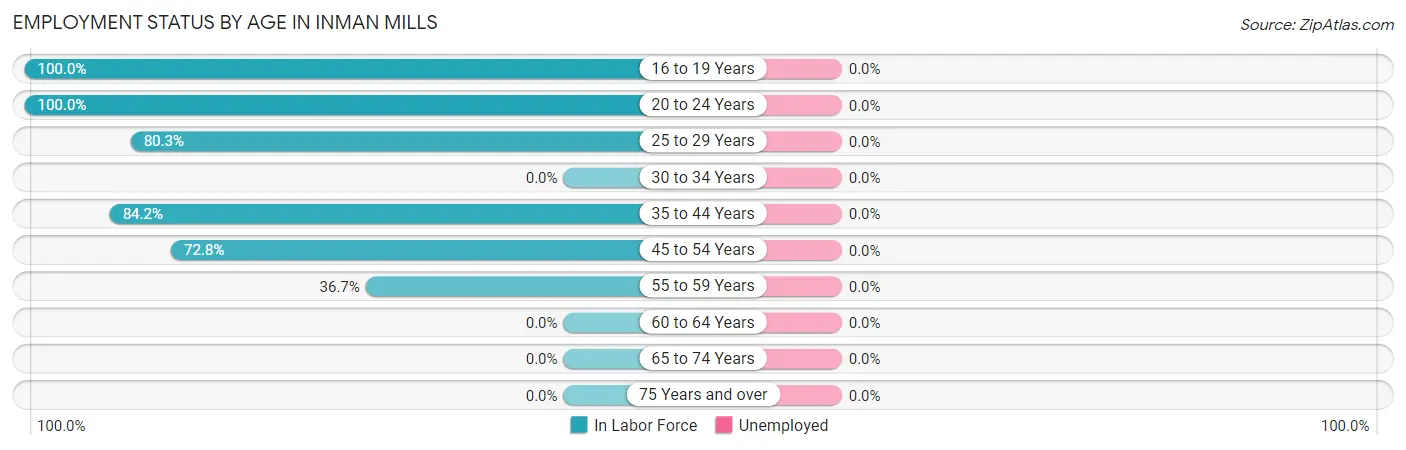
| Age Bracket | In Labor Force | Unemployed |
| 16 to 19 Years | 31 (100.0%) | 0 (0.0%) |
| 20 to 24 Years | 13 (100.0%) | 0 (0.0%) |
| 25 to 29 Years | 49 (80.3%) | 0 (0.0%) |
| 30 to 34 Years | 0 (0.0%) | 0 (0.0%) |
| 35 to 44 Years | 48 (84.2%) | 0 (0.0%) |
| 45 to 54 Years | 203 (72.8%) | 0 (0.0%) |
| 55 to 59 Years | 11 (36.7%) | 0 (0.0%) |
| 60 to 64 Years | 0 (0.0%) | 0 (0.0%) |
| 65 to 74 Years | 0 (0.0%) | 0 (0.0%) |
| 75 Years and over | 0 (0.0%) | 0 (0.0%) |
| Total | 355 (41.3%) | 0 (0.0%) |
Employment Status by Educational Attainment in Inman Mills
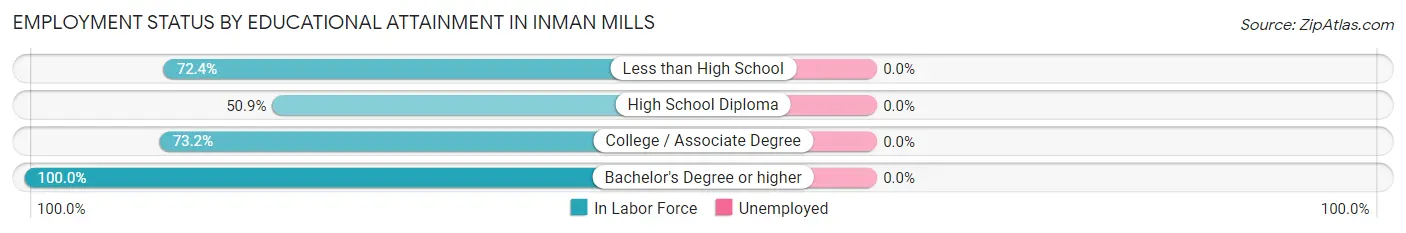
| Educational Attainment | In Labor Force | Unemployed |
| Less than High School | 84 (72.4%) | 0 (0.0%) |
| High School Diploma | 85 (50.9%) | 0 (0.0%) |
| College / Associate Degree | 131 (73.2%) | 0 (0.0%) |
| Bachelor's Degree or higher | 11 (100.0%) | 0 (0.0%) |
| Total | 311 (65.8%) | 0 (0.0%) |
Employment Occupations by Sex in Inman Mills
Management, Business, Science and Arts Occupations
The most common Management, Business, Science and Arts occupations in Inman Mills are Community & Social Service (11 | 3.1%), and Education Instruction & Library (11 | 3.1%).
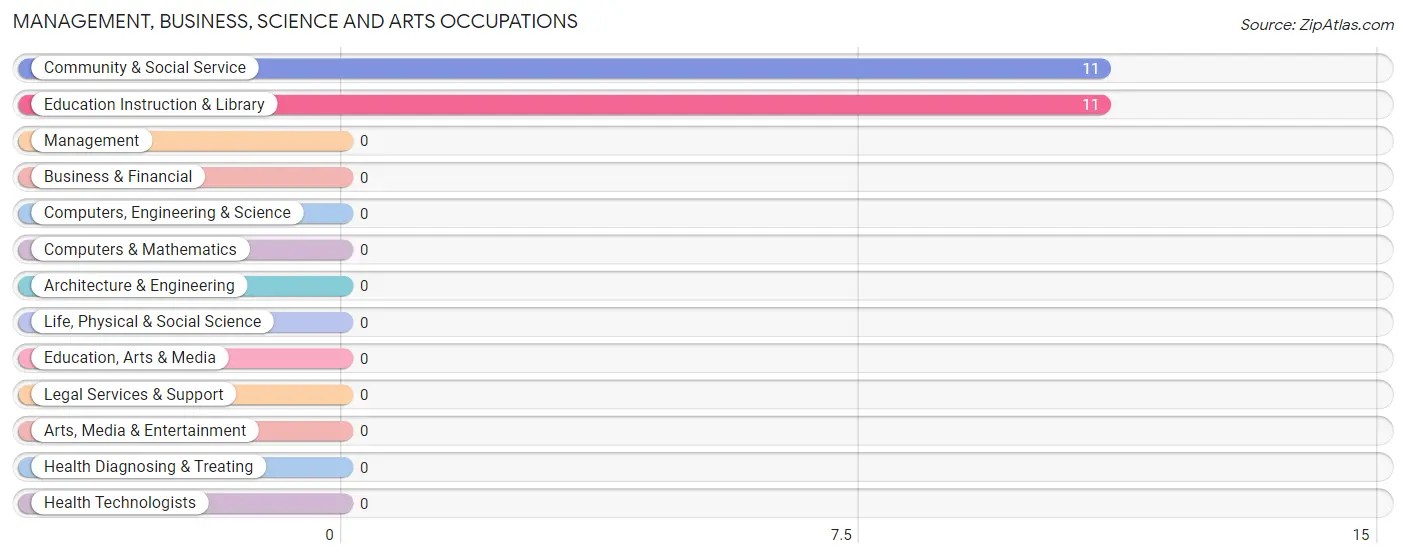
Management, Business, Science and Arts Occupations by Sex
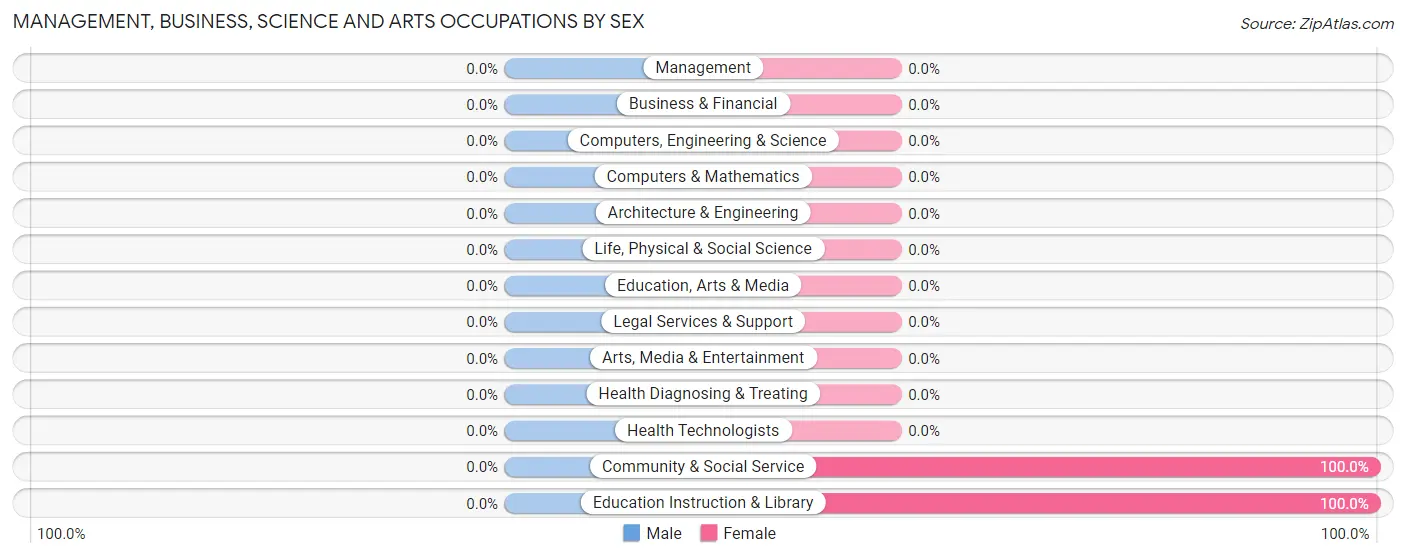
| Occupation | Male | Female |
| Management | 0 (0.0%) | 0 (0.0%) |
| Business & Financial | 0 (0.0%) | 0 (0.0%) |
| Computers, Engineering & Science | 0 (0.0%) | 0 (0.0%) |
| Computers & Mathematics | 0 (0.0%) | 0 (0.0%) |
| Architecture & Engineering | 0 (0.0%) | 0 (0.0%) |
| Life, Physical & Social Science | 0 (0.0%) | 0 (0.0%) |
| Community & Social Service | 0 (0.0%) | 11 (100.0%) |
| Education, Arts & Media | 0 (0.0%) | 0 (0.0%) |
| Legal Services & Support | 0 (0.0%) | 0 (0.0%) |
| Education Instruction & Library | 0 (0.0%) | 11 (100.0%) |
| Arts, Media & Entertainment | 0 (0.0%) | 0 (0.0%) |
| Health Diagnosing & Treating | 0 (0.0%) | 0 (0.0%) |
| Health Technologists | 0 (0.0%) | 0 (0.0%) |
| Total (Category) | 0 (0.0%) | 11 (100.0%) |
| Total (Overall) | 230 (64.8%) | 125 (35.2%) |
Services Occupations
The most common Services occupations in Inman Mills are , and Food Preparation & Serving (49 | 13.8%).
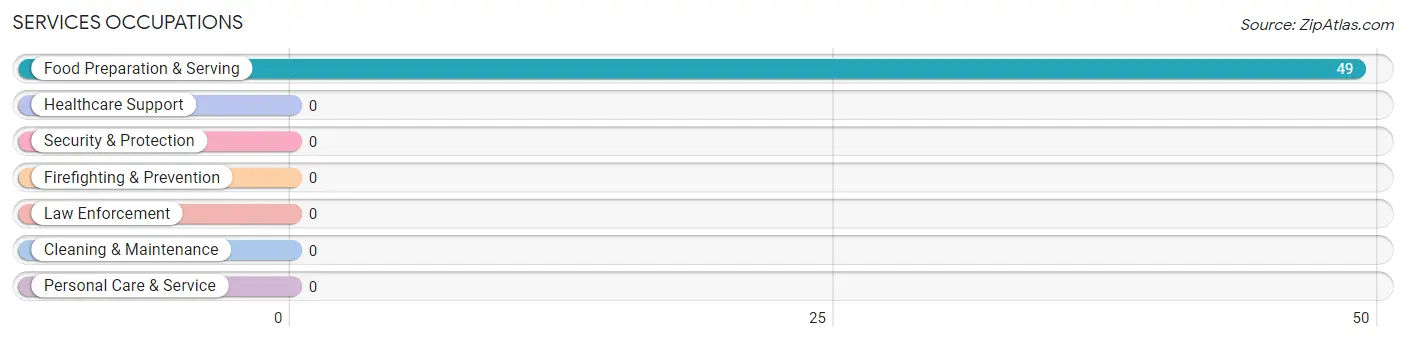
Services Occupations by Sex
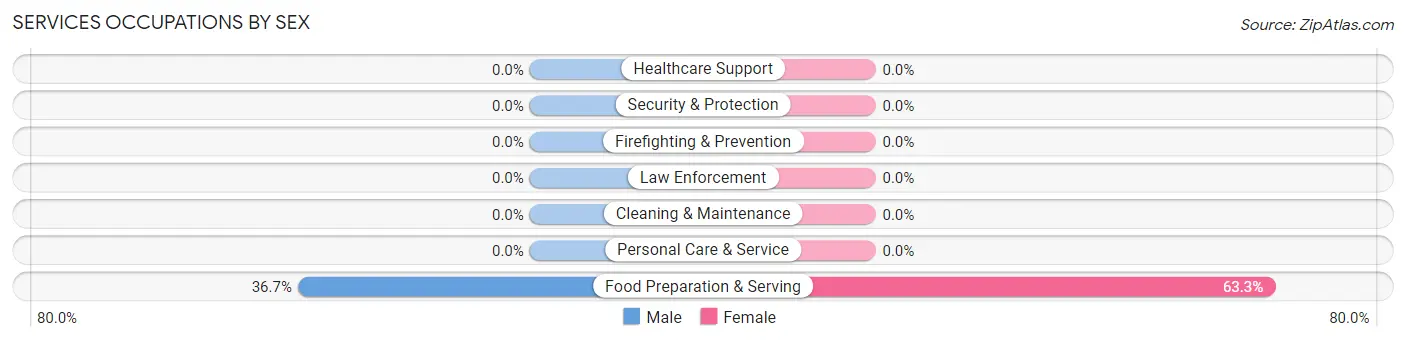
| Occupation | Male | Female |
| Healthcare Support | 0 (0.0%) | 0 (0.0%) |
| Security & Protection | 0 (0.0%) | 0 (0.0%) |
| Firefighting & Prevention | 0 (0.0%) | 0 (0.0%) |
| Law Enforcement | 0 (0.0%) | 0 (0.0%) |
| Food Preparation & Serving | 18 (36.7%) | 31 (63.3%) |
| Cleaning & Maintenance | 0 (0.0%) | 0 (0.0%) |
| Personal Care & Service | 0 (0.0%) | 0 (0.0%) |
| Total (Category) | 18 (36.7%) | 31 (63.3%) |
| Total (Overall) | 230 (64.8%) | 125 (35.2%) |
Sales and Office Occupations
The most common Sales and Office occupations in Inman Mills are Office & Administration (50 | 14.1%), and Sales & Related (27 | 7.6%).
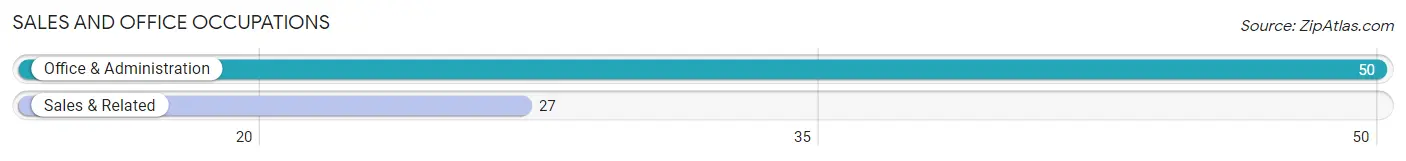
Sales and Office Occupations by Sex
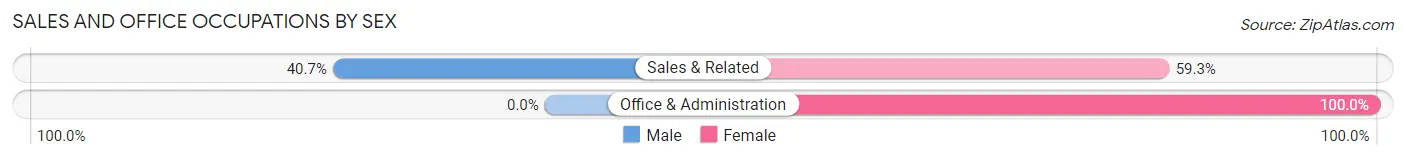
| Occupation | Male | Female |
| Sales & Related | 11 (40.7%) | 16 (59.3%) |
| Office & Administration | 0 (0.0%) | 50 (100.0%) |
| Total (Category) | 11 (14.3%) | 66 (85.7%) |
| Total (Overall) | 230 (64.8%) | 125 (35.2%) |
Natural Resources, Construction and Maintenance Occupations
The most common Natural Resources, Construction and Maintenance occupations in Inman Mills are Installation, Maintenance & Repair (14 | 3.9%), and Construction & Extraction (13 | 3.7%).
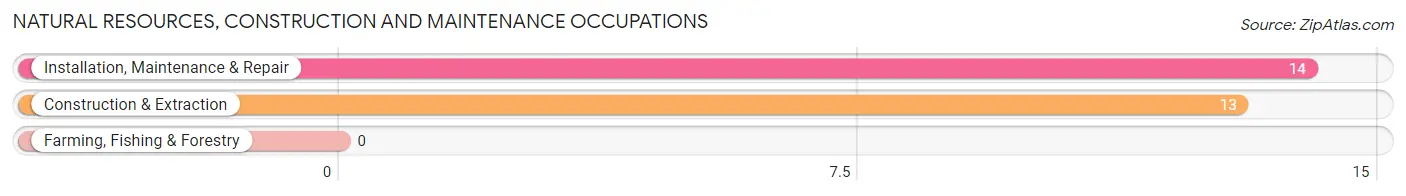
Natural Resources, Construction and Maintenance Occupations by Sex
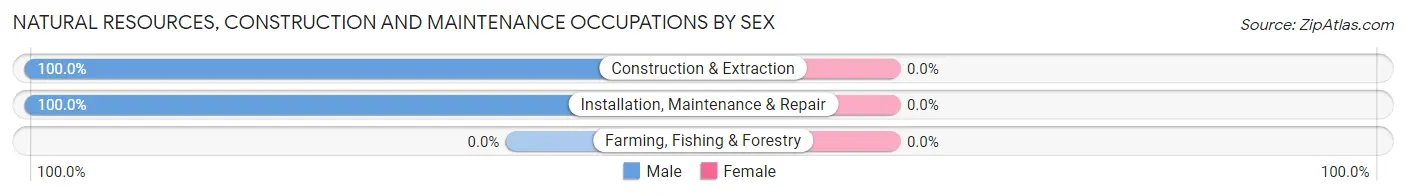
| Occupation | Male | Female |
| Farming, Fishing & Forestry | 0 (0.0%) | 0 (0.0%) |
| Construction & Extraction | 13 (100.0%) | 0 (0.0%) |
| Installation, Maintenance & Repair | 14 (100.0%) | 0 (0.0%) |
| Total (Category) | 27 (100.0%) | 0 (0.0%) |
| Total (Overall) | 230 (64.8%) | 125 (35.2%) |
Production, Transportation and Moving Occupations
The most common Production, Transportation and Moving occupations in Inman Mills are Material Moving (112 | 31.6%), Transportation (49 | 13.8%), and Production (30 | 8.5%).
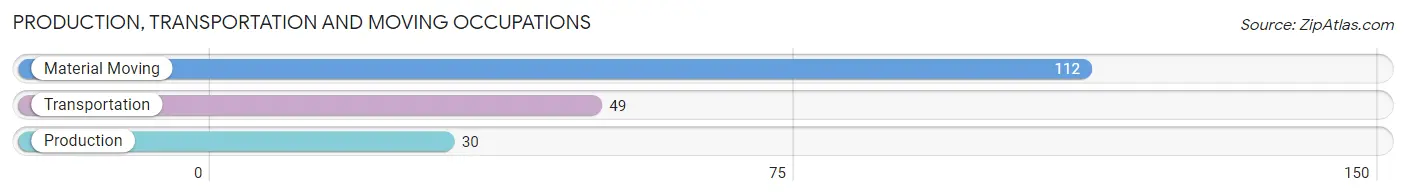
Production, Transportation and Moving Occupations by Sex
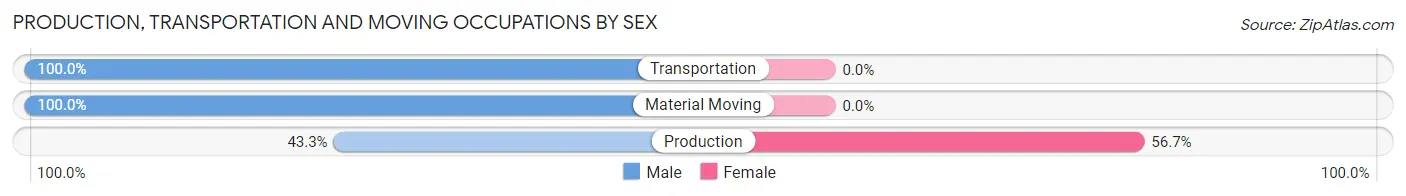
| Occupation | Male | Female |
| Production | 13 (43.3%) | 17 (56.7%) |
| Transportation | 49 (100.0%) | 0 (0.0%) |
| Material Moving | 112 (100.0%) | 0 (0.0%) |
| Total (Category) | 174 (91.1%) | 17 (8.9%) |
| Total (Overall) | 230 (64.8%) | 125 (35.2%) |
Employment Industries by Sex in Inman Mills
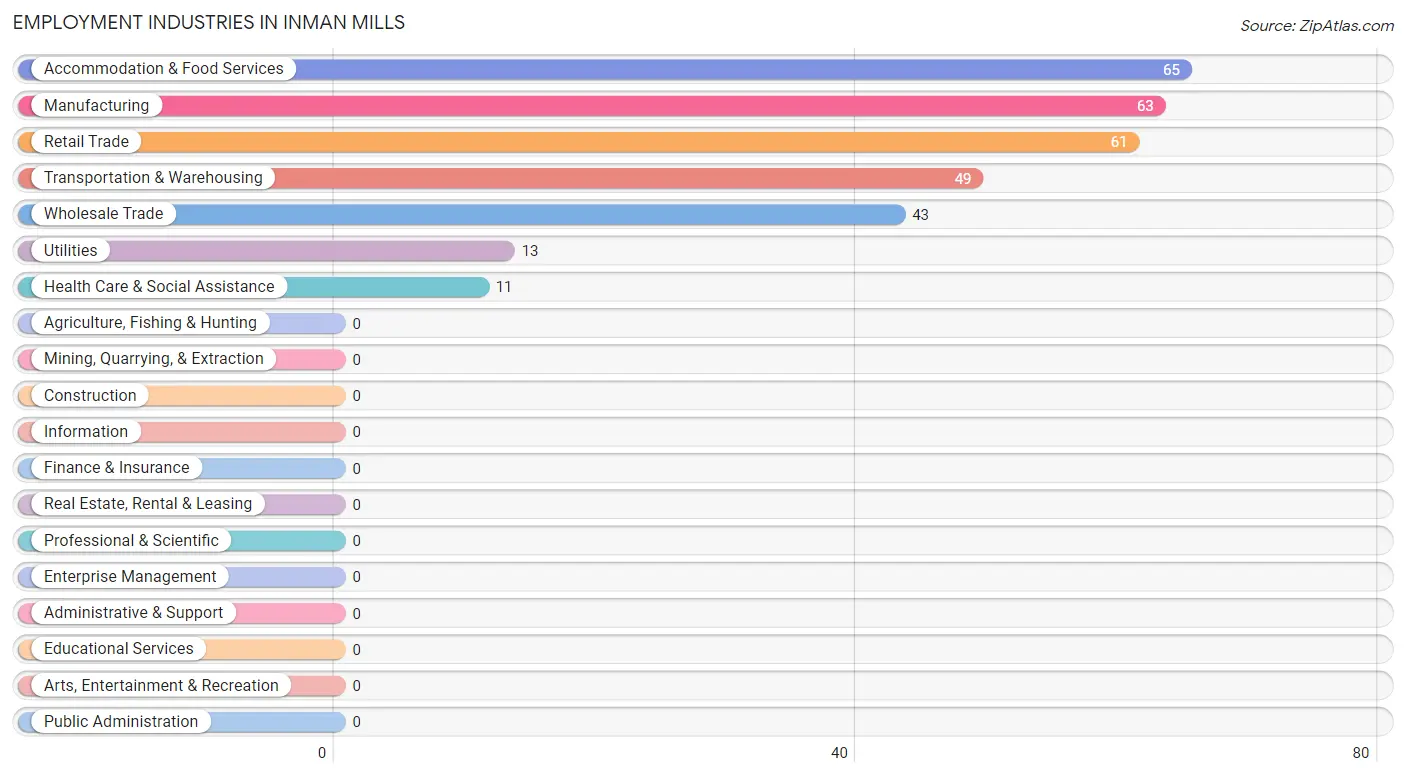
Employment Industries in Inman Mills
The major employment industries in Inman Mills include Accommodation & Food Services (65 | 18.3%), Manufacturing (63 | 17.7%), Retail Trade (61 | 17.2%), Transportation & Warehousing (49 | 13.8%), and Wholesale Trade (43 | 12.1%).
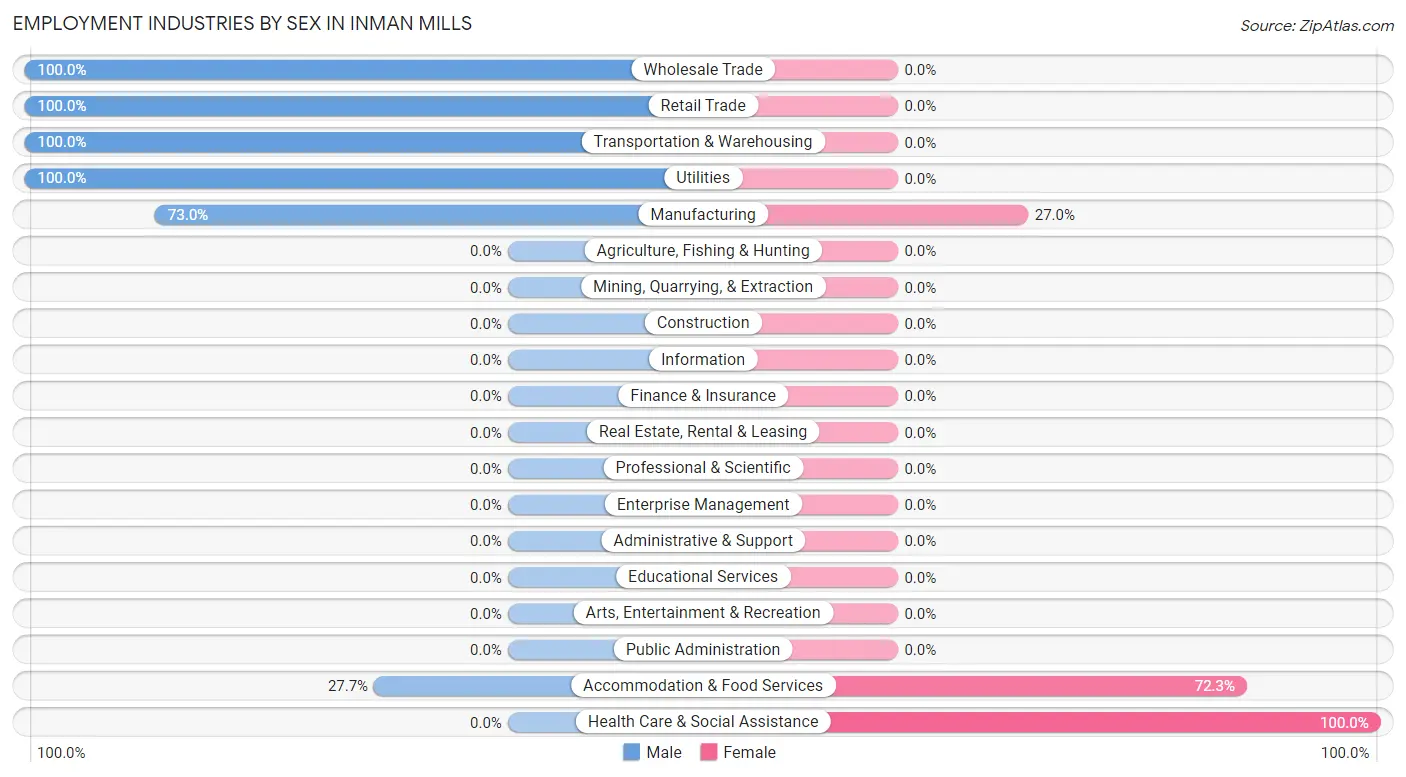
Employment Industries by Sex in Inman Mills
The Inman Mills industries that see more men than women are Wholesale Trade (100.0%), Retail Trade (100.0%), and Transportation & Warehousing (100.0%), whereas the industries that tend to have a higher number of women are Health Care & Social Assistance (100.0%), Accommodation & Food Services (72.3%), and Manufacturing (27.0%).
| Industry | Male | Female |
| Agriculture, Fishing & Hunting | 0 (0.0%) | 0 (0.0%) |
| Mining, Quarrying, & Extraction | 0 (0.0%) | 0 (0.0%) |
| Construction | 0 (0.0%) | 0 (0.0%) |
| Manufacturing | 46 (73.0%) | 17 (27.0%) |
| Wholesale Trade | 43 (100.0%) | 0 (0.0%) |
| Retail Trade | 61 (100.0%) | 0 (0.0%) |
| Transportation & Warehousing | 49 (100.0%) | 0 (0.0%) |
| Utilities | 13 (100.0%) | 0 (0.0%) |
| Information | 0 (0.0%) | 0 (0.0%) |
| Finance & Insurance | 0 (0.0%) | 0 (0.0%) |
| Real Estate, Rental & Leasing | 0 (0.0%) | 0 (0.0%) |
| Professional & Scientific | 0 (0.0%) | 0 (0.0%) |
| Enterprise Management | 0 (0.0%) | 0 (0.0%) |
| Administrative & Support | 0 (0.0%) | 0 (0.0%) |
| Educational Services | 0 (0.0%) | 0 (0.0%) |
| Health Care & Social Assistance | 0 (0.0%) | 11 (100.0%) |
| Arts, Entertainment & Recreation | 0 (0.0%) | 0 (0.0%) |
| Accommodation & Food Services | 18 (27.7%) | 47 (72.3%) |
| Public Administration | 0 (0.0%) | 0 (0.0%) |
| Total | 230 (64.8%) | 125 (35.2%) |
Education in Inman Mills
School Enrollment in Inman Mills
The most common levels of schooling among the 111 students in Inman Mills are middle school (71 | 64.0%), elementary school (25 | 22.5%), and high school (15 | 13.5%).
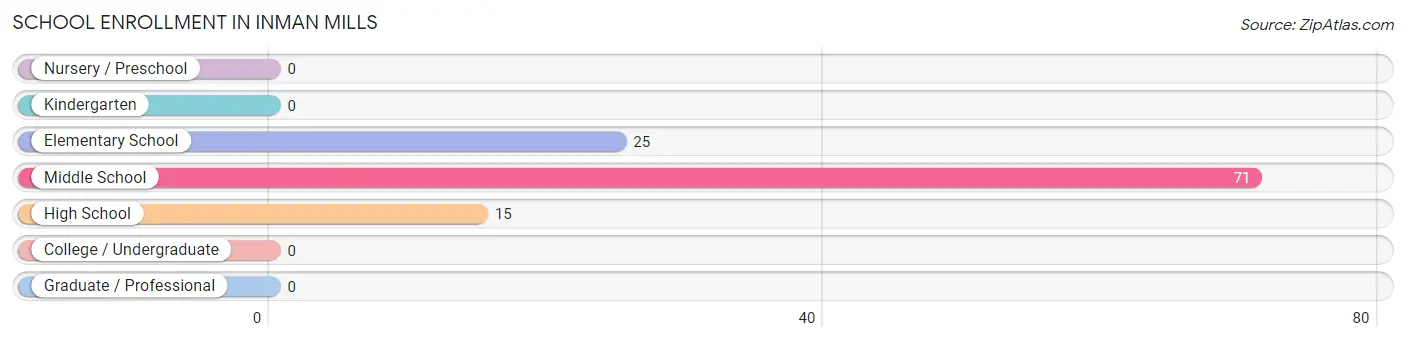
| School Level | # Students | % Students |
| Nursery / Preschool | 0 | 0.0% |
| Kindergarten | 0 | 0.0% |
| Elementary School | 25 | 22.5% |
| Middle School | 71 | 64.0% |
| High School | 15 | 13.5% |
| College / Undergraduate | 0 | 0.0% |
| Graduate / Professional | 0 | 0.0% |
| Total | 111 | 100.0% |
School Enrollment by Age by Funding Source in Inman Mills
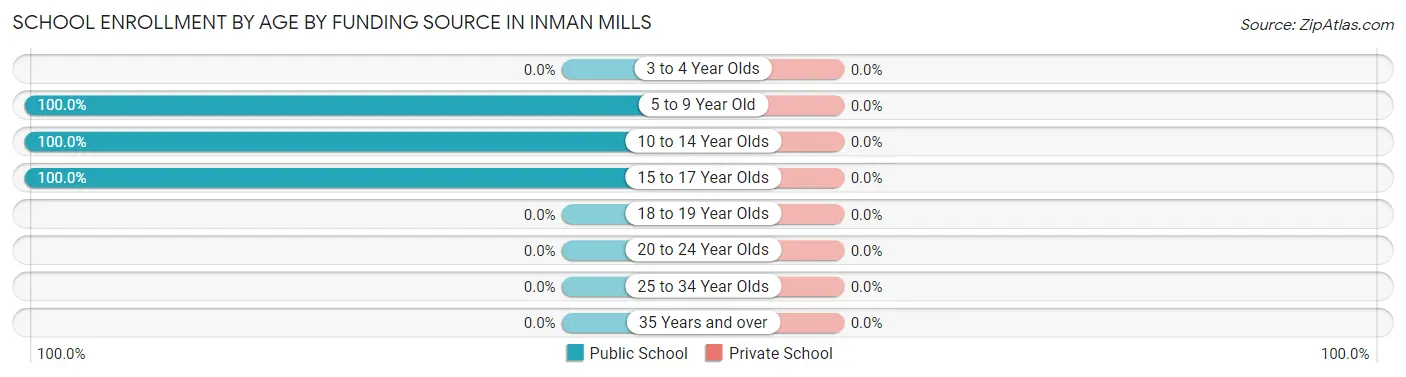
| Age Bracket | Public School | Private School |
| 3 to 4 Year Olds | 0 (0.0%) | 0 (0.0%) |
| 5 to 9 Year Old | 25 (100.0%) | 0 (0.0%) |
| 10 to 14 Year Olds | 71 (100.0%) | 0 (0.0%) |
| 15 to 17 Year Olds | 15 (100.0%) | 0 (0.0%) |
| 18 to 19 Year Olds | 0 (0.0%) | 0 (0.0%) |
| 20 to 24 Year Olds | 0 (0.0%) | 0 (0.0%) |
| 25 to 34 Year Olds | 0 (0.0%) | 0 (0.0%) |
| 35 Years and over | 0 (0.0%) | 0 (0.0%) |
| Total | 111 (100.0%) | 0 (0.0%) |
Educational Attainment by Field of Study in Inman Mills
Science & technology (14 | 23.0%), business (11 | 18.0%), literature & languages (11 | 18.0%), liberal arts & history (11 | 18.0%), and psychology (7 | 11.5%) are the most common fields of study among 61 individuals in Inman Mills who have obtained a bachelor's degree or higher.
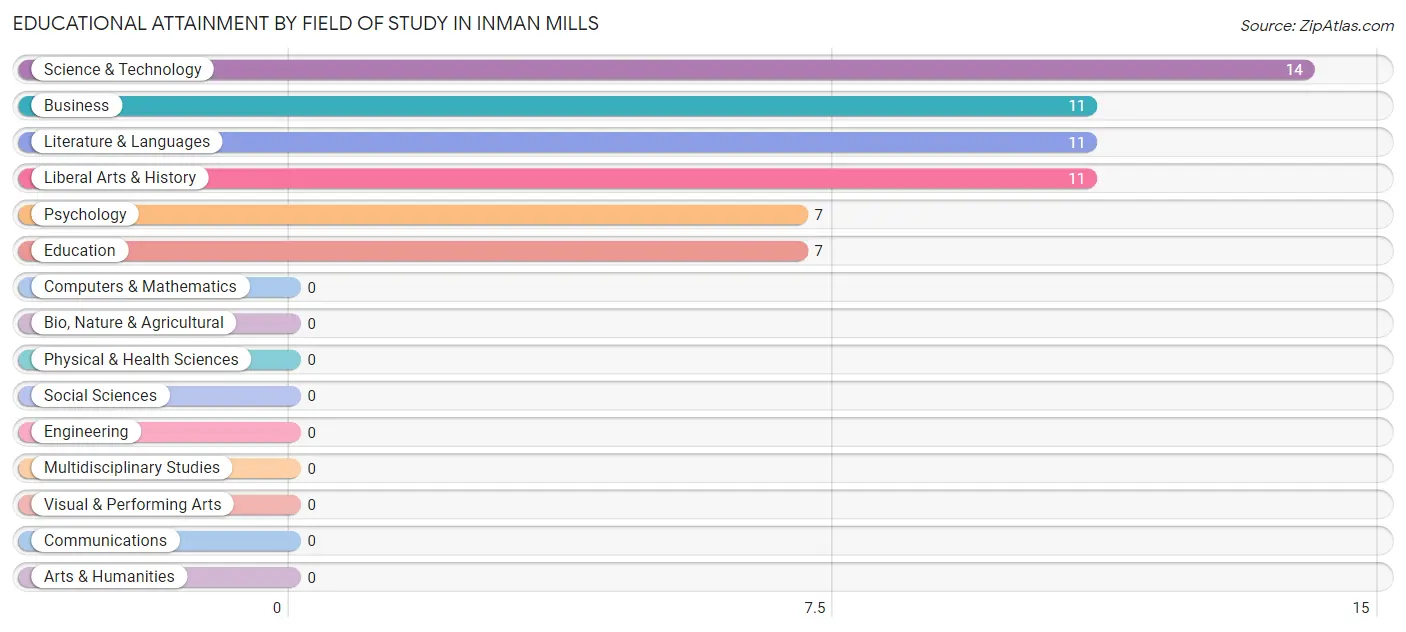
| Field of Study | # Graduates | % Graduates |
| Computers & Mathematics | 0 | 0.0% |
| Bio, Nature & Agricultural | 0 | 0.0% |
| Physical & Health Sciences | 0 | 0.0% |
| Psychology | 7 | 11.5% |
| Social Sciences | 0 | 0.0% |
| Engineering | 0 | 0.0% |
| Multidisciplinary Studies | 0 | 0.0% |
| Science & Technology | 14 | 23.0% |
| Business | 11 | 18.0% |
| Education | 7 | 11.5% |
| Literature & Languages | 11 | 18.0% |
| Liberal Arts & History | 11 | 18.0% |
| Visual & Performing Arts | 0 | 0.0% |
| Communications | 0 | 0.0% |
| Arts & Humanities | 0 | 0.0% |
| Total | 61 | 100.0% |
Transportation & Commute in Inman Mills
Vehicle Availability by Sex in Inman Mills
The most prevalent vehicle ownership categories in Inman Mills are males with 1 vehicle (106, accounting for 46.1%) and females with 1 vehicle (0, making up 84.8%).
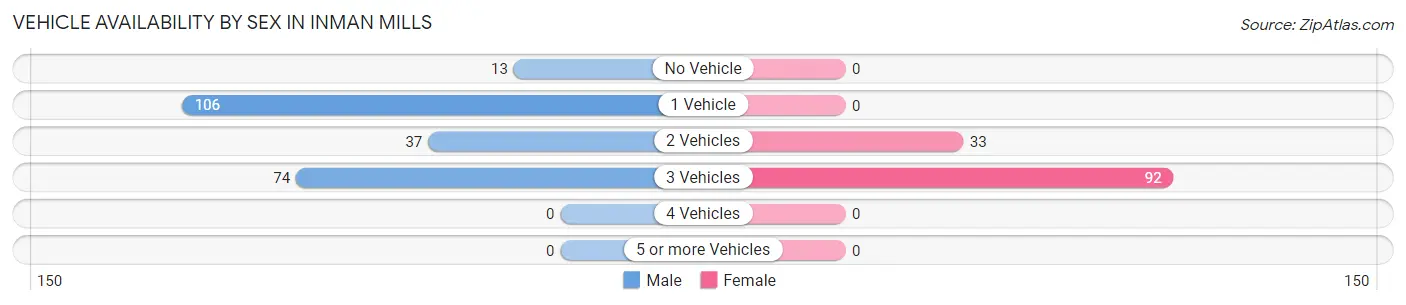
| Vehicles Available | Male | Female |
| No Vehicle | 13 (5.7%) | 0 (0.0%) |
| 1 Vehicle | 106 (46.1%) | 0 (0.0%) |
| 2 Vehicles | 37 (16.1%) | 33 (26.4%) |
| 3 Vehicles | 74 (32.2%) | 92 (73.6%) |
| 4 Vehicles | 0 (0.0%) | 0 (0.0%) |
| 5 or more Vehicles | 0 (0.0%) | 0 (0.0%) |
| Total | 230 (100.0%) | 125 (100.0%) |
Commute Time in Inman Mills
The most frequently occuring commute durations in Inman Mills are 20 to 24 minutes (142 commuters, 40.0%), 15 to 19 minutes (67 commuters, 18.9%), and 5 to 9 minutes (45 commuters, 12.7%).
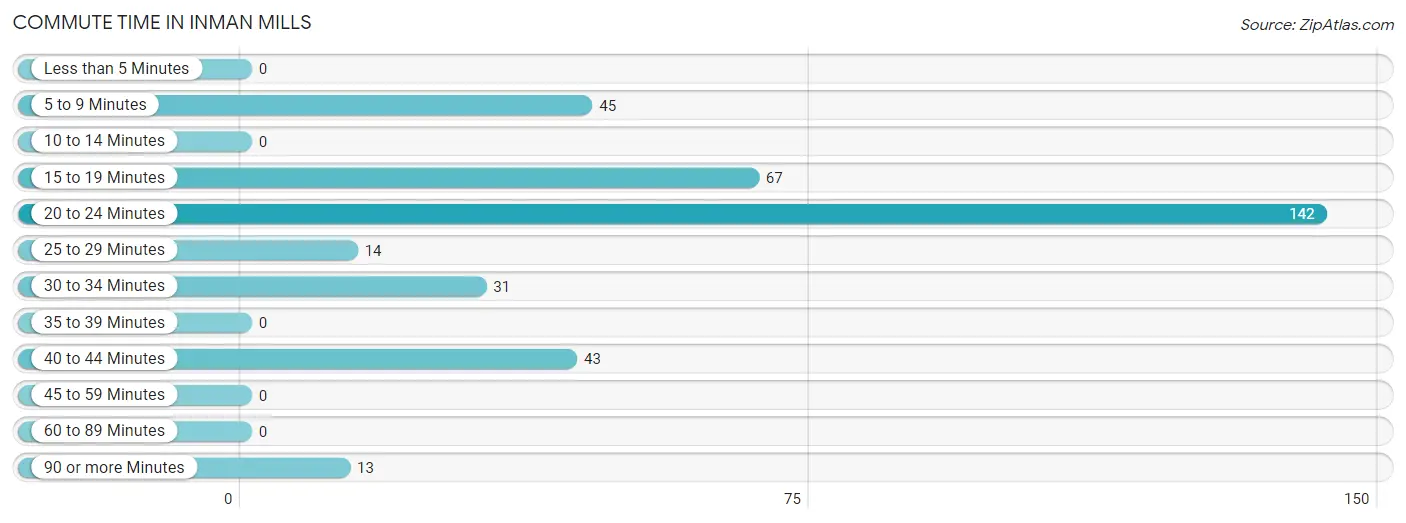
| Commute Time | # Commuters | % Commuters |
| Less than 5 Minutes | 0 | 0.0% |
| 5 to 9 Minutes | 45 | 12.7% |
| 10 to 14 Minutes | 0 | 0.0% |
| 15 to 19 Minutes | 67 | 18.9% |
| 20 to 24 Minutes | 142 | 40.0% |
| 25 to 29 Minutes | 14 | 3.9% |
| 30 to 34 Minutes | 31 | 8.7% |
| 35 to 39 Minutes | 0 | 0.0% |
| 40 to 44 Minutes | 43 | 12.1% |
| 45 to 59 Minutes | 0 | 0.0% |
| 60 to 89 Minutes | 0 | 0.0% |
| 90 or more Minutes | 13 | 3.7% |
Commute Time by Sex in Inman Mills
The most common commute times in Inman Mills are 20 to 24 minutes (92 commuters, 40.0%) for males and 20 to 24 minutes (50 commuters, 40.0%) for females.
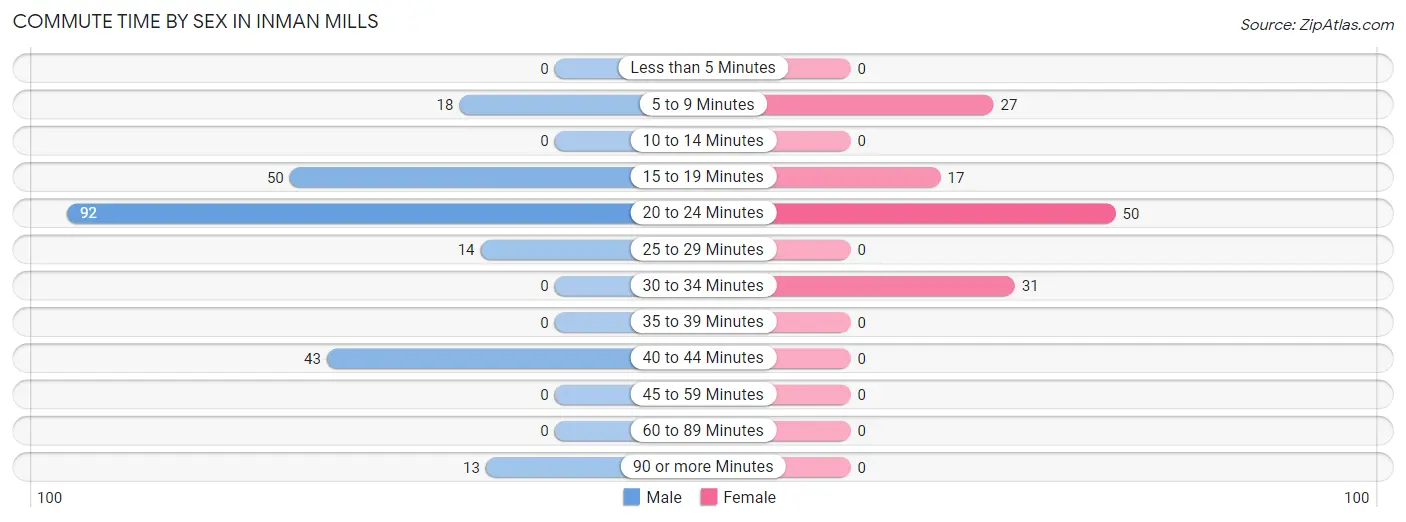
| Commute Time | Male | Female |
| Less than 5 Minutes | 0 (0.0%) | 0 (0.0%) |
| 5 to 9 Minutes | 18 (7.8%) | 27 (21.6%) |
| 10 to 14 Minutes | 0 (0.0%) | 0 (0.0%) |
| 15 to 19 Minutes | 50 (21.7%) | 17 (13.6%) |
| 20 to 24 Minutes | 92 (40.0%) | 50 (40.0%) |
| 25 to 29 Minutes | 14 (6.1%) | 0 (0.0%) |
| 30 to 34 Minutes | 0 (0.0%) | 31 (24.8%) |
| 35 to 39 Minutes | 0 (0.0%) | 0 (0.0%) |
| 40 to 44 Minutes | 43 (18.7%) | 0 (0.0%) |
| 45 to 59 Minutes | 0 (0.0%) | 0 (0.0%) |
| 60 to 89 Minutes | 0 (0.0%) | 0 (0.0%) |
| 90 or more Minutes | 13 (5.7%) | 0 (0.0%) |
Time of Departure to Work by Sex in Inman Mills
The most frequent times of departure to work in Inman Mills are 12:00 AM to 4:59 AM (105, 45.7%) for males and 7:00 AM to 7:29 AM (50, 40.0%) for females.
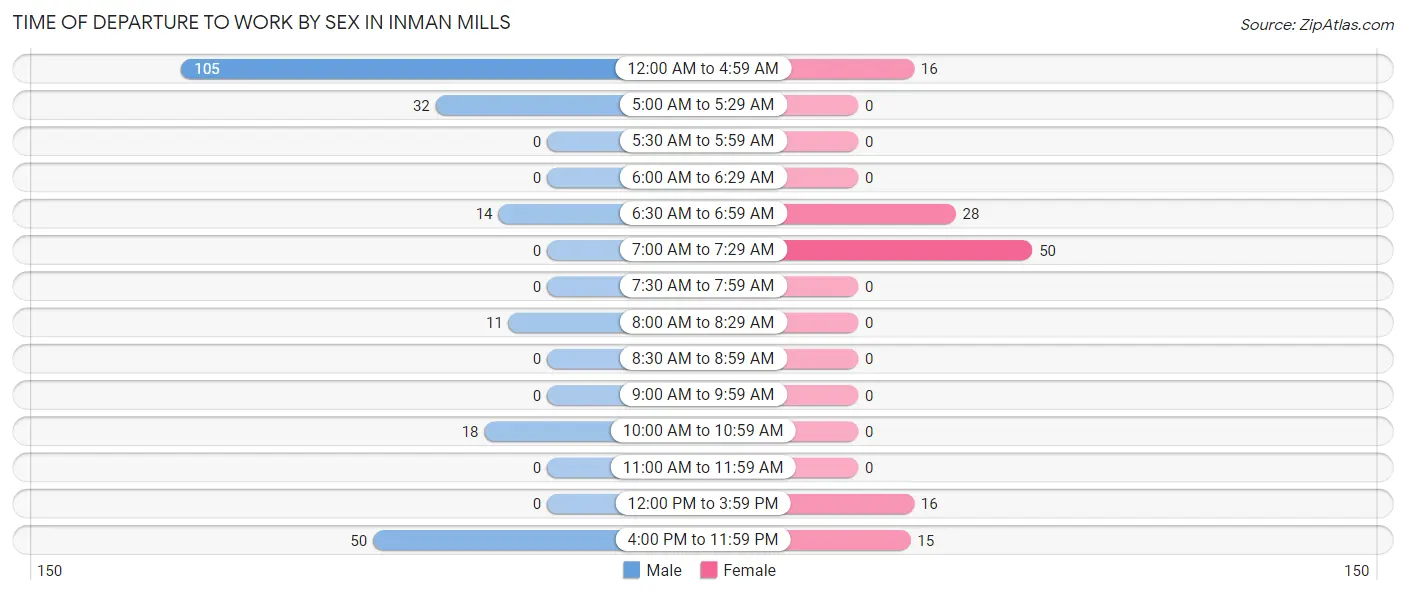
| Time of Departure | Male | Female |
| 12:00 AM to 4:59 AM | 105 (45.7%) | 16 (12.8%) |
| 5:00 AM to 5:29 AM | 32 (13.9%) | 0 (0.0%) |
| 5:30 AM to 5:59 AM | 0 (0.0%) | 0 (0.0%) |
| 6:00 AM to 6:29 AM | 0 (0.0%) | 0 (0.0%) |
| 6:30 AM to 6:59 AM | 14 (6.1%) | 28 (22.4%) |
| 7:00 AM to 7:29 AM | 0 (0.0%) | 50 (40.0%) |
| 7:30 AM to 7:59 AM | 0 (0.0%) | 0 (0.0%) |
| 8:00 AM to 8:29 AM | 11 (4.8%) | 0 (0.0%) |
| 8:30 AM to 8:59 AM | 0 (0.0%) | 0 (0.0%) |
| 9:00 AM to 9:59 AM | 0 (0.0%) | 0 (0.0%) |
| 10:00 AM to 10:59 AM | 18 (7.8%) | 0 (0.0%) |
| 11:00 AM to 11:59 AM | 0 (0.0%) | 0 (0.0%) |
| 12:00 PM to 3:59 PM | 0 (0.0%) | 16 (12.8%) |
| 4:00 PM to 11:59 PM | 50 (21.7%) | 15 (12.0%) |
| Total | 230 (100.0%) | 125 (100.0%) |
Housing Occupancy in Inman Mills
Occupancy by Ownership in Inman Mills
Of the total 373 dwellings in Inman Mills, owner-occupied units account for 225 (60.3%), while renter-occupied units make up 148 (39.7%).
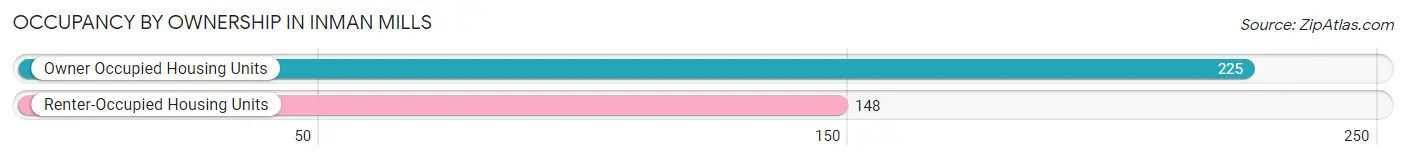
| Occupancy | # Housing Units | % Housing Units |
| Owner Occupied Housing Units | 225 | 60.3% |
| Renter-Occupied Housing Units | 148 | 39.7% |
| Total Occupied Housing Units | 373 | 100.0% |
Occupancy by Household Size in Inman Mills
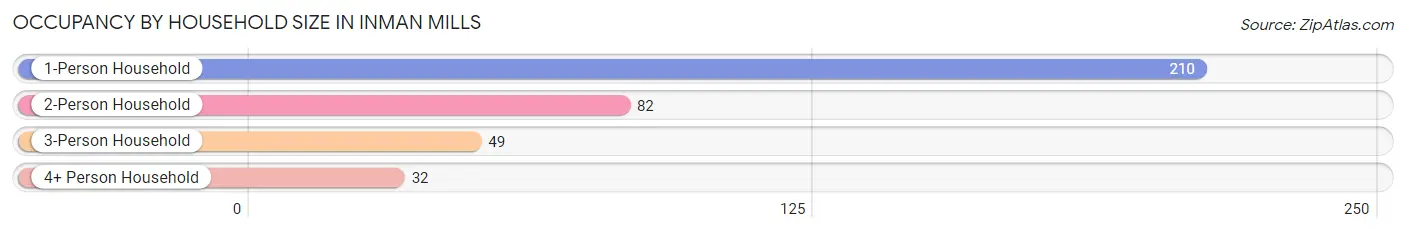
| Household Size | # Housing Units | % Housing Units |
| 1-Person Household | 210 | 56.3% |
| 2-Person Household | 82 | 22.0% |
| 3-Person Household | 49 | 13.1% |
| 4+ Person Household | 32 | 8.6% |
| Total Housing Units | 373 | 100.0% |
Occupancy by Ownership by Household Size in Inman Mills
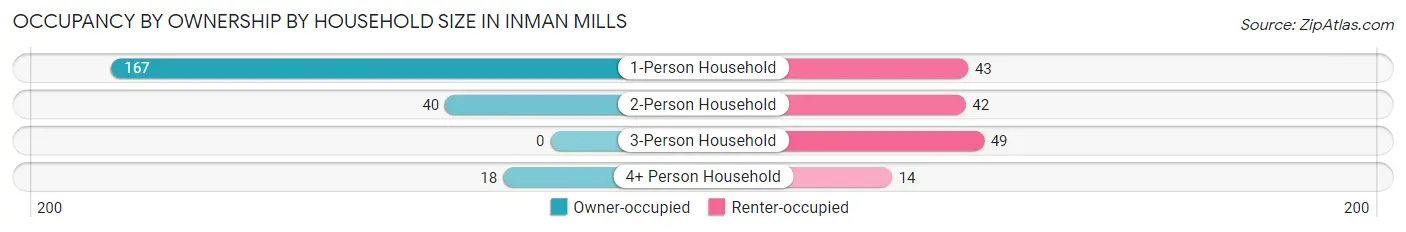
| Household Size | Owner-occupied | Renter-occupied |
| 1-Person Household | 167 (79.5%) | 43 (20.5%) |
| 2-Person Household | 40 (48.8%) | 42 (51.2%) |
| 3-Person Household | 0 (0.0%) | 49 (100.0%) |
| 4+ Person Household | 18 (56.2%) | 14 (43.8%) |
| Total Housing Units | 225 (60.3%) | 148 (39.7%) |
Occupancy by Educational Attainment in Inman Mills
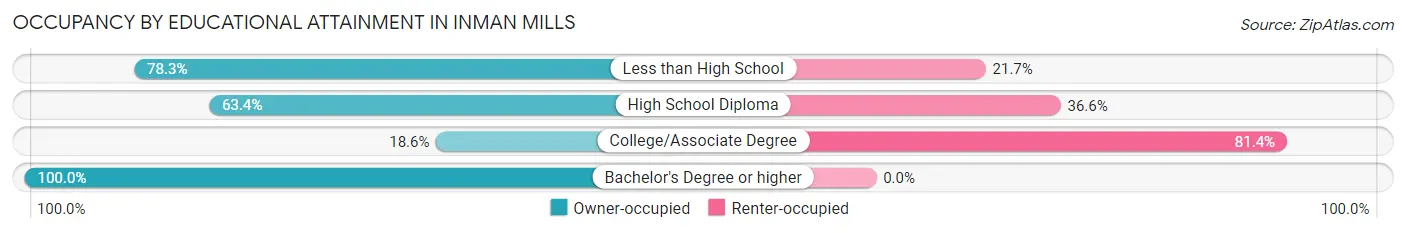
| Household Size | Owner-occupied | Renter-occupied |
| Less than High School | 83 (78.3%) | 23 (21.7%) |
| High School Diploma | 118 (63.4%) | 68 (36.6%) |
| College/Associate Degree | 13 (18.6%) | 57 (81.4%) |
| Bachelor's Degree or higher | 11 (100.0%) | 0 (0.0%) |
Occupancy by Age of Householder in Inman Mills
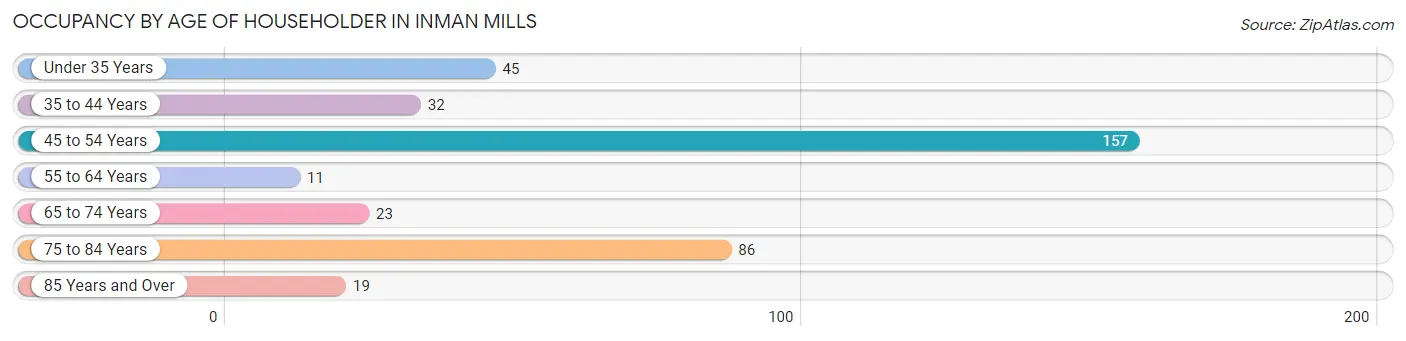
| Age Bracket | # Households | % Households |
| Under 35 Years | 45 | 12.1% |
| 35 to 44 Years | 32 | 8.6% |
| 45 to 54 Years | 157 | 42.1% |
| 55 to 64 Years | 11 | 2.9% |
| 65 to 74 Years | 23 | 6.2% |
| 75 to 84 Years | 86 | 23.1% |
| 85 Years and Over | 19 | 5.1% |
| Total | 373 | 100.0% |
Housing Finances in Inman Mills
Median Income by Occupancy in Inman Mills
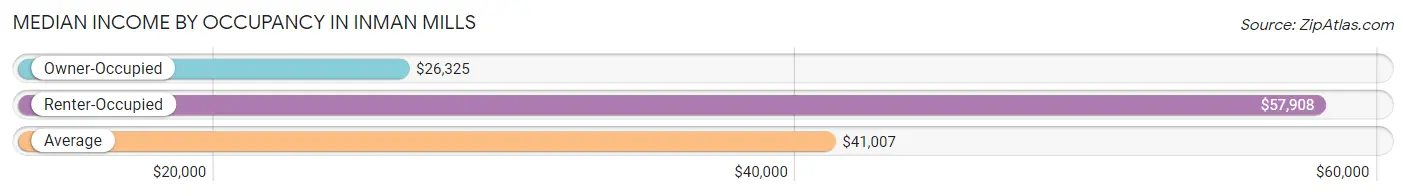
| Occupancy Type | # Households | Median Income |
| Owner-Occupied | 225 (60.3%) | $26,325 |
| Renter-Occupied | 148 (39.7%) | $57,908 |
| Average | 373 (100.0%) | $41,007 |
Occupancy by Householder Income Bracket in Inman Mills
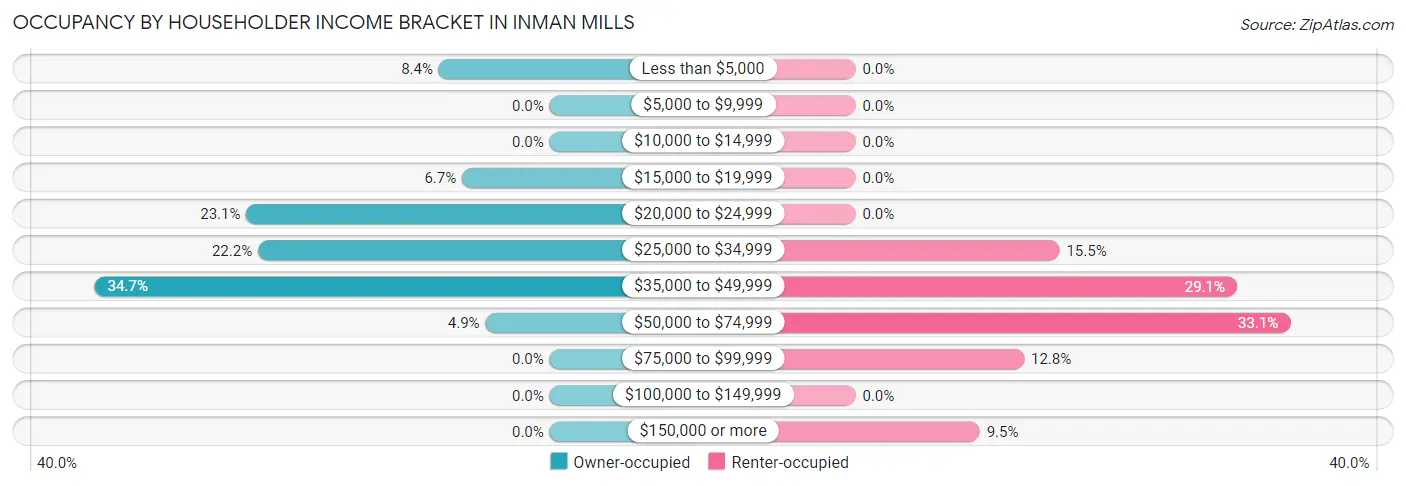
| Income Bracket | Owner-occupied | Renter-occupied |
| Less than $5,000 | 19 (8.4%) | 0 (0.0%) |
| $5,000 to $9,999 | 0 (0.0%) | 0 (0.0%) |
| $10,000 to $14,999 | 0 (0.0%) | 0 (0.0%) |
| $15,000 to $19,999 | 15 (6.7%) | 0 (0.0%) |
| $20,000 to $24,999 | 52 (23.1%) | 0 (0.0%) |
| $25,000 to $34,999 | 50 (22.2%) | 23 (15.5%) |
| $35,000 to $49,999 | 78 (34.7%) | 43 (29.0%) |
| $50,000 to $74,999 | 11 (4.9%) | 49 (33.1%) |
| $75,000 to $99,999 | 0 (0.0%) | 19 (12.8%) |
| $100,000 to $149,999 | 0 (0.0%) | 0 (0.0%) |
| $150,000 or more | 0 (0.0%) | 14 (9.5%) |
| Total | 225 (100.0%) | 148 (100.0%) |
Monthly Housing Cost Tiers in Inman Mills
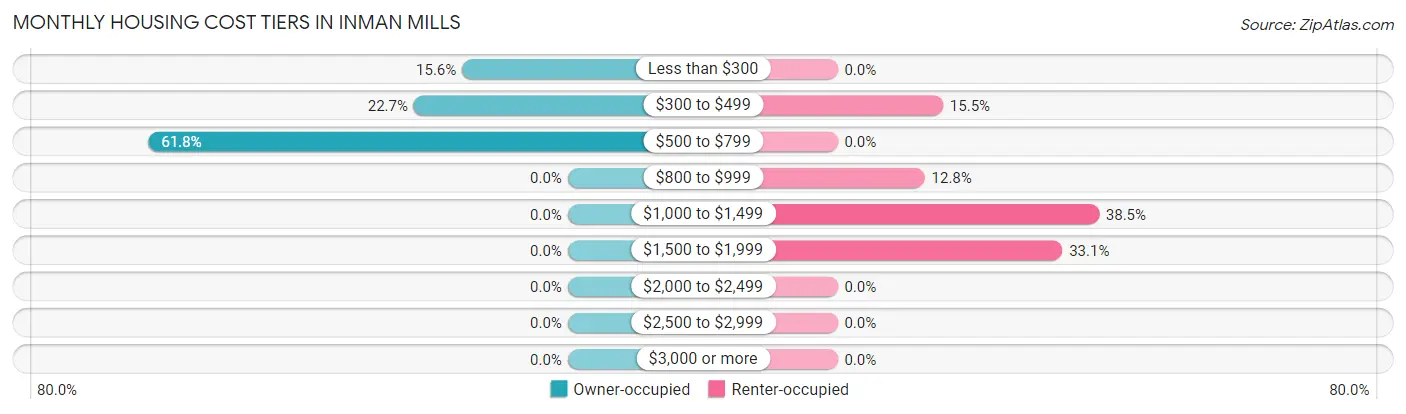
| Monthly Cost | Owner-occupied | Renter-occupied |
| Less than $300 | 35 (15.6%) | 0 (0.0%) |
| $300 to $499 | 51 (22.7%) | 23 (15.5%) |
| $500 to $799 | 139 (61.8%) | 0 (0.0%) |
| $800 to $999 | 0 (0.0%) | 19 (12.8%) |
| $1,000 to $1,499 | 0 (0.0%) | 57 (38.5%) |
| $1,500 to $1,999 | 0 (0.0%) | 49 (33.1%) |
| $2,000 to $2,499 | 0 (0.0%) | 0 (0.0%) |
| $2,500 to $2,999 | 0 (0.0%) | 0 (0.0%) |
| $3,000 or more | 0 (0.0%) | 0 (0.0%) |
| Total | 225 (100.0%) | 148 (100.0%) |
Physical Housing Characteristics in Inman Mills
Housing Structures in Inman Mills
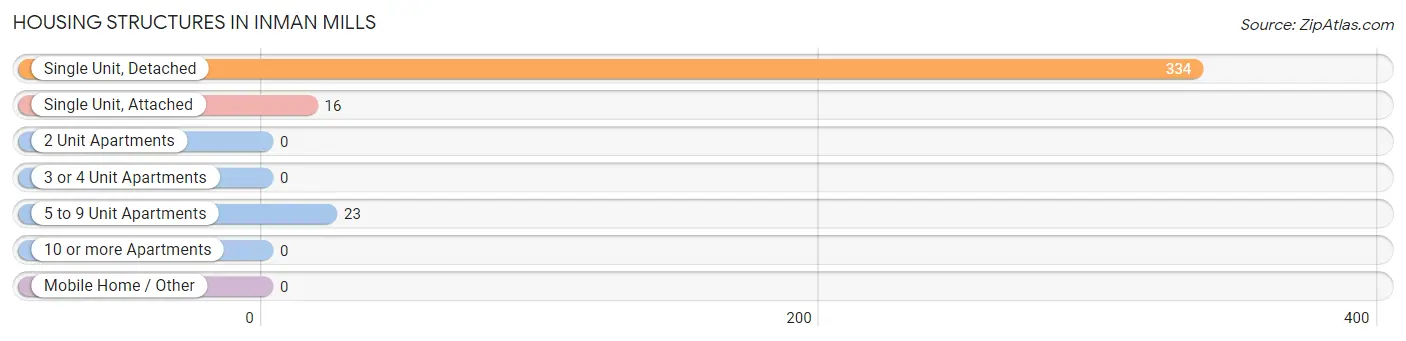
| Structure Type | # Housing Units | % Housing Units |
| Single Unit, Detached | 334 | 89.5% |
| Single Unit, Attached | 16 | 4.3% |
| 2 Unit Apartments | 0 | 0.0% |
| 3 or 4 Unit Apartments | 0 | 0.0% |
| 5 to 9 Unit Apartments | 23 | 6.2% |
| 10 or more Apartments | 0 | 0.0% |
| Mobile Home / Other | 0 | 0.0% |
| Total | 373 | 100.0% |
Housing Structures by Occupancy in Inman Mills
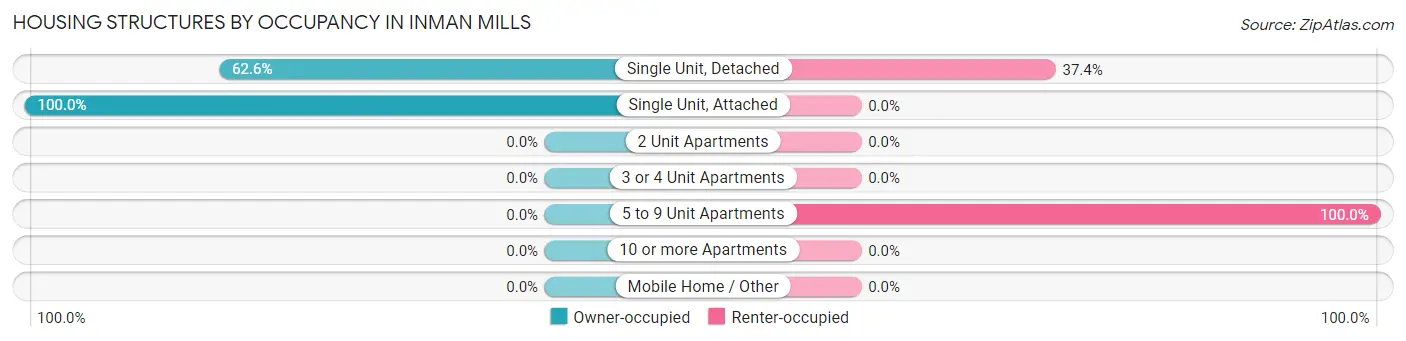
| Structure Type | Owner-occupied | Renter-occupied |
| Single Unit, Detached | 209 (62.6%) | 125 (37.4%) |
| Single Unit, Attached | 16 (100.0%) | 0 (0.0%) |
| 2 Unit Apartments | 0 (0.0%) | 0 (0.0%) |
| 3 or 4 Unit Apartments | 0 (0.0%) | 0 (0.0%) |
| 5 to 9 Unit Apartments | 0 (0.0%) | 23 (100.0%) |
| 10 or more Apartments | 0 (0.0%) | 0 (0.0%) |
| Mobile Home / Other | 0 (0.0%) | 0 (0.0%) |
| Total | 225 (60.3%) | 148 (39.7%) |
Housing Structures by Number of Rooms in Inman Mills
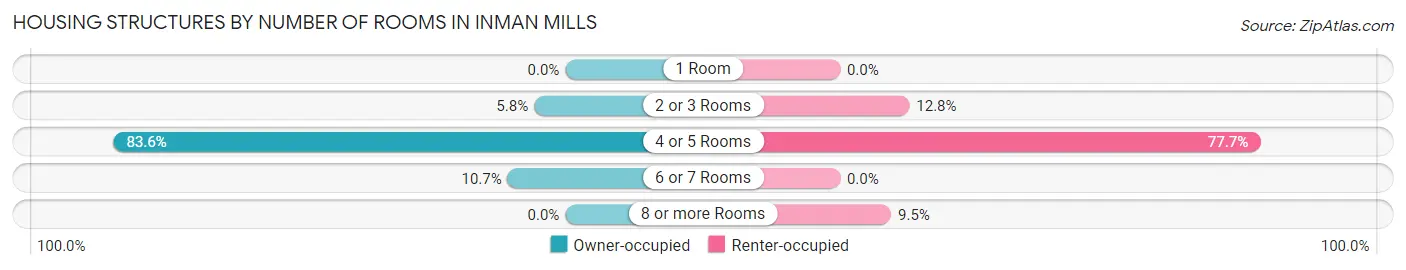
| Number of Rooms | Owner-occupied | Renter-occupied |
| 1 Room | 0 (0.0%) | 0 (0.0%) |
| 2 or 3 Rooms | 13 (5.8%) | 19 (12.8%) |
| 4 or 5 Rooms | 188 (83.6%) | 115 (77.7%) |
| 6 or 7 Rooms | 24 (10.7%) | 0 (0.0%) |
| 8 or more Rooms | 0 (0.0%) | 14 (9.5%) |
| Total | 225 (100.0%) | 148 (100.0%) |
Housing Structure by Heating Type in Inman Mills
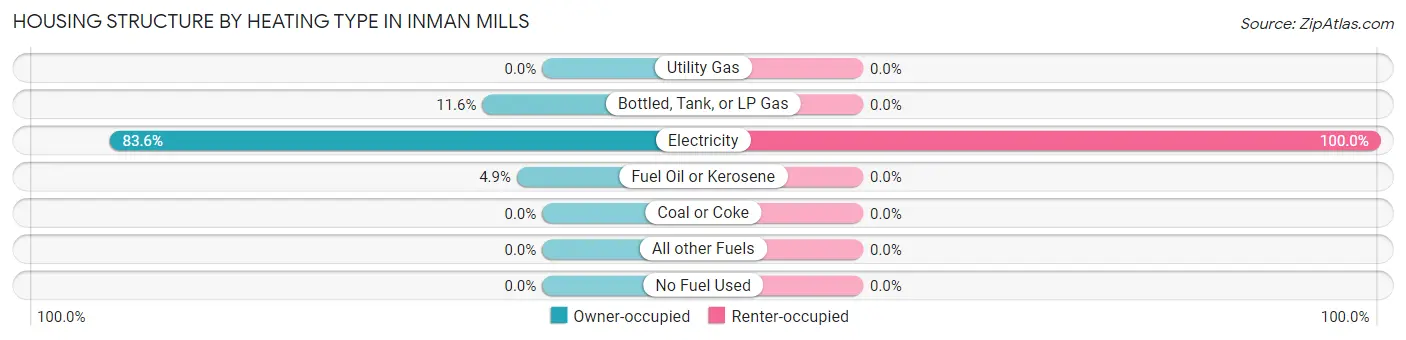
| Heating Type | Owner-occupied | Renter-occupied |
| Utility Gas | 0 (0.0%) | 0 (0.0%) |
| Bottled, Tank, or LP Gas | 26 (11.6%) | 0 (0.0%) |
| Electricity | 188 (83.6%) | 148 (100.0%) |
| Fuel Oil or Kerosene | 11 (4.9%) | 0 (0.0%) |
| Coal or Coke | 0 (0.0%) | 0 (0.0%) |
| All other Fuels | 0 (0.0%) | 0 (0.0%) |
| No Fuel Used | 0 (0.0%) | 0 (0.0%) |
| Total | 225 (100.0%) | 148 (100.0%) |
Household Vehicle Usage in Inman Mills
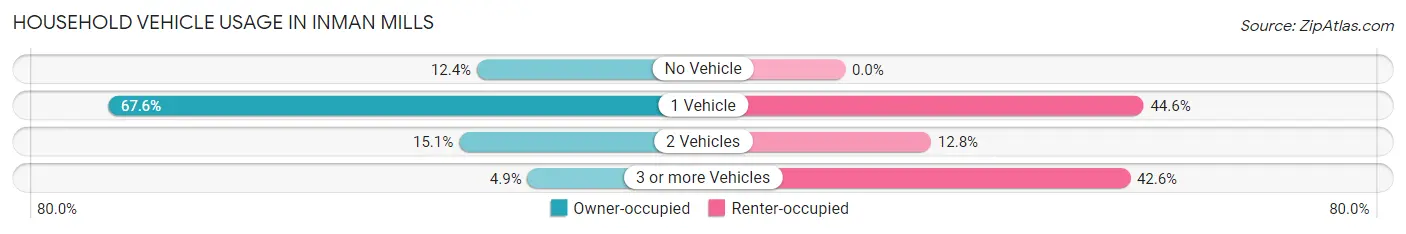
| Vehicles per Household | Owner-occupied | Renter-occupied |
| No Vehicle | 28 (12.4%) | 0 (0.0%) |
| 1 Vehicle | 152 (67.6%) | 66 (44.6%) |
| 2 Vehicles | 34 (15.1%) | 19 (12.8%) |
| 3 or more Vehicles | 11 (4.9%) | 63 (42.6%) |
| Total | 225 (100.0%) | 148 (100.0%) |
Real Estate & Mortgages in Inman Mills
Real Estate and Mortgage Overview in Inman Mills
| Characteristic | Without Mortgage | With Mortgage |
| Housing Units | 71 | 154 |
| Median Property Value | - | - |
| Median Household Income | $41,146 | $0 |
| Monthly Housing Costs | $301 | $0 |
| Real Estate Taxes | - | - |
Property Value by Mortgage Status in Inman Mills
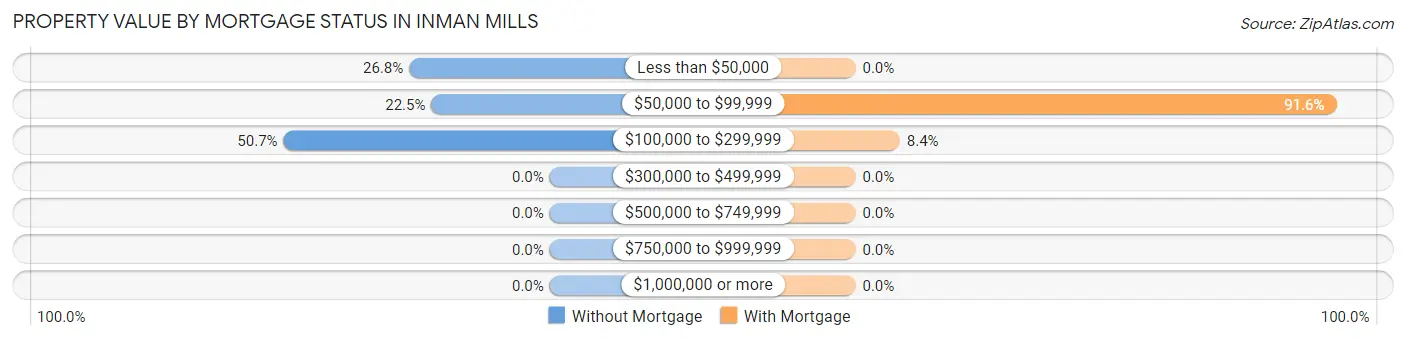
| Property Value | Without Mortgage | With Mortgage |
| Less than $50,000 | 19 (26.8%) | 0 (0.0%) |
| $50,000 to $99,999 | 16 (22.5%) | 141 (91.6%) |
| $100,000 to $299,999 | 36 (50.7%) | 13 (8.4%) |
| $300,000 to $499,999 | 0 (0.0%) | 0 (0.0%) |
| $500,000 to $749,999 | 0 (0.0%) | 0 (0.0%) |
| $750,000 to $999,999 | 0 (0.0%) | 0 (0.0%) |
| $1,000,000 or more | 0 (0.0%) | 0 (0.0%) |
| Total | 71 (100.0%) | 154 (100.0%) |
Household Income by Mortgage Status in Inman Mills
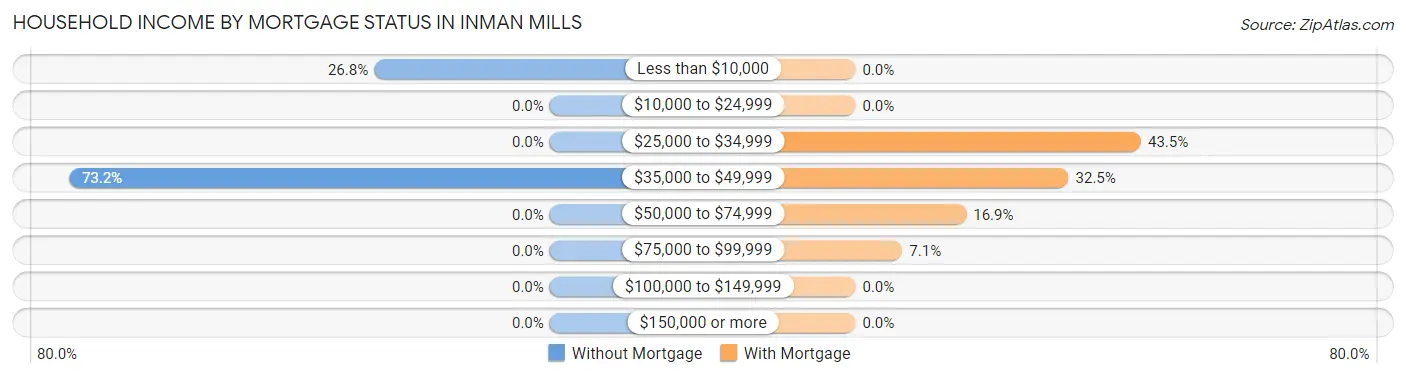
| Household Income | Without Mortgage | With Mortgage |
| Less than $10,000 | 19 (26.8%) | 0 (0.0%) |
| $10,000 to $24,999 | 0 (0.0%) | 0 (0.0%) |
| $25,000 to $34,999 | 0 (0.0%) | 67 (43.5%) |
| $35,000 to $49,999 | 52 (73.2%) | 50 (32.5%) |
| $50,000 to $74,999 | 0 (0.0%) | 26 (16.9%) |
| $75,000 to $99,999 | 0 (0.0%) | 11 (7.1%) |
| $100,000 to $149,999 | 0 (0.0%) | 0 (0.0%) |
| $150,000 or more | 0 (0.0%) | 0 (0.0%) |
| Total | 71 (100.0%) | 154 (100.0%) |
Property Value to Household Income Ratio in Inman Mills
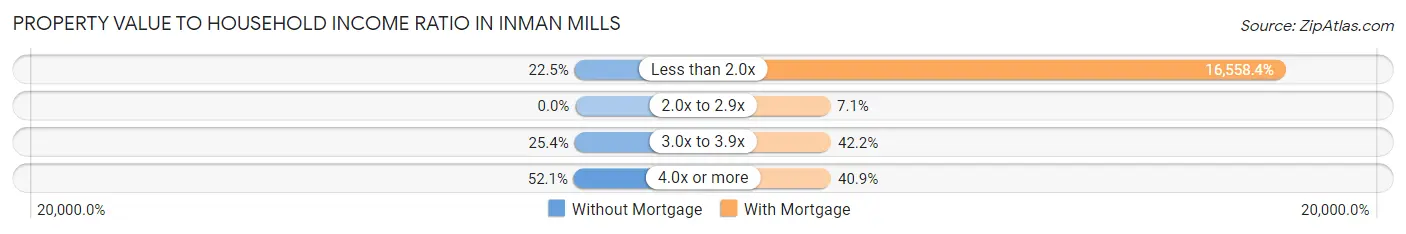
| Value-to-Income Ratio | Without Mortgage | With Mortgage |
| Less than 2.0x | 16 (22.5%) | 25,500 (16,558.4%) |
| 2.0x to 2.9x | 0 (0.0%) | 11 (7.1%) |
| 3.0x to 3.9x | 18 (25.4%) | 65 (42.2%) |
| 4.0x or more | 37 (52.1%) | 63 (40.9%) |
| Total | 71 (100.0%) | 154 (100.0%) |
Real Estate Taxes by Mortgage Status in Inman Mills
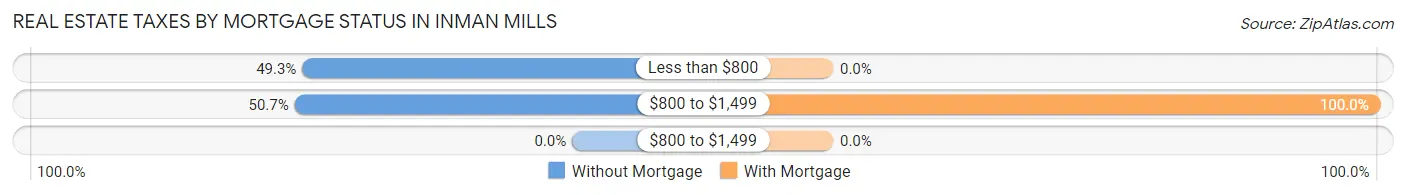
| Property Taxes | Without Mortgage | With Mortgage |
| Less than $800 | 35 (49.3%) | 0 (0.0%) |
| $800 to $1,499 | 36 (50.7%) | 154 (100.0%) |
| $800 to $1,499 | 0 (0.0%) | 0 (0.0%) |
| Total | 71 (100.0%) | 154 (100.0%) |
Health & Disability in Inman Mills
Health Insurance Coverage by Age in Inman Mills
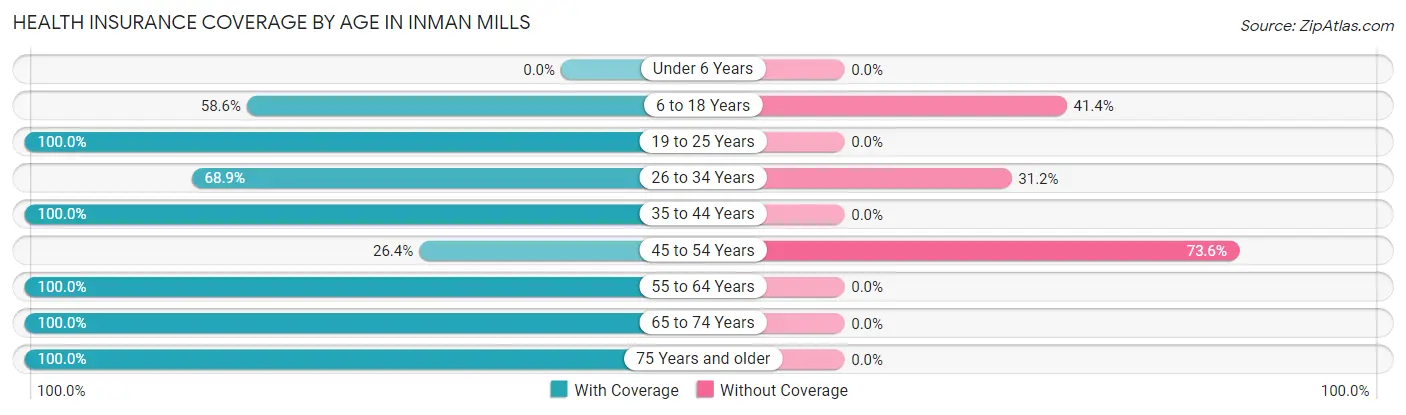
| Age Bracket | With Coverage | Without Coverage |
| Under 6 Years | 0 (0.0%) | 0 (0.0%) |
| 6 to 18 Years | 65 (58.6%) | 46 (41.4%) |
| 19 to 25 Years | 29 (100.0%) | 0 (0.0%) |
| 26 to 34 Years | 42 (68.9%) | 19 (31.1%) |
| 35 to 44 Years | 48 (100.0%) | 0 (0.0%) |
| 45 to 54 Years | 69 (26.4%) | 192 (73.6%) |
| 55 to 64 Years | 11 (100.0%) | 0 (0.0%) |
| 65 to 74 Years | 38 (100.0%) | 0 (0.0%) |
| 75 Years and older | 105 (100.0%) | 0 (0.0%) |
| Total | 407 (61.3%) | 257 (38.7%) |
Health Insurance Coverage by Citizenship Status in Inman Mills
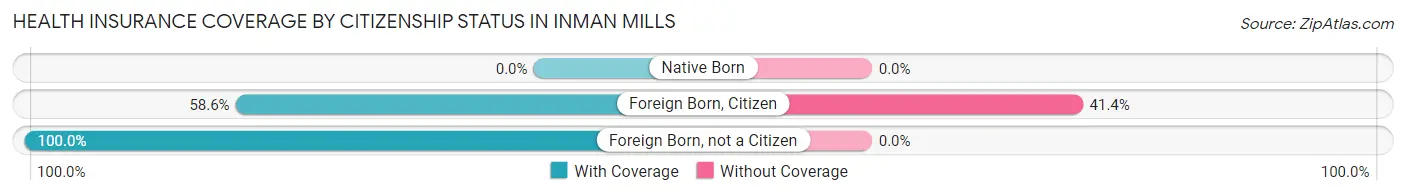
| Citizenship Status | With Coverage | Without Coverage |
| Native Born | 0 (0.0%) | 0 (0.0%) |
| Foreign Born, Citizen | 65 (58.6%) | 46 (41.4%) |
| Foreign Born, not a Citizen | 29 (100.0%) | 0 (0.0%) |
Health Insurance Coverage by Household Income in Inman Mills
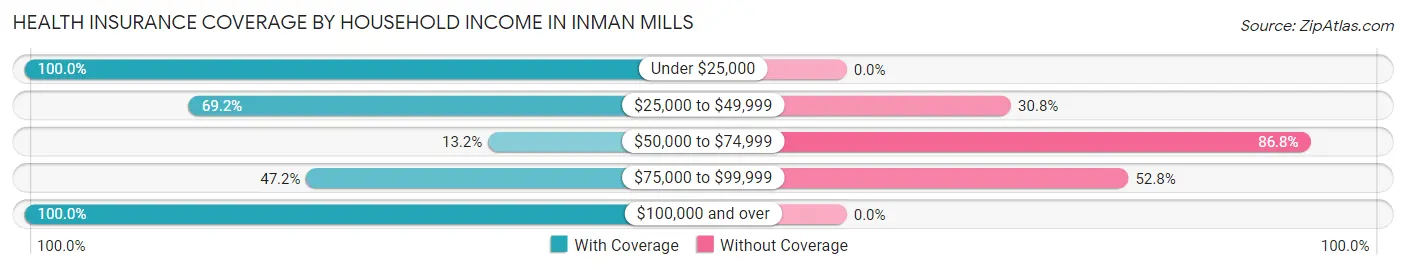
| Household Income | With Coverage | Without Coverage |
| Under $25,000 | 86 (100.0%) | 0 (0.0%) |
| $25,000 to $49,999 | 209 (69.2%) | 93 (30.8%) |
| $50,000 to $74,999 | 22 (13.2%) | 145 (86.8%) |
| $75,000 to $99,999 | 17 (47.2%) | 19 (52.8%) |
| $100,000 and over | 73 (100.0%) | 0 (0.0%) |
Public vs Private Health Insurance Coverage by Age in Inman Mills
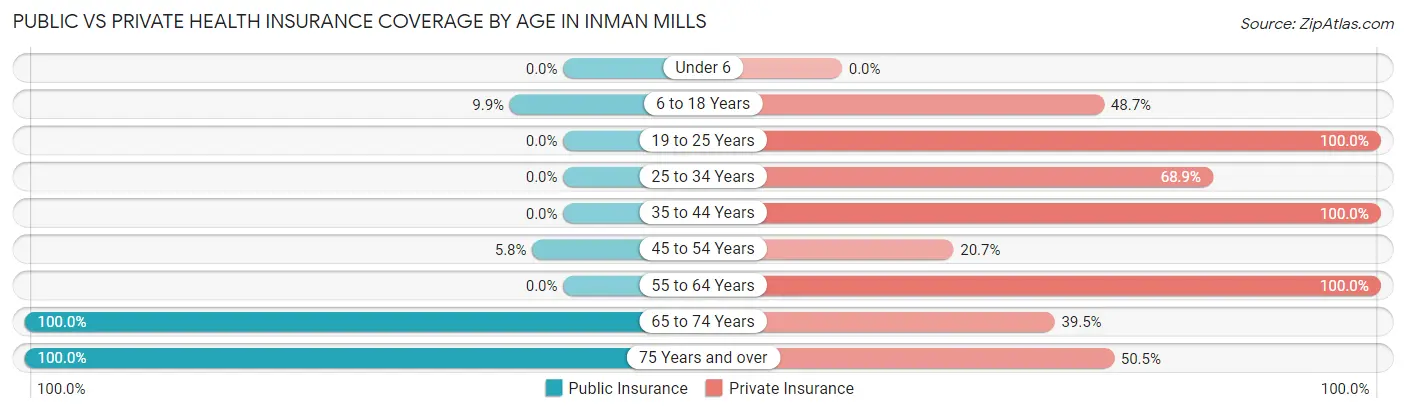
| Age Bracket | Public Insurance | Private Insurance |
| Under 6 | 0 (0.0%) | 0 (0.0%) |
| 6 to 18 Years | 11 (9.9%) | 54 (48.6%) |
| 19 to 25 Years | 0 (0.0%) | 29 (100.0%) |
| 25 to 34 Years | 0 (0.0%) | 42 (68.9%) |
| 35 to 44 Years | 0 (0.0%) | 48 (100.0%) |
| 45 to 54 Years | 15 (5.8%) | 54 (20.7%) |
| 55 to 64 Years | 0 (0.0%) | 11 (100.0%) |
| 65 to 74 Years | 38 (100.0%) | 15 (39.5%) |
| 75 Years and over | 105 (100.0%) | 53 (50.5%) |
| Total | 169 (25.5%) | 306 (46.1%) |
Disability Status by Sex by Age in Inman Mills
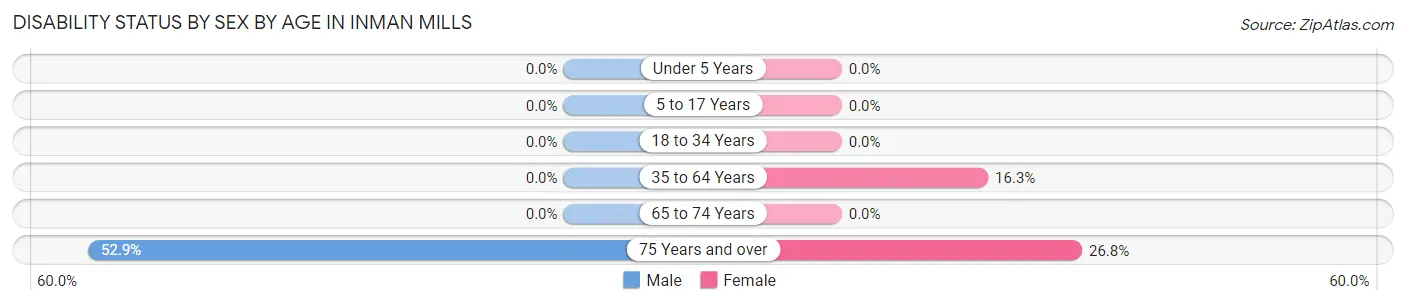
| Age Bracket | Male | Female |
| Under 5 Years | 0 (0.0%) | 0 (0.0%) |
| 5 to 17 Years | 0 (0.0%) | 0 (0.0%) |
| 18 to 34 Years | 0 (0.0%) | 0 (0.0%) |
| 35 to 64 Years | 0 (0.0%) | 15 (16.3%) |
| 65 to 74 Years | 0 (0.0%) | 0 (0.0%) |
| 75 Years and over | 18 (52.9%) | 19 (26.8%) |
Disability Class by Sex by Age in Inman Mills
Disability Class: Hearing Difficulty
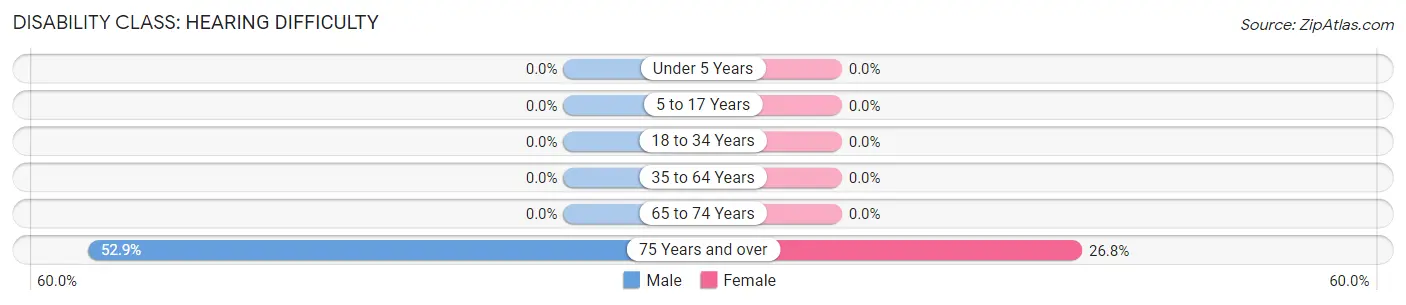
| Age Bracket | Male | Female |
| Under 5 Years | 0 (0.0%) | 0 (0.0%) |
| 5 to 17 Years | 0 (0.0%) | 0 (0.0%) |
| 18 to 34 Years | 0 (0.0%) | 0 (0.0%) |
| 35 to 64 Years | 0 (0.0%) | 0 (0.0%) |
| 65 to 74 Years | 0 (0.0%) | 0 (0.0%) |
| 75 Years and over | 18 (52.9%) | 19 (26.8%) |
Disability Class: Vision Difficulty
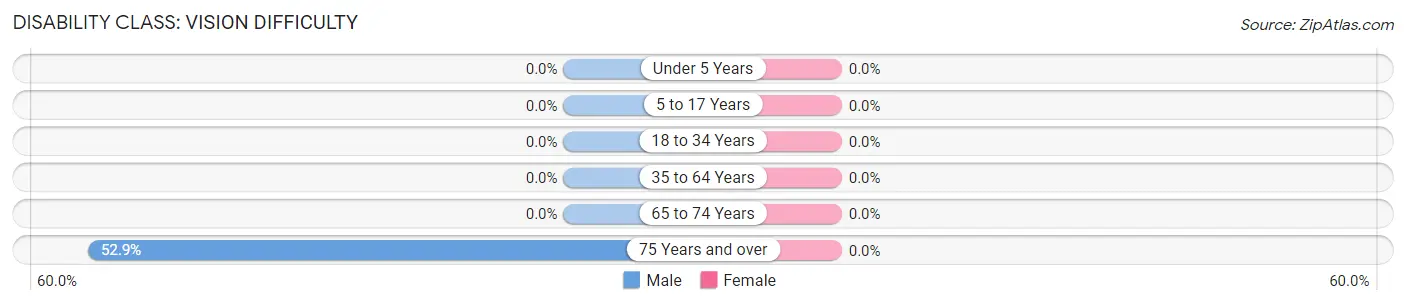
| Age Bracket | Male | Female |
| Under 5 Years | 0 (0.0%) | 0 (0.0%) |
| 5 to 17 Years | 0 (0.0%) | 0 (0.0%) |
| 18 to 34 Years | 0 (0.0%) | 0 (0.0%) |
| 35 to 64 Years | 0 (0.0%) | 0 (0.0%) |
| 65 to 74 Years | 0 (0.0%) | 0 (0.0%) |
| 75 Years and over | 18 (52.9%) | 0 (0.0%) |
Disability Class: Cognitive Difficulty
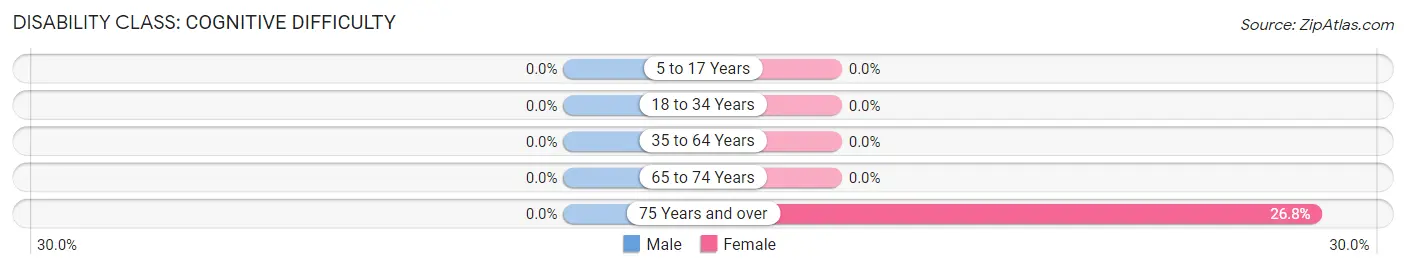
| Age Bracket | Male | Female |
| 5 to 17 Years | 0 (0.0%) | 0 (0.0%) |
| 18 to 34 Years | 0 (0.0%) | 0 (0.0%) |
| 35 to 64 Years | 0 (0.0%) | 0 (0.0%) |
| 65 to 74 Years | 0 (0.0%) | 0 (0.0%) |
| 75 Years and over | 0 (0.0%) | 19 (26.8%) |
Disability Class: Ambulatory Difficulty
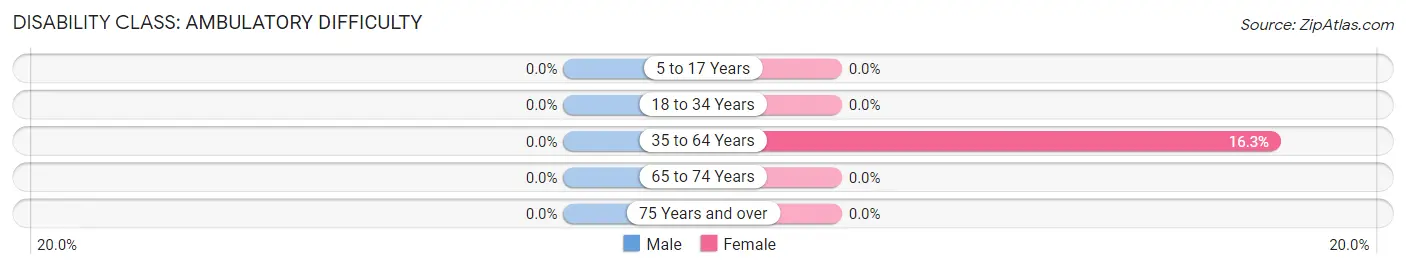
| Age Bracket | Male | Female |
| 5 to 17 Years | 0 (0.0%) | 0 (0.0%) |
| 18 to 34 Years | 0 (0.0%) | 0 (0.0%) |
| 35 to 64 Years | 0 (0.0%) | 15 (16.3%) |
| 65 to 74 Years | 0 (0.0%) | 0 (0.0%) |
| 75 Years and over | 0 (0.0%) | 0 (0.0%) |
Disability Class: Self-Care Difficulty
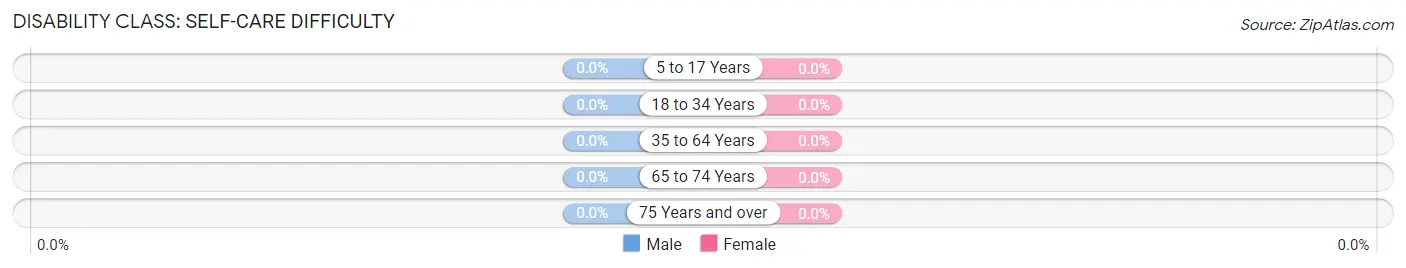
| Age Bracket | Male | Female |
| 5 to 17 Years | 0 (0.0%) | 0 (0.0%) |
| 18 to 34 Years | 0 (0.0%) | 0 (0.0%) |
| 35 to 64 Years | 0 (0.0%) | 0 (0.0%) |
| 65 to 74 Years | 0 (0.0%) | 0 (0.0%) |
| 75 Years and over | 0 (0.0%) | 0 (0.0%) |
Technology Access in Inman Mills
Computing Device Access in Inman Mills
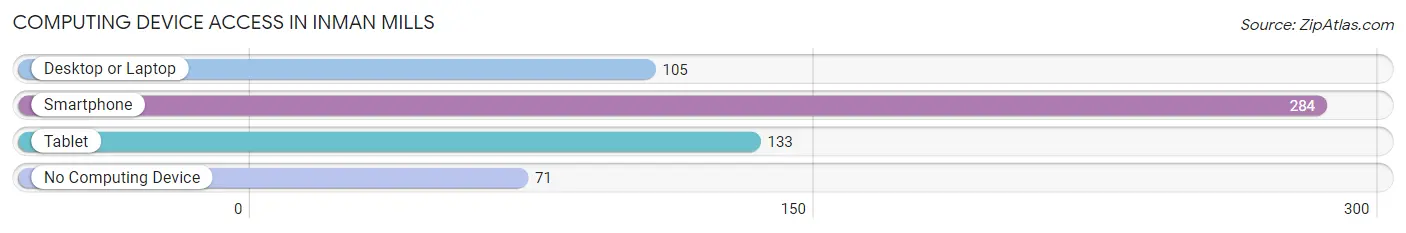
| Device Type | # Households | % Households |
| Desktop or Laptop | 105 | 28.1% |
| Smartphone | 284 | 76.1% |
| Tablet | 133 | 35.7% |
| No Computing Device | 71 | 19.0% |
| Total | 373 | 100.0% |
Internet Access in Inman Mills
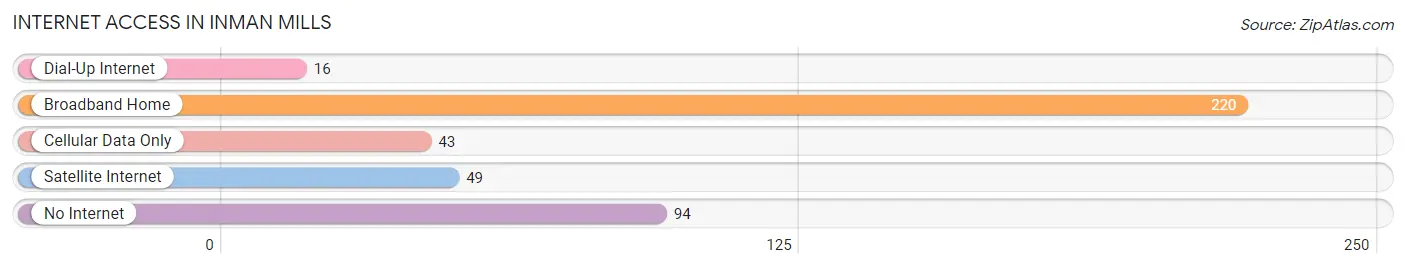
| Internet Type | # Households | % Households |
| Dial-Up Internet | 16 | 4.3% |
| Broadband Home | 220 | 59.0% |
| Cellular Data Only | 43 | 11.5% |
| Satellite Internet | 49 | 13.1% |
| No Internet | 94 | 25.2% |
| Total | 373 | 100.0% |
Inman Mills Summary
Inman Mills is a small unincorporated community located in Spartanburg County, South Carolina. It is situated along the banks of the Pacolet River, approximately 10 miles northwest of Spartanburg. The community is named after the Inman family, who were among the first settlers in the area.
History
Inman Mills was first settled in the late 1700s by the Inman family, who were among the first settlers in the area. The Inman family owned a large plantation in the area, and the community was named after them. The Inman family was also responsible for the construction of the first mill in the area, which was used to grind grain and produce flour. The mill was powered by the Pacolet River, and it was the first of many mills that would be built in the area.
In the early 1800s, the Inman family sold their plantation and the mill to a man named William Inman. William Inman continued to operate the mill, and he also built a cotton gin and a sawmill. The mills were a major source of employment for the local residents, and the community began to grow.
In the late 1800s, the Inman family sold the mill to a man named John Inman. John Inman continued to operate the mill, and he also built a gristmill and a cotton gin. The mills were a major source of employment for the local residents, and the community continued to grow.
In the early 1900s, the Inman family sold the mill to a man named William Inman. William Inman continued to operate the mill, and he also built a cotton gin and a sawmill. The mills were a major source of employment for the local residents, and the community continued to grow.
In the mid-1900s, the Inman family sold the mill to a man named John Inman. John Inman continued to operate the mill, and he also built a gristmill and a cotton gin. The mills were a major source of employment for the local residents, and the community continued to grow.
In the late 1900s, the Inman family sold the mill to a man named William Inman. William Inman continued to operate the mill, and he also built a cotton gin and a sawmill. The mills were a major source of employment for the local residents, and the community continued to grow.
Geography
Inman Mills is located in Spartanburg County, South Carolina. It is situated along the banks of the Pacolet River, approximately 10 miles northwest of Spartanburg. The community is located in the foothills of the Blue Ridge Mountains, and it is surrounded by rolling hills and forests. The climate in the area is mild, with temperatures ranging from the mid-50s in the winter to the mid-80s in the summer.
Economy
Inman Mills is a small, rural community with a population of approximately 1,000 people. The economy of the community is largely based on agriculture and forestry. The local economy is also supported by the mills that were built in the area in the late 1700s. The mills are still in operation today, and they provide employment for many of the local residents.
Demographics
Inman Mills is a small, rural community with a population of approximately 1,000 people. The population is predominantly white, with a small African American population. The median household income in the area is approximately $35,000, and the median home value is approximately $150,000. The unemployment rate in the area is approximately 5%, which is slightly lower than the national average.
Common Questions
What is Per Capita Income in Inman Mills?
Per Capita income in Inman Mills is $20,836.
What is the Median Family Income in Inman Mills?
Median Family Income in Inman Mills is $58,087.
What is the Median Household income in Inman Mills?
Median Household Income in Inman Mills is $41,007.
What is Income or Wage Gap in Inman Mills?
Income or Wage Gap in Inman Mills is 30.4%.
Women in Inman Mills earn 69.6 cents for every dollar earned by a man.
What is Inequality or Gini Index in Inman Mills?
Inequality or Gini Index in Inman Mills is 0.32.
What is the Total Population of Inman Mills?
Total Population of Inman Mills is 956.
What is the Total Male Population of Inman Mills?
Total Male Population of Inman Mills is 522.
What is the Total Female Population of Inman Mills?
Total Female Population of Inman Mills is 434.
What is the Ratio of Males per 100 Females in Inman Mills?
There are 120.28 Males per 100 Females in Inman Mills.
What is the Ratio of Females per 100 Males in Inman Mills?
There are 83.14 Females per 100 Males in Inman Mills.
What is the Median Population Age in Inman Mills?
Median Population Age in Inman Mills is 51.2 Years.
What is the Average Family Size in Inman Mills
Average Family Size in Inman Mills is 2.8 People.
What is the Average Household Size in Inman Mills
Average Household Size in Inman Mills is 1.8 People.
How Large is the Labor Force in Inman Mills?
There are 355 People in the Labor Forcein in Inman Mills.
What is the Percentage of People in the Labor Force in Inman Mills?
41.3% of People are in the Labor Force in Inman Mills.