Barnwell, SC Map & Demographics
Barnwell Map
Barnwell Overview
$22,803
PER CAPITA INCOME
$69,904
AVG FAMILY INCOME
$38,065
AVG HOUSEHOLD INCOME
59.0%
WAGE / INCOME GAP [ % ]
41.0¢/ $1
WAGE / INCOME GAP [ $ ]
0.51
INEQUALITY / GINI INDEX
4,643
TOTAL POPULATION
2,113
MALE POPULATION
2,530
FEMALE POPULATION
83.52
MALES / 100 FEMALES
119.73
FEMALES / 100 MALES
32.5
MEDIAN AGE
3.3
AVG FAMILY SIZE
2.4
AVG HOUSEHOLD SIZE
1,917
LABOR FORCE [ PEOPLE ]
53.3%
PERCENT IN LABOR FORCE
12.4%
UNEMPLOYMENT RATE
Barnwell Zip Codes
Barnwell Area Codes
Income in Barnwell
Income Overview in Barnwell
Per Capita Income in Barnwell is $22,803, while median incomes of families and households are $69,904 and $38,065 respectively.
| Characteristic | Number | Measure |
| Per Capita Income | 4,643 | $22,803 |
| Median Family Income | 1,069 | $69,904 |
| Mean Family Income | 1,069 | $67,365 |
| Median Household Income | 1,845 | $38,065 |
| Mean Household Income | 1,845 | $52,539 |
| Income Deficit | 1,069 | $0 |
| Wage / Income Gap (%) | 4,643 | 59.03% |
| Wage / Income Gap ($) | 4,643 | 40.97¢ per $1 |
| Gini / Inequality Index | 4,643 | 0.51 |
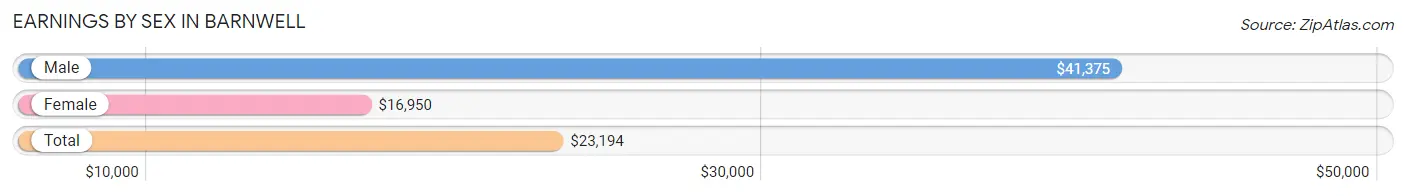
Earnings by Sex in Barnwell
Average Earnings in Barnwell are $23,194, $41,375 for men and $16,950 for women, a difference of 59.0%.
| Sex | Number | Average Earnings |
| Male | 1,041 (51.9%) | $41,375 |
| Female | 964 (48.1%) | $16,950 |
| Total | 2,005 (100.0%) | $23,194 |
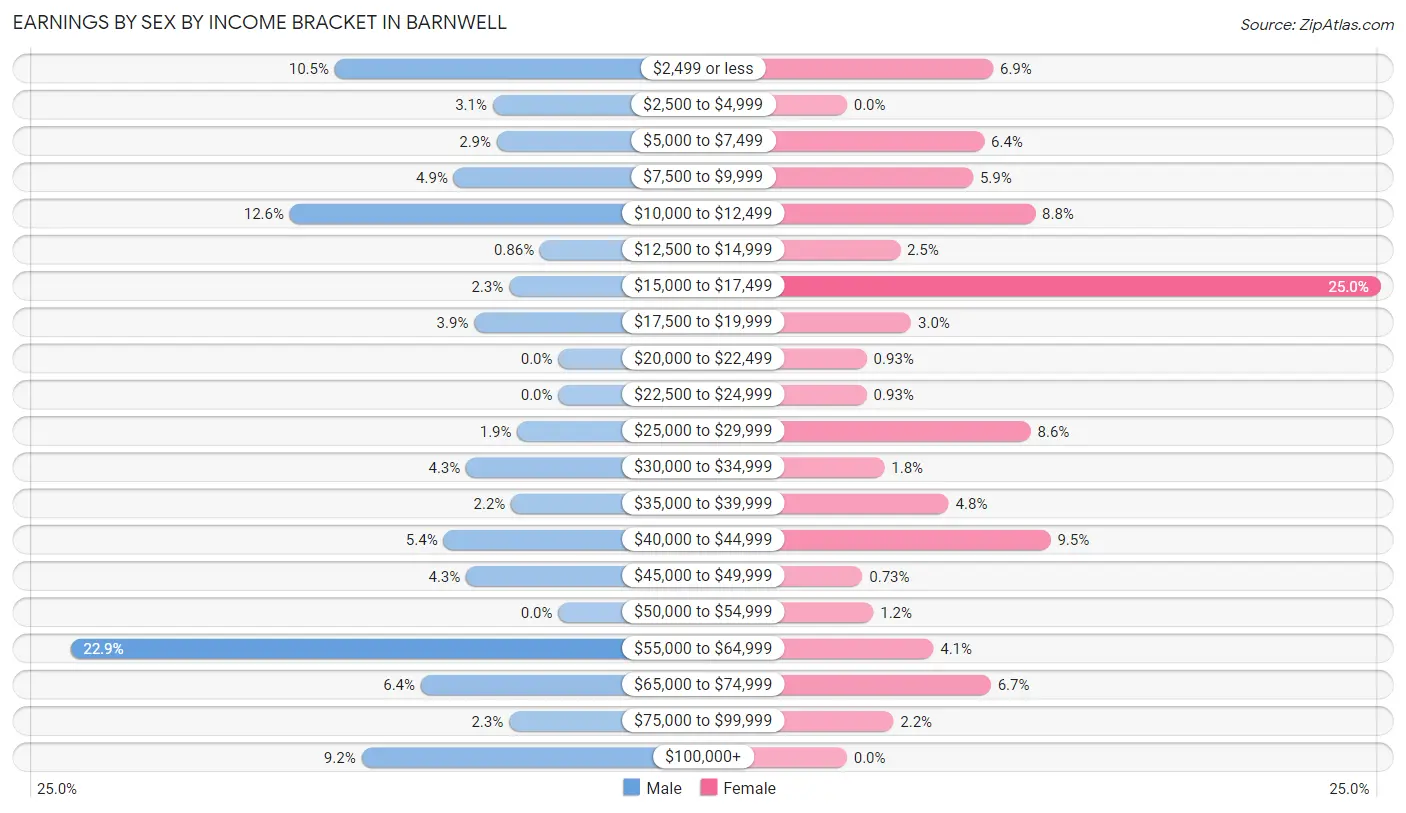
Earnings by Sex by Income Bracket in Barnwell
The most common earnings brackets in Barnwell are $55,000 to $64,999 for men (238 | 22.9%) and $15,000 to $17,499 for women (241 | 25.0%).
| Income | Male | Female |
| $2,499 or less | 109 (10.5%) | 66 (6.9%) |
| $2,500 to $4,999 | 32 (3.1%) | 0 (0.0%) |
| $5,000 to $7,499 | 30 (2.9%) | 62 (6.4%) |
| $7,500 to $9,999 | 51 (4.9%) | 57 (5.9%) |
| $10,000 to $12,499 | 131 (12.6%) | 85 (8.8%) |
| $12,500 to $14,999 | 9 (0.9%) | 24 (2.5%) |
| $15,000 to $17,499 | 24 (2.3%) | 241 (25.0%) |
| $17,500 to $19,999 | 41 (3.9%) | 29 (3.0%) |
| $20,000 to $22,499 | 0 (0.0%) | 9 (0.9%) |
| $22,500 to $24,999 | 0 (0.0%) | 9 (0.9%) |
| $25,000 to $29,999 | 20 (1.9%) | 83 (8.6%) |
| $30,000 to $34,999 | 45 (4.3%) | 17 (1.8%) |
| $35,000 to $39,999 | 23 (2.2%) | 46 (4.8%) |
| $40,000 to $44,999 | 56 (5.4%) | 92 (9.5%) |
| $45,000 to $49,999 | 45 (4.3%) | 7 (0.7%) |
| $50,000 to $54,999 | 0 (0.0%) | 12 (1.2%) |
| $55,000 to $64,999 | 238 (22.9%) | 39 (4.1%) |
| $65,000 to $74,999 | 67 (6.4%) | 65 (6.7%) |
| $75,000 to $99,999 | 24 (2.3%) | 21 (2.2%) |
| $100,000+ | 96 (9.2%) | 0 (0.0%) |
| Total | 1,041 (100.0%) | 964 (100.0%) |
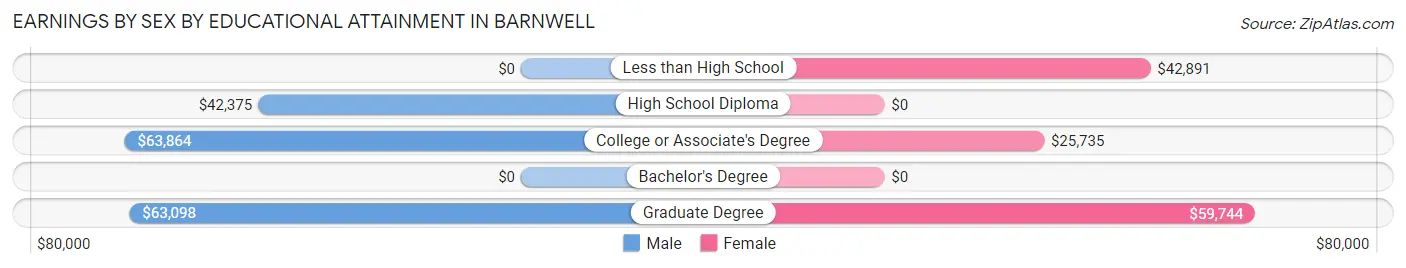
Earnings by Sex by Educational Attainment in Barnwell
Average earnings in Barnwell are $55,026 for men and $28,636 for women, a difference of 48.0%. Men with an educational attainment of college or associate's degree enjoy the highest average annual earnings of $63,864, while those with high school diploma education earn the least with $42,375. Women with an educational attainment of graduate degree earn the most with the average annual earnings of $59,744, while those with college or associate's degree education have the smallest earnings of $25,735.
| Educational Attainment | Male Income | Female Income |
| Less than High School | - | - |
| High School Diploma | $42,375 | $0 |
| College or Associate's Degree | $63,864 | $25,735 |
| Bachelor's Degree | - | - |
| Graduate Degree | $63,098 | $59,744 |
| Total | $55,026 | $28,636 |
Family Income in Barnwell
Family Income Brackets in Barnwell
According to the Barnwell family income data, there are 216 families falling into the $100,000 to $149,999 income range, which is the most common income bracket and makes up 20.2% of all families. Conversely, the $200,000+ income bracket is the least frequent group with only 21 families (2.0%) belonging to this category.
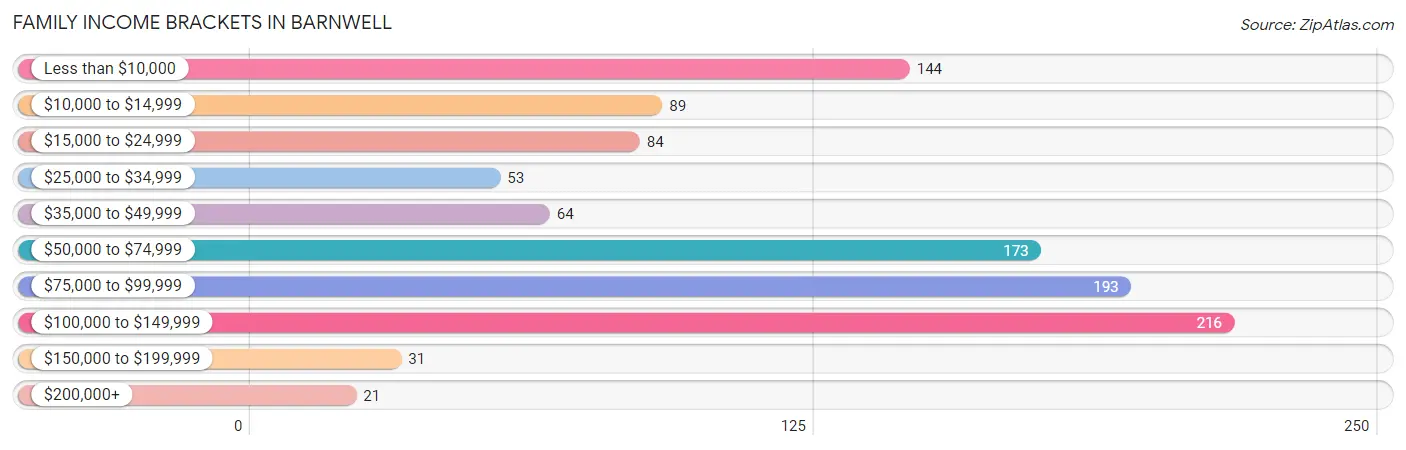
| Income Bracket | # Families | % Families |
| Less than $10,000 | 144 | 13.5% |
| $10,000 to $14,999 | 89 | 8.3% |
| $15,000 to $24,999 | 84 | 7.9% |
| $25,000 to $34,999 | 53 | 5.0% |
| $35,000 to $49,999 | 64 | 6.0% |
| $50,000 to $74,999 | 173 | 16.2% |
| $75,000 to $99,999 | 193 | 18.1% |
| $100,000 to $149,999 | 216 | 20.2% |
| $150,000 to $199,999 | 31 | 2.9% |
| $200,000+ | 21 | 2.0% |
Family Income by Famaliy Size in Barnwell
5-person families (39 | 3.6%) account for the highest median family income in Barnwell with $113,977 per family, while 2-person families (529 | 49.5%) have the highest median income of $37,650 per family member.
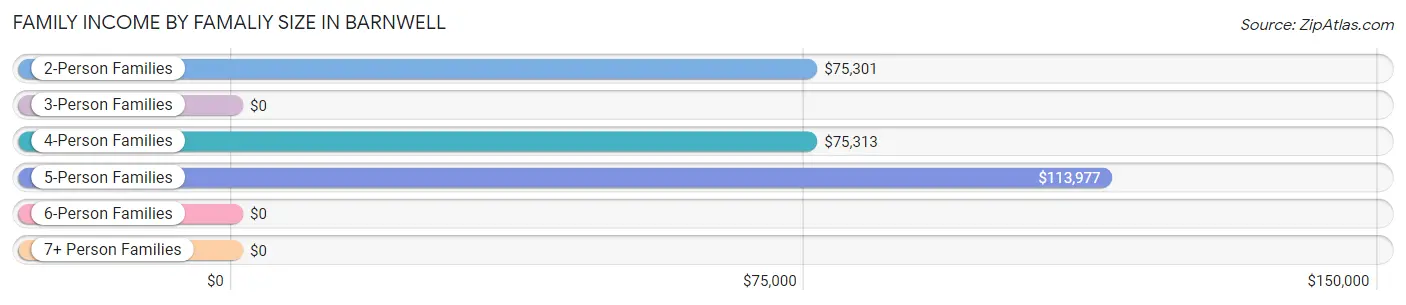
| Income Bracket | # Families | Median Income |
| 2-Person Families | 529 (49.5%) | $75,301 |
| 3-Person Families | 297 (27.8%) | $0 |
| 4-Person Families | 168 (15.7%) | $75,313 |
| 5-Person Families | 39 (3.6%) | $113,977 |
| 6-Person Families | 36 (3.4%) | $0 |
| 7+ Person Families | 0 (0.0%) | $0 |
| Total | 1,069 (100.0%) | $69,904 |
Family Income by Number of Earners in Barnwell
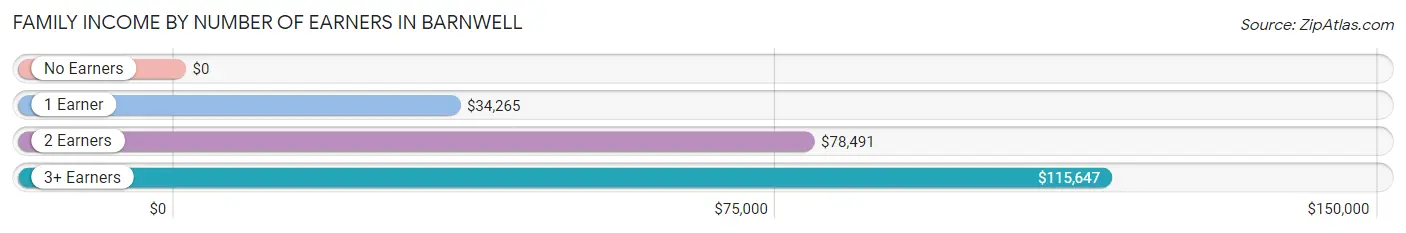
| Number of Earners | # Families | Median Income |
| No Earners | 176 (16.5%) | $0 |
| 1 Earner | 498 (46.6%) | $34,265 |
| 2 Earners | 294 (27.5%) | $78,491 |
| 3+ Earners | 101 (9.5%) | $115,647 |
| Total | 1,069 (100.0%) | $69,904 |
Household Income in Barnwell
Household Income Brackets in Barnwell
With 299 households falling in the category, the less than $10,000 income range is the most frequent in Barnwell, accounting for 16.2% of all households. In contrast, only 30 households (1.6%) fall into the $200,000+ income bracket, making it the least populous group.
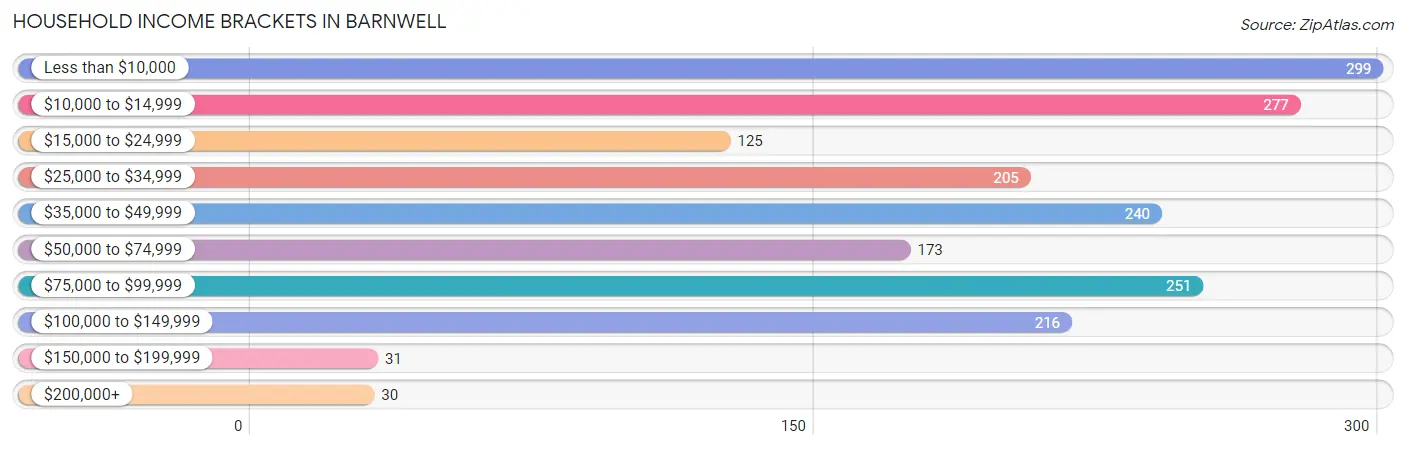
| Income Bracket | # Households | % Households |
| Less than $10,000 | 299 | 16.2% |
| $10,000 to $14,999 | 277 | 15.0% |
| $15,000 to $24,999 | 125 | 6.8% |
| $25,000 to $34,999 | 205 | 11.1% |
| $35,000 to $49,999 | 240 | 13.0% |
| $50,000 to $74,999 | 173 | 9.4% |
| $75,000 to $99,999 | 251 | 13.6% |
| $100,000 to $149,999 | 216 | 11.7% |
| $150,000 to $199,999 | 31 | 1.7% |
| $200,000+ | 30 | 1.6% |
Household Income by Householder Age in Barnwell
The median household income in Barnwell is $38,065, with the highest median household income of $59,500 found in the 45 to 64 years age bracket for the primary householder. A total of 548 households (29.7%) fall into this category. Meanwhile, the 15 to 24 years age bracket for the primary householder has the lowest median household income of $0, with 170 households (9.2%) in this group.
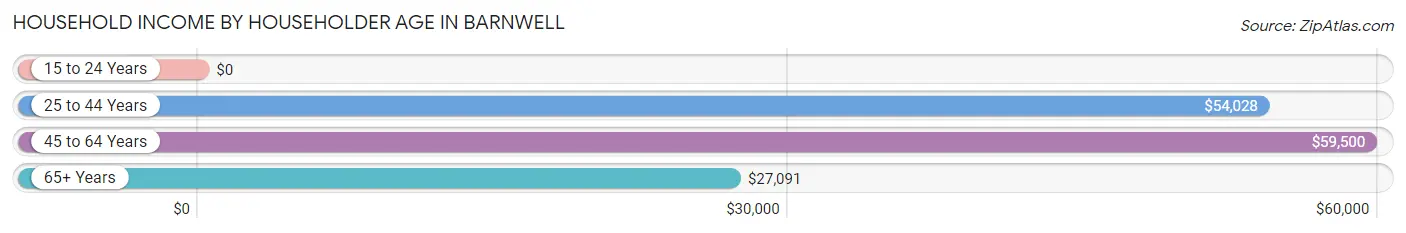
| Income Bracket | # Households | Median Income |
| 15 to 24 Years | 170 (9.2%) | $0 |
| 25 to 44 Years | 596 (32.3%) | $54,028 |
| 45 to 64 Years | 548 (29.7%) | $59,500 |
| 65+ Years | 531 (28.8%) | $27,091 |
| Total | 1,845 (100.0%) | $38,065 |
Poverty in Barnwell
Income Below Poverty by Sex and Age in Barnwell
With 27.8% poverty level for males and 42.3% for females among the residents of Barnwell, 5 year old males and 12 to 14 year old females are the most vulnerable to poverty, with 38 males (77.5%) and 104 females (81.9%) in their respective age groups living below the poverty level.
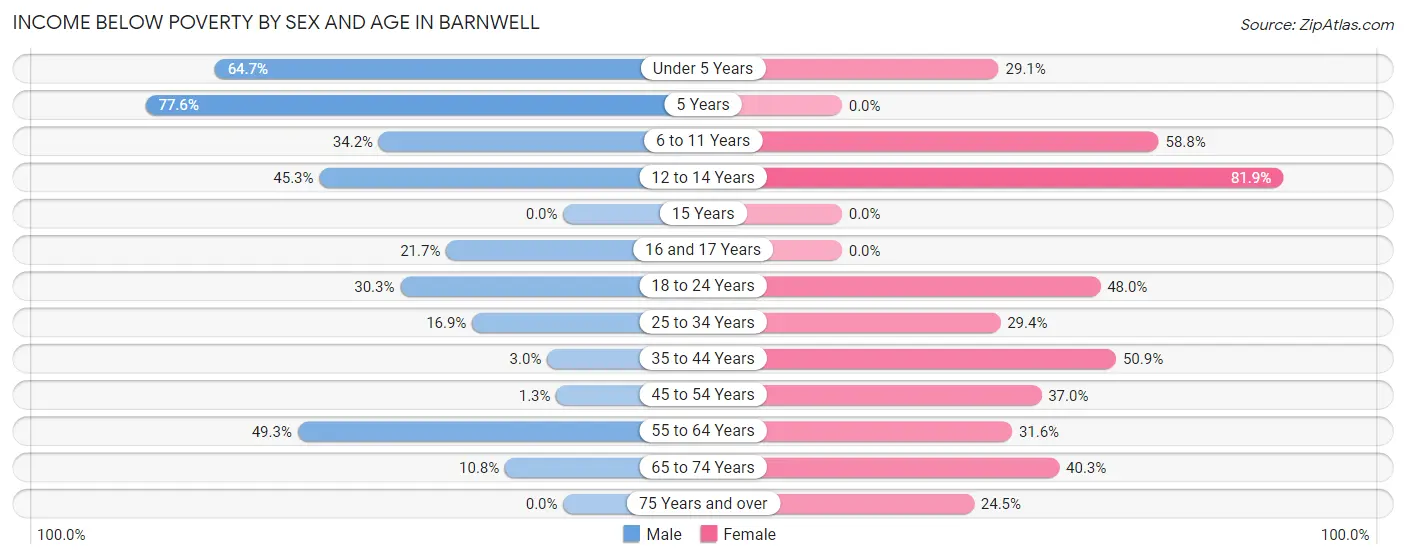
| Age Bracket | Male | Female |
| Under 5 Years | 110 (64.7%) | 23 (29.1%) |
| 5 Years | 38 (77.5%) | 0 (0.0%) |
| 6 to 11 Years | 38 (34.2%) | 194 (58.8%) |
| 12 to 14 Years | 77 (45.3%) | 104 (81.9%) |
| 15 Years | 0 (0.0%) | 0 (0.0%) |
| 16 and 17 Years | 20 (21.7%) | 0 (0.0%) |
| 18 to 24 Years | 79 (30.3%) | 212 (48.0%) |
| 25 to 34 Years | 55 (16.9%) | 45 (29.4%) |
| 35 to 44 Years | 4 (3.0%) | 172 (50.9%) |
| 45 to 54 Years | 3 (1.3%) | 87 (37.0%) |
| 55 to 64 Years | 106 (49.3%) | 60 (31.6%) |
| 65 to 74 Years | 16 (10.8%) | 96 (40.3%) |
| 75 Years and over | 0 (0.0%) | 62 (24.5%) |
| Total | 546 (27.8%) | 1,055 (42.3%) |
Income Above Poverty by Sex and Age in Barnwell
According to the poverty statistics in Barnwell, males aged 75 years and over and females aged 5 years are the age groups that are most secure financially, with 100.0% of males and 100.0% of females in these age groups living above the poverty line.
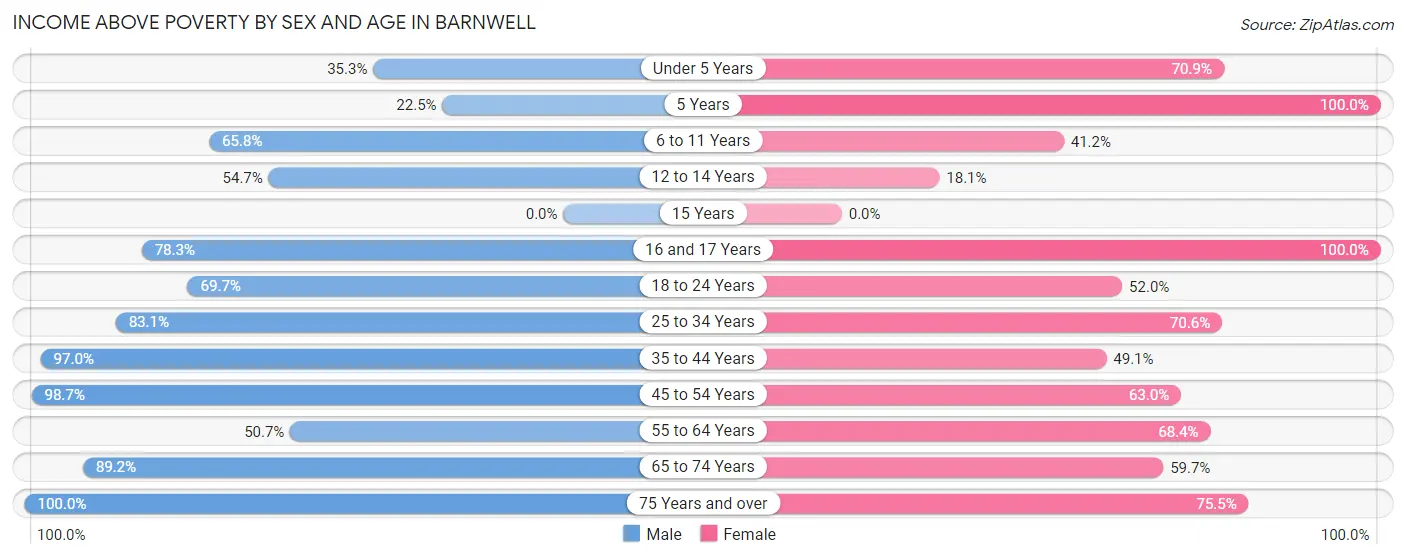
| Age Bracket | Male | Female |
| Under 5 Years | 60 (35.3%) | 56 (70.9%) |
| 5 Years | 11 (22.5%) | 10 (100.0%) |
| 6 to 11 Years | 73 (65.8%) | 136 (41.2%) |
| 12 to 14 Years | 93 (54.7%) | 23 (18.1%) |
| 15 Years | 0 (0.0%) | 0 (0.0%) |
| 16 and 17 Years | 72 (78.3%) | 96 (100.0%) |
| 18 to 24 Years | 182 (69.7%) | 230 (52.0%) |
| 25 to 34 Years | 270 (83.1%) | 108 (70.6%) |
| 35 to 44 Years | 130 (97.0%) | 166 (49.1%) |
| 45 to 54 Years | 228 (98.7%) | 148 (63.0%) |
| 55 to 64 Years | 109 (50.7%) | 130 (68.4%) |
| 65 to 74 Years | 132 (89.2%) | 142 (59.7%) |
| 75 Years and over | 58 (100.0%) | 191 (75.5%) |
| Total | 1,418 (72.2%) | 1,436 (57.7%) |
Income Below Poverty Among Married-Couple Families in Barnwell
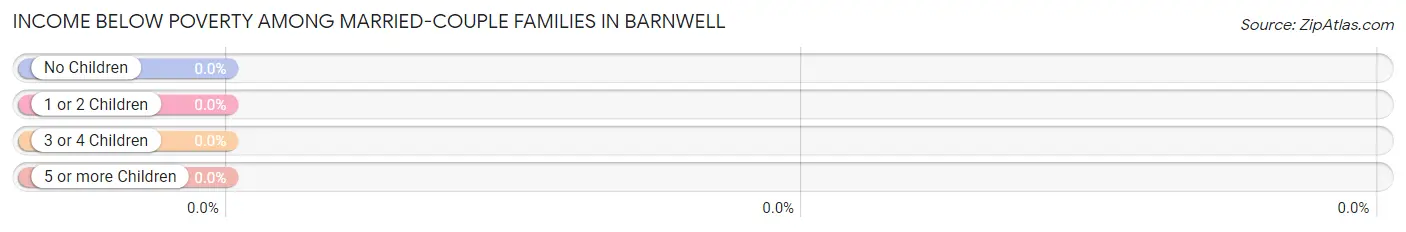
| Children | Above Poverty | Below Poverty |
| No Children | 285 (100.0%) | 0 (0.0%) |
| 1 or 2 Children | 138 (100.0%) | 0 (0.0%) |
| 3 or 4 Children | 33 (100.0%) | 0 (0.0%) |
| 5 or more Children | 0 (0.0%) | 0 (0.0%) |
| Total | 456 (100.0%) | 0 (0.0%) |
Income Below Poverty Among Single-Parent Households in Barnwell
According to the poverty data in Barnwell, 10.7% or 15 single-father households and 62.0% or 293 single-mother households are living below the poverty line. Among single-father households, those with no children have the highest poverty rate, with 15 households (13.3%) experiencing poverty. Likewise, among single-mother households, those with 3 or 4 children have the highest poverty rate, with 20 households (100.0%) falling below the poverty line.
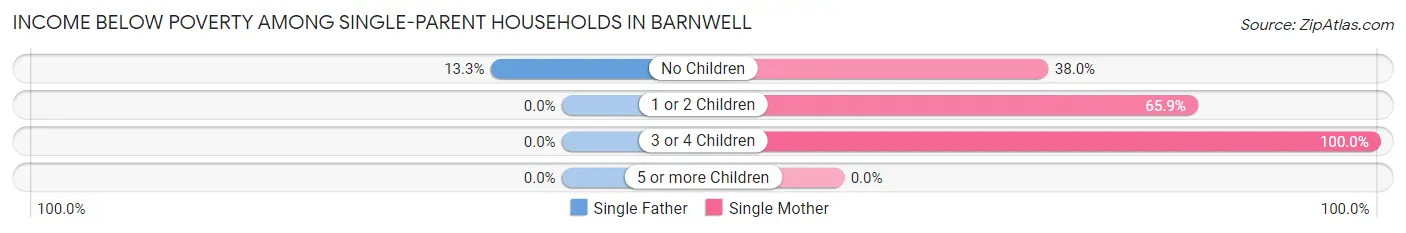
| Children | Single Father | Single Mother |
| No Children | 15 (13.3%) | 35 (38.0%) |
| 1 or 2 Children | 0 (0.0%) | 238 (65.9%) |
| 3 or 4 Children | 0 (0.0%) | 20 (100.0%) |
| 5 or more Children | 0 (0.0%) | 0 (0.0%) |
| Total | 15 (10.7%) | 293 (62.0%) |
Income Below Poverty Among Married-Couple vs Single-Parent Households in Barnwell
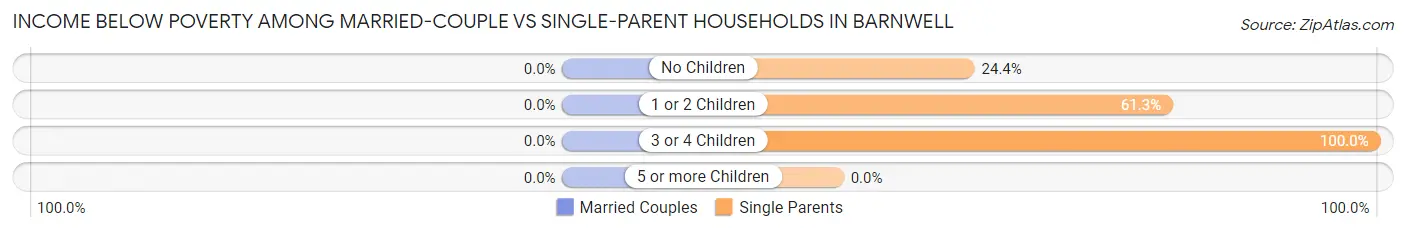
| Children | Married-Couple Families | Single-Parent Households |
| No Children | 0 (0.0%) | 50 (24.4%) |
| 1 or 2 Children | 0 (0.0%) | 238 (61.3%) |
| 3 or 4 Children | 0 (0.0%) | 20 (100.0%) |
| 5 or more Children | 0 (0.0%) | 0 (0.0%) |
| Total | 0 (0.0%) | 308 (50.2%) |
Race in Barnwell
The most populous races in Barnwell are Black / African American (2,748 | 59.2%), White / Caucasian (1,666 | 35.9%), and Two or more Races (143 | 3.1%).
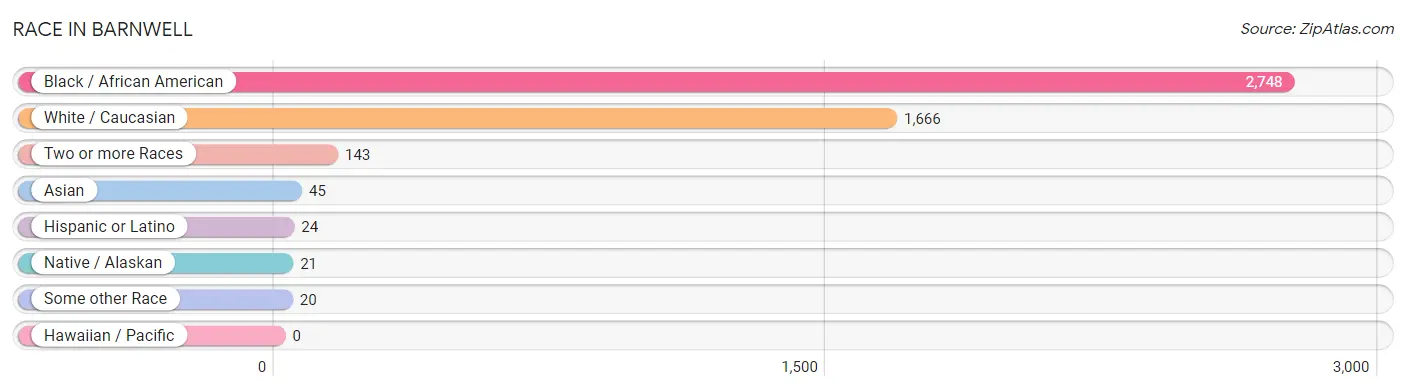
| Race | # Population | % Population |
| Asian | 45 | 1.0% |
| Black / African American | 2,748 | 59.2% |
| Hawaiian / Pacific | 0 | 0.0% |
| Hispanic or Latino | 24 | 0.5% |
| Native / Alaskan | 21 | 0.4% |
| White / Caucasian | 1,666 | 35.9% |
| Two or more Races | 143 | 3.1% |
| Some other Race | 20 | 0.4% |
| Total | 4,643 | 100.0% |
Ancestry in Barnwell
The most populous ancestries reported in Barnwell are American (944 | 20.3%), Jamaican (164 | 3.5%), English (144 | 3.1%), Subsaharan African (93 | 2.0%), and Thai (92 | 2.0%), together accounting for 30.9% of all Barnwell residents.
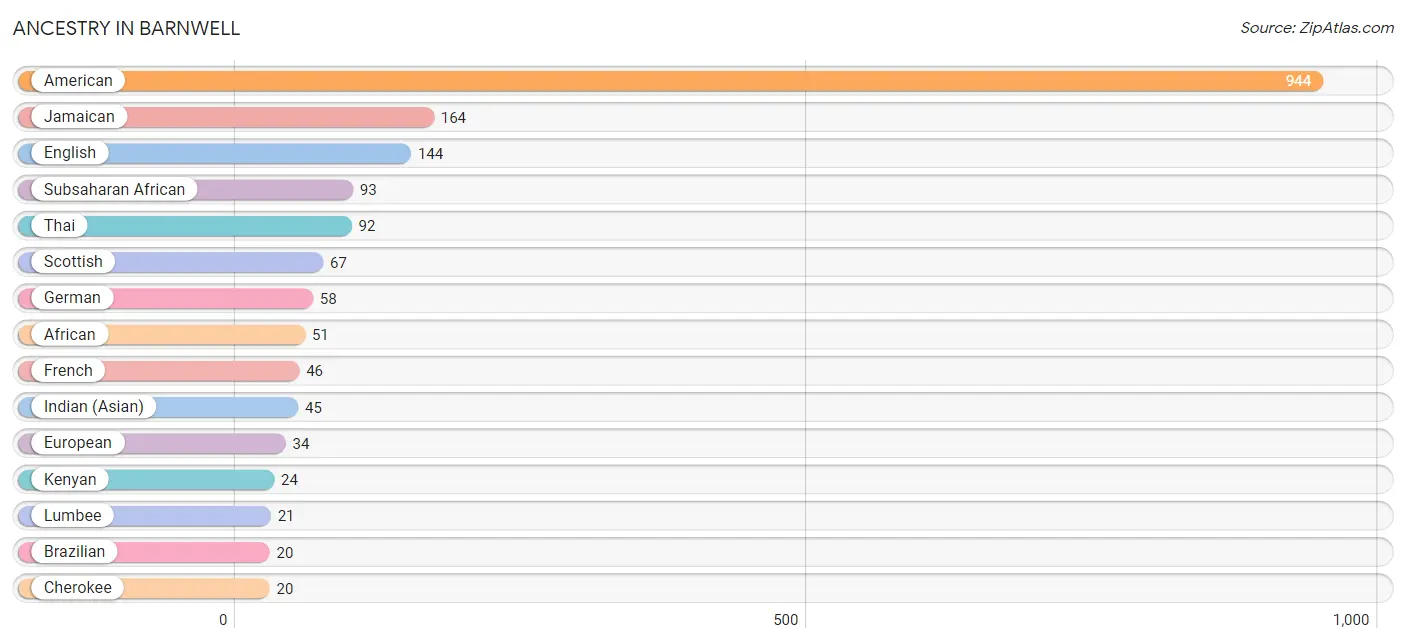
| Ancestry | # Population | % Population |
| African | 51 | 1.1% |
| American | 944 | 20.3% |
| Brazilian | 20 | 0.4% |
| Central American | 14 | 0.3% |
| Cherokee | 20 | 0.4% |
| Costa Rican | 14 | 0.3% |
| English | 144 | 3.1% |
| European | 34 | 0.7% |
| French | 46 | 1.0% |
| German | 58 | 1.3% |
| Ghanaian | 18 | 0.4% |
| Indian (Asian) | 45 | 1.0% |
| Irish | 13 | 0.3% |
| Italian | 8 | 0.2% |
| Jamaican | 164 | 3.5% |
| Kenyan | 24 | 0.5% |
| Lumbee | 21 | 0.4% |
| Portuguese | 20 | 0.4% |
| Puerto Rican | 10 | 0.2% |
| Scotch-Irish | 12 | 0.3% |
| Scottish | 67 | 1.4% |
| Subsaharan African | 93 | 2.0% |
| Thai | 92 | 2.0% | View All 23 Rows |
Immigrants in Barnwell
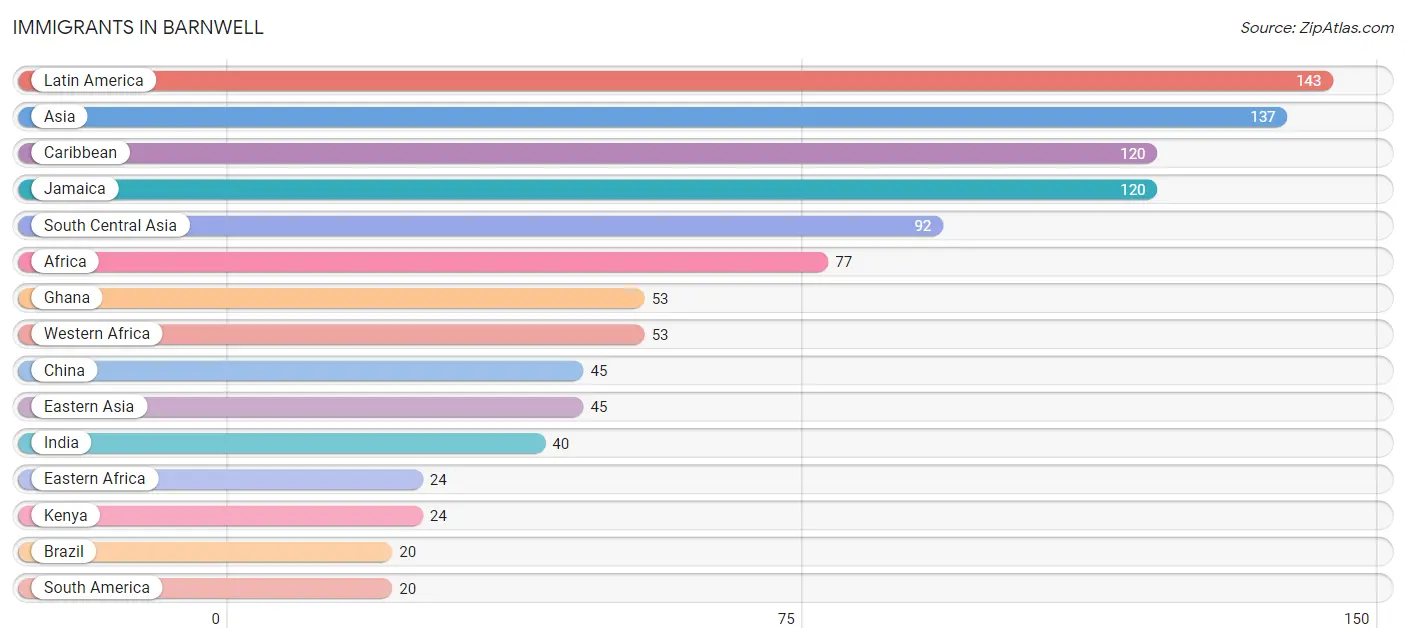
The most numerous immigrant groups reported in Barnwell came from Latin America (143 | 3.1%), Asia (137 | 2.9%), Caribbean (120 | 2.6%), Jamaica (120 | 2.6%), and South Central Asia (92 | 2.0%), together accounting for 13.2% of all Barnwell residents.
| Immigration Origin | # Population | % Population |
| Africa | 77 | 1.7% |
| Asia | 137 | 2.9% |
| Brazil | 20 | 0.4% |
| Caribbean | 120 | 2.6% |
| Central America | 3 | 0.1% |
| China | 45 | 1.0% |
| Costa Rica | 3 | 0.1% |
| Eastern Africa | 24 | 0.5% |
| Eastern Asia | 45 | 1.0% |
| Ghana | 53 | 1.1% |
| India | 40 | 0.9% |
| Jamaica | 120 | 2.6% |
| Kenya | 24 | 0.5% |
| Latin America | 143 | 3.1% |
| South America | 20 | 0.4% |
| South Central Asia | 92 | 2.0% |
| Western Africa | 53 | 1.1% | View All 17 Rows |
Sex and Age in Barnwell
Sex and Age in Barnwell
The most populous age groups in Barnwell are 30 to 34 Years (276 | 13.1%) for men and 20 to 24 Years (279 | 11.0%) for women.
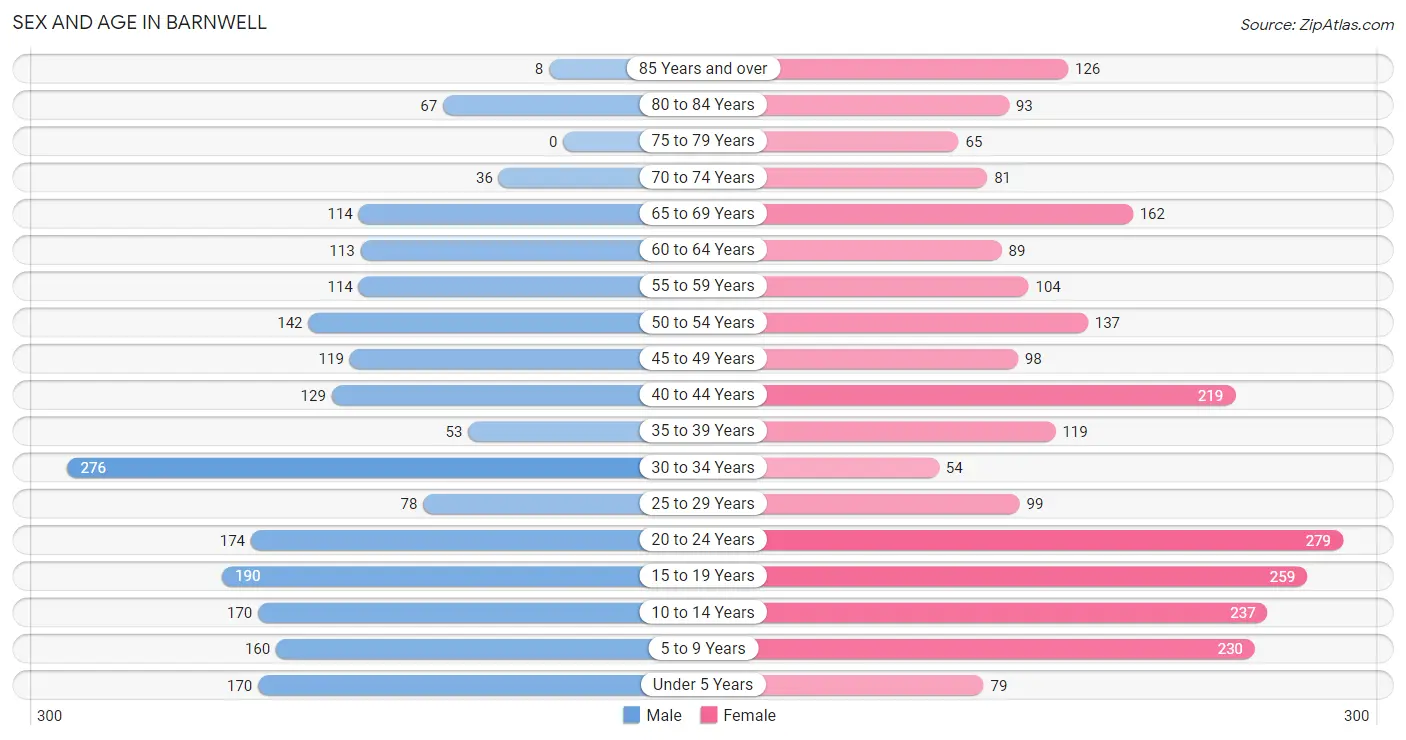
| Age Bracket | Male | Female |
| Under 5 Years | 170 (8.1%) | 79 (3.1%) |
| 5 to 9 Years | 160 (7.6%) | 230 (9.1%) |
| 10 to 14 Years | 170 (8.1%) | 237 (9.4%) |
| 15 to 19 Years | 190 (9.0%) | 259 (10.2%) |
| 20 to 24 Years | 174 (8.2%) | 279 (11.0%) |
| 25 to 29 Years | 78 (3.7%) | 99 (3.9%) |
| 30 to 34 Years | 276 (13.1%) | 54 (2.1%) |
| 35 to 39 Years | 53 (2.5%) | 119 (4.7%) |
| 40 to 44 Years | 129 (6.1%) | 219 (8.7%) |
| 45 to 49 Years | 119 (5.6%) | 98 (3.9%) |
| 50 to 54 Years | 142 (6.7%) | 137 (5.4%) |
| 55 to 59 Years | 114 (5.4%) | 104 (4.1%) |
| 60 to 64 Years | 113 (5.3%) | 89 (3.5%) |
| 65 to 69 Years | 114 (5.4%) | 162 (6.4%) |
| 70 to 74 Years | 36 (1.7%) | 81 (3.2%) |
| 75 to 79 Years | 0 (0.0%) | 65 (2.6%) |
| 80 to 84 Years | 67 (3.2%) | 93 (3.7%) |
| 85 Years and over | 8 (0.4%) | 126 (5.0%) |
| Total | 2,113 (100.0%) | 2,530 (100.0%) |
Families and Households in Barnwell
Median Family Size in Barnwell
The median family size in Barnwell is 3.29 persons per family, with single female/mother families (473 | 44.3%) accounting for the largest median family size of 3.67 persons per family. On the other hand, single male/father families (140 | 13.1%) represent the smallest median family size with 2.39 persons per family.
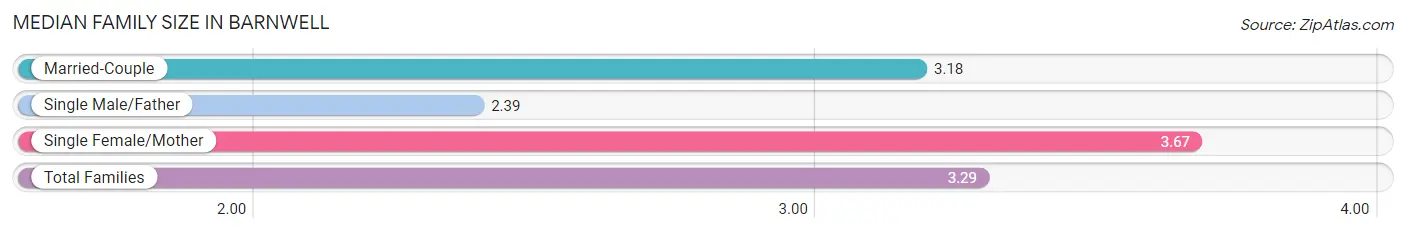
| Family Type | # Families | Family Size |
| Married-Couple | 456 (42.7%) | 3.18 |
| Single Male/Father | 140 (13.1%) | 2.39 |
| Single Female/Mother | 473 (44.3%) | 3.67 |
| Total Families | 1,069 (100.0%) | 3.29 |
Median Household Size in Barnwell
The median household size in Barnwell is 2.40 persons per household, with single female/mother households (473 | 25.6%) accounting for the largest median household size of 3.81 persons per household. non-family households (776 | 42.1%) represent the smallest median household size with 1.05 persons per household.
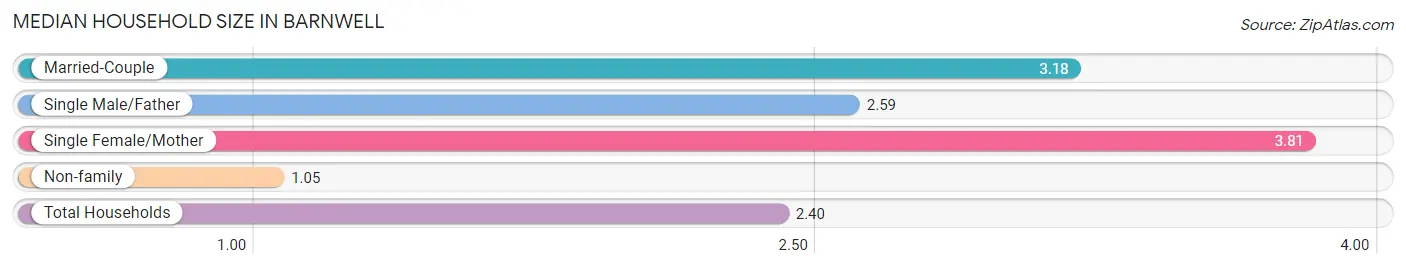
| Household Type | # Households | Household Size |
| Married-Couple | 456 (24.7%) | 3.18 |
| Single Male/Father | 140 (7.6%) | 2.59 |
| Single Female/Mother | 473 (25.6%) | 3.81 |
| Non-family | 776 (42.1%) | 1.05 |
| Total Households | 1,845 (100.0%) | 2.40 |
Household Size by Marriage Status in Barnwell
Out of a total of 1,845 households in Barnwell, 1,069 (57.9%) are family households, while 776 (42.1%) are nonfamily households. The most numerous type of family households are 2-person households, comprising 529, and the most common type of nonfamily households are 1-person households, comprising 749.
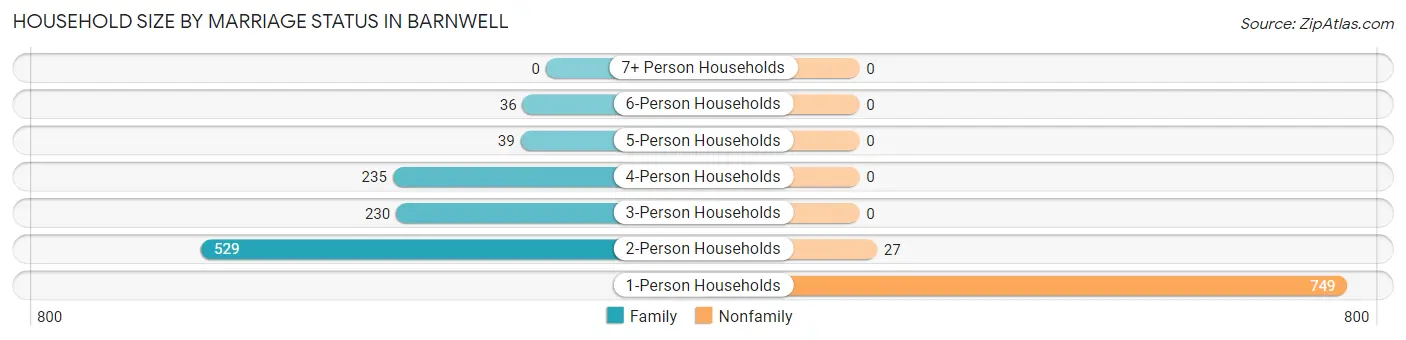
| Household Size | Family Households | Nonfamily Households |
| 1-Person Households | - | 749 (40.6%) |
| 2-Person Households | 529 (28.7%) | 27 (1.5%) |
| 3-Person Households | 230 (12.5%) | 0 (0.0%) |
| 4-Person Households | 235 (12.7%) | 0 (0.0%) |
| 5-Person Households | 39 (2.1%) | 0 (0.0%) |
| 6-Person Households | 36 (1.9%) | 0 (0.0%) |
| 7+ Person Households | 0 (0.0%) | 0 (0.0%) |
| Total | 1,069 (57.9%) | 776 (42.1%) |
Female Fertility in Barnwell
Fertility by Age in Barnwell
Average fertility rate in Barnwell is 26.0 births per 1,000 women. Women in the age bracket of 20 to 34 years have the highest fertility rate with 69.0 births per 1,000 women. Women in the age bracket of 20 to 34 years acount for 100.0% of all women with births.
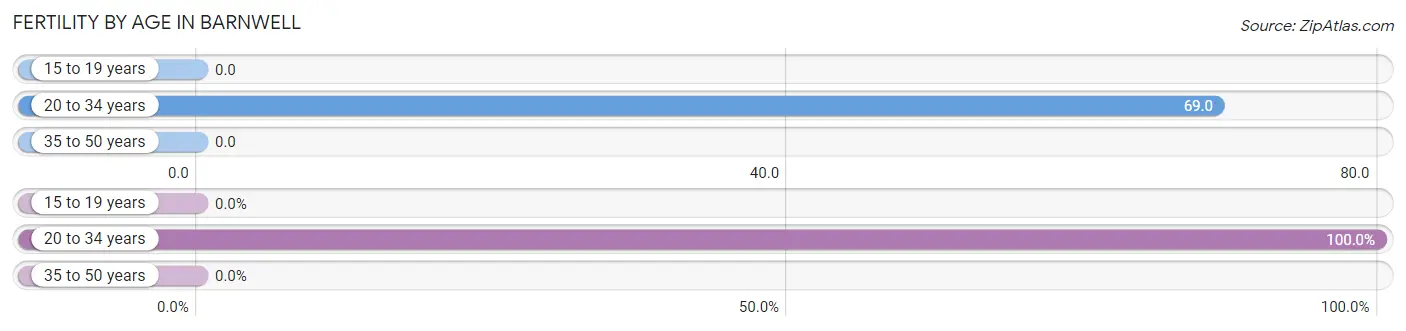
| Age Bracket | Women with Births | Births / 1,000 Women |
| 15 to 19 years | 0 (0.0%) | 0.0 |
| 20 to 34 years | 30 (100.0%) | 69.0 |
| 35 to 50 years | 0 (0.0%) | 0.0 |
| Total | 30 (100.0%) | 26.0 |
Fertility by Age by Marriage Status in Barnwell
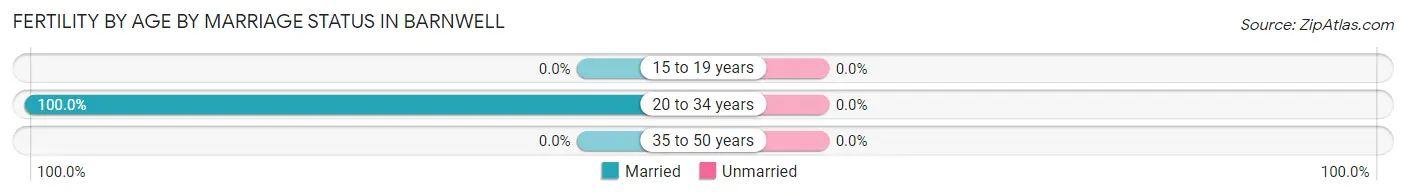
| Age Bracket | Married | Unmarried |
| 15 to 19 years | 0 (0.0%) | 0 (0.0%) |
| 20 to 34 years | 30 (100.0%) | 0 (0.0%) |
| 35 to 50 years | 0 (0.0%) | 0 (0.0%) |
| Total | 30 (100.0%) | 0 (0.0%) |
Fertility by Education in Barnwell

| Educational Attainment | Women with Births | Births / 1,000 Women |
| Less than High School | 0 (0.0%) | 0.0 |
| High School Diploma | 0 (0.0%) | 0.0 |
| College or Associate's Degree | 0 (0.0%) | 0.0 |
| Bachelor's Degree | 30 (100.0%) | 326.0 |
| Graduate Degree | 0 (0.0%) | 0.0 |
| Total | 30 (100.0%) | 26.0 |
Fertility by Education by Marriage Status in Barnwell
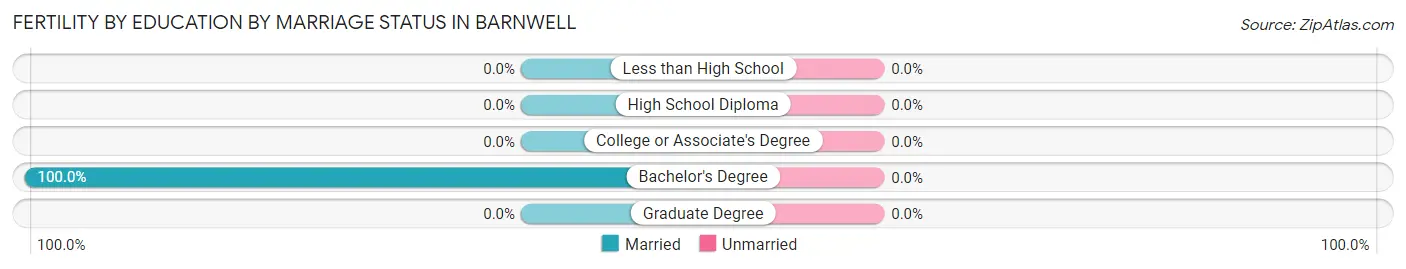
| Educational Attainment | Married | Unmarried |
| Less than High School | 0 (0.0%) | 0 (0.0%) |
| High School Diploma | 0 (0.0%) | 0 (0.0%) |
| College or Associate's Degree | 0 (0.0%) | 0 (0.0%) |
| Bachelor's Degree | 30 (100.0%) | 0 (0.0%) |
| Graduate Degree | 0 (0.0%) | 0 (0.0%) |
| Total | 30 (100.0%) | 0 (0.0%) |
Employment Characteristics in Barnwell
Employment by Class of Employer in Barnwell
Among the 1,635 employed individuals in Barnwell, private company employees (1,180 | 72.2%), local government employees (143 | 8.7%), and federal government employees (98 | 6.0%) make up the most common classes of employment.
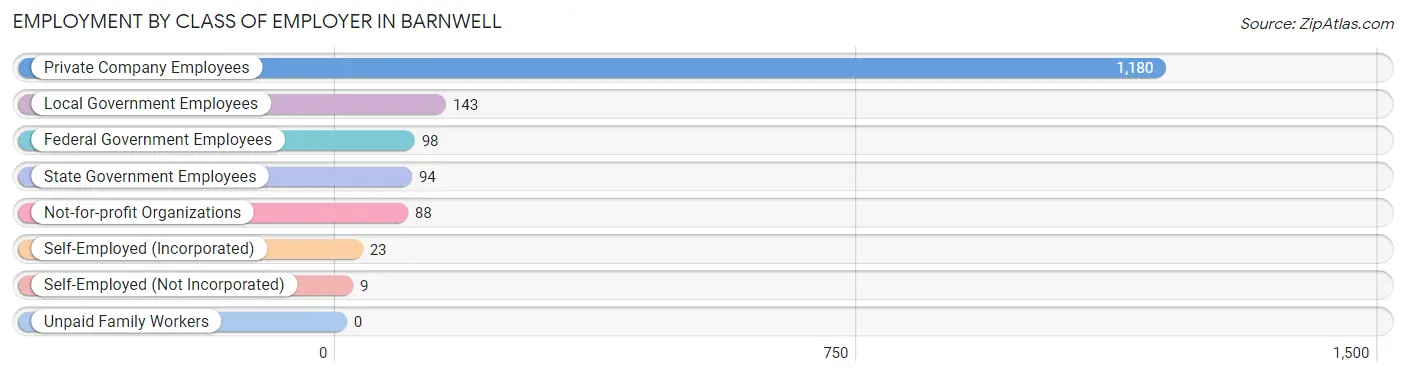
| Employer Class | # Employees | % Employees |
| Private Company Employees | 1,180 | 72.2% |
| Self-Employed (Incorporated) | 23 | 1.4% |
| Self-Employed (Not Incorporated) | 9 | 0.5% |
| Not-for-profit Organizations | 88 | 5.4% |
| Local Government Employees | 143 | 8.7% |
| State Government Employees | 94 | 5.8% |
| Federal Government Employees | 98 | 6.0% |
| Unpaid Family Workers | 0 | 0.0% |
| Total | 1,635 | 100.0% |
Employment Status by Age in Barnwell
According to the labor force statistics for Barnwell, out of the total population over 16 years of age (3,597), 53.3% or 1,917 individuals are in the labor force, with 12.4% or 238 of them unemployed. The age group with the highest labor force participation rate is 30 to 34 years, with 87.0% or 287 individuals in the labor force. Within the labor force, the 25 to 29 years age range has the highest percentage of unemployed individuals, with 38.6% or 54 of them being unemployed.
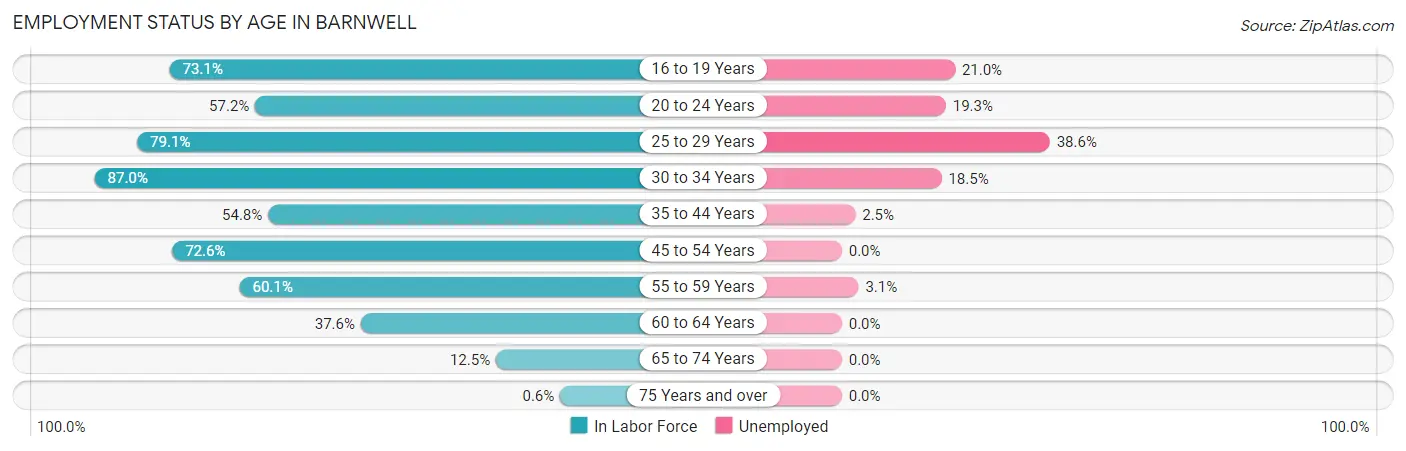
| Age Bracket | In Labor Force | Unemployed |
| 16 to 19 Years | 328 (73.1%) | 69 (21.0%) |
| 20 to 24 Years | 259 (57.2%) | 50 (19.3%) |
| 25 to 29 Years | 140 (79.1%) | 54 (38.6%) |
| 30 to 34 Years | 287 (87.0%) | 53 (18.5%) |
| 35 to 44 Years | 285 (54.8%) | 7 (2.5%) |
| 45 to 54 Years | 360 (72.6%) | 0 (0.0%) |
| 55 to 59 Years | 131 (60.1%) | 4 (3.1%) |
| 60 to 64 Years | 76 (37.6%) | 0 (0.0%) |
| 65 to 74 Years | 49 (12.5%) | 0 (0.0%) |
| 75 Years and over | 2 (0.6%) | 0 (0.0%) |
| Total | 1,917 (53.3%) | 238 (12.4%) |
Employment Status by Educational Attainment in Barnwell
According to labor force statistics for Barnwell, 65.8% of individuals (1,278) out of the total population between 25 and 64 years of age (1,943) are in the labor force, with 9.2% or 118 of them being unemployed. The group with the highest labor force participation rate are those with the educational attainment of bachelor's degree or higher, with 86.2% or 381 individuals in the labor force. Within the labor force, individuals with less than high school education have the highest percentage of unemployment, with 34.5% or 60 of them being unemployed.
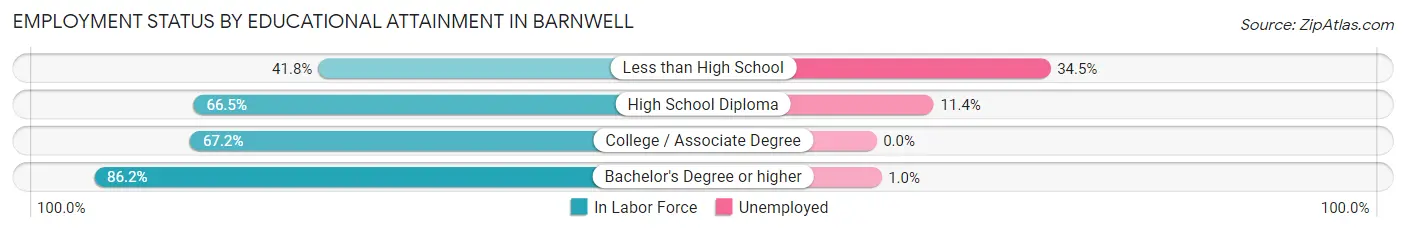
| Educational Attainment | In Labor Force | Unemployed |
| Less than High School | 174 (41.8%) | 144 (34.5%) |
| High School Diploma | 472 (66.5%) | 81 (11.4%) |
| College / Associate Degree | 252 (67.2%) | 0 (0.0%) |
| Bachelor's Degree or higher | 381 (86.2%) | 4 (1.0%) |
| Total | 1,278 (65.8%) | 179 (9.2%) |
Employment Occupations by Sex in Barnwell
Management, Business, Science and Arts Occupations
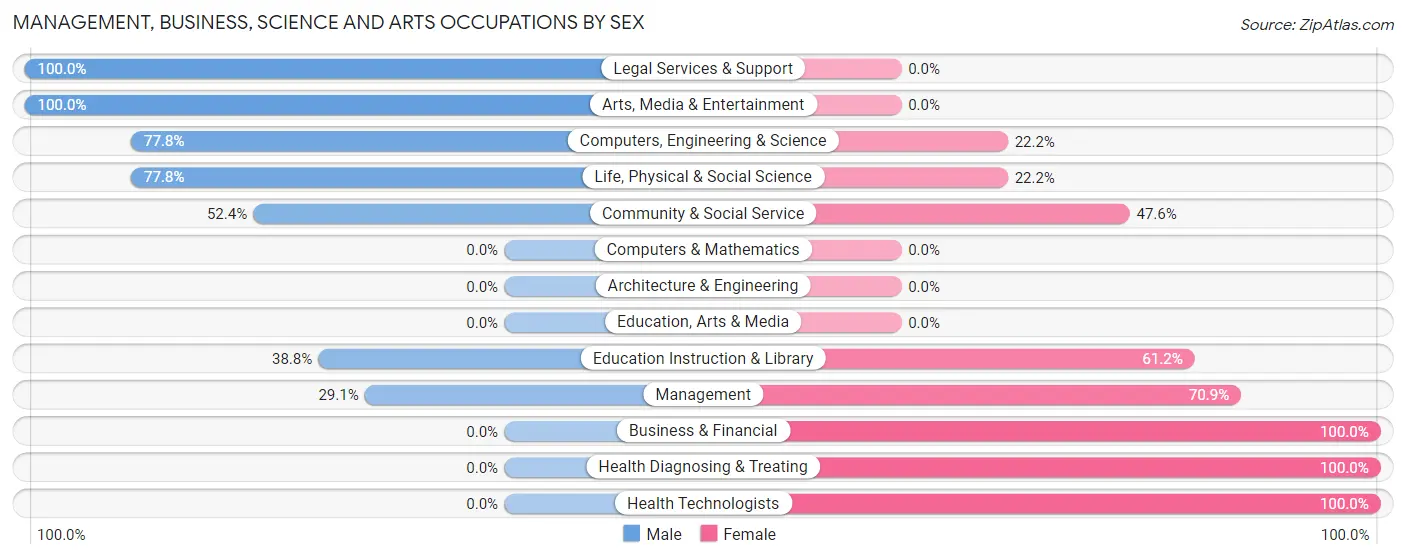
The most common Management, Business, Science and Arts occupations in Barnwell are Community & Social Service (275 | 16.4%), Education Instruction & Library (214 | 12.7%), Management (134 | 8.0%), Health Diagnosing & Treating (36 | 2.1%), and Legal Services & Support (33 | 2.0%).
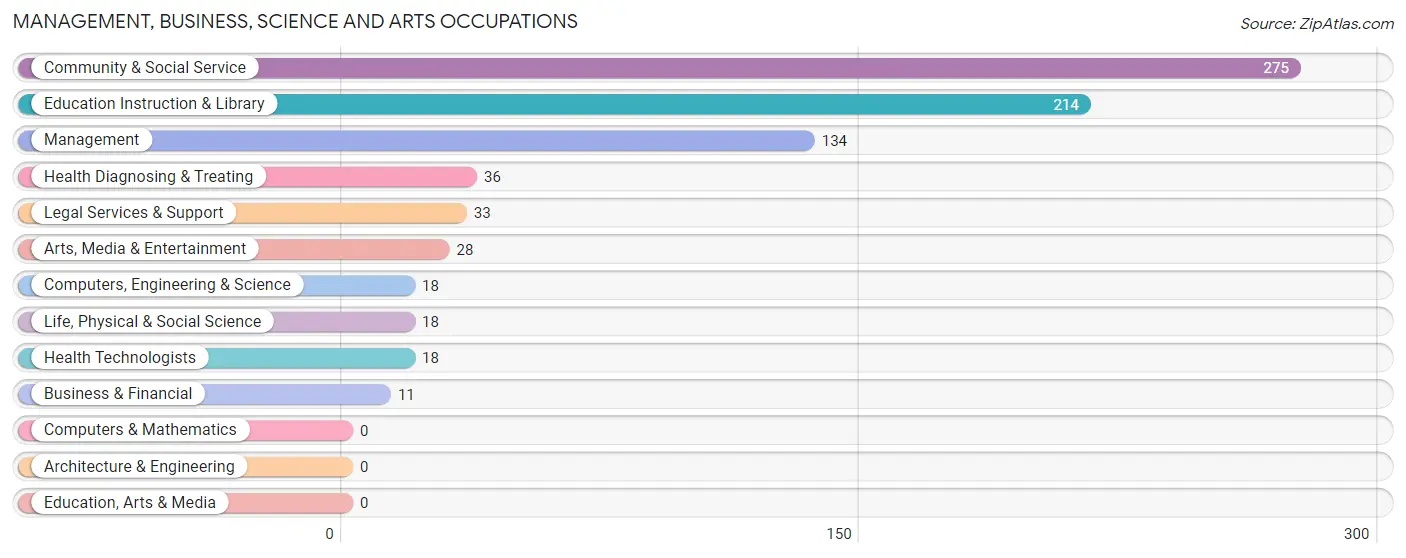
Management, Business, Science and Arts Occupations by Sex
Within the Management, Business, Science and Arts occupations in Barnwell, the most male-oriented occupations are Legal Services & Support (100.0%), Arts, Media & Entertainment (100.0%), and Computers, Engineering & Science (77.8%), while the most female-oriented occupations are Business & Financial (100.0%), Health Diagnosing & Treating (100.0%), and Health Technologists (100.0%).
| Occupation | Male | Female |
| Management | 39 (29.1%) | 95 (70.9%) |
| Business & Financial | 0 (0.0%) | 11 (100.0%) |
| Computers, Engineering & Science | 14 (77.8%) | 4 (22.2%) |
| Computers & Mathematics | 0 (0.0%) | 0 (0.0%) |
| Architecture & Engineering | 0 (0.0%) | 0 (0.0%) |
| Life, Physical & Social Science | 14 (77.8%) | 4 (22.2%) |
| Community & Social Service | 144 (52.4%) | 131 (47.6%) |
| Education, Arts & Media | 0 (0.0%) | 0 (0.0%) |
| Legal Services & Support | 33 (100.0%) | 0 (0.0%) |
| Education Instruction & Library | 83 (38.8%) | 131 (61.2%) |
| Arts, Media & Entertainment | 28 (100.0%) | 0 (0.0%) |
| Health Diagnosing & Treating | 0 (0.0%) | 36 (100.0%) |
| Health Technologists | 0 (0.0%) | 18 (100.0%) |
| Total (Category) | 197 (41.6%) | 277 (58.4%) |
| Total (Overall) | 796 (47.4%) | 884 (52.6%) |
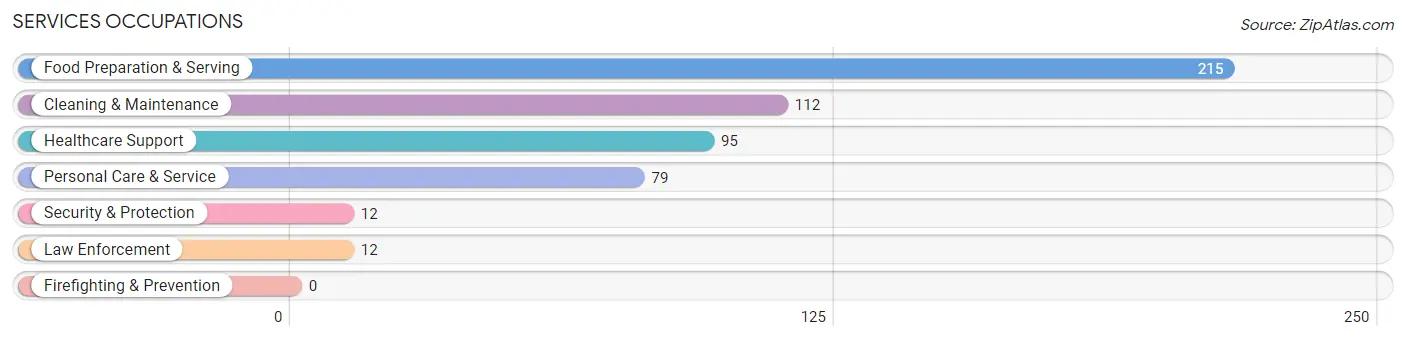
Services Occupations
The most common Services occupations in Barnwell are Food Preparation & Serving (215 | 12.8%), Cleaning & Maintenance (112 | 6.7%), Healthcare Support (95 | 5.7%), Personal Care & Service (79 | 4.7%), and Security & Protection (12 | 0.7%).
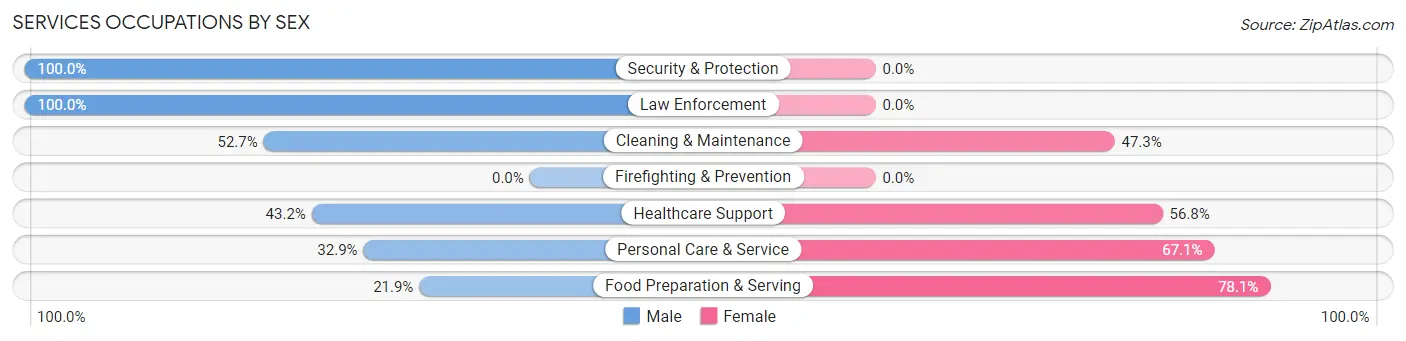
Services Occupations by Sex
Within the Services occupations in Barnwell, the most male-oriented occupations are Security & Protection (100.0%), Law Enforcement (100.0%), and Cleaning & Maintenance (52.7%), while the most female-oriented occupations are Food Preparation & Serving (78.1%), Personal Care & Service (67.1%), and Healthcare Support (56.8%).
| Occupation | Male | Female |
| Healthcare Support | 41 (43.2%) | 54 (56.8%) |
| Security & Protection | 12 (100.0%) | 0 (0.0%) |
| Firefighting & Prevention | 0 (0.0%) | 0 (0.0%) |
| Law Enforcement | 12 (100.0%) | 0 (0.0%) |
| Food Preparation & Serving | 47 (21.9%) | 168 (78.1%) |
| Cleaning & Maintenance | 59 (52.7%) | 53 (47.3%) |
| Personal Care & Service | 26 (32.9%) | 53 (67.1%) |
| Total (Category) | 185 (36.1%) | 328 (63.9%) |
| Total (Overall) | 796 (47.4%) | 884 (52.6%) |
Sales and Office Occupations
The most common Sales and Office occupations in Barnwell are Office & Administration (151 | 9.0%), and Sales & Related (24 | 1.4%).

Sales and Office Occupations by Sex

| Occupation | Male | Female |
| Sales & Related | 0 (0.0%) | 24 (100.0%) |
| Office & Administration | 39 (25.8%) | 112 (74.2%) |
| Total (Category) | 39 (22.3%) | 136 (77.7%) |
| Total (Overall) | 796 (47.4%) | 884 (52.6%) |
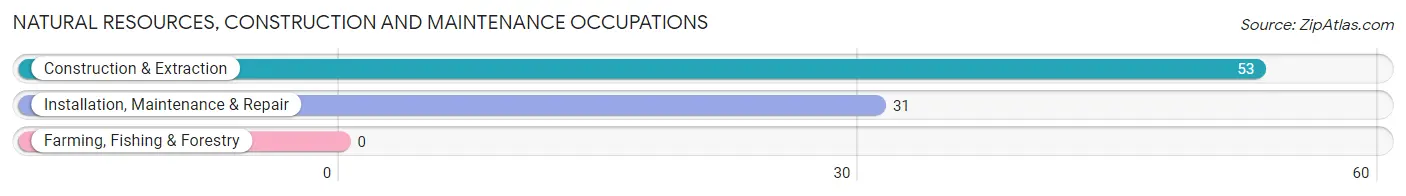
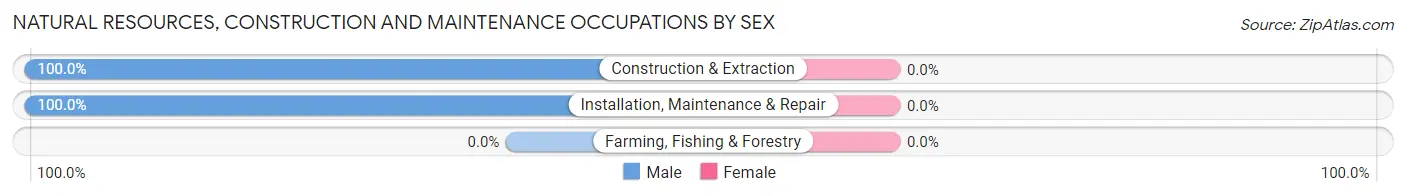
Natural Resources, Construction and Maintenance Occupations
The most common Natural Resources, Construction and Maintenance occupations in Barnwell are Construction & Extraction (53 | 3.2%), and Installation, Maintenance & Repair (31 | 1.8%).
Natural Resources, Construction and Maintenance Occupations by Sex
| Occupation | Male | Female |
| Farming, Fishing & Forestry | 0 (0.0%) | 0 (0.0%) |
| Construction & Extraction | 53 (100.0%) | 0 (0.0%) |
| Installation, Maintenance & Repair | 31 (100.0%) | 0 (0.0%) |
| Total (Category) | 84 (100.0%) | 0 (0.0%) |
| Total (Overall) | 796 (47.4%) | 884 (52.6%) |
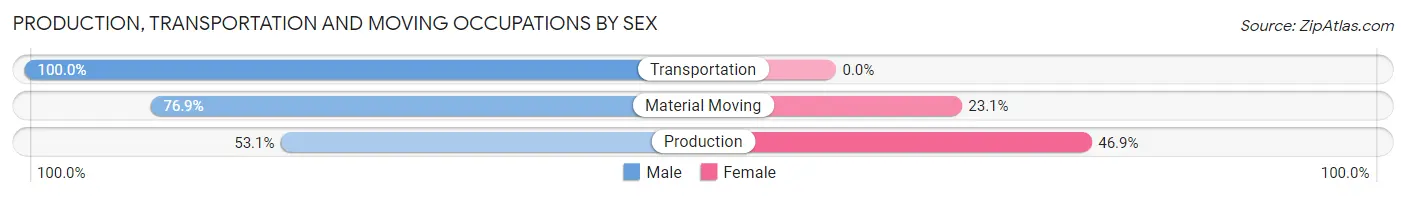
Production, Transportation and Moving Occupations
The most common Production, Transportation and Moving occupations in Barnwell are Production (292 | 17.4%), Transportation (116 | 6.9%), and Material Moving (26 | 1.5%).

Production, Transportation and Moving Occupations by Sex
| Occupation | Male | Female |
| Production | 155 (53.1%) | 137 (46.9%) |
| Transportation | 116 (100.0%) | 0 (0.0%) |
| Material Moving | 20 (76.9%) | 6 (23.1%) |
| Total (Category) | 291 (67.0%) | 143 (33.0%) |
| Total (Overall) | 796 (47.4%) | 884 (52.6%) |
Employment Industries by Sex in Barnwell
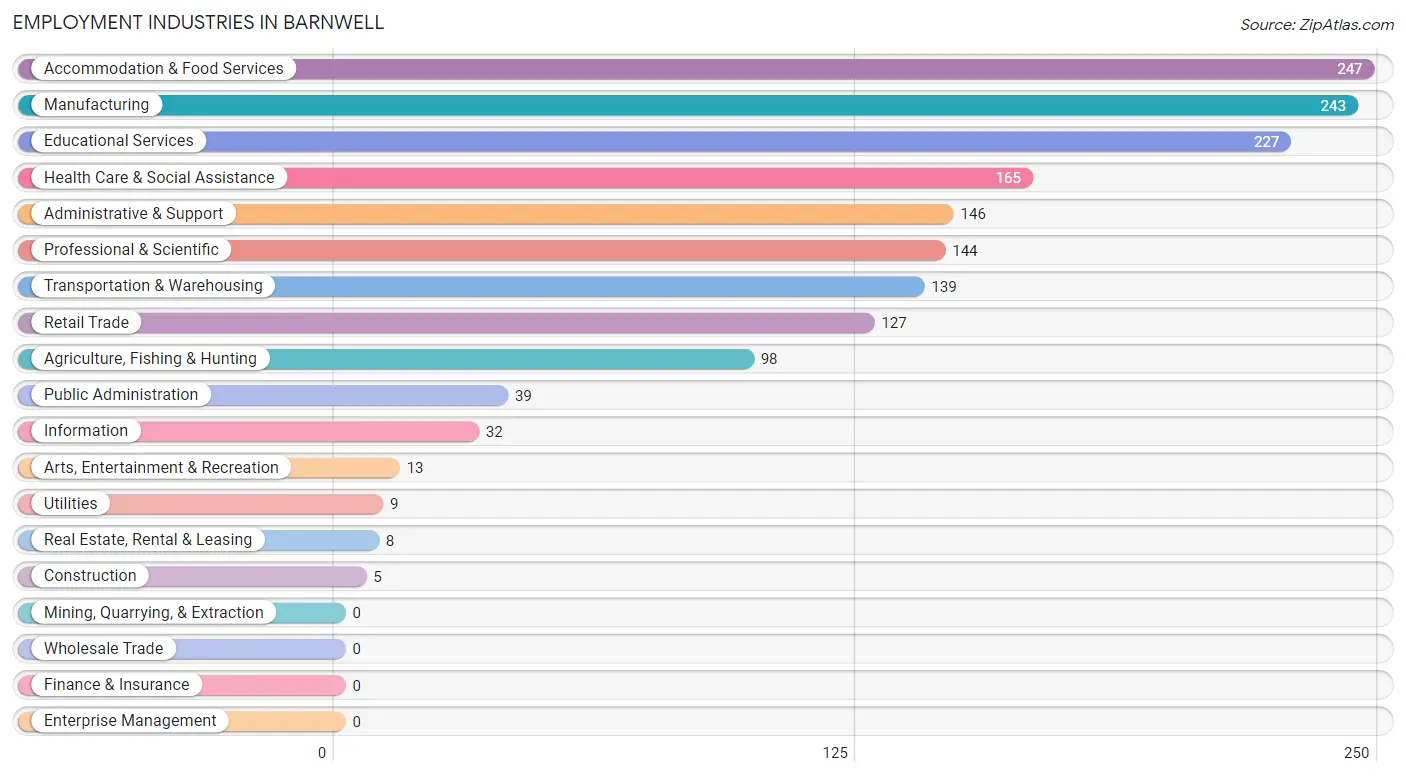
Employment Industries in Barnwell
The major employment industries in Barnwell include Accommodation & Food Services (247 | 14.7%), Manufacturing (243 | 14.5%), Educational Services (227 | 13.5%), Health Care & Social Assistance (165 | 9.8%), and Administrative & Support (146 | 8.7%).
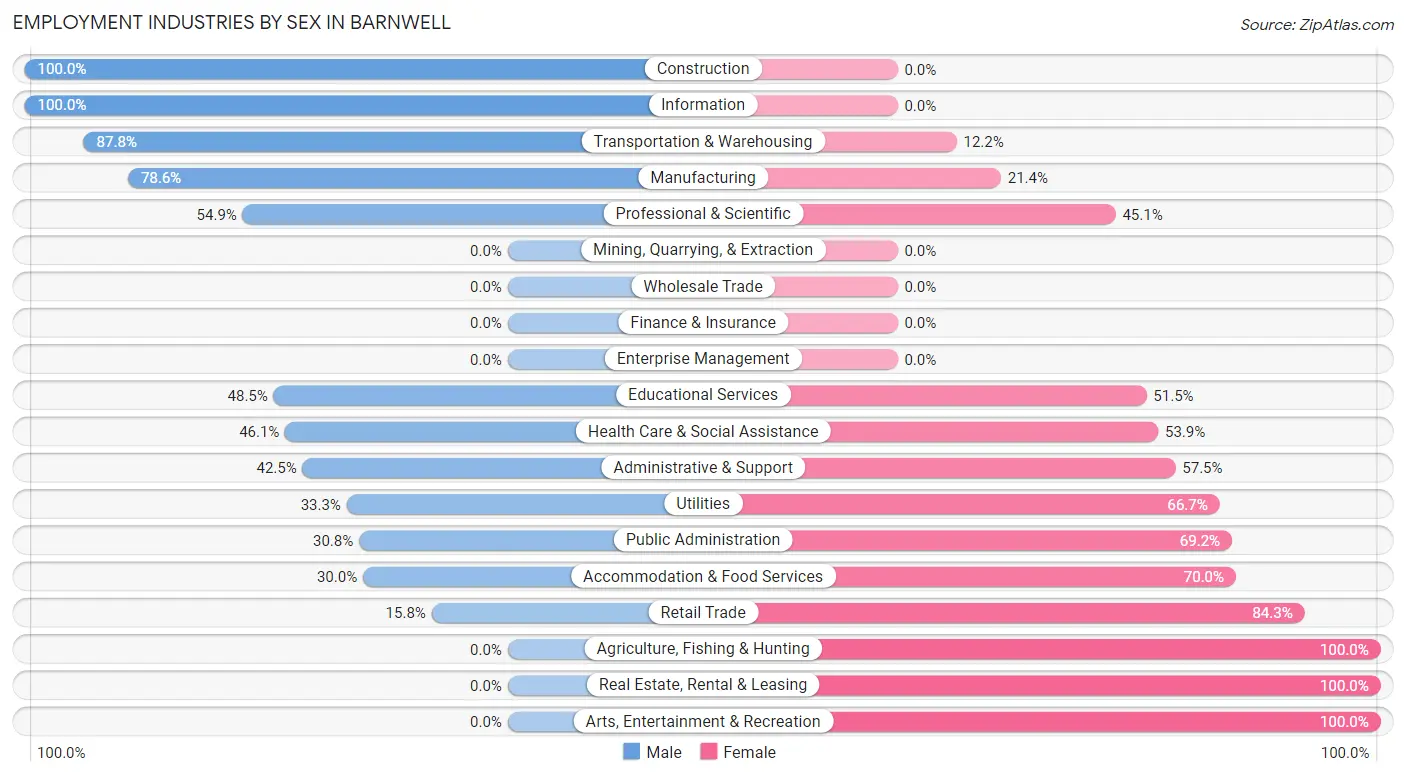
Employment Industries by Sex in Barnwell
The Barnwell industries that see more men than women are Construction (100.0%), Information (100.0%), and Transportation & Warehousing (87.8%), whereas the industries that tend to have a higher number of women are Agriculture, Fishing & Hunting (100.0%), Real Estate, Rental & Leasing (100.0%), and Arts, Entertainment & Recreation (100.0%).
| Industry | Male | Female |
| Agriculture, Fishing & Hunting | 0 (0.0%) | 98 (100.0%) |
| Mining, Quarrying, & Extraction | 0 (0.0%) | 0 (0.0%) |
| Construction | 5 (100.0%) | 0 (0.0%) |
| Manufacturing | 191 (78.6%) | 52 (21.4%) |
| Wholesale Trade | 0 (0.0%) | 0 (0.0%) |
| Retail Trade | 20 (15.8%) | 107 (84.3%) |
| Transportation & Warehousing | 122 (87.8%) | 17 (12.2%) |
| Utilities | 3 (33.3%) | 6 (66.7%) |
| Information | 32 (100.0%) | 0 (0.0%) |
| Finance & Insurance | 0 (0.0%) | 0 (0.0%) |
| Real Estate, Rental & Leasing | 0 (0.0%) | 8 (100.0%) |
| Professional & Scientific | 79 (54.9%) | 65 (45.1%) |
| Enterprise Management | 0 (0.0%) | 0 (0.0%) |
| Administrative & Support | 62 (42.5%) | 84 (57.5%) |
| Educational Services | 110 (48.5%) | 117 (51.5%) |
| Health Care & Social Assistance | 76 (46.1%) | 89 (53.9%) |
| Arts, Entertainment & Recreation | 0 (0.0%) | 13 (100.0%) |
| Accommodation & Food Services | 74 (30.0%) | 173 (70.0%) |
| Public Administration | 12 (30.8%) | 27 (69.2%) |
| Total | 796 (47.4%) | 884 (52.6%) |
Education in Barnwell
School Enrollment in Barnwell
The most common levels of schooling among the 1,265 students in Barnwell are high school (420 | 33.2%), elementary school (312 | 24.7%), and middle school (284 | 22.5%).
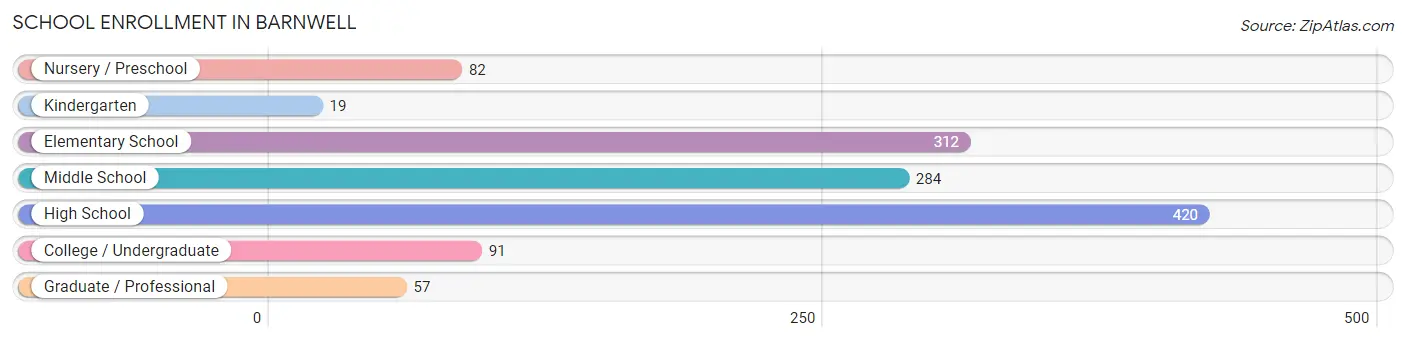
| School Level | # Students | % Students |
| Nursery / Preschool | 82 | 6.5% |
| Kindergarten | 19 | 1.5% |
| Elementary School | 312 | 24.7% |
| Middle School | 284 | 22.5% |
| High School | 420 | 33.2% |
| College / Undergraduate | 91 | 7.2% |
| Graduate / Professional | 57 | 4.5% |
| Total | 1,265 | 100.0% |
School Enrollment by Age by Funding Source in Barnwell
Out of a total of 1,265 students who are enrolled in schools in Barnwell, 257 (20.3%) attend a private institution, while the remaining 1,008 (79.7%) are enrolled in public schools. The age group of 3 to 4 year olds has the highest likelihood of being enrolled in private schools, with 44 (100.0% in the age bracket) enrolled. Conversely, the age group of 10 to 14 year olds has the lowest likelihood of being enrolled in a private school, with 361 (100.0% in the age bracket) attending a public institution.
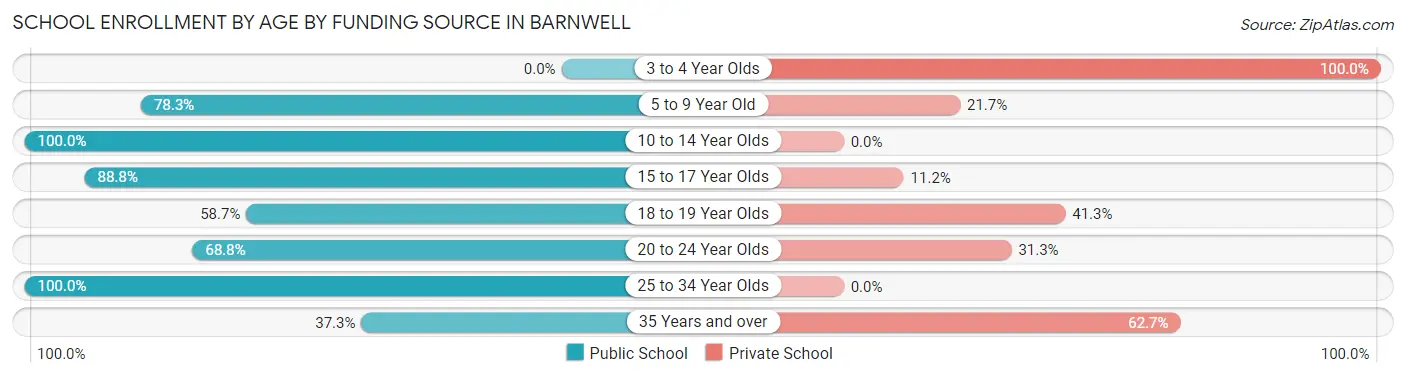
| Age Bracket | Public School | Private School |
| 3 to 4 Year Olds | 0 (0.0%) | 44 (100.0%) |
| 5 to 9 Year Old | 289 (78.3%) | 80 (21.7%) |
| 10 to 14 Year Olds | 361 (100.0%) | 0 (0.0%) |
| 15 to 17 Year Olds | 167 (88.8%) | 21 (11.2%) |
| 18 to 19 Year Olds | 64 (58.7%) | 45 (41.3%) |
| 20 to 24 Year Olds | 66 (68.8%) | 30 (31.2%) |
| 25 to 34 Year Olds | 39 (100.0%) | 0 (0.0%) |
| 35 Years and over | 22 (37.3%) | 37 (62.7%) |
| Total | 1,008 (79.7%) | 257 (20.3%) |
Educational Attainment by Field of Study in Barnwell
Business (118 | 20.3%), education (114 | 19.7%), physical & health sciences (60 | 10.3%), engineering (54 | 9.3%), and literature & languages (49 | 8.5%) are the most common fields of study among 580 individuals in Barnwell who have obtained a bachelor's degree or higher.
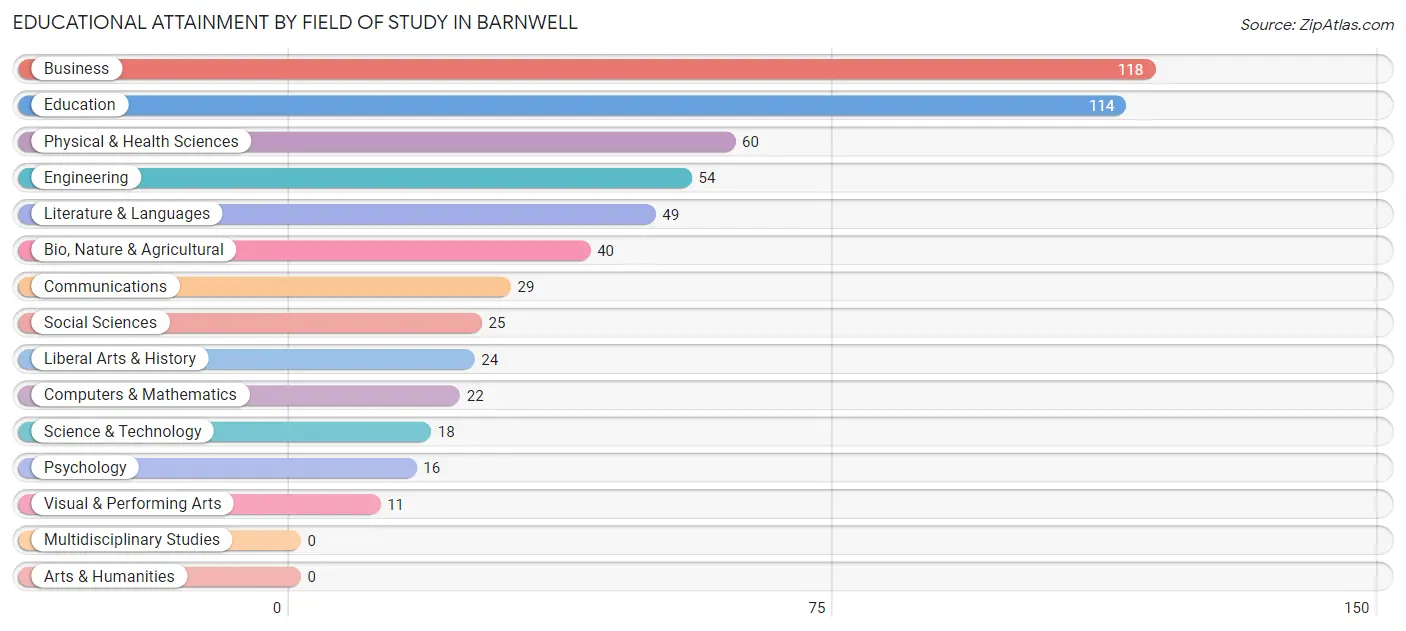
| Field of Study | # Graduates | % Graduates |
| Computers & Mathematics | 22 | 3.8% |
| Bio, Nature & Agricultural | 40 | 6.9% |
| Physical & Health Sciences | 60 | 10.3% |
| Psychology | 16 | 2.8% |
| Social Sciences | 25 | 4.3% |
| Engineering | 54 | 9.3% |
| Multidisciplinary Studies | 0 | 0.0% |
| Science & Technology | 18 | 3.1% |
| Business | 118 | 20.3% |
| Education | 114 | 19.7% |
| Literature & Languages | 49 | 8.5% |
| Liberal Arts & History | 24 | 4.1% |
| Visual & Performing Arts | 11 | 1.9% |
| Communications | 29 | 5.0% |
| Arts & Humanities | 0 | 0.0% |
| Total | 580 | 100.0% |
Transportation & Commute in Barnwell
Vehicle Availability by Sex in Barnwell
The most prevalent vehicle ownership categories in Barnwell are males with 2 vehicles (310, accounting for 39.4%) and females with 2 vehicles (358, making up 36.9%).
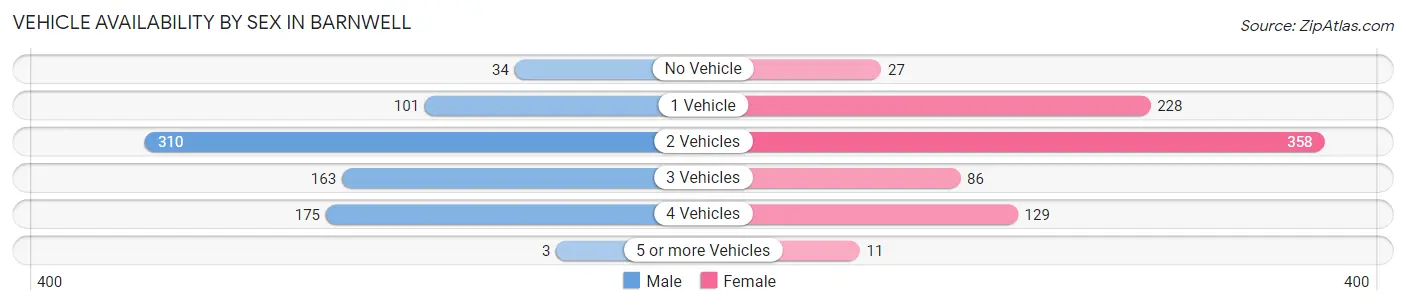
| Vehicles Available | Male | Female |
| No Vehicle | 34 (4.3%) | 27 (3.2%) |
| 1 Vehicle | 101 (12.9%) | 228 (27.2%) |
| 2 Vehicles | 310 (39.4%) | 358 (42.7%) |
| 3 Vehicles | 163 (20.7%) | 86 (10.2%) |
| 4 Vehicles | 175 (22.3%) | 129 (15.4%) |
| 5 or more Vehicles | 3 (0.4%) | 11 (1.3%) |
| Total | 786 (100.0%) | 839 (100.0%) |
Commute Time in Barnwell
The most frequently occuring commute durations in Barnwell are 5 to 9 minutes (497 commuters, 30.4%), less than 5 minutes (218 commuters, 13.3%), and 20 to 24 minutes (147 commuters, 9.0%).
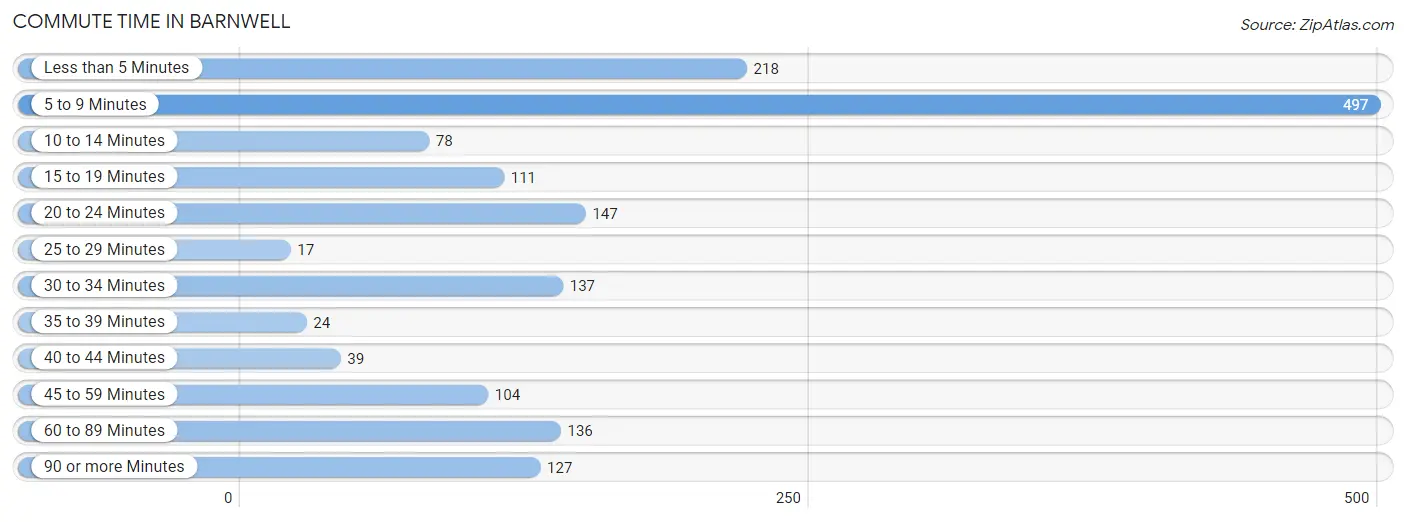
| Commute Time | # Commuters | % Commuters |
| Less than 5 Minutes | 218 | 13.3% |
| 5 to 9 Minutes | 497 | 30.4% |
| 10 to 14 Minutes | 78 | 4.8% |
| 15 to 19 Minutes | 111 | 6.8% |
| 20 to 24 Minutes | 147 | 9.0% |
| 25 to 29 Minutes | 17 | 1.0% |
| 30 to 34 Minutes | 137 | 8.4% |
| 35 to 39 Minutes | 24 | 1.5% |
| 40 to 44 Minutes | 39 | 2.4% |
| 45 to 59 Minutes | 104 | 6.4% |
| 60 to 89 Minutes | 136 | 8.3% |
| 90 or more Minutes | 127 | 7.8% |
Commute Time by Sex in Barnwell
The most common commute times in Barnwell are 5 to 9 minutes (197 commuters, 24.7%) for males and 5 to 9 minutes (300 commuters, 35.8%) for females.
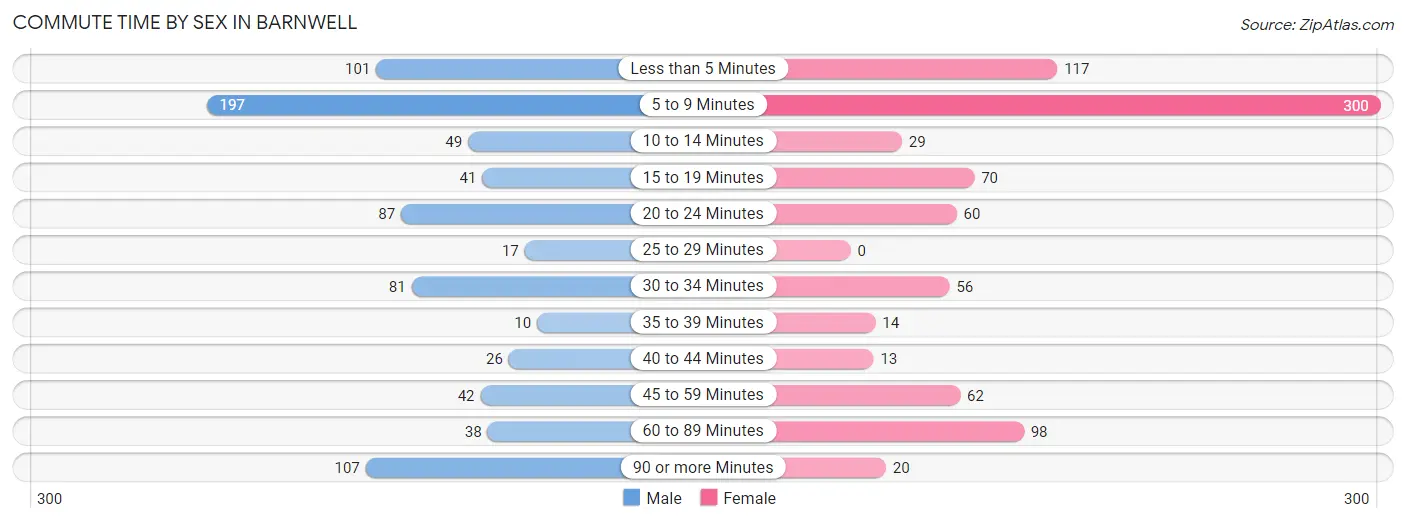
| Commute Time | Male | Female |
| Less than 5 Minutes | 101 (12.7%) | 117 (14.0%) |
| 5 to 9 Minutes | 197 (24.7%) | 300 (35.8%) |
| 10 to 14 Minutes | 49 (6.2%) | 29 (3.5%) |
| 15 to 19 Minutes | 41 (5.1%) | 70 (8.3%) |
| 20 to 24 Minutes | 87 (10.9%) | 60 (7.1%) |
| 25 to 29 Minutes | 17 (2.1%) | 0 (0.0%) |
| 30 to 34 Minutes | 81 (10.2%) | 56 (6.7%) |
| 35 to 39 Minutes | 10 (1.3%) | 14 (1.7%) |
| 40 to 44 Minutes | 26 (3.3%) | 13 (1.5%) |
| 45 to 59 Minutes | 42 (5.3%) | 62 (7.4%) |
| 60 to 89 Minutes | 38 (4.8%) | 98 (11.7%) |
| 90 or more Minutes | 107 (13.4%) | 20 (2.4%) |
Time of Departure to Work by Sex in Barnwell
The most frequent times of departure to work in Barnwell are 12:00 AM to 4:59 AM (118, 14.8%) for males and 12:00 PM to 3:59 PM (122, 14.5%) for females.
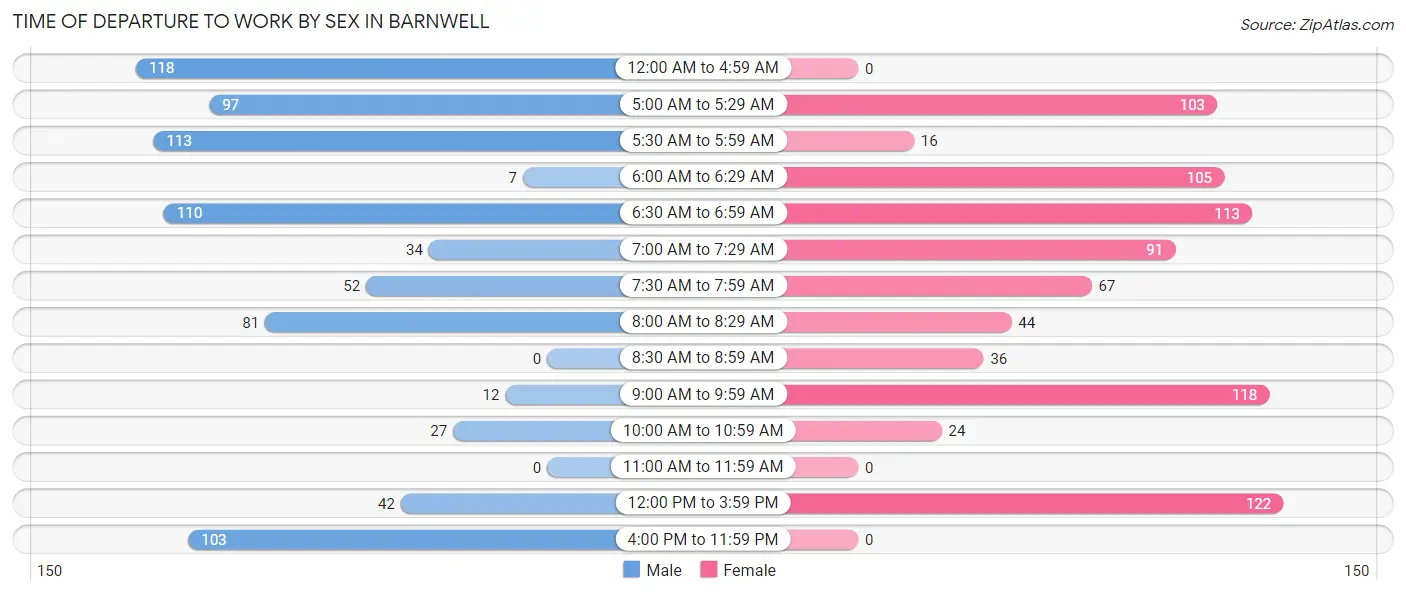
| Time of Departure | Male | Female |
| 12:00 AM to 4:59 AM | 118 (14.8%) | 0 (0.0%) |
| 5:00 AM to 5:29 AM | 97 (12.2%) | 103 (12.3%) |
| 5:30 AM to 5:59 AM | 113 (14.2%) | 16 (1.9%) |
| 6:00 AM to 6:29 AM | 7 (0.9%) | 105 (12.5%) |
| 6:30 AM to 6:59 AM | 110 (13.8%) | 113 (13.5%) |
| 7:00 AM to 7:29 AM | 34 (4.3%) | 91 (10.8%) |
| 7:30 AM to 7:59 AM | 52 (6.5%) | 67 (8.0%) |
| 8:00 AM to 8:29 AM | 81 (10.2%) | 44 (5.2%) |
| 8:30 AM to 8:59 AM | 0 (0.0%) | 36 (4.3%) |
| 9:00 AM to 9:59 AM | 12 (1.5%) | 118 (14.1%) |
| 10:00 AM to 10:59 AM | 27 (3.4%) | 24 (2.9%) |
| 11:00 AM to 11:59 AM | 0 (0.0%) | 0 (0.0%) |
| 12:00 PM to 3:59 PM | 42 (5.3%) | 122 (14.5%) |
| 4:00 PM to 11:59 PM | 103 (12.9%) | 0 (0.0%) |
| Total | 796 (100.0%) | 839 (100.0%) |
Housing Occupancy in Barnwell
Occupancy by Ownership in Barnwell
Of the total 1,845 dwellings in Barnwell, owner-occupied units account for 1,122 (60.8%), while renter-occupied units make up 723 (39.2%).
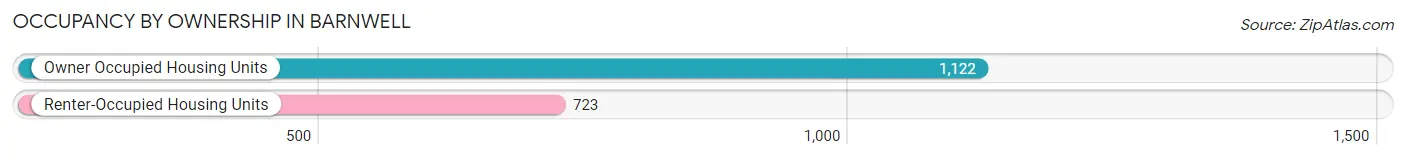
| Occupancy | # Housing Units | % Housing Units |
| Owner Occupied Housing Units | 1,122 | 60.8% |
| Renter-Occupied Housing Units | 723 | 39.2% |
| Total Occupied Housing Units | 1,845 | 100.0% |
Occupancy by Household Size in Barnwell
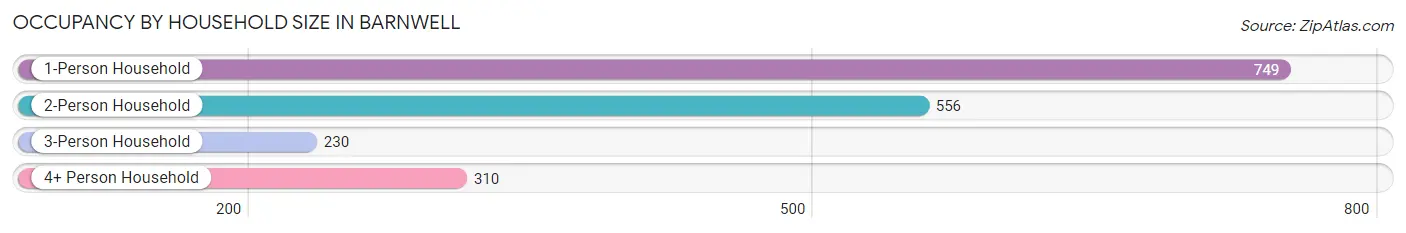
| Household Size | # Housing Units | % Housing Units |
| 1-Person Household | 749 | 40.6% |
| 2-Person Household | 556 | 30.1% |
| 3-Person Household | 230 | 12.5% |
| 4+ Person Household | 310 | 16.8% |
| Total Housing Units | 1,845 | 100.0% |
Occupancy by Ownership by Household Size in Barnwell
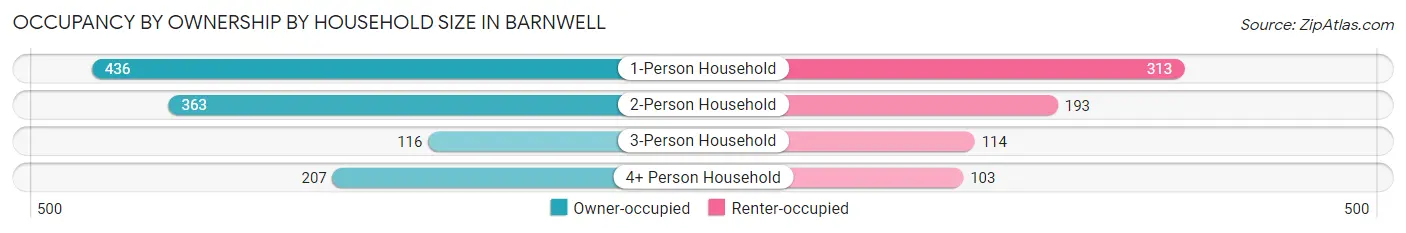
| Household Size | Owner-occupied | Renter-occupied |
| 1-Person Household | 436 (58.2%) | 313 (41.8%) |
| 2-Person Household | 363 (65.3%) | 193 (34.7%) |
| 3-Person Household | 116 (50.4%) | 114 (49.6%) |
| 4+ Person Household | 207 (66.8%) | 103 (33.2%) |
| Total Housing Units | 1,122 (60.8%) | 723 (39.2%) |
Occupancy by Educational Attainment in Barnwell
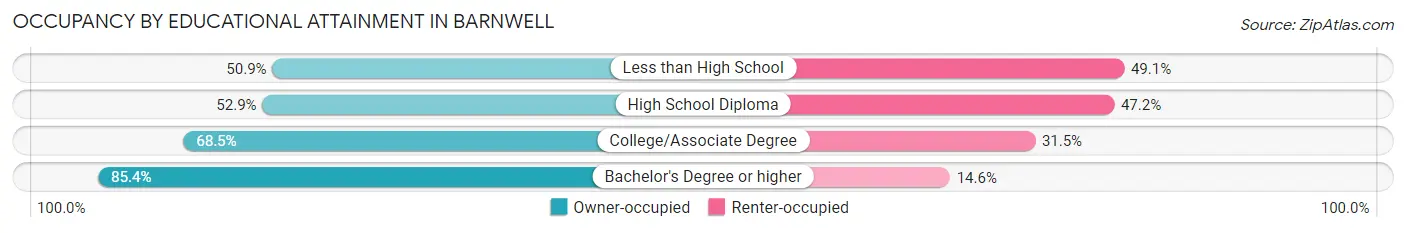
| Household Size | Owner-occupied | Renter-occupied |
| Less than High School | 205 (50.9%) | 198 (49.1%) |
| High School Diploma | 427 (52.8%) | 381 (47.1%) |
| College/Associate Degree | 209 (68.5%) | 96 (31.5%) |
| Bachelor's Degree or higher | 281 (85.4%) | 48 (14.6%) |
Occupancy by Age of Householder in Barnwell
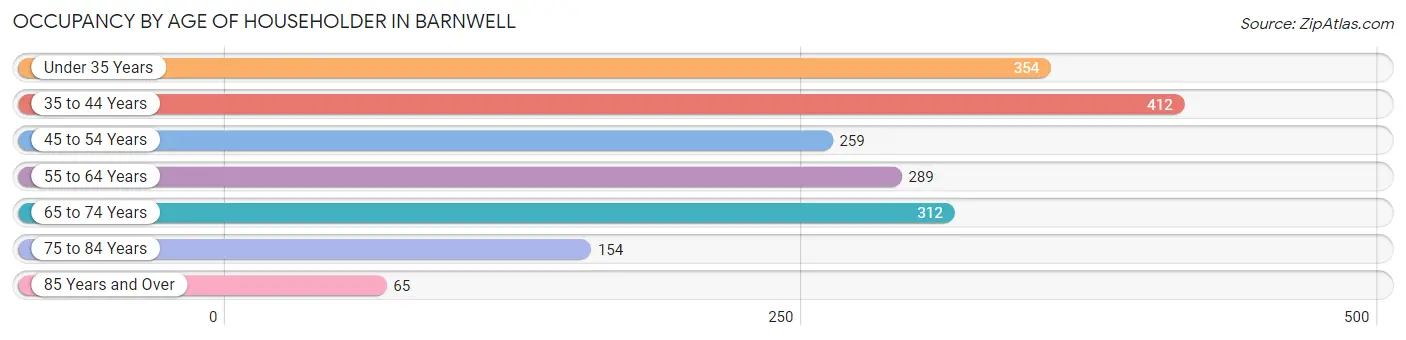
| Age Bracket | # Households | % Households |
| Under 35 Years | 354 | 19.2% |
| 35 to 44 Years | 412 | 22.3% |
| 45 to 54 Years | 259 | 14.0% |
| 55 to 64 Years | 289 | 15.7% |
| 65 to 74 Years | 312 | 16.9% |
| 75 to 84 Years | 154 | 8.4% |
| 85 Years and Over | 65 | 3.5% |
| Total | 1,845 | 100.0% |
Housing Finances in Barnwell
Median Income by Occupancy in Barnwell
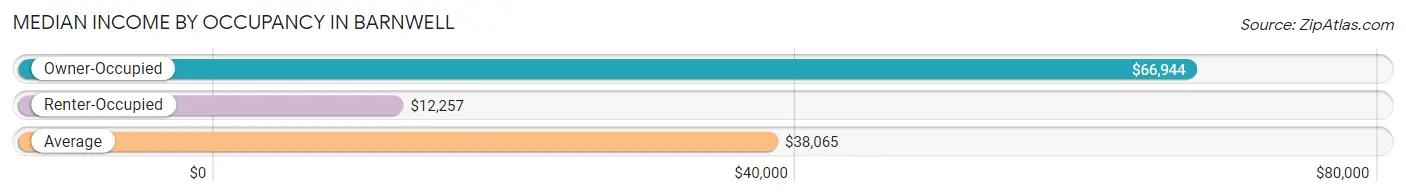
| Occupancy Type | # Households | Median Income |
| Owner-Occupied | 1,122 (60.8%) | $66,944 |
| Renter-Occupied | 723 (39.2%) | $12,257 |
| Average | 1,845 (100.0%) | $38,065 |
Occupancy by Householder Income Bracket in Barnwell
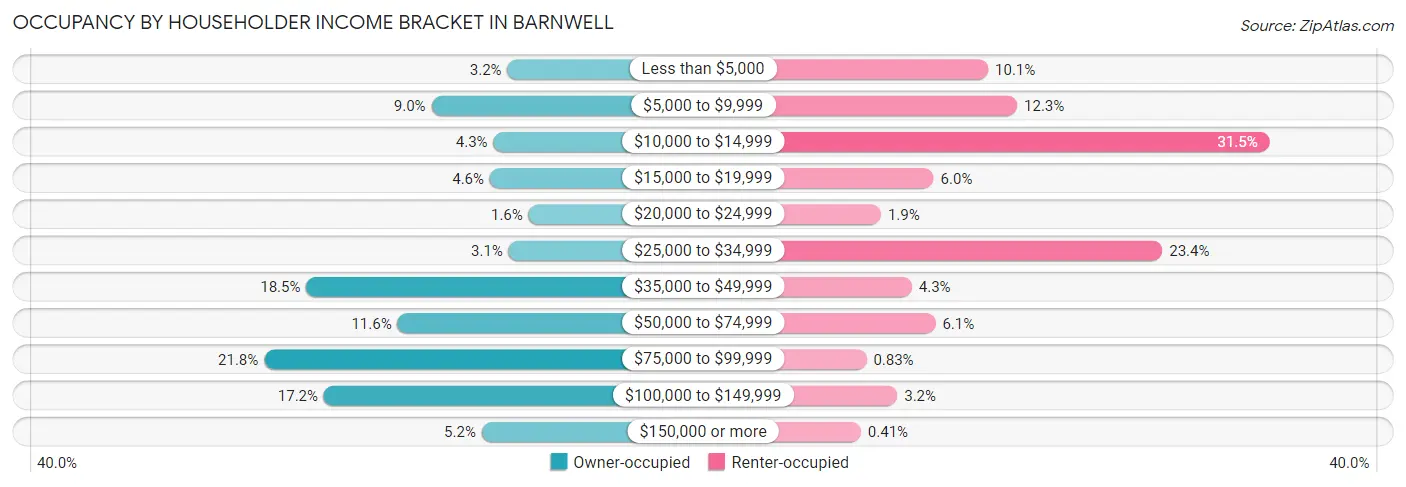
| Income Bracket | Owner-occupied | Renter-occupied |
| Less than $5,000 | 36 (3.2%) | 73 (10.1%) |
| $5,000 to $9,999 | 101 (9.0%) | 89 (12.3%) |
| $10,000 to $14,999 | 48 (4.3%) | 228 (31.5%) |
| $15,000 to $19,999 | 51 (4.5%) | 43 (5.9%) |
| $20,000 to $24,999 | 18 (1.6%) | 14 (1.9%) |
| $25,000 to $34,999 | 35 (3.1%) | 169 (23.4%) |
| $35,000 to $49,999 | 208 (18.5%) | 31 (4.3%) |
| $50,000 to $74,999 | 130 (11.6%) | 44 (6.1%) |
| $75,000 to $99,999 | 244 (21.7%) | 6 (0.8%) |
| $100,000 to $149,999 | 193 (17.2%) | 23 (3.2%) |
| $150,000 or more | 58 (5.2%) | 3 (0.4%) |
| Total | 1,122 (100.0%) | 723 (100.0%) |
Monthly Housing Cost Tiers in Barnwell
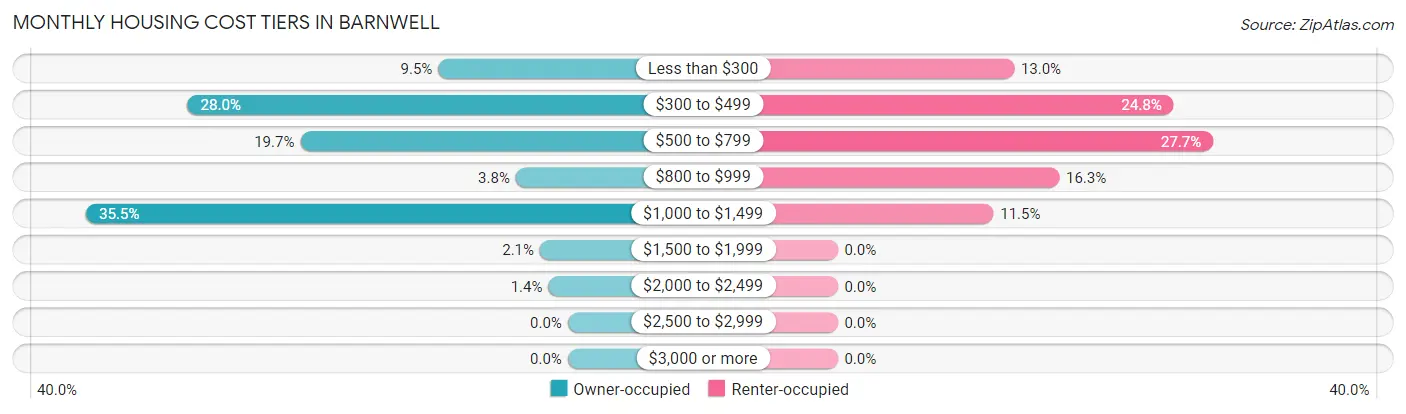
| Monthly Cost | Owner-occupied | Renter-occupied |
| Less than $300 | 107 (9.5%) | 94 (13.0%) |
| $300 to $499 | 314 (28.0%) | 179 (24.8%) |
| $500 to $799 | 221 (19.7%) | 200 (27.7%) |
| $800 to $999 | 43 (3.8%) | 118 (16.3%) |
| $1,000 to $1,499 | 398 (35.5%) | 83 (11.5%) |
| $1,500 to $1,999 | 23 (2.1%) | 0 (0.0%) |
| $2,000 to $2,499 | 16 (1.4%) | 0 (0.0%) |
| $2,500 to $2,999 | 0 (0.0%) | 0 (0.0%) |
| $3,000 or more | 0 (0.0%) | 0 (0.0%) |
| Total | 1,122 (100.0%) | 723 (100.0%) |
Physical Housing Characteristics in Barnwell
Housing Structures in Barnwell
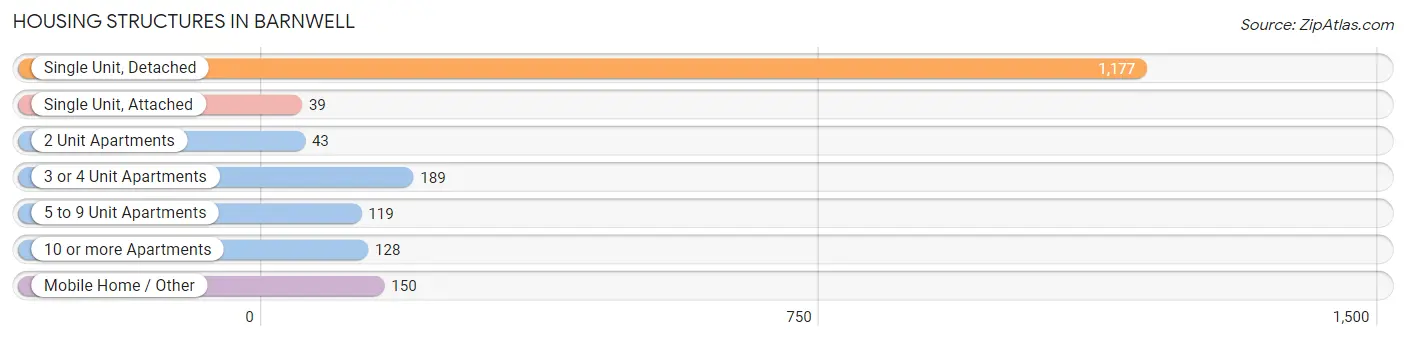
| Structure Type | # Housing Units | % Housing Units |
| Single Unit, Detached | 1,177 | 63.8% |
| Single Unit, Attached | 39 | 2.1% |
| 2 Unit Apartments | 43 | 2.3% |
| 3 or 4 Unit Apartments | 189 | 10.2% |
| 5 to 9 Unit Apartments | 119 | 6.5% |
| 10 or more Apartments | 128 | 6.9% |
| Mobile Home / Other | 150 | 8.1% |
| Total | 1,845 | 100.0% |
Housing Structures by Occupancy in Barnwell
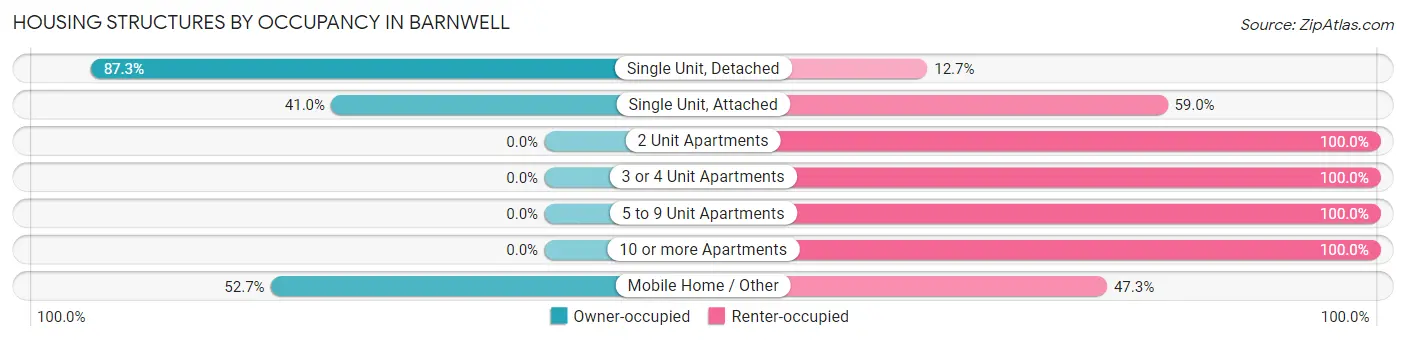
| Structure Type | Owner-occupied | Renter-occupied |
| Single Unit, Detached | 1,027 (87.3%) | 150 (12.7%) |
| Single Unit, Attached | 16 (41.0%) | 23 (59.0%) |
| 2 Unit Apartments | 0 (0.0%) | 43 (100.0%) |
| 3 or 4 Unit Apartments | 0 (0.0%) | 189 (100.0%) |
| 5 to 9 Unit Apartments | 0 (0.0%) | 119 (100.0%) |
| 10 or more Apartments | 0 (0.0%) | 128 (100.0%) |
| Mobile Home / Other | 79 (52.7%) | 71 (47.3%) |
| Total | 1,122 (60.8%) | 723 (39.2%) |
Housing Structures by Number of Rooms in Barnwell
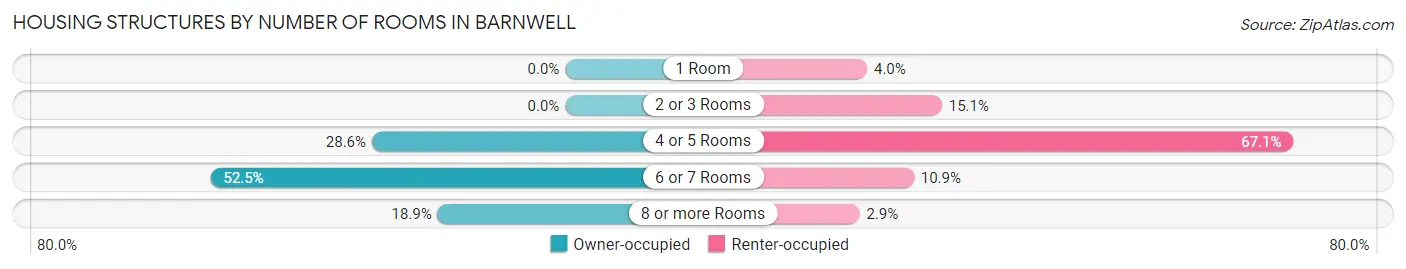
| Number of Rooms | Owner-occupied | Renter-occupied |
| 1 Room | 0 (0.0%) | 29 (4.0%) |
| 2 or 3 Rooms | 0 (0.0%) | 109 (15.1%) |
| 4 or 5 Rooms | 321 (28.6%) | 485 (67.1%) |
| 6 or 7 Rooms | 589 (52.5%) | 79 (10.9%) |
| 8 or more Rooms | 212 (18.9%) | 21 (2.9%) |
| Total | 1,122 (100.0%) | 723 (100.0%) |
Housing Structure by Heating Type in Barnwell
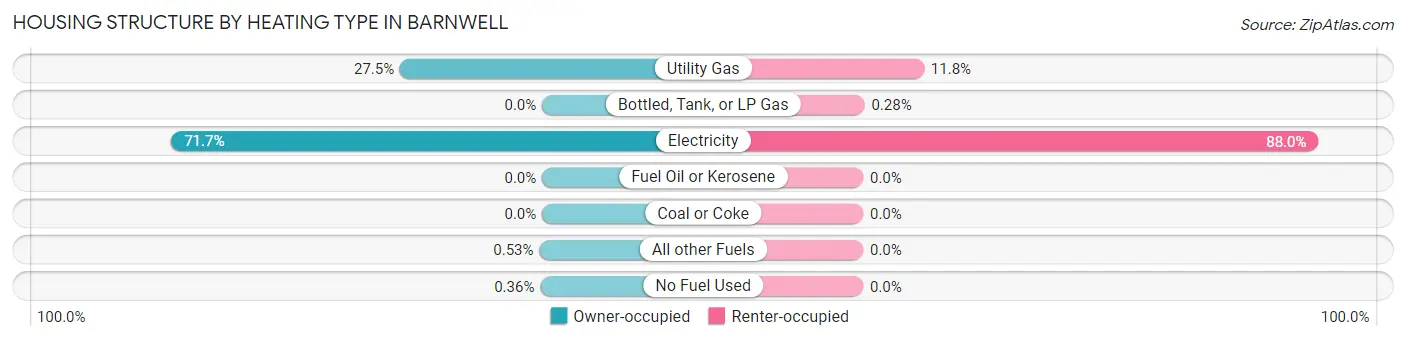
| Heating Type | Owner-occupied | Renter-occupied |
| Utility Gas | 308 (27.5%) | 85 (11.8%) |
| Bottled, Tank, or LP Gas | 0 (0.0%) | 2 (0.3%) |
| Electricity | 804 (71.7%) | 636 (88.0%) |
| Fuel Oil or Kerosene | 0 (0.0%) | 0 (0.0%) |
| Coal or Coke | 0 (0.0%) | 0 (0.0%) |
| All other Fuels | 6 (0.5%) | 0 (0.0%) |
| No Fuel Used | 4 (0.4%) | 0 (0.0%) |
| Total | 1,122 (100.0%) | 723 (100.0%) |
Household Vehicle Usage in Barnwell
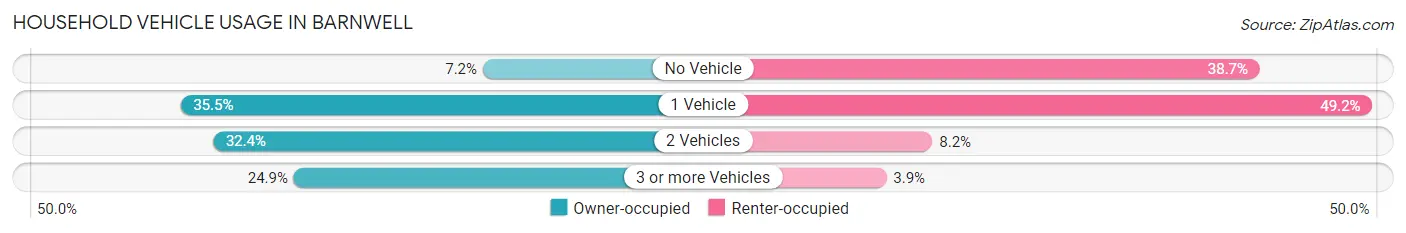
| Vehicles per Household | Owner-occupied | Renter-occupied |
| No Vehicle | 81 (7.2%) | 280 (38.7%) |
| 1 Vehicle | 398 (35.5%) | 356 (49.2%) |
| 2 Vehicles | 364 (32.4%) | 59 (8.2%) |
| 3 or more Vehicles | 279 (24.9%) | 28 (3.9%) |
| Total | 1,122 (100.0%) | 723 (100.0%) |
Real Estate & Mortgages in Barnwell
Real Estate and Mortgage Overview in Barnwell
| Characteristic | Without Mortgage | With Mortgage |
| Housing Units | 634 | 488 |
| Median Property Value | $122,500 | $110,900 |
| Median Household Income | $58,750 | $23 |
| Monthly Housing Costs | $380 | $0 |
| Real Estate Taxes | $694 | $48 |
Property Value by Mortgage Status in Barnwell
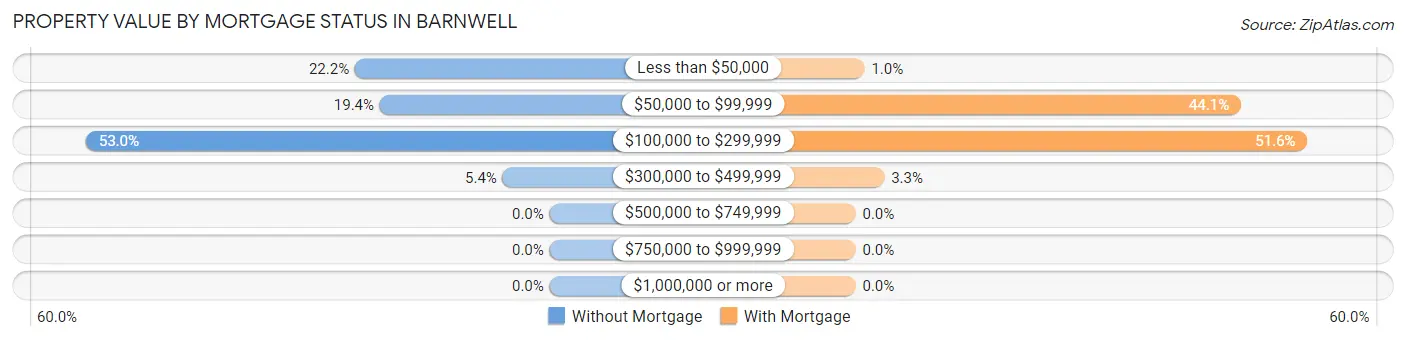
| Property Value | Without Mortgage | With Mortgage |
| Less than $50,000 | 141 (22.2%) | 5 (1.0%) |
| $50,000 to $99,999 | 123 (19.4%) | 215 (44.1%) |
| $100,000 to $299,999 | 336 (53.0%) | 252 (51.6%) |
| $300,000 to $499,999 | 34 (5.4%) | 16 (3.3%) |
| $500,000 to $749,999 | 0 (0.0%) | 0 (0.0%) |
| $750,000 to $999,999 | 0 (0.0%) | 0 (0.0%) |
| $1,000,000 or more | 0 (0.0%) | 0 (0.0%) |
| Total | 634 (100.0%) | 488 (100.0%) |
Household Income by Mortgage Status in Barnwell
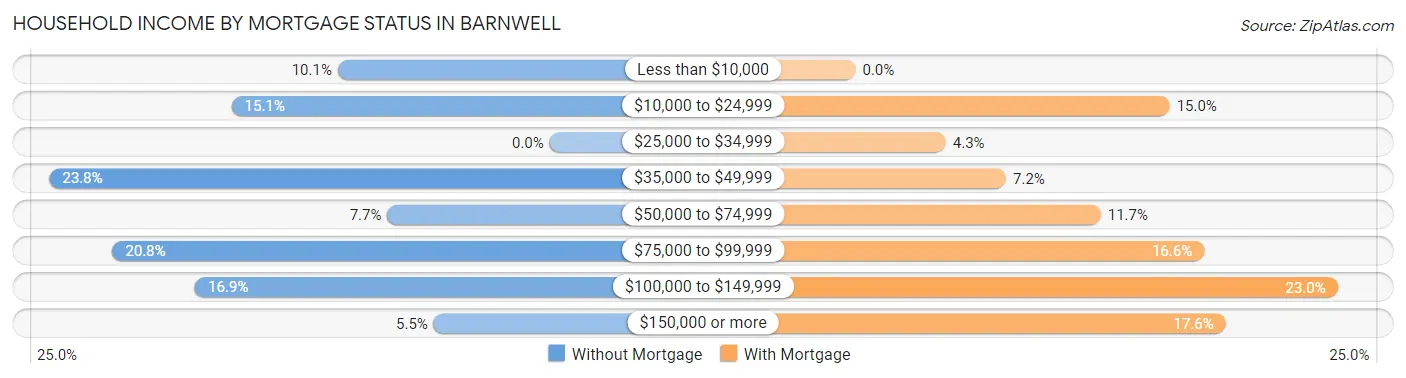
| Household Income | Without Mortgage | With Mortgage |
| Less than $10,000 | 64 (10.1%) | 0 (0.0%) |
| $10,000 to $24,999 | 96 (15.1%) | 73 (15.0%) |
| $25,000 to $34,999 | 0 (0.0%) | 21 (4.3%) |
| $35,000 to $49,999 | 151 (23.8%) | 35 (7.2%) |
| $50,000 to $74,999 | 49 (7.7%) | 57 (11.7%) |
| $75,000 to $99,999 | 132 (20.8%) | 81 (16.6%) |
| $100,000 to $149,999 | 107 (16.9%) | 112 (23.0%) |
| $150,000 or more | 35 (5.5%) | 86 (17.6%) |
| Total | 634 (100.0%) | 488 (100.0%) |
Property Value to Household Income Ratio in Barnwell
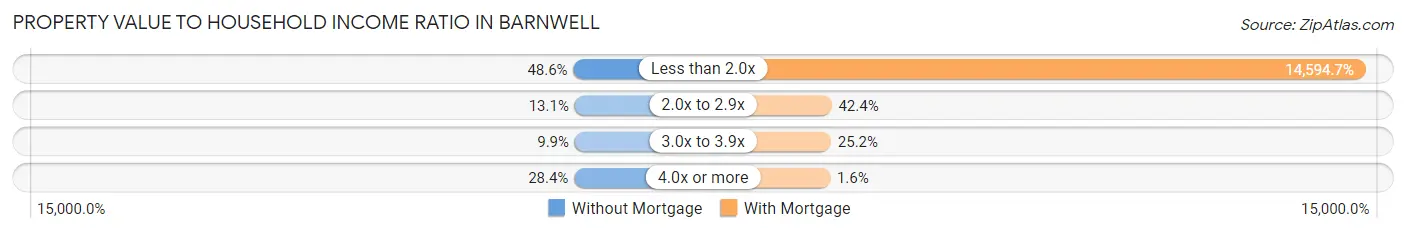
| Value-to-Income Ratio | Without Mortgage | With Mortgage |
| Less than 2.0x | 308 (48.6%) | 71,222 (14,594.7%) |
| 2.0x to 2.9x | 83 (13.1%) | 207 (42.4%) |
| 3.0x to 3.9x | 63 (9.9%) | 123 (25.2%) |
| 4.0x or more | 180 (28.4%) | 8 (1.6%) |
| Total | 634 (100.0%) | 488 (100.0%) |
Real Estate Taxes by Mortgage Status in Barnwell
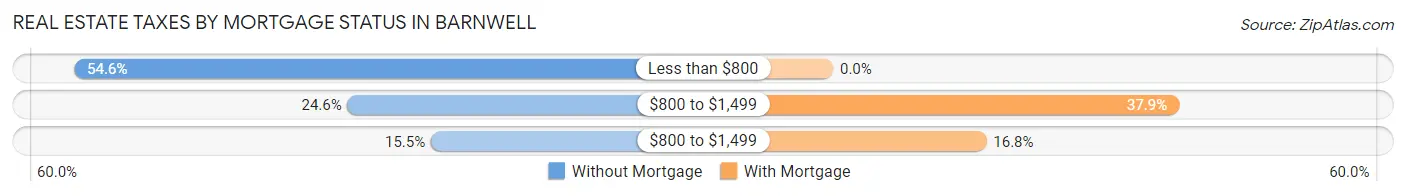
| Property Taxes | Without Mortgage | With Mortgage |
| Less than $800 | 346 (54.6%) | 0 (0.0%) |
| $800 to $1,499 | 156 (24.6%) | 185 (37.9%) |
| $800 to $1,499 | 98 (15.5%) | 82 (16.8%) |
| Total | 634 (100.0%) | 488 (100.0%) |
Health & Disability in Barnwell
Health Insurance Coverage by Age in Barnwell
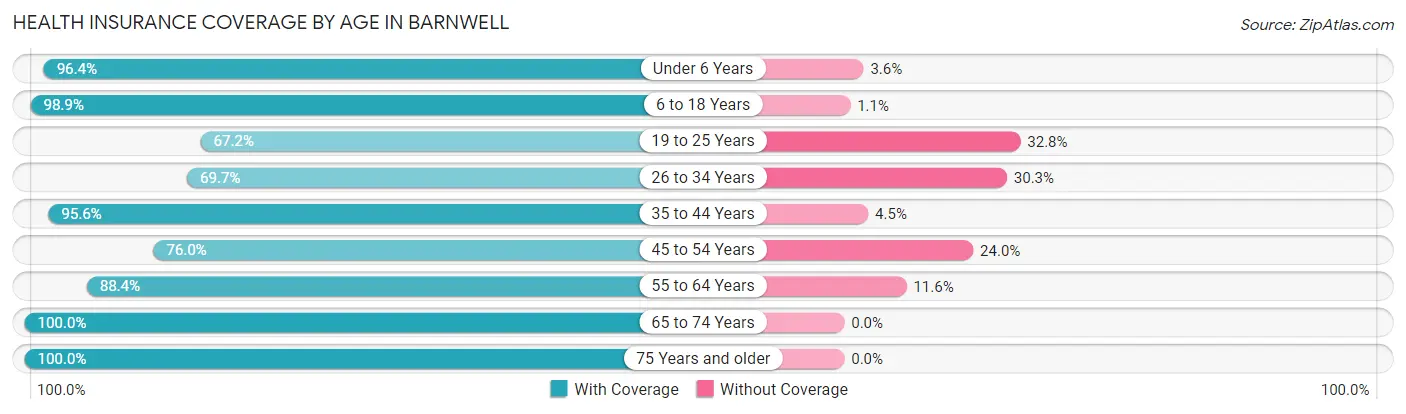
| Age Bracket | With Coverage | Without Coverage |
| Under 6 Years | 297 (96.4%) | 11 (3.6%) |
| 6 to 18 Years | 1,155 (98.9%) | 13 (1.1%) |
| 19 to 25 Years | 356 (67.2%) | 174 (32.8%) |
| 26 to 34 Years | 285 (69.7%) | 124 (30.3%) |
| 35 to 44 Years | 451 (95.6%) | 21 (4.4%) |
| 45 to 54 Years | 354 (76.0%) | 112 (24.0%) |
| 55 to 64 Years | 358 (88.4%) | 47 (11.6%) |
| 65 to 74 Years | 386 (100.0%) | 0 (0.0%) |
| 75 Years and older | 311 (100.0%) | 0 (0.0%) |
| Total | 3,953 (88.7%) | 502 (11.3%) |
Health Insurance Coverage by Citizenship Status in Barnwell
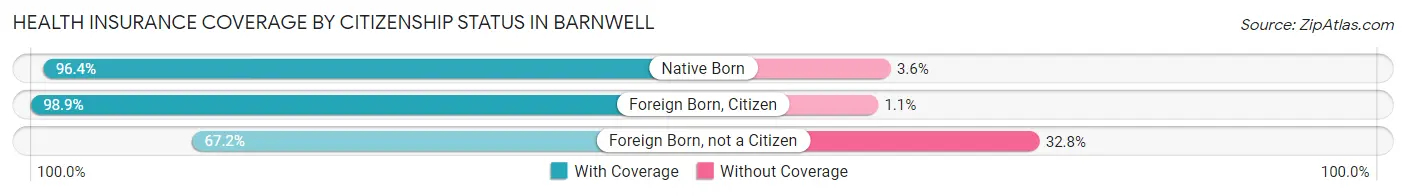
| Citizenship Status | With Coverage | Without Coverage |
| Native Born | 297 (96.4%) | 11 (3.6%) |
| Foreign Born, Citizen | 1,155 (98.9%) | 13 (1.1%) |
| Foreign Born, not a Citizen | 356 (67.2%) | 174 (32.8%) |
Health Insurance Coverage by Household Income in Barnwell
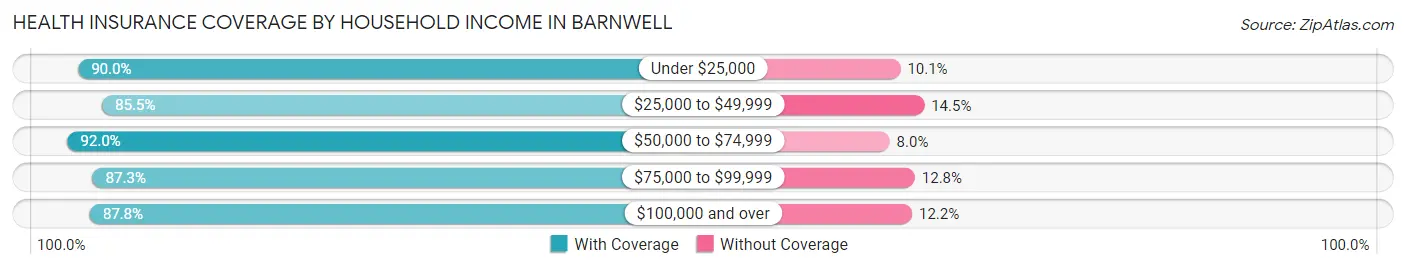
| Household Income | With Coverage | Without Coverage |
| Under $25,000 | 1,262 (89.9%) | 141 (10.1%) |
| $25,000 to $49,999 | 595 (85.5%) | 101 (14.5%) |
| $50,000 to $74,999 | 607 (92.0%) | 53 (8.0%) |
| $75,000 to $99,999 | 527 (87.3%) | 77 (12.8%) |
| $100,000 and over | 934 (87.8%) | 130 (12.2%) |
Public vs Private Health Insurance Coverage by Age in Barnwell
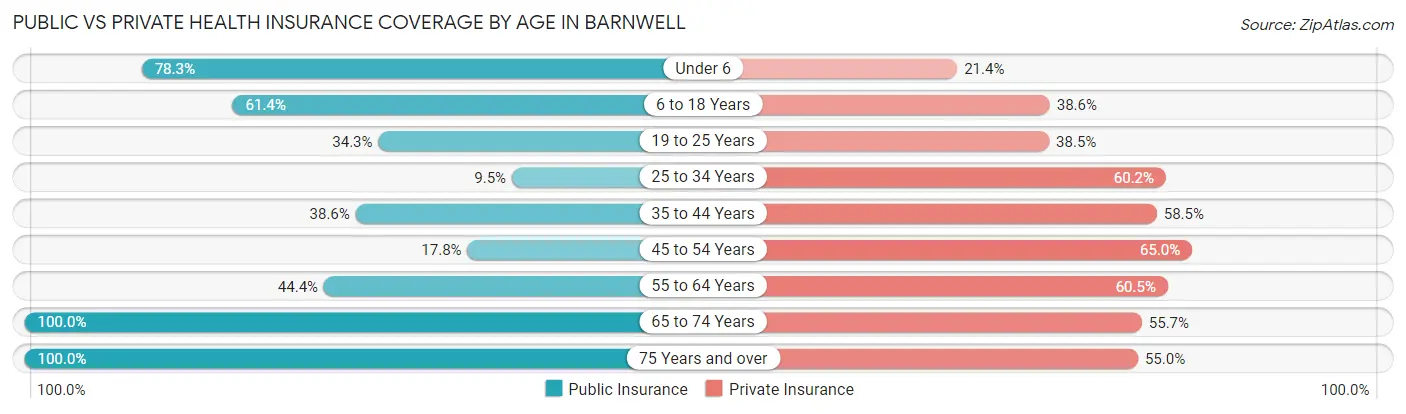
| Age Bracket | Public Insurance | Private Insurance |
| Under 6 | 241 (78.2%) | 66 (21.4%) |
| 6 to 18 Years | 717 (61.4%) | 451 (38.6%) |
| 19 to 25 Years | 182 (34.3%) | 204 (38.5%) |
| 25 to 34 Years | 39 (9.5%) | 246 (60.2%) |
| 35 to 44 Years | 182 (38.6%) | 276 (58.5%) |
| 45 to 54 Years | 83 (17.8%) | 303 (65.0%) |
| 55 to 64 Years | 180 (44.4%) | 245 (60.5%) |
| 65 to 74 Years | 386 (100.0%) | 215 (55.7%) |
| 75 Years and over | 311 (100.0%) | 171 (55.0%) |
| Total | 2,321 (52.1%) | 2,177 (48.9%) |
Disability Status by Sex by Age in Barnwell
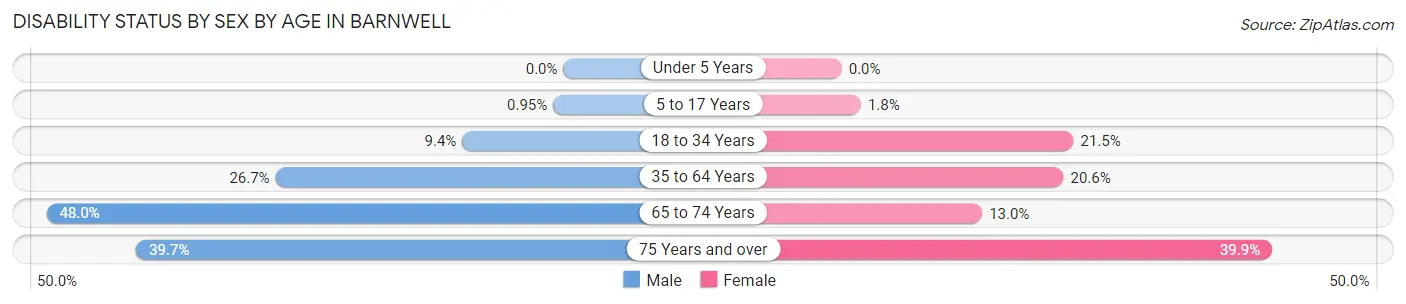
| Age Bracket | Male | Female |
| Under 5 Years | 0 (0.0%) | 0 (0.0%) |
| 5 to 17 Years | 4 (0.9%) | 10 (1.8%) |
| 18 to 34 Years | 55 (9.4%) | 128 (21.5%) |
| 35 to 64 Years | 155 (26.7%) | 157 (20.6%) |
| 65 to 74 Years | 71 (48.0%) | 31 (13.0%) |
| 75 Years and over | 23 (39.7%) | 101 (39.9%) |
Disability Class by Sex by Age in Barnwell
Disability Class: Hearing Difficulty
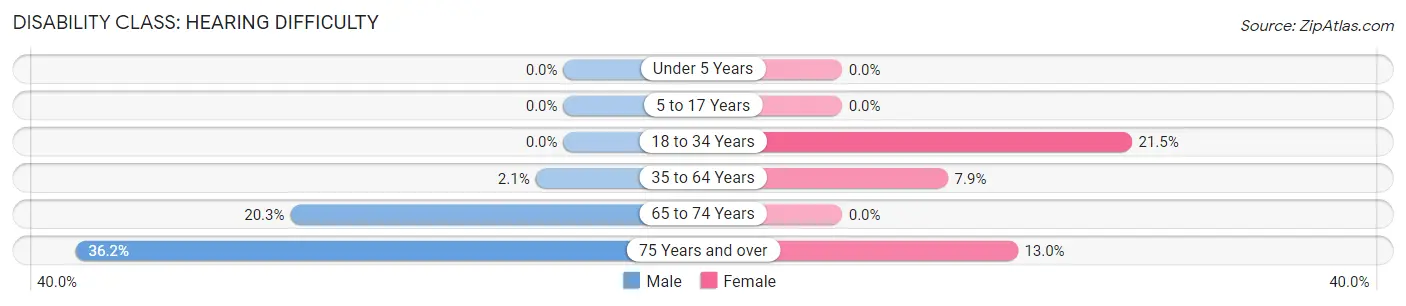
| Age Bracket | Male | Female |
| Under 5 Years | 0 (0.0%) | 0 (0.0%) |
| 5 to 17 Years | 0 (0.0%) | 0 (0.0%) |
| 18 to 34 Years | 0 (0.0%) | 128 (21.5%) |
| 35 to 64 Years | 12 (2.1%) | 60 (7.9%) |
| 65 to 74 Years | 30 (20.3%) | 0 (0.0%) |
| 75 Years and over | 21 (36.2%) | 33 (13.0%) |
Disability Class: Vision Difficulty
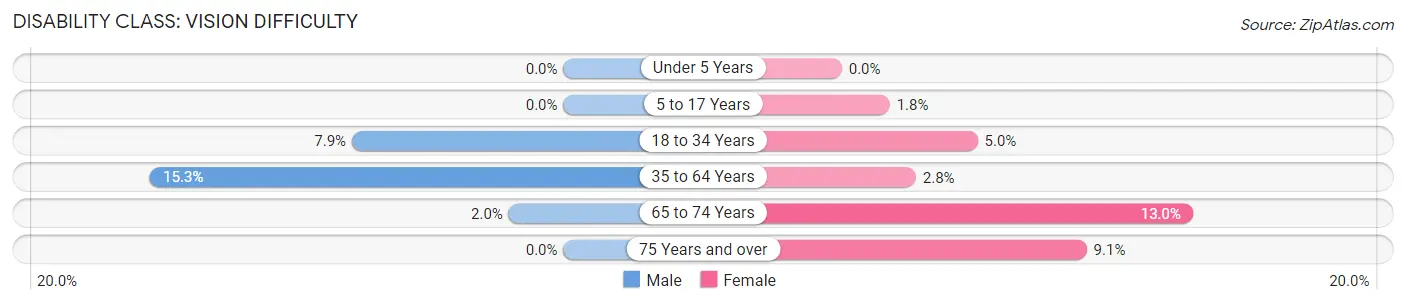
| Age Bracket | Male | Female |
| Under 5 Years | 0 (0.0%) | 0 (0.0%) |
| 5 to 17 Years | 0 (0.0%) | 10 (1.8%) |
| 18 to 34 Years | 46 (7.9%) | 30 (5.0%) |
| 35 to 64 Years | 89 (15.3%) | 21 (2.8%) |
| 65 to 74 Years | 3 (2.0%) | 31 (13.0%) |
| 75 Years and over | 0 (0.0%) | 23 (9.1%) |
Disability Class: Cognitive Difficulty
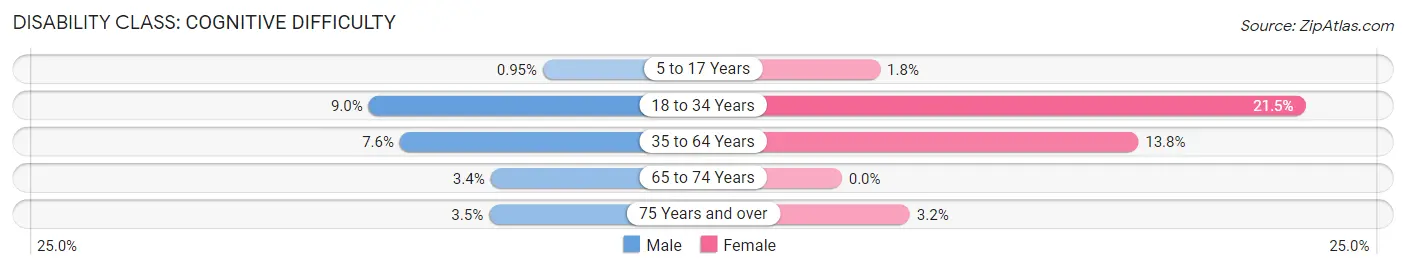
| Age Bracket | Male | Female |
| 5 to 17 Years | 4 (0.9%) | 10 (1.8%) |
| 18 to 34 Years | 53 (9.0%) | 128 (21.5%) |
| 35 to 64 Years | 44 (7.6%) | 105 (13.8%) |
| 65 to 74 Years | 5 (3.4%) | 0 (0.0%) |
| 75 Years and over | 2 (3.5%) | 8 (3.2%) |
Disability Class: Ambulatory Difficulty
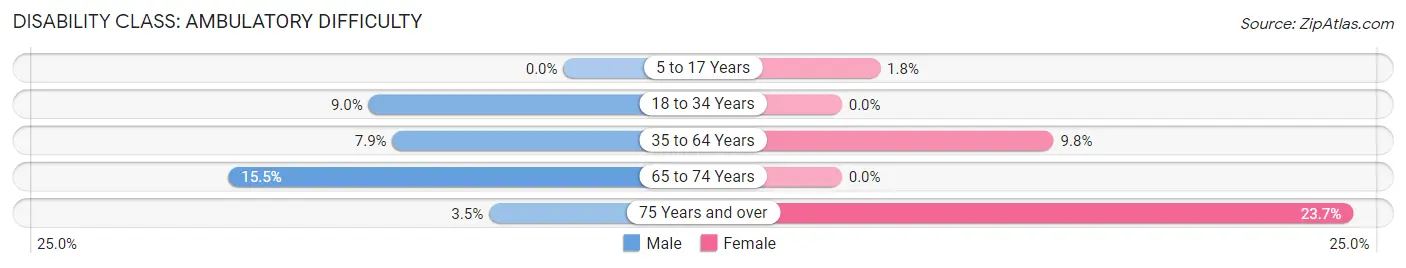
| Age Bracket | Male | Female |
| 5 to 17 Years | 0 (0.0%) | 10 (1.8%) |
| 18 to 34 Years | 53 (9.0%) | 0 (0.0%) |
| 35 to 64 Years | 46 (7.9%) | 75 (9.8%) |
| 65 to 74 Years | 23 (15.5%) | 0 (0.0%) |
| 75 Years and over | 2 (3.5%) | 60 (23.7%) |
Disability Class: Self-Care Difficulty
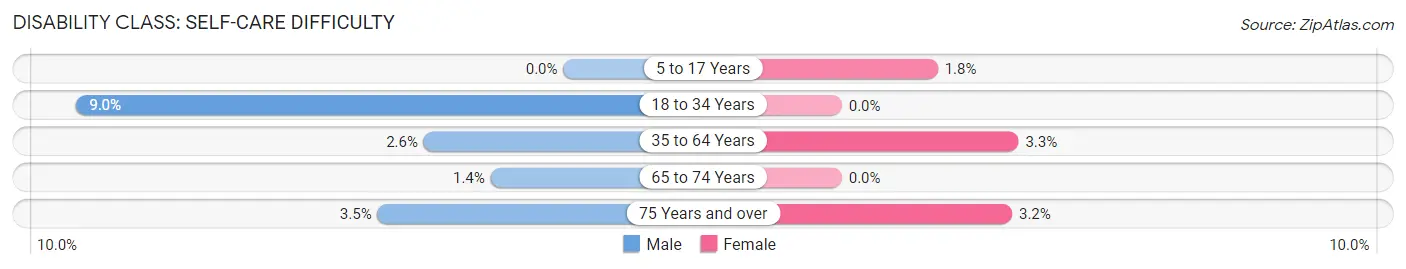
| Age Bracket | Male | Female |
| 5 to 17 Years | 0 (0.0%) | 10 (1.8%) |
| 18 to 34 Years | 53 (9.0%) | 0 (0.0%) |
| 35 to 64 Years | 15 (2.6%) | 25 (3.3%) |
| 65 to 74 Years | 2 (1.3%) | 0 (0.0%) |
| 75 Years and over | 2 (3.5%) | 8 (3.2%) |
Technology Access in Barnwell
Computing Device Access in Barnwell
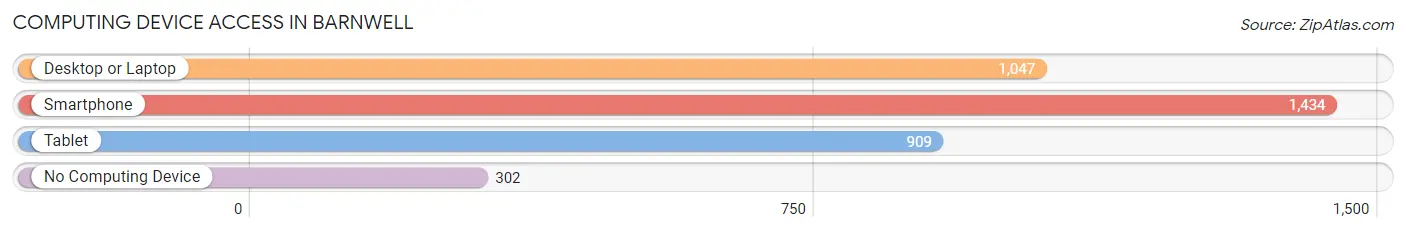
| Device Type | # Households | % Households |
| Desktop or Laptop | 1,047 | 56.8% |
| Smartphone | 1,434 | 77.7% |
| Tablet | 909 | 49.3% |
| No Computing Device | 302 | 16.4% |
| Total | 1,845 | 100.0% |
Internet Access in Barnwell
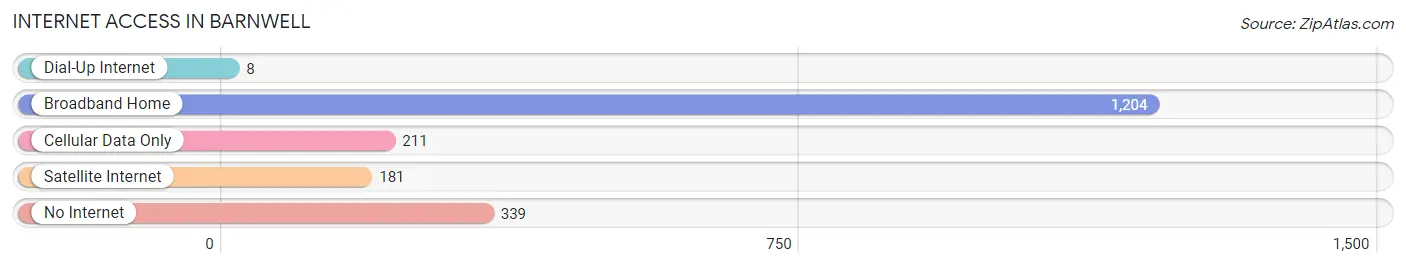
| Internet Type | # Households | % Households |
| Dial-Up Internet | 8 | 0.4% |
| Broadband Home | 1,204 | 65.3% |
| Cellular Data Only | 211 | 11.4% |
| Satellite Internet | 181 | 9.8% |
| No Internet | 339 | 18.4% |
| Total | 1,845 | 100.0% |
Barnwell Summary
History
The town of Barnwell, South Carolina is located in the heart of the state’s Lowcountry region. It is the county seat of Barnwell County, which was established in 1785. The town was founded in 1785 and named after John Barnwell, a Revolutionary War hero. The town was originally known as “Barnwell Court House” and was the site of the first court house in the county.
The town was an important trading center in the early 19th century, and it was the site of the first cotton gin in the state. The town was also the site of the first railroad in the state, which was built in 1833. The railroad connected Barnwell to Charleston and Columbia, and it was a major factor in the town’s growth.
The town was also an important center of education in the 19th century. The Barnwell Academy was founded in 1819 and was the first school in the county. The school was later renamed the Barnwell Institute and was the first public school in the county.
The town was also an important center of industry in the 19th century. The Barnwell Manufacturing Company was founded in 1845 and was the first cotton mill in the state. The mill was a major employer in the town and helped to spur the town’s growth.
The town was also an important center of culture in the 19th century. The Barnwell Opera House was built in 1883 and was the first opera house in the state. The opera house was a major cultural center in the town and hosted many famous performers.
Geography
Barnwell is located in the heart of the Lowcountry region of South Carolina. The town is situated on the Savannah River, which forms the border between South Carolina and Georgia. The town is located about 40 miles northwest of Charleston and about 60 miles southeast of Columbia.
The town is located in a flat, low-lying area and is surrounded by pine forests and swamps. The town is located in a humid subtropical climate zone and has hot, humid summers and mild winters. The average annual temperature is around 70 degrees Fahrenheit.
Economy
The economy of Barnwell is largely based on agriculture and manufacturing. The town is home to several large farms, which produce cotton, soybeans, corn, and other crops. The town is also home to several manufacturing companies, which produce textiles, furniture, and other products.
The town is also home to several retail stores, restaurants, and other businesses. The town is also home to several medical facilities, including a hospital and several clinics.
Demographics
As of the 2010 census, the population of Barnwell was 4,750. The population is largely white (77.3%) and African American (20.2%). The median household income is $31,250 and the median home value is $90,000. The town has a poverty rate of 22.3%.
The town is served by the Barnwell County School District, which includes four elementary schools, one middle school, and one high school. The town is also home to several private schools, including the Barnwell Academy and the Barnwell Institute.
Common Questions
What is Per Capita Income in Barnwell?
Per Capita income in Barnwell is $22,803.
What is the Median Family Income in Barnwell?
Median Family Income in Barnwell is $69,904.
What is the Median Household income in Barnwell?
Median Household Income in Barnwell is $38,065.
What is Income or Wage Gap in Barnwell?
Income or Wage Gap in Barnwell is 59.0%.
Women in Barnwell earn 41.0 cents for every dollar earned by a man.
What is Inequality or Gini Index in Barnwell?
Inequality or Gini Index in Barnwell is 0.51.
What is the Total Population of Barnwell?
Total Population of Barnwell is 4,643.
What is the Total Male Population of Barnwell?
Total Male Population of Barnwell is 2,113.
What is the Total Female Population of Barnwell?
Total Female Population of Barnwell is 2,530.
What is the Ratio of Males per 100 Females in Barnwell?
There are 83.52 Males per 100 Females in Barnwell.
What is the Ratio of Females per 100 Males in Barnwell?
There are 119.73 Females per 100 Males in Barnwell.
What is the Median Population Age in Barnwell?
Median Population Age in Barnwell is 32.5 Years.
What is the Average Family Size in Barnwell
Average Family Size in Barnwell is 3.3 People.
What is the Average Household Size in Barnwell
Average Household Size in Barnwell is 2.4 People.
How Large is the Labor Force in Barnwell?
There are 1,917 People in the Labor Forcein in Barnwell.
What is the Percentage of People in the Labor Force in Barnwell?
53.3% of People are in the Labor Force in Barnwell.
What is the Unemployment Rate in Barnwell?
Unemployment Rate in Barnwell is 12.4%.