Socastee, SC Map & Demographics
Socastee Map
Socastee Overview
$29,909
PER CAPITA INCOME
$61,875
AVG FAMILY INCOME
$54,405
AVG HOUSEHOLD INCOME
20.7%
WAGE / INCOME GAP [ % ]
79.3¢/ $1
WAGE / INCOME GAP [ $ ]
$10,589
FAMILY INCOME DEFICIT
0.42
INEQUALITY / GINI INDEX
24,464
TOTAL POPULATION
12,085
MALE POPULATION
12,379
FEMALE POPULATION
97.63
MALES / 100 FEMALES
102.43
FEMALES / 100 MALES
42.6
MEDIAN AGE
3.2
AVG FAMILY SIZE
2.8
AVG HOUSEHOLD SIZE
11,938
LABOR FORCE [ PEOPLE ]
59.2%
PERCENT IN LABOR FORCE
5.5%
UNEMPLOYMENT RATE
Income in Socastee
Income Overview in Socastee
Per Capita Income in Socastee is $29,909, while median incomes of families and households are $61,875 and $54,405 respectively.
| Characteristic | Number | Measure |
| Per Capita Income | 24,464 | $29,909 |
| Median Family Income | 5,664 | $61,875 |
| Mean Family Income | 5,664 | $83,467 |
| Median Household Income | 8,818 | $54,405 |
| Mean Household Income | 8,818 | $73,362 |
| Income Deficit | 5,664 | $10,589 |
| Wage / Income Gap (%) | 24,464 | 20.72% |
| Wage / Income Gap ($) | 24,464 | 79.28¢ per $1 |
| Gini / Inequality Index | 24,464 | 0.42 |
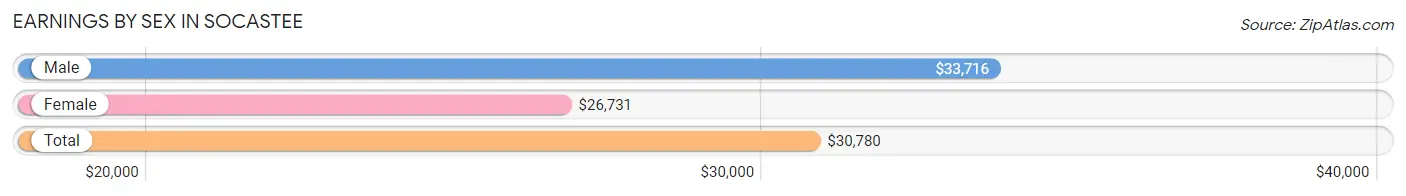
Earnings by Sex in Socastee
Average Earnings in Socastee are $30,780, $33,716 for men and $26,731 for women, a difference of 20.7%.
| Sex | Number | Average Earnings |
| Male | 6,755 (55.9%) | $33,716 |
| Female | 5,318 (44.1%) | $26,731 |
| Total | 12,073 (100.0%) | $30,780 |
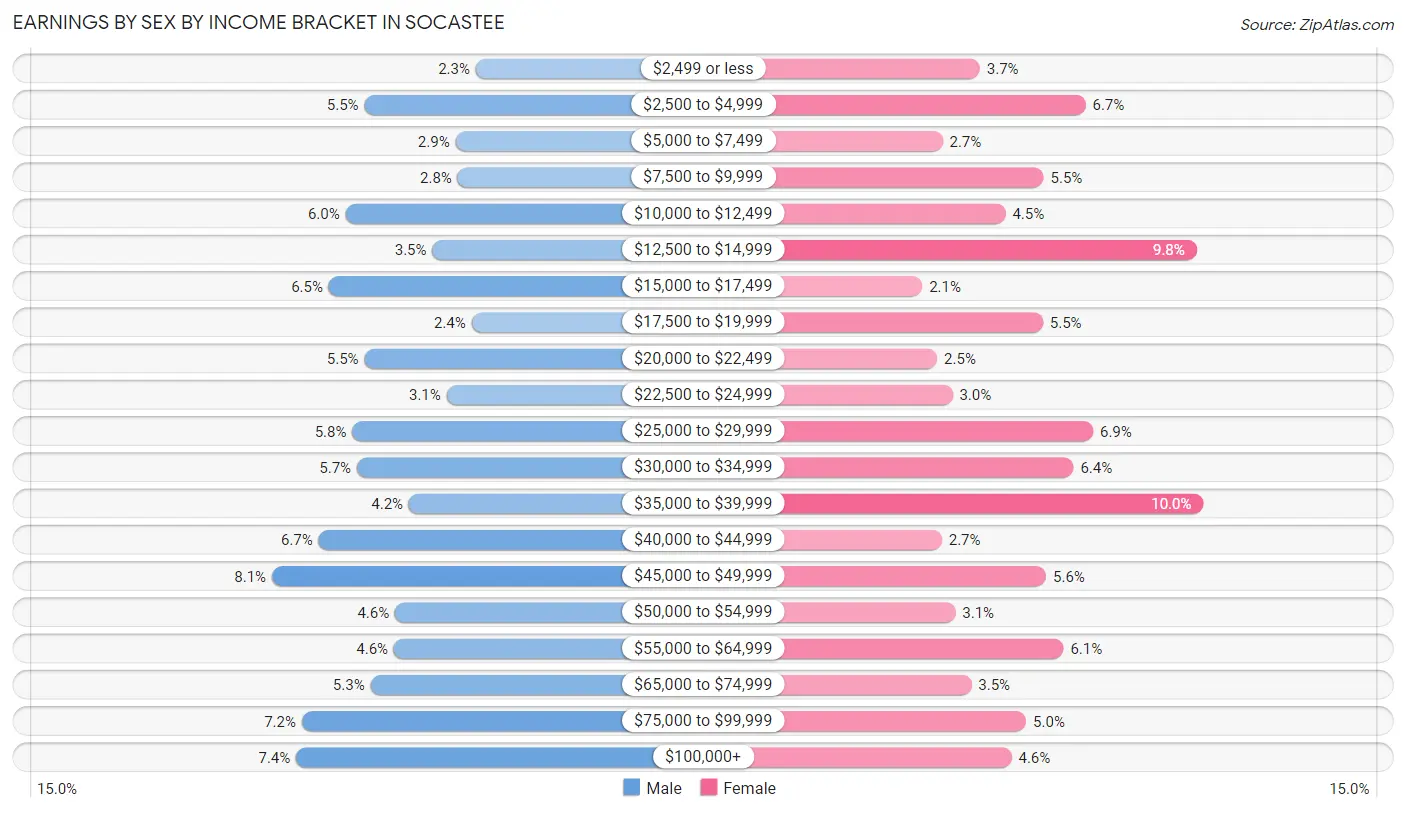
Earnings by Sex by Income Bracket in Socastee
The most common earnings brackets in Socastee are $45,000 to $49,999 for men (544 | 8.1%) and $35,000 to $39,999 for women (533 | 10.0%).
| Income | Male | Female |
| $2,499 or less | 157 (2.3%) | 199 (3.7%) |
| $2,500 to $4,999 | 368 (5.4%) | 357 (6.7%) |
| $5,000 to $7,499 | 195 (2.9%) | 143 (2.7%) |
| $7,500 to $9,999 | 191 (2.8%) | 294 (5.5%) |
| $10,000 to $12,499 | 404 (6.0%) | 237 (4.5%) |
| $12,500 to $14,999 | 239 (3.5%) | 523 (9.8%) |
| $15,000 to $17,499 | 436 (6.5%) | 113 (2.1%) |
| $17,500 to $19,999 | 165 (2.4%) | 293 (5.5%) |
| $20,000 to $22,499 | 368 (5.4%) | 135 (2.5%) |
| $22,500 to $24,999 | 212 (3.1%) | 158 (3.0%) |
| $25,000 to $29,999 | 391 (5.8%) | 368 (6.9%) |
| $30,000 to $34,999 | 382 (5.7%) | 339 (6.4%) |
| $35,000 to $39,999 | 284 (4.2%) | 533 (10.0%) |
| $40,000 to $44,999 | 455 (6.7%) | 142 (2.7%) |
| $45,000 to $49,999 | 544 (8.1%) | 298 (5.6%) |
| $50,000 to $54,999 | 310 (4.6%) | 162 (3.0%) |
| $55,000 to $64,999 | 312 (4.6%) | 324 (6.1%) |
| $65,000 to $74,999 | 357 (5.3%) | 186 (3.5%) |
| $75,000 to $99,999 | 487 (7.2%) | 268 (5.0%) |
| $100,000+ | 498 (7.4%) | 246 (4.6%) |
| Total | 6,755 (100.0%) | 5,318 (100.0%) |
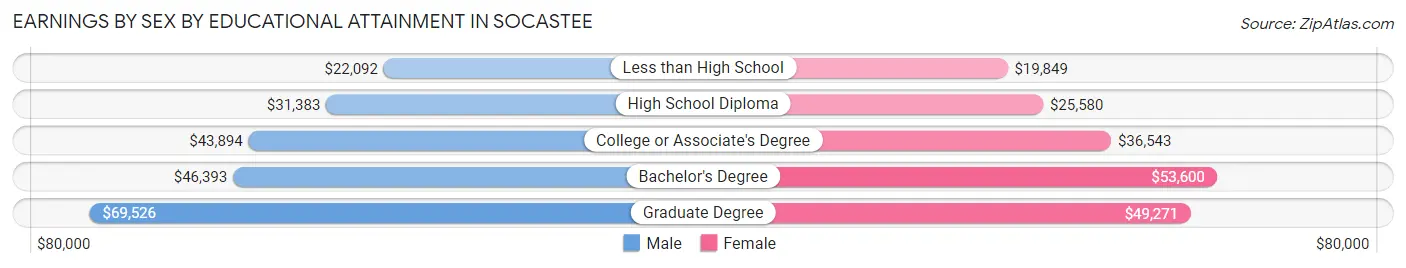
Earnings by Sex by Educational Attainment in Socastee
Average earnings in Socastee are $38,453 for men and $32,698 for women, a difference of 15.0%. Men with an educational attainment of graduate degree enjoy the highest average annual earnings of $69,526, while those with less than high school education earn the least with $22,092. Women with an educational attainment of bachelor's degree earn the most with the average annual earnings of $53,600, while those with less than high school education have the smallest earnings of $19,849.
| Educational Attainment | Male Income | Female Income |
| Less than High School | $22,092 | $19,849 |
| High School Diploma | $31,383 | $25,580 |
| College or Associate's Degree | $43,894 | $36,543 |
| Bachelor's Degree | $46,393 | $53,600 |
| Graduate Degree | $69,526 | $49,271 |
| Total | $38,453 | $32,698 |
Family Income in Socastee
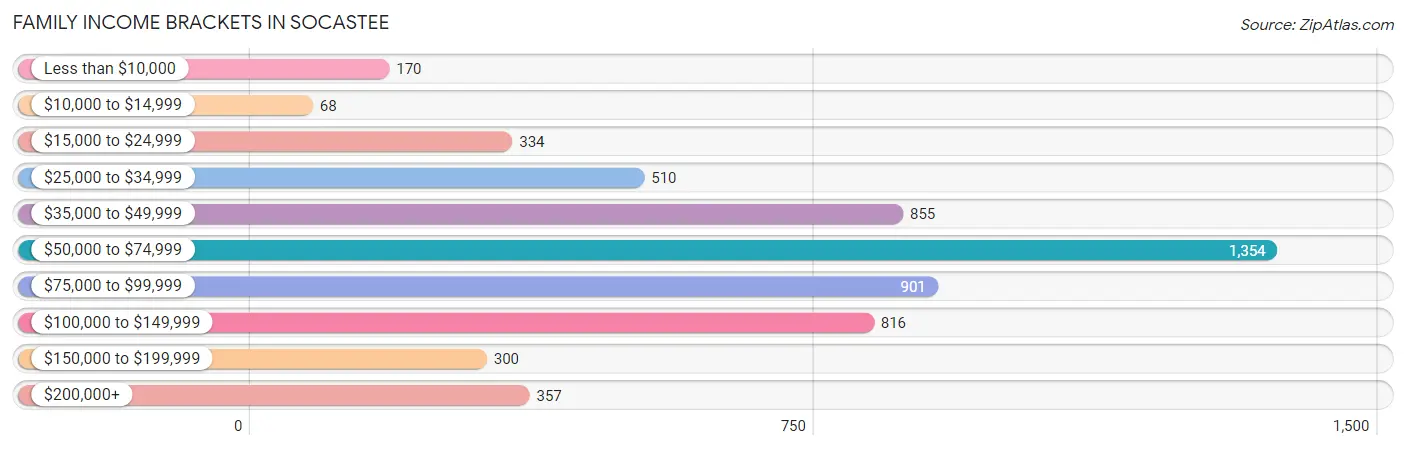
Family Income Brackets in Socastee
According to the Socastee family income data, there are 1,354 families falling into the $50,000 to $74,999 income range, which is the most common income bracket and makes up 23.9% of all families. Conversely, the $10,000 to $14,999 income bracket is the least frequent group with only 68 families (1.2%) belonging to this category.
| Income Bracket | # Families | % Families |
| Less than $10,000 | 170 | 3.0% |
| $10,000 to $14,999 | 68 | 1.2% |
| $15,000 to $24,999 | 334 | 5.9% |
| $25,000 to $34,999 | 510 | 9.0% |
| $35,000 to $49,999 | 855 | 15.1% |
| $50,000 to $74,999 | 1,354 | 23.9% |
| $75,000 to $99,999 | 901 | 15.9% |
| $100,000 to $149,999 | 816 | 14.4% |
| $150,000 to $199,999 | 300 | 5.3% |
| $200,000+ | 357 | 6.3% |
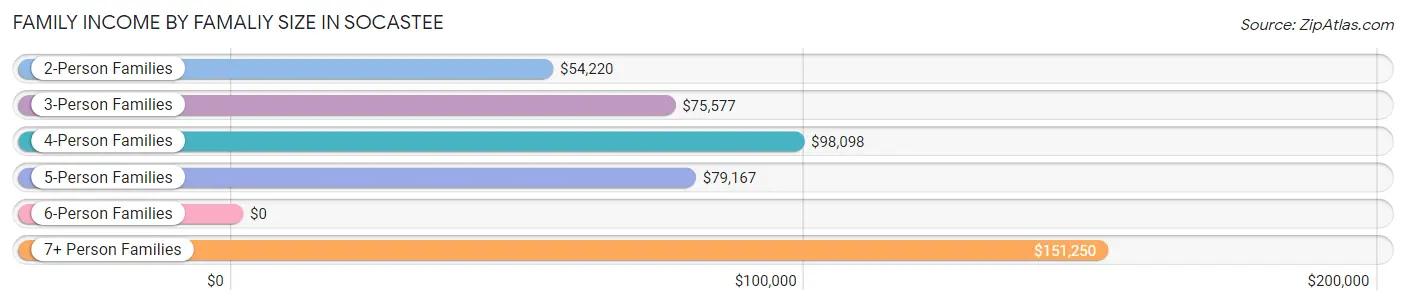
Family Income by Famaliy Size in Socastee
7+ person families (91 | 1.6%) account for the highest median family income in Socastee with $151,250 per family, while 2-person families (3,495 | 61.7%) have the highest median income of $27,110 per family member.
| Income Bracket | # Families | Median Income |
| 2-Person Families | 3,495 (61.7%) | $54,220 |
| 3-Person Families | 938 (16.6%) | $75,577 |
| 4-Person Families | 731 (12.9%) | $98,098 |
| 5-Person Families | 382 (6.7%) | $79,167 |
| 6-Person Families | 27 (0.5%) | $0 |
| 7+ Person Families | 91 (1.6%) | $151,250 |
| Total | 5,664 (100.0%) | $61,875 |
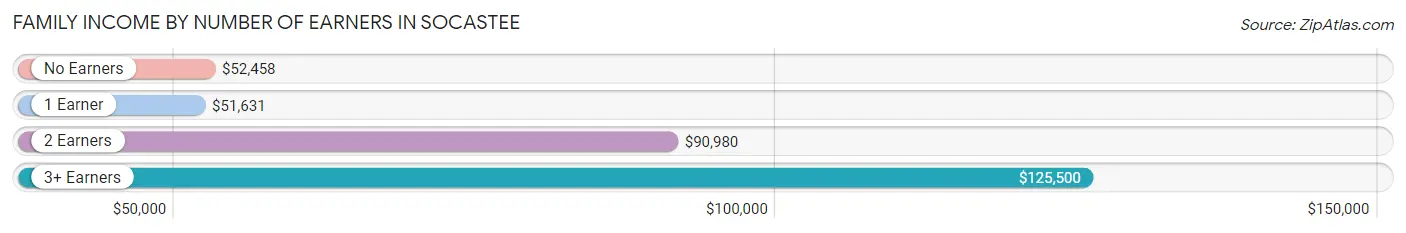
Family Income by Number of Earners in Socastee
The median family income in Socastee is $61,875, with families comprising 3+ earners (454) having the highest median family income of $125,500, while families with 1 earner (1,955) have the lowest median family income of $51,631, accounting for 8.0% and 34.5% of families, respectively.
| Number of Earners | # Families | Median Income |
| No Earners | 1,401 (24.7%) | $52,458 |
| 1 Earner | 1,955 (34.5%) | $51,631 |
| 2 Earners | 1,854 (32.7%) | $90,980 |
| 3+ Earners | 454 (8.0%) | $125,500 |
| Total | 5,664 (100.0%) | $61,875 |
Household Income in Socastee
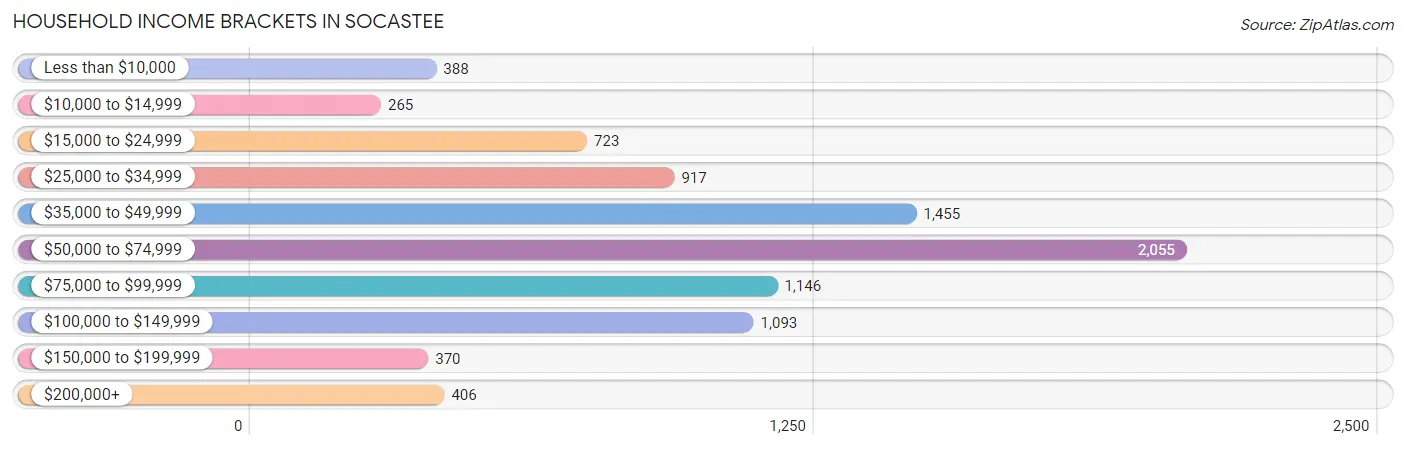
Household Income Brackets in Socastee
With 2,055 households falling in the category, the $50,000 to $74,999 income range is the most frequent in Socastee, accounting for 23.3% of all households. In contrast, only 265 households (3.0%) fall into the $10,000 to $14,999 income bracket, making it the least populous group.
| Income Bracket | # Households | % Households |
| Less than $10,000 | 388 | 4.4% |
| $10,000 to $14,999 | 265 | 3.0% |
| $15,000 to $24,999 | 723 | 8.2% |
| $25,000 to $34,999 | 917 | 10.4% |
| $35,000 to $49,999 | 1,455 | 16.5% |
| $50,000 to $74,999 | 2,055 | 23.3% |
| $75,000 to $99,999 | 1,146 | 13.0% |
| $100,000 to $149,999 | 1,093 | 12.4% |
| $150,000 to $199,999 | 370 | 4.2% |
| $200,000+ | 406 | 4.6% |
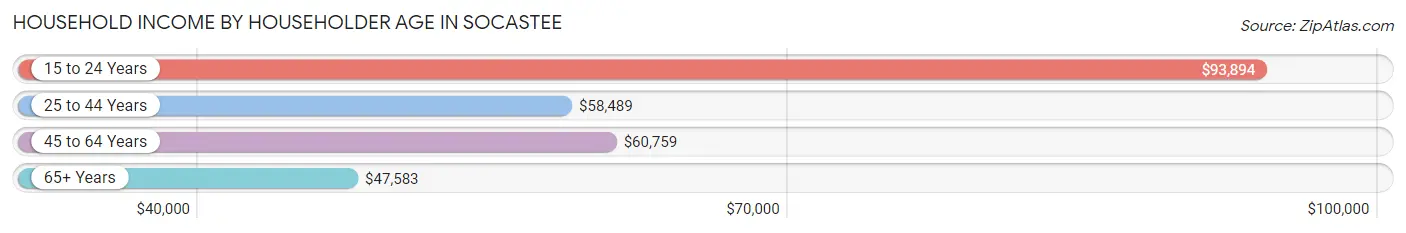
Household Income by Householder Age in Socastee
The median household income in Socastee is $54,405, with the highest median household income of $93,894 found in the 15 to 24 years age bracket for the primary householder. A total of 69 households (0.8%) fall into this category. Meanwhile, the 65+ years age bracket for the primary householder has the lowest median household income of $47,583, with 3,069 households (34.8%) in this group.
| Income Bracket | # Households | Median Income |
| 15 to 24 Years | 69 (0.8%) | $93,894 |
| 25 to 44 Years | 2,448 (27.8%) | $58,489 |
| 45 to 64 Years | 3,232 (36.6%) | $60,759 |
| 65+ Years | 3,069 (34.8%) | $47,583 |
| Total | 8,818 (100.0%) | $54,405 |
Poverty in Socastee
Income Below Poverty by Sex and Age in Socastee
With 11.9% poverty level for males and 15.6% for females among the residents of Socastee, 5 year old males and 16 and 17 year old females are the most vulnerable to poverty, with 51 males (23.8%) and 95 females (39.6%) in their respective age groups living below the poverty level.
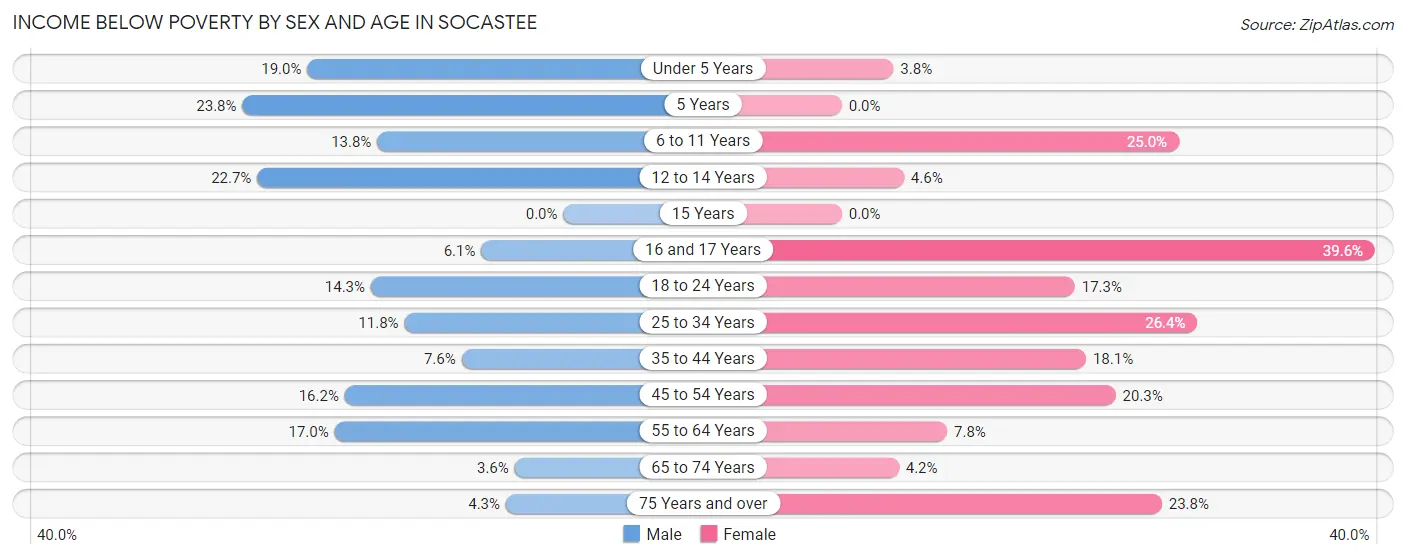
| Age Bracket | Male | Female |
| Under 5 Years | 123 (19.0%) | 29 (3.8%) |
| 5 Years | 51 (23.8%) | 0 (0.0%) |
| 6 to 11 Years | 111 (13.8%) | 235 (25.0%) |
| 12 to 14 Years | 40 (22.7%) | 14 (4.6%) |
| 15 Years | 0 (0.0%) | 0 (0.0%) |
| 16 and 17 Years | 12 (6.1%) | 95 (39.6%) |
| 18 to 24 Years | 131 (14.3%) | 114 (17.3%) |
| 25 to 34 Years | 228 (11.8%) | 457 (26.4%) |
| 35 to 44 Years | 114 (7.6%) | 238 (18.1%) |
| 45 to 54 Years | 249 (16.2%) | 281 (20.3%) |
| 55 to 64 Years | 280 (17.0%) | 156 (7.8%) |
| 65 to 74 Years | 59 (3.6%) | 75 (4.2%) |
| 75 Years and over | 31 (4.3%) | 215 (23.8%) |
| Total | 1,429 (11.9%) | 1,909 (15.6%) |
Income Above Poverty by Sex and Age in Socastee
According to the poverty statistics in Socastee, males aged 15 years and females aged 5 years are the age groups that are most secure financially, with 100.0% of males and 100.0% of females in these age groups living above the poverty line.
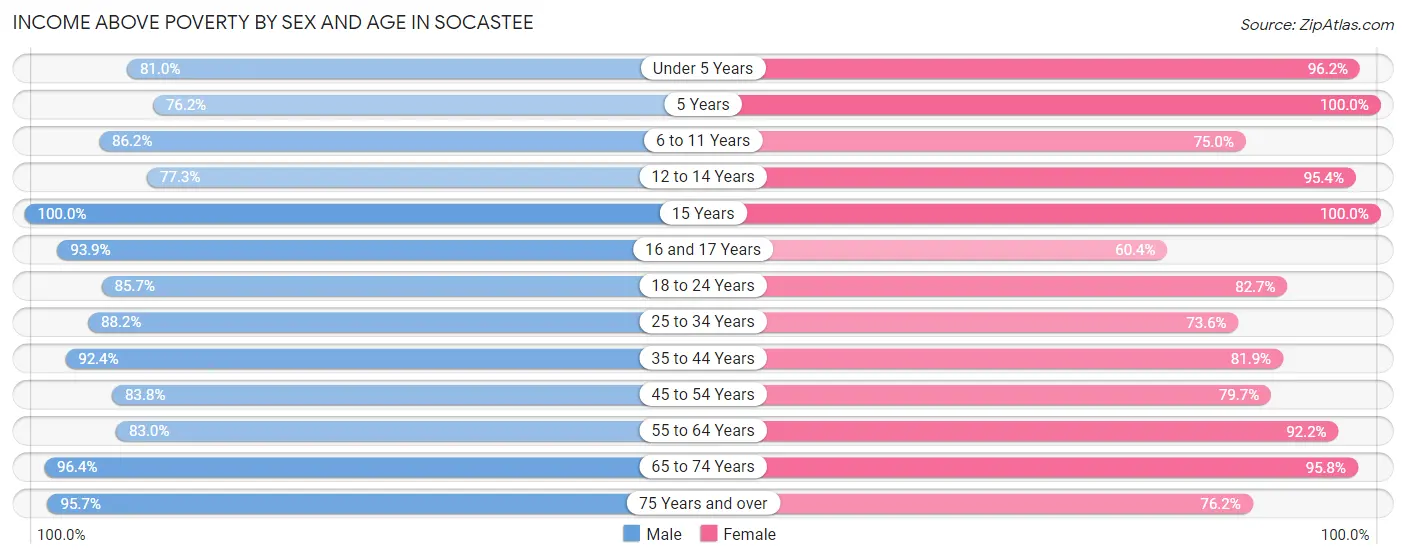
| Age Bracket | Male | Female |
| Under 5 Years | 524 (81.0%) | 729 (96.2%) |
| 5 Years | 163 (76.2%) | 98 (100.0%) |
| 6 to 11 Years | 692 (86.2%) | 704 (75.0%) |
| 12 to 14 Years | 136 (77.3%) | 290 (95.4%) |
| 15 Years | 48 (100.0%) | 113 (100.0%) |
| 16 and 17 Years | 185 (93.9%) | 145 (60.4%) |
| 18 to 24 Years | 786 (85.7%) | 545 (82.7%) |
| 25 to 34 Years | 1,705 (88.2%) | 1,275 (73.6%) |
| 35 to 44 Years | 1,393 (92.4%) | 1,075 (81.9%) |
| 45 to 54 Years | 1,285 (83.8%) | 1,101 (79.7%) |
| 55 to 64 Years | 1,368 (83.0%) | 1,838 (92.2%) |
| 65 to 74 Years | 1,570 (96.4%) | 1,699 (95.8%) |
| 75 Years and over | 695 (95.7%) | 690 (76.2%) |
| Total | 10,550 (88.1%) | 10,302 (84.4%) |
Income Below Poverty Among Married-Couple Families in Socastee
The poverty statistics for married-couple families in Socastee show that 6.0% or 242 of the total 4,003 families live below the poverty line. Families with 3 or 4 children have the highest poverty rate of 11.7%, comprising of 29 families. On the other hand, families with 5 or more children have the lowest poverty rate of 0.0%, which includes 0 families.
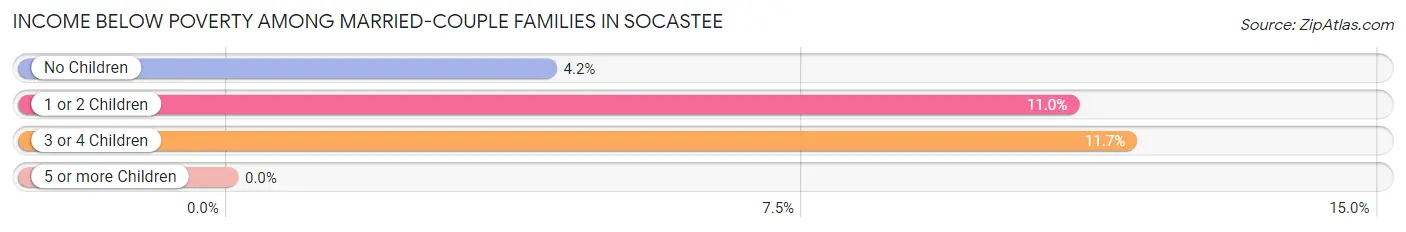
| Children | Above Poverty | Below Poverty |
| No Children | 2,764 (95.8%) | 120 (4.2%) |
| 1 or 2 Children | 754 (89.0%) | 93 (11.0%) |
| 3 or 4 Children | 218 (88.3%) | 29 (11.7%) |
| 5 or more Children | 25 (100.0%) | 0 (0.0%) |
| Total | 3,761 (94.0%) | 242 (6.0%) |
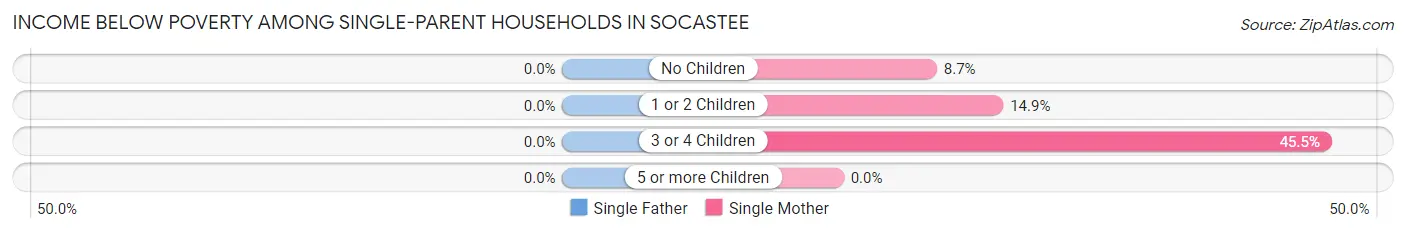
Income Below Poverty Among Single-Parent Households in Socastee
| Children | Single Father | Single Mother |
| No Children | 0 (0.0%) | 44 (8.7%) |
| 1 or 2 Children | 0 (0.0%) | 85 (14.9%) |
| 3 or 4 Children | 0 (0.0%) | 20 (45.5%) |
| 5 or more Children | 0 (0.0%) | 0 (0.0%) |
| Total | 0 (0.0%) | 149 (12.9%) |
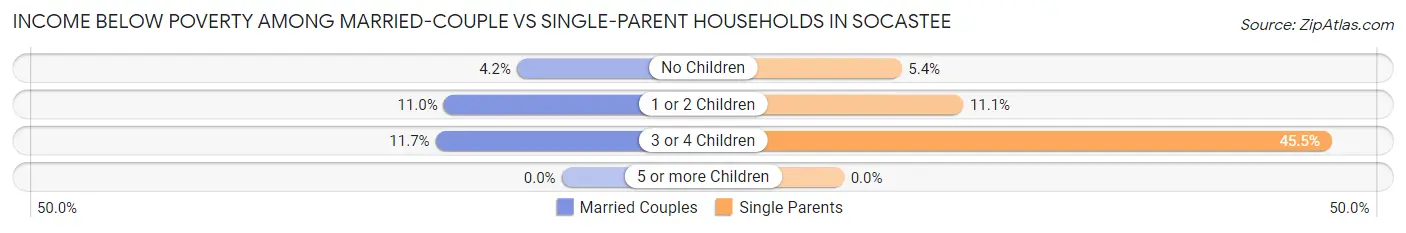
Income Below Poverty Among Married-Couple vs Single-Parent Households in Socastee
The poverty data for Socastee shows that 242 of the married-couple family households (6.0%) and 149 of the single-parent households (9.0%) are living below the poverty level. Within the married-couple family households, those with 3 or 4 children have the highest poverty rate, with 29 households (11.7%) falling below the poverty line. Among the single-parent households, those with 3 or 4 children have the highest poverty rate, with 20 household (45.5%) living below poverty.
| Children | Married-Couple Families | Single-Parent Households |
| No Children | 120 (4.2%) | 44 (5.4%) |
| 1 or 2 Children | 93 (11.0%) | 85 (11.1%) |
| 3 or 4 Children | 29 (11.7%) | 20 (45.5%) |
| 5 or more Children | 0 (0.0%) | 0 (0.0%) |
| Total | 242 (6.0%) | 149 (9.0%) |
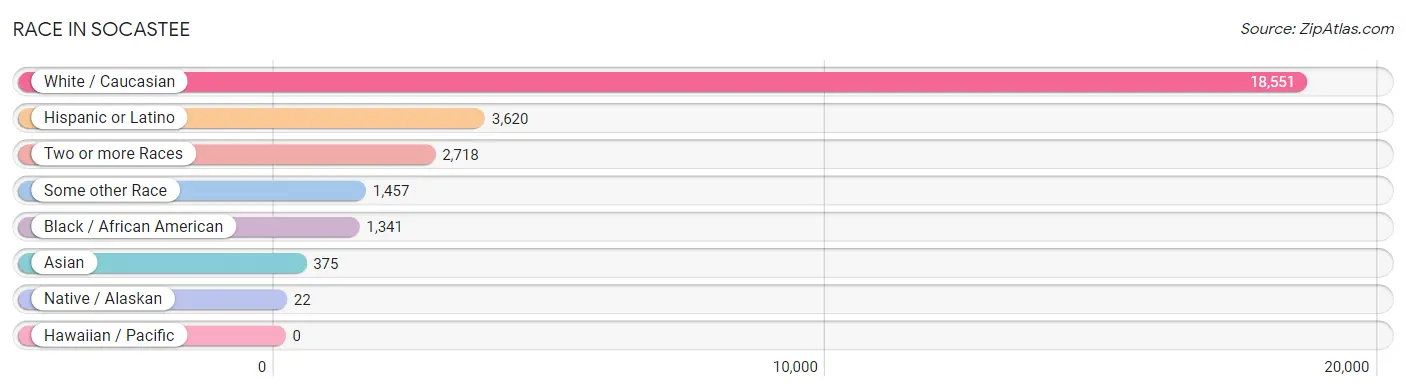
Race in Socastee
The most populous races in Socastee are White / Caucasian (18,551 | 75.8%), Hispanic or Latino (3,620 | 14.8%), and Two or more Races (2,718 | 11.1%).
| Race | # Population | % Population |
| Asian | 375 | 1.5% |
| Black / African American | 1,341 | 5.5% |
| Hawaiian / Pacific | 0 | 0.0% |
| Hispanic or Latino | 3,620 | 14.8% |
| Native / Alaskan | 22 | 0.1% |
| White / Caucasian | 18,551 | 75.8% |
| Two or more Races | 2,718 | 11.1% |
| Some other Race | 1,457 | 6.0% |
| Total | 24,464 | 100.0% |
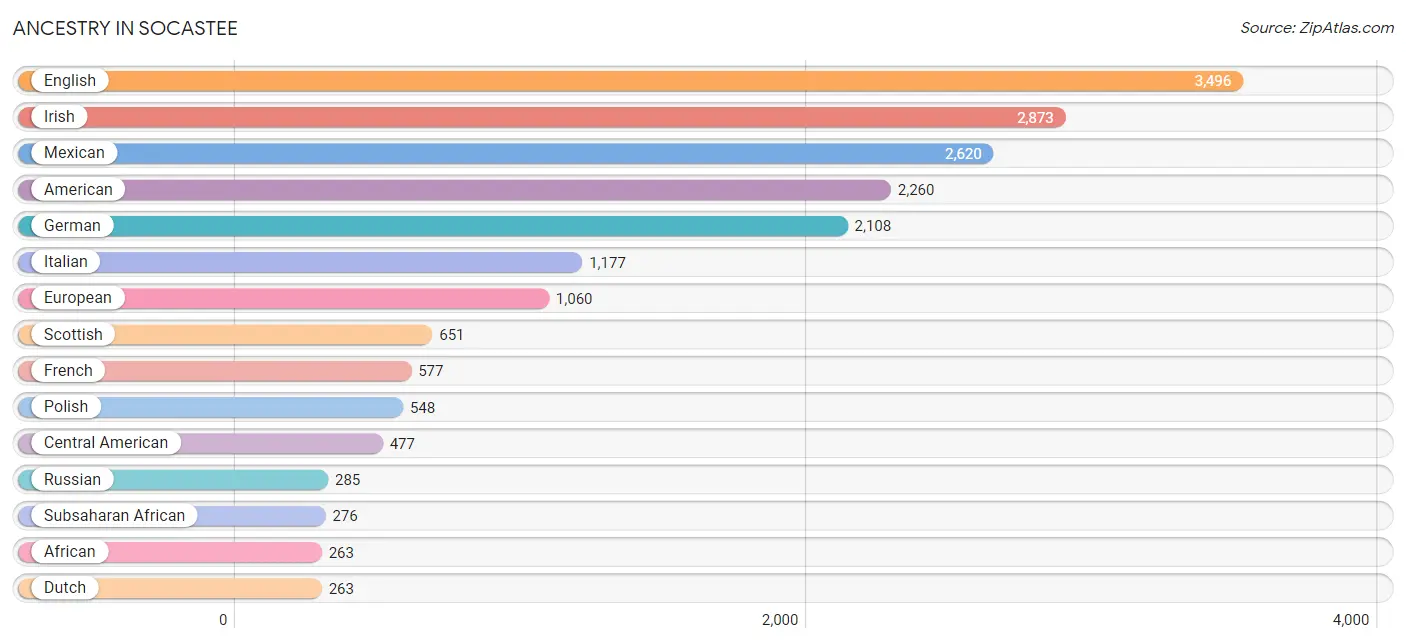
Ancestry in Socastee
The most populous ancestries reported in Socastee are English (3,496 | 14.3%), Irish (2,873 | 11.7%), Mexican (2,620 | 10.7%), American (2,260 | 9.2%), and German (2,108 | 8.6%), together accounting for 54.6% of all Socastee residents.
| Ancestry | # Population | % Population |
| African | 263 | 1.1% |
| Albanian | 5 | 0.0% |
| American | 2,260 | 9.2% |
| Arab | 41 | 0.2% |
| Armenian | 68 | 0.3% |
| Australian | 7 | 0.0% |
| Austrian | 59 | 0.2% |
| Belgian | 14 | 0.1% |
| Bhutanese | 154 | 0.6% |
| Brazilian | 251 | 1.0% |
| British | 34 | 0.1% |
| Burmese | 182 | 0.7% |
| Canadian | 26 | 0.1% |
| Central American | 477 | 1.9% |
| Cherokee | 7 | 0.0% |
| Chilean | 68 | 0.3% |
| Colombian | 5 | 0.0% |
| Costa Rican | 97 | 0.4% |
| Cuban | 32 | 0.1% |
| Czech | 42 | 0.2% |
| Danish | 155 | 0.6% |
| Dominican | 77 | 0.3% |
| Dutch | 263 | 1.1% |
| Eastern European | 40 | 0.2% |
| English | 3,496 | 14.3% |
| European | 1,060 | 4.3% |
| Finnish | 9 | 0.0% |
| French | 577 | 2.4% |
| French Canadian | 46 | 0.2% |
| German | 2,108 | 8.6% |
| Greek | 47 | 0.2% |
| Guamanian / Chamorro | 32 | 0.1% |
| Guatemalan | 172 | 0.7% |
| Honduran | 178 | 0.7% |
| Hungarian | 92 | 0.4% |
| Indian (Asian) | 141 | 0.6% |
| Irish | 2,873 | 11.7% |
| Italian | 1,177 | 4.8% |
| Korean | 130 | 0.5% |
| Lebanese | 41 | 0.2% |
| Lithuanian | 32 | 0.1% |
| Lumbee | 59 | 0.2% |
| Mexican | 2,620 | 10.7% |
| Native Hawaiian | 11 | 0.0% |
| Norwegian | 43 | 0.2% |
| Panamanian | 25 | 0.1% |
| Peruvian | 16 | 0.1% |
| Polish | 548 | 2.2% |
| Portuguese | 126 | 0.5% |
| Puerto Rican | 263 | 1.1% |
| Romanian | 8 | 0.0% |
| Russian | 285 | 1.2% |
| Salvadoran | 5 | 0.0% |
| Scandinavian | 222 | 0.9% |
| Scotch-Irish | 218 | 0.9% |
| Scottish | 651 | 2.7% |
| Serbian | 59 | 0.2% |
| Slovak | 4 | 0.0% |
| South African | 13 | 0.1% |
| South American | 89 | 0.4% |
| Sri Lankan | 79 | 0.3% |
| Subsaharan African | 276 | 1.1% |
| Swedish | 134 | 0.5% |
| Thai | 56 | 0.2% |
| Ukrainian | 61 | 0.3% |
| Welsh | 129 | 0.5% | View All 66 Rows |
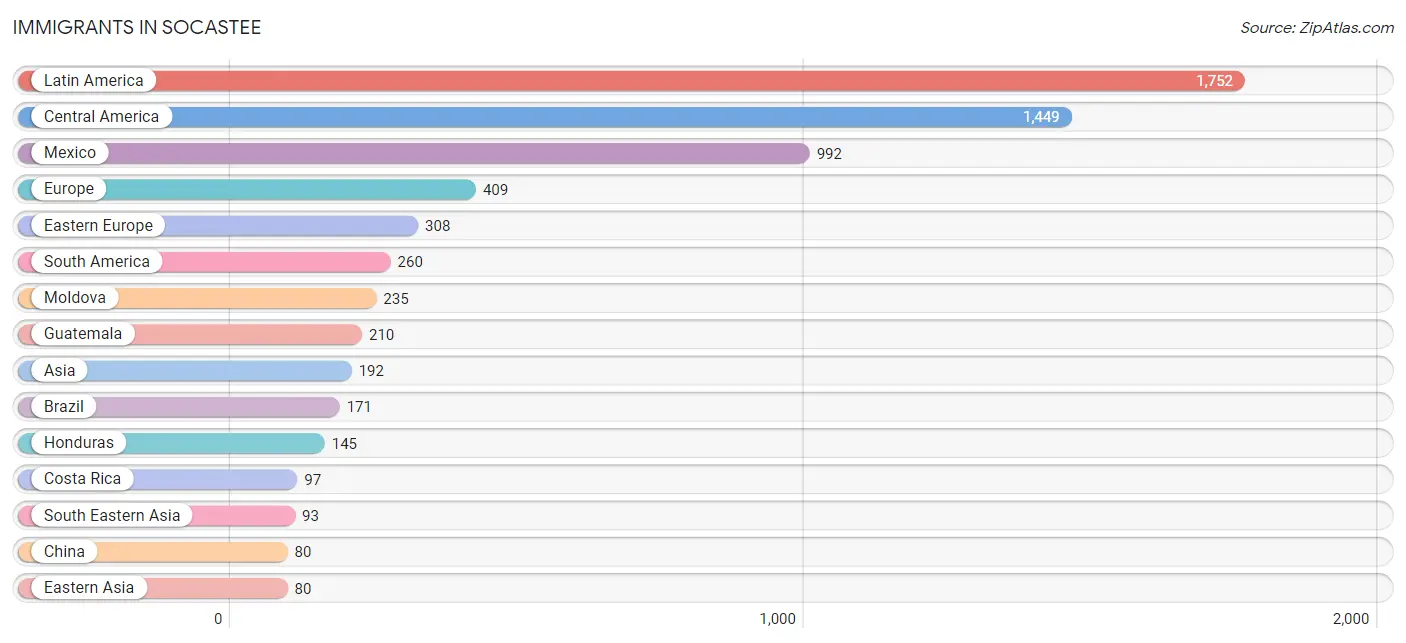
Immigrants in Socastee
The most numerous immigrant groups reported in Socastee came from Latin America (1,752 | 7.2%), Central America (1,449 | 5.9%), Mexico (992 | 4.1%), Europe (409 | 1.7%), and Eastern Europe (308 | 1.3%), together accounting for 20.1% of all Socastee residents.
| Immigration Origin | # Population | % Population |
| Africa | 13 | 0.1% |
| Asia | 192 | 0.8% |
| Austria | 5 | 0.0% |
| Brazil | 171 | 0.7% |
| Canada | 7 | 0.0% |
| Caribbean | 43 | 0.2% |
| Central America | 1,449 | 5.9% |
| Chile | 68 | 0.3% |
| China | 80 | 0.3% |
| Colombia | 5 | 0.0% |
| Costa Rica | 97 | 0.4% |
| Dominican Republic | 43 | 0.2% |
| Eastern Asia | 80 | 0.3% |
| Eastern Europe | 308 | 1.3% |
| El Salvador | 5 | 0.0% |
| England | 22 | 0.1% |
| Europe | 409 | 1.7% |
| France | 17 | 0.1% |
| Germany | 18 | 0.1% |
| Guatemala | 210 | 0.9% |
| Honduras | 145 | 0.6% |
| India | 19 | 0.1% |
| Ireland | 21 | 0.1% |
| Latin America | 1,752 | 7.2% |
| Mexico | 992 | 4.1% |
| Moldova | 235 | 1.0% |
| Northern Europe | 61 | 0.3% |
| Peru | 16 | 0.1% |
| Philippines | 48 | 0.2% |
| Russia | 28 | 0.1% |
| Scotland | 13 | 0.1% |
| Serbia | 45 | 0.2% |
| South Africa | 13 | 0.1% |
| South America | 260 | 1.1% |
| South Central Asia | 19 | 0.1% |
| South Eastern Asia | 93 | 0.4% |
| Taiwan | 36 | 0.2% |
| Vietnam | 45 | 0.2% |
| Western Europe | 40 | 0.2% | View All 39 Rows |
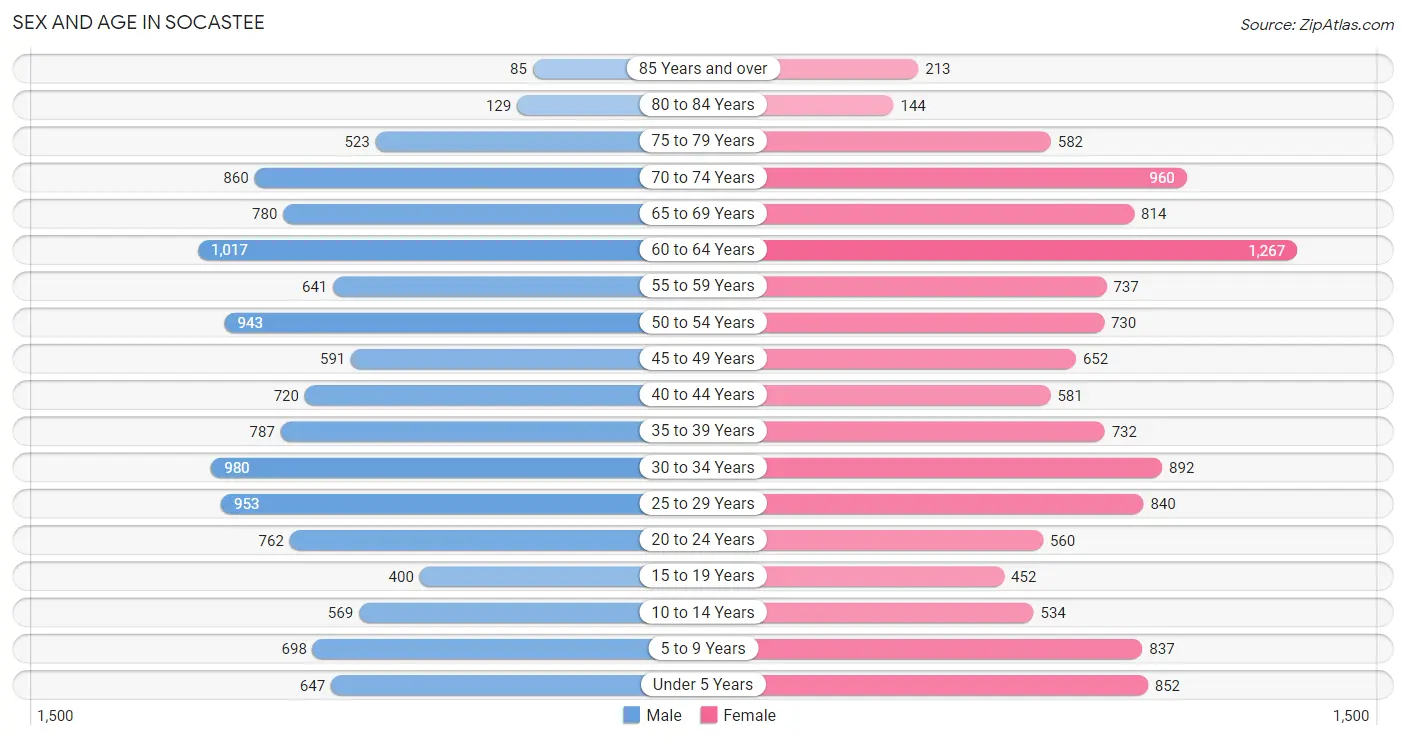
Sex and Age in Socastee
Sex and Age in Socastee
The most populous age groups in Socastee are 60 to 64 Years (1,017 | 8.4%) for men and 60 to 64 Years (1,267 | 10.2%) for women.
| Age Bracket | Male | Female |
| Under 5 Years | 647 (5.3%) | 852 (6.9%) |
| 5 to 9 Years | 698 (5.8%) | 837 (6.8%) |
| 10 to 14 Years | 569 (4.7%) | 534 (4.3%) |
| 15 to 19 Years | 400 (3.3%) | 452 (3.6%) |
| 20 to 24 Years | 762 (6.3%) | 560 (4.5%) |
| 25 to 29 Years | 953 (7.9%) | 840 (6.8%) |
| 30 to 34 Years | 980 (8.1%) | 892 (7.2%) |
| 35 to 39 Years | 787 (6.5%) | 732 (5.9%) |
| 40 to 44 Years | 720 (6.0%) | 581 (4.7%) |
| 45 to 49 Years | 591 (4.9%) | 652 (5.3%) |
| 50 to 54 Years | 943 (7.8%) | 730 (5.9%) |
| 55 to 59 Years | 641 (5.3%) | 737 (5.9%) |
| 60 to 64 Years | 1,017 (8.4%) | 1,267 (10.2%) |
| 65 to 69 Years | 780 (6.5%) | 814 (6.6%) |
| 70 to 74 Years | 860 (7.1%) | 960 (7.8%) |
| 75 to 79 Years | 523 (4.3%) | 582 (4.7%) |
| 80 to 84 Years | 129 (1.1%) | 144 (1.2%) |
| 85 Years and over | 85 (0.7%) | 213 (1.7%) |
| Total | 12,085 (100.0%) | 12,379 (100.0%) |
Families and Households in Socastee
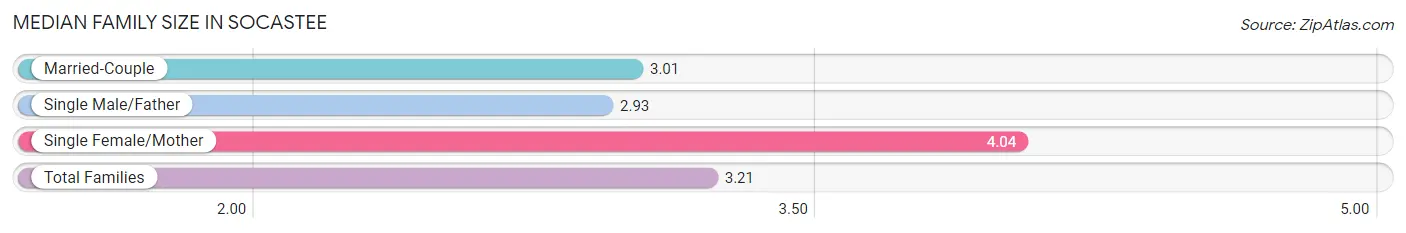
Median Family Size in Socastee
The median family size in Socastee is 3.21 persons per family, with single female/mother families (1,156 | 20.4%) accounting for the largest median family size of 4.04 persons per family. On the other hand, single male/father families (505 | 8.9%) represent the smallest median family size with 2.93 persons per family.
| Family Type | # Families | Family Size |
| Married-Couple | 4,003 (70.7%) | 3.01 |
| Single Male/Father | 505 (8.9%) | 2.93 |
| Single Female/Mother | 1,156 (20.4%) | 4.04 |
| Total Families | 5,664 (100.0%) | 3.21 |
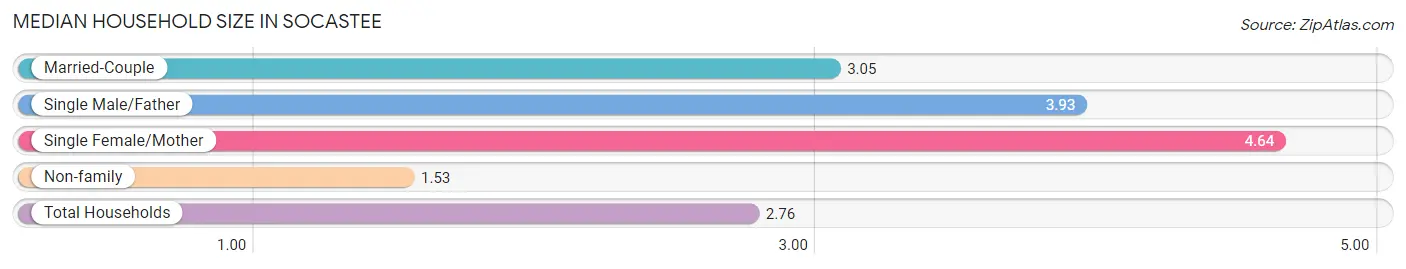
Median Household Size in Socastee
The median household size in Socastee is 2.76 persons per household, with single female/mother households (1,156 | 13.1%) accounting for the largest median household size of 4.64 persons per household. non-family households (3,154 | 35.8%) represent the smallest median household size with 1.53 persons per household.
| Household Type | # Households | Household Size |
| Married-Couple | 4,003 (45.4%) | 3.05 |
| Single Male/Father | 505 (5.7%) | 3.93 |
| Single Female/Mother | 1,156 (13.1%) | 4.64 |
| Non-family | 3,154 (35.8%) | 1.53 |
| Total Households | 8,818 (100.0%) | 2.76 |
Household Size by Marriage Status in Socastee
Out of a total of 8,818 households in Socastee, 5,664 (64.2%) are family households, while 3,154 (35.8%) are nonfamily households. The most numerous type of family households are 2-person households, comprising 3,147, and the most common type of nonfamily households are 1-person households, comprising 2,379.
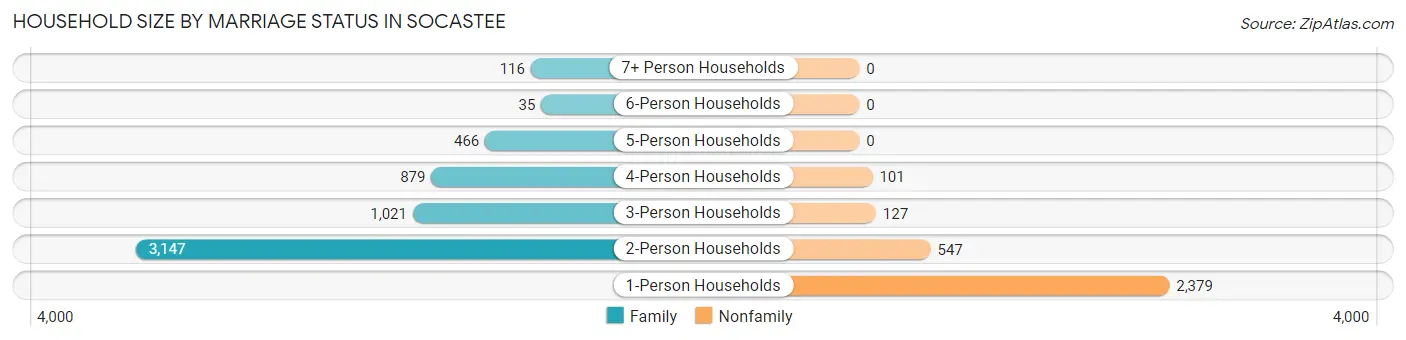
| Household Size | Family Households | Nonfamily Households |
| 1-Person Households | - | 2,379 (27.0%) |
| 2-Person Households | 3,147 (35.7%) | 547 (6.2%) |
| 3-Person Households | 1,021 (11.6%) | 127 (1.4%) |
| 4-Person Households | 879 (10.0%) | 101 (1.1%) |
| 5-Person Households | 466 (5.3%) | 0 (0.0%) |
| 6-Person Households | 35 (0.4%) | 0 (0.0%) |
| 7+ Person Households | 116 (1.3%) | 0 (0.0%) |
| Total | 5,664 (64.2%) | 3,154 (35.8%) |
Female Fertility in Socastee
Fertility by Age in Socastee
Average fertility rate in Socastee is 18.0 births per 1,000 women. Women in the age bracket of 20 to 34 years have the highest fertility rate with 23.0 births per 1,000 women. Women in the age bracket of 20 to 34 years acount for 59.8% of all women with births.
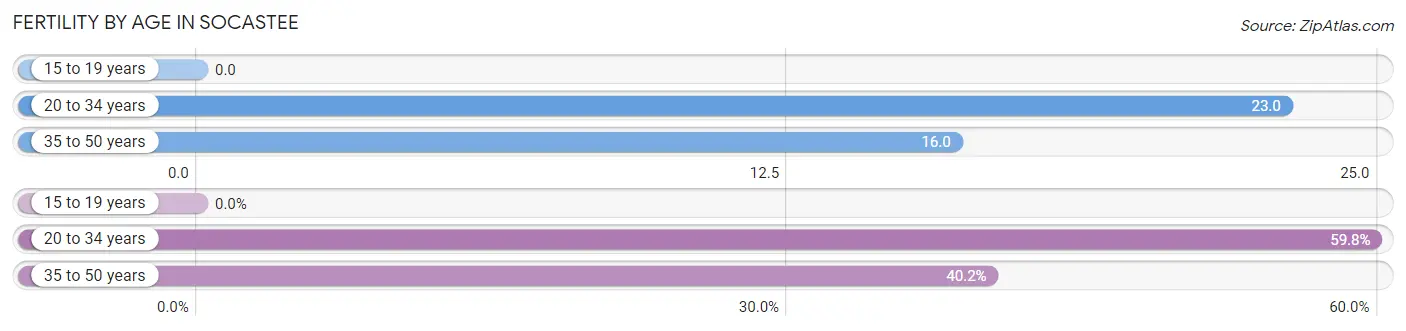
| Age Bracket | Women with Births | Births / 1,000 Women |
| 15 to 19 years | 0 (0.0%) | 0.0 |
| 20 to 34 years | 52 (59.8%) | 23.0 |
| 35 to 50 years | 35 (40.2%) | 16.0 |
| Total | 87 (100.0%) | 18.0 |
Fertility by Age by Marriage Status in Socastee
62.1% of women with births (87) in Socastee are married. The highest percentage of unmarried women with births falls into 20 to 34 years age bracket with 63.5% of them unmarried at the time of birth, while the lowest percentage of unmarried women with births belong to 35 to 50 years age bracket with 0.0% of them unmarried.
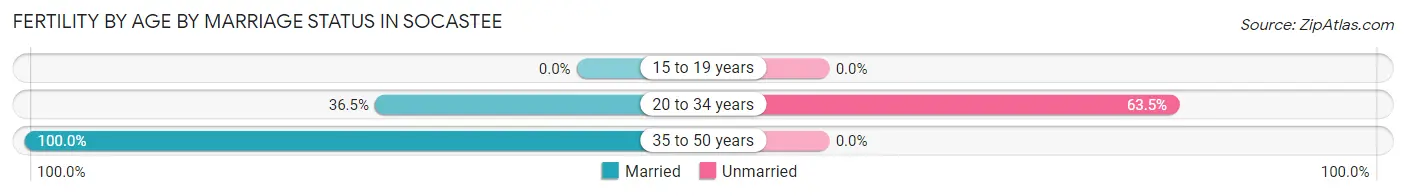
| Age Bracket | Married | Unmarried |
| 15 to 19 years | 0 (0.0%) | 0 (0.0%) |
| 20 to 34 years | 19 (36.5%) | 33 (63.5%) |
| 35 to 50 years | 35 (100.0%) | 0 (0.0%) |
| Total | 54 (62.1%) | 33 (37.9%) |
Fertility by Education in Socastee
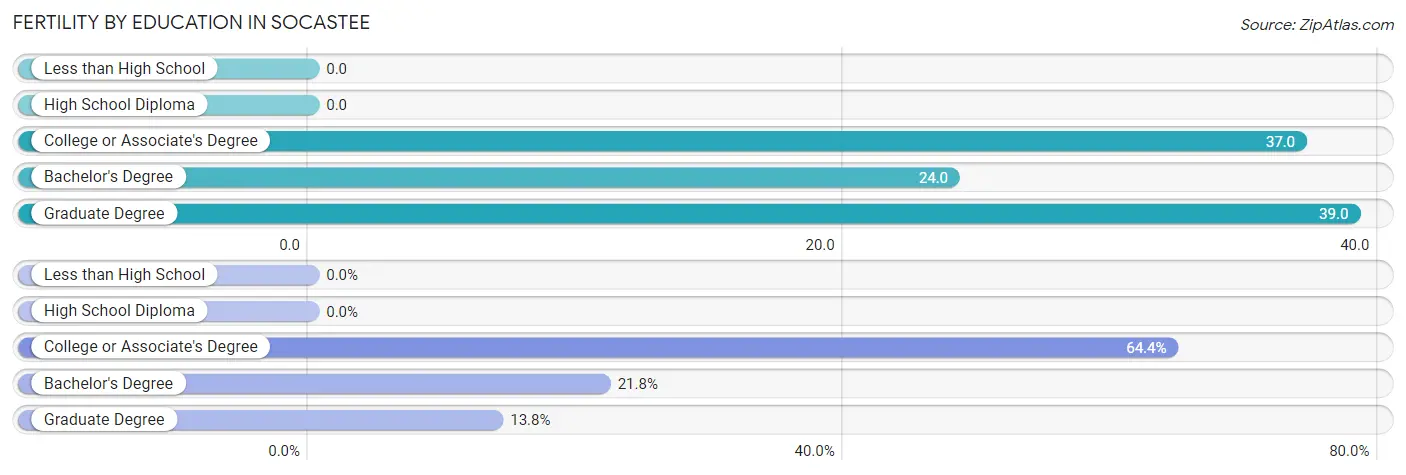
| Educational Attainment | Women with Births | Births / 1,000 Women |
| Less than High School | 0 (0.0%) | 0.0 |
| High School Diploma | 0 (0.0%) | 0.0 |
| College or Associate's Degree | 56 (64.4%) | 37.0 |
| Bachelor's Degree | 19 (21.8%) | 24.0 |
| Graduate Degree | 12 (13.8%) | 39.0 |
| Total | 87 (100.0%) | 18.0 |
Fertility by Education by Marriage Status in Socastee
37.9% of women with births in Socastee are unmarried. Women with the educational attainment of bachelor's degree are most likely to be married with 100.0% of them married at childbirth, while women with the educational attainment of college or associate's degree are least likely to be married with 58.9% of them unmarried at childbirth.
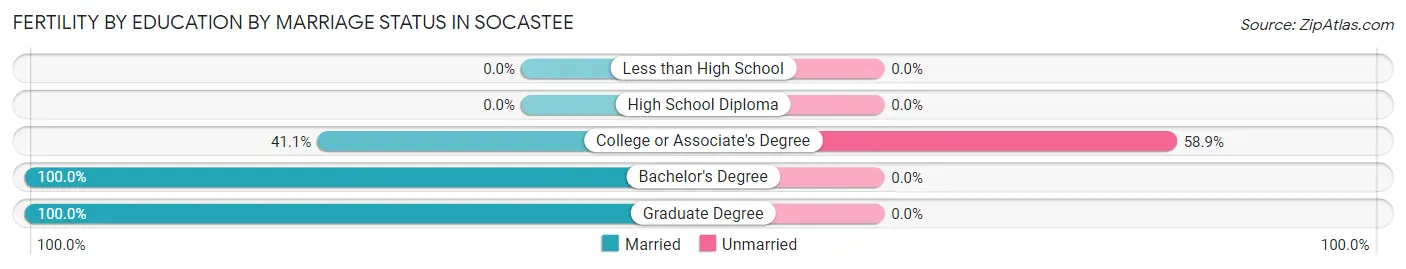
| Educational Attainment | Married | Unmarried |
| Less than High School | 0 (0.0%) | 0 (0.0%) |
| High School Diploma | 0 (0.0%) | 0 (0.0%) |
| College or Associate's Degree | 23 (41.1%) | 33 (58.9%) |
| Bachelor's Degree | 19 (100.0%) | 0 (0.0%) |
| Graduate Degree | 12 (100.0%) | 0 (0.0%) |
| Total | 54 (62.1%) | 33 (37.9%) |
Employment Characteristics in Socastee
Employment by Class of Employer in Socastee
Among the 11,130 employed individuals in Socastee, private company employees (8,513 | 76.5%), self-employed (not incorporated) (1,257 | 11.3%), and local government employees (552 | 5.0%) make up the most common classes of employment.
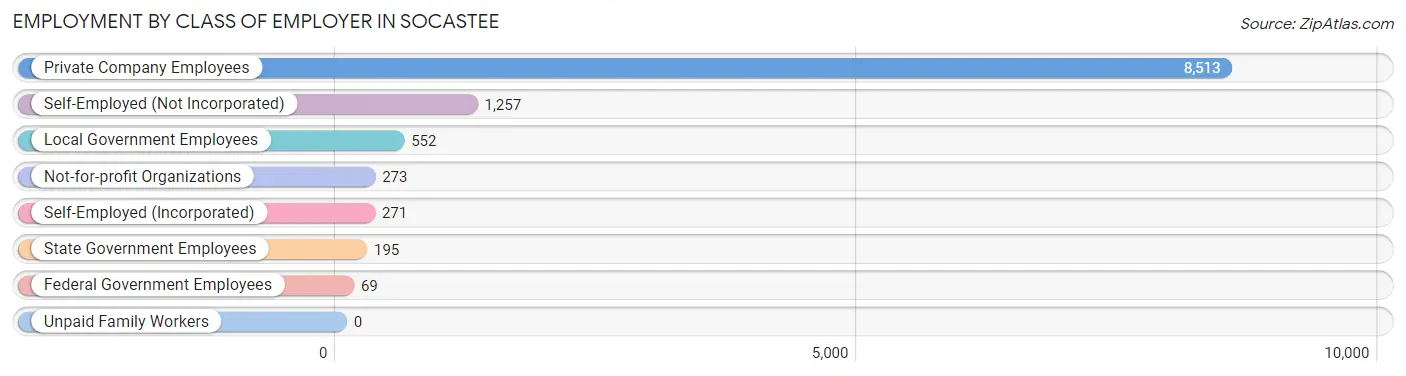
| Employer Class | # Employees | % Employees |
| Private Company Employees | 8,513 | 76.5% |
| Self-Employed (Incorporated) | 271 | 2.4% |
| Self-Employed (Not Incorporated) | 1,257 | 11.3% |
| Not-for-profit Organizations | 273 | 2.5% |
| Local Government Employees | 552 | 5.0% |
| State Government Employees | 195 | 1.8% |
| Federal Government Employees | 69 | 0.6% |
| Unpaid Family Workers | 0 | 0.0% |
| Total | 11,130 | 100.0% |
Employment Status by Age in Socastee
According to the labor force statistics for Socastee, out of the total population over 16 years of age (20,166), 59.2% or 11,938 individuals are in the labor force, with 5.5% or 657 of them unemployed. The age group with the highest labor force participation rate is 35 to 44 years, with 87.8% or 2,476 individuals in the labor force. Within the labor force, the 16 to 19 years age range has the highest percentage of unemployed individuals, with 13.3% or 59 of them being unemployed.
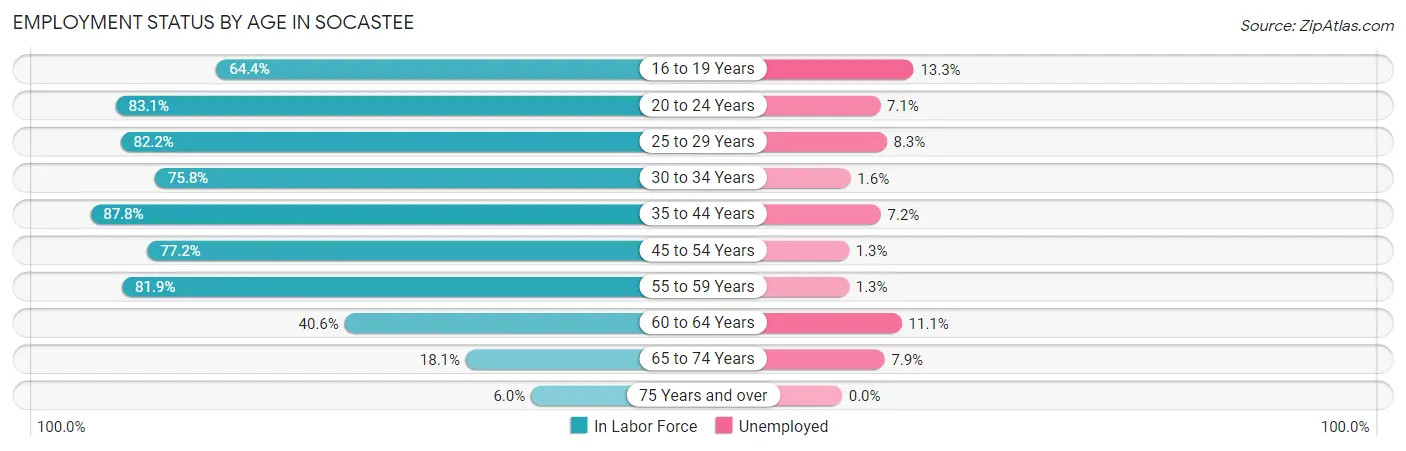
| Age Bracket | In Labor Force | Unemployed |
| 16 to 19 Years | 445 (64.4%) | 59 (13.3%) |
| 20 to 24 Years | 1,099 (83.1%) | 78 (7.1%) |
| 25 to 29 Years | 1,474 (82.2%) | 122 (8.3%) |
| 30 to 34 Years | 1,419 (75.8%) | 23 (1.6%) |
| 35 to 44 Years | 2,476 (87.8%) | 178 (7.2%) |
| 45 to 54 Years | 2,251 (77.2%) | 29 (1.3%) |
| 55 to 59 Years | 1,129 (81.9%) | 15 (1.3%) |
| 60 to 64 Years | 927 (40.6%) | 103 (11.1%) |
| 65 to 74 Years | 618 (18.1%) | 49 (7.9%) |
| 75 Years and over | 101 (6.0%) | 0 (0.0%) |
| Total | 11,938 (59.2%) | 657 (5.5%) |
Employment Status by Educational Attainment in Socastee
According to labor force statistics for Socastee, 74.1% of individuals (9,680) out of the total population between 25 and 64 years of age (13,063) are in the labor force, with 4.8% or 465 of them being unemployed. The group with the highest labor force participation rate are those with the educational attainment of bachelor's degree or higher, with 80.2% or 2,276 individuals in the labor force. Within the labor force, individuals with less than high school education have the highest percentage of unemployment, with 7.9% or 89 of them being unemployed.
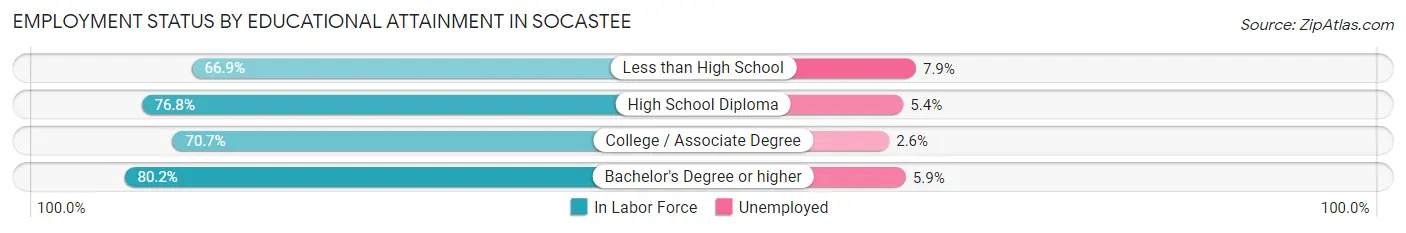
| Educational Attainment | In Labor Force | Unemployed |
| Less than High School | 1,127 (66.9%) | 133 (7.9%) |
| High School Diploma | 2,939 (76.8%) | 207 (5.4%) |
| College / Associate Degree | 3,333 (70.7%) | 123 (2.6%) |
| Bachelor's Degree or higher | 2,276 (80.2%) | 167 (5.9%) |
| Total | 9,680 (74.1%) | 627 (4.8%) |
Employment Occupations by Sex in Socastee
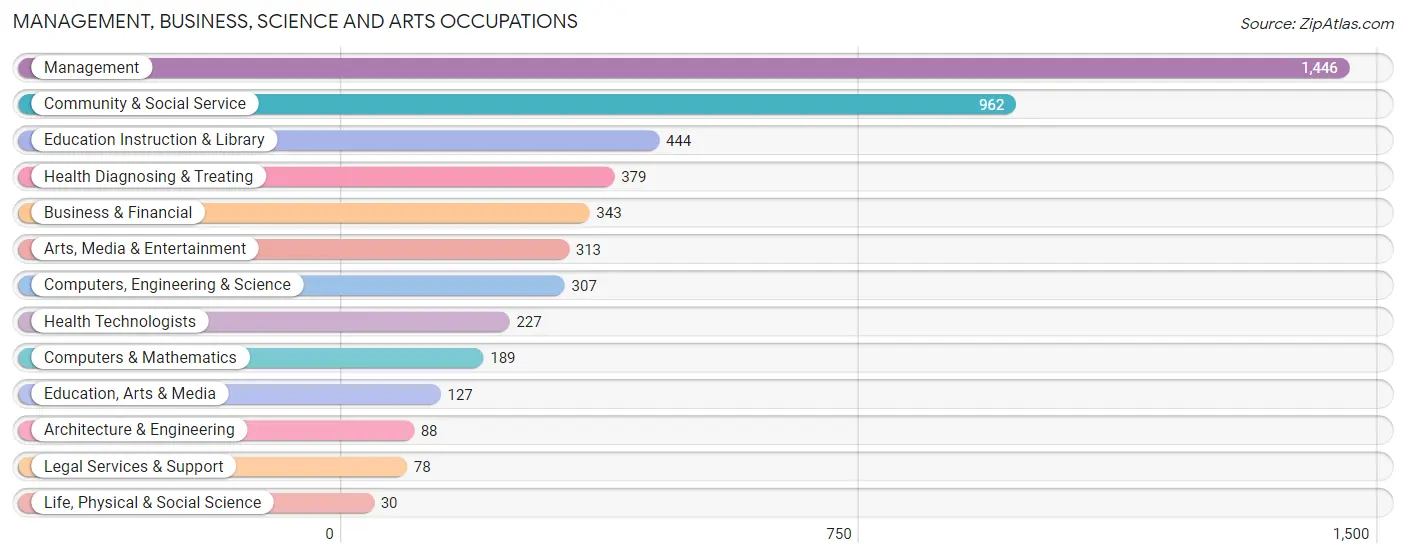
Management, Business, Science and Arts Occupations
The most common Management, Business, Science and Arts occupations in Socastee are Management (1,446 | 12.8%), Community & Social Service (962 | 8.5%), Education Instruction & Library (444 | 3.9%), Health Diagnosing & Treating (379 | 3.4%), and Business & Financial (343 | 3.0%).
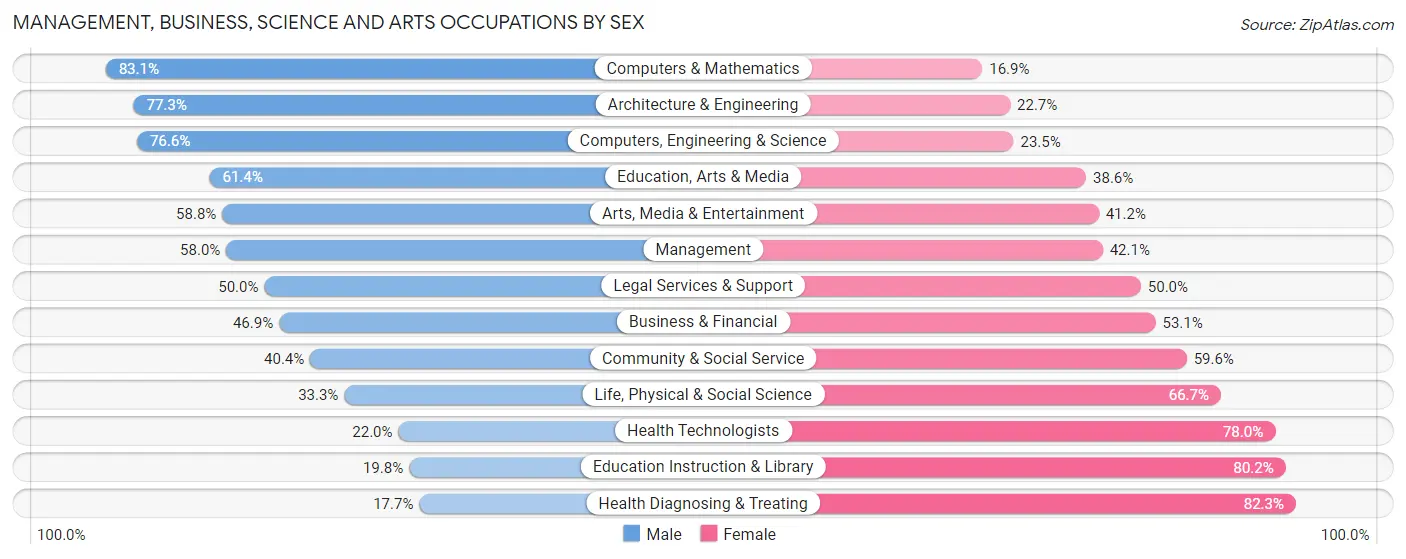
Management, Business, Science and Arts Occupations by Sex
Within the Management, Business, Science and Arts occupations in Socastee, the most male-oriented occupations are Computers & Mathematics (83.1%), Architecture & Engineering (77.3%), and Computers, Engineering & Science (76.5%), while the most female-oriented occupations are Health Diagnosing & Treating (82.3%), Education Instruction & Library (80.2%), and Health Technologists (78.0%).
| Occupation | Male | Female |
| Management | 838 (58.0%) | 608 (42.0%) |
| Business & Financial | 161 (46.9%) | 182 (53.1%) |
| Computers, Engineering & Science | 235 (76.5%) | 72 (23.4%) |
| Computers & Mathematics | 157 (83.1%) | 32 (16.9%) |
| Architecture & Engineering | 68 (77.3%) | 20 (22.7%) |
| Life, Physical & Social Science | 10 (33.3%) | 20 (66.7%) |
| Community & Social Service | 389 (40.4%) | 573 (59.6%) |
| Education, Arts & Media | 78 (61.4%) | 49 (38.6%) |
| Legal Services & Support | 39 (50.0%) | 39 (50.0%) |
| Education Instruction & Library | 88 (19.8%) | 356 (80.2%) |
| Arts, Media & Entertainment | 184 (58.8%) | 129 (41.2%) |
| Health Diagnosing & Treating | 67 (17.7%) | 312 (82.3%) |
| Health Technologists | 50 (22.0%) | 177 (78.0%) |
| Total (Category) | 1,690 (49.2%) | 1,747 (50.8%) |
| Total (Overall) | 6,314 (56.0%) | 4,953 (44.0%) |
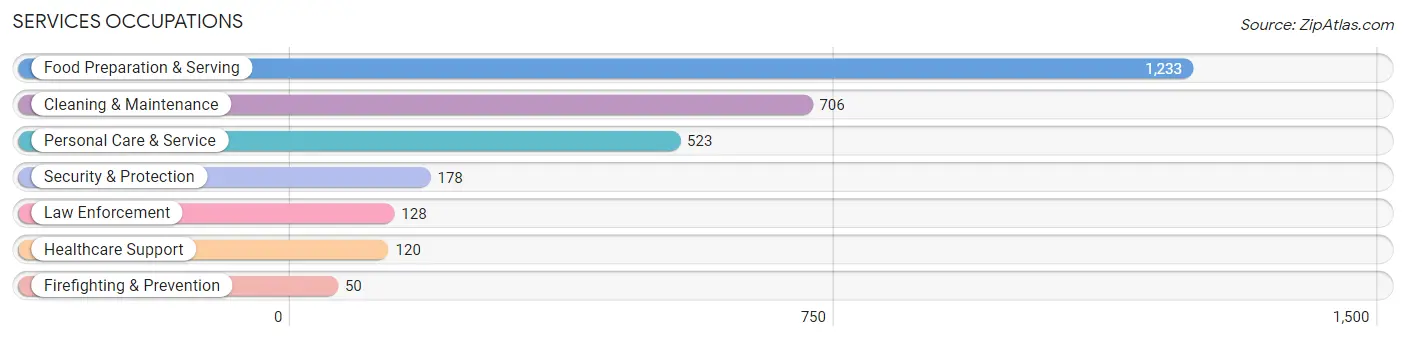
Services Occupations
The most common Services occupations in Socastee are Food Preparation & Serving (1,233 | 10.9%), Cleaning & Maintenance (706 | 6.3%), Personal Care & Service (523 | 4.6%), Security & Protection (178 | 1.6%), and Law Enforcement (128 | 1.1%).
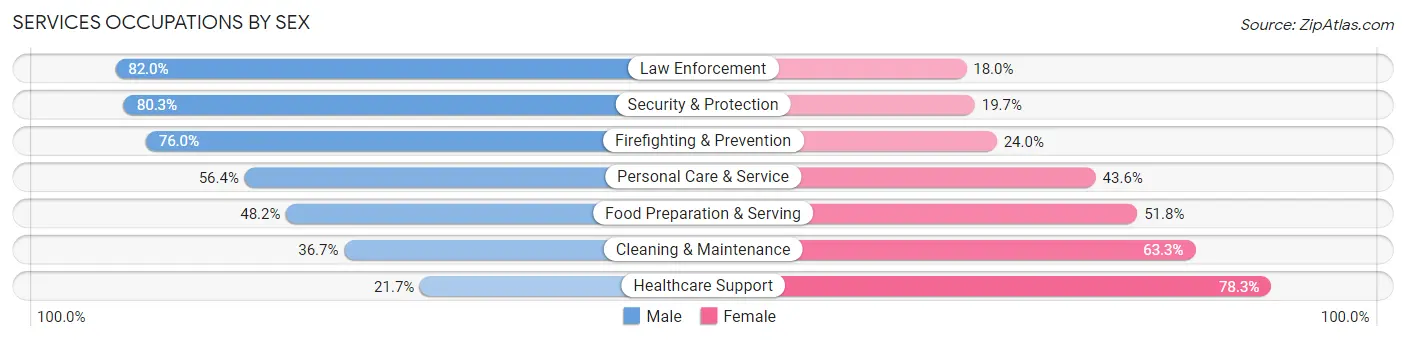
Services Occupations by Sex
Within the Services occupations in Socastee, the most male-oriented occupations are Law Enforcement (82.0%), Security & Protection (80.3%), and Firefighting & Prevention (76.0%), while the most female-oriented occupations are Healthcare Support (78.3%), Cleaning & Maintenance (63.3%), and Food Preparation & Serving (51.8%).
| Occupation | Male | Female |
| Healthcare Support | 26 (21.7%) | 94 (78.3%) |
| Security & Protection | 143 (80.3%) | 35 (19.7%) |
| Firefighting & Prevention | 38 (76.0%) | 12 (24.0%) |
| Law Enforcement | 105 (82.0%) | 23 (18.0%) |
| Food Preparation & Serving | 594 (48.2%) | 639 (51.8%) |
| Cleaning & Maintenance | 259 (36.7%) | 447 (63.3%) |
| Personal Care & Service | 295 (56.4%) | 228 (43.6%) |
| Total (Category) | 1,317 (47.7%) | 1,443 (52.3%) |
| Total (Overall) | 6,314 (56.0%) | 4,953 (44.0%) |
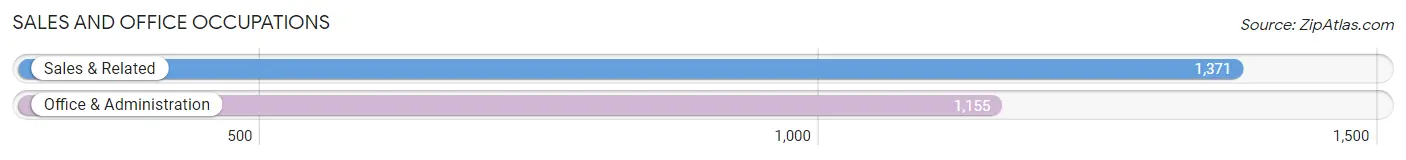
Sales and Office Occupations
The most common Sales and Office occupations in Socastee are Sales & Related (1,371 | 12.2%), and Office & Administration (1,155 | 10.2%).
Sales and Office Occupations by Sex
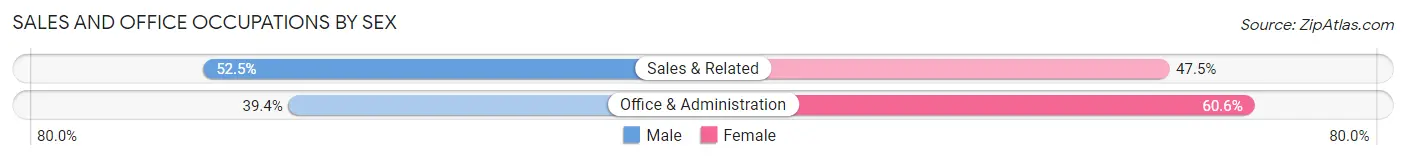
| Occupation | Male | Female |
| Sales & Related | 720 (52.5%) | 651 (47.5%) |
| Office & Administration | 455 (39.4%) | 700 (60.6%) |
| Total (Category) | 1,175 (46.5%) | 1,351 (53.5%) |
| Total (Overall) | 6,314 (56.0%) | 4,953 (44.0%) |
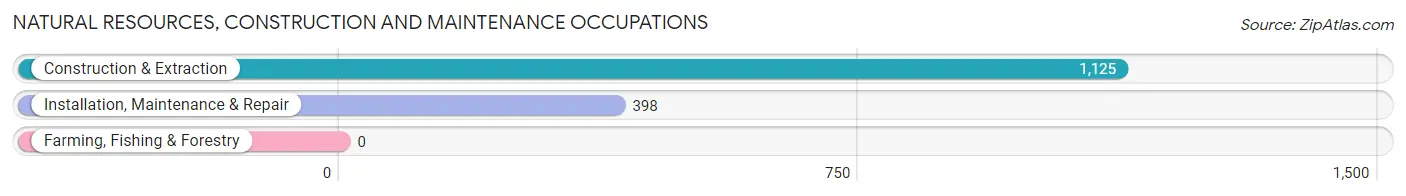
Natural Resources, Construction and Maintenance Occupations
The most common Natural Resources, Construction and Maintenance occupations in Socastee are Construction & Extraction (1,125 | 10.0%), and Installation, Maintenance & Repair (398 | 3.5%).
Natural Resources, Construction and Maintenance Occupations by Sex
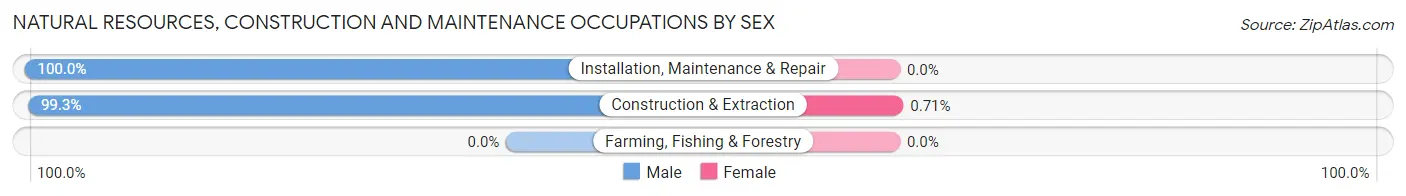
| Occupation | Male | Female |
| Farming, Fishing & Forestry | 0 (0.0%) | 0 (0.0%) |
| Construction & Extraction | 1,117 (99.3%) | 8 (0.7%) |
| Installation, Maintenance & Repair | 398 (100.0%) | 0 (0.0%) |
| Total (Category) | 1,515 (99.5%) | 8 (0.5%) |
| Total (Overall) | 6,314 (56.0%) | 4,953 (44.0%) |
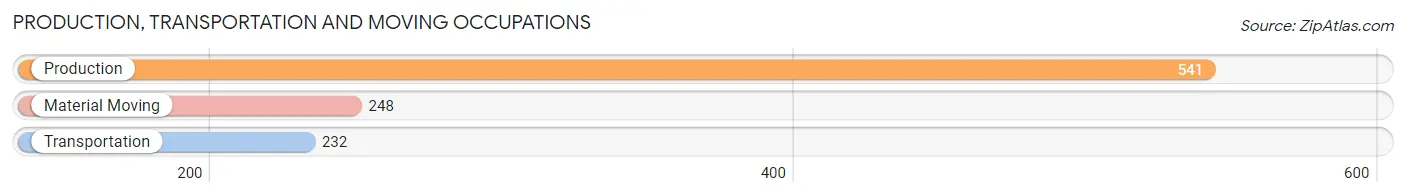
Production, Transportation and Moving Occupations
The most common Production, Transportation and Moving occupations in Socastee are Production (541 | 4.8%), Material Moving (248 | 2.2%), and Transportation (232 | 2.1%).
Production, Transportation and Moving Occupations by Sex
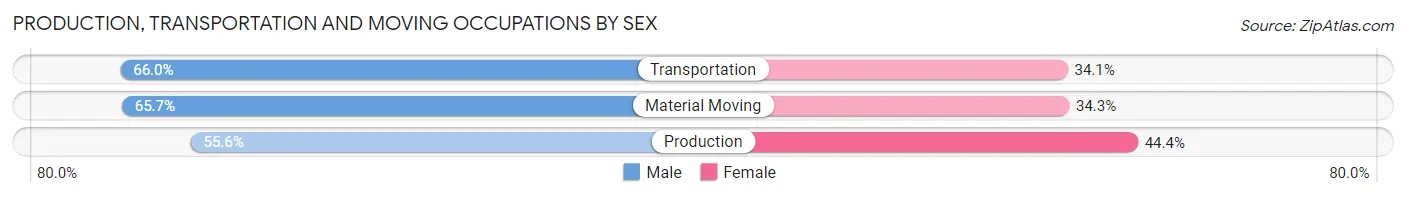
| Occupation | Male | Female |
| Production | 301 (55.6%) | 240 (44.4%) |
| Transportation | 153 (65.9%) | 79 (34.1%) |
| Material Moving | 163 (65.7%) | 85 (34.3%) |
| Total (Category) | 617 (60.4%) | 404 (39.6%) |
| Total (Overall) | 6,314 (56.0%) | 4,953 (44.0%) |
Employment Industries by Sex in Socastee
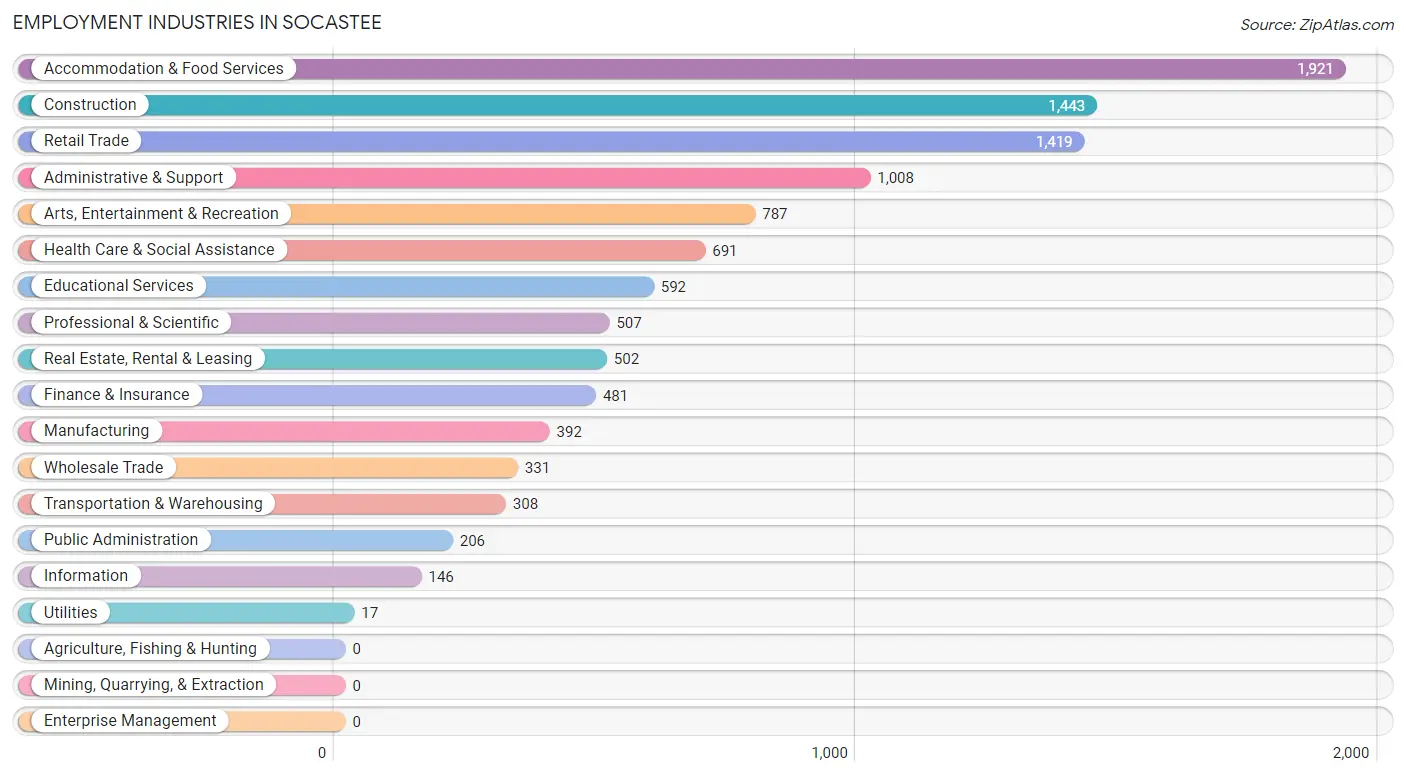
Employment Industries in Socastee
The major employment industries in Socastee include Accommodation & Food Services (1,921 | 17.1%), Construction (1,443 | 12.8%), Retail Trade (1,419 | 12.6%), Administrative & Support (1,008 | 8.9%), and Arts, Entertainment & Recreation (787 | 7.0%).
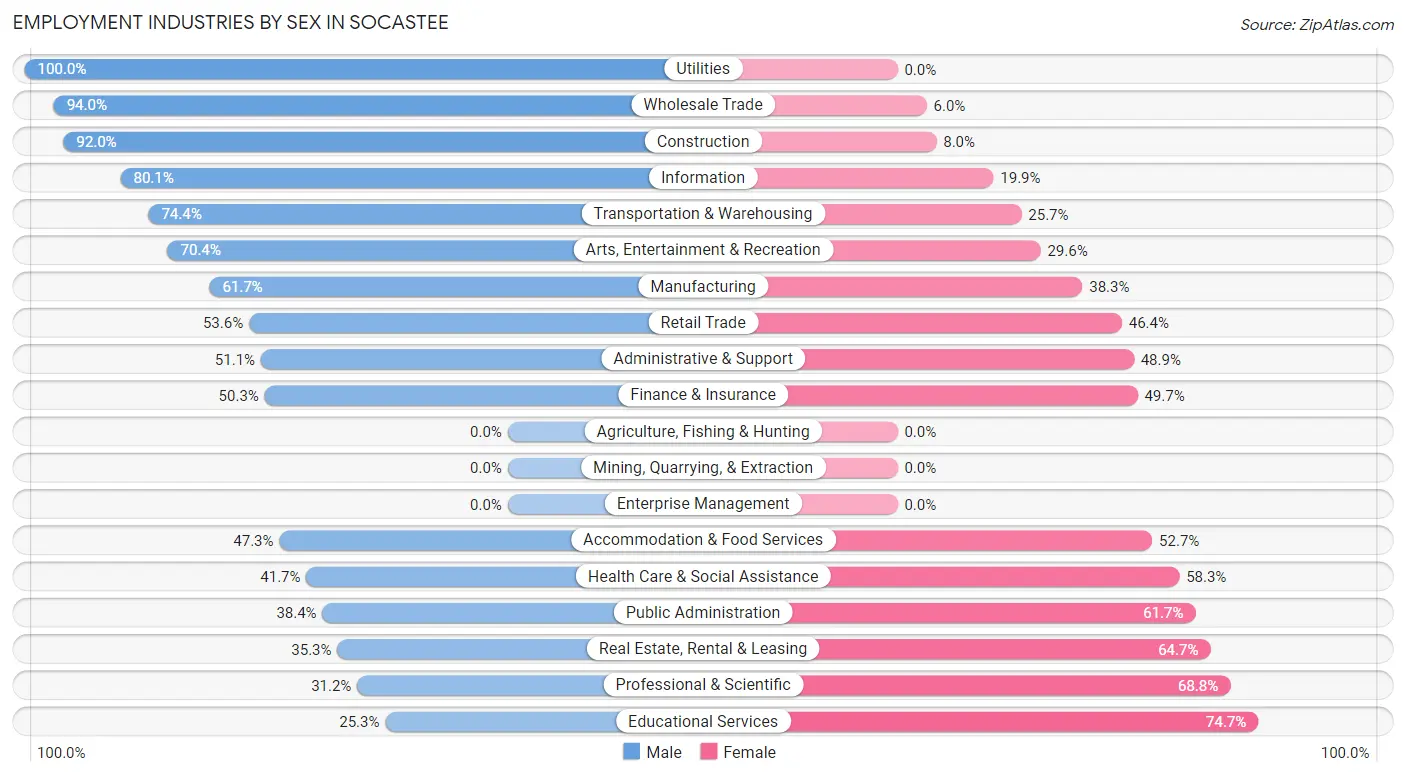
Employment Industries by Sex in Socastee
The Socastee industries that see more men than women are Utilities (100.0%), Wholesale Trade (94.0%), and Construction (92.0%), whereas the industries that tend to have a higher number of women are Educational Services (74.7%), Professional & Scientific (68.8%), and Real Estate, Rental & Leasing (64.7%).
| Industry | Male | Female |
| Agriculture, Fishing & Hunting | 0 (0.0%) | 0 (0.0%) |
| Mining, Quarrying, & Extraction | 0 (0.0%) | 0 (0.0%) |
| Construction | 1,327 (92.0%) | 116 (8.0%) |
| Manufacturing | 242 (61.7%) | 150 (38.3%) |
| Wholesale Trade | 311 (94.0%) | 20 (6.0%) |
| Retail Trade | 760 (53.6%) | 659 (46.4%) |
| Transportation & Warehousing | 229 (74.4%) | 79 (25.7%) |
| Utilities | 17 (100.0%) | 0 (0.0%) |
| Information | 117 (80.1%) | 29 (19.9%) |
| Finance & Insurance | 242 (50.3%) | 239 (49.7%) |
| Real Estate, Rental & Leasing | 177 (35.3%) | 325 (64.7%) |
| Professional & Scientific | 158 (31.2%) | 349 (68.8%) |
| Enterprise Management | 0 (0.0%) | 0 (0.0%) |
| Administrative & Support | 515 (51.1%) | 493 (48.9%) |
| Educational Services | 150 (25.3%) | 442 (74.7%) |
| Health Care & Social Assistance | 288 (41.7%) | 403 (58.3%) |
| Arts, Entertainment & Recreation | 554 (70.4%) | 233 (29.6%) |
| Accommodation & Food Services | 908 (47.3%) | 1,013 (52.7%) |
| Public Administration | 79 (38.4%) | 127 (61.7%) |
| Total | 6,314 (56.0%) | 4,953 (44.0%) |
Education in Socastee
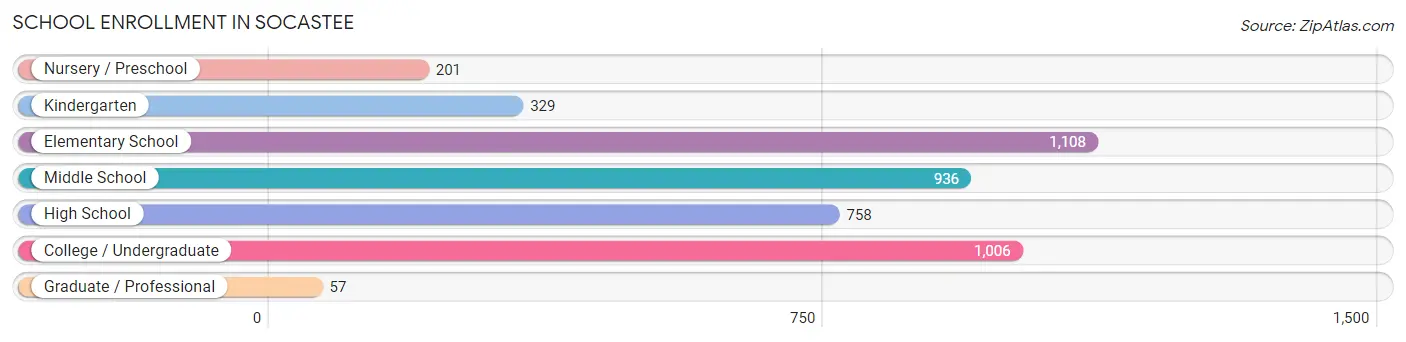
School Enrollment in Socastee
The most common levels of schooling among the 4,395 students in Socastee are elementary school (1,108 | 25.2%), college / undergraduate (1,006 | 22.9%), and middle school (936 | 21.3%).
| School Level | # Students | % Students |
| Nursery / Preschool | 201 | 4.6% |
| Kindergarten | 329 | 7.5% |
| Elementary School | 1,108 | 25.2% |
| Middle School | 936 | 21.3% |
| High School | 758 | 17.2% |
| College / Undergraduate | 1,006 | 22.9% |
| Graduate / Professional | 57 | 1.3% |
| Total | 4,395 | 100.0% |
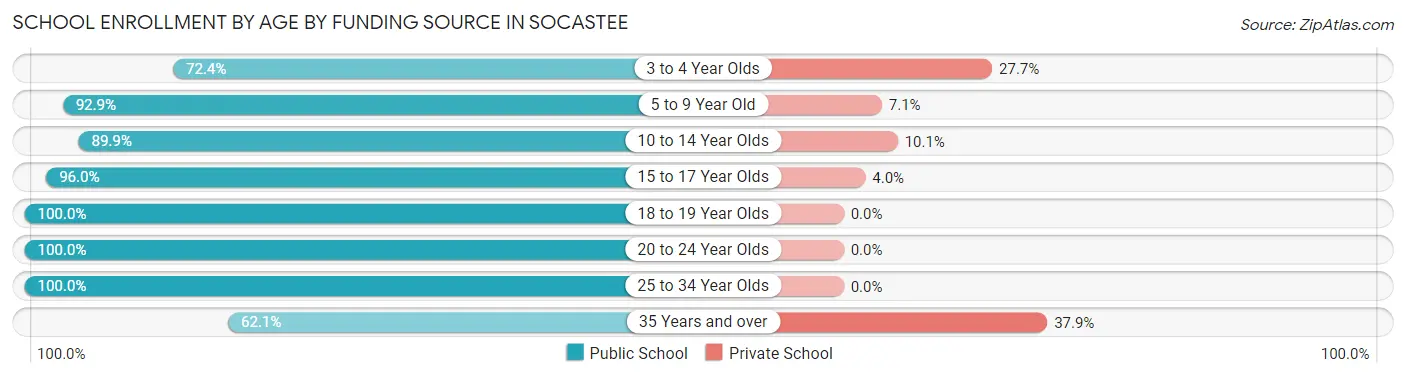
School Enrollment by Age by Funding Source in Socastee
Out of a total of 4,395 students who are enrolled in schools in Socastee, 418 (9.5%) attend a private institution, while the remaining 3,977 (90.5%) are enrolled in public schools. The age group of 35 years and over has the highest likelihood of being enrolled in private schools, with 127 (37.9% in the age bracket) enrolled. Conversely, the age group of 18 to 19 year olds has the lowest likelihood of being enrolled in a private school, with 85 (100.0% in the age bracket) attending a public institution.
| Age Bracket | Public School | Private School |
| 3 to 4 Year Olds | 157 (72.4%) | 60 (27.7%) |
| 5 to 9 Year Old | 1,268 (92.9%) | 97 (7.1%) |
| 10 to 14 Year Olds | 992 (89.9%) | 111 (10.1%) |
| 15 to 17 Year Olds | 547 (96.0%) | 23 (4.0%) |
| 18 to 19 Year Olds | 85 (100.0%) | 0 (0.0%) |
| 20 to 24 Year Olds | 268 (100.0%) | 0 (0.0%) |
| 25 to 34 Year Olds | 452 (100.0%) | 0 (0.0%) |
| 35 Years and over | 208 (62.1%) | 127 (37.9%) |
| Total | 3,977 (90.5%) | 418 (9.5%) |
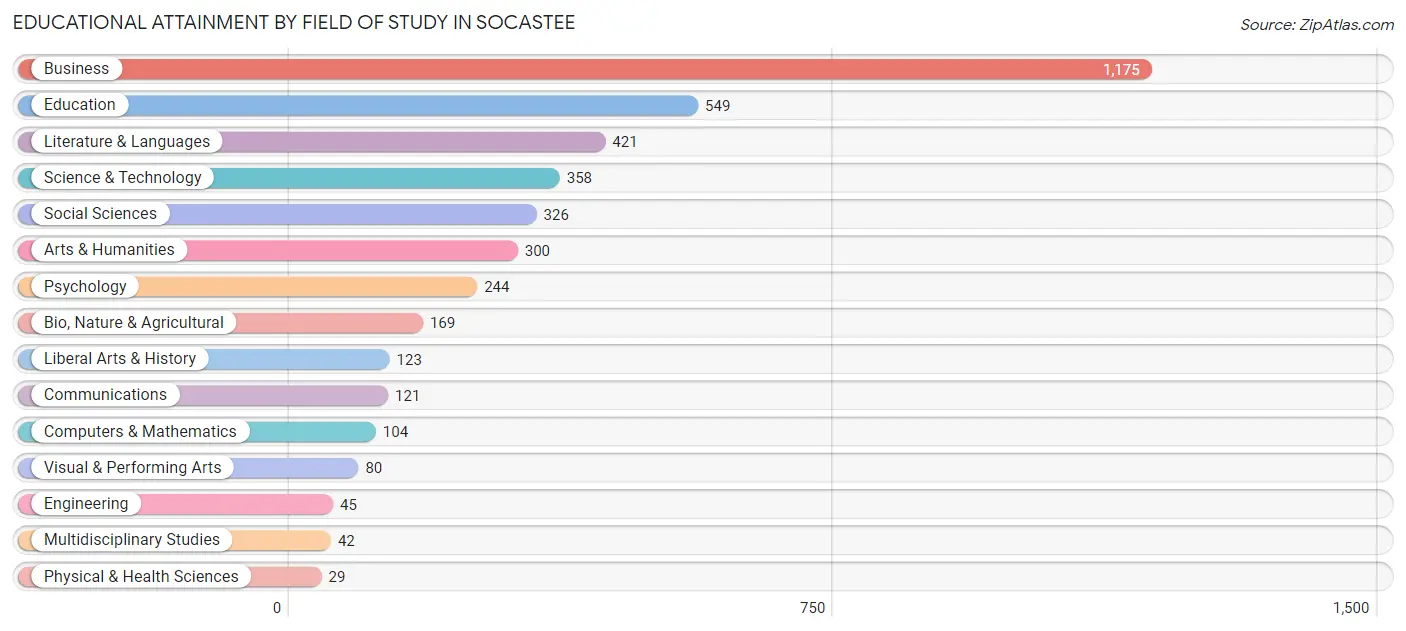
Educational Attainment by Field of Study in Socastee
Business (1,175 | 28.8%), education (549 | 13.4%), literature & languages (421 | 10.3%), science & technology (358 | 8.8%), and social sciences (326 | 8.0%) are the most common fields of study among 4,086 individuals in Socastee who have obtained a bachelor's degree or higher.
| Field of Study | # Graduates | % Graduates |
| Computers & Mathematics | 104 | 2.5% |
| Bio, Nature & Agricultural | 169 | 4.1% |
| Physical & Health Sciences | 29 | 0.7% |
| Psychology | 244 | 6.0% |
| Social Sciences | 326 | 8.0% |
| Engineering | 45 | 1.1% |
| Multidisciplinary Studies | 42 | 1.0% |
| Science & Technology | 358 | 8.8% |
| Business | 1,175 | 28.8% |
| Education | 549 | 13.4% |
| Literature & Languages | 421 | 10.3% |
| Liberal Arts & History | 123 | 3.0% |
| Visual & Performing Arts | 80 | 2.0% |
| Communications | 121 | 3.0% |
| Arts & Humanities | 300 | 7.3% |
| Total | 4,086 | 100.0% |
Transportation & Commute in Socastee
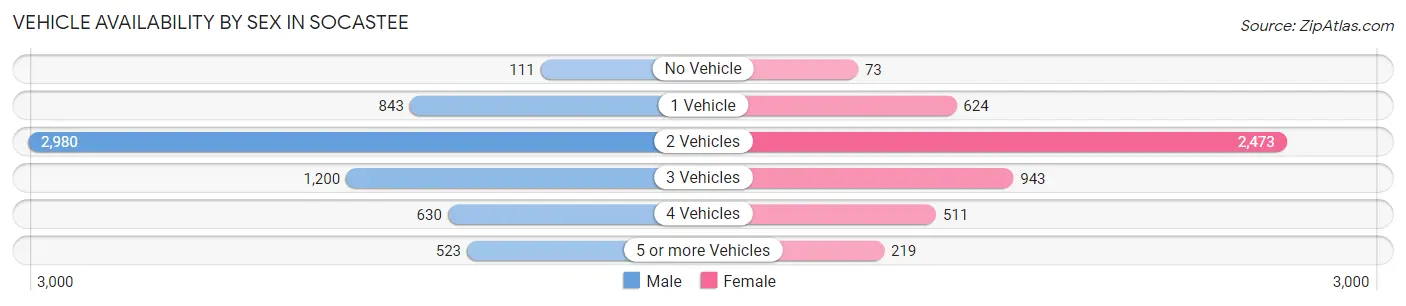
Vehicle Availability by Sex in Socastee
The most prevalent vehicle ownership categories in Socastee are males with 2 vehicles (2,980, accounting for 47.4%) and females with 2 vehicles (2,473, making up 61.5%).
| Vehicles Available | Male | Female |
| No Vehicle | 111 (1.8%) | 73 (1.5%) |
| 1 Vehicle | 843 (13.4%) | 624 (12.9%) |
| 2 Vehicles | 2,980 (47.4%) | 2,473 (51.1%) |
| 3 Vehicles | 1,200 (19.1%) | 943 (19.5%) |
| 4 Vehicles | 630 (10.0%) | 511 (10.5%) |
| 5 or more Vehicles | 523 (8.3%) | 219 (4.5%) |
| Total | 6,287 (100.0%) | 4,843 (100.0%) |
Commute Time in Socastee
The most frequently occuring commute durations in Socastee are 20 to 24 minutes (3,018 commuters, 29.1%), 15 to 19 minutes (2,553 commuters, 24.6%), and 30 to 34 minutes (1,400 commuters, 13.5%).
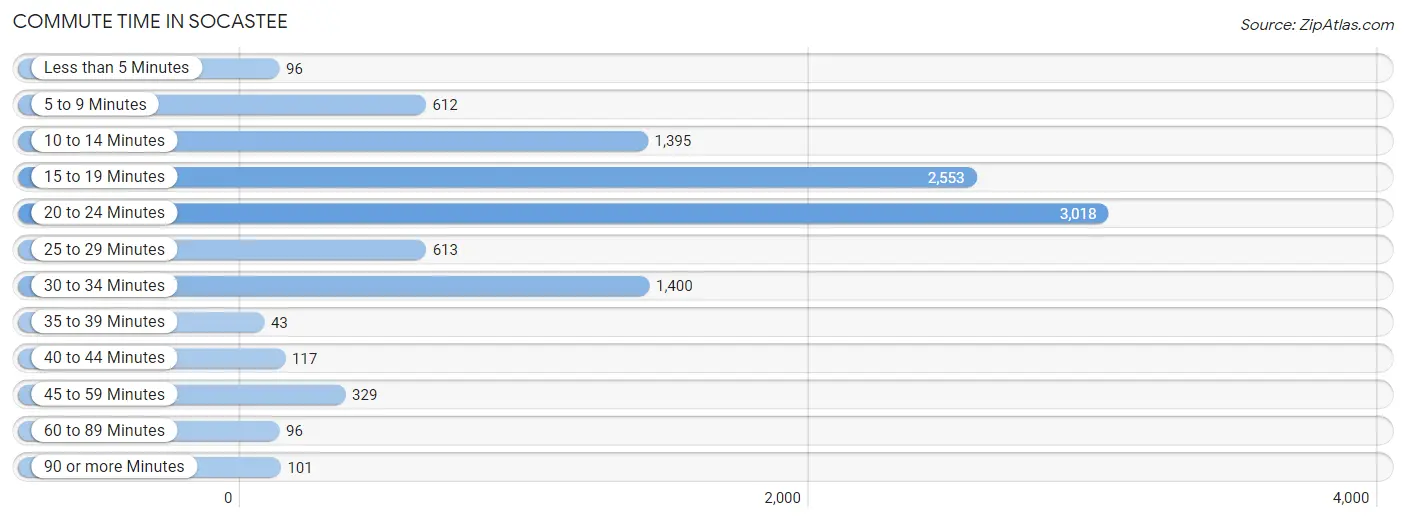
| Commute Time | # Commuters | % Commuters |
| Less than 5 Minutes | 96 | 0.9% |
| 5 to 9 Minutes | 612 | 5.9% |
| 10 to 14 Minutes | 1,395 | 13.5% |
| 15 to 19 Minutes | 2,553 | 24.6% |
| 20 to 24 Minutes | 3,018 | 29.1% |
| 25 to 29 Minutes | 613 | 5.9% |
| 30 to 34 Minutes | 1,400 | 13.5% |
| 35 to 39 Minutes | 43 | 0.4% |
| 40 to 44 Minutes | 117 | 1.1% |
| 45 to 59 Minutes | 329 | 3.2% |
| 60 to 89 Minutes | 96 | 0.9% |
| 90 or more Minutes | 101 | 1.0% |
Commute Time by Sex in Socastee
The most common commute times in Socastee are 15 to 19 minutes (1,691 commuters, 28.2%) for males and 20 to 24 minutes (1,522 commuters, 34.8%) for females.
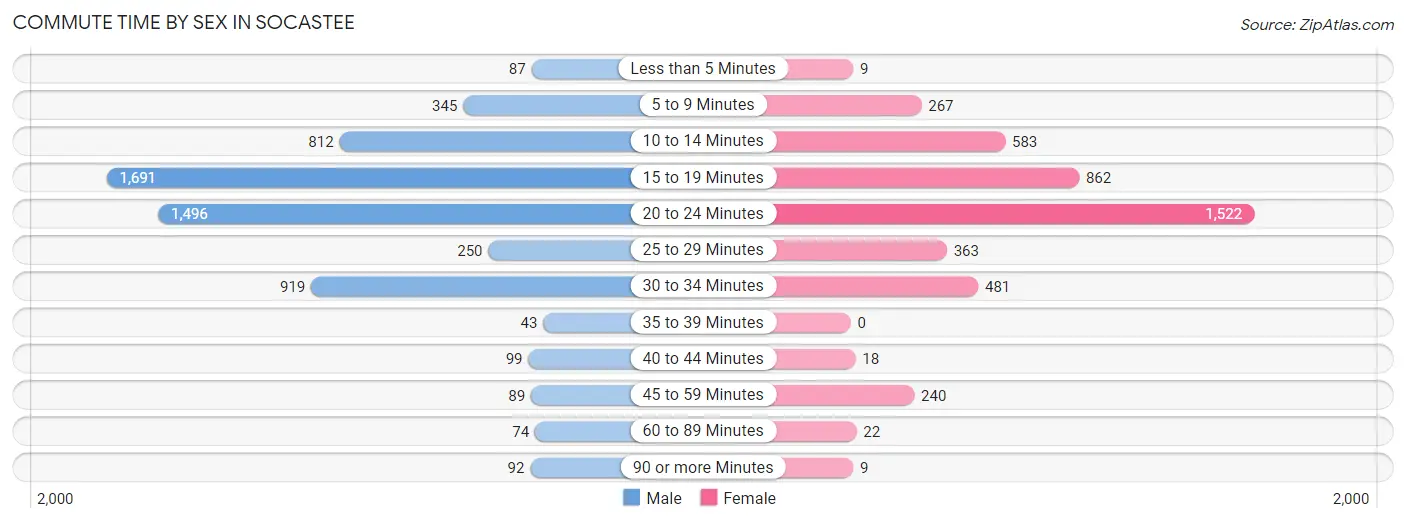
| Commute Time | Male | Female |
| Less than 5 Minutes | 87 (1.5%) | 9 (0.2%) |
| 5 to 9 Minutes | 345 (5.8%) | 267 (6.1%) |
| 10 to 14 Minutes | 812 (13.5%) | 583 (13.3%) |
| 15 to 19 Minutes | 1,691 (28.2%) | 862 (19.7%) |
| 20 to 24 Minutes | 1,496 (24.9%) | 1,522 (34.8%) |
| 25 to 29 Minutes | 250 (4.2%) | 363 (8.3%) |
| 30 to 34 Minutes | 919 (15.3%) | 481 (11.0%) |
| 35 to 39 Minutes | 43 (0.7%) | 0 (0.0%) |
| 40 to 44 Minutes | 99 (1.7%) | 18 (0.4%) |
| 45 to 59 Minutes | 89 (1.5%) | 240 (5.5%) |
| 60 to 89 Minutes | 74 (1.2%) | 22 (0.5%) |
| 90 or more Minutes | 92 (1.5%) | 9 (0.2%) |
Time of Departure to Work by Sex in Socastee
The most frequent times of departure to work in Socastee are 8:00 AM to 8:29 AM (1,098, 18.3%) for males and 12:00 PM to 3:59 PM (744, 17.0%) for females.
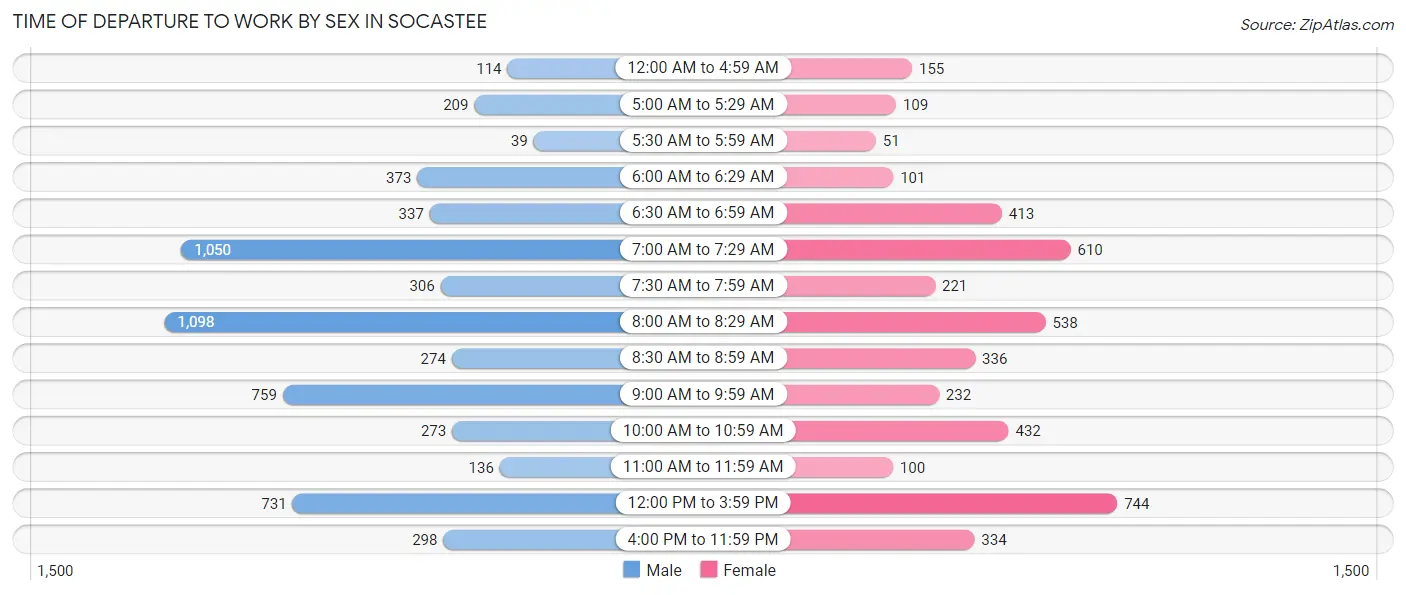
| Time of Departure | Male | Female |
| 12:00 AM to 4:59 AM | 114 (1.9%) | 155 (3.5%) |
| 5:00 AM to 5:29 AM | 209 (3.5%) | 109 (2.5%) |
| 5:30 AM to 5:59 AM | 39 (0.6%) | 51 (1.2%) |
| 6:00 AM to 6:29 AM | 373 (6.2%) | 101 (2.3%) |
| 6:30 AM to 6:59 AM | 337 (5.6%) | 413 (9.4%) |
| 7:00 AM to 7:29 AM | 1,050 (17.5%) | 610 (13.9%) |
| 7:30 AM to 7:59 AM | 306 (5.1%) | 221 (5.1%) |
| 8:00 AM to 8:29 AM | 1,098 (18.3%) | 538 (12.3%) |
| 8:30 AM to 8:59 AM | 274 (4.6%) | 336 (7.7%) |
| 9:00 AM to 9:59 AM | 759 (12.7%) | 232 (5.3%) |
| 10:00 AM to 10:59 AM | 273 (4.5%) | 432 (9.9%) |
| 11:00 AM to 11:59 AM | 136 (2.3%) | 100 (2.3%) |
| 12:00 PM to 3:59 PM | 731 (12.2%) | 744 (17.0%) |
| 4:00 PM to 11:59 PM | 298 (5.0%) | 334 (7.6%) |
| Total | 5,997 (100.0%) | 4,376 (100.0%) |
Housing Occupancy in Socastee
Occupancy by Ownership in Socastee
Of the total 8,818 dwellings in Socastee, owner-occupied units account for 5,858 (66.4%), while renter-occupied units make up 2,960 (33.6%).
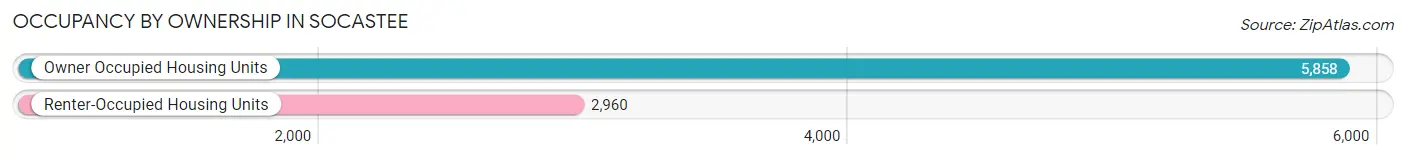
| Occupancy | # Housing Units | % Housing Units |
| Owner Occupied Housing Units | 5,858 | 66.4% |
| Renter-Occupied Housing Units | 2,960 | 33.6% |
| Total Occupied Housing Units | 8,818 | 100.0% |
Occupancy by Household Size in Socastee
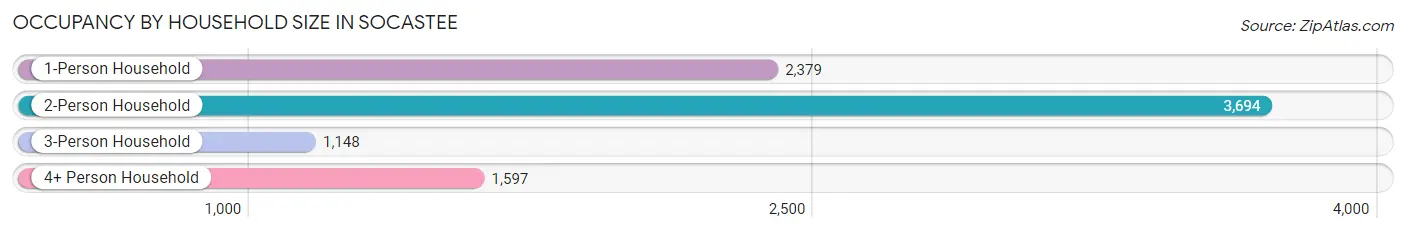
| Household Size | # Housing Units | % Housing Units |
| 1-Person Household | 2,379 | 27.0% |
| 2-Person Household | 3,694 | 41.9% |
| 3-Person Household | 1,148 | 13.0% |
| 4+ Person Household | 1,597 | 18.1% |
| Total Housing Units | 8,818 | 100.0% |
Occupancy by Ownership by Household Size in Socastee
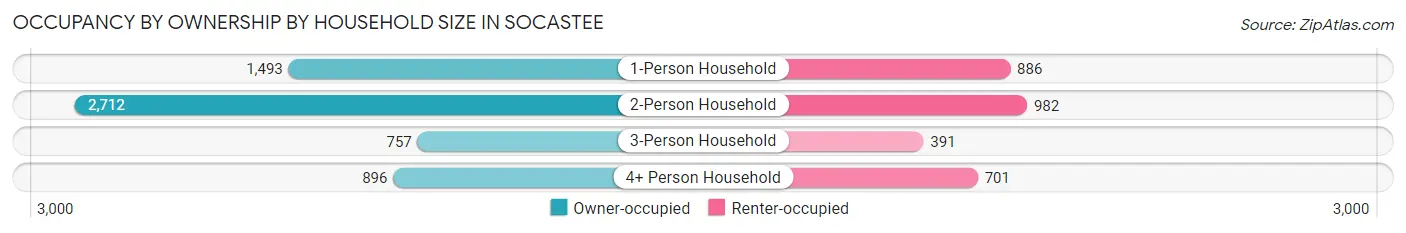
| Household Size | Owner-occupied | Renter-occupied |
| 1-Person Household | 1,493 (62.8%) | 886 (37.2%) |
| 2-Person Household | 2,712 (73.4%) | 982 (26.6%) |
| 3-Person Household | 757 (65.9%) | 391 (34.1%) |
| 4+ Person Household | 896 (56.1%) | 701 (43.9%) |
| Total Housing Units | 5,858 (66.4%) | 2,960 (33.6%) |
Occupancy by Educational Attainment in Socastee
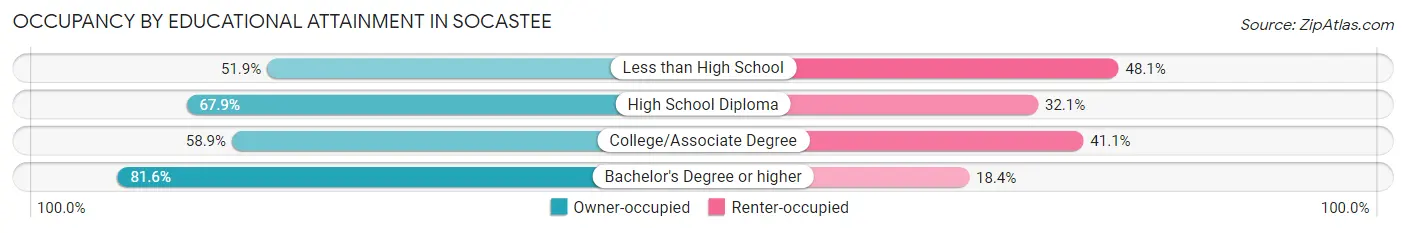
| Household Size | Owner-occupied | Renter-occupied |
| Less than High School | 404 (51.9%) | 374 (48.1%) |
| High School Diploma | 1,618 (67.9%) | 765 (32.1%) |
| College/Associate Degree | 2,024 (58.9%) | 1,412 (41.1%) |
| Bachelor's Degree or higher | 1,812 (81.6%) | 409 (18.4%) |
Occupancy by Age of Householder in Socastee
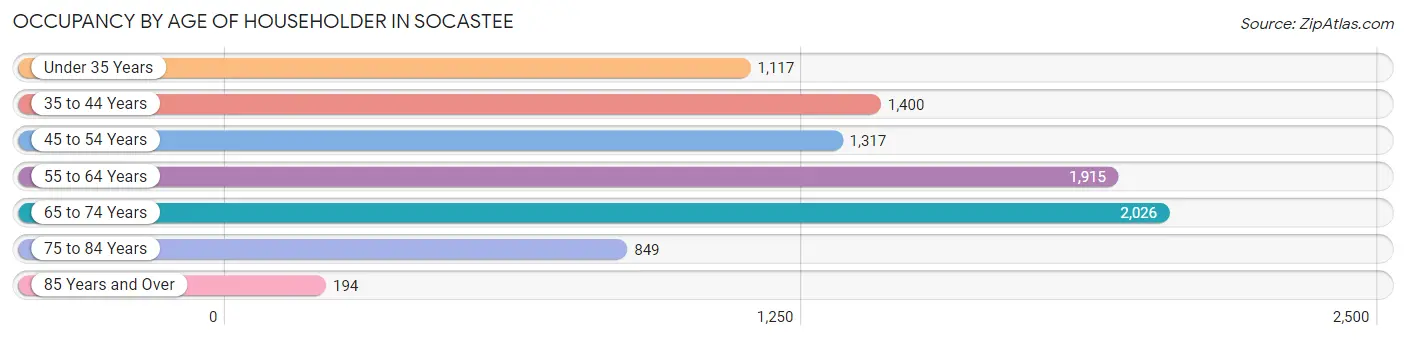
| Age Bracket | # Households | % Households |
| Under 35 Years | 1,117 | 12.7% |
| 35 to 44 Years | 1,400 | 15.9% |
| 45 to 54 Years | 1,317 | 14.9% |
| 55 to 64 Years | 1,915 | 21.7% |
| 65 to 74 Years | 2,026 | 23.0% |
| 75 to 84 Years | 849 | 9.6% |
| 85 Years and Over | 194 | 2.2% |
| Total | 8,818 | 100.0% |
Housing Finances in Socastee
Median Income by Occupancy in Socastee
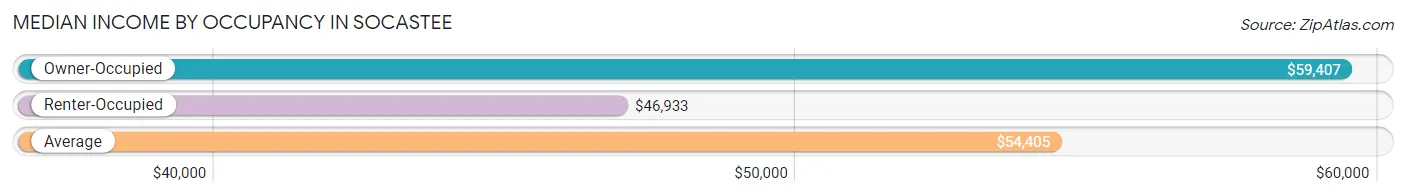
| Occupancy Type | # Households | Median Income |
| Owner-Occupied | 5,858 (66.4%) | $59,407 |
| Renter-Occupied | 2,960 (33.6%) | $46,933 |
| Average | 8,818 (100.0%) | $54,405 |
Occupancy by Householder Income Bracket in Socastee
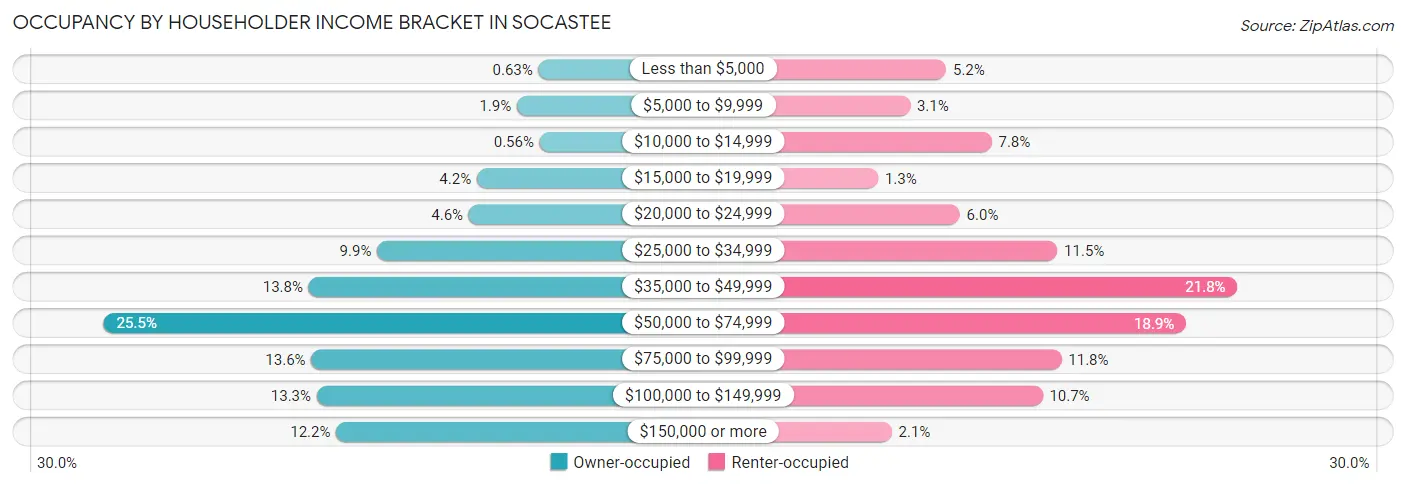
| Income Bracket | Owner-occupied | Renter-occupied |
| Less than $5,000 | 37 (0.6%) | 153 (5.2%) |
| $5,000 to $9,999 | 109 (1.9%) | 92 (3.1%) |
| $10,000 to $14,999 | 33 (0.6%) | 230 (7.8%) |
| $15,000 to $19,999 | 243 (4.2%) | 38 (1.3%) |
| $20,000 to $24,999 | 270 (4.6%) | 176 (5.9%) |
| $25,000 to $34,999 | 577 (9.9%) | 341 (11.5%) |
| $35,000 to $49,999 | 806 (13.8%) | 646 (21.8%) |
| $50,000 to $74,999 | 1,493 (25.5%) | 559 (18.9%) |
| $75,000 to $99,999 | 797 (13.6%) | 348 (11.8%) |
| $100,000 to $149,999 | 779 (13.3%) | 316 (10.7%) |
| $150,000 or more | 714 (12.2%) | 61 (2.1%) |
| Total | 5,858 (100.0%) | 2,960 (100.0%) |
Monthly Housing Cost Tiers in Socastee
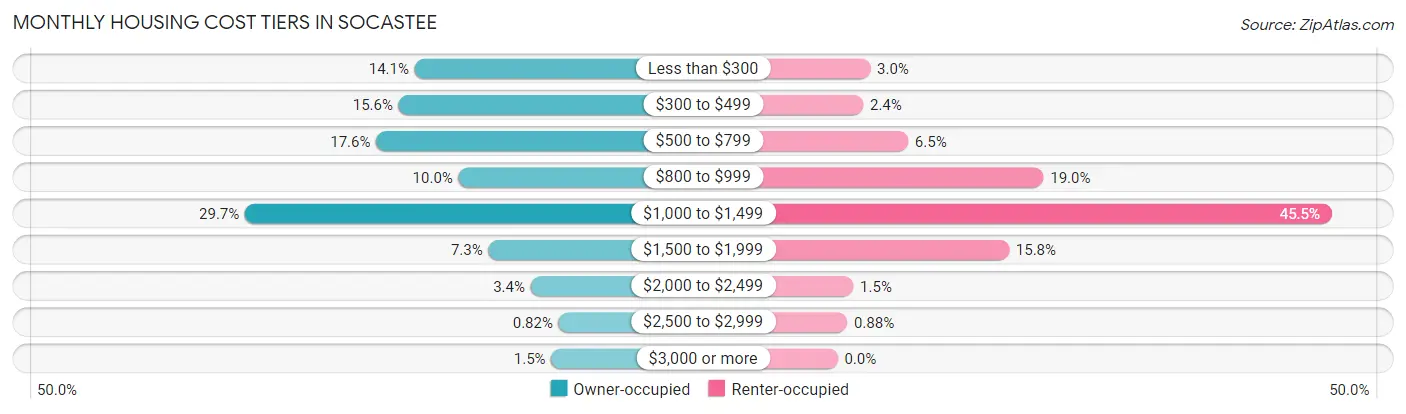
| Monthly Cost | Owner-occupied | Renter-occupied |
| Less than $300 | 825 (14.1%) | 89 (3.0%) |
| $300 to $499 | 911 (15.5%) | 70 (2.4%) |
| $500 to $799 | 1,032 (17.6%) | 192 (6.5%) |
| $800 to $999 | 588 (10.0%) | 561 (19.0%) |
| $1,000 to $1,499 | 1,740 (29.7%) | 1,347 (45.5%) |
| $1,500 to $1,999 | 427 (7.3%) | 467 (15.8%) |
| $2,000 to $2,499 | 199 (3.4%) | 43 (1.5%) |
| $2,500 to $2,999 | 48 (0.8%) | 26 (0.9%) |
| $3,000 or more | 88 (1.5%) | 0 (0.0%) |
| Total | 5,858 (100.0%) | 2,960 (100.0%) |
Physical Housing Characteristics in Socastee
Housing Structures in Socastee
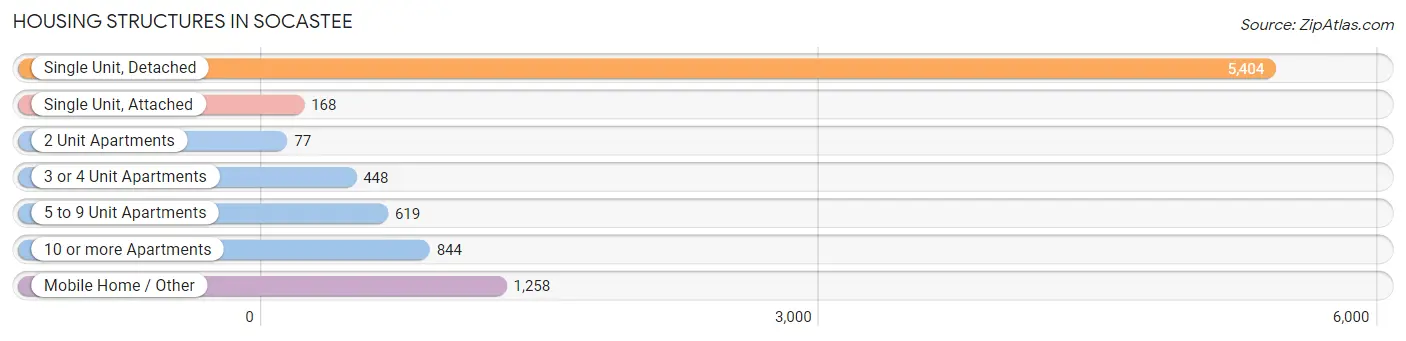
| Structure Type | # Housing Units | % Housing Units |
| Single Unit, Detached | 5,404 | 61.3% |
| Single Unit, Attached | 168 | 1.9% |
| 2 Unit Apartments | 77 | 0.9% |
| 3 or 4 Unit Apartments | 448 | 5.1% |
| 5 to 9 Unit Apartments | 619 | 7.0% |
| 10 or more Apartments | 844 | 9.6% |
| Mobile Home / Other | 1,258 | 14.3% |
| Total | 8,818 | 100.0% |
Housing Structures by Occupancy in Socastee
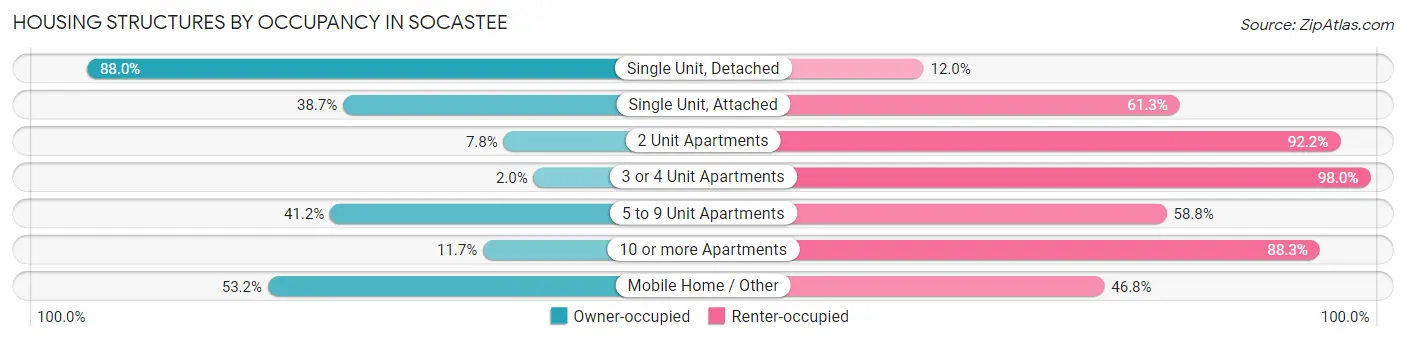
| Structure Type | Owner-occupied | Renter-occupied |
| Single Unit, Detached | 4,755 (88.0%) | 649 (12.0%) |
| Single Unit, Attached | 65 (38.7%) | 103 (61.3%) |
| 2 Unit Apartments | 6 (7.8%) | 71 (92.2%) |
| 3 or 4 Unit Apartments | 9 (2.0%) | 439 (98.0%) |
| 5 to 9 Unit Apartments | 255 (41.2%) | 364 (58.8%) |
| 10 or more Apartments | 99 (11.7%) | 745 (88.3%) |
| Mobile Home / Other | 669 (53.2%) | 589 (46.8%) |
| Total | 5,858 (66.4%) | 2,960 (33.6%) |
Housing Structures by Number of Rooms in Socastee
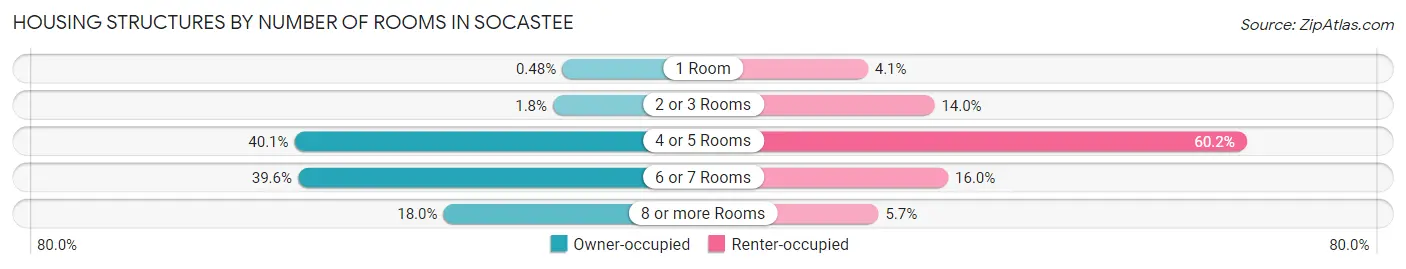
| Number of Rooms | Owner-occupied | Renter-occupied |
| 1 Room | 28 (0.5%) | 122 (4.1%) |
| 2 or 3 Rooms | 107 (1.8%) | 414 (14.0%) |
| 4 or 5 Rooms | 2,348 (40.1%) | 1,781 (60.2%) |
| 6 or 7 Rooms | 2,318 (39.6%) | 474 (16.0%) |
| 8 or more Rooms | 1,057 (18.0%) | 169 (5.7%) |
| Total | 5,858 (100.0%) | 2,960 (100.0%) |
Housing Structure by Heating Type in Socastee
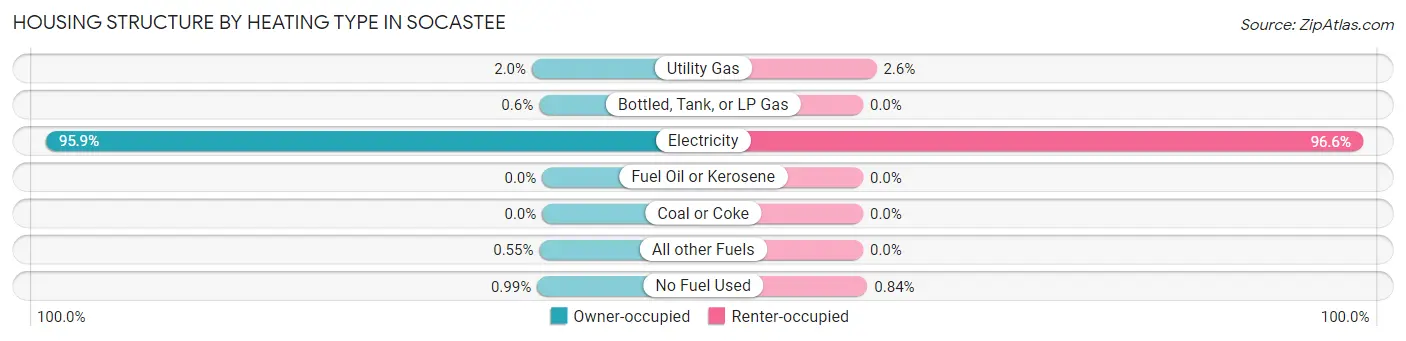
| Heating Type | Owner-occupied | Renter-occupied |
| Utility Gas | 116 (2.0%) | 77 (2.6%) |
| Bottled, Tank, or LP Gas | 35 (0.6%) | 0 (0.0%) |
| Electricity | 5,617 (95.9%) | 2,858 (96.6%) |
| Fuel Oil or Kerosene | 0 (0.0%) | 0 (0.0%) |
| Coal or Coke | 0 (0.0%) | 0 (0.0%) |
| All other Fuels | 32 (0.5%) | 0 (0.0%) |
| No Fuel Used | 58 (1.0%) | 25 (0.8%) |
| Total | 5,858 (100.0%) | 2,960 (100.0%) |
Household Vehicle Usage in Socastee
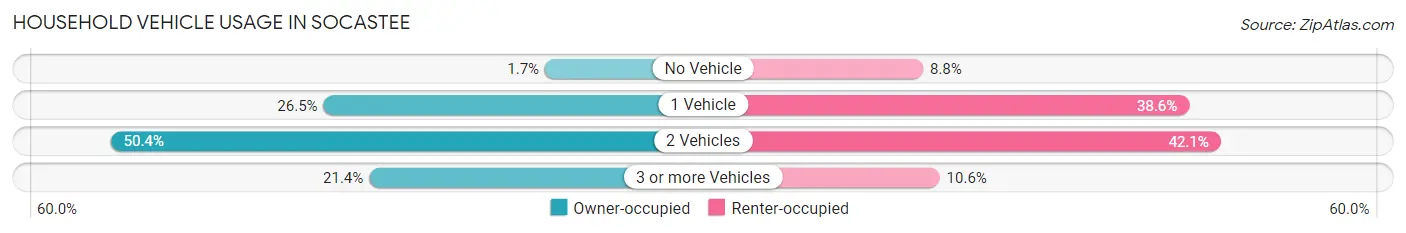
| Vehicles per Household | Owner-occupied | Renter-occupied |
| No Vehicle | 100 (1.7%) | 259 (8.7%) |
| 1 Vehicle | 1,554 (26.5%) | 1,141 (38.6%) |
| 2 Vehicles | 2,950 (50.4%) | 1,246 (42.1%) |
| 3 or more Vehicles | 1,254 (21.4%) | 314 (10.6%) |
| Total | 5,858 (100.0%) | 2,960 (100.0%) |
Real Estate & Mortgages in Socastee
Real Estate and Mortgage Overview in Socastee
| Characteristic | Without Mortgage | With Mortgage |
| Housing Units | 2,508 | 3,350 |
| Median Property Value | $193,400 | $205,700 |
| Median Household Income | $52,385 | $467 |
| Monthly Housing Costs | $394 | $88 |
| Real Estate Taxes | $521 | $54 |
Property Value by Mortgage Status in Socastee
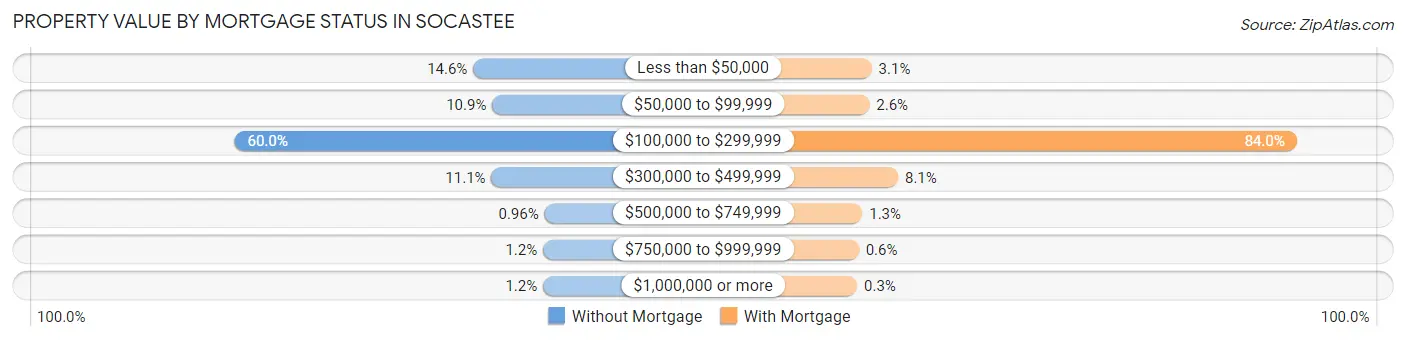
| Property Value | Without Mortgage | With Mortgage |
| Less than $50,000 | 365 (14.5%) | 103 (3.1%) |
| $50,000 to $99,999 | 274 (10.9%) | 88 (2.6%) |
| $100,000 to $299,999 | 1,505 (60.0%) | 2,815 (84.0%) |
| $300,000 to $499,999 | 278 (11.1%) | 271 (8.1%) |
| $500,000 to $749,999 | 24 (1.0%) | 43 (1.3%) |
| $750,000 to $999,999 | 31 (1.2%) | 20 (0.6%) |
| $1,000,000 or more | 31 (1.2%) | 10 (0.3%) |
| Total | 2,508 (100.0%) | 3,350 (100.0%) |
Household Income by Mortgage Status in Socastee
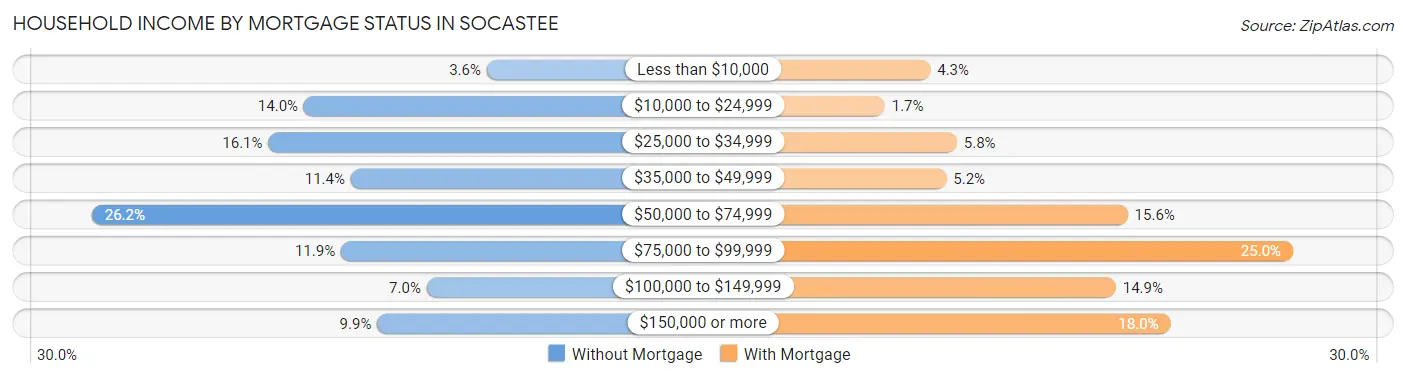
| Household Income | Without Mortgage | With Mortgage |
| Less than $10,000 | 90 (3.6%) | 143 (4.3%) |
| $10,000 to $24,999 | 352 (14.0%) | 56 (1.7%) |
| $25,000 to $34,999 | 403 (16.1%) | 194 (5.8%) |
| $35,000 to $49,999 | 285 (11.4%) | 174 (5.2%) |
| $50,000 to $74,999 | 656 (26.2%) | 521 (15.5%) |
| $75,000 to $99,999 | 299 (11.9%) | 837 (25.0%) |
| $100,000 to $149,999 | 176 (7.0%) | 498 (14.9%) |
| $150,000 or more | 247 (9.9%) | 603 (18.0%) |
| Total | 2,508 (100.0%) | 3,350 (100.0%) |
Property Value to Household Income Ratio in Socastee
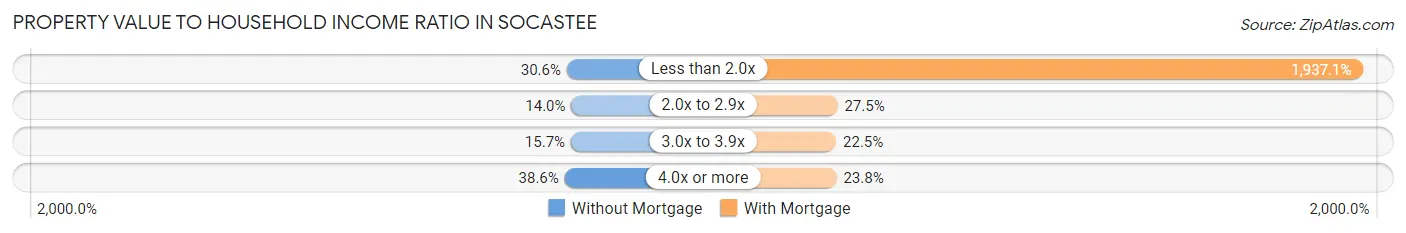
| Value-to-Income Ratio | Without Mortgage | With Mortgage |
| Less than 2.0x | 768 (30.6%) | 64,894 (1,937.1%) |
| 2.0x to 2.9x | 352 (14.0%) | 922 (27.5%) |
| 3.0x to 3.9x | 394 (15.7%) | 755 (22.5%) |
| 4.0x or more | 969 (38.6%) | 797 (23.8%) |
| Total | 2,508 (100.0%) | 3,350 (100.0%) |
Real Estate Taxes by Mortgage Status in Socastee
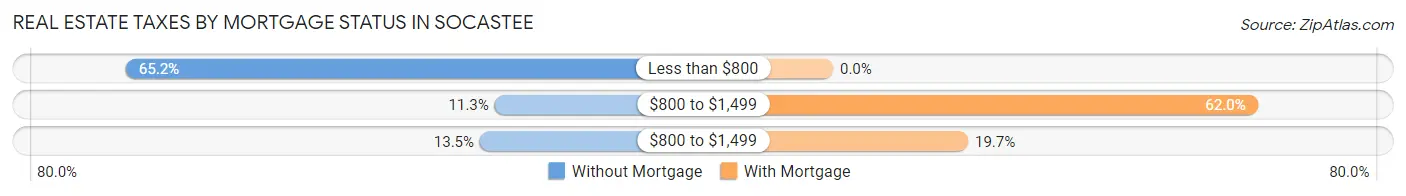
| Property Taxes | Without Mortgage | With Mortgage |
| Less than $800 | 1,635 (65.2%) | 0 (0.0%) |
| $800 to $1,499 | 284 (11.3%) | 2,078 (62.0%) |
| $800 to $1,499 | 338 (13.5%) | 661 (19.7%) |
| Total | 2,508 (100.0%) | 3,350 (100.0%) |
Health & Disability in Socastee
Health Insurance Coverage by Age in Socastee
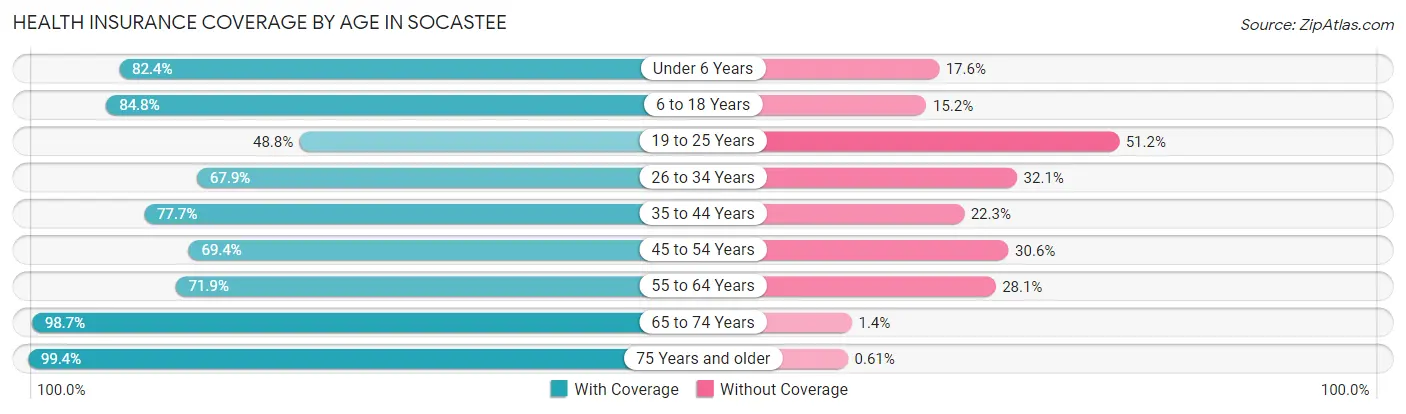
| Age Bracket | With Coverage | Without Coverage |
| Under 6 Years | 1,492 (82.4%) | 319 (17.6%) |
| 6 to 18 Years | 2,564 (84.8%) | 461 (15.2%) |
| 19 to 25 Years | 995 (48.8%) | 1,043 (51.2%) |
| 26 to 34 Years | 2,105 (67.9%) | 997 (32.1%) |
| 35 to 44 Years | 2,178 (77.7%) | 624 (22.3%) |
| 45 to 54 Years | 2,025 (69.4%) | 891 (30.6%) |
| 55 to 64 Years | 2,617 (71.9%) | 1,025 (28.1%) |
| 65 to 74 Years | 3,357 (98.7%) | 46 (1.3%) |
| 75 Years and older | 1,621 (99.4%) | 10 (0.6%) |
| Total | 18,954 (77.8%) | 5,416 (22.2%) |
Health Insurance Coverage by Citizenship Status in Socastee
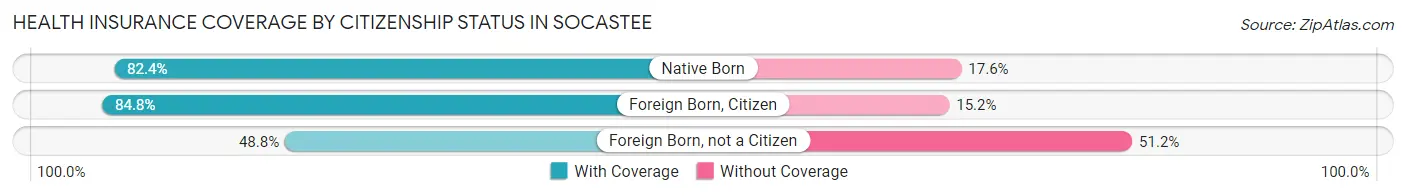
| Citizenship Status | With Coverage | Without Coverage |
| Native Born | 1,492 (82.4%) | 319 (17.6%) |
| Foreign Born, Citizen | 2,564 (84.8%) | 461 (15.2%) |
| Foreign Born, not a Citizen | 995 (48.8%) | 1,043 (51.2%) |
Health Insurance Coverage by Household Income in Socastee
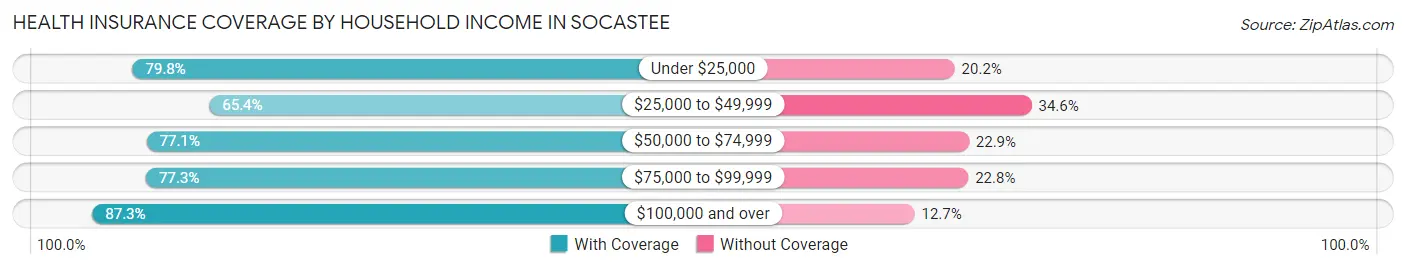
| Household Income | With Coverage | Without Coverage |
| Under $25,000 | 1,883 (79.8%) | 477 (20.2%) |
| $25,000 to $49,999 | 3,780 (65.4%) | 2,002 (34.6%) |
| $50,000 to $74,999 | 3,815 (77.1%) | 1,131 (22.9%) |
| $75,000 to $99,999 | 2,880 (77.2%) | 848 (22.8%) |
| $100,000 and over | 6,587 (87.3%) | 958 (12.7%) |
Public vs Private Health Insurance Coverage by Age in Socastee
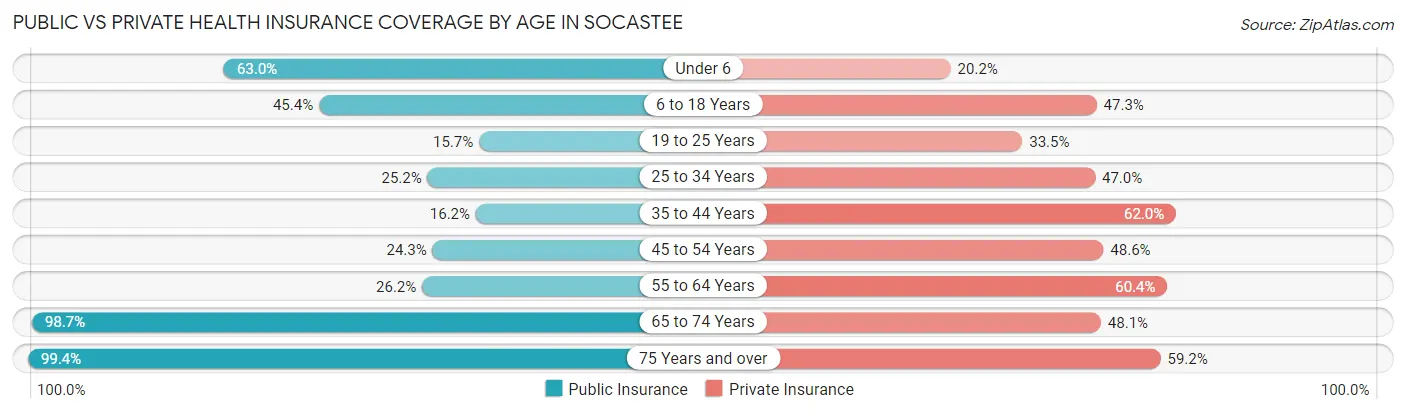
| Age Bracket | Public Insurance | Private Insurance |
| Under 6 | 1,141 (63.0%) | 366 (20.2%) |
| 6 to 18 Years | 1,372 (45.4%) | 1,431 (47.3%) |
| 19 to 25 Years | 319 (15.7%) | 683 (33.5%) |
| 25 to 34 Years | 782 (25.2%) | 1,458 (47.0%) |
| 35 to 44 Years | 455 (16.2%) | 1,738 (62.0%) |
| 45 to 54 Years | 708 (24.3%) | 1,416 (48.6%) |
| 55 to 64 Years | 955 (26.2%) | 2,200 (60.4%) |
| 65 to 74 Years | 3,357 (98.7%) | 1,637 (48.1%) |
| 75 Years and over | 1,621 (99.4%) | 965 (59.2%) |
| Total | 10,710 (44.0%) | 11,894 (48.8%) |
Disability Status by Sex by Age in Socastee
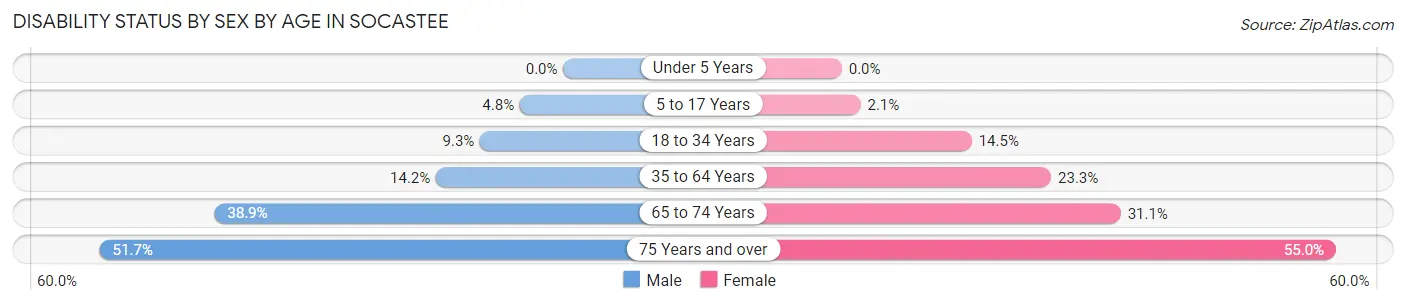
| Age Bracket | Male | Female |
| Under 5 Years | 0 (0.0%) | 0 (0.0%) |
| 5 to 17 Years | 73 (4.8%) | 36 (2.1%) |
| 18 to 34 Years | 264 (9.3%) | 346 (14.5%) |
| 35 to 64 Years | 662 (14.2%) | 1,093 (23.3%) |
| 65 to 74 Years | 633 (38.9%) | 551 (31.1%) |
| 75 Years and over | 375 (51.6%) | 498 (55.0%) |
Disability Class by Sex by Age in Socastee
Disability Class: Hearing Difficulty
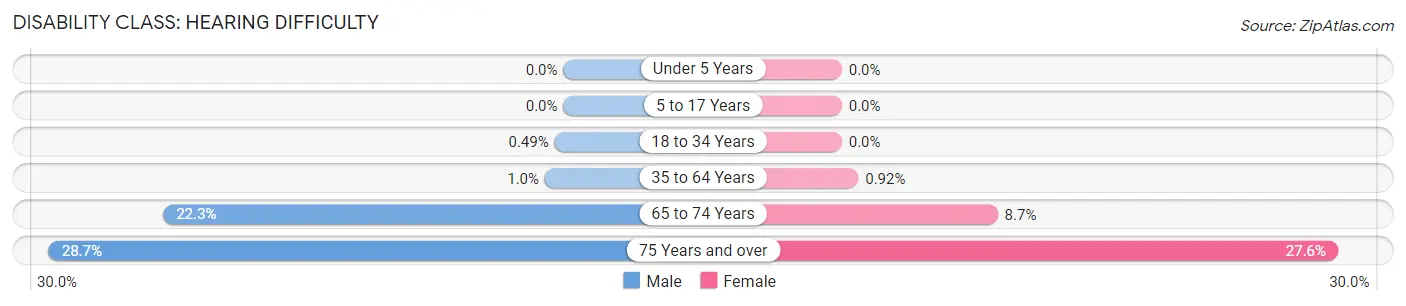
| Age Bracket | Male | Female |
| Under 5 Years | 0 (0.0%) | 0 (0.0%) |
| 5 to 17 Years | 0 (0.0%) | 0 (0.0%) |
| 18 to 34 Years | 14 (0.5%) | 0 (0.0%) |
| 35 to 64 Years | 48 (1.0%) | 43 (0.9%) |
| 65 to 74 Years | 363 (22.3%) | 154 (8.7%) |
| 75 Years and over | 208 (28.6%) | 250 (27.6%) |
Disability Class: Vision Difficulty
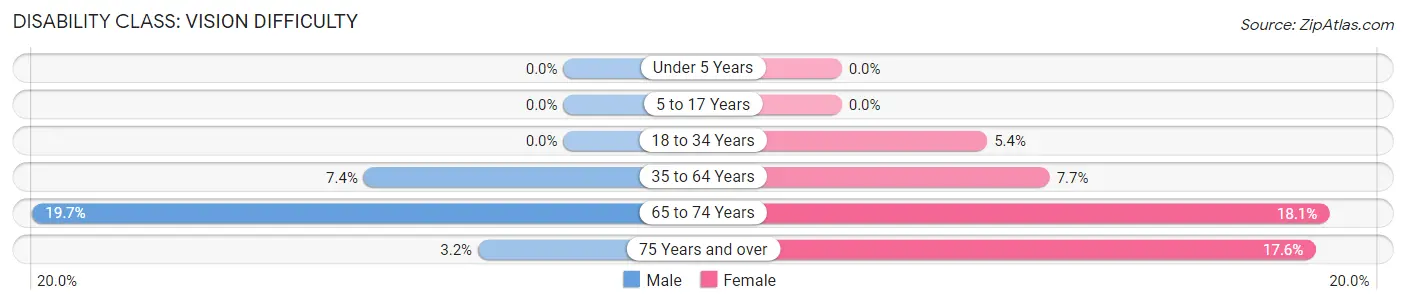
| Age Bracket | Male | Female |
| Under 5 Years | 0 (0.0%) | 0 (0.0%) |
| 5 to 17 Years | 0 (0.0%) | 0 (0.0%) |
| 18 to 34 Years | 0 (0.0%) | 129 (5.4%) |
| 35 to 64 Years | 346 (7.4%) | 362 (7.7%) |
| 65 to 74 Years | 321 (19.7%) | 321 (18.1%) |
| 75 Years and over | 23 (3.2%) | 159 (17.6%) |
Disability Class: Cognitive Difficulty
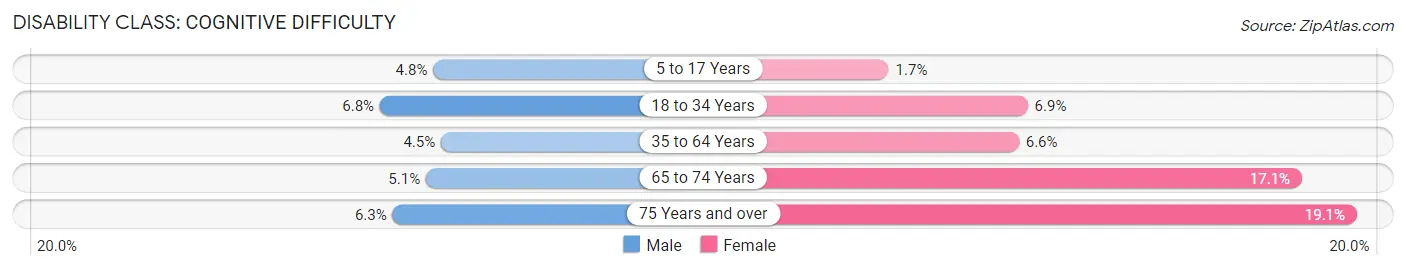
| Age Bracket | Male | Female |
| 5 to 17 Years | 73 (4.8%) | 30 (1.7%) |
| 18 to 34 Years | 194 (6.8%) | 165 (6.9%) |
| 35 to 64 Years | 212 (4.5%) | 308 (6.6%) |
| 65 to 74 Years | 83 (5.1%) | 303 (17.1%) |
| 75 Years and over | 46 (6.3%) | 173 (19.1%) |
Disability Class: Ambulatory Difficulty
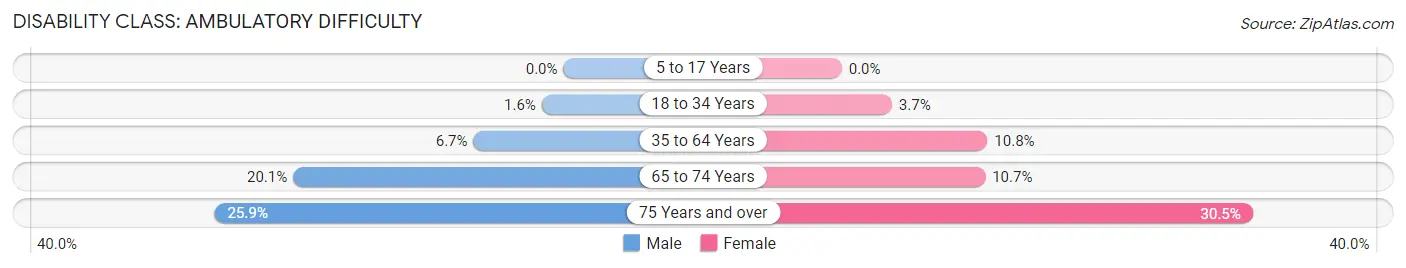
| Age Bracket | Male | Female |
| 5 to 17 Years | 0 (0.0%) | 0 (0.0%) |
| 18 to 34 Years | 46 (1.6%) | 89 (3.7%) |
| 35 to 64 Years | 312 (6.7%) | 507 (10.8%) |
| 65 to 74 Years | 327 (20.1%) | 189 (10.6%) |
| 75 Years and over | 188 (25.9%) | 276 (30.5%) |
Disability Class: Self-Care Difficulty
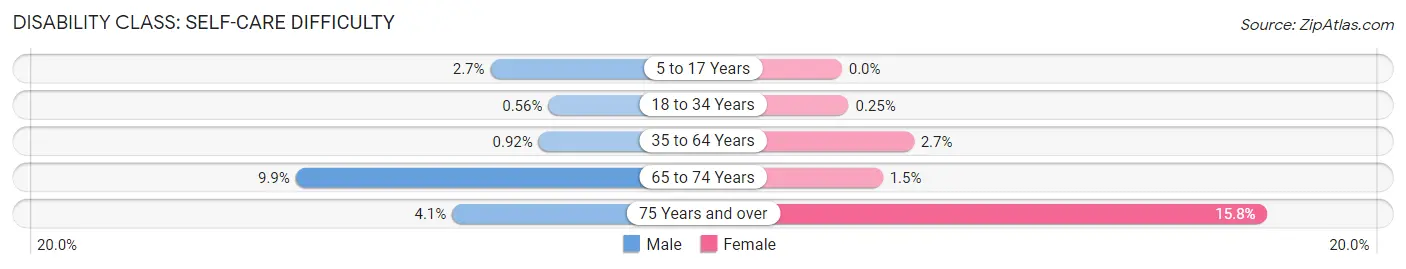
| Age Bracket | Male | Female |
| 5 to 17 Years | 41 (2.7%) | 0 (0.0%) |
| 18 to 34 Years | 16 (0.6%) | 6 (0.3%) |
| 35 to 64 Years | 43 (0.9%) | 125 (2.7%) |
| 65 to 74 Years | 162 (9.9%) | 27 (1.5%) |
| 75 Years and over | 30 (4.1%) | 143 (15.8%) |
Technology Access in Socastee
Computing Device Access in Socastee
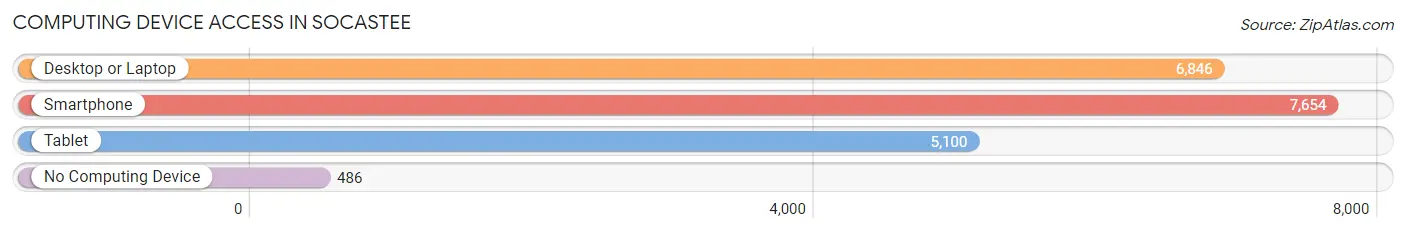
| Device Type | # Households | % Households |
| Desktop or Laptop | 6,846 | 77.6% |
| Smartphone | 7,654 | 86.8% |
| Tablet | 5,100 | 57.8% |
| No Computing Device | 486 | 5.5% |
| Total | 8,818 | 100.0% |
Internet Access in Socastee
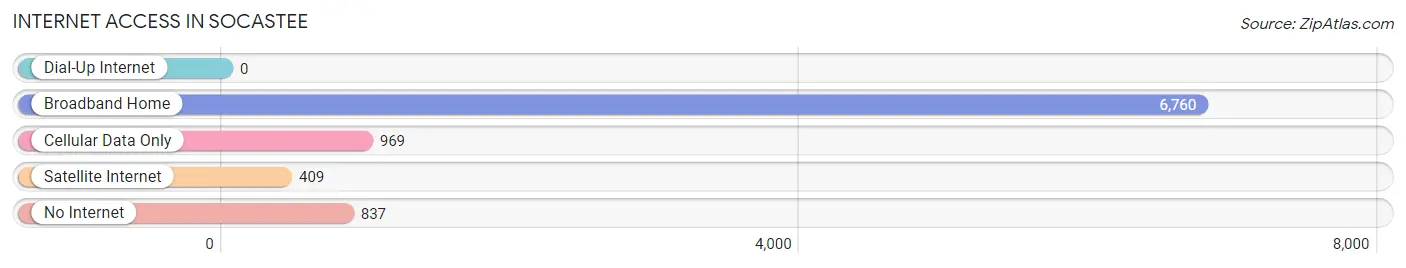
| Internet Type | # Households | % Households |
| Dial-Up Internet | 0 | 0.0% |
| Broadband Home | 6,760 | 76.7% |
| Cellular Data Only | 969 | 11.0% |
| Satellite Internet | 409 | 4.6% |
| No Internet | 837 | 9.5% |
| Total | 8,818 | 100.0% |
Socastee Summary
Socastee is a small unincorporated community located in Horry County, South Carolina. It is situated along the Intracoastal Waterway, just south of Myrtle Beach. The area is known for its beautiful beaches, golf courses, and other attractions.
History
The area now known as Socastee was first settled in the late 1700s by a group of settlers from the British Isles. The settlers named the area Socastee, which is derived from the Native American word for “place of the wild geese.” The area was primarily used for farming and fishing until the early 1900s, when the area began to be developed for tourism.
In the 1920s, the area was developed as a resort destination, with the construction of several hotels and golf courses. The area was also home to a number of amusement parks, including the famous Pavilion Amusement Park. The area continued to grow in popularity throughout the 20th century, and by the late 1990s, it had become one of the most popular tourist destinations in the state.
Geography
Socastee is located in Horry County, South Carolina, along the Intracoastal Waterway. The area is bordered by the Atlantic Ocean to the east, the Waccamaw River to the west, and the Waccamaw National Wildlife Refuge to the south. The area is known for its beautiful beaches, golf courses, and other attractions.
Economy
The economy of Socastee is largely driven by tourism. The area is home to a number of hotels, restaurants, and other attractions that cater to tourists. The area is also home to a number of golf courses, which attract golfers from all over the world. In addition, the area is home to a number of manufacturing and industrial businesses, as well as a number of retail stores.
Demographics
As of the 2010 census, the population of Socastee was 8,945. The population is largely white (83.3%), with a small African American population (7.2%) and a small Hispanic population (3.2%). The median household income in the area is $45,845, and the median home value is $179,000. The area is largely rural, with a population density of just over 200 people per square mile.
Common Questions
What is Per Capita Income in Socastee?
Per Capita income in Socastee is $29,909.
What is the Median Family Income in Socastee?
Median Family Income in Socastee is $61,875.
What is the Median Household income in Socastee?
Median Household Income in Socastee is $54,405.
What is Income or Wage Gap in Socastee?
Income or Wage Gap in Socastee is 20.7%.
Women in Socastee earn 79.3 cents for every dollar earned by a man.
What is Family Income Deficit in Socastee?
Family Income Deficit in Socastee is $10,589.
Families that are below poverty line in Socastee earn $10,589 less on average than the poverty threshold level.
What is Inequality or Gini Index in Socastee?
Inequality or Gini Index in Socastee is 0.42.
What is the Total Population of Socastee?
Total Population of Socastee is 24,464.
What is the Total Male Population of Socastee?
Total Male Population of Socastee is 12,085.
What is the Total Female Population of Socastee?
Total Female Population of Socastee is 12,379.
What is the Ratio of Males per 100 Females in Socastee?
There are 97.63 Males per 100 Females in Socastee.
What is the Ratio of Females per 100 Males in Socastee?
There are 102.43 Females per 100 Males in Socastee.
What is the Median Population Age in Socastee?
Median Population Age in Socastee is 42.6 Years.
What is the Average Family Size in Socastee
Average Family Size in Socastee is 3.2 People.
What is the Average Household Size in Socastee
Average Household Size in Socastee is 2.8 People.
How Large is the Labor Force in Socastee?
There are 11,938 People in the Labor Forcein in Socastee.
What is the Percentage of People in the Labor Force in Socastee?
59.2% of People are in the Labor Force in Socastee.
What is the Unemployment Rate in Socastee?
Unemployment Rate in Socastee is 5.5%.