Zip Codes with the Highest Percentage of Population Employed in Food Preparation & Serving in Easley, SC
RELATED REPORTS & OPTIONS
Food Preparation & Serving
Easley
Compare Zip Codes
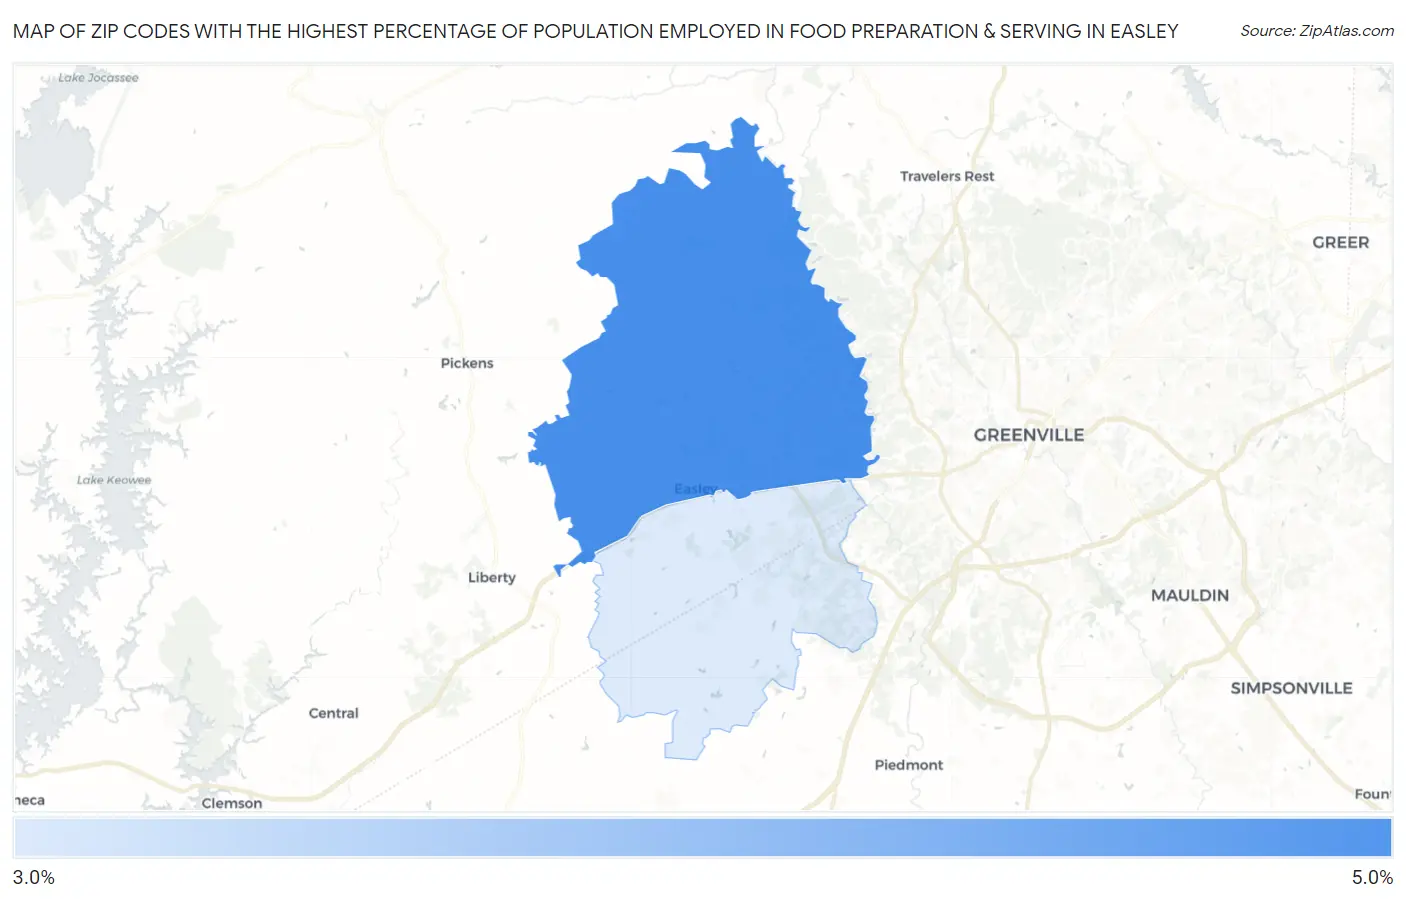
Map of Zip Codes with the Highest Percentage of Population Employed in Food Preparation & Serving in Easley
3.9%
4.5%
Zip Codes with the Highest Percentage of Population Employed in Food Preparation & Serving in Easley, SC
| Zip Code | % Employed | vs State | vs National | |
| 1. | 29640 | 4.5% | 5.8%(-1.27)#223 | 5.3%(-0.787)#15,037 |
| 2. | 29642 | 3.9% | 5.8%(-1.89)#257 | 5.3%(-1.41)#17,647 |
1
Common Questions
What are the Top Zip Codes with the Highest Percentage of Population Employed in Food Preparation & Serving in Easley, SC?
Top Zip Codes with the Highest Percentage of Population Employed in Food Preparation & Serving in Easley, SC are:
What zip code has the Highest Percentage of Population Employed in Food Preparation & Serving in Easley, SC?
29640 has the Highest Percentage of Population Employed in Food Preparation & Serving in Easley, SC with 4.5%.
What is the Percentage of Population Employed in Food Preparation & Serving in Easley, SC?
Percentage of Population Employed in Food Preparation & Serving in Easley is 4.2%.
What is the Percentage of Population Employed in Food Preparation & Serving in South Carolina?
Percentage of Population Employed in Food Preparation & Serving in South Carolina is 5.8%.
What is the Percentage of Population Employed in Food Preparation & Serving in the United States?
Percentage of Population Employed in Food Preparation & Serving in the United States is 5.3%.