Zip Codes with the Highest Percentage of Population Employed in Food Preparation & Serving in Rock Hill, SC
RELATED REPORTS & OPTIONS
Food Preparation & Serving
Rock Hill
Compare Zip Codes
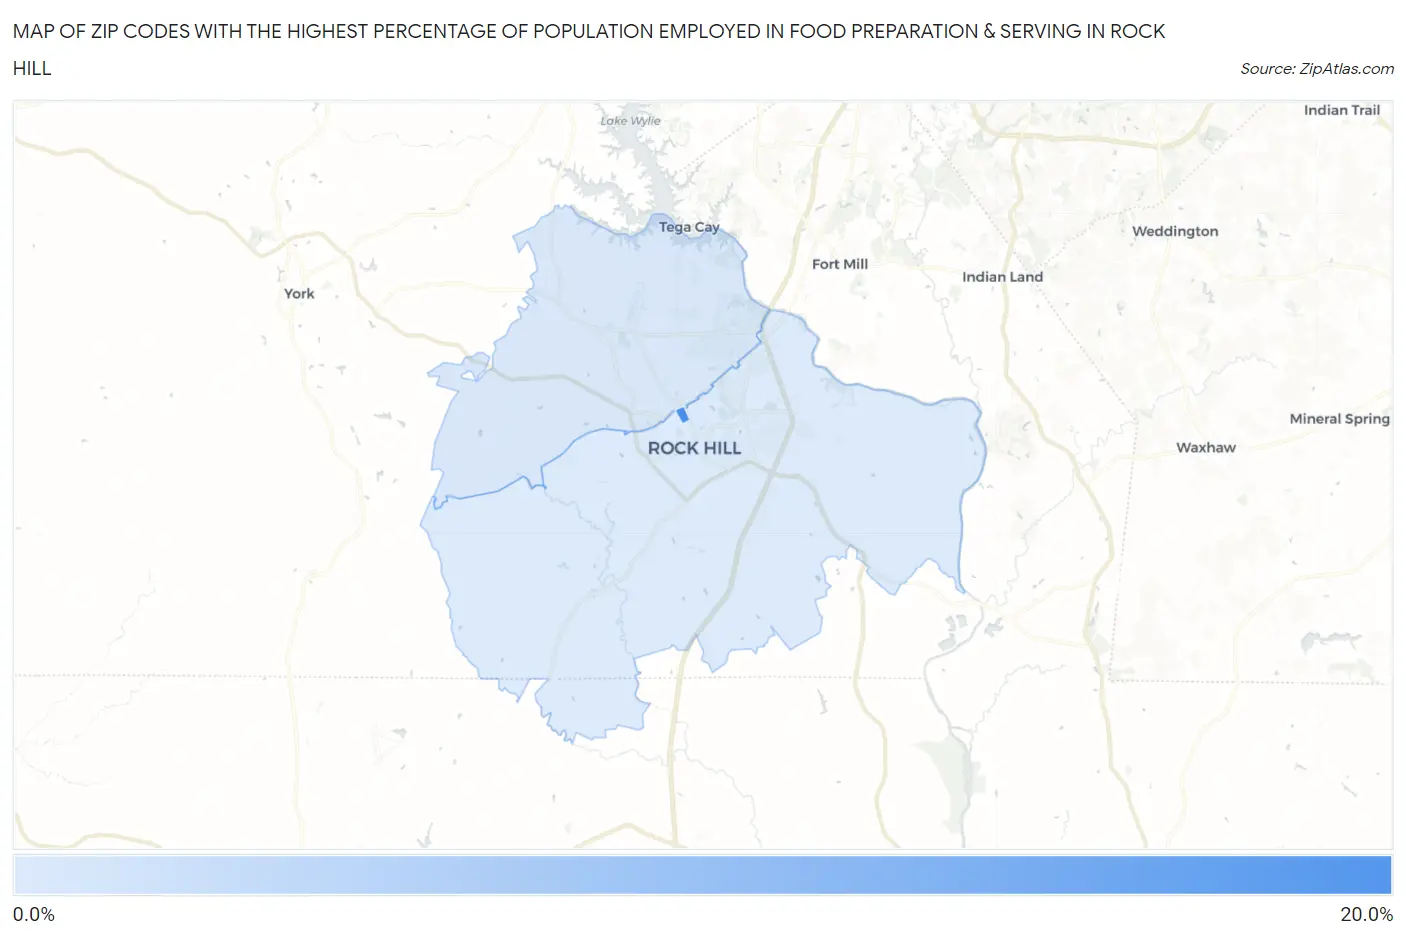
Map of Zip Codes with the Highest Percentage of Population Employed in Food Preparation & Serving in Rock Hill
6.2%
19.2%
Zip Codes with the Highest Percentage of Population Employed in Food Preparation & Serving in Rock Hill, SC
| Zip Code | % Employed | vs State | vs National | |
| 1. | 29733 | 19.2% | 5.8%(+13.4)#7 | 5.3%(+13.9)#554 |
| 2. | 29732 | 6.5% | 5.8%(+0.769)#125 | 5.3%(+1.25)#7,769 |
| 3. | 29730 | 6.2% | 5.8%(+0.421)#141 | 5.3%(+0.904)#8,766 |
1
Common Questions
What are the Top Zip Codes with the Highest Percentage of Population Employed in Food Preparation & Serving in Rock Hill, SC?
Top Zip Codes with the Highest Percentage of Population Employed in Food Preparation & Serving in Rock Hill, SC are:
What zip code has the Highest Percentage of Population Employed in Food Preparation & Serving in Rock Hill, SC?
29733 has the Highest Percentage of Population Employed in Food Preparation & Serving in Rock Hill, SC with 19.2%.
What is the Percentage of Population Employed in Food Preparation & Serving in Rock Hill, SC?
Percentage of Population Employed in Food Preparation & Serving in Rock Hill is 6.7%.
What is the Percentage of Population Employed in Food Preparation & Serving in South Carolina?
Percentage of Population Employed in Food Preparation & Serving in South Carolina is 5.8%.
What is the Percentage of Population Employed in Food Preparation & Serving in the United States?
Percentage of Population Employed in Food Preparation & Serving in the United States is 5.3%.