Myrtle Beach, SC Map & Demographics
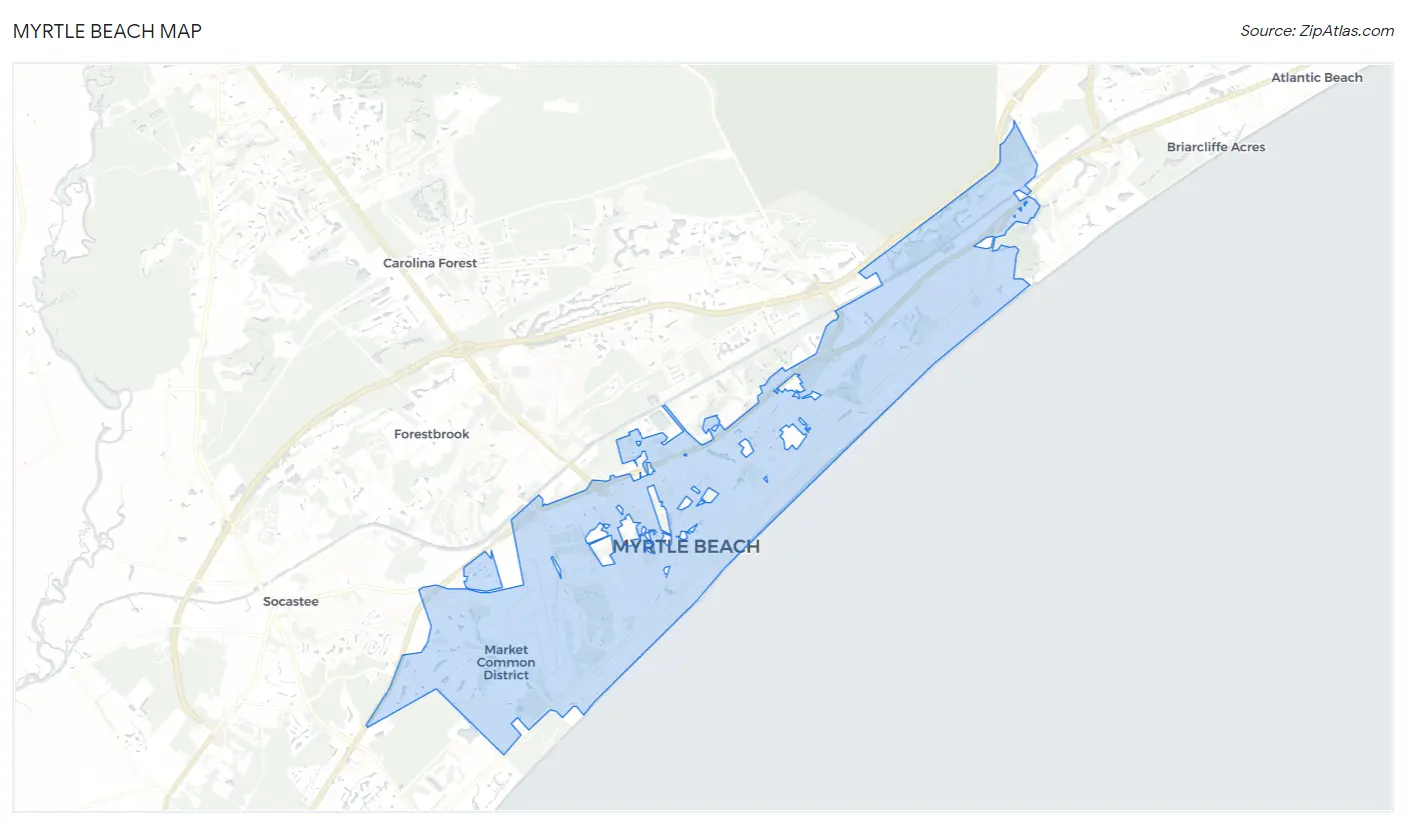
Myrtle Beach Map
Myrtle Beach Overview
$38,086
PER CAPITA INCOME
$66,880
AVG FAMILY INCOME
$50,558
AVG HOUSEHOLD INCOME
22.3%
WAGE / INCOME GAP [ % ]
77.7¢/ $1
WAGE / INCOME GAP [ $ ]
$8,680
FAMILY INCOME DEFICIT
0.52
INEQUALITY / GINI INDEX
36,064
TOTAL POPULATION
17,903
MALE POPULATION
18,161
FEMALE POPULATION
98.58
MALES / 100 FEMALES
101.44
FEMALES / 100 MALES
47.0
MEDIAN AGE
2.8
AVG FAMILY SIZE
2.2
AVG HOUSEHOLD SIZE
18,526
LABOR FORCE [ PEOPLE ]
60.3%
PERCENT IN LABOR FORCE
4.2%
UNEMPLOYMENT RATE
Myrtle Beach Area Codes
Income in Myrtle Beach
Income Overview in Myrtle Beach
Per Capita Income in Myrtle Beach is $38,086, while median incomes of families and households are $66,880 and $50,558 respectively.
| Characteristic | Number | Measure |
| Per Capita Income | 36,064 | $38,086 |
| Median Family Income | 9,103 | $66,880 |
| Mean Family Income | 9,103 | $104,660 |
| Median Household Income | 16,201 | $50,558 |
| Mean Household Income | 16,201 | $80,513 |
| Income Deficit | 9,103 | $8,680 |
| Wage / Income Gap (%) | 36,064 | 22.33% |
| Wage / Income Gap ($) | 36,064 | 77.67¢ per $1 |
| Gini / Inequality Index | 36,064 | 0.52 |
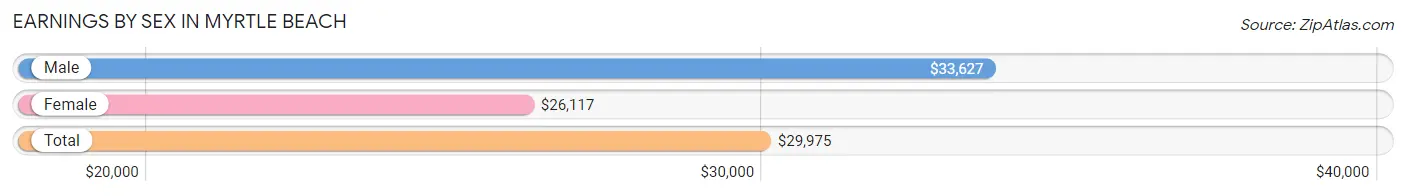
Earnings by Sex in Myrtle Beach
Average Earnings in Myrtle Beach are $29,975, $33,627 for men and $26,117 for women, a difference of 22.3%.
| Sex | Number | Average Earnings |
| Male | 9,858 (51.5%) | $33,627 |
| Female | 9,272 (48.5%) | $26,117 |
| Total | 19,130 (100.0%) | $29,975 |
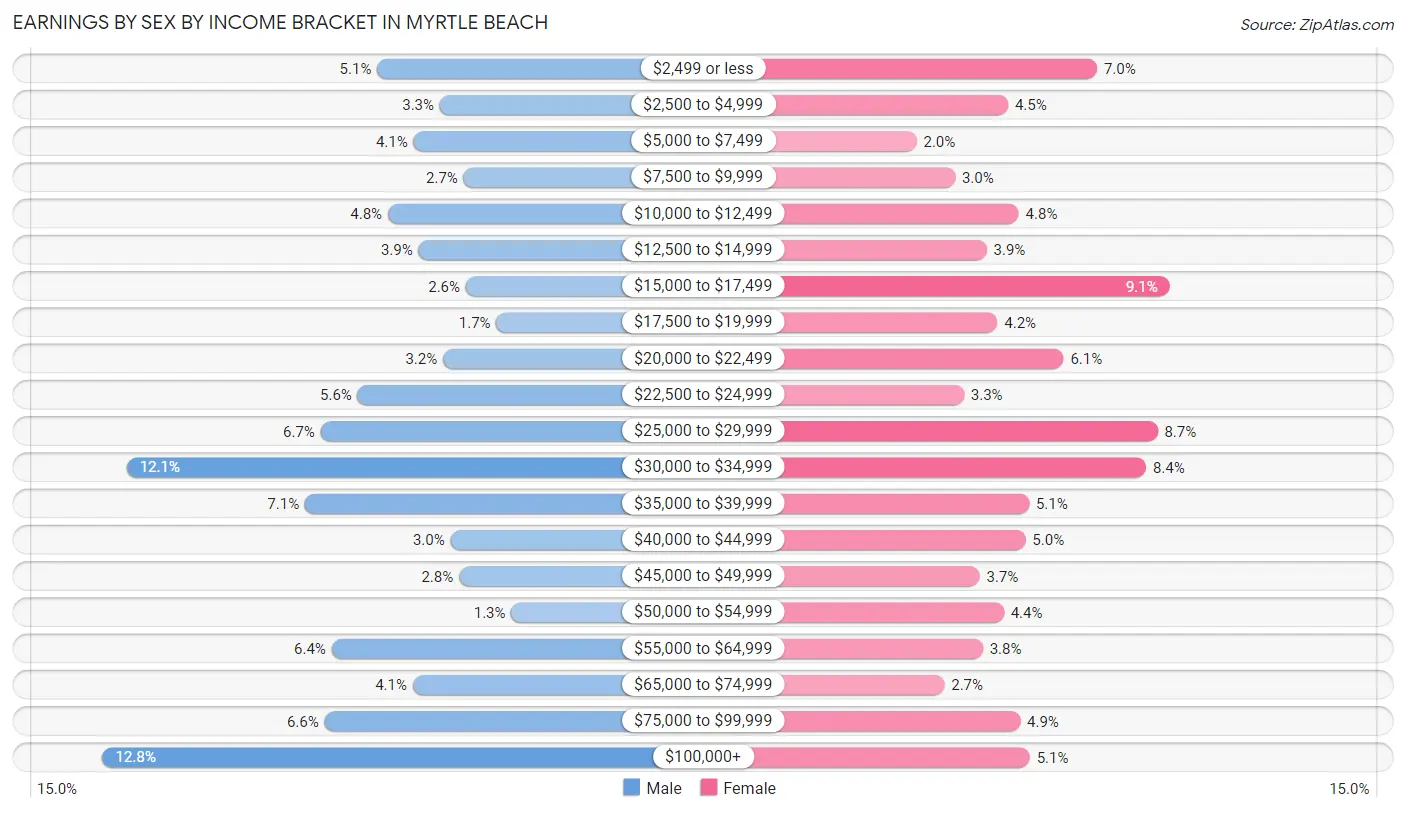
Earnings by Sex by Income Bracket in Myrtle Beach
The most common earnings brackets in Myrtle Beach are $100,000+ for men (1,263 | 12.8%) and $15,000 to $17,499 for women (841 | 9.1%).
| Income | Male | Female |
| $2,499 or less | 502 (5.1%) | 652 (7.0%) |
| $2,500 to $4,999 | 328 (3.3%) | 420 (4.5%) |
| $5,000 to $7,499 | 401 (4.1%) | 182 (2.0%) |
| $7,500 to $9,999 | 262 (2.7%) | 282 (3.0%) |
| $10,000 to $12,499 | 472 (4.8%) | 448 (4.8%) |
| $12,500 to $14,999 | 387 (3.9%) | 364 (3.9%) |
| $15,000 to $17,499 | 256 (2.6%) | 841 (9.1%) |
| $17,500 to $19,999 | 172 (1.7%) | 392 (4.2%) |
| $20,000 to $22,499 | 319 (3.2%) | 565 (6.1%) |
| $22,500 to $24,999 | 556 (5.6%) | 305 (3.3%) |
| $25,000 to $29,999 | 659 (6.7%) | 809 (8.7%) |
| $30,000 to $34,999 | 1,196 (12.1%) | 780 (8.4%) |
| $35,000 to $39,999 | 702 (7.1%) | 475 (5.1%) |
| $40,000 to $44,999 | 299 (3.0%) | 465 (5.0%) |
| $45,000 to $49,999 | 275 (2.8%) | 346 (3.7%) |
| $50,000 to $54,999 | 130 (1.3%) | 409 (4.4%) |
| $55,000 to $64,999 | 628 (6.4%) | 354 (3.8%) |
| $65,000 to $74,999 | 403 (4.1%) | 254 (2.7%) |
| $75,000 to $99,999 | 648 (6.6%) | 452 (4.9%) |
| $100,000+ | 1,263 (12.8%) | 477 (5.1%) |
| Total | 9,858 (100.0%) | 9,272 (100.0%) |
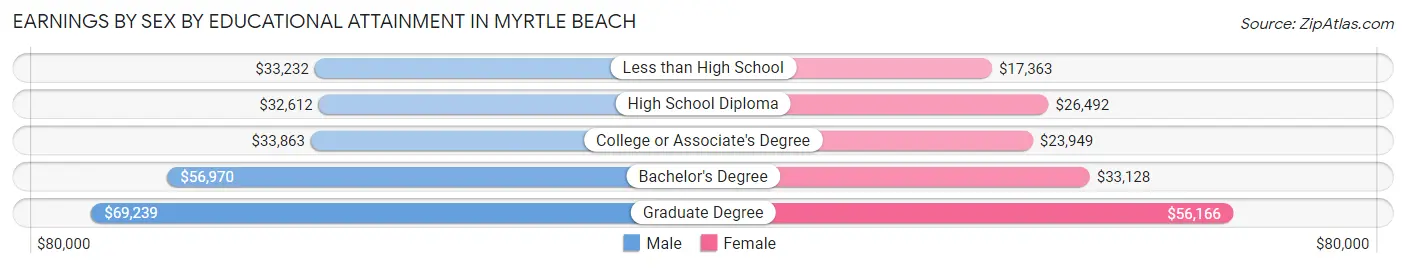
Earnings by Sex by Educational Attainment in Myrtle Beach
Average earnings in Myrtle Beach are $34,828 for men and $27,392 for women, a difference of 21.3%. Men with an educational attainment of graduate degree enjoy the highest average annual earnings of $69,239, while those with high school diploma education earn the least with $32,612. Women with an educational attainment of graduate degree earn the most with the average annual earnings of $56,166, while those with less than high school education have the smallest earnings of $17,363.
| Educational Attainment | Male Income | Female Income |
| Less than High School | $33,232 | $17,363 |
| High School Diploma | $32,612 | $26,492 |
| College or Associate's Degree | $33,863 | $23,949 |
| Bachelor's Degree | $56,970 | $33,128 |
| Graduate Degree | $69,239 | $56,166 |
| Total | $34,828 | $27,392 |
Family Income in Myrtle Beach
Family Income Brackets in Myrtle Beach
According to the Myrtle Beach family income data, there are 1,493 families falling into the $50,000 to $74,999 income range, which is the most common income bracket and makes up 16.4% of all families. Conversely, the $10,000 to $14,999 income bracket is the least frequent group with only 209 families (2.3%) belonging to this category.
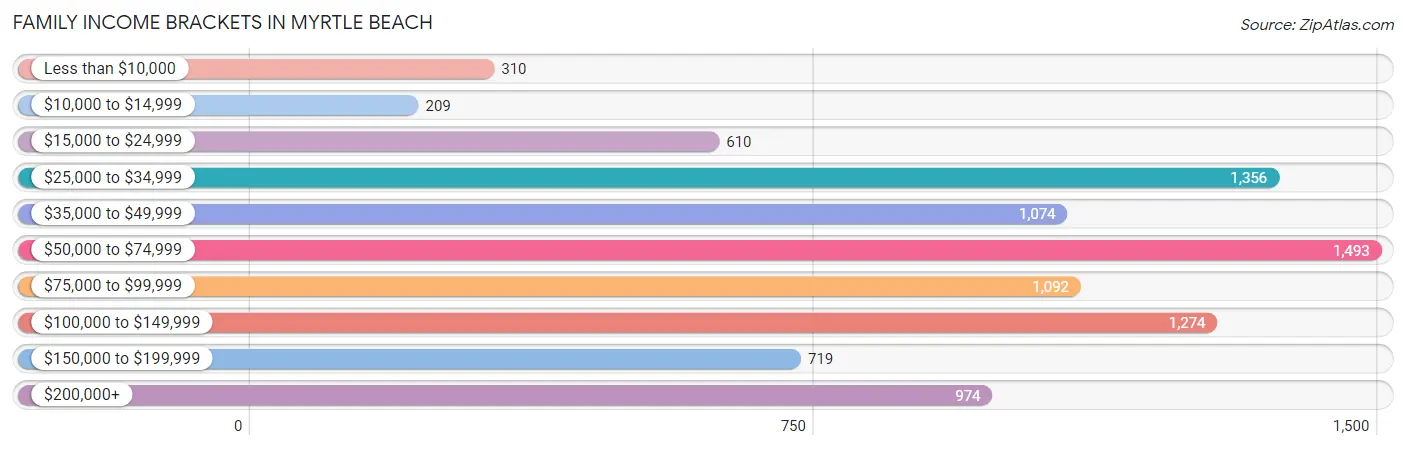
| Income Bracket | # Families | % Families |
| Less than $10,000 | 310 | 3.4% |
| $10,000 to $14,999 | 209 | 2.3% |
| $15,000 to $24,999 | 610 | 6.7% |
| $25,000 to $34,999 | 1,356 | 14.9% |
| $35,000 to $49,999 | 1,074 | 11.8% |
| $50,000 to $74,999 | 1,493 | 16.4% |
| $75,000 to $99,999 | 1,092 | 12.0% |
| $100,000 to $149,999 | 1,274 | 14.0% |
| $150,000 to $199,999 | 719 | 7.9% |
| $200,000+ | 974 | 10.7% |
Family Income by Famaliy Size in Myrtle Beach
5-person families (506 | 5.6%) account for the highest median family income in Myrtle Beach with $75,893 per family, while 2-person families (5,581 | 61.3%) have the highest median income of $35,951 per family member.
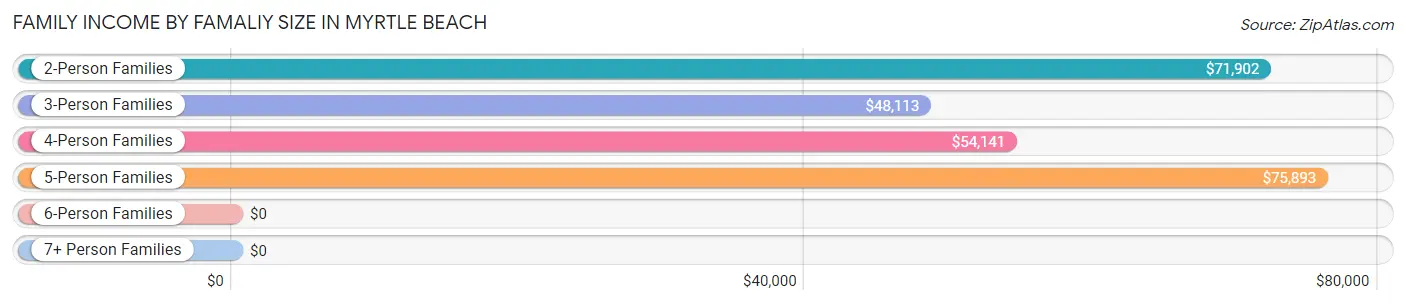
| Income Bracket | # Families | Median Income |
| 2-Person Families | 5,581 (61.3%) | $71,902 |
| 3-Person Families | 2,169 (23.8%) | $48,113 |
| 4-Person Families | 758 (8.3%) | $54,141 |
| 5-Person Families | 506 (5.6%) | $75,893 |
| 6-Person Families | 67 (0.7%) | $0 |
| 7+ Person Families | 22 (0.2%) | $0 |
| Total | 9,103 (100.0%) | $66,880 |
Family Income by Number of Earners in Myrtle Beach
The median family income in Myrtle Beach is $66,880, with families comprising 2 earners (3,369) having the highest median family income of $96,777, while families with 1 earner (3,140) have the lowest median family income of $41,288, accounting for 37.0% and 34.5% of families, respectively.
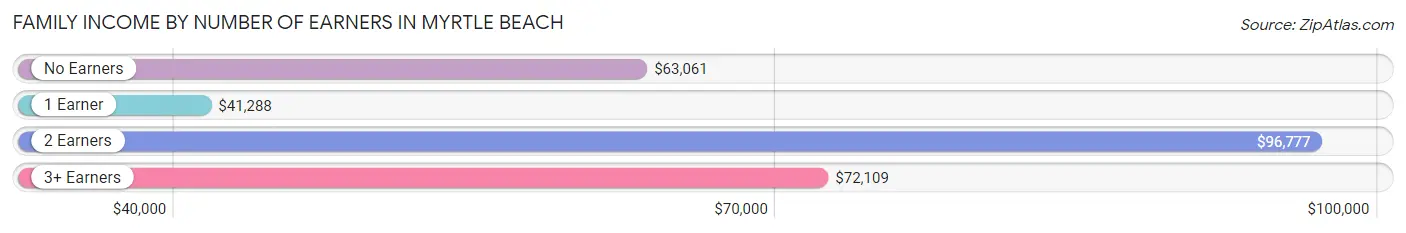
| Number of Earners | # Families | Median Income |
| No Earners | 2,066 (22.7%) | $63,061 |
| 1 Earner | 3,140 (34.5%) | $41,288 |
| 2 Earners | 3,369 (37.0%) | $96,777 |
| 3+ Earners | 528 (5.8%) | $72,109 |
| Total | 9,103 (100.0%) | $66,880 |
Household Income in Myrtle Beach
Household Income Brackets in Myrtle Beach
With 2,835 households falling in the category, the $50,000 to $74,999 income range is the most frequent in Myrtle Beach, accounting for 17.5% of all households. In contrast, only 794 households (4.9%) fall into the $10,000 to $14,999 income bracket, making it the least populous group.
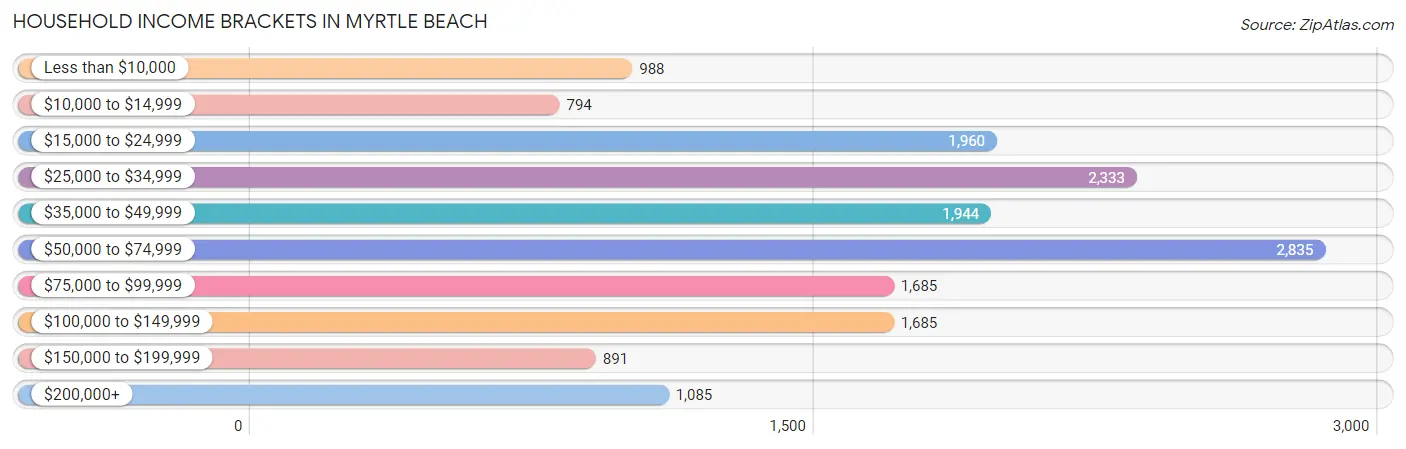
| Income Bracket | # Households | % Households |
| Less than $10,000 | 988 | 6.1% |
| $10,000 to $14,999 | 794 | 4.9% |
| $15,000 to $24,999 | 1,960 | 12.1% |
| $25,000 to $34,999 | 2,333 | 14.4% |
| $35,000 to $49,999 | 1,944 | 12.0% |
| $50,000 to $74,999 | 2,835 | 17.5% |
| $75,000 to $99,999 | 1,685 | 10.4% |
| $100,000 to $149,999 | 1,685 | 10.4% |
| $150,000 to $199,999 | 891 | 5.5% |
| $200,000+ | 1,085 | 6.7% |
Household Income by Householder Age in Myrtle Beach
The median household income in Myrtle Beach is $50,558, with the highest median household income of $57,677 found in the 65+ years age bracket for the primary householder. A total of 5,225 households (32.3%) fall into this category. Meanwhile, the 15 to 24 years age bracket for the primary householder has the lowest median household income of $42,834, with 421 households (2.6%) in this group.
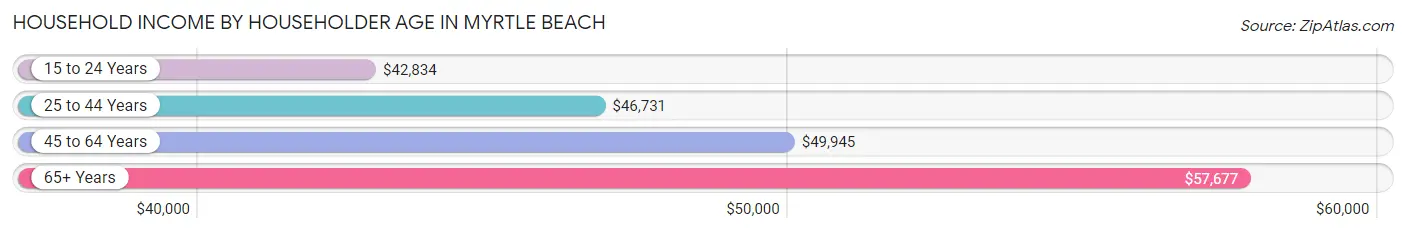
| Income Bracket | # Households | Median Income |
| 15 to 24 Years | 421 (2.6%) | $42,834 |
| 25 to 44 Years | 4,386 (27.1%) | $46,731 |
| 45 to 64 Years | 6,169 (38.1%) | $49,945 |
| 65+ Years | 5,225 (32.3%) | $57,677 |
| Total | 16,201 (100.0%) | $50,558 |
Poverty in Myrtle Beach
Income Below Poverty by Sex and Age in Myrtle Beach
With 15.0% poverty level for males and 15.6% for females among the residents of Myrtle Beach, 12 to 14 year old males and under 5 year old females are the most vulnerable to poverty, with 268 males (38.9%) and 333 females (48.1%) in their respective age groups living below the poverty level.
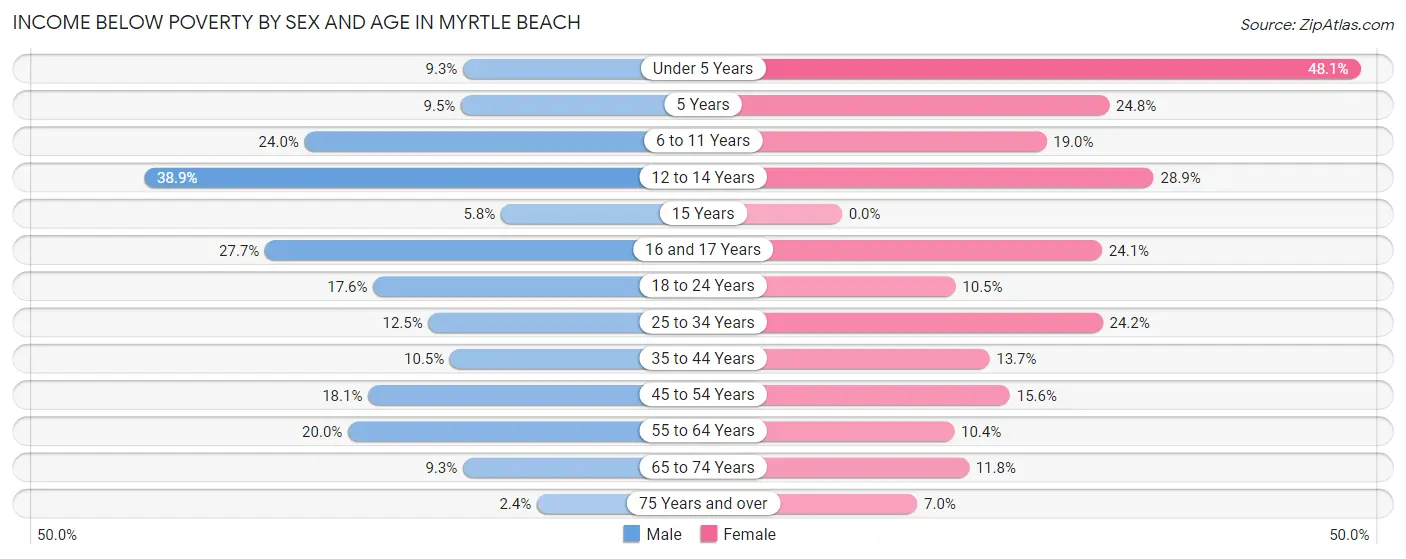
| Age Bracket | Male | Female |
| Under 5 Years | 87 (9.3%) | 333 (48.1%) |
| 5 Years | 11 (9.5%) | 33 (24.8%) |
| 6 to 11 Years | 201 (24.0%) | 145 (19.0%) |
| 12 to 14 Years | 268 (38.9%) | 145 (28.9%) |
| 15 Years | 19 (5.8%) | 0 (0.0%) |
| 16 and 17 Years | 62 (27.7%) | 70 (24.1%) |
| 18 to 24 Years | 237 (17.6%) | 119 (10.5%) |
| 25 to 34 Years | 266 (12.5%) | 537 (24.2%) |
| 35 to 44 Years | 245 (10.5%) | 258 (13.7%) |
| 45 to 54 Years | 411 (18.1%) | 366 (15.6%) |
| 55 to 64 Years | 580 (20.0%) | 376 (10.4%) |
| 65 to 74 Years | 261 (9.3%) | 317 (11.8%) |
| 75 Years and over | 23 (2.4%) | 110 (7.0%) |
| Total | 2,671 (15.0%) | 2,809 (15.6%) |
Income Above Poverty by Sex and Age in Myrtle Beach
According to the poverty statistics in Myrtle Beach, males aged 75 years and over and females aged 15 years are the age groups that are most secure financially, with 97.6% of males and 100.0% of females in these age groups living above the poverty line.
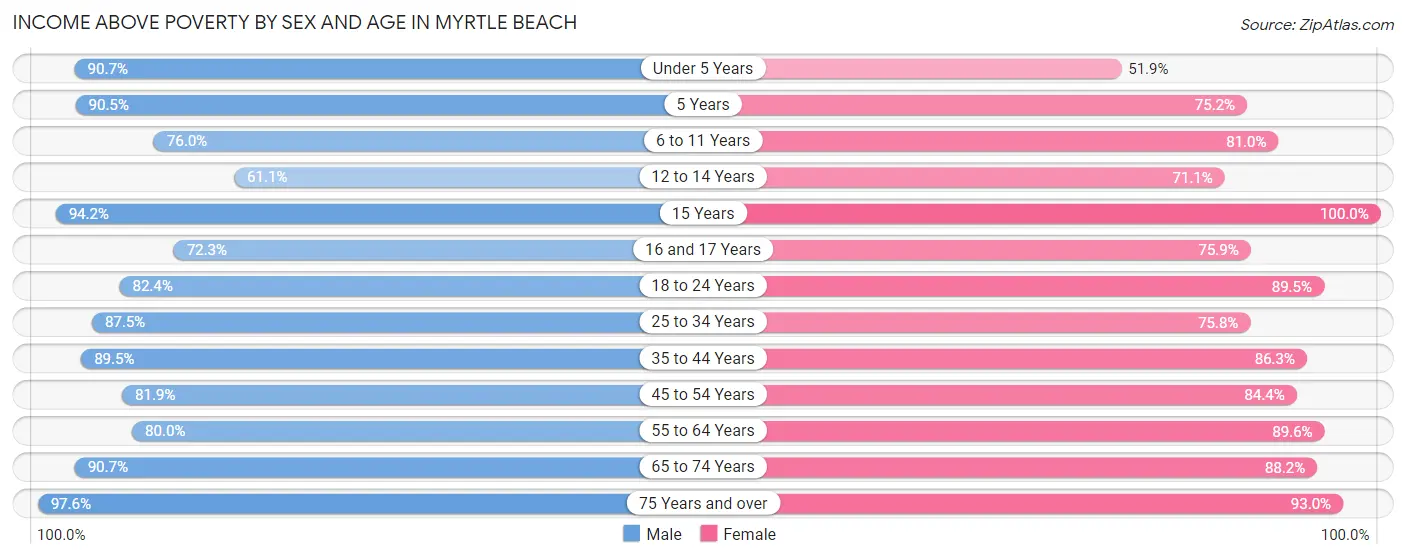
| Age Bracket | Male | Female |
| Under 5 Years | 848 (90.7%) | 359 (51.9%) |
| 5 Years | 105 (90.5%) | 100 (75.2%) |
| 6 to 11 Years | 636 (76.0%) | 619 (81.0%) |
| 12 to 14 Years | 421 (61.1%) | 356 (71.1%) |
| 15 Years | 310 (94.2%) | 173 (100.0%) |
| 16 and 17 Years | 162 (72.3%) | 220 (75.9%) |
| 18 to 24 Years | 1,107 (82.4%) | 1,010 (89.5%) |
| 25 to 34 Years | 1,860 (87.5%) | 1,682 (75.8%) |
| 35 to 44 Years | 2,087 (89.5%) | 1,626 (86.3%) |
| 45 to 54 Years | 1,858 (81.9%) | 1,982 (84.4%) |
| 55 to 64 Years | 2,325 (80.0%) | 3,233 (89.6%) |
| 65 to 74 Years | 2,543 (90.7%) | 2,374 (88.2%) |
| 75 Years and over | 919 (97.6%) | 1,463 (93.0%) |
| Total | 15,181 (85.0%) | 15,197 (84.4%) |
Income Below Poverty Among Married-Couple Families in Myrtle Beach
The poverty statistics for married-couple families in Myrtle Beach show that 5.5% or 384 of the total 6,970 families live below the poverty line. Families with 3 or 4 children have the highest poverty rate of 21.7%, comprising of 45 families. On the other hand, families with no children have the lowest poverty rate of 4.7%, which includes 233 families.
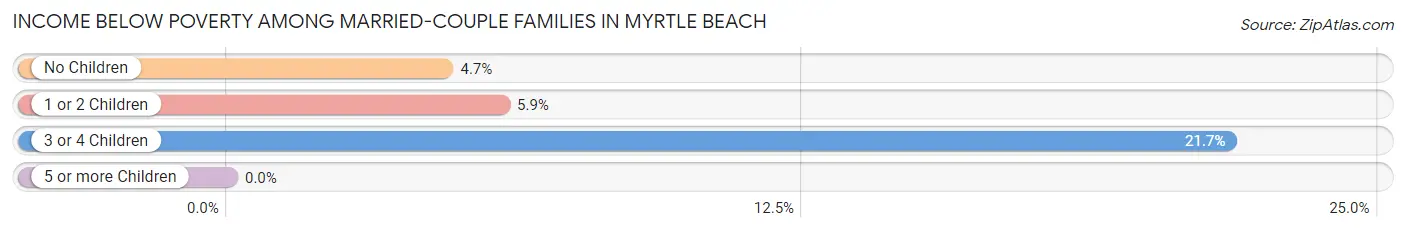
| Children | Above Poverty | Below Poverty |
| No Children | 4,740 (95.3%) | 233 (4.7%) |
| 1 or 2 Children | 1,684 (94.1%) | 106 (5.9%) |
| 3 or 4 Children | 162 (78.3%) | 45 (21.7%) |
| 5 or more Children | 0 (0.0%) | 0 (0.0%) |
| Total | 6,586 (94.5%) | 384 (5.5%) |
Income Below Poverty Among Single-Parent Households in Myrtle Beach
According to the poverty data in Myrtle Beach, 15.2% or 71 single-father households and 30.0% or 500 single-mother households are living below the poverty line. Among single-father households, those with 1 or 2 children have the highest poverty rate, with 48 households (21.5%) experiencing poverty. Likewise, among single-mother households, those with 5 or more children have the highest poverty rate, with 24 households (100.0%) falling below the poverty line.
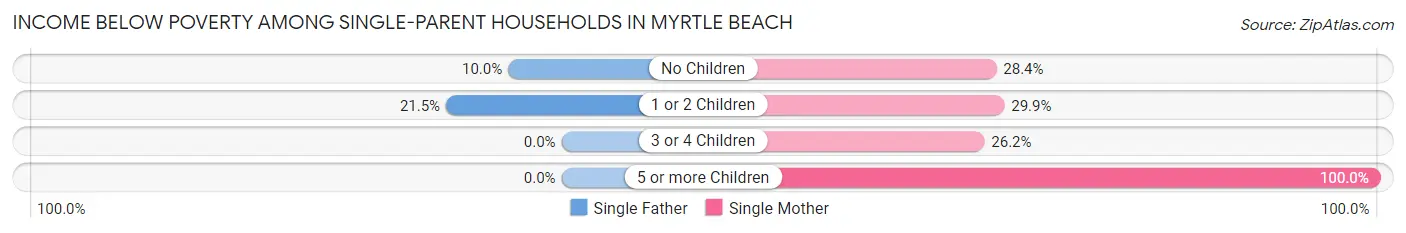
| Children | Single Father | Single Mother |
| No Children | 23 (10.0%) | 190 (28.4%) |
| 1 or 2 Children | 48 (21.5%) | 248 (29.9%) |
| 3 or 4 Children | 0 (0.0%) | 38 (26.2%) |
| 5 or more Children | 0 (0.0%) | 24 (100.0%) |
| Total | 71 (15.2%) | 500 (30.0%) |
Income Below Poverty Among Married-Couple vs Single-Parent Households in Myrtle Beach
The poverty data for Myrtle Beach shows that 384 of the married-couple family households (5.5%) and 571 of the single-parent households (26.8%) are living below the poverty level. Within the married-couple family households, those with 3 or 4 children have the highest poverty rate, with 45 households (21.7%) falling below the poverty line. Among the single-parent households, those with 5 or more children have the highest poverty rate, with 24 household (92.3%) living below poverty.
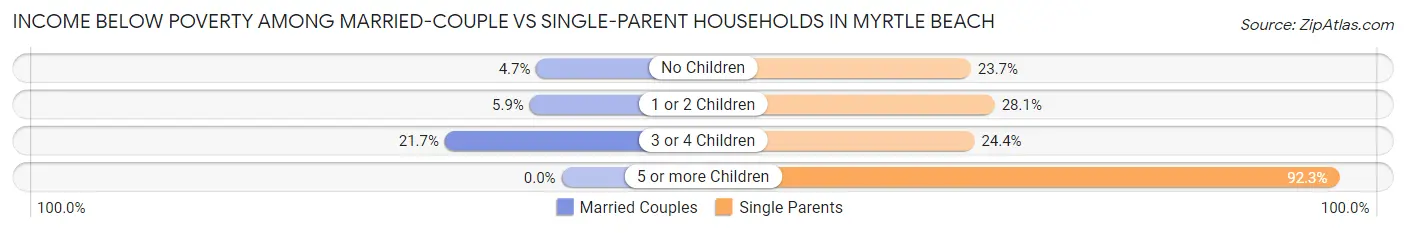
| Children | Married-Couple Families | Single-Parent Households |
| No Children | 233 (4.7%) | 213 (23.7%) |
| 1 or 2 Children | 106 (5.9%) | 296 (28.1%) |
| 3 or 4 Children | 45 (21.7%) | 38 (24.4%) |
| 5 or more Children | 0 (0.0%) | 24 (92.3%) |
| Total | 384 (5.5%) | 571 (26.8%) |
Race in Myrtle Beach
The most populous races in Myrtle Beach are White / Caucasian (26,221 | 72.7%), Black / African American (5,613 | 15.6%), and Hispanic or Latino (4,111 | 11.4%).
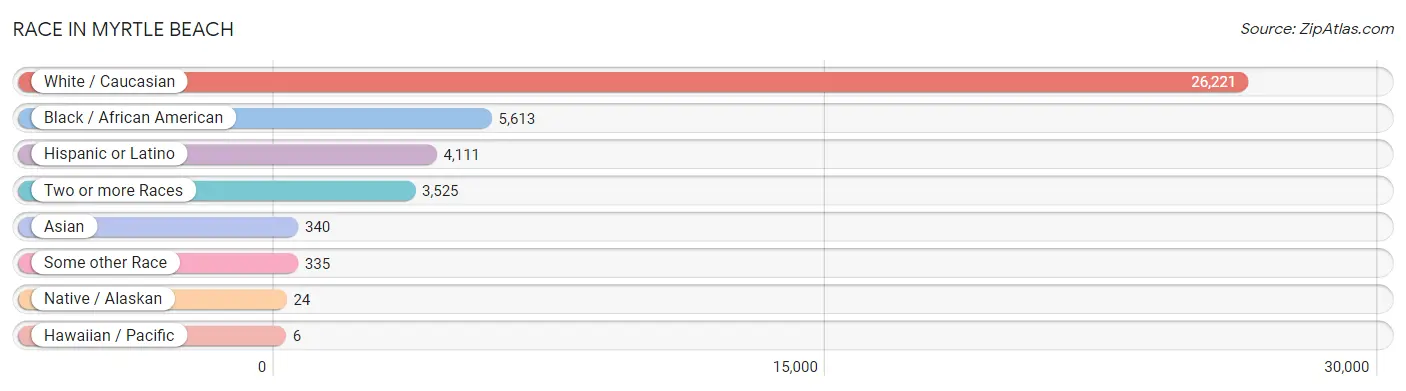
| Race | # Population | % Population |
| Asian | 340 | 0.9% |
| Black / African American | 5,613 | 15.6% |
| Hawaiian / Pacific | 6 | 0.0% |
| Hispanic or Latino | 4,111 | 11.4% |
| Native / Alaskan | 24 | 0.1% |
| White / Caucasian | 26,221 | 72.7% |
| Two or more Races | 3,525 | 9.8% |
| Some other Race | 335 | 0.9% |
| Total | 36,064 | 100.0% |
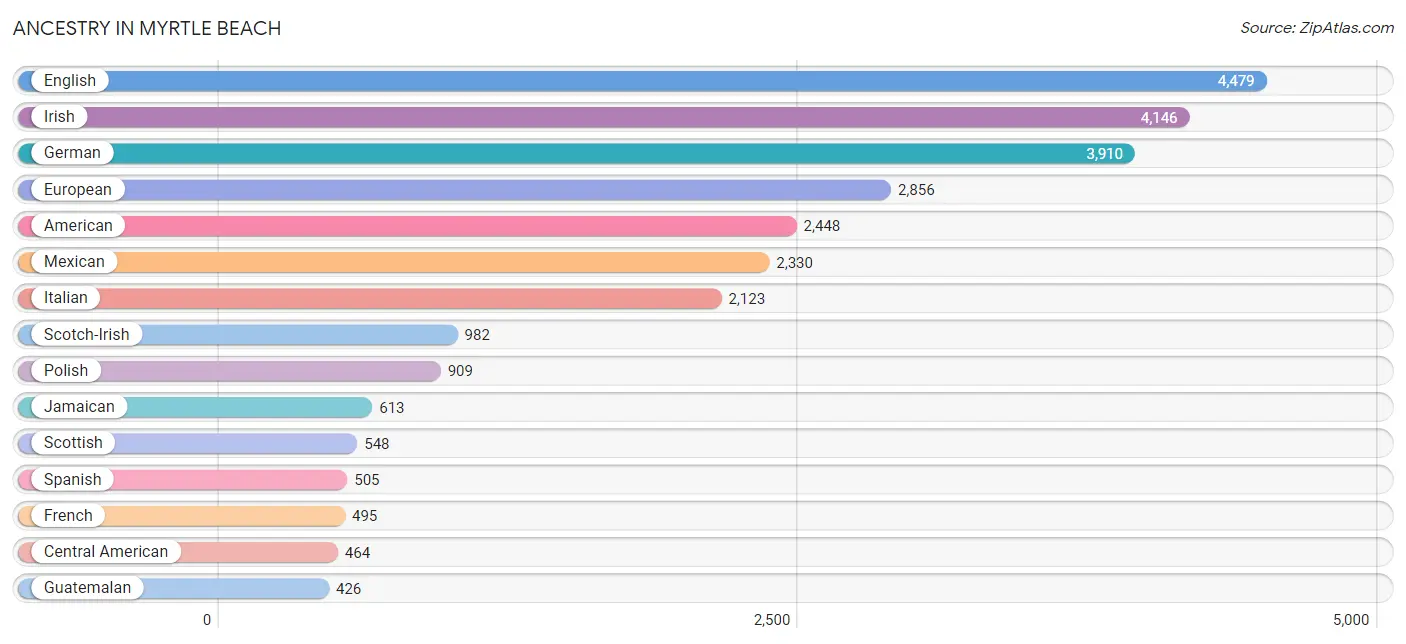
Ancestry in Myrtle Beach
The most populous ancestries reported in Myrtle Beach are English (4,479 | 12.4%), Irish (4,146 | 11.5%), German (3,910 | 10.8%), European (2,856 | 7.9%), and American (2,448 | 6.8%), together accounting for 49.5% of all Myrtle Beach residents.
| Ancestry | # Population | % Population |
| Afghan | 19 | 0.1% |
| African | 19 | 0.1% |
| Albanian | 216 | 0.6% |
| American | 2,448 | 6.8% |
| Apache | 7 | 0.0% |
| Arab | 173 | 0.5% |
| Armenian | 32 | 0.1% |
| Austrian | 74 | 0.2% |
| Bahamian | 28 | 0.1% |
| Belgian | 103 | 0.3% |
| Bhutanese | 25 | 0.1% |
| Blackfeet | 22 | 0.1% |
| Brazilian | 305 | 0.9% |
| British | 232 | 0.6% |
| Burmese | 45 | 0.1% |
| Canadian | 61 | 0.2% |
| Celtic | 12 | 0.0% |
| Central American | 464 | 1.3% |
| Central American Indian | 20 | 0.1% |
| Cherokee | 138 | 0.4% |
| Colombian | 67 | 0.2% |
| Costa Rican | 22 | 0.1% |
| Croatian | 6 | 0.0% |
| Cuban | 23 | 0.1% |
| Czech | 68 | 0.2% |
| Czechoslovakian | 15 | 0.0% |
| Danish | 138 | 0.4% |
| Dutch | 186 | 0.5% |
| Eastern European | 91 | 0.3% |
| Ecuadorian | 107 | 0.3% |
| Egyptian | 5 | 0.0% |
| English | 4,479 | 12.4% |
| European | 2,856 | 7.9% |
| Filipino | 16 | 0.0% |
| Finnish | 21 | 0.1% |
| French | 495 | 1.4% |
| French Canadian | 213 | 0.6% |
| German | 3,910 | 10.8% |
| Greek | 121 | 0.3% |
| Guatemalan | 426 | 1.2% |
| Honduran | 4 | 0.0% |
| Hungarian | 185 | 0.5% |
| Indian (Asian) | 152 | 0.4% |
| Irish | 4,146 | 11.5% |
| Iroquois | 7 | 0.0% |
| Israeli | 58 | 0.2% |
| Italian | 2,123 | 5.9% |
| Jamaican | 613 | 1.7% |
| Korean | 88 | 0.2% |
| Laotian | 7 | 0.0% |
| Lebanese | 35 | 0.1% |
| Lithuanian | 61 | 0.2% |
| Lumbee | 60 | 0.2% |
| Mexican | 2,330 | 6.5% |
| Moroccan | 64 | 0.2% |
| Native Hawaiian | 19 | 0.1% |
| Northern European | 35 | 0.1% |
| Norwegian | 248 | 0.7% |
| Pakistani | 18 | 0.1% |
| Pennsylvania German | 27 | 0.1% |
| Polish | 909 | 2.5% |
| Portuguese | 135 | 0.4% |
| Puerto Rican | 262 | 0.7% |
| Romanian | 50 | 0.1% |
| Russian | 332 | 0.9% |
| Salvadoran | 12 | 0.0% |
| Samoan | 6 | 0.0% |
| Scandinavian | 78 | 0.2% |
| Scotch-Irish | 982 | 2.7% |
| Scottish | 548 | 1.5% |
| Seminole | 4 | 0.0% |
| Slavic | 117 | 0.3% |
| Slovak | 102 | 0.3% |
| Slovene | 10 | 0.0% |
| South American | 174 | 0.5% |
| Spanish | 505 | 1.4% |
| Sri Lankan | 131 | 0.4% |
| Subsaharan African | 19 | 0.1% |
| Swedish | 188 | 0.5% |
| Swiss | 55 | 0.2% |
| Syrian | 13 | 0.0% |
| Thai | 103 | 0.3% |
| Trinidadian and Tobagonian | 17 | 0.1% |
| Ukrainian | 162 | 0.4% |
| Welsh | 49 | 0.1% |
| Yugoslavian | 16 | 0.0% | View All 86 Rows |
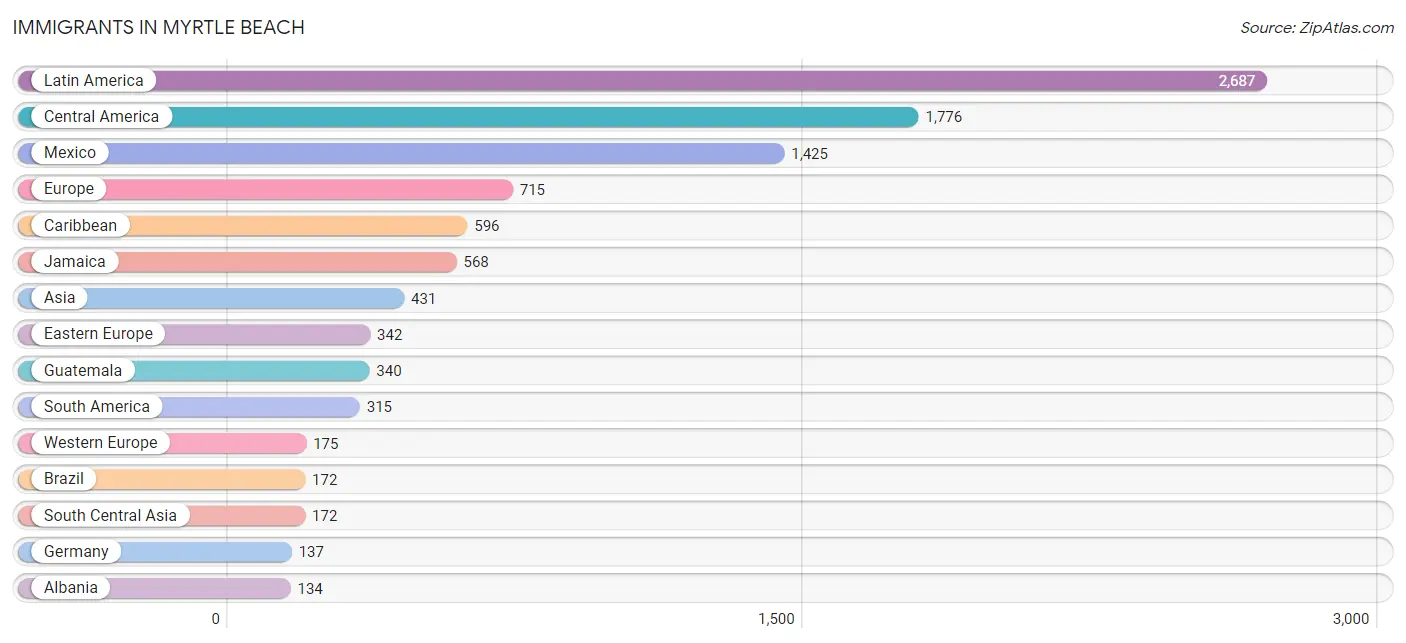
Immigrants in Myrtle Beach
The most numerous immigrant groups reported in Myrtle Beach came from Latin America (2,687 | 7.4%), Central America (1,776 | 4.9%), Mexico (1,425 | 4.0%), Europe (715 | 2.0%), and Caribbean (596 | 1.7%), together accounting for 20.0% of all Myrtle Beach residents.
| Immigration Origin | # Population | % Population |
| Afghanistan | 19 | 0.1% |
| Africa | 65 | 0.2% |
| Albania | 134 | 0.4% |
| Asia | 431 | 1.2% |
| Austria | 7 | 0.0% |
| Bahamas | 28 | 0.1% |
| Belgium | 18 | 0.1% |
| Brazil | 172 | 0.5% |
| Canada | 123 | 0.3% |
| Caribbean | 596 | 1.7% |
| Central America | 1,776 | 4.9% |
| China | 68 | 0.2% |
| Colombia | 36 | 0.1% |
| Costa Rica | 11 | 0.0% |
| Czechoslovakia | 51 | 0.1% |
| Eastern Asia | 83 | 0.2% |
| Eastern Europe | 342 | 0.9% |
| Ecuador | 107 | 0.3% |
| Egypt | 5 | 0.0% |
| England | 11 | 0.0% |
| Europe | 715 | 2.0% |
| France | 13 | 0.0% |
| Germany | 137 | 0.4% |
| Greece | 16 | 0.0% |
| Guatemala | 340 | 0.9% |
| India | 25 | 0.1% |
| Indonesia | 7 | 0.0% |
| Israel | 58 | 0.2% |
| Italy | 52 | 0.1% |
| Jamaica | 568 | 1.6% |
| Japan | 8 | 0.0% |
| Korea | 7 | 0.0% |
| Latin America | 2,687 | 7.4% |
| Mexico | 1,425 | 4.0% |
| Morocco | 60 | 0.2% |
| Northern Africa | 65 | 0.2% |
| Northern Europe | 87 | 0.2% |
| Philippines | 1 | 0.0% |
| Poland | 77 | 0.2% |
| Portugal | 40 | 0.1% |
| Russia | 66 | 0.2% |
| South America | 315 | 0.9% |
| South Central Asia | 172 | 0.5% |
| South Eastern Asia | 118 | 0.3% |
| Southern Europe | 111 | 0.3% |
| Spain | 3 | 0.0% |
| Taiwan | 31 | 0.1% |
| Thailand | 8 | 0.0% |
| Ukraine | 14 | 0.0% |
| Uzbekistan | 128 | 0.4% |
| Vietnam | 102 | 0.3% |
| Western Asia | 58 | 0.2% |
| Western Europe | 175 | 0.5% | View All 53 Rows |
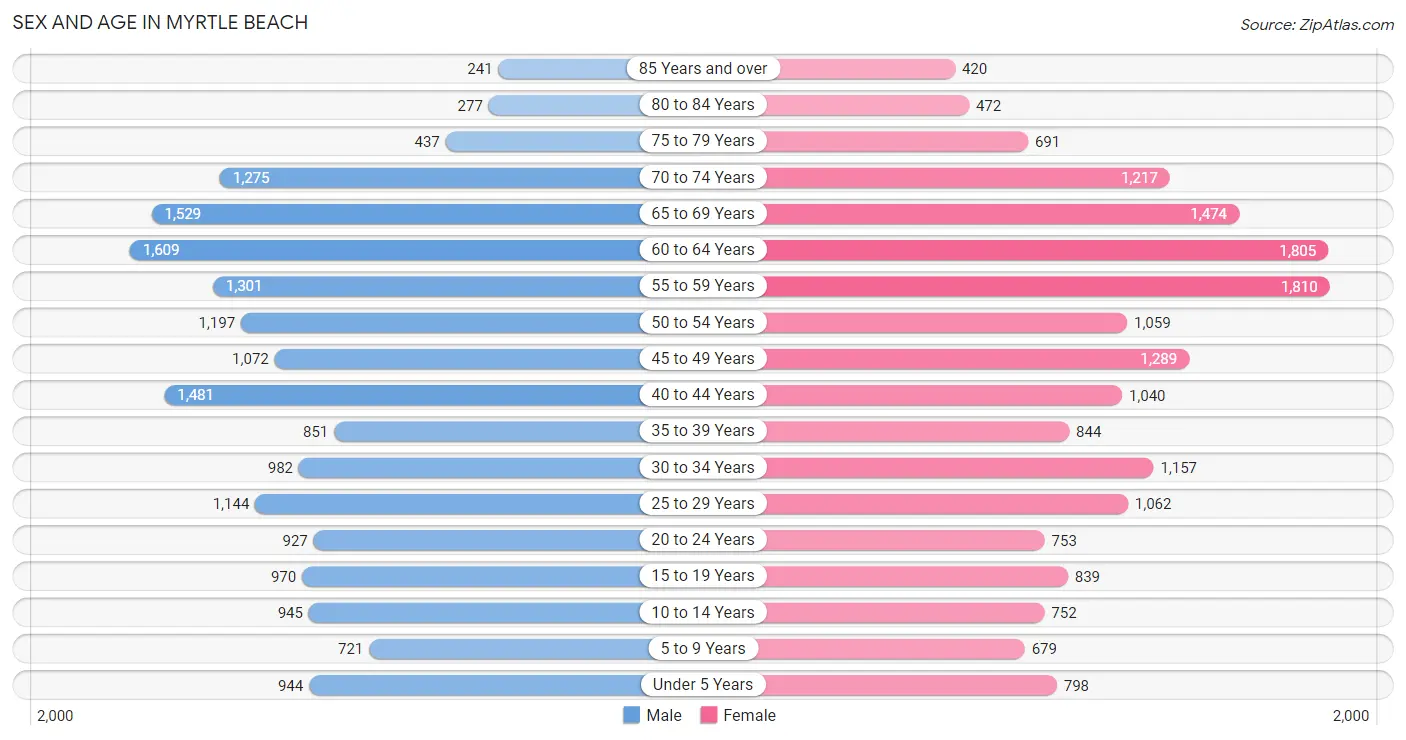
Sex and Age in Myrtle Beach
Sex and Age in Myrtle Beach
The most populous age groups in Myrtle Beach are 60 to 64 Years (1,609 | 9.0%) for men and 55 to 59 Years (1,810 | 10.0%) for women.
| Age Bracket | Male | Female |
| Under 5 Years | 944 (5.3%) | 798 (4.4%) |
| 5 to 9 Years | 721 (4.0%) | 679 (3.7%) |
| 10 to 14 Years | 945 (5.3%) | 752 (4.1%) |
| 15 to 19 Years | 970 (5.4%) | 839 (4.6%) |
| 20 to 24 Years | 927 (5.2%) | 753 (4.2%) |
| 25 to 29 Years | 1,144 (6.4%) | 1,062 (5.9%) |
| 30 to 34 Years | 982 (5.5%) | 1,157 (6.4%) |
| 35 to 39 Years | 851 (4.8%) | 844 (4.6%) |
| 40 to 44 Years | 1,481 (8.3%) | 1,040 (5.7%) |
| 45 to 49 Years | 1,072 (6.0%) | 1,289 (7.1%) |
| 50 to 54 Years | 1,197 (6.7%) | 1,059 (5.8%) |
| 55 to 59 Years | 1,301 (7.3%) | 1,810 (10.0%) |
| 60 to 64 Years | 1,609 (9.0%) | 1,805 (9.9%) |
| 65 to 69 Years | 1,529 (8.5%) | 1,474 (8.1%) |
| 70 to 74 Years | 1,275 (7.1%) | 1,217 (6.7%) |
| 75 to 79 Years | 437 (2.4%) | 691 (3.8%) |
| 80 to 84 Years | 277 (1.5%) | 472 (2.6%) |
| 85 Years and over | 241 (1.3%) | 420 (2.3%) |
| Total | 17,903 (100.0%) | 18,161 (100.0%) |
Families and Households in Myrtle Beach
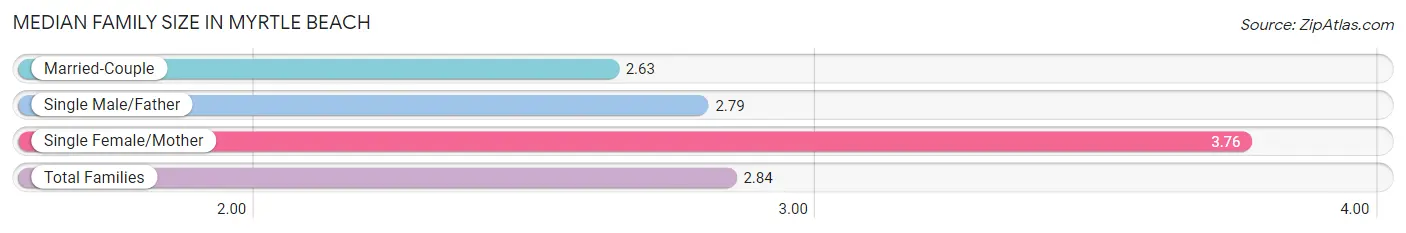
Median Family Size in Myrtle Beach
The median family size in Myrtle Beach is 2.84 persons per family, with single female/mother families (1,666 | 18.3%) accounting for the largest median family size of 3.76 persons per family. On the other hand, married-couple families (6,970 | 76.6%) represent the smallest median family size with 2.63 persons per family.
| Family Type | # Families | Family Size |
| Married-Couple | 6,970 (76.6%) | 2.63 |
| Single Male/Father | 467 (5.1%) | 2.79 |
| Single Female/Mother | 1,666 (18.3%) | 3.76 |
| Total Families | 9,103 (100.0%) | 2.84 |
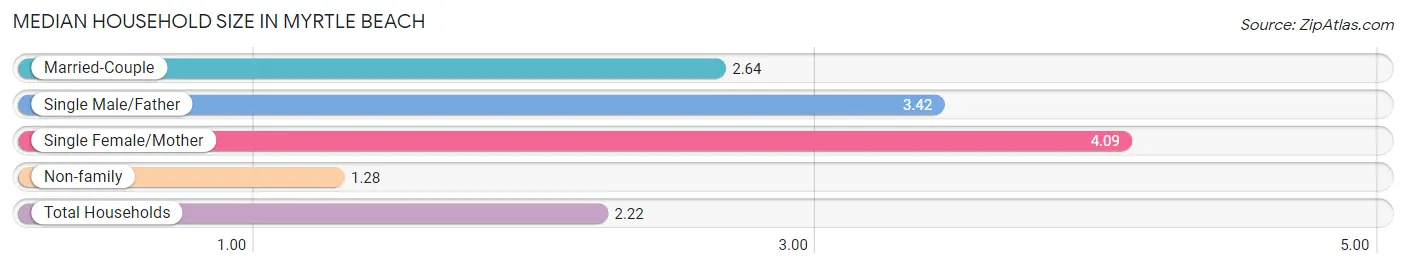
Median Household Size in Myrtle Beach
The median household size in Myrtle Beach is 2.22 persons per household, with single female/mother households (1,666 | 10.3%) accounting for the largest median household size of 4.09 persons per household. non-family households (7,098 | 43.8%) represent the smallest median household size with 1.28 persons per household.
| Household Type | # Households | Household Size |
| Married-Couple | 6,970 (43.0%) | 2.64 |
| Single Male/Father | 467 (2.9%) | 3.42 |
| Single Female/Mother | 1,666 (10.3%) | 4.09 |
| Non-family | 7,098 (43.8%) | 1.28 |
| Total Households | 16,201 (100.0%) | 2.22 |
Household Size by Marriage Status in Myrtle Beach
Out of a total of 16,201 households in Myrtle Beach, 9,103 (56.2%) are family households, while 7,098 (43.8%) are nonfamily households. The most numerous type of family households are 2-person households, comprising 5,320, and the most common type of nonfamily households are 1-person households, comprising 6,026.
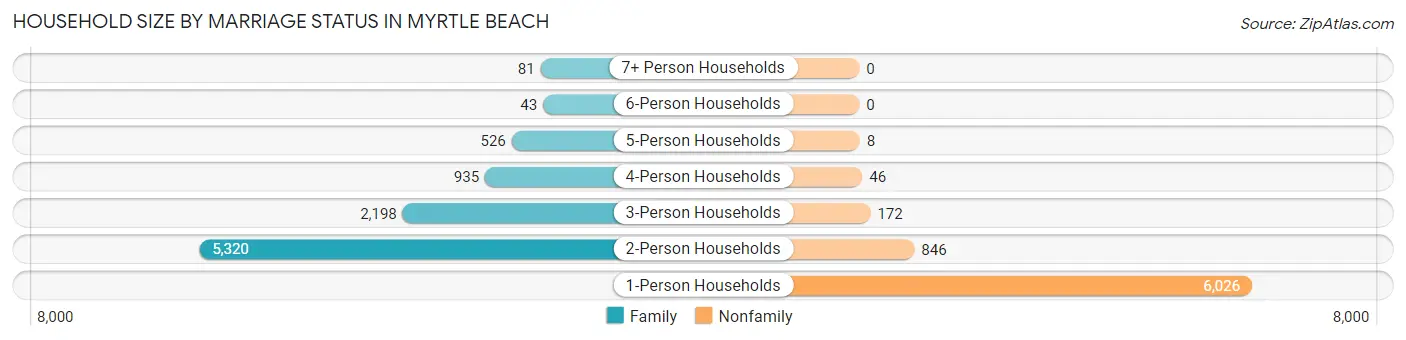
| Household Size | Family Households | Nonfamily Households |
| 1-Person Households | - | 6,026 (37.2%) |
| 2-Person Households | 5,320 (32.8%) | 846 (5.2%) |
| 3-Person Households | 2,198 (13.6%) | 172 (1.1%) |
| 4-Person Households | 935 (5.8%) | 46 (0.3%) |
| 5-Person Households | 526 (3.3%) | 8 (0.1%) |
| 6-Person Households | 43 (0.3%) | 0 (0.0%) |
| 7+ Person Households | 81 (0.5%) | 0 (0.0%) |
| Total | 9,103 (56.2%) | 7,098 (43.8%) |
Female Fertility in Myrtle Beach
Fertility by Age in Myrtle Beach
Average fertility rate in Myrtle Beach is 23.0 births per 1,000 women. Women in the age bracket of 20 to 34 years have the highest fertility rate with 41.0 births per 1,000 women. Women in the age bracket of 20 to 34 years acount for 72.5% of all women with births.
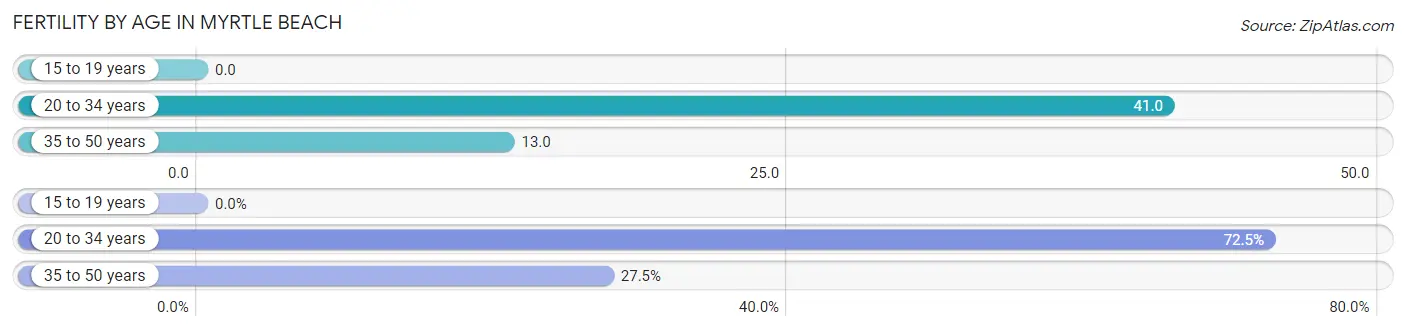
| Age Bracket | Women with Births | Births / 1,000 Women |
| 15 to 19 years | 0 (0.0%) | 0.0 |
| 20 to 34 years | 121 (72.5%) | 41.0 |
| 35 to 50 years | 46 (27.5%) | 13.0 |
| Total | 167 (100.0%) | 23.0 |
Fertility by Age by Marriage Status in Myrtle Beach
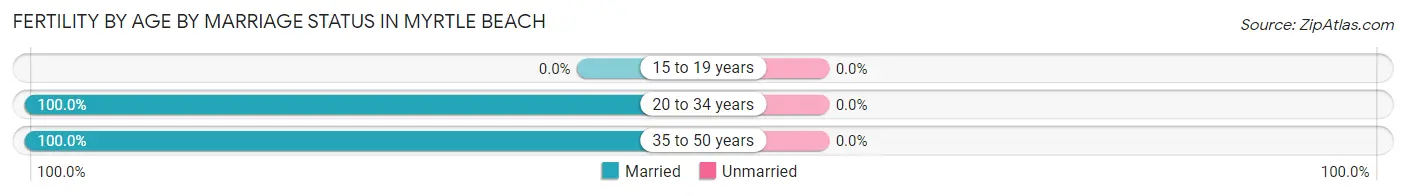
| Age Bracket | Married | Unmarried |
| 15 to 19 years | 0 (0.0%) | 0 (0.0%) |
| 20 to 34 years | 121 (100.0%) | 0 (0.0%) |
| 35 to 50 years | 46 (100.0%) | 0 (0.0%) |
| Total | 167 (100.0%) | 0 (0.0%) |
Fertility by Education in Myrtle Beach
Average fertility rate in Myrtle Beach is 23.0 births per 1,000 women. Women with the education attainment of less than high school have the highest fertility rate of 36.0 births per 1,000 women, while women with the education attainment of bachelor's degree have the lowest fertility at 14.0 births per 1,000 women. Women with the education attainment of college or associate's degree represent 34.1% of all women with births.
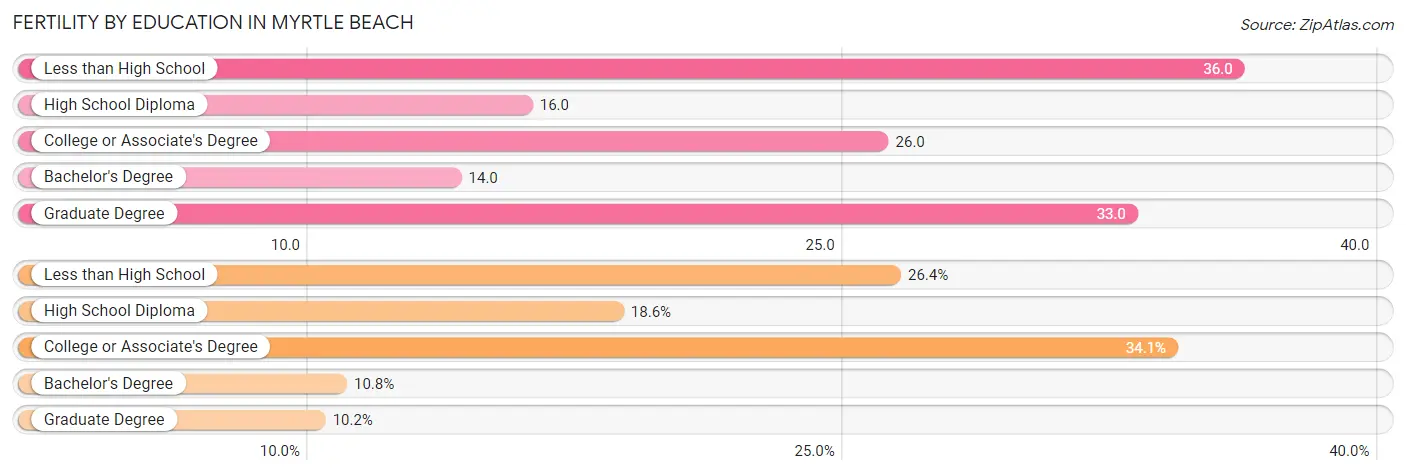
| Educational Attainment | Women with Births | Births / 1,000 Women |
| Less than High School | 44 (26.4%) | 36.0 |
| High School Diploma | 31 (18.6%) | 16.0 |
| College or Associate's Degree | 57 (34.1%) | 26.0 |
| Bachelor's Degree | 18 (10.8%) | 14.0 |
| Graduate Degree | 17 (10.2%) | 33.0 |
| Total | 167 (100.0%) | 23.0 |
Fertility by Education by Marriage Status in Myrtle Beach
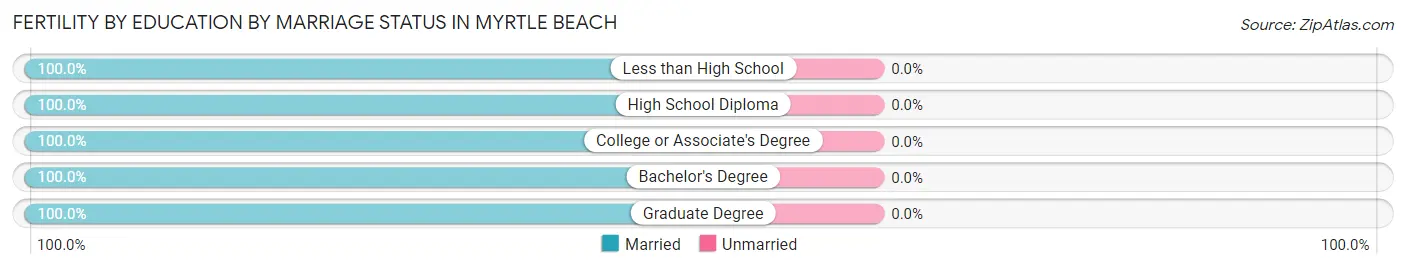
| Educational Attainment | Married | Unmarried |
| Less than High School | 44 (100.0%) | 0 (0.0%) |
| High School Diploma | 31 (100.0%) | 0 (0.0%) |
| College or Associate's Degree | 57 (100.0%) | 0 (0.0%) |
| Bachelor's Degree | 18 (100.0%) | 0 (0.0%) |
| Graduate Degree | 17 (100.0%) | 0 (0.0%) |
| Total | 167 (100.0%) | 0 (0.0%) |
Employment Characteristics in Myrtle Beach
Employment by Class of Employer in Myrtle Beach
Among the 17,475 employed individuals in Myrtle Beach, private company employees (12,797 | 73.2%), self-employed (not incorporated) (1,460 | 8.4%), and local government employees (934 | 5.3%) make up the most common classes of employment.
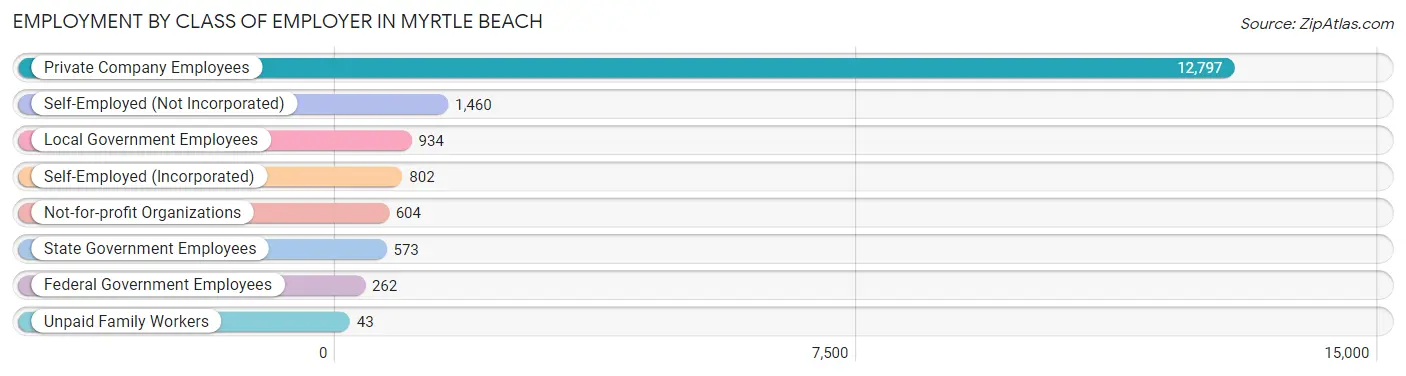
| Employer Class | # Employees | % Employees |
| Private Company Employees | 12,797 | 73.2% |
| Self-Employed (Incorporated) | 802 | 4.6% |
| Self-Employed (Not Incorporated) | 1,460 | 8.4% |
| Not-for-profit Organizations | 604 | 3.5% |
| Local Government Employees | 934 | 5.3% |
| State Government Employees | 573 | 3.3% |
| Federal Government Employees | 262 | 1.5% |
| Unpaid Family Workers | 43 | 0.3% |
| Total | 17,475 | 100.0% |
Employment Status by Age in Myrtle Beach
According to the labor force statistics for Myrtle Beach, out of the total population over 16 years of age (30,723), 60.3% or 18,526 individuals are in the labor force, with 4.2% or 778 of them unemployed. The age group with the highest labor force participation rate is 35 to 44 years, with 91.1% or 3,841 individuals in the labor force. Within the labor force, the 16 to 19 years age range has the highest percentage of unemployed individuals, with 10.7% or 63 of them being unemployed.
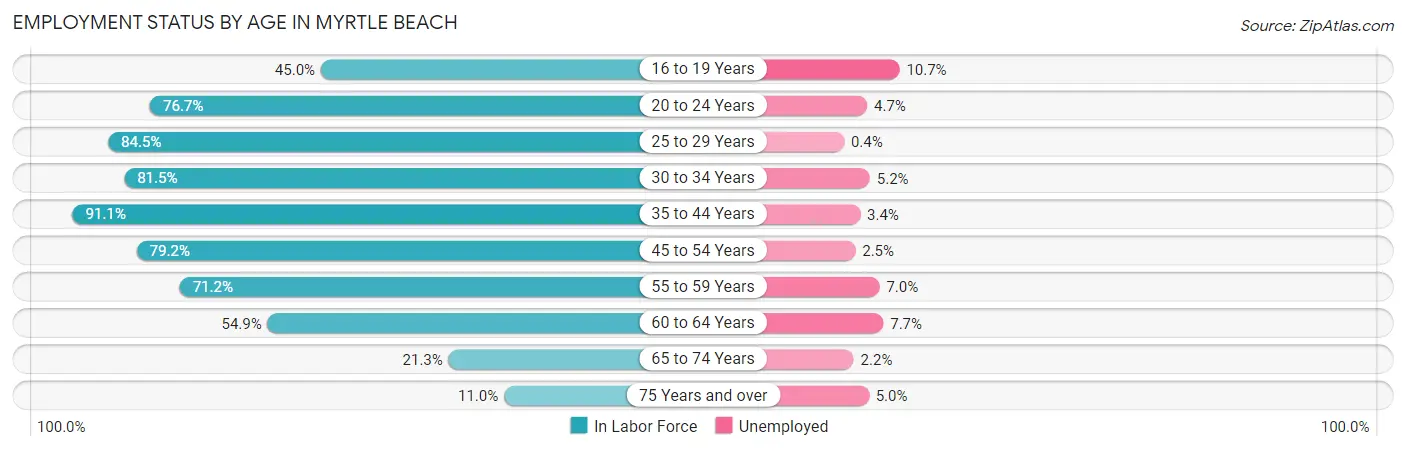
| Age Bracket | In Labor Force | Unemployed |
| 16 to 19 Years | 588 (45.0%) | 63 (10.7%) |
| 20 to 24 Years | 1,289 (76.7%) | 61 (4.7%) |
| 25 to 29 Years | 1,864 (84.5%) | 7 (0.4%) |
| 30 to 34 Years | 1,743 (81.5%) | 91 (5.2%) |
| 35 to 44 Years | 3,841 (91.1%) | 131 (3.4%) |
| 45 to 54 Years | 3,657 (79.2%) | 91 (2.5%) |
| 55 to 59 Years | 2,215 (71.2%) | 155 (7.0%) |
| 60 to 64 Years | 1,874 (54.9%) | 144 (7.7%) |
| 65 to 74 Years | 1,170 (21.3%) | 26 (2.2%) |
| 75 Years and over | 279 (11.0%) | 14 (5.0%) |
| Total | 18,526 (60.3%) | 778 (4.2%) |
Employment Status by Educational Attainment in Myrtle Beach
According to labor force statistics for Myrtle Beach, 77.1% of individuals (15,191) out of the total population between 25 and 64 years of age (19,703) are in the labor force, with 4.1% or 623 of them being unemployed. The group with the highest labor force participation rate are those with the educational attainment of bachelor's degree or higher, with 80.0% or 5,078 individuals in the labor force. Within the labor force, individuals with less than high school education have the highest percentage of unemployment, with 7.5% or 95 of them being unemployed.
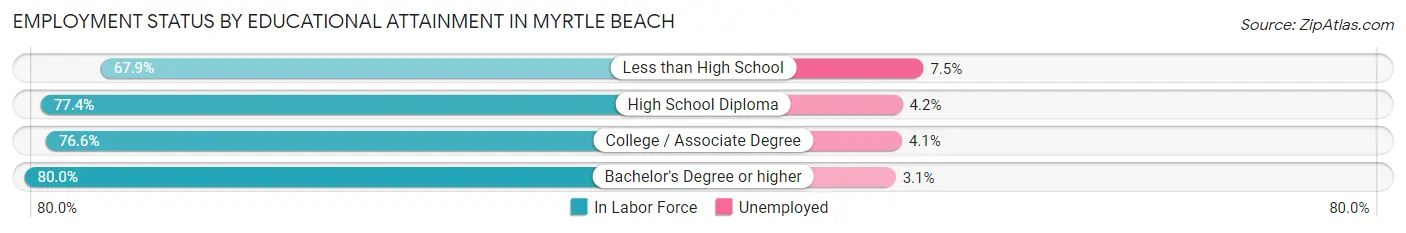
| Educational Attainment | In Labor Force | Unemployed |
| Less than High School | 1,262 (67.9%) | 139 (7.5%) |
| High School Diploma | 4,610 (77.4%) | 250 (4.2%) |
| College / Associate Degree | 4,244 (76.6%) | 227 (4.1%) |
| Bachelor's Degree or higher | 5,078 (80.0%) | 197 (3.1%) |
| Total | 15,191 (77.1%) | 808 (4.1%) |
Employment Occupations by Sex in Myrtle Beach
Management, Business, Science and Arts Occupations
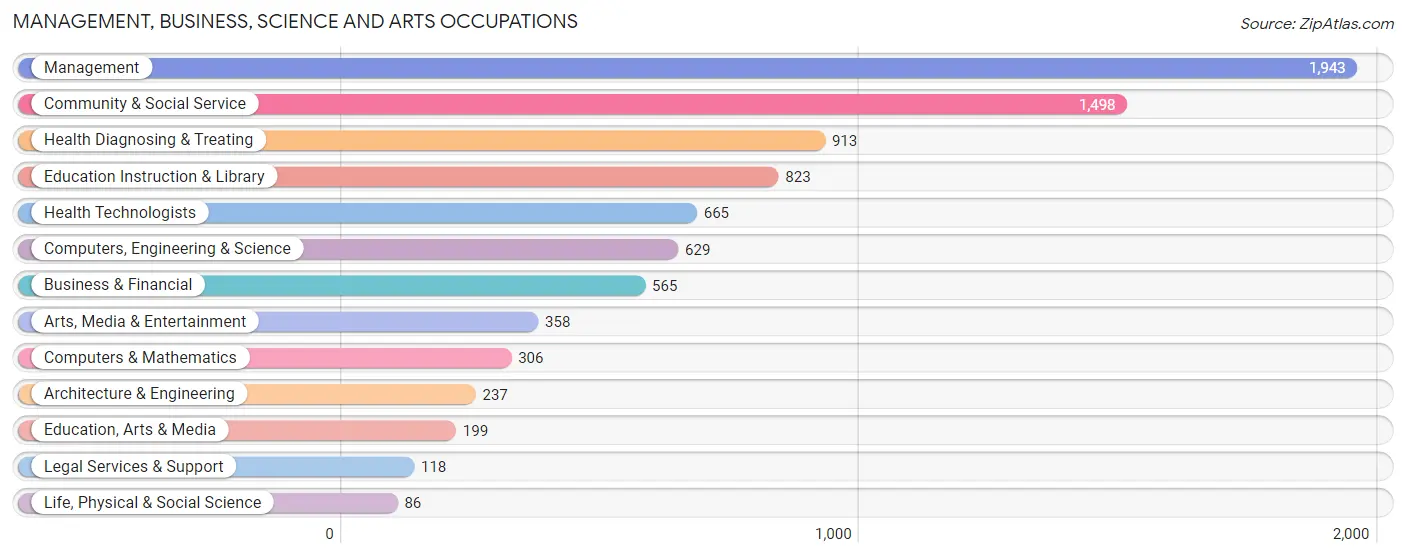
The most common Management, Business, Science and Arts occupations in Myrtle Beach are Management (1,943 | 11.0%), Community & Social Service (1,498 | 8.5%), Health Diagnosing & Treating (913 | 5.1%), Education Instruction & Library (823 | 4.6%), and Health Technologists (665 | 3.7%).
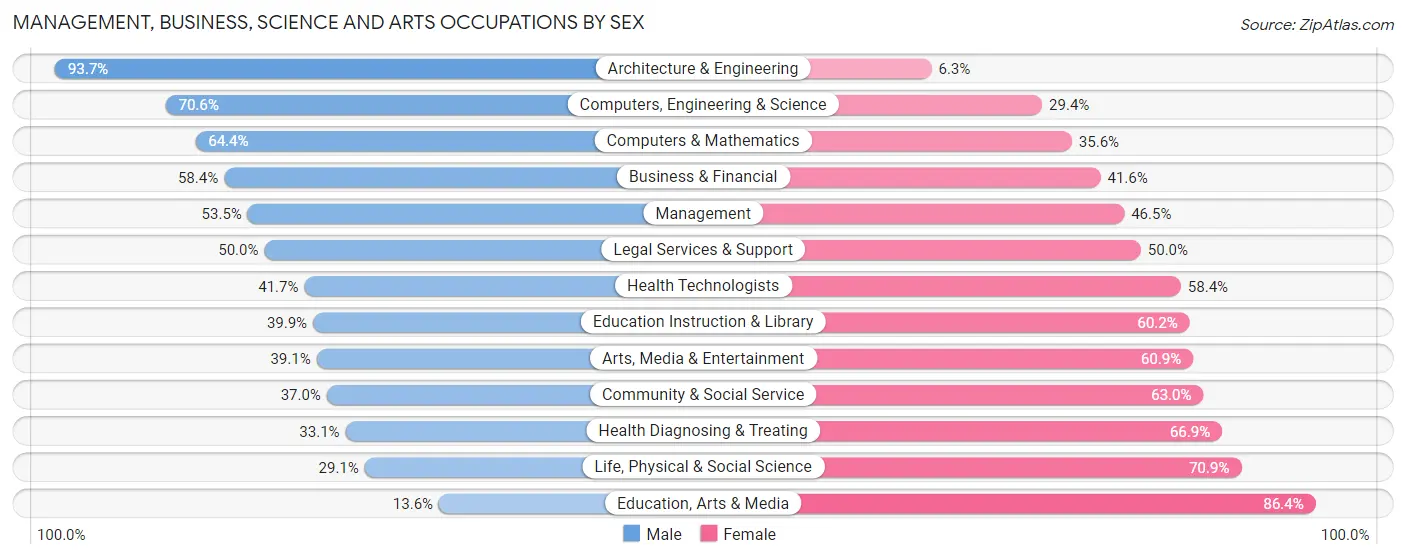
Management, Business, Science and Arts Occupations by Sex
Within the Management, Business, Science and Arts occupations in Myrtle Beach, the most male-oriented occupations are Architecture & Engineering (93.7%), Computers, Engineering & Science (70.6%), and Computers & Mathematics (64.4%), while the most female-oriented occupations are Education, Arts & Media (86.4%), Life, Physical & Social Science (70.9%), and Health Diagnosing & Treating (66.9%).
| Occupation | Male | Female |
| Management | 1,039 (53.5%) | 904 (46.5%) |
| Business & Financial | 330 (58.4%) | 235 (41.6%) |
| Computers, Engineering & Science | 444 (70.6%) | 185 (29.4%) |
| Computers & Mathematics | 197 (64.4%) | 109 (35.6%) |
| Architecture & Engineering | 222 (93.7%) | 15 (6.3%) |
| Life, Physical & Social Science | 25 (29.1%) | 61 (70.9%) |
| Community & Social Service | 554 (37.0%) | 944 (63.0%) |
| Education, Arts & Media | 27 (13.6%) | 172 (86.4%) |
| Legal Services & Support | 59 (50.0%) | 59 (50.0%) |
| Education Instruction & Library | 328 (39.9%) | 495 (60.2%) |
| Arts, Media & Entertainment | 140 (39.1%) | 218 (60.9%) |
| Health Diagnosing & Treating | 302 (33.1%) | 611 (66.9%) |
| Health Technologists | 277 (41.6%) | 388 (58.4%) |
| Total (Category) | 2,669 (48.1%) | 2,879 (51.9%) |
| Total (Overall) | 9,198 (51.9%) | 8,535 (48.1%) |
Services Occupations
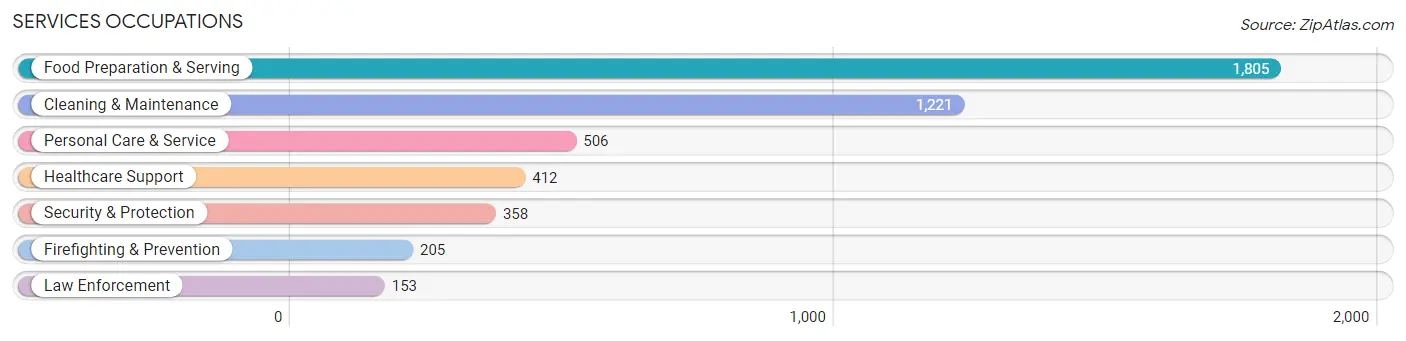
The most common Services occupations in Myrtle Beach are Food Preparation & Serving (1,805 | 10.2%), Cleaning & Maintenance (1,221 | 6.9%), Personal Care & Service (506 | 2.9%), Healthcare Support (412 | 2.3%), and Security & Protection (358 | 2.0%).
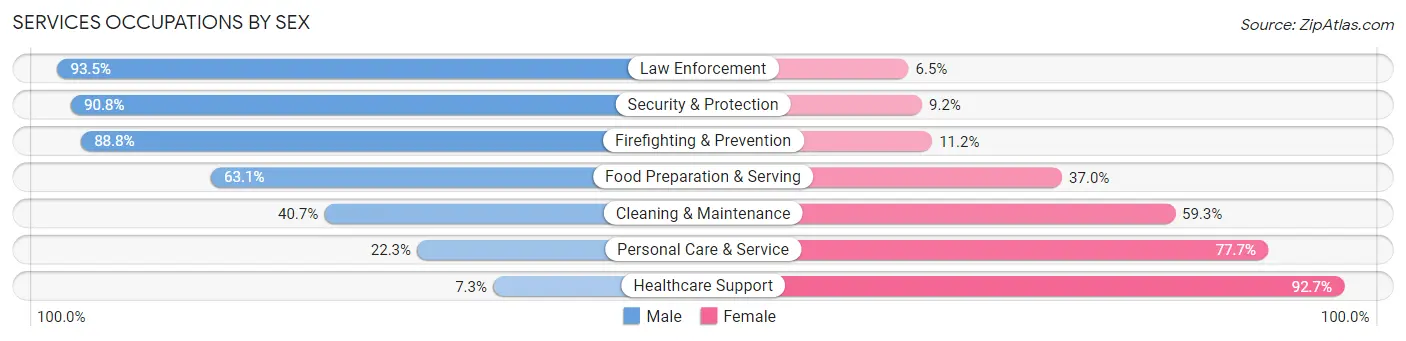
Services Occupations by Sex
Within the Services occupations in Myrtle Beach, the most male-oriented occupations are Law Enforcement (93.5%), Security & Protection (90.8%), and Firefighting & Prevention (88.8%), while the most female-oriented occupations are Healthcare Support (92.7%), Personal Care & Service (77.7%), and Cleaning & Maintenance (59.3%).
| Occupation | Male | Female |
| Healthcare Support | 30 (7.3%) | 382 (92.7%) |
| Security & Protection | 325 (90.8%) | 33 (9.2%) |
| Firefighting & Prevention | 182 (88.8%) | 23 (11.2%) |
| Law Enforcement | 143 (93.5%) | 10 (6.5%) |
| Food Preparation & Serving | 1,138 (63.0%) | 667 (36.9%) |
| Cleaning & Maintenance | 497 (40.7%) | 724 (59.3%) |
| Personal Care & Service | 113 (22.3%) | 393 (77.7%) |
| Total (Category) | 2,103 (48.9%) | 2,199 (51.1%) |
| Total (Overall) | 9,198 (51.9%) | 8,535 (48.1%) |
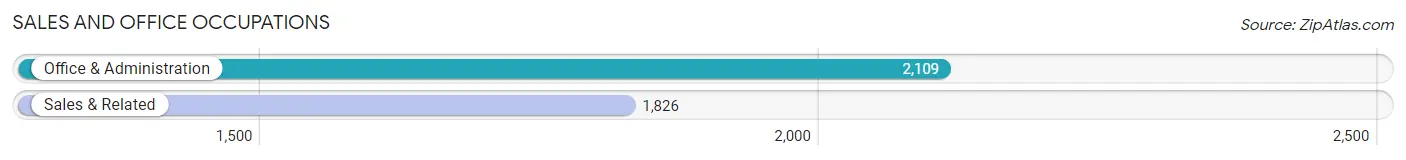
Sales and Office Occupations
The most common Sales and Office occupations in Myrtle Beach are Office & Administration (2,109 | 11.9%), and Sales & Related (1,826 | 10.3%).
Sales and Office Occupations by Sex
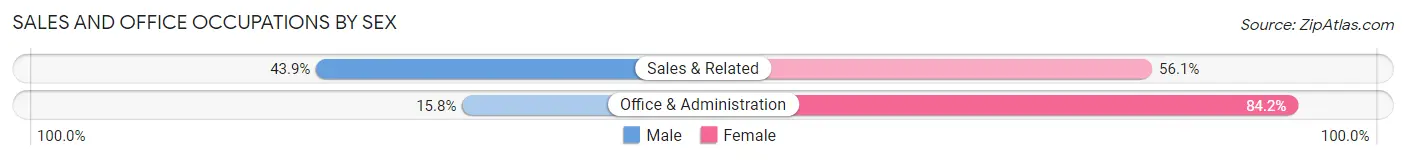
| Occupation | Male | Female |
| Sales & Related | 802 (43.9%) | 1,024 (56.1%) |
| Office & Administration | 334 (15.8%) | 1,775 (84.2%) |
| Total (Category) | 1,136 (28.9%) | 2,799 (71.1%) |
| Total (Overall) | 9,198 (51.9%) | 8,535 (48.1%) |
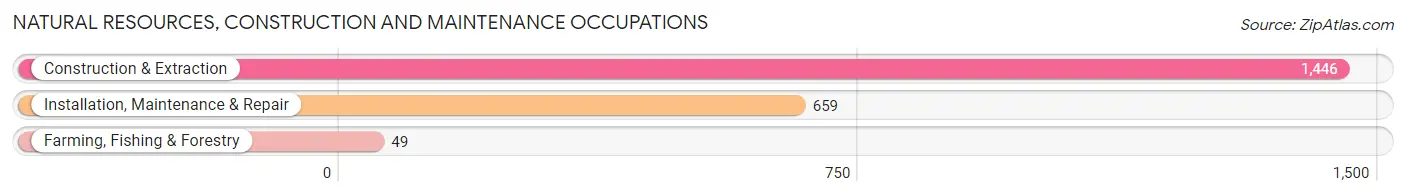
Natural Resources, Construction and Maintenance Occupations
The most common Natural Resources, Construction and Maintenance occupations in Myrtle Beach are Construction & Extraction (1,446 | 8.2%), Installation, Maintenance & Repair (659 | 3.7%), and Farming, Fishing & Forestry (49 | 0.3%).
Natural Resources, Construction and Maintenance Occupations by Sex
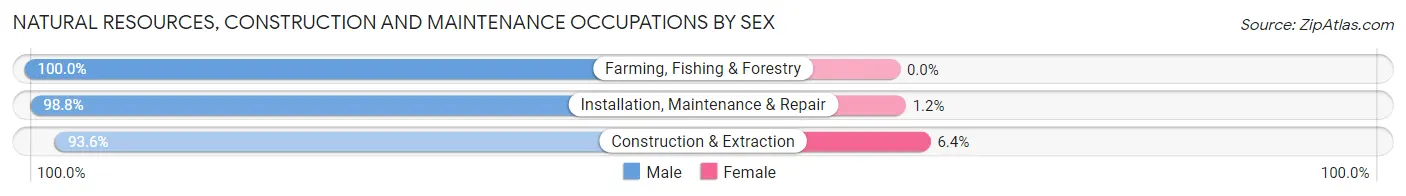
| Occupation | Male | Female |
| Farming, Fishing & Forestry | 49 (100.0%) | 0 (0.0%) |
| Construction & Extraction | 1,354 (93.6%) | 92 (6.4%) |
| Installation, Maintenance & Repair | 651 (98.8%) | 8 (1.2%) |
| Total (Category) | 2,054 (95.4%) | 100 (4.6%) |
| Total (Overall) | 9,198 (51.9%) | 8,535 (48.1%) |
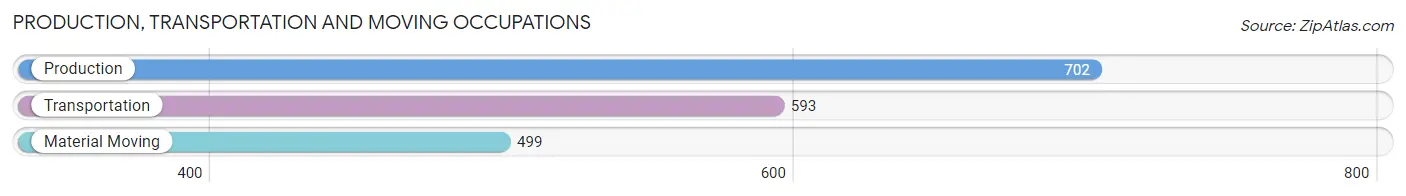
Production, Transportation and Moving Occupations
The most common Production, Transportation and Moving occupations in Myrtle Beach are Production (702 | 4.0%), Transportation (593 | 3.3%), and Material Moving (499 | 2.8%).
Production, Transportation and Moving Occupations by Sex
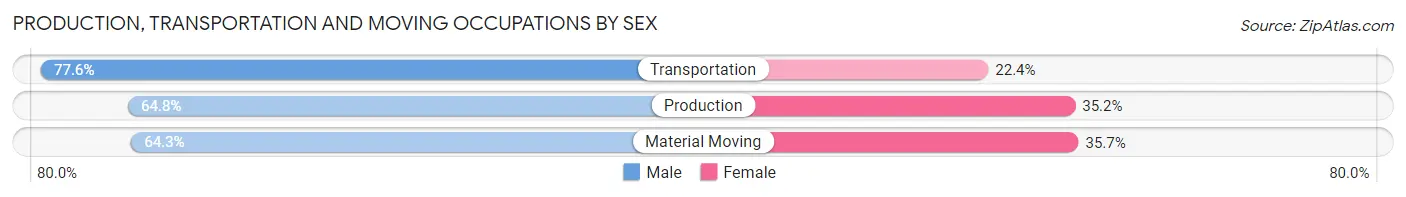
| Occupation | Male | Female |
| Production | 455 (64.8%) | 247 (35.2%) |
| Transportation | 460 (77.6%) | 133 (22.4%) |
| Material Moving | 321 (64.3%) | 178 (35.7%) |
| Total (Category) | 1,236 (68.9%) | 558 (31.1%) |
| Total (Overall) | 9,198 (51.9%) | 8,535 (48.1%) |
Employment Industries by Sex in Myrtle Beach
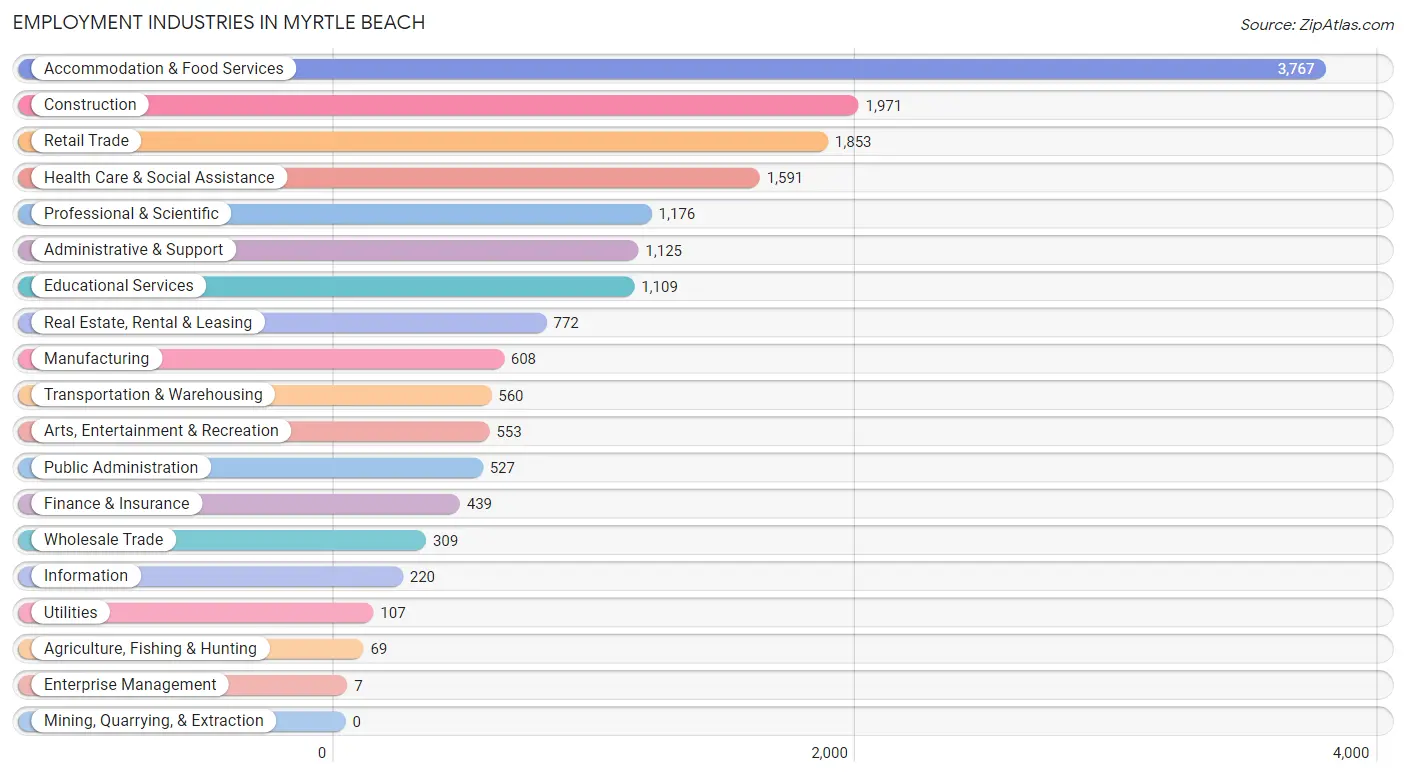
Employment Industries in Myrtle Beach
The major employment industries in Myrtle Beach include Accommodation & Food Services (3,767 | 21.2%), Construction (1,971 | 11.1%), Retail Trade (1,853 | 10.4%), Health Care & Social Assistance (1,591 | 9.0%), and Professional & Scientific (1,176 | 6.6%).
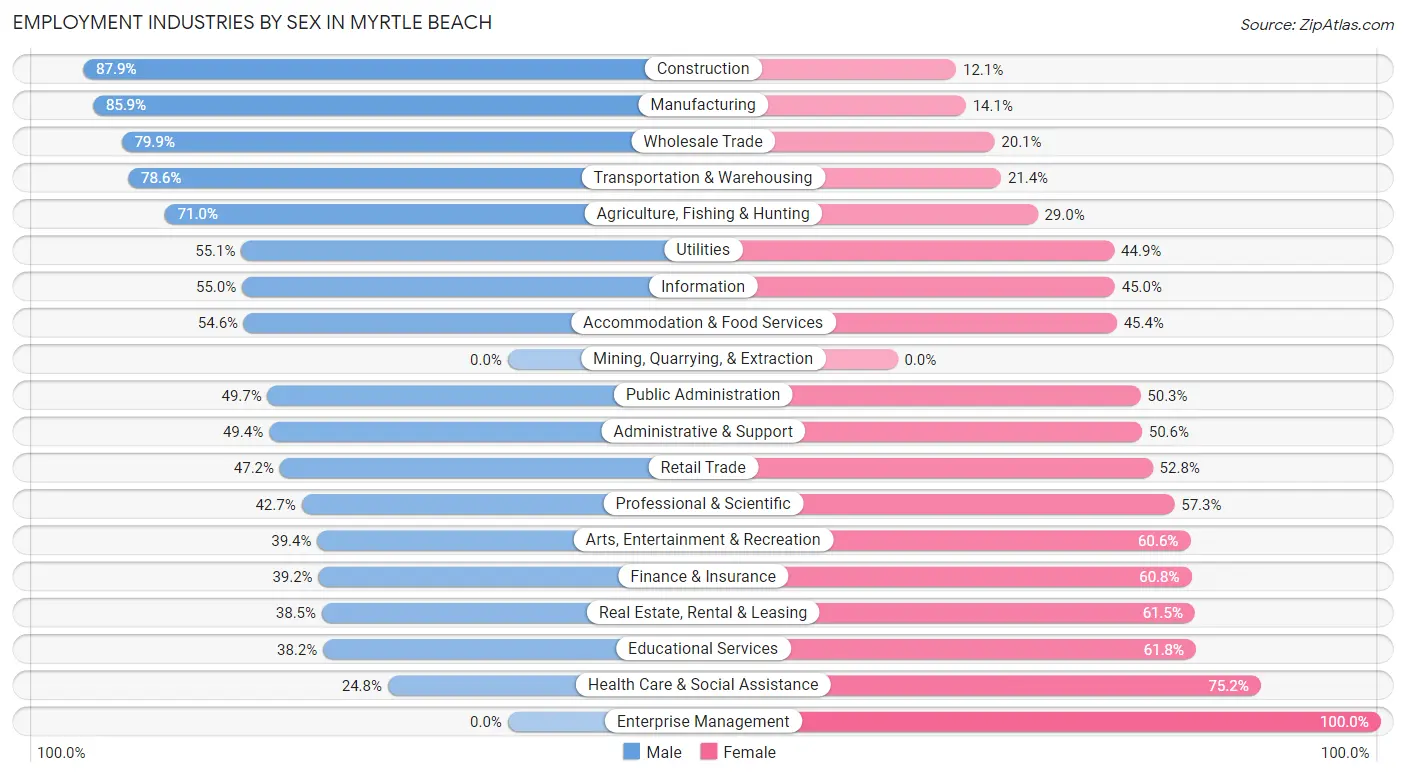
Employment Industries by Sex in Myrtle Beach
The Myrtle Beach industries that see more men than women are Construction (87.9%), Manufacturing (85.9%), and Wholesale Trade (79.9%), whereas the industries that tend to have a higher number of women are Enterprise Management (100.0%), Health Care & Social Assistance (75.2%), and Educational Services (61.8%).
| Industry | Male | Female |
| Agriculture, Fishing & Hunting | 49 (71.0%) | 20 (29.0%) |
| Mining, Quarrying, & Extraction | 0 (0.0%) | 0 (0.0%) |
| Construction | 1,732 (87.9%) | 239 (12.1%) |
| Manufacturing | 522 (85.9%) | 86 (14.1%) |
| Wholesale Trade | 247 (79.9%) | 62 (20.1%) |
| Retail Trade | 874 (47.2%) | 979 (52.8%) |
| Transportation & Warehousing | 440 (78.6%) | 120 (21.4%) |
| Utilities | 59 (55.1%) | 48 (44.9%) |
| Information | 121 (55.0%) | 99 (45.0%) |
| Finance & Insurance | 172 (39.2%) | 267 (60.8%) |
| Real Estate, Rental & Leasing | 297 (38.5%) | 475 (61.5%) |
| Professional & Scientific | 502 (42.7%) | 674 (57.3%) |
| Enterprise Management | 0 (0.0%) | 7 (100.0%) |
| Administrative & Support | 556 (49.4%) | 569 (50.6%) |
| Educational Services | 424 (38.2%) | 685 (61.8%) |
| Health Care & Social Assistance | 395 (24.8%) | 1,196 (75.2%) |
| Arts, Entertainment & Recreation | 218 (39.4%) | 335 (60.6%) |
| Accommodation & Food Services | 2,057 (54.6%) | 1,710 (45.4%) |
| Public Administration | 262 (49.7%) | 265 (50.3%) |
| Total | 9,198 (51.9%) | 8,535 (48.1%) |
Education in Myrtle Beach
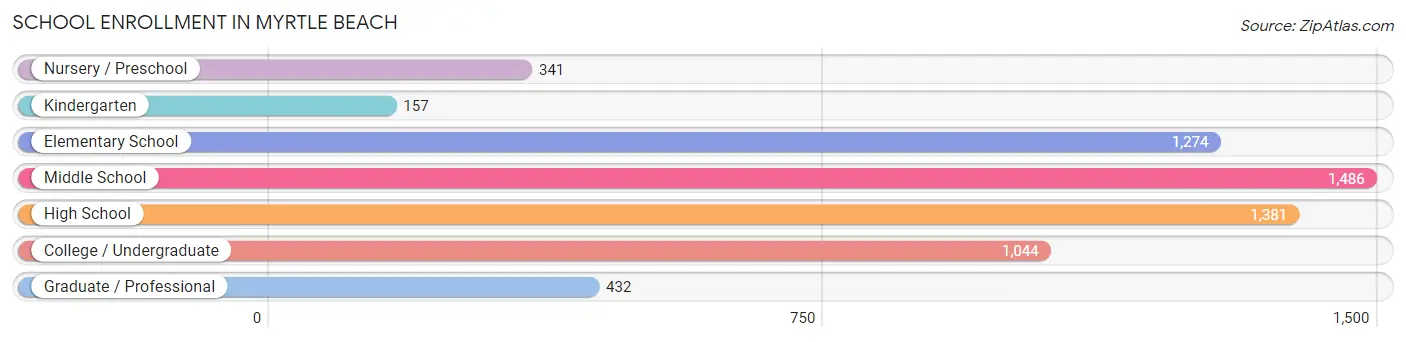
School Enrollment in Myrtle Beach
The most common levels of schooling among the 6,115 students in Myrtle Beach are middle school (1,486 | 24.3%), high school (1,381 | 22.6%), and elementary school (1,274 | 20.8%).
| School Level | # Students | % Students |
| Nursery / Preschool | 341 | 5.6% |
| Kindergarten | 157 | 2.6% |
| Elementary School | 1,274 | 20.8% |
| Middle School | 1,486 | 24.3% |
| High School | 1,381 | 22.6% |
| College / Undergraduate | 1,044 | 17.1% |
| Graduate / Professional | 432 | 7.1% |
| Total | 6,115 | 100.0% |
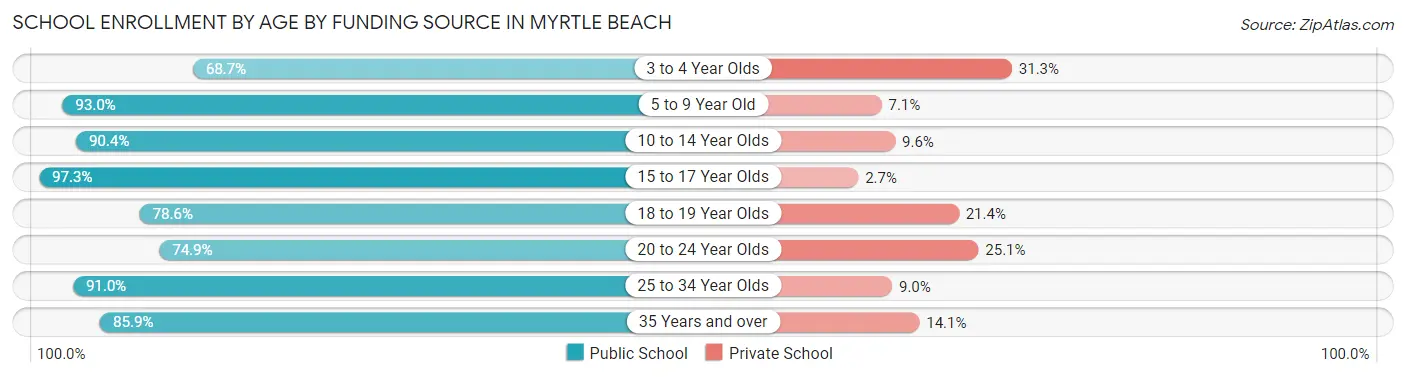
School Enrollment by Age by Funding Source in Myrtle Beach
Out of a total of 6,115 students who are enrolled in schools in Myrtle Beach, 685 (11.2%) attend a private institution, while the remaining 5,430 (88.8%) are enrolled in public schools. The age group of 3 to 4 year olds has the highest likelihood of being enrolled in private schools, with 78 (31.3% in the age bracket) enrolled. Conversely, the age group of 15 to 17 year olds has the lowest likelihood of being enrolled in a private school, with 971 (97.3% in the age bracket) attending a public institution.
| Age Bracket | Public School | Private School |
| 3 to 4 Year Olds | 171 (68.7%) | 78 (31.3%) |
| 5 to 9 Year Old | 1,293 (92.9%) | 98 (7.0%) |
| 10 to 14 Year Olds | 1,519 (90.4%) | 161 (9.6%) |
| 15 to 17 Year Olds | 971 (97.3%) | 27 (2.7%) |
| 18 to 19 Year Olds | 341 (78.6%) | 93 (21.4%) |
| 20 to 24 Year Olds | 403 (74.9%) | 135 (25.1%) |
| 25 to 34 Year Olds | 434 (91.0%) | 43 (9.0%) |
| 35 Years and over | 299 (85.9%) | 49 (14.1%) |
| Total | 5,430 (88.8%) | 685 (11.2%) |
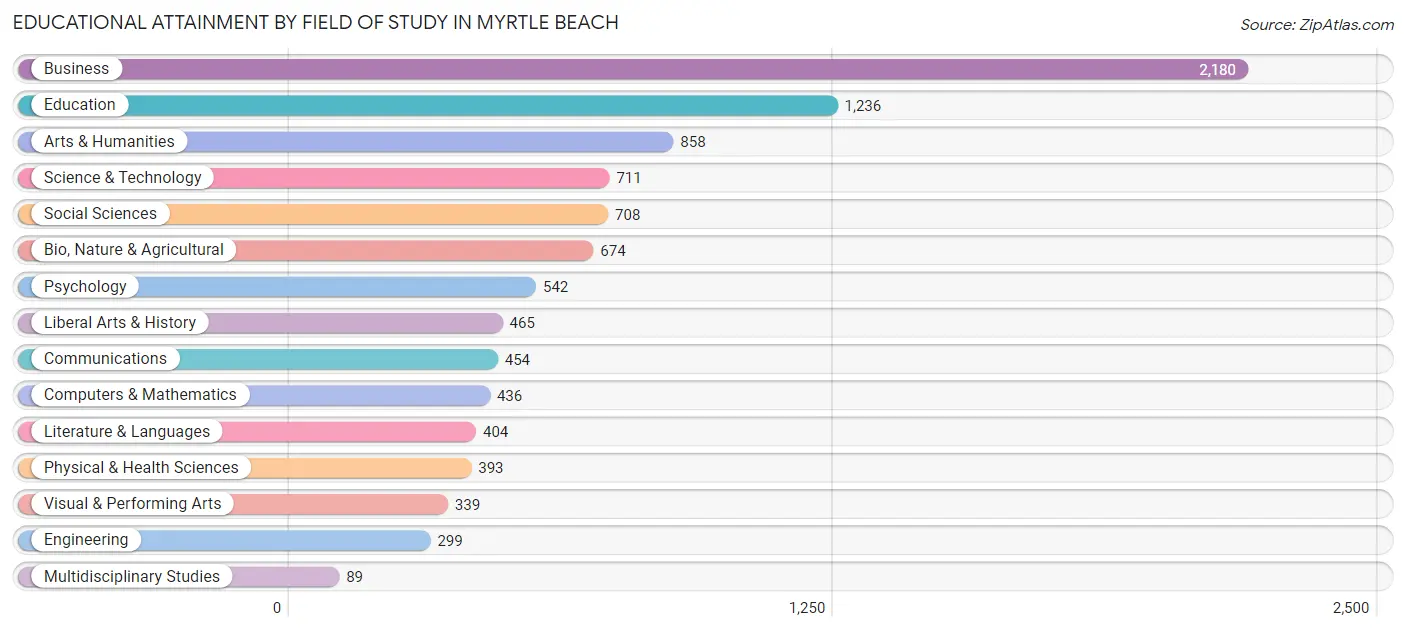
Educational Attainment by Field of Study in Myrtle Beach
Business (2,180 | 22.3%), education (1,236 | 12.6%), arts & humanities (858 | 8.8%), science & technology (711 | 7.3%), and social sciences (708 | 7.2%) are the most common fields of study among 9,788 individuals in Myrtle Beach who have obtained a bachelor's degree or higher.
| Field of Study | # Graduates | % Graduates |
| Computers & Mathematics | 436 | 4.4% |
| Bio, Nature & Agricultural | 674 | 6.9% |
| Physical & Health Sciences | 393 | 4.0% |
| Psychology | 542 | 5.5% |
| Social Sciences | 708 | 7.2% |
| Engineering | 299 | 3.0% |
| Multidisciplinary Studies | 89 | 0.9% |
| Science & Technology | 711 | 7.3% |
| Business | 2,180 | 22.3% |
| Education | 1,236 | 12.6% |
| Literature & Languages | 404 | 4.1% |
| Liberal Arts & History | 465 | 4.8% |
| Visual & Performing Arts | 339 | 3.5% |
| Communications | 454 | 4.6% |
| Arts & Humanities | 858 | 8.8% |
| Total | 9,788 | 100.0% |
Transportation & Commute in Myrtle Beach
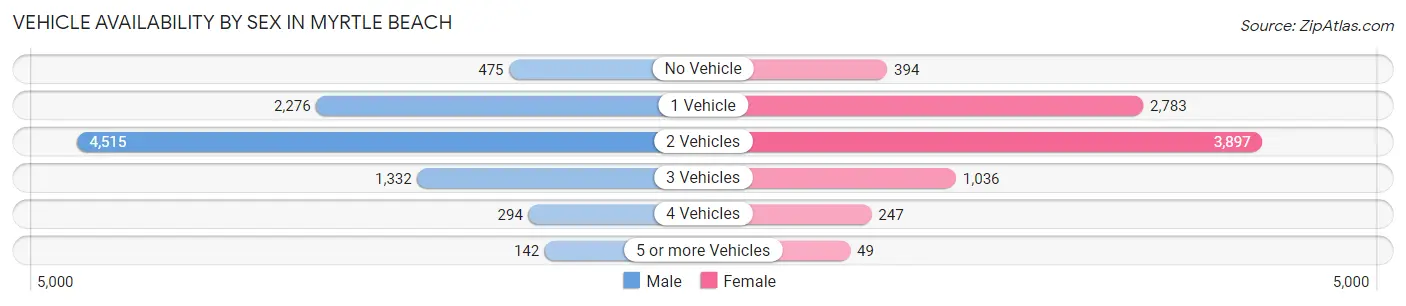
Vehicle Availability by Sex in Myrtle Beach
The most prevalent vehicle ownership categories in Myrtle Beach are males with 2 vehicles (4,515, accounting for 50.0%) and females with 2 vehicles (3,897, making up 53.7%).
| Vehicles Available | Male | Female |
| No Vehicle | 475 (5.3%) | 394 (4.7%) |
| 1 Vehicle | 2,276 (25.2%) | 2,783 (33.1%) |
| 2 Vehicles | 4,515 (50.0%) | 3,897 (46.4%) |
| 3 Vehicles | 1,332 (14.7%) | 1,036 (12.3%) |
| 4 Vehicles | 294 (3.3%) | 247 (2.9%) |
| 5 or more Vehicles | 142 (1.6%) | 49 (0.6%) |
| Total | 9,034 (100.0%) | 8,406 (100.0%) |
Commute Time in Myrtle Beach
The most frequently occuring commute durations in Myrtle Beach are 10 to 14 minutes (3,606 commuters, 22.9%), 15 to 19 minutes (3,110 commuters, 19.7%), and 20 to 24 minutes (2,691 commuters, 17.1%).
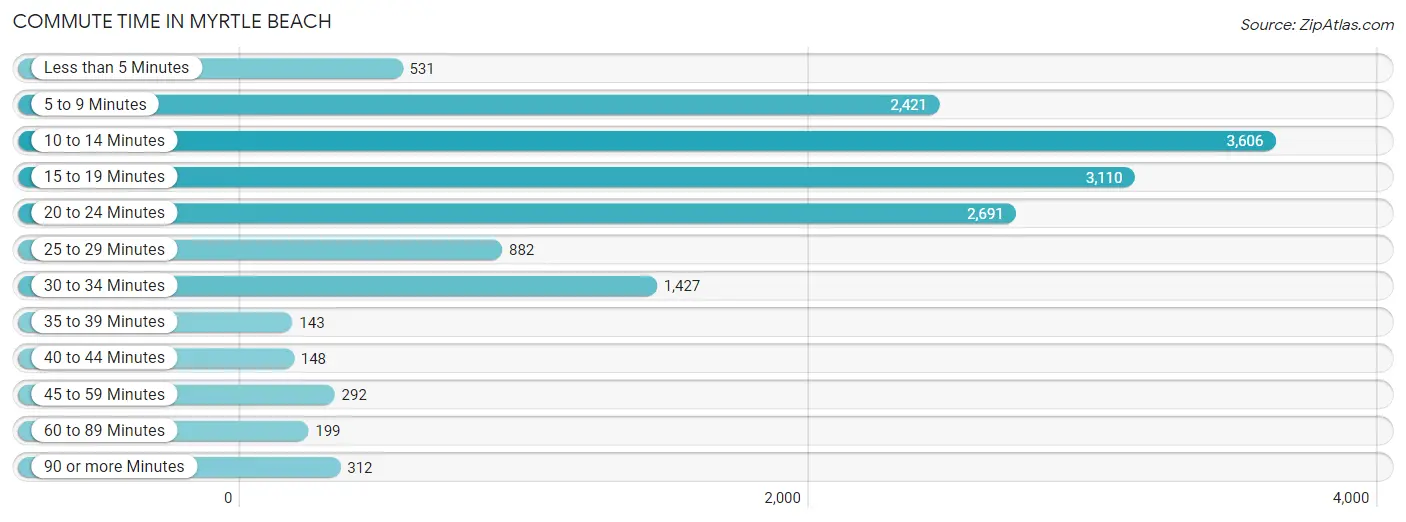
| Commute Time | # Commuters | % Commuters |
| Less than 5 Minutes | 531 | 3.4% |
| 5 to 9 Minutes | 2,421 | 15.4% |
| 10 to 14 Minutes | 3,606 | 22.9% |
| 15 to 19 Minutes | 3,110 | 19.7% |
| 20 to 24 Minutes | 2,691 | 17.1% |
| 25 to 29 Minutes | 882 | 5.6% |
| 30 to 34 Minutes | 1,427 | 9.0% |
| 35 to 39 Minutes | 143 | 0.9% |
| 40 to 44 Minutes | 148 | 0.9% |
| 45 to 59 Minutes | 292 | 1.8% |
| 60 to 89 Minutes | 199 | 1.3% |
| 90 or more Minutes | 312 | 2.0% |
Commute Time by Sex in Myrtle Beach
The most common commute times in Myrtle Beach are 10 to 14 minutes (1,942 commuters, 23.9%) for males and 10 to 14 minutes (1,664 commuters, 21.8%) for females.
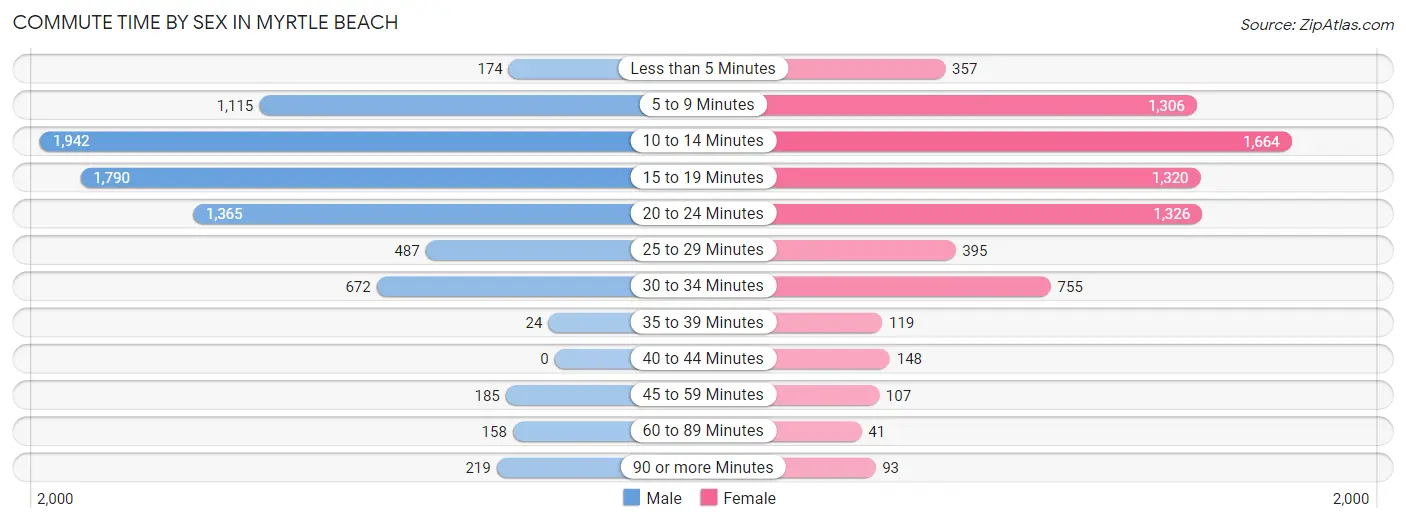
| Commute Time | Male | Female |
| Less than 5 Minutes | 174 (2.1%) | 357 (4.7%) |
| 5 to 9 Minutes | 1,115 (13.7%) | 1,306 (17.1%) |
| 10 to 14 Minutes | 1,942 (23.9%) | 1,664 (21.8%) |
| 15 to 19 Minutes | 1,790 (22.0%) | 1,320 (17.3%) |
| 20 to 24 Minutes | 1,365 (16.8%) | 1,326 (17.4%) |
| 25 to 29 Minutes | 487 (6.0%) | 395 (5.2%) |
| 30 to 34 Minutes | 672 (8.3%) | 755 (9.9%) |
| 35 to 39 Minutes | 24 (0.3%) | 119 (1.6%) |
| 40 to 44 Minutes | 0 (0.0%) | 148 (1.9%) |
| 45 to 59 Minutes | 185 (2.3%) | 107 (1.4%) |
| 60 to 89 Minutes | 158 (1.9%) | 41 (0.5%) |
| 90 or more Minutes | 219 (2.7%) | 93 (1.2%) |
Time of Departure to Work by Sex in Myrtle Beach
The most frequent times of departure to work in Myrtle Beach are 8:00 AM to 8:29 AM (2,037, 25.1%) for males and 8:00 AM to 8:29 AM (1,187, 15.5%) for females.
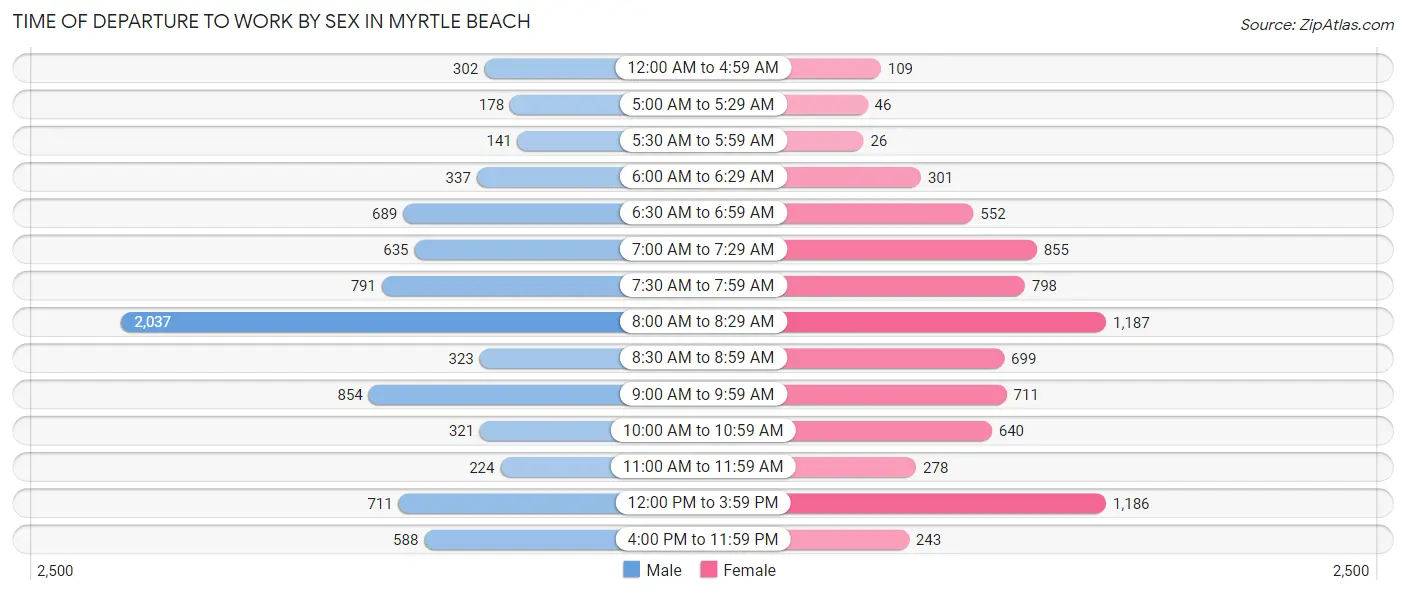
| Time of Departure | Male | Female |
| 12:00 AM to 4:59 AM | 302 (3.7%) | 109 (1.4%) |
| 5:00 AM to 5:29 AM | 178 (2.2%) | 46 (0.6%) |
| 5:30 AM to 5:59 AM | 141 (1.7%) | 26 (0.3%) |
| 6:00 AM to 6:29 AM | 337 (4.1%) | 301 (3.9%) |
| 6:30 AM to 6:59 AM | 689 (8.5%) | 552 (7.2%) |
| 7:00 AM to 7:29 AM | 635 (7.8%) | 855 (11.2%) |
| 7:30 AM to 7:59 AM | 791 (9.7%) | 798 (10.5%) |
| 8:00 AM to 8:29 AM | 2,037 (25.1%) | 1,187 (15.5%) |
| 8:30 AM to 8:59 AM | 323 (4.0%) | 699 (9.2%) |
| 9:00 AM to 9:59 AM | 854 (10.5%) | 711 (9.3%) |
| 10:00 AM to 10:59 AM | 321 (4.0%) | 640 (8.4%) |
| 11:00 AM to 11:59 AM | 224 (2.8%) | 278 (3.6%) |
| 12:00 PM to 3:59 PM | 711 (8.7%) | 1,186 (15.5%) |
| 4:00 PM to 11:59 PM | 588 (7.2%) | 243 (3.2%) |
| Total | 8,131 (100.0%) | 7,631 (100.0%) |
Housing Occupancy in Myrtle Beach
Occupancy by Ownership in Myrtle Beach
Of the total 16,201 dwellings in Myrtle Beach, owner-occupied units account for 9,816 (60.6%), while renter-occupied units make up 6,385 (39.4%).
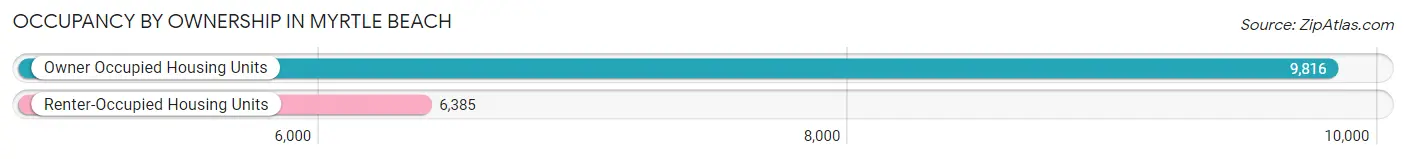
| Occupancy | # Housing Units | % Housing Units |
| Owner Occupied Housing Units | 9,816 | 60.6% |
| Renter-Occupied Housing Units | 6,385 | 39.4% |
| Total Occupied Housing Units | 16,201 | 100.0% |
Occupancy by Household Size in Myrtle Beach
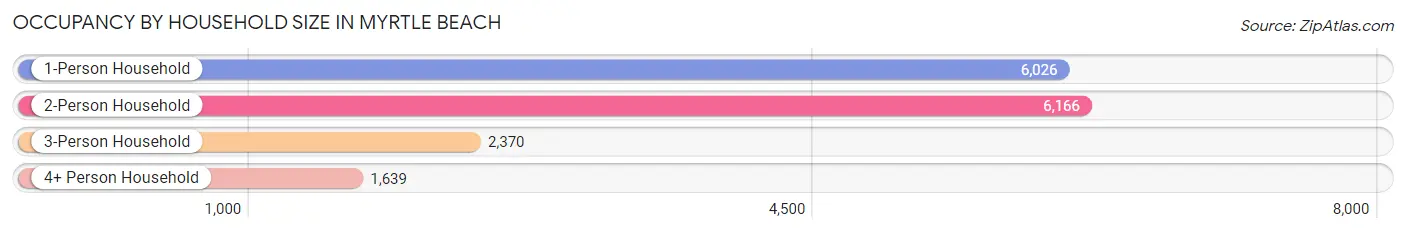
| Household Size | # Housing Units | % Housing Units |
| 1-Person Household | 6,026 | 37.2% |
| 2-Person Household | 6,166 | 38.1% |
| 3-Person Household | 2,370 | 14.6% |
| 4+ Person Household | 1,639 | 10.1% |
| Total Housing Units | 16,201 | 100.0% |
Occupancy by Ownership by Household Size in Myrtle Beach
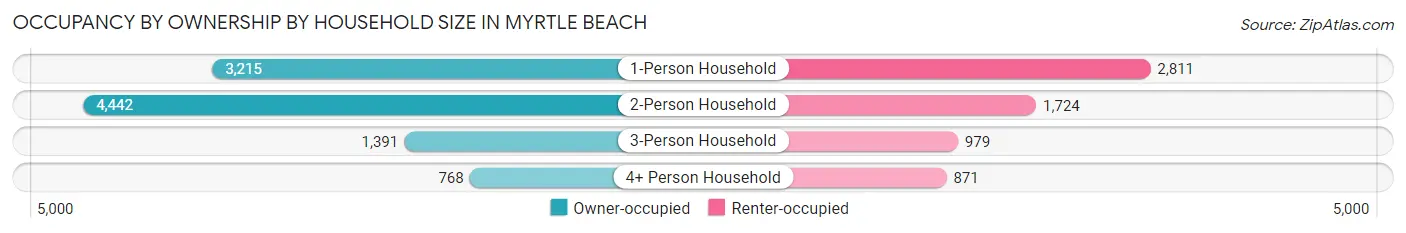
| Household Size | Owner-occupied | Renter-occupied |
| 1-Person Household | 3,215 (53.3%) | 2,811 (46.7%) |
| 2-Person Household | 4,442 (72.0%) | 1,724 (28.0%) |
| 3-Person Household | 1,391 (58.7%) | 979 (41.3%) |
| 4+ Person Household | 768 (46.9%) | 871 (53.1%) |
| Total Housing Units | 9,816 (60.6%) | 6,385 (39.4%) |
Occupancy by Educational Attainment in Myrtle Beach
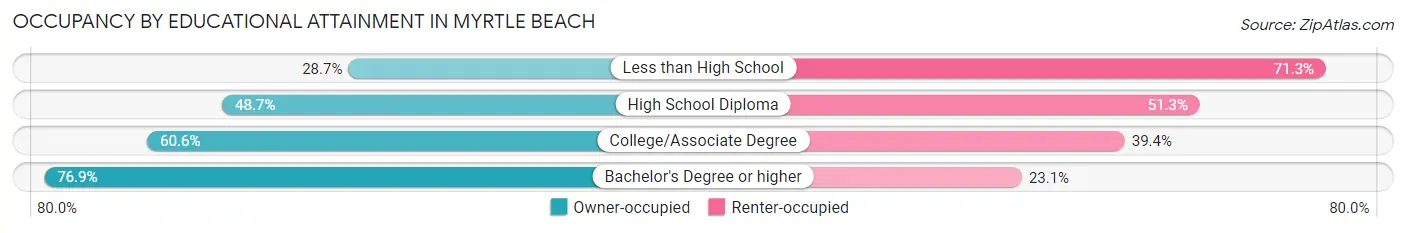
| Household Size | Owner-occupied | Renter-occupied |
| Less than High School | 330 (28.7%) | 821 (71.3%) |
| High School Diploma | 2,010 (48.7%) | 2,119 (51.3%) |
| College/Associate Degree | 3,417 (60.6%) | 2,224 (39.4%) |
| Bachelor's Degree or higher | 4,059 (76.9%) | 1,221 (23.1%) |
Occupancy by Age of Householder in Myrtle Beach
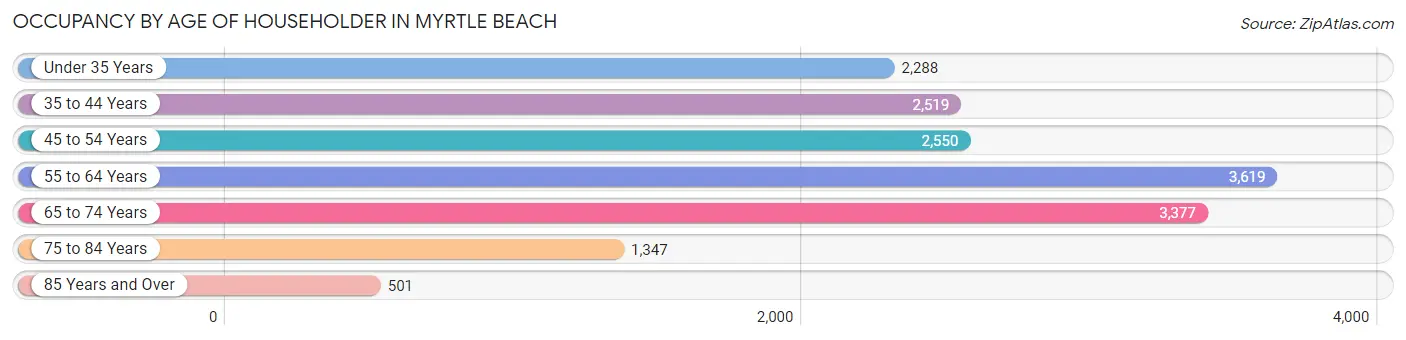
| Age Bracket | # Households | % Households |
| Under 35 Years | 2,288 | 14.1% |
| 35 to 44 Years | 2,519 | 15.5% |
| 45 to 54 Years | 2,550 | 15.7% |
| 55 to 64 Years | 3,619 | 22.3% |
| 65 to 74 Years | 3,377 | 20.8% |
| 75 to 84 Years | 1,347 | 8.3% |
| 85 Years and Over | 501 | 3.1% |
| Total | 16,201 | 100.0% |
Housing Finances in Myrtle Beach
Median Income by Occupancy in Myrtle Beach
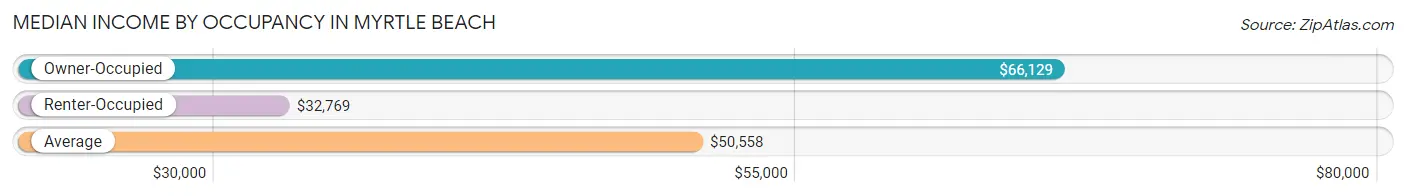
| Occupancy Type | # Households | Median Income |
| Owner-Occupied | 9,816 (60.6%) | $66,129 |
| Renter-Occupied | 6,385 (39.4%) | $32,769 |
| Average | 16,201 (100.0%) | $50,558 |
Occupancy by Householder Income Bracket in Myrtle Beach
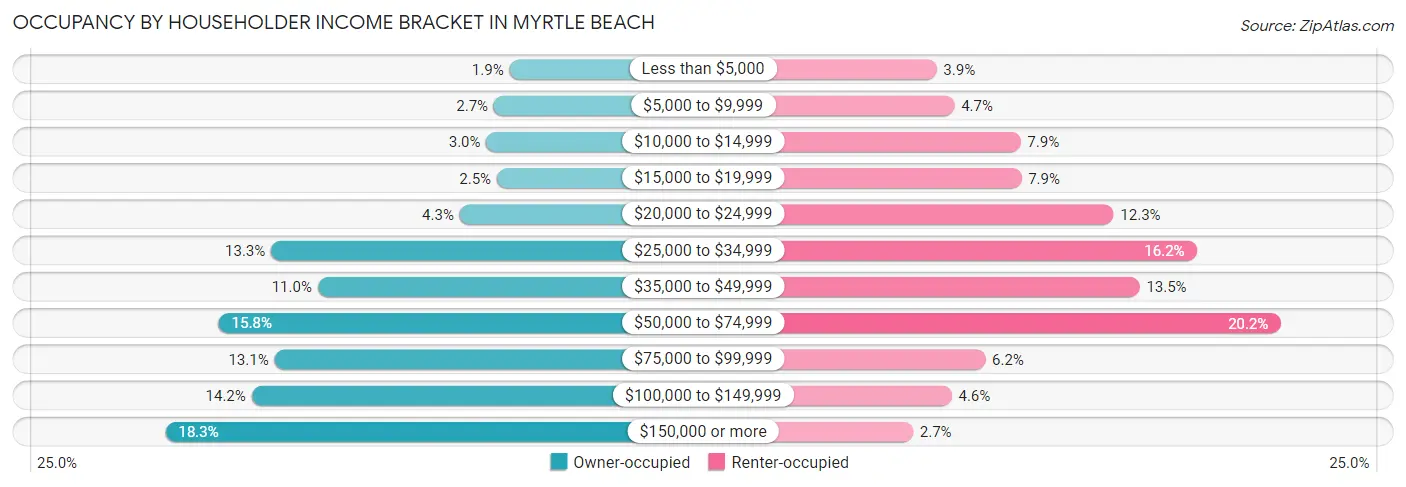
| Income Bracket | Owner-occupied | Renter-occupied |
| Less than $5,000 | 187 (1.9%) | 246 (3.8%) |
| $5,000 to $9,999 | 260 (2.6%) | 300 (4.7%) |
| $10,000 to $14,999 | 295 (3.0%) | 501 (7.9%) |
| $15,000 to $19,999 | 246 (2.5%) | 504 (7.9%) |
| $20,000 to $24,999 | 420 (4.3%) | 784 (12.3%) |
| $25,000 to $34,999 | 1,302 (13.3%) | 1,036 (16.2%) |
| $35,000 to $49,999 | 1,084 (11.0%) | 863 (13.5%) |
| $50,000 to $74,999 | 1,547 (15.8%) | 1,291 (20.2%) |
| $75,000 to $99,999 | 1,286 (13.1%) | 394 (6.2%) |
| $100,000 to $149,999 | 1,393 (14.2%) | 292 (4.6%) |
| $150,000 or more | 1,796 (18.3%) | 174 (2.7%) |
| Total | 9,816 (100.0%) | 6,385 (100.0%) |
Monthly Housing Cost Tiers in Myrtle Beach
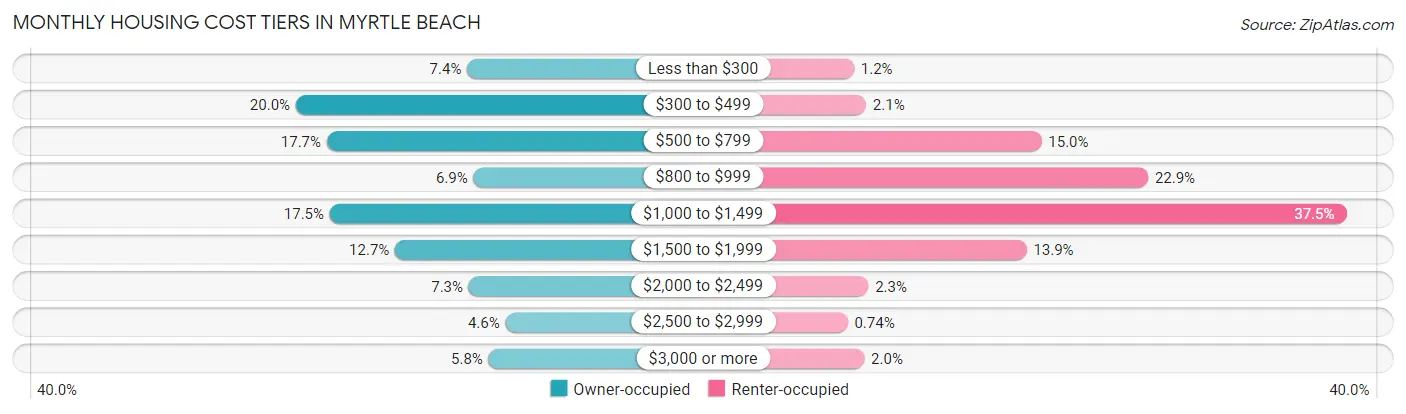
| Monthly Cost | Owner-occupied | Renter-occupied |
| Less than $300 | 726 (7.4%) | 77 (1.2%) |
| $300 to $499 | 1,965 (20.0%) | 134 (2.1%) |
| $500 to $799 | 1,741 (17.7%) | 959 (15.0%) |
| $800 to $999 | 680 (6.9%) | 1,460 (22.9%) |
| $1,000 to $1,499 | 1,720 (17.5%) | 2,393 (37.5%) |
| $1,500 to $1,999 | 1,248 (12.7%) | 889 (13.9%) |
| $2,000 to $2,499 | 715 (7.3%) | 145 (2.3%) |
| $2,500 to $2,999 | 450 (4.6%) | 47 (0.7%) |
| $3,000 or more | 571 (5.8%) | 126 (2.0%) |
| Total | 9,816 (100.0%) | 6,385 (100.0%) |
Physical Housing Characteristics in Myrtle Beach
Housing Structures in Myrtle Beach
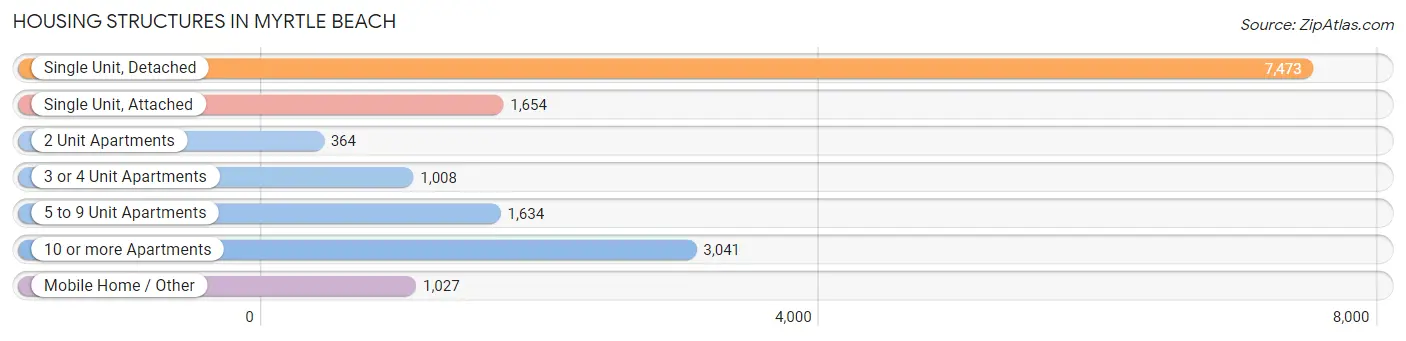
| Structure Type | # Housing Units | % Housing Units |
| Single Unit, Detached | 7,473 | 46.1% |
| Single Unit, Attached | 1,654 | 10.2% |
| 2 Unit Apartments | 364 | 2.2% |
| 3 or 4 Unit Apartments | 1,008 | 6.2% |
| 5 to 9 Unit Apartments | 1,634 | 10.1% |
| 10 or more Apartments | 3,041 | 18.8% |
| Mobile Home / Other | 1,027 | 6.3% |
| Total | 16,201 | 100.0% |
Housing Structures by Occupancy in Myrtle Beach
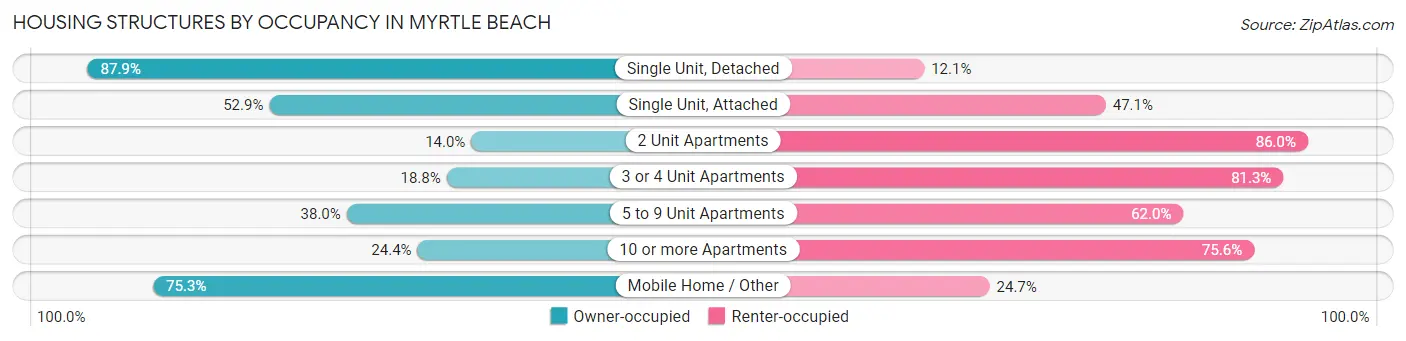
| Structure Type | Owner-occupied | Renter-occupied |
| Single Unit, Detached | 6,566 (87.9%) | 907 (12.1%) |
| Single Unit, Attached | 875 (52.9%) | 779 (47.1%) |
| 2 Unit Apartments | 51 (14.0%) | 313 (86.0%) |
| 3 or 4 Unit Apartments | 189 (18.8%) | 819 (81.2%) |
| 5 to 9 Unit Apartments | 621 (38.0%) | 1,013 (62.0%) |
| 10 or more Apartments | 741 (24.4%) | 2,300 (75.6%) |
| Mobile Home / Other | 773 (75.3%) | 254 (24.7%) |
| Total | 9,816 (60.6%) | 6,385 (39.4%) |
Housing Structures by Number of Rooms in Myrtle Beach
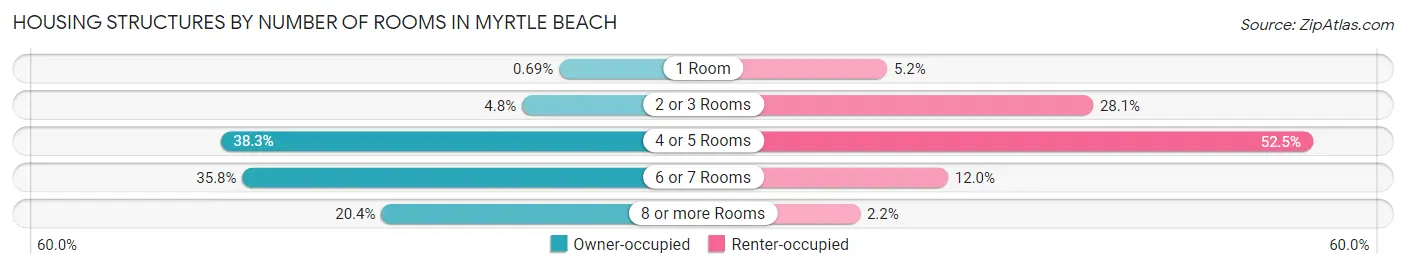
| Number of Rooms | Owner-occupied | Renter-occupied |
| 1 Room | 68 (0.7%) | 334 (5.2%) |
| 2 or 3 Rooms | 471 (4.8%) | 1,793 (28.1%) |
| 4 or 5 Rooms | 3,757 (38.3%) | 3,351 (52.5%) |
| 6 or 7 Rooms | 3,517 (35.8%) | 765 (12.0%) |
| 8 or more Rooms | 2,003 (20.4%) | 142 (2.2%) |
| Total | 9,816 (100.0%) | 6,385 (100.0%) |
Housing Structure by Heating Type in Myrtle Beach
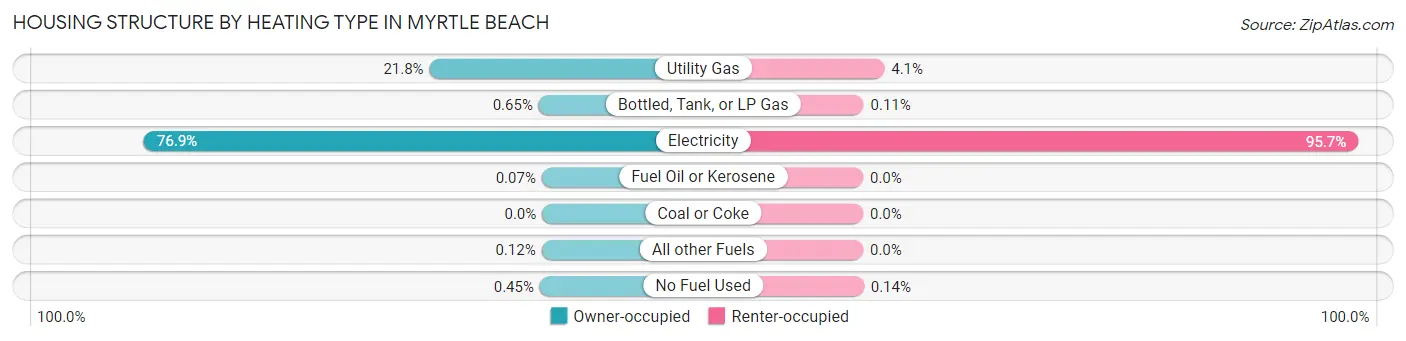
| Heating Type | Owner-occupied | Renter-occupied |
| Utility Gas | 2,137 (21.8%) | 262 (4.1%) |
| Bottled, Tank, or LP Gas | 64 (0.6%) | 7 (0.1%) |
| Electricity | 7,552 (76.9%) | 6,107 (95.7%) |
| Fuel Oil or Kerosene | 7 (0.1%) | 0 (0.0%) |
| Coal or Coke | 0 (0.0%) | 0 (0.0%) |
| All other Fuels | 12 (0.1%) | 0 (0.0%) |
| No Fuel Used | 44 (0.4%) | 9 (0.1%) |
| Total | 9,816 (100.0%) | 6,385 (100.0%) |
Household Vehicle Usage in Myrtle Beach
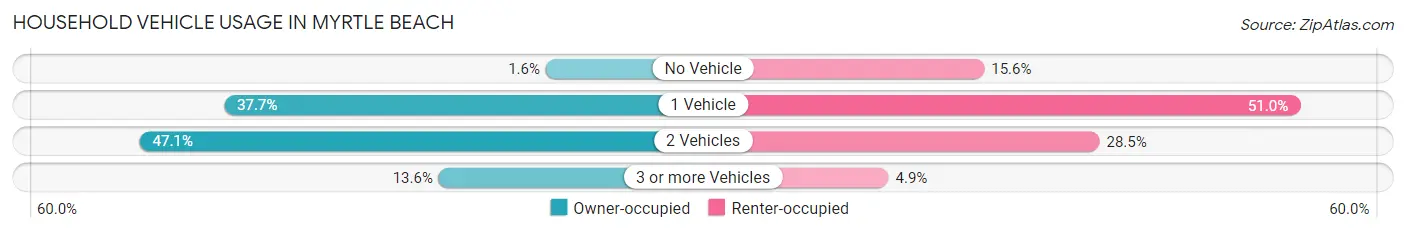
| Vehicles per Household | Owner-occupied | Renter-occupied |
| No Vehicle | 159 (1.6%) | 997 (15.6%) |
| 1 Vehicle | 3,697 (37.7%) | 3,255 (51.0%) |
| 2 Vehicles | 4,624 (47.1%) | 1,821 (28.5%) |
| 3 or more Vehicles | 1,336 (13.6%) | 312 (4.9%) |
| Total | 9,816 (100.0%) | 6,385 (100.0%) |
Real Estate & Mortgages in Myrtle Beach
Real Estate and Mortgage Overview in Myrtle Beach
| Characteristic | Without Mortgage | With Mortgage |
| Housing Units | 4,879 | 4,937 |
| Median Property Value | $236,000 | $356,900 |
| Median Household Income | $52,640 | $1,306 |
| Monthly Housing Costs | $484 | $571 |
| Real Estate Taxes | $1,038 | $105 |
Property Value by Mortgage Status in Myrtle Beach
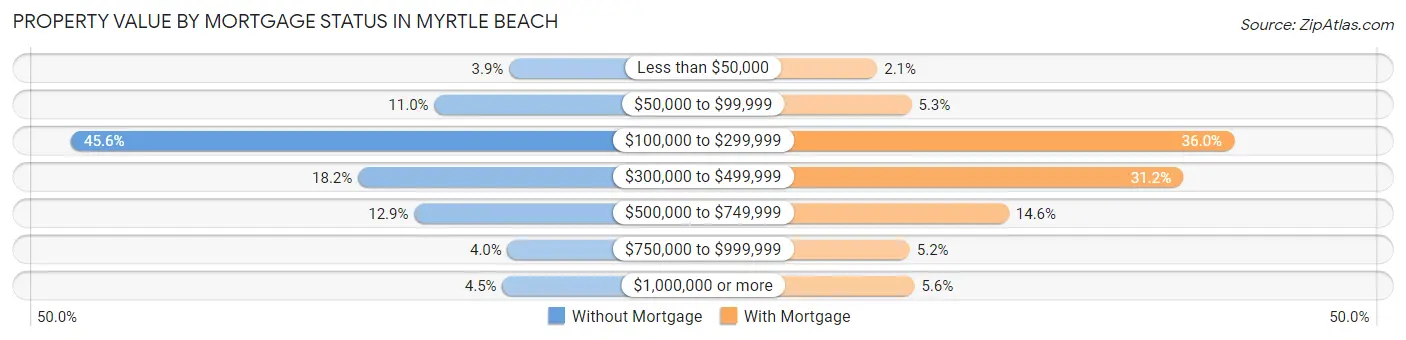
| Property Value | Without Mortgage | With Mortgage |
| Less than $50,000 | 188 (3.8%) | 102 (2.1%) |
| $50,000 to $99,999 | 535 (11.0%) | 263 (5.3%) |
| $100,000 to $299,999 | 2,223 (45.6%) | 1,779 (36.0%) |
| $300,000 to $499,999 | 890 (18.2%) | 1,540 (31.2%) |
| $500,000 to $749,999 | 629 (12.9%) | 721 (14.6%) |
| $750,000 to $999,999 | 195 (4.0%) | 255 (5.2%) |
| $1,000,000 or more | 219 (4.5%) | 277 (5.6%) |
| Total | 4,879 (100.0%) | 4,937 (100.0%) |
Household Income by Mortgage Status in Myrtle Beach
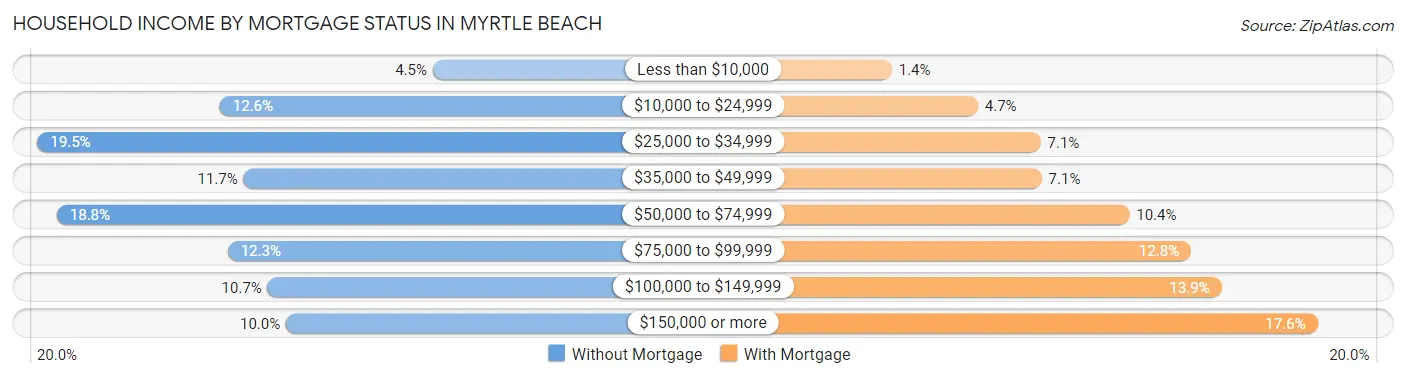
| Household Income | Without Mortgage | With Mortgage |
| Less than $10,000 | 217 (4.4%) | 68 (1.4%) |
| $10,000 to $24,999 | 613 (12.6%) | 230 (4.7%) |
| $25,000 to $34,999 | 952 (19.5%) | 348 (7.0%) |
| $35,000 to $49,999 | 569 (11.7%) | 350 (7.1%) |
| $50,000 to $74,999 | 916 (18.8%) | 515 (10.4%) |
| $75,000 to $99,999 | 598 (12.3%) | 631 (12.8%) |
| $100,000 to $149,999 | 524 (10.7%) | 688 (13.9%) |
| $150,000 or more | 490 (10.0%) | 869 (17.6%) |
| Total | 4,879 (100.0%) | 4,937 (100.0%) |
Property Value to Household Income Ratio in Myrtle Beach
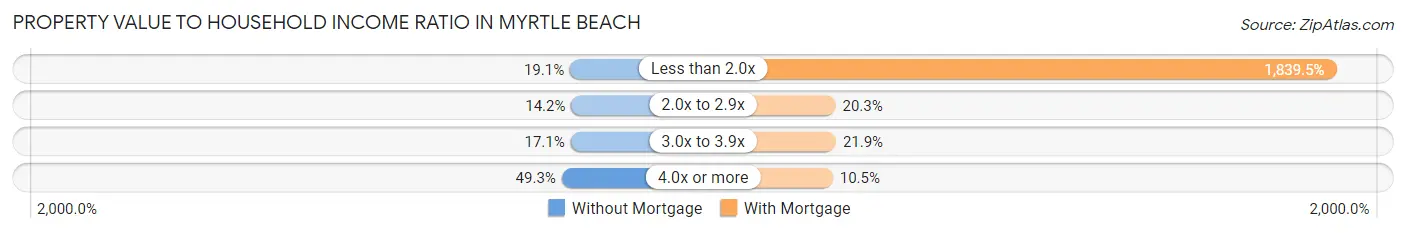
| Value-to-Income Ratio | Without Mortgage | With Mortgage |
| Less than 2.0x | 931 (19.1%) | 90,817 (1,839.5%) |
| 2.0x to 2.9x | 691 (14.2%) | 1,004 (20.3%) |
| 3.0x to 3.9x | 836 (17.1%) | 1,081 (21.9%) |
| 4.0x or more | 2,405 (49.3%) | 520 (10.5%) |
| Total | 4,879 (100.0%) | 4,937 (100.0%) |
Real Estate Taxes by Mortgage Status in Myrtle Beach
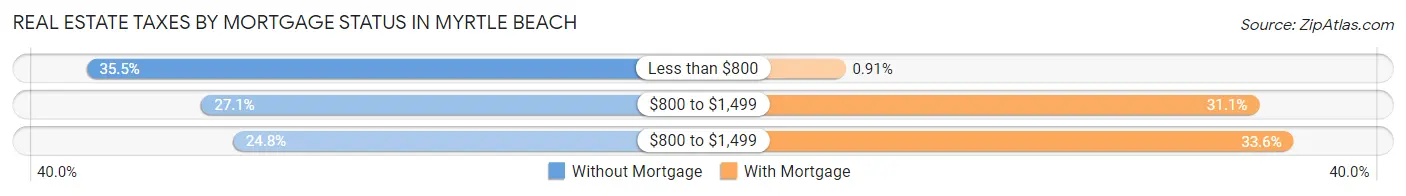
| Property Taxes | Without Mortgage | With Mortgage |
| Less than $800 | 1,731 (35.5%) | 45 (0.9%) |
| $800 to $1,499 | 1,321 (27.1%) | 1,537 (31.1%) |
| $800 to $1,499 | 1,209 (24.8%) | 1,661 (33.6%) |
| Total | 4,879 (100.0%) | 4,937 (100.0%) |
Health & Disability in Myrtle Beach
Health Insurance Coverage by Age in Myrtle Beach
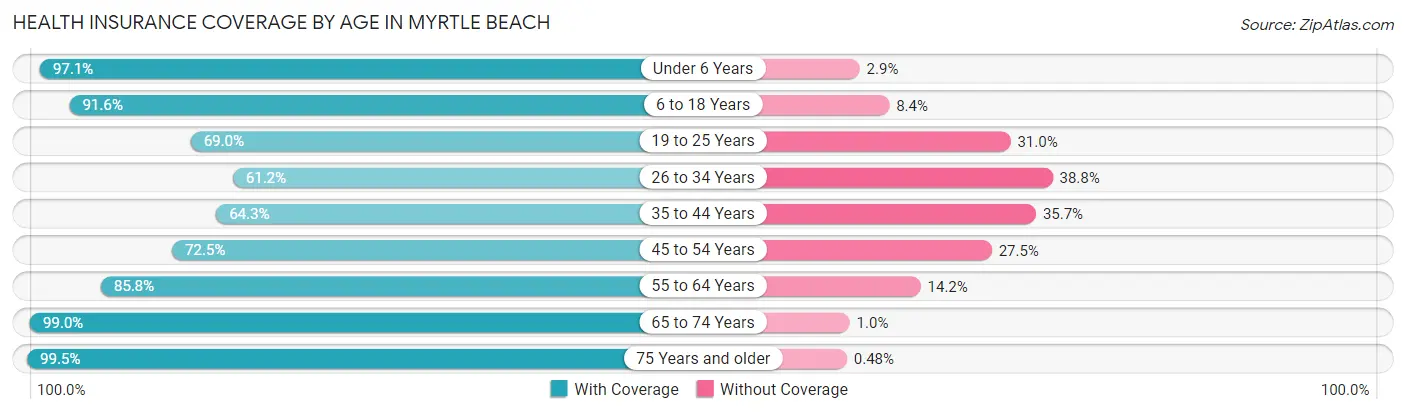
| Age Bracket | With Coverage | Without Coverage |
| Under 6 Years | 1,934 (97.1%) | 57 (2.9%) |
| 6 to 18 Years | 3,948 (91.6%) | 361 (8.4%) |
| 19 to 25 Years | 1,819 (69.0%) | 817 (31.0%) |
| 26 to 34 Years | 2,280 (61.2%) | 1,448 (38.8%) |
| 35 to 44 Years | 2,709 (64.3%) | 1,507 (35.7%) |
| 45 to 54 Years | 3,348 (72.5%) | 1,269 (27.5%) |
| 55 to 64 Years | 5,587 (85.8%) | 927 (14.2%) |
| 65 to 74 Years | 5,440 (99.0%) | 55 (1.0%) |
| 75 Years and older | 2,503 (99.5%) | 12 (0.5%) |
| Total | 29,568 (82.1%) | 6,453 (17.9%) |
Health Insurance Coverage by Citizenship Status in Myrtle Beach
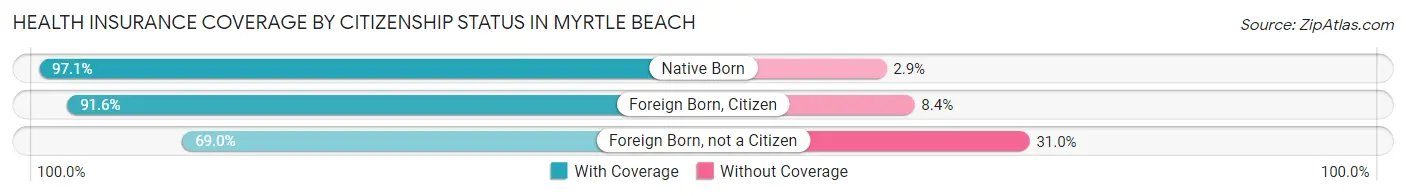
| Citizenship Status | With Coverage | Without Coverage |
| Native Born | 1,934 (97.1%) | 57 (2.9%) |
| Foreign Born, Citizen | 3,948 (91.6%) | 361 (8.4%) |
| Foreign Born, not a Citizen | 1,819 (69.0%) | 817 (31.0%) |
Health Insurance Coverage by Household Income in Myrtle Beach
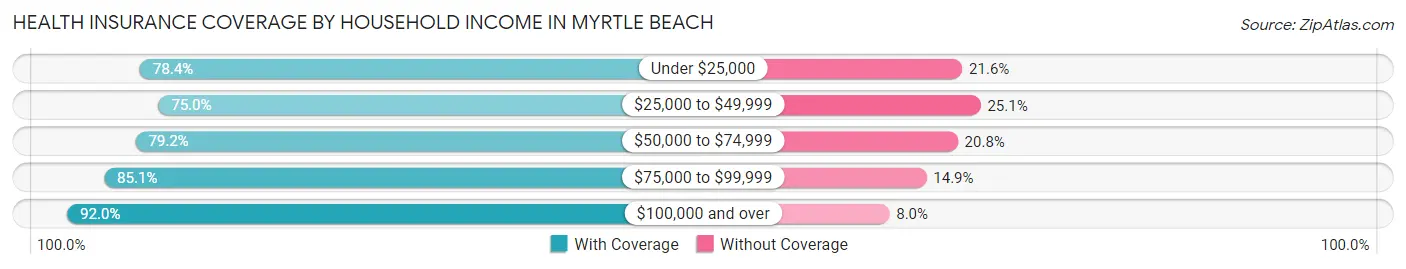
| Household Income | With Coverage | Without Coverage |
| Under $25,000 | 4,508 (78.4%) | 1,243 (21.6%) |
| $25,000 to $49,999 | 6,540 (75.0%) | 2,186 (25.1%) |
| $50,000 to $74,999 | 5,923 (79.2%) | 1,553 (20.8%) |
| $75,000 to $99,999 | 3,527 (85.1%) | 618 (14.9%) |
| $100,000 and over | 9,015 (92.0%) | 780 (8.0%) |
Public vs Private Health Insurance Coverage by Age in Myrtle Beach
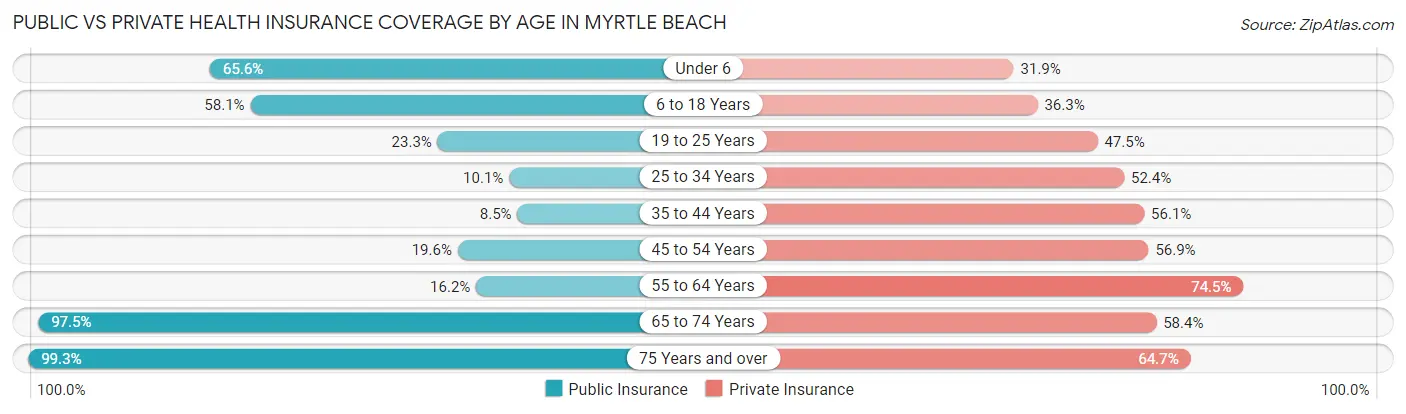
| Age Bracket | Public Insurance | Private Insurance |
| Under 6 | 1,306 (65.6%) | 635 (31.9%) |
| 6 to 18 Years | 2,503 (58.1%) | 1,565 (36.3%) |
| 19 to 25 Years | 615 (23.3%) | 1,251 (47.5%) |
| 25 to 34 Years | 375 (10.1%) | 1,953 (52.4%) |
| 35 to 44 Years | 359 (8.5%) | 2,366 (56.1%) |
| 45 to 54 Years | 905 (19.6%) | 2,628 (56.9%) |
| 55 to 64 Years | 1,054 (16.2%) | 4,854 (74.5%) |
| 65 to 74 Years | 5,356 (97.5%) | 3,207 (58.4%) |
| 75 Years and over | 2,498 (99.3%) | 1,628 (64.7%) |
| Total | 14,971 (41.6%) | 20,087 (55.8%) |
Disability Status by Sex by Age in Myrtle Beach
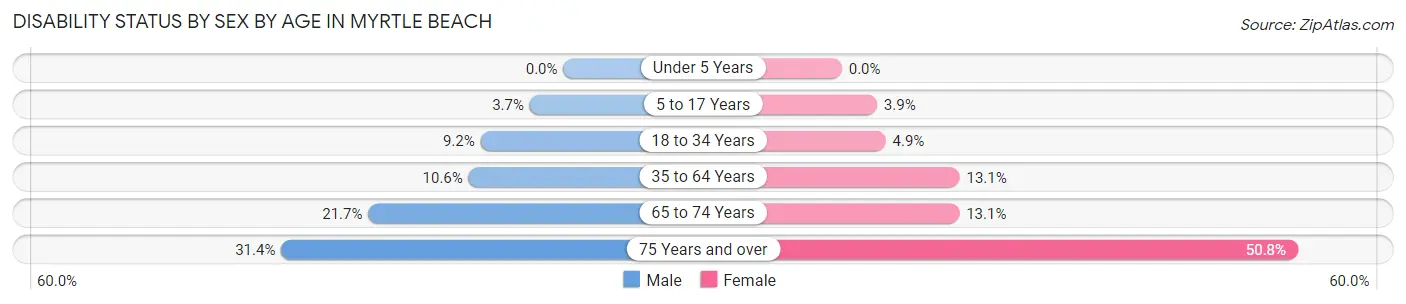
| Age Bracket | Male | Female |
| Under 5 Years | 0 (0.0%) | 0 (0.0%) |
| 5 to 17 Years | 83 (3.7%) | 74 (3.9%) |
| 18 to 34 Years | 320 (9.2%) | 163 (4.9%) |
| 35 to 64 Years | 792 (10.5%) | 1,028 (13.1%) |
| 65 to 74 Years | 609 (21.7%) | 352 (13.1%) |
| 75 Years and over | 296 (31.4%) | 799 (50.8%) |
Disability Class by Sex by Age in Myrtle Beach
Disability Class: Hearing Difficulty
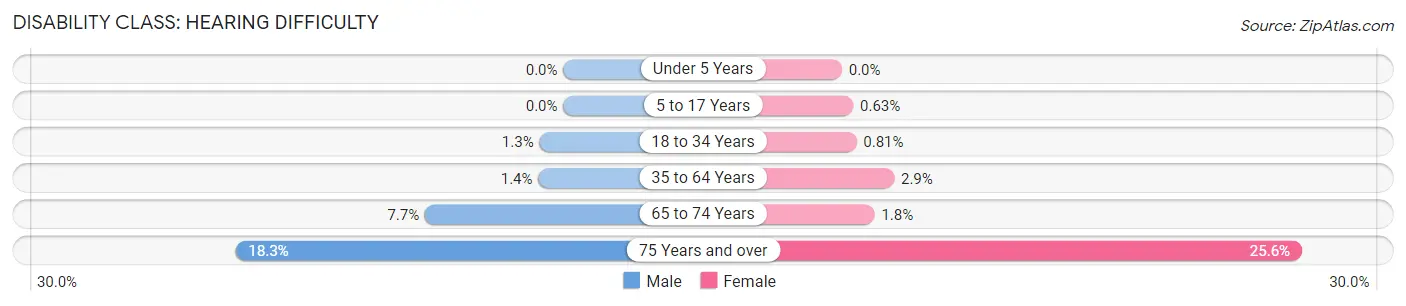
| Age Bracket | Male | Female |
| Under 5 Years | 0 (0.0%) | 0 (0.0%) |
| 5 to 17 Years | 0 (0.0%) | 12 (0.6%) |
| 18 to 34 Years | 46 (1.3%) | 27 (0.8%) |
| 35 to 64 Years | 104 (1.4%) | 228 (2.9%) |
| 65 to 74 Years | 216 (7.7%) | 49 (1.8%) |
| 75 Years and over | 172 (18.3%) | 403 (25.6%) |
Disability Class: Vision Difficulty
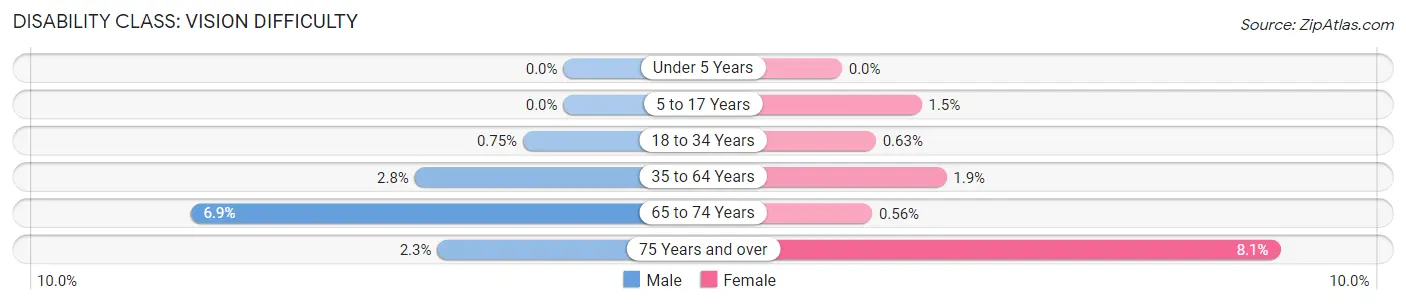
| Age Bracket | Male | Female |
| Under 5 Years | 0 (0.0%) | 0 (0.0%) |
| 5 to 17 Years | 0 (0.0%) | 28 (1.5%) |
| 18 to 34 Years | 26 (0.7%) | 21 (0.6%) |
| 35 to 64 Years | 207 (2.8%) | 152 (1.9%) |
| 65 to 74 Years | 194 (6.9%) | 15 (0.6%) |
| 75 Years and over | 22 (2.3%) | 128 (8.1%) |
Disability Class: Cognitive Difficulty
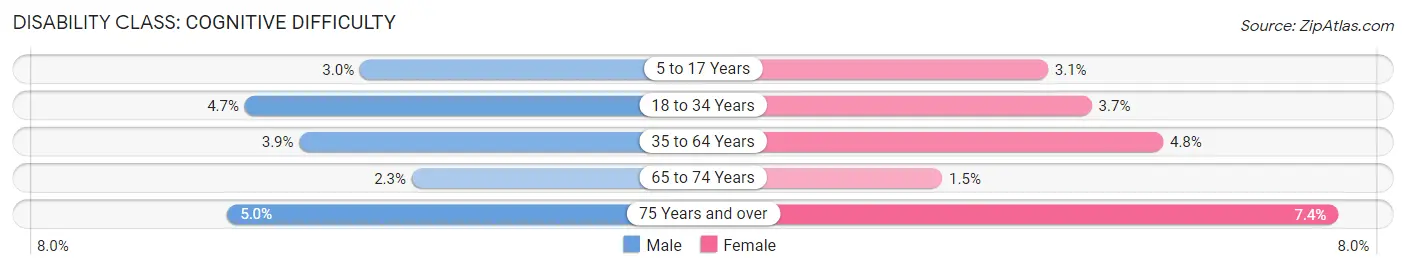
| Age Bracket | Male | Female |
| 5 to 17 Years | 67 (3.0%) | 58 (3.1%) |
| 18 to 34 Years | 164 (4.7%) | 124 (3.7%) |
| 35 to 64 Years | 294 (3.9%) | 374 (4.8%) |
| 65 to 74 Years | 63 (2.2%) | 40 (1.5%) |
| 75 Years and over | 47 (5.0%) | 116 (7.4%) |
Disability Class: Ambulatory Difficulty
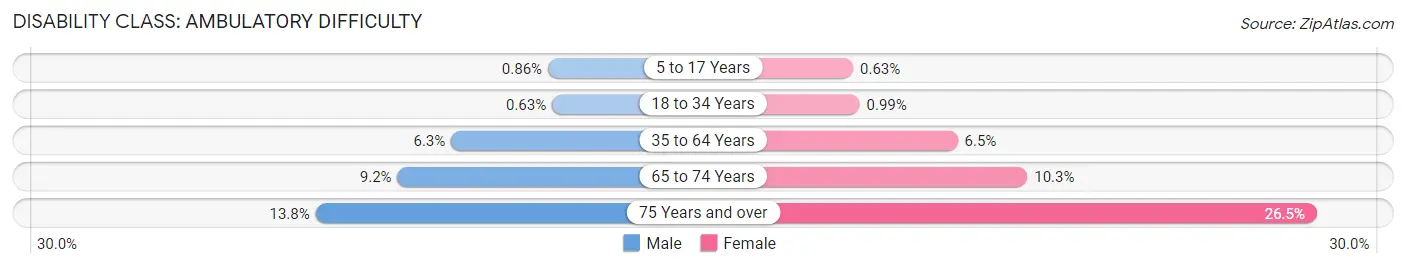
| Age Bracket | Male | Female |
| 5 to 17 Years | 19 (0.9%) | 12 (0.6%) |
| 18 to 34 Years | 22 (0.6%) | 33 (1.0%) |
| 35 to 64 Years | 469 (6.2%) | 506 (6.5%) |
| 65 to 74 Years | 259 (9.2%) | 278 (10.3%) |
| 75 Years and over | 130 (13.8%) | 416 (26.5%) |
Disability Class: Self-Care Difficulty
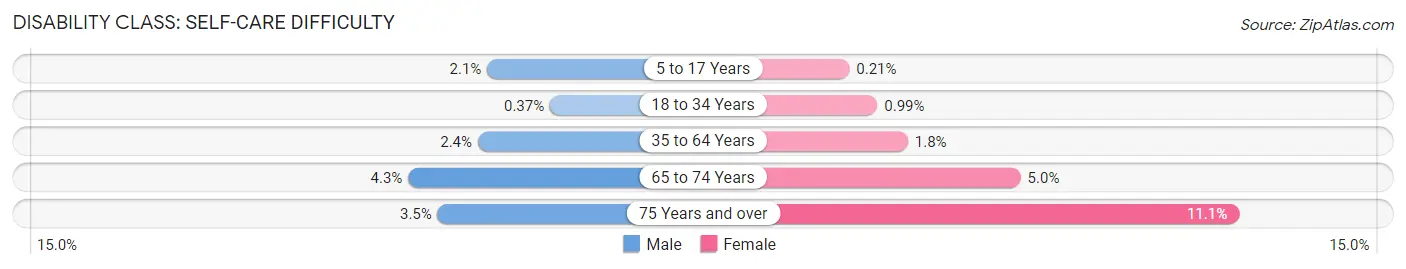
| Age Bracket | Male | Female |
| 5 to 17 Years | 47 (2.1%) | 4 (0.2%) |
| 18 to 34 Years | 13 (0.4%) | 33 (1.0%) |
| 35 to 64 Years | 179 (2.4%) | 144 (1.8%) |
| 65 to 74 Years | 121 (4.3%) | 134 (5.0%) |
| 75 Years and over | 33 (3.5%) | 174 (11.1%) |
Technology Access in Myrtle Beach
Computing Device Access in Myrtle Beach
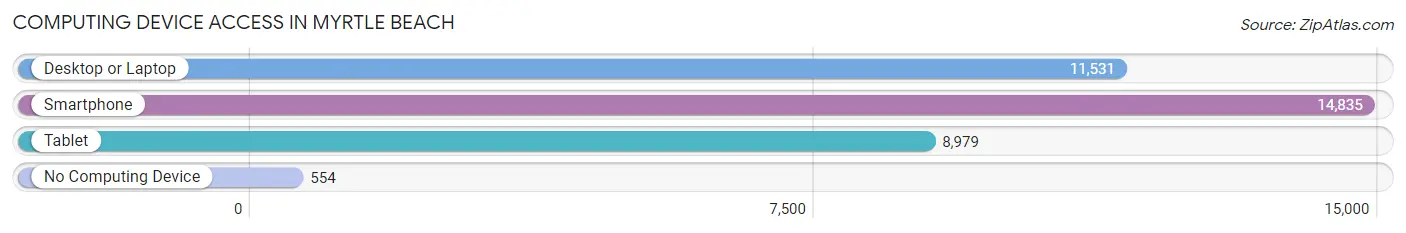
| Device Type | # Households | % Households |
| Desktop or Laptop | 11,531 | 71.2% |
| Smartphone | 14,835 | 91.6% |
| Tablet | 8,979 | 55.4% |
| No Computing Device | 554 | 3.4% |
| Total | 16,201 | 100.0% |
Internet Access in Myrtle Beach
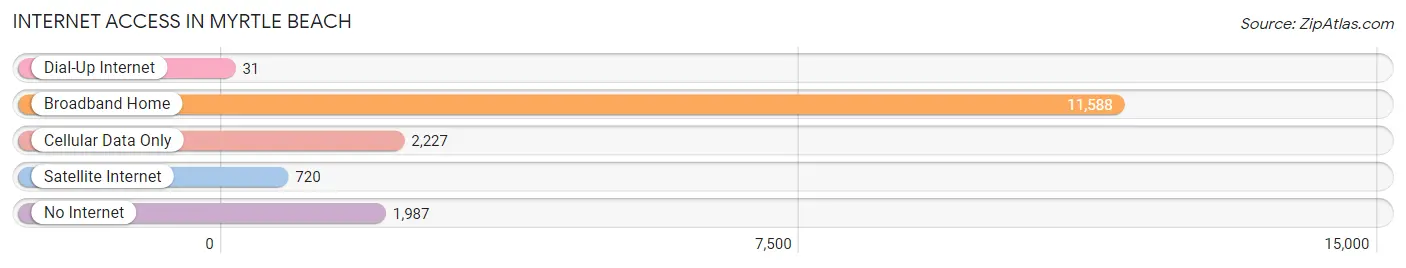
| Internet Type | # Households | % Households |
| Dial-Up Internet | 31 | 0.2% |
| Broadband Home | 11,588 | 71.5% |
| Cellular Data Only | 2,227 | 13.8% |
| Satellite Internet | 720 | 4.4% |
| No Internet | 1,987 | 12.3% |
| Total | 16,201 | 100.0% |
Myrtle Beach Summary
Myrtle Beach is a coastal city located in Horry County, South Carolina. It is situated along the Atlantic Ocean and is a popular tourist destination. The city is known for its beautiful beaches, golf courses, and other attractions. Myrtle Beach has a population of approximately 30,000 people and is the second-largest city in South Carolina.
Geography
Myrtle Beach is located in the Grand Strand region of South Carolina, which is a 60-mile stretch of coastline along the Atlantic Ocean. The city is situated on a barrier island, which is separated from the mainland by the Intracoastal Waterway. The city is bordered by the Waccamaw River to the north and the Atlantic Ocean to the east. The city is also home to several lakes, including Lake Arrowhead, Lakewood, and Lake Moultrie.
The city has a humid subtropical climate, with hot, humid summers and mild winters. The average temperature in the summer is around 80°F (27°C), while the average temperature in the winter is around 60°F (15°C). The city receives an average of 48 inches (122 cm) of rain per year.
Economy
Myrtle Beach is a major tourist destination, with over 14 million visitors each year. The city is home to numerous attractions, including amusement parks, water parks, golf courses, and other attractions. Tourism is the main driver of the city’s economy, with over $7 billion in annual revenue.
The city is also home to several large companies, including Horry Telephone Cooperative, Horry Electric Cooperative, and Horry County Schools. The city is also home to several military bases, including the Myrtle Beach Air Force Base and the Myrtle Beach Naval Weapons Station.
Demographics
As of the 2010 census, the population of Myrtle Beach was 27,109. The racial makeup of the city was 79.2% White, 14.3% African American, 0.5% Native American, 2.2% Asian, 0.1% Pacific Islander, and 3.7% from other races. The median household income was $37,845, and the median family income was $45,890.
The city is home to several religious denominations, including Baptist, Methodist, Presbyterian, and Catholic. The city is also home to several colleges and universities, including Coastal Carolina University, Horry-Georgetown Technical College, and the University of South Carolina.
Conclusion
Myrtle Beach is a popular tourist destination located in Horry County, South Carolina. The city is situated along the Atlantic Ocean and is home to numerous attractions, including amusement parks, water parks, golf courses, and other attractions. The city has a humid subtropical climate, with hot, humid summers and mild winters. Tourism is the main driver of the city’s economy, with over $7 billion in annual revenue. The population of Myrtle Beach was 27,109 as of the 2010 census, and the median household income was $37,845. The city is home to several religious denominations, colleges and universities, and military bases.
Common Questions
What is Per Capita Income in Myrtle Beach?
Per Capita income in Myrtle Beach is $38,086.
What is the Median Family Income in Myrtle Beach?
Median Family Income in Myrtle Beach is $66,880.
What is the Median Household income in Myrtle Beach?
Median Household Income in Myrtle Beach is $50,558.
What is Income or Wage Gap in Myrtle Beach?
Income or Wage Gap in Myrtle Beach is 22.3%.
Women in Myrtle Beach earn 77.7 cents for every dollar earned by a man.
What is Family Income Deficit in Myrtle Beach?
Family Income Deficit in Myrtle Beach is $8,680.
Families that are below poverty line in Myrtle Beach earn $8,680 less on average than the poverty threshold level.
What is Inequality or Gini Index in Myrtle Beach?
Inequality or Gini Index in Myrtle Beach is 0.52.
What is the Total Population of Myrtle Beach?
Total Population of Myrtle Beach is 36,064.
What is the Total Male Population of Myrtle Beach?
Total Male Population of Myrtle Beach is 17,903.
What is the Total Female Population of Myrtle Beach?
Total Female Population of Myrtle Beach is 18,161.
What is the Ratio of Males per 100 Females in Myrtle Beach?
There are 98.58 Males per 100 Females in Myrtle Beach.
What is the Ratio of Females per 100 Males in Myrtle Beach?
There are 101.44 Females per 100 Males in Myrtle Beach.
What is the Median Population Age in Myrtle Beach?
Median Population Age in Myrtle Beach is 47.0 Years.
What is the Average Family Size in Myrtle Beach
Average Family Size in Myrtle Beach is 2.8 People.
What is the Average Household Size in Myrtle Beach
Average Household Size in Myrtle Beach is 2.2 People.
How Large is the Labor Force in Myrtle Beach?
There are 18,526 People in the Labor Forcein in Myrtle Beach.
What is the Percentage of People in the Labor Force in Myrtle Beach?
60.3% of People are in the Labor Force in Myrtle Beach.
What is the Unemployment Rate in Myrtle Beach?
Unemployment Rate in Myrtle Beach is 4.2%.