Joanna, SC Map & Demographics
Joanna Map
Joanna Overview
$29,379
PER CAPITA INCOME
$82,600
AVG FAMILY INCOME
$52,381
AVG HOUSEHOLD INCOME
31.2%
WAGE / INCOME GAP [ % ]
68.8¢/ $1
WAGE / INCOME GAP [ $ ]
0.47
INEQUALITY / GINI INDEX
1,406
TOTAL POPULATION
704
MALE POPULATION
702
FEMALE POPULATION
100.28
MALES / 100 FEMALES
99.72
FEMALES / 100 MALES
42.4
MEDIAN AGE
2.9
AVG FAMILY SIZE
2.4
AVG HOUSEHOLD SIZE
627
LABOR FORCE [ PEOPLE ]
52.9%
PERCENT IN LABOR FORCE
Joanna Zip Codes
Joanna Area Codes
Income in Joanna
Income Overview in Joanna
Per Capita Income in Joanna is $29,379, while median incomes of families and households are $82,600 and $52,381 respectively.
| Characteristic | Number | Measure |
| Per Capita Income | 1,406 | $29,379 |
| Median Family Income | 394 | $82,600 |
| Mean Family Income | 394 | $93,275 |
| Median Household Income | 576 | $52,381 |
| Mean Household Income | 576 | $72,464 |
| Income Deficit | 394 | $0 |
| Wage / Income Gap (%) | 1,406 | 31.21% |
| Wage / Income Gap ($) | 1,406 | 68.79¢ per $1 |
| Gini / Inequality Index | 1,406 | 0.47 |
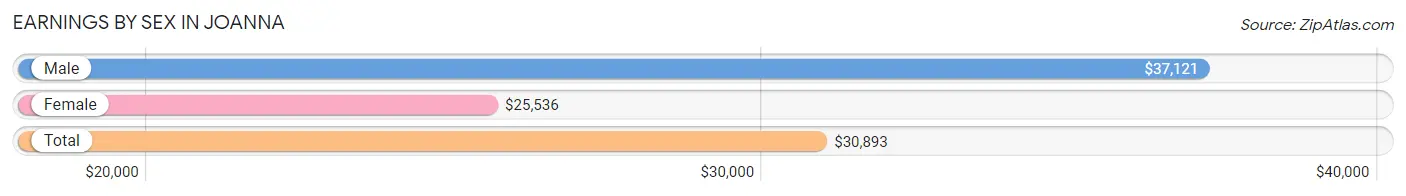
Earnings by Sex in Joanna
Average Earnings in Joanna are $30,893, $37,121 for men and $25,536 for women, a difference of 31.2%.
| Sex | Number | Average Earnings |
| Male | 410 (60.9%) | $37,121 |
| Female | 263 (39.1%) | $25,536 |
| Total | 673 (100.0%) | $30,893 |
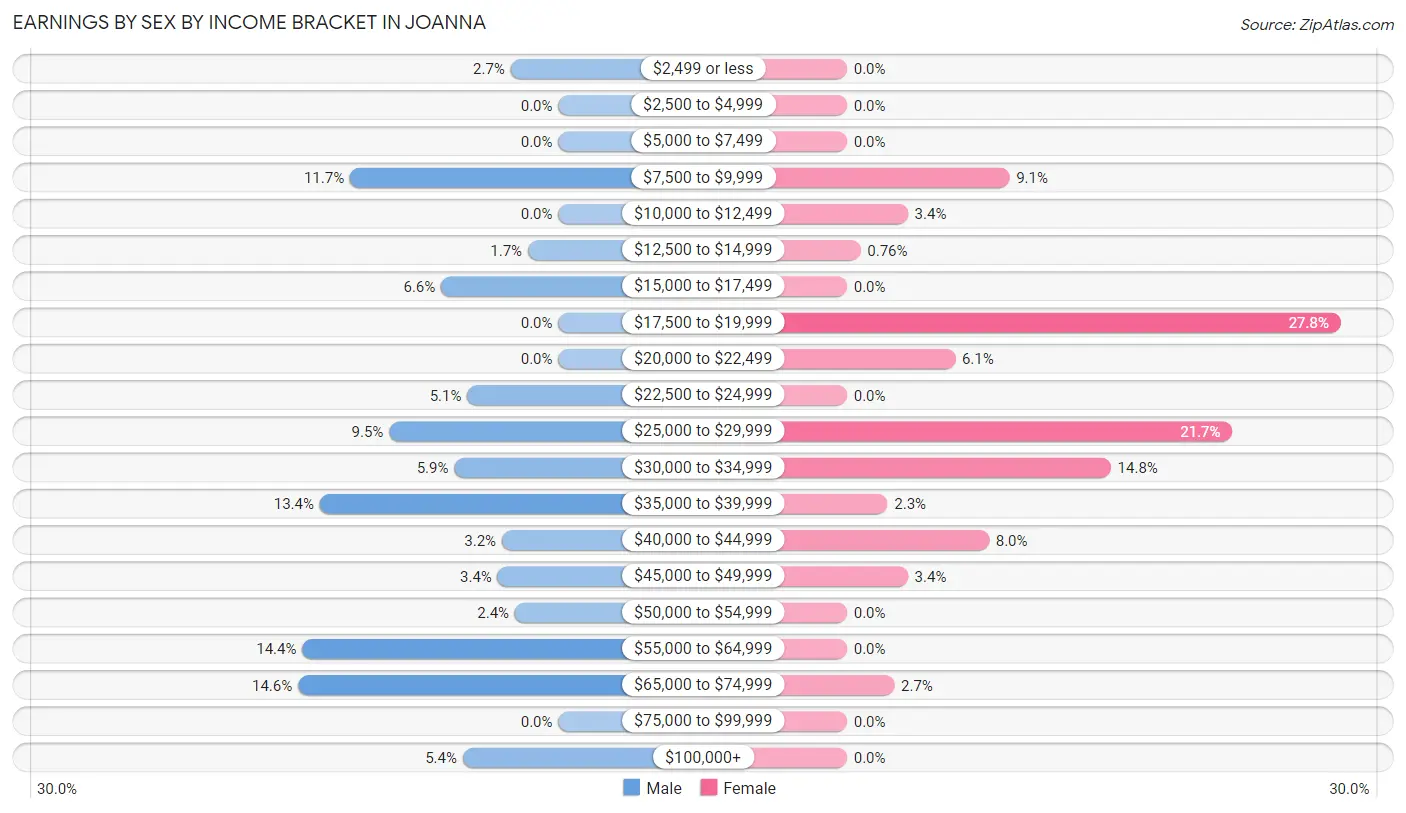
Earnings by Sex by Income Bracket in Joanna
The most common earnings brackets in Joanna are $65,000 to $74,999 for men (60 | 14.6%) and $17,500 to $19,999 for women (73 | 27.8%).
| Income | Male | Female |
| $2,499 or less | 11 (2.7%) | 0 (0.0%) |
| $2,500 to $4,999 | 0 (0.0%) | 0 (0.0%) |
| $5,000 to $7,499 | 0 (0.0%) | 0 (0.0%) |
| $7,500 to $9,999 | 48 (11.7%) | 24 (9.1%) |
| $10,000 to $12,499 | 0 (0.0%) | 9 (3.4%) |
| $12,500 to $14,999 | 7 (1.7%) | 2 (0.8%) |
| $15,000 to $17,499 | 27 (6.6%) | 0 (0.0%) |
| $17,500 to $19,999 | 0 (0.0%) | 73 (27.8%) |
| $20,000 to $22,499 | 0 (0.0%) | 16 (6.1%) |
| $22,500 to $24,999 | 21 (5.1%) | 0 (0.0%) |
| $25,000 to $29,999 | 39 (9.5%) | 57 (21.7%) |
| $30,000 to $34,999 | 24 (5.9%) | 39 (14.8%) |
| $35,000 to $39,999 | 55 (13.4%) | 6 (2.3%) |
| $40,000 to $44,999 | 13 (3.2%) | 21 (8.0%) |
| $45,000 to $49,999 | 14 (3.4%) | 9 (3.4%) |
| $50,000 to $54,999 | 10 (2.4%) | 0 (0.0%) |
| $55,000 to $64,999 | 59 (14.4%) | 0 (0.0%) |
| $65,000 to $74,999 | 60 (14.6%) | 7 (2.7%) |
| $75,000 to $99,999 | 0 (0.0%) | 0 (0.0%) |
| $100,000+ | 22 (5.4%) | 0 (0.0%) |
| Total | 410 (100.0%) | 263 (100.0%) |
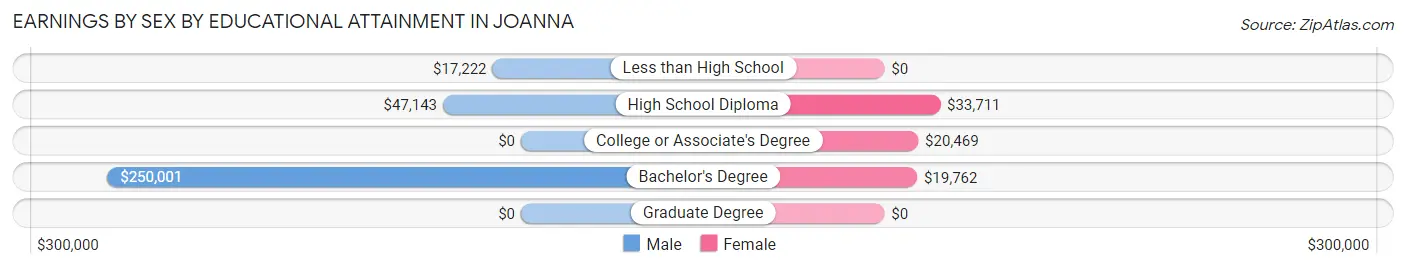
Earnings by Sex by Educational Attainment in Joanna
Average earnings in Joanna are $55,200 for men and $26,000 for women, a difference of 52.9%. Men with an educational attainment of bachelor's degree enjoy the highest average annual earnings of $250,001, while those with less than high school education earn the least with $17,222. Women with an educational attainment of high school diploma earn the most with the average annual earnings of $33,711, while those with bachelor's degree education have the smallest earnings of $19,762.
| Educational Attainment | Male Income | Female Income |
| Less than High School | $17,222 | $0 |
| High School Diploma | $47,143 | $33,711 |
| College or Associate's Degree | - | - |
| Bachelor's Degree | $250,001 | $19,762 |
| Graduate Degree | - | - |
| Total | $55,200 | $26,000 |
Family Income in Joanna
Family Income Brackets in Joanna
According to the Joanna family income data, there are 183 families falling into the $75,000 to $99,999 income range, which is the most common income bracket and makes up 46.5% of all families.
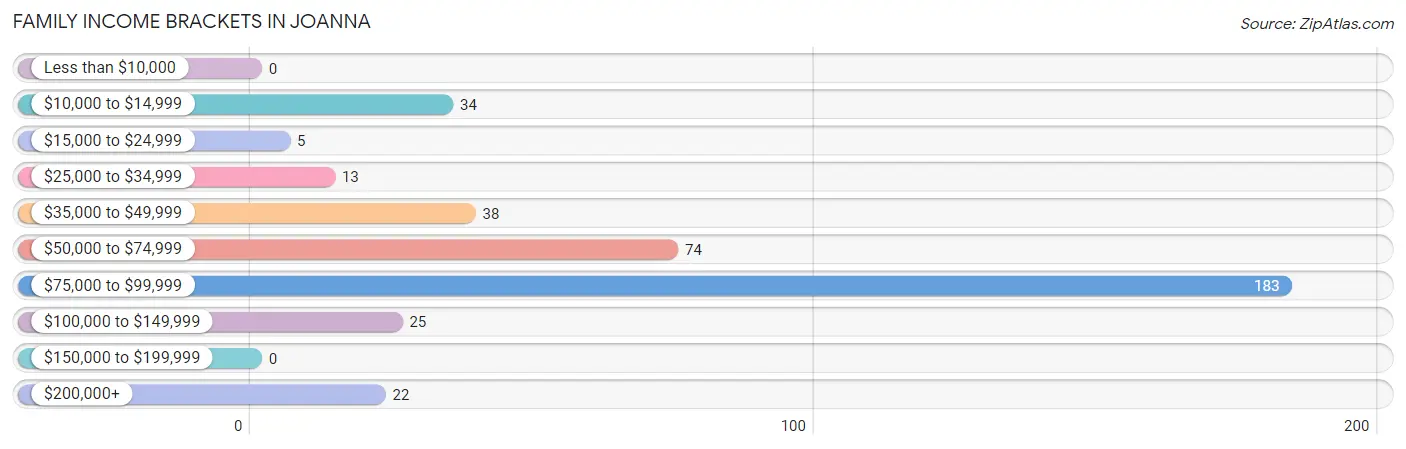
| Income Bracket | # Families | % Families |
| Less than $10,000 | 0 | 0.0% |
| $10,000 to $14,999 | 34 | 8.6% |
| $15,000 to $24,999 | 5 | 1.3% |
| $25,000 to $34,999 | 13 | 3.3% |
| $35,000 to $49,999 | 38 | 9.6% |
| $50,000 to $74,999 | 74 | 18.8% |
| $75,000 to $99,999 | 183 | 46.4% |
| $100,000 to $149,999 | 25 | 6.3% |
| $150,000 to $199,999 | 0 | 0.0% |
| $200,000+ | 22 | 5.6% |
Family Income by Famaliy Size in Joanna
3-person families (114 | 28.9%) account for the highest median family income in Joanna with $83,663 per family, while 3-person families (114 | 28.9%) have the highest median income of $27,888 per family member.
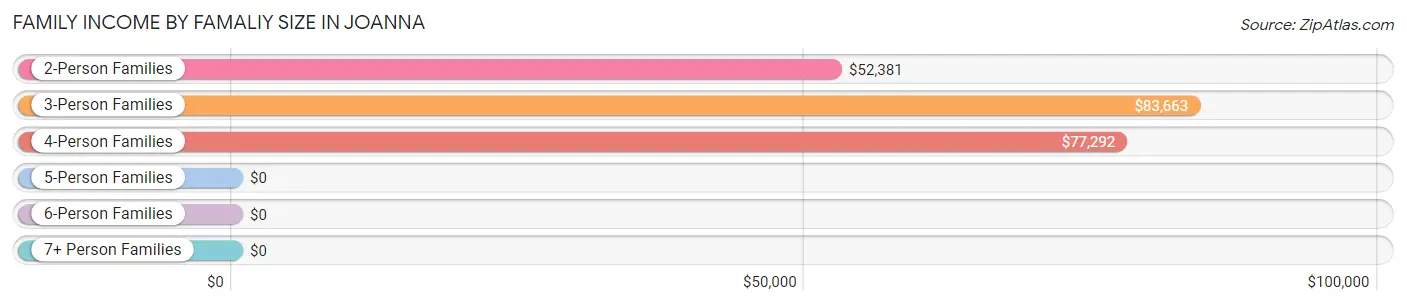
| Income Bracket | # Families | Median Income |
| 2-Person Families | 198 (50.2%) | $52,381 |
| 3-Person Families | 114 (28.9%) | $83,663 |
| 4-Person Families | 26 (6.6%) | $77,292 |
| 5-Person Families | 22 (5.6%) | $0 |
| 6-Person Families | 34 (8.6%) | $0 |
| 7+ Person Families | 0 (0.0%) | $0 |
| Total | 394 (100.0%) | $82,600 |
Family Income by Number of Earners in Joanna
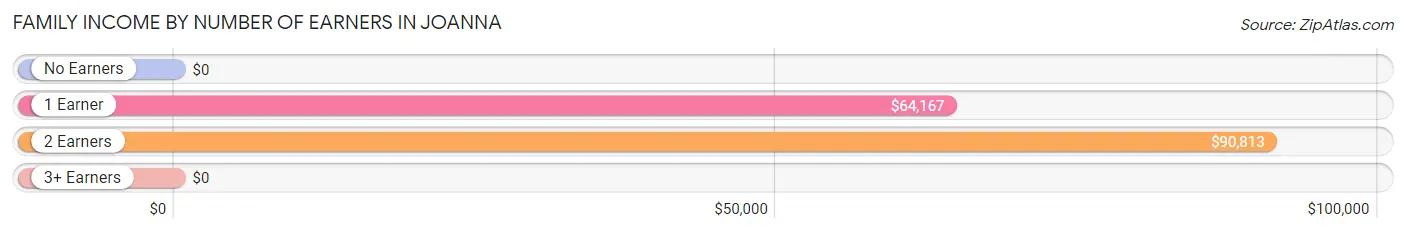
| Number of Earners | # Families | Median Income |
| No Earners | 68 (17.3%) | $0 |
| 1 Earner | 50 (12.7%) | $64,167 |
| 2 Earners | 208 (52.8%) | $90,813 |
| 3+ Earners | 68 (17.3%) | $0 |
| Total | 394 (100.0%) | $82,600 |
Household Income in Joanna
Household Income Brackets in Joanna
With 187 households falling in the category, the $75,000 to $99,999 income range is the most frequent in Joanna, accounting for 32.5% of all households.
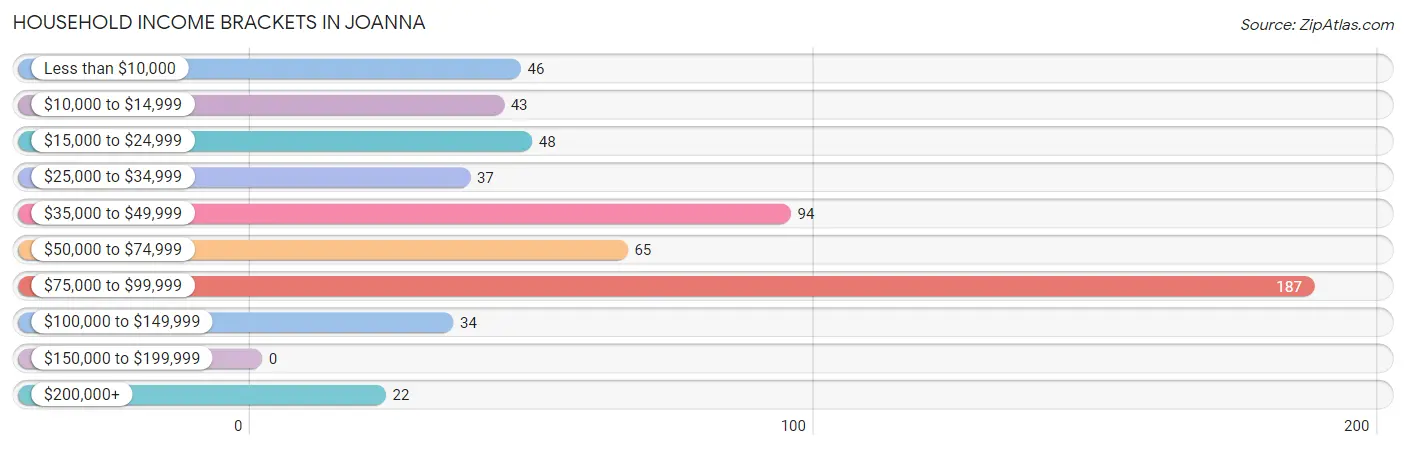
| Income Bracket | # Households | % Households |
| Less than $10,000 | 46 | 8.0% |
| $10,000 to $14,999 | 43 | 7.5% |
| $15,000 to $24,999 | 48 | 8.3% |
| $25,000 to $34,999 | 37 | 6.4% |
| $35,000 to $49,999 | 94 | 16.3% |
| $50,000 to $74,999 | 65 | 11.3% |
| $75,000 to $99,999 | 187 | 32.5% |
| $100,000 to $149,999 | 34 | 5.9% |
| $150,000 to $199,999 | 0 | 0.0% |
| $200,000+ | 22 | 3.8% |
Household Income by Householder Age in Joanna
The median household income in Joanna is $52,381, with the highest median household income of $98,091 found in the 25 to 44 years age bracket for the primary householder. A total of 178 households (30.9%) fall into this category. Meanwhile, the 15 to 24 years age bracket for the primary householder has the lowest median household income of $0, with 5 households (0.9%) in this group.
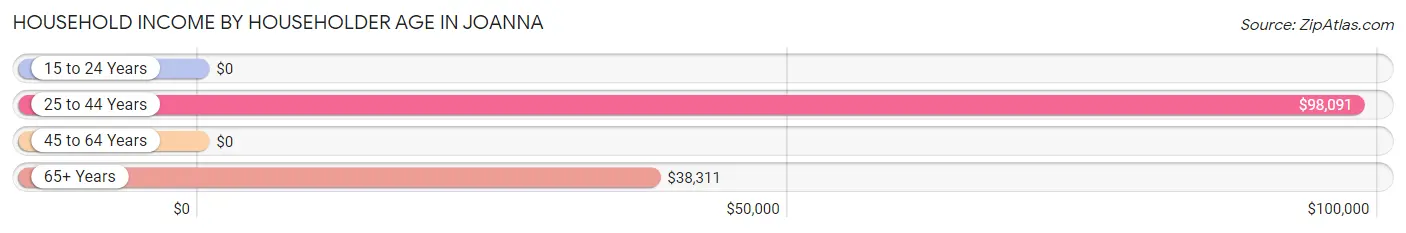
| Income Bracket | # Households | Median Income |
| 15 to 24 Years | 5 (0.9%) | $0 |
| 25 to 44 Years | 178 (30.9%) | $98,091 |
| 45 to 64 Years | 251 (43.6%) | $0 |
| 65+ Years | 142 (24.6%) | $38,311 |
| Total | 576 (100.0%) | $52,381 |
Poverty in Joanna
Income Below Poverty by Sex and Age in Joanna
With 9.7% poverty level for males and 19.5% for females among the residents of Joanna, 65 to 74 year old males and 6 to 11 year old females are the most vulnerable to poverty, with 23 males (51.1%) and 9 females (45.0%) in their respective age groups living below the poverty level.
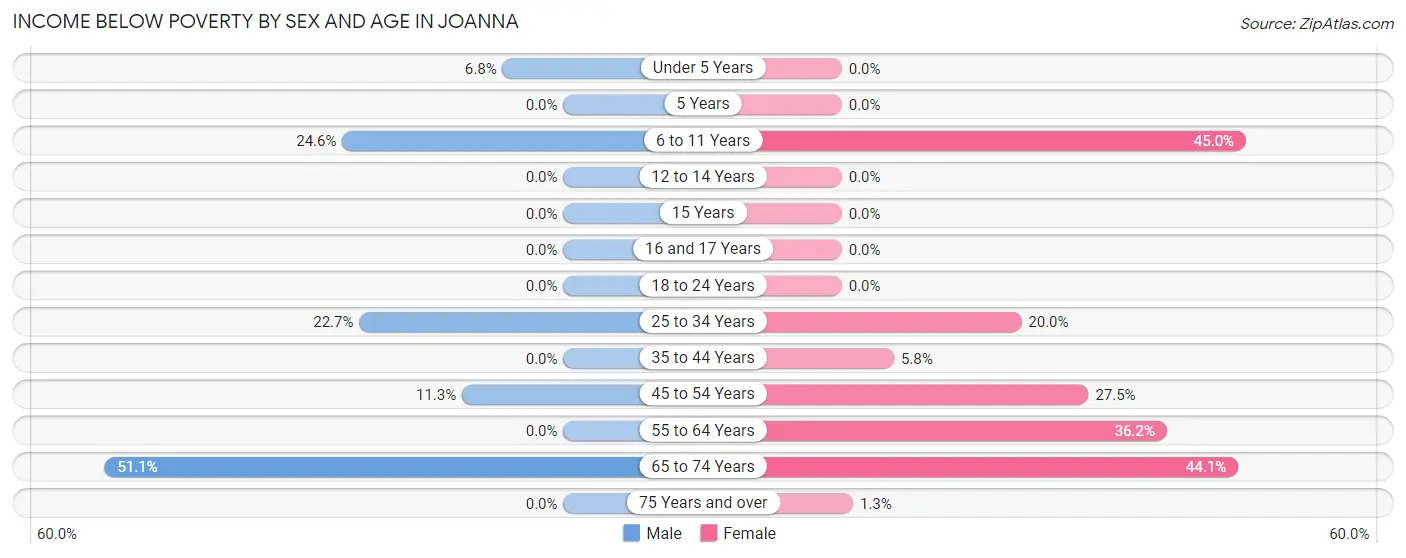
| Age Bracket | Male | Female |
| Under 5 Years | 4 (6.8%) | 0 (0.0%) |
| 5 Years | 0 (0.0%) | 0 (0.0%) |
| 6 to 11 Years | 16 (24.6%) | 9 (45.0%) |
| 12 to 14 Years | 0 (0.0%) | 0 (0.0%) |
| 15 Years | 0 (0.0%) | 0 (0.0%) |
| 16 and 17 Years | 0 (0.0%) | 0 (0.0%) |
| 18 to 24 Years | 0 (0.0%) | 0 (0.0%) |
| 25 to 34 Years | 10 (22.7%) | 6 (20.0%) |
| 35 to 44 Years | 0 (0.0%) | 9 (5.8%) |
| 45 to 54 Years | 15 (11.3%) | 25 (27.5%) |
| 55 to 64 Years | 0 (0.0%) | 38 (36.2%) |
| 65 to 74 Years | 23 (51.1%) | 49 (44.1%) |
| 75 Years and over | 0 (0.0%) | 1 (1.3%) |
| Total | 68 (9.7%) | 137 (19.5%) |
Income Above Poverty by Sex and Age in Joanna
According to the poverty statistics in Joanna, males aged 12 to 14 years and females aged under 5 years are the age groups that are most secure financially, with 100.0% of males and 100.0% of females in these age groups living above the poverty line.
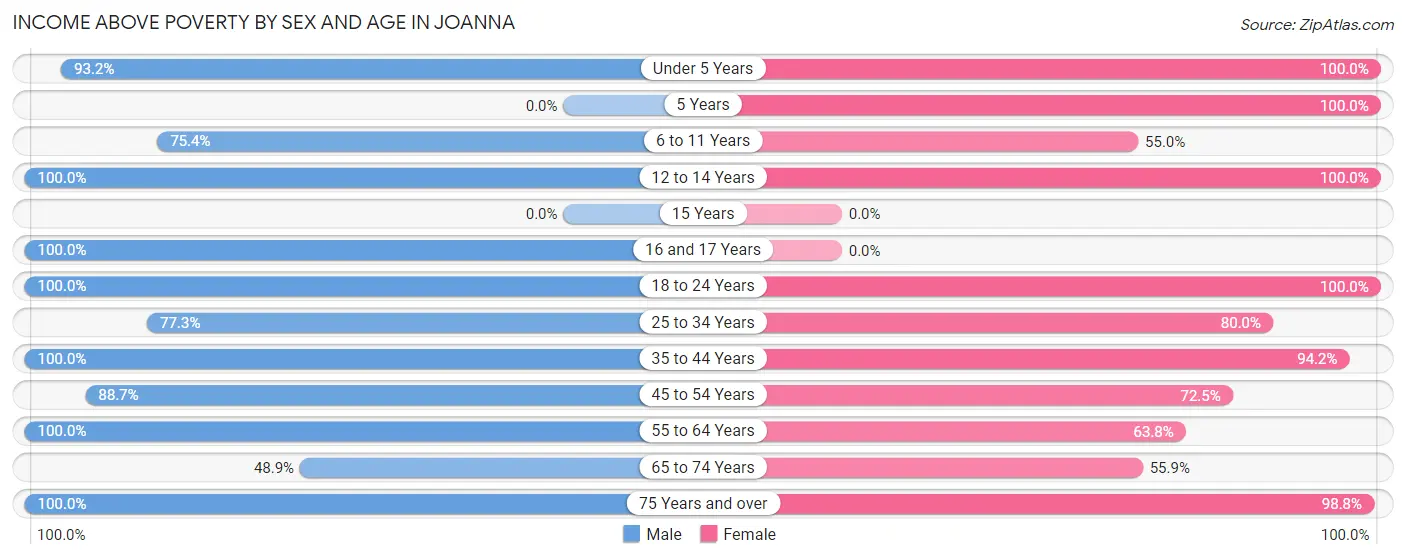
| Age Bracket | Male | Female |
| Under 5 Years | 55 (93.2%) | 35 (100.0%) |
| 5 Years | 0 (0.0%) | 11 (100.0%) |
| 6 to 11 Years | 49 (75.4%) | 11 (55.0%) |
| 12 to 14 Years | 20 (100.0%) | 10 (100.0%) |
| 15 Years | 0 (0.0%) | 0 (0.0%) |
| 16 and 17 Years | 11 (100.0%) | 0 (0.0%) |
| 18 to 24 Years | 125 (100.0%) | 54 (100.0%) |
| 25 to 34 Years | 34 (77.3%) | 24 (80.0%) |
| 35 to 44 Years | 102 (100.0%) | 146 (94.2%) |
| 45 to 54 Years | 118 (88.7%) | 66 (72.5%) |
| 55 to 64 Years | 76 (100.0%) | 67 (63.8%) |
| 65 to 74 Years | 22 (48.9%) | 62 (55.9%) |
| 75 Years and over | 24 (100.0%) | 79 (98.8%) |
| Total | 636 (90.3%) | 565 (80.5%) |
Income Below Poverty Among Married-Couple Families in Joanna
The poverty statistics for married-couple families in Joanna show that 2.3% or 7 of the total 309 families live below the poverty line. Families with no children have the highest poverty rate of 3.2%, comprising of 7 families. On the other hand, families with 1 or 2 children have the lowest poverty rate of 0.0%, which includes 0 families.
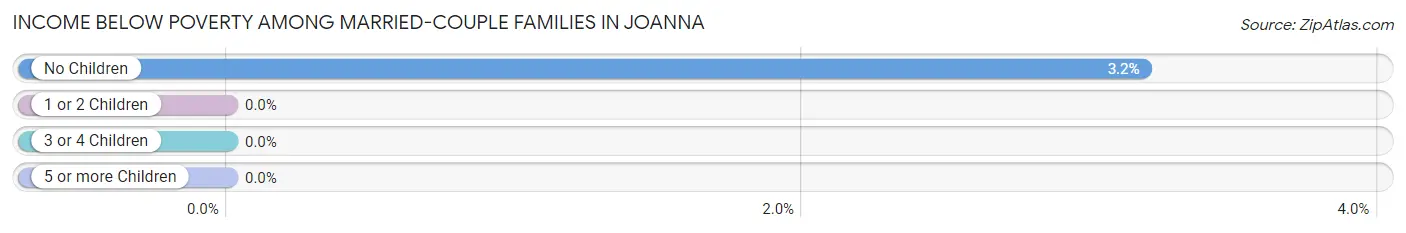
| Children | Above Poverty | Below Poverty |
| No Children | 213 (96.8%) | 7 (3.2%) |
| 1 or 2 Children | 67 (100.0%) | 0 (0.0%) |
| 3 or 4 Children | 22 (100.0%) | 0 (0.0%) |
| 5 or more Children | 0 (0.0%) | 0 (0.0%) |
| Total | 302 (97.7%) | 7 (2.3%) |
Income Below Poverty Among Single-Parent Households in Joanna
According to the poverty data in Joanna, 12.8% or 5 single-father households and 58.7% or 27 single-mother households are living below the poverty line. Among single-father households, those with no children have the highest poverty rate, with 5 households (12.8%) experiencing poverty. Likewise, among single-mother households, those with 3 or 4 children have the highest poverty rate, with 2 households (100.0%) falling below the poverty line.
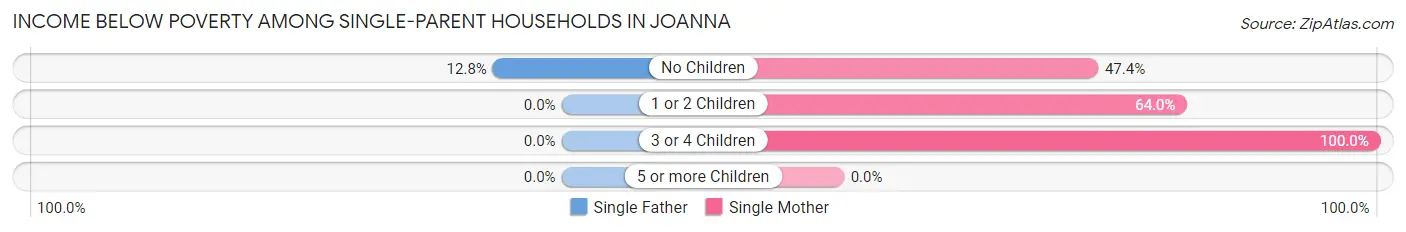
| Children | Single Father | Single Mother |
| No Children | 5 (12.8%) | 9 (47.4%) |
| 1 or 2 Children | 0 (0.0%) | 16 (64.0%) |
| 3 or 4 Children | 0 (0.0%) | 2 (100.0%) |
| 5 or more Children | 0 (0.0%) | 0 (0.0%) |
| Total | 5 (12.8%) | 27 (58.7%) |
Income Below Poverty Among Married-Couple vs Single-Parent Households in Joanna
The poverty data for Joanna shows that 7 of the married-couple family households (2.3%) and 32 of the single-parent households (37.7%) are living below the poverty level. Within the married-couple family households, those with no children have the highest poverty rate, with 7 households (3.2%) falling below the poverty line. Among the single-parent households, those with 3 or 4 children have the highest poverty rate, with 2 household (100.0%) living below poverty.
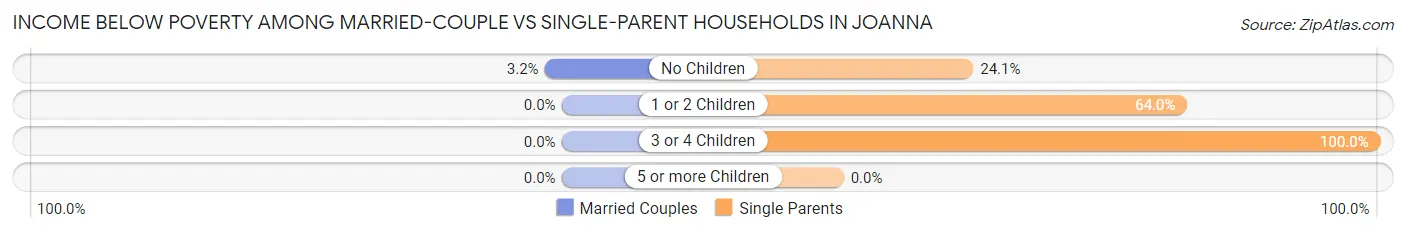
| Children | Married-Couple Families | Single-Parent Households |
| No Children | 7 (3.2%) | 14 (24.1%) |
| 1 or 2 Children | 0 (0.0%) | 16 (64.0%) |
| 3 or 4 Children | 0 (0.0%) | 2 (100.0%) |
| 5 or more Children | 0 (0.0%) | 0 (0.0%) |
| Total | 7 (2.3%) | 32 (37.7%) |
Race in Joanna
The most populous races in Joanna are White / Caucasian (1,243 | 88.4%), Hispanic or Latino (182 | 12.9%), and Black / African American (66 | 4.7%).
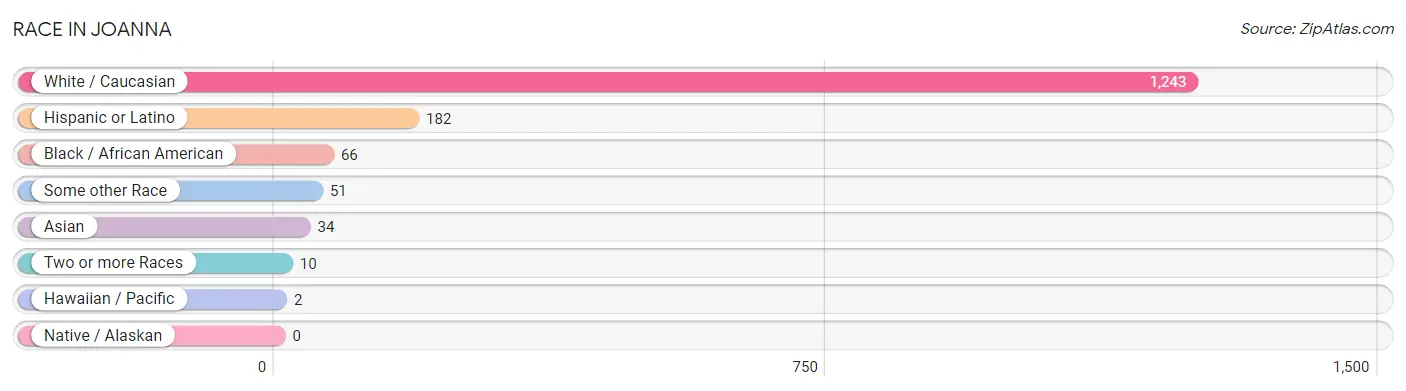
| Race | # Population | % Population |
| Asian | 34 | 2.4% |
| Black / African American | 66 | 4.7% |
| Hawaiian / Pacific | 2 | 0.1% |
| Hispanic or Latino | 182 | 12.9% |
| Native / Alaskan | 0 | 0.0% |
| White / Caucasian | 1,243 | 88.4% |
| Two or more Races | 10 | 0.7% |
| Some other Race | 51 | 3.6% |
| Total | 1,406 | 100.0% |
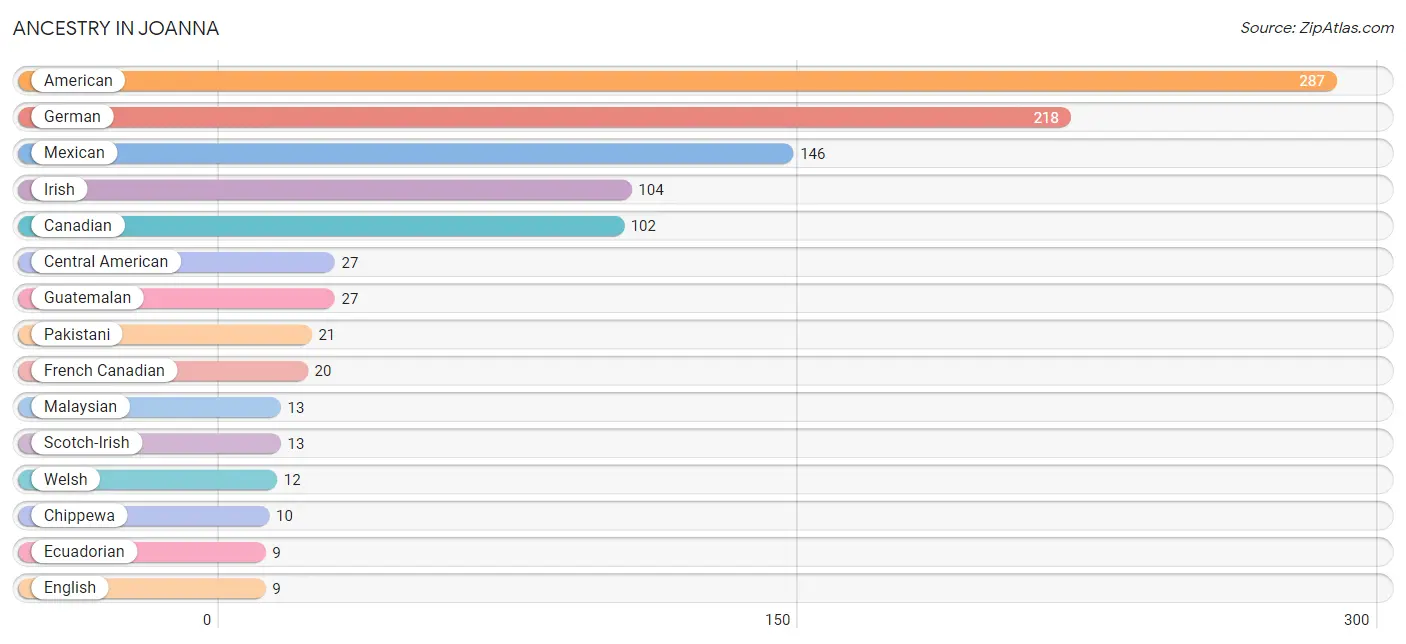
Ancestry in Joanna
The most populous ancestries reported in Joanna are American (287 | 20.4%), German (218 | 15.5%), Mexican (146 | 10.4%), Irish (104 | 7.4%), and Canadian (102 | 7.2%), together accounting for 60.9% of all Joanna residents.
| Ancestry | # Population | % Population |
| African | 2 | 0.1% |
| American | 287 | 20.4% |
| Canadian | 102 | 7.2% |
| Central American | 27 | 1.9% |
| Chippewa | 10 | 0.7% |
| Dutch | 8 | 0.6% |
| Ecuadorian | 9 | 0.6% |
| English | 9 | 0.6% |
| European | 1 | 0.1% |
| French | 9 | 0.6% |
| French Canadian | 20 | 1.4% |
| German | 218 | 15.5% |
| Guatemalan | 27 | 1.9% |
| Irish | 104 | 7.4% |
| Malaysian | 13 | 0.9% |
| Mexican | 146 | 10.4% |
| Native Hawaiian | 2 | 0.1% |
| Norwegian | 7 | 0.5% |
| Pakistani | 21 | 1.5% |
| Scotch-Irish | 13 | 0.9% |
| Slovak | 6 | 0.4% |
| South American | 9 | 0.6% |
| Subsaharan African | 2 | 0.1% |
| Swedish | 7 | 0.5% |
| Swiss | 4 | 0.3% |
| Welsh | 12 | 0.9% | View All 26 Rows |
Immigrants in Joanna
The most numerous immigrant groups reported in Joanna came from Latin America (93 | 6.6%), Central America (64 | 4.5%), Mexico (37 | 2.6%), Asia (34 | 2.4%), and South Eastern Asia (34 | 2.4%), together accounting for 18.6% of all Joanna residents.
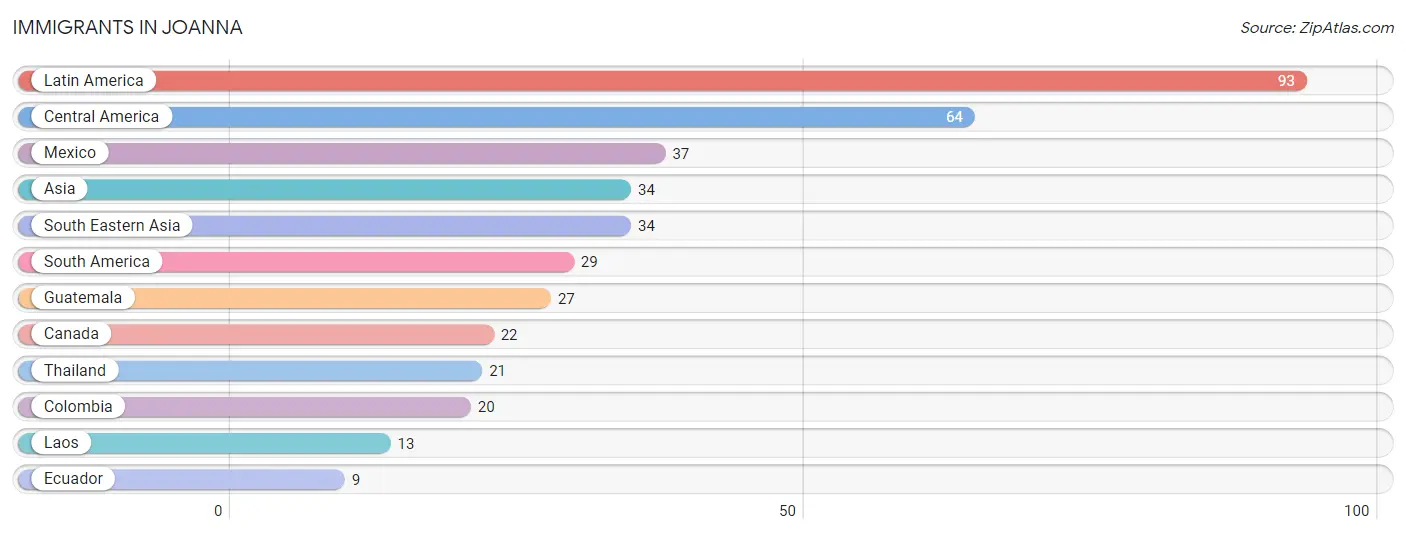
| Immigration Origin | # Population | % Population |
| Asia | 34 | 2.4% |
| Canada | 22 | 1.6% |
| Central America | 64 | 4.5% |
| Colombia | 20 | 1.4% |
| Ecuador | 9 | 0.6% |
| Guatemala | 27 | 1.9% |
| Laos | 13 | 0.9% |
| Latin America | 93 | 6.6% |
| Mexico | 37 | 2.6% |
| South America | 29 | 2.1% |
| South Eastern Asia | 34 | 2.4% |
| Thailand | 21 | 1.5% | View All 12 Rows |
Sex and Age in Joanna
Sex and Age in Joanna
The most populous age groups in Joanna are 45 to 49 Years (126 | 17.9%) for men and 40 to 44 Years (100 | 14.2%) for women.
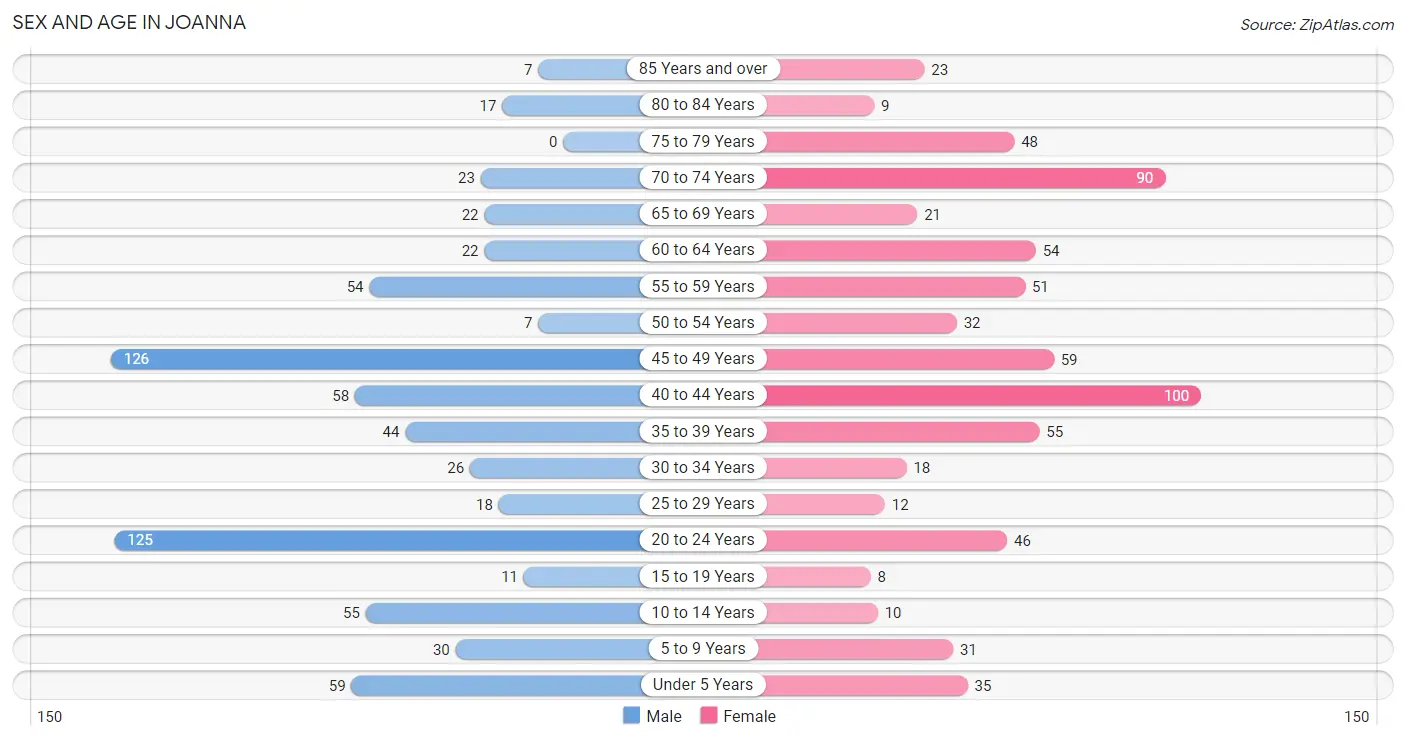
| Age Bracket | Male | Female |
| Under 5 Years | 59 (8.4%) | 35 (5.0%) |
| 5 to 9 Years | 30 (4.3%) | 31 (4.4%) |
| 10 to 14 Years | 55 (7.8%) | 10 (1.4%) |
| 15 to 19 Years | 11 (1.6%) | 8 (1.1%) |
| 20 to 24 Years | 125 (17.8%) | 46 (6.6%) |
| 25 to 29 Years | 18 (2.6%) | 12 (1.7%) |
| 30 to 34 Years | 26 (3.7%) | 18 (2.6%) |
| 35 to 39 Years | 44 (6.2%) | 55 (7.8%) |
| 40 to 44 Years | 58 (8.2%) | 100 (14.2%) |
| 45 to 49 Years | 126 (17.9%) | 59 (8.4%) |
| 50 to 54 Years | 7 (1.0%) | 32 (4.6%) |
| 55 to 59 Years | 54 (7.7%) | 51 (7.3%) |
| 60 to 64 Years | 22 (3.1%) | 54 (7.7%) |
| 65 to 69 Years | 22 (3.1%) | 21 (3.0%) |
| 70 to 74 Years | 23 (3.3%) | 90 (12.8%) |
| 75 to 79 Years | 0 (0.0%) | 48 (6.8%) |
| 80 to 84 Years | 17 (2.4%) | 9 (1.3%) |
| 85 Years and over | 7 (1.0%) | 23 (3.3%) |
| Total | 704 (100.0%) | 702 (100.0%) |
Families and Households in Joanna
Median Family Size in Joanna
The median family size in Joanna is 2.94 persons per family, with married-couple families (309 | 78.4%) accounting for the largest median family size of 3.1 persons per family. On the other hand, single male/father families (39 | 9.9%) represent the smallest median family size with 2.00 persons per family.
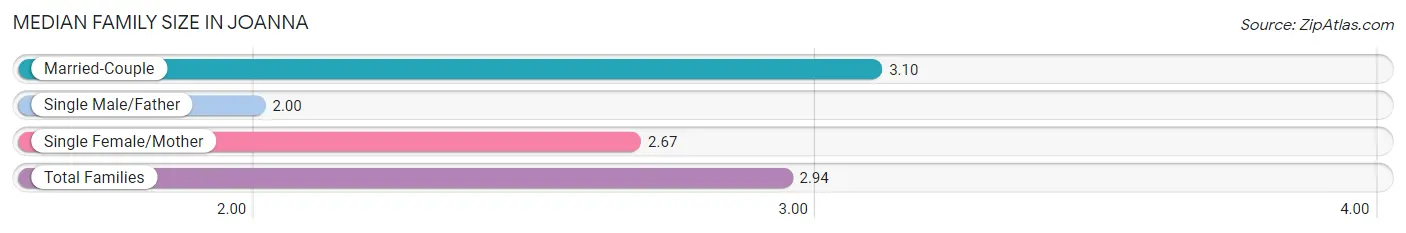
| Family Type | # Families | Family Size |
| Married-Couple | 309 (78.4%) | 3.10 |
| Single Male/Father | 39 (9.9%) | 2.00 |
| Single Female/Mother | 46 (11.7%) | 2.67 |
| Total Families | 394 (100.0%) | 2.94 |
Median Household Size in Joanna
The median household size in Joanna is 2.43 persons per household, with married-couple households (309 | 53.6%) accounting for the largest median household size of 3.26 persons per household. non-family households (182 | 31.6%) represent the smallest median household size with 1.02 persons per household.
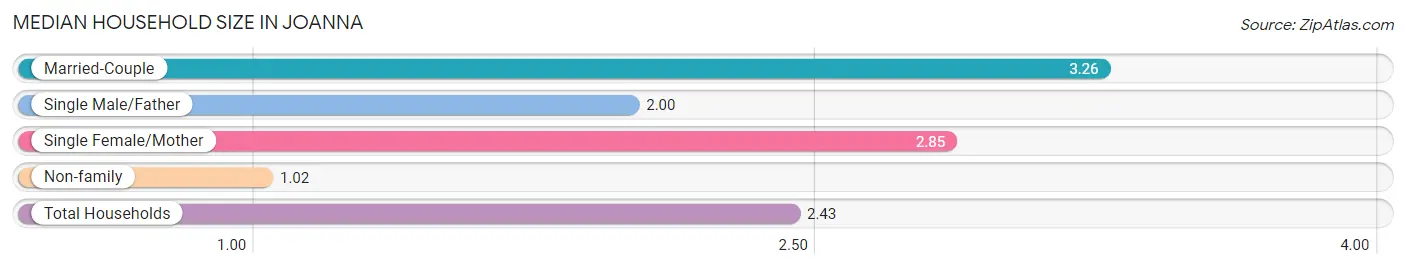
| Household Type | # Households | Household Size |
| Married-Couple | 309 (53.6%) | 3.26 |
| Single Male/Father | 39 (6.8%) | 2.00 |
| Single Female/Mother | 46 (8.0%) | 2.85 |
| Non-family | 182 (31.6%) | 1.02 |
| Total Households | 576 (100.0%) | 2.43 |
Household Size by Marriage Status in Joanna
Out of a total of 576 households in Joanna, 394 (68.4%) are family households, while 182 (31.6%) are nonfamily households. The most numerous type of family households are 2-person households, comprising 181, and the most common type of nonfamily households are 1-person households, comprising 178.
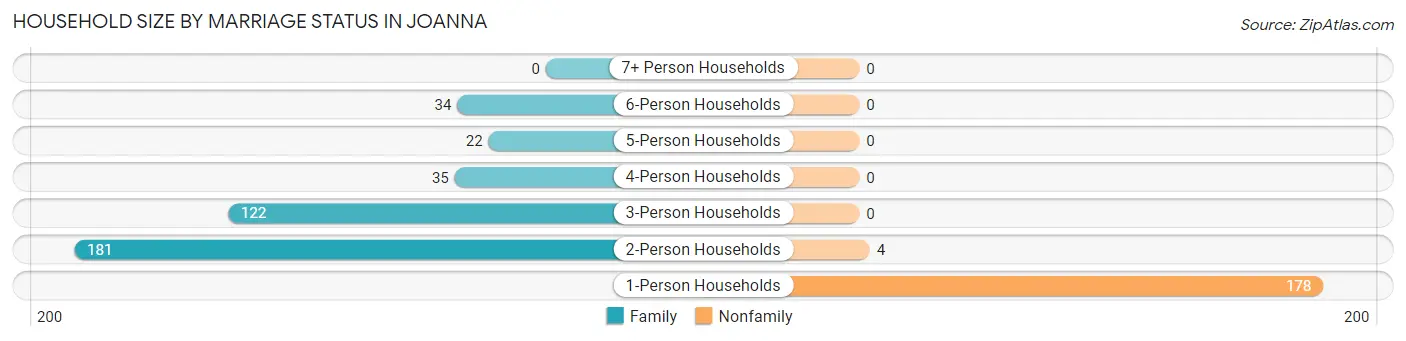
| Household Size | Family Households | Nonfamily Households |
| 1-Person Households | - | 178 (30.9%) |
| 2-Person Households | 181 (31.4%) | 4 (0.7%) |
| 3-Person Households | 122 (21.2%) | 0 (0.0%) |
| 4-Person Households | 35 (6.1%) | 0 (0.0%) |
| 5-Person Households | 22 (3.8%) | 0 (0.0%) |
| 6-Person Households | 34 (5.9%) | 0 (0.0%) |
| 7+ Person Households | 0 (0.0%) | 0 (0.0%) |
| Total | 394 (68.4%) | 182 (31.6%) |
Female Fertility in Joanna
Fertility by Age in Joanna
Average fertility rate in Joanna is 121.0 births per 1,000 women. Women in the age bracket of 20 to 34 years have the highest fertility rate with 474.0 births per 1,000 women. Women in the age bracket of 20 to 34 years acount for 100.0% of all women with births.
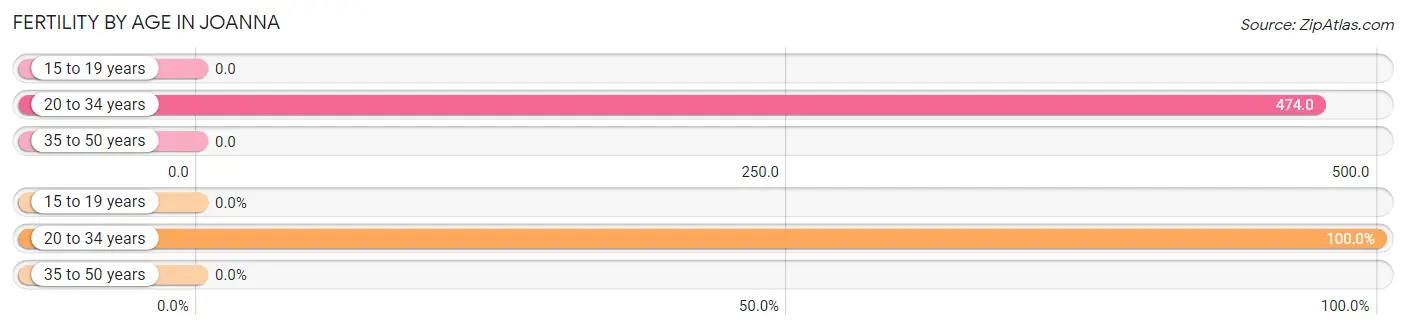
| Age Bracket | Women with Births | Births / 1,000 Women |
| 15 to 19 years | 0 (0.0%) | 0.0 |
| 20 to 34 years | 36 (100.0%) | 474.0 |
| 35 to 50 years | 0 (0.0%) | 0.0 |
| Total | 36 (100.0%) | 121.0 |
Fertility by Age by Marriage Status in Joanna
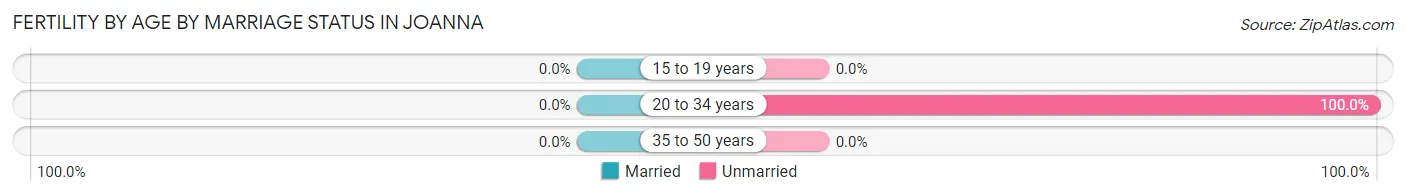
| Age Bracket | Married | Unmarried |
| 15 to 19 years | 0 (0.0%) | 0 (0.0%) |
| 20 to 34 years | 0 (0.0%) | 36 (100.0%) |
| 35 to 50 years | 0 (0.0%) | 0 (0.0%) |
| Total | 0 (0.0%) | 36 (100.0%) |
Fertility by Education in Joanna
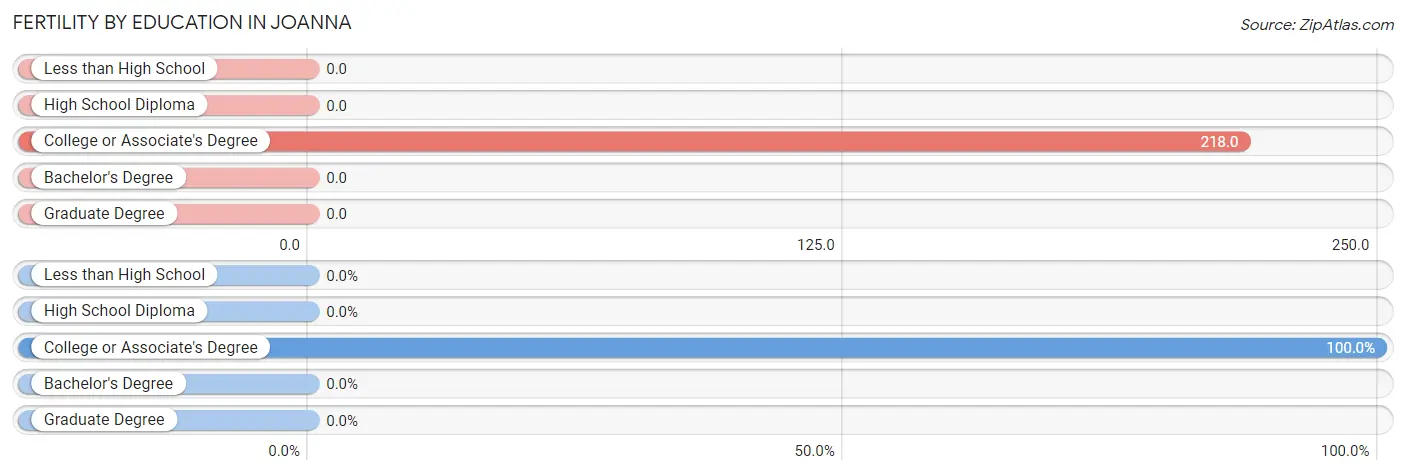
| Educational Attainment | Women with Births | Births / 1,000 Women |
| Less than High School | 0 (0.0%) | 0.0 |
| High School Diploma | 0 (0.0%) | 0.0 |
| College or Associate's Degree | 36 (100.0%) | 218.0 |
| Bachelor's Degree | 0 (0.0%) | 0.0 |
| Graduate Degree | 0 (0.0%) | 0.0 |
| Total | 36 (100.0%) | 121.0 |
Fertility by Education by Marriage Status in Joanna
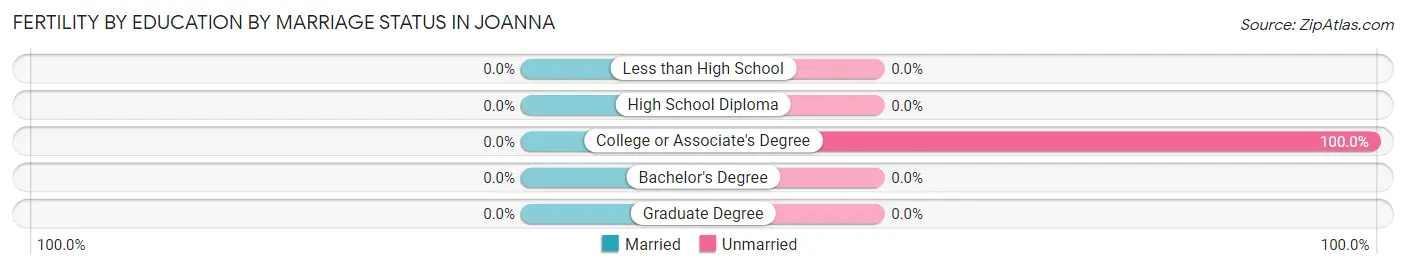
| Educational Attainment | Married | Unmarried |
| Less than High School | 0 (0.0%) | 0 (0.0%) |
| High School Diploma | 0 (0.0%) | 0 (0.0%) |
| College or Associate's Degree | 0 (0.0%) | 36 (100.0%) |
| Bachelor's Degree | 0 (0.0%) | 0 (0.0%) |
| Graduate Degree | 0 (0.0%) | 0 (0.0%) |
| Total | 0 (0.0%) | 36 (100.0%) |
Employment Characteristics in Joanna
Employment by Class of Employer in Joanna
Among the 625 employed individuals in Joanna, private company employees (382 | 61.1%), not-for-profit organizations (103 | 16.5%), and self-employed (not incorporated) (66 | 10.6%) make up the most common classes of employment.
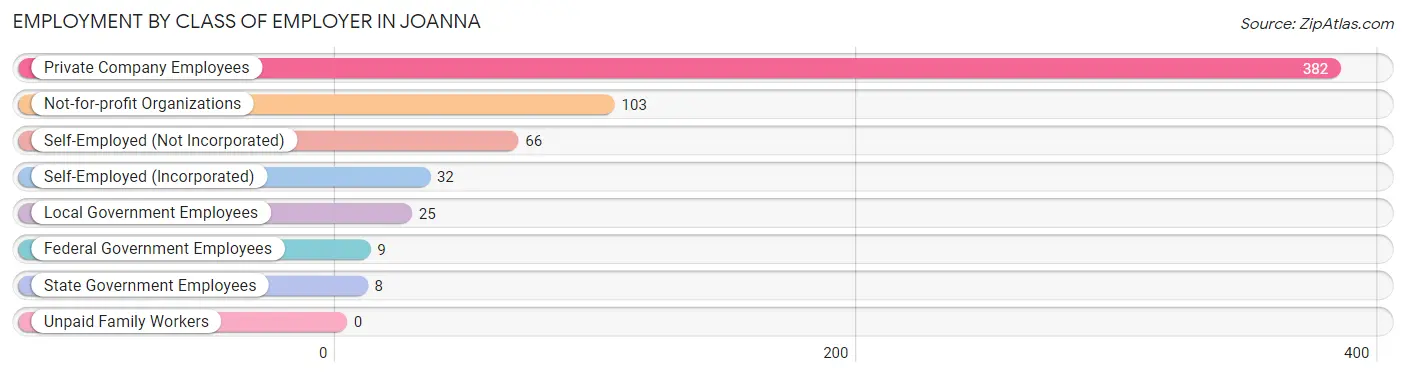
| Employer Class | # Employees | % Employees |
| Private Company Employees | 382 | 61.1% |
| Self-Employed (Incorporated) | 32 | 5.1% |
| Self-Employed (Not Incorporated) | 66 | 10.6% |
| Not-for-profit Organizations | 103 | 16.5% |
| Local Government Employees | 25 | 4.0% |
| State Government Employees | 8 | 1.3% |
| Federal Government Employees | 9 | 1.4% |
| Unpaid Family Workers | 0 | 0.0% |
| Total | 625 | 100.0% |
Employment Status by Age in Joanna
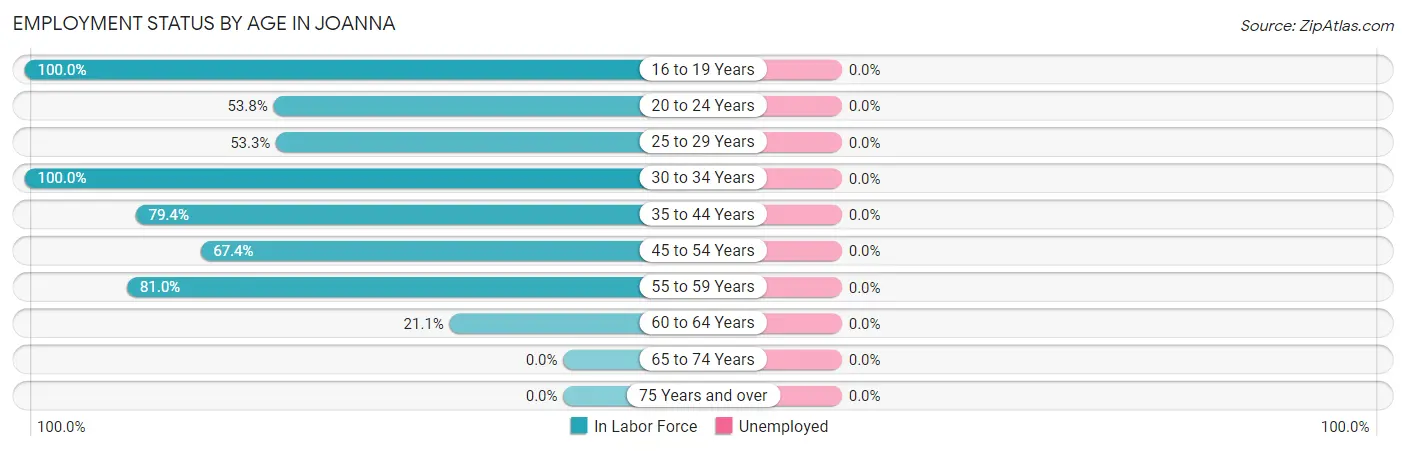
| Age Bracket | In Labor Force | Unemployed |
| 16 to 19 Years | 19 (100.0%) | 0 (0.0%) |
| 20 to 24 Years | 92 (53.8%) | 0 (0.0%) |
| 25 to 29 Years | 16 (53.3%) | 0 (0.0%) |
| 30 to 34 Years | 44 (100.0%) | 0 (0.0%) |
| 35 to 44 Years | 204 (79.4%) | 0 (0.0%) |
| 45 to 54 Years | 151 (67.4%) | 0 (0.0%) |
| 55 to 59 Years | 85 (81.0%) | 0 (0.0%) |
| 60 to 64 Years | 16 (21.1%) | 0 (0.0%) |
| 65 to 74 Years | 0 (0.0%) | 0 (0.0%) |
| 75 Years and over | 0 (0.0%) | 0 (0.0%) |
| Total | 627 (52.9%) | 0 (0.0%) |
Employment Status by Educational Attainment in Joanna
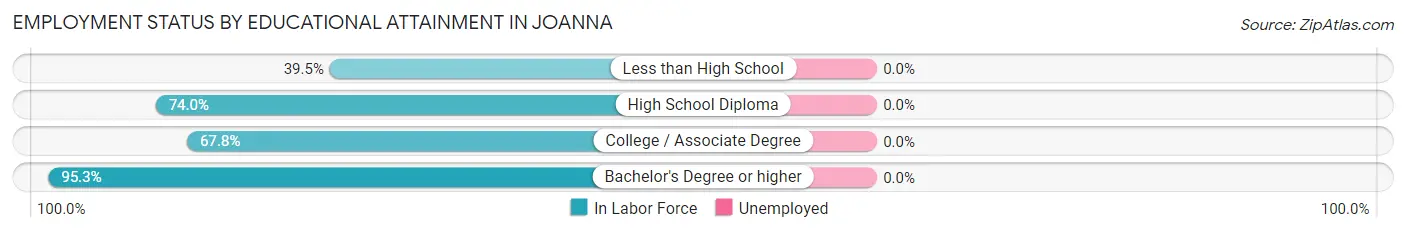
| Educational Attainment | In Labor Force | Unemployed |
| Less than High School | 58 (39.5%) | 0 (0.0%) |
| High School Diploma | 213 (74.0%) | 0 (0.0%) |
| College / Associate Degree | 103 (67.8%) | 0 (0.0%) |
| Bachelor's Degree or higher | 142 (95.3%) | 0 (0.0%) |
| Total | 516 (70.1%) | 0 (0.0%) |
Employment Occupations by Sex in Joanna
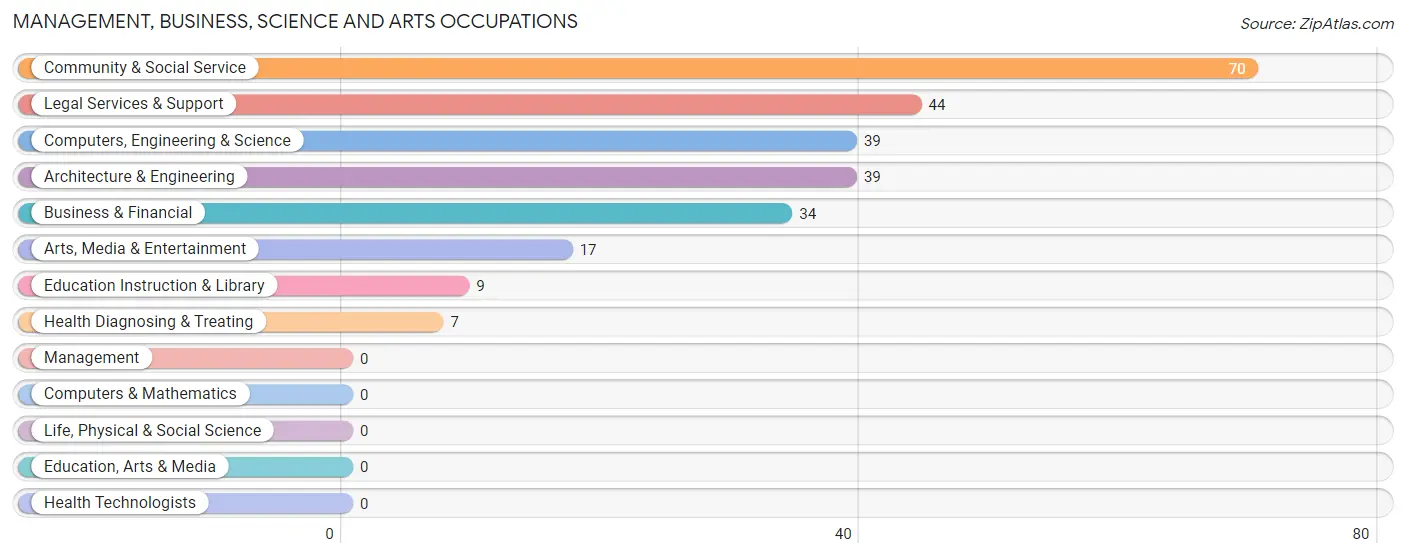
Management, Business, Science and Arts Occupations
The most common Management, Business, Science and Arts occupations in Joanna are Community & Social Service (70 | 11.2%), Legal Services & Support (44 | 7.0%), Computers, Engineering & Science (39 | 6.2%), Architecture & Engineering (39 | 6.2%), and Business & Financial (34 | 5.4%).
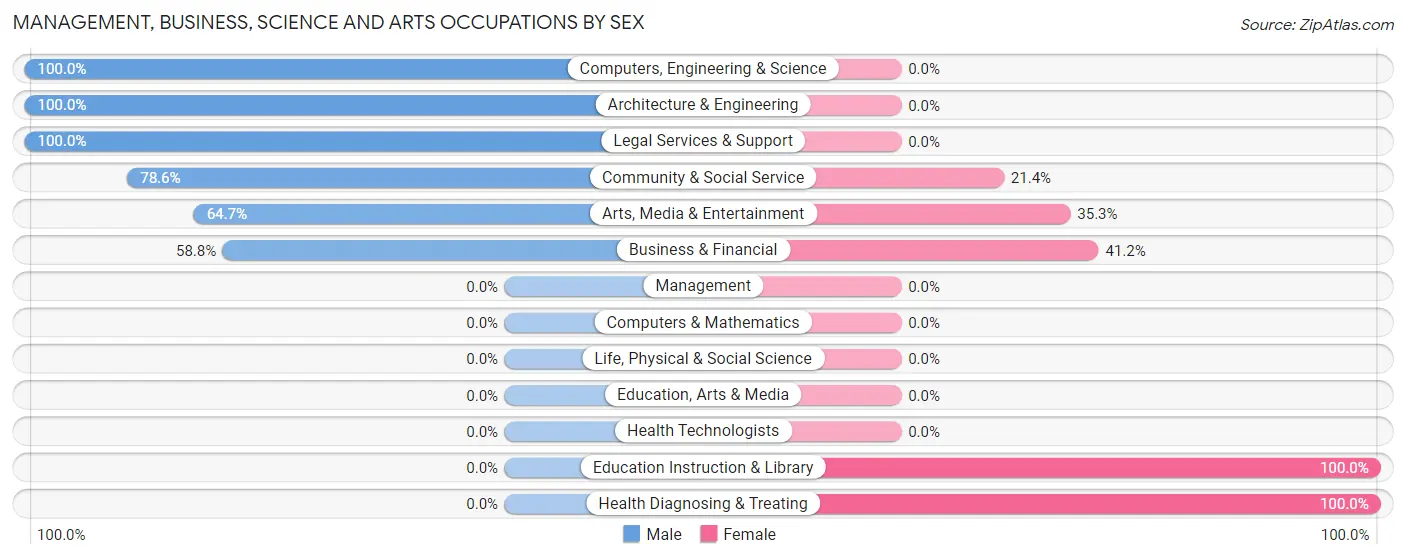
Management, Business, Science and Arts Occupations by Sex
Within the Management, Business, Science and Arts occupations in Joanna, the most male-oriented occupations are Computers, Engineering & Science (100.0%), Architecture & Engineering (100.0%), and Legal Services & Support (100.0%), while the most female-oriented occupations are Education Instruction & Library (100.0%), Health Diagnosing & Treating (100.0%), and Business & Financial (41.2%).
| Occupation | Male | Female |
| Management | 0 (0.0%) | 0 (0.0%) |
| Business & Financial | 20 (58.8%) | 14 (41.2%) |
| Computers, Engineering & Science | 39 (100.0%) | 0 (0.0%) |
| Computers & Mathematics | 0 (0.0%) | 0 (0.0%) |
| Architecture & Engineering | 39 (100.0%) | 0 (0.0%) |
| Life, Physical & Social Science | 0 (0.0%) | 0 (0.0%) |
| Community & Social Service | 55 (78.6%) | 15 (21.4%) |
| Education, Arts & Media | 0 (0.0%) | 0 (0.0%) |
| Legal Services & Support | 44 (100.0%) | 0 (0.0%) |
| Education Instruction & Library | 0 (0.0%) | 9 (100.0%) |
| Arts, Media & Entertainment | 11 (64.7%) | 6 (35.3%) |
| Health Diagnosing & Treating | 0 (0.0%) | 7 (100.0%) |
| Health Technologists | 0 (0.0%) | 0 (0.0%) |
| Total (Category) | 114 (76.0%) | 36 (24.0%) |
| Total (Overall) | 372 (59.3%) | 255 (40.7%) |
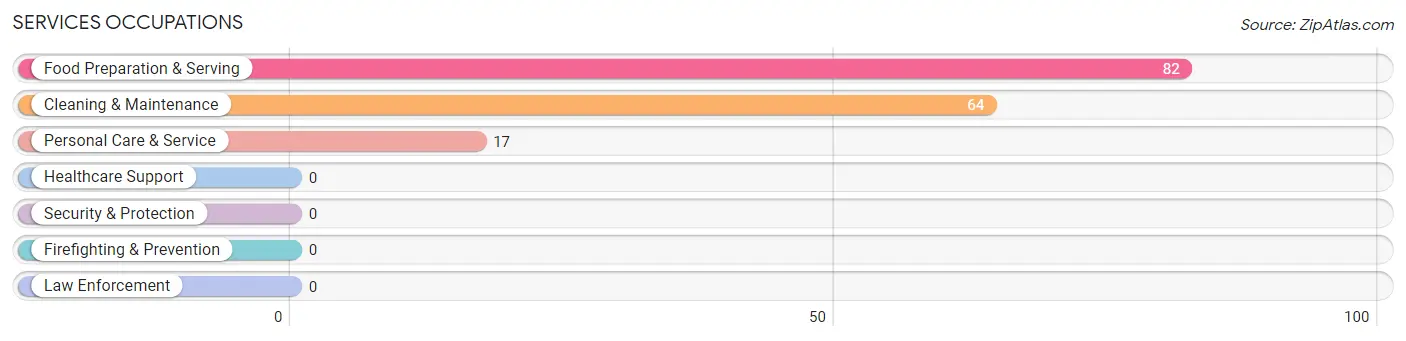
Services Occupations
The most common Services occupations in Joanna are Food Preparation & Serving (82 | 13.1%), Cleaning & Maintenance (64 | 10.2%), and Personal Care & Service (17 | 2.7%).
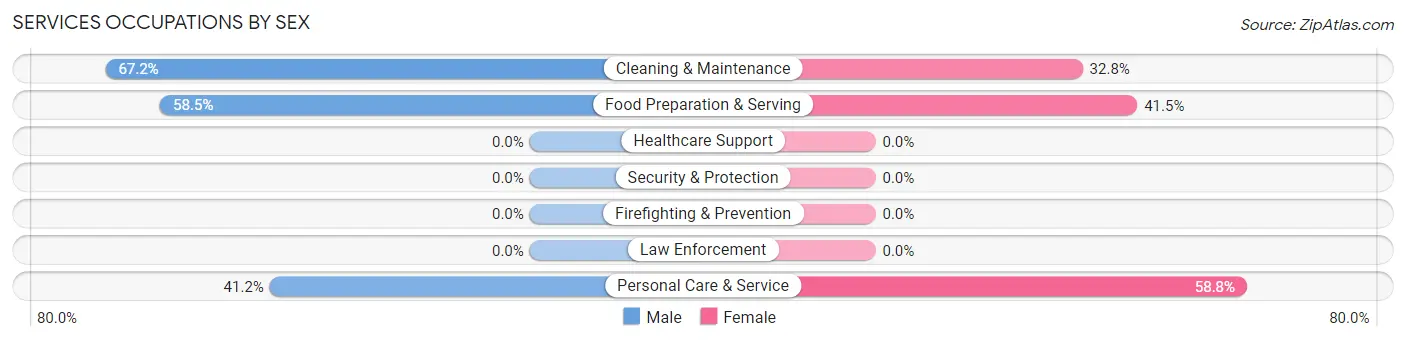
Services Occupations by Sex
Within the Services occupations in Joanna, the most male-oriented occupations are Cleaning & Maintenance (67.2%), Food Preparation & Serving (58.5%), and Personal Care & Service (41.2%), while the most female-oriented occupations are Personal Care & Service (58.8%), Food Preparation & Serving (41.5%), and Cleaning & Maintenance (32.8%).
| Occupation | Male | Female |
| Healthcare Support | 0 (0.0%) | 0 (0.0%) |
| Security & Protection | 0 (0.0%) | 0 (0.0%) |
| Firefighting & Prevention | 0 (0.0%) | 0 (0.0%) |
| Law Enforcement | 0 (0.0%) | 0 (0.0%) |
| Food Preparation & Serving | 48 (58.5%) | 34 (41.5%) |
| Cleaning & Maintenance | 43 (67.2%) | 21 (32.8%) |
| Personal Care & Service | 7 (41.2%) | 10 (58.8%) |
| Total (Category) | 98 (60.1%) | 65 (39.9%) |
| Total (Overall) | 372 (59.3%) | 255 (40.7%) |
Sales and Office Occupations
The most common Sales and Office occupations in Joanna are Office & Administration (82 | 13.1%), and Sales & Related (60 | 9.6%).
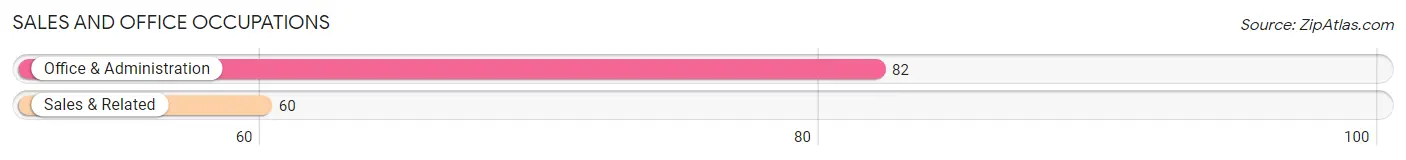
Sales and Office Occupations by Sex
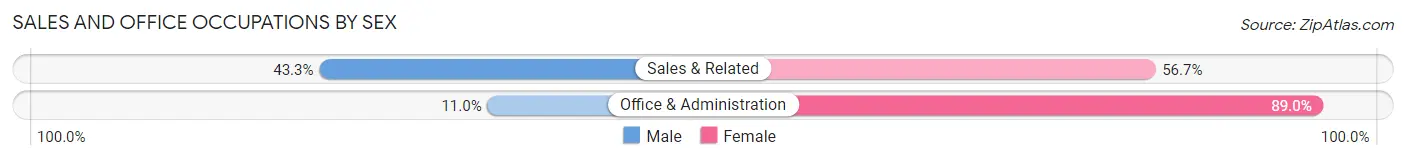
| Occupation | Male | Female |
| Sales & Related | 26 (43.3%) | 34 (56.7%) |
| Office & Administration | 9 (11.0%) | 73 (89.0%) |
| Total (Category) | 35 (24.6%) | 107 (75.3%) |
| Total (Overall) | 372 (59.3%) | 255 (40.7%) |
Natural Resources, Construction and Maintenance Occupations
The most common Natural Resources, Construction and Maintenance occupations in Joanna are Installation, Maintenance & Repair (48 | 7.7%), and Construction & Extraction (5 | 0.8%).
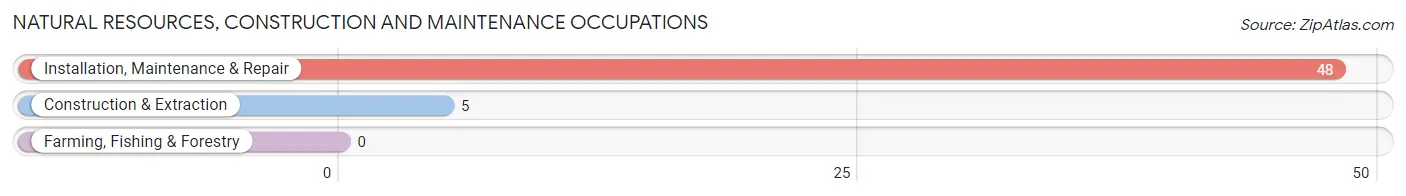
Natural Resources, Construction and Maintenance Occupations by Sex
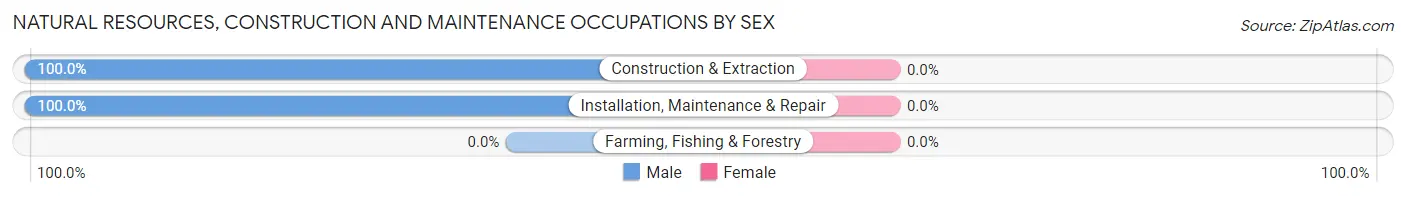
| Occupation | Male | Female |
| Farming, Fishing & Forestry | 0 (0.0%) | 0 (0.0%) |
| Construction & Extraction | 5 (100.0%) | 0 (0.0%) |
| Installation, Maintenance & Repair | 48 (100.0%) | 0 (0.0%) |
| Total (Category) | 53 (100.0%) | 0 (0.0%) |
| Total (Overall) | 372 (59.3%) | 255 (40.7%) |
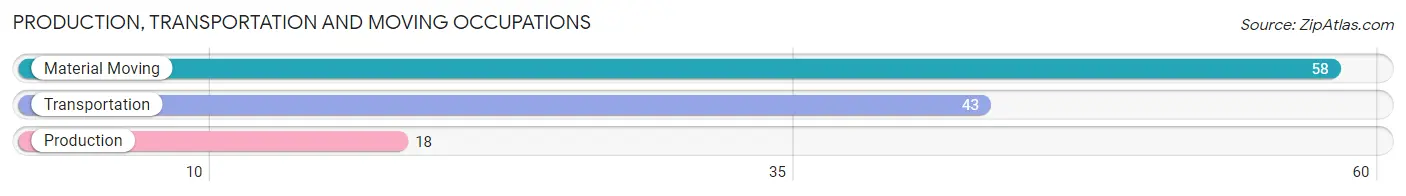
Production, Transportation and Moving Occupations
The most common Production, Transportation and Moving occupations in Joanna are Material Moving (58 | 9.2%), Transportation (43 | 6.9%), and Production (18 | 2.9%).
Production, Transportation and Moving Occupations by Sex
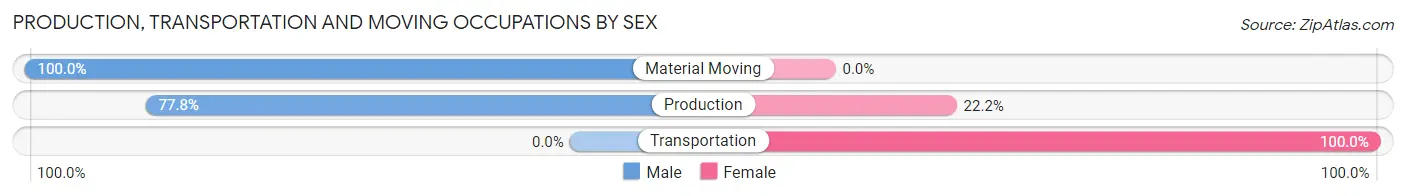
| Occupation | Male | Female |
| Production | 14 (77.8%) | 4 (22.2%) |
| Transportation | 0 (0.0%) | 43 (100.0%) |
| Material Moving | 58 (100.0%) | 0 (0.0%) |
| Total (Category) | 72 (60.5%) | 47 (39.5%) |
| Total (Overall) | 372 (59.3%) | 255 (40.7%) |
Employment Industries by Sex in Joanna
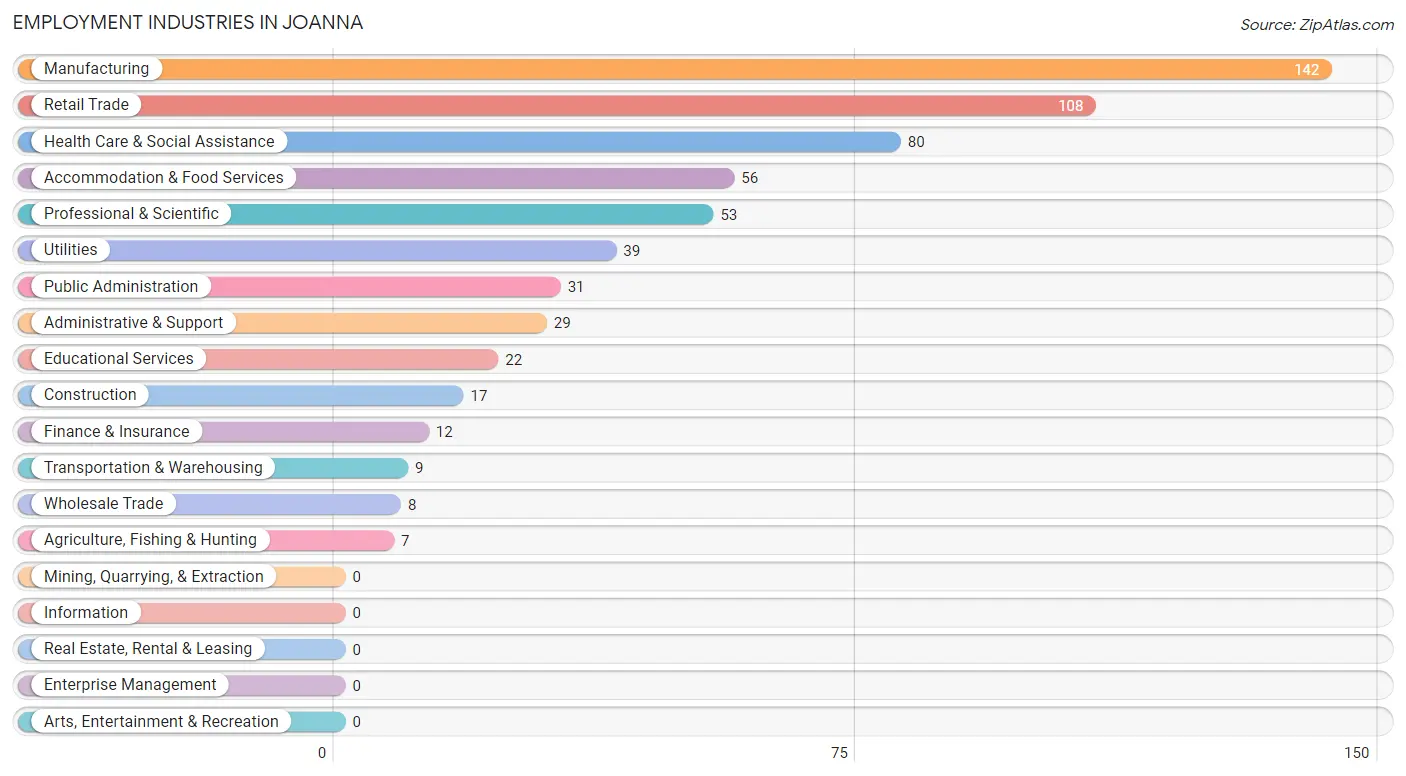
Employment Industries in Joanna
The major employment industries in Joanna include Manufacturing (142 | 22.7%), Retail Trade (108 | 17.2%), Health Care & Social Assistance (80 | 12.8%), Accommodation & Food Services (56 | 8.9%), and Professional & Scientific (53 | 8.5%).
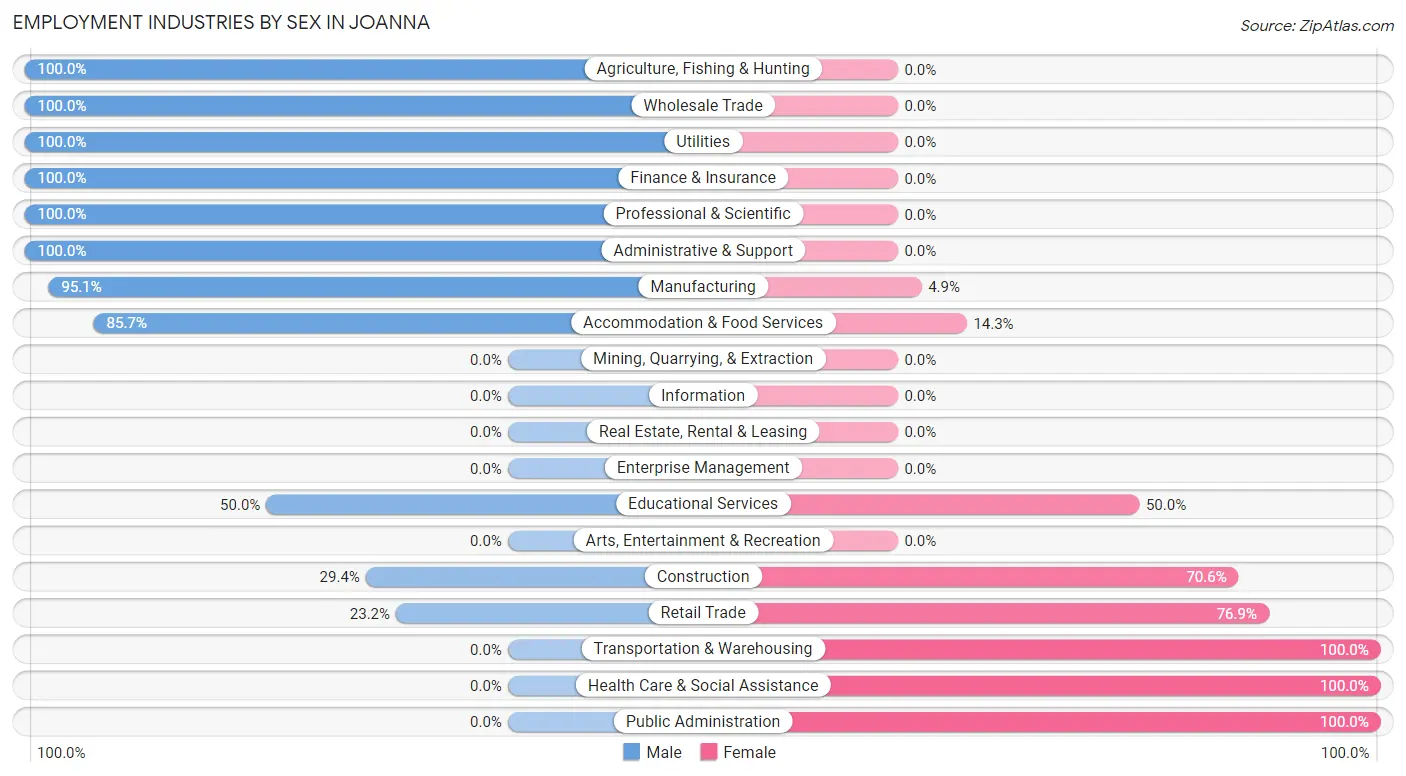
Employment Industries by Sex in Joanna
The Joanna industries that see more men than women are Agriculture, Fishing & Hunting (100.0%), Wholesale Trade (100.0%), and Utilities (100.0%), whereas the industries that tend to have a higher number of women are Transportation & Warehousing (100.0%), Health Care & Social Assistance (100.0%), and Public Administration (100.0%).
| Industry | Male | Female |
| Agriculture, Fishing & Hunting | 7 (100.0%) | 0 (0.0%) |
| Mining, Quarrying, & Extraction | 0 (0.0%) | 0 (0.0%) |
| Construction | 5 (29.4%) | 12 (70.6%) |
| Manufacturing | 135 (95.1%) | 7 (4.9%) |
| Wholesale Trade | 8 (100.0%) | 0 (0.0%) |
| Retail Trade | 25 (23.2%) | 83 (76.8%) |
| Transportation & Warehousing | 0 (0.0%) | 9 (100.0%) |
| Utilities | 39 (100.0%) | 0 (0.0%) |
| Information | 0 (0.0%) | 0 (0.0%) |
| Finance & Insurance | 12 (100.0%) | 0 (0.0%) |
| Real Estate, Rental & Leasing | 0 (0.0%) | 0 (0.0%) |
| Professional & Scientific | 53 (100.0%) | 0 (0.0%) |
| Enterprise Management | 0 (0.0%) | 0 (0.0%) |
| Administrative & Support | 29 (100.0%) | 0 (0.0%) |
| Educational Services | 11 (50.0%) | 11 (50.0%) |
| Health Care & Social Assistance | 0 (0.0%) | 80 (100.0%) |
| Arts, Entertainment & Recreation | 0 (0.0%) | 0 (0.0%) |
| Accommodation & Food Services | 48 (85.7%) | 8 (14.3%) |
| Public Administration | 0 (0.0%) | 31 (100.0%) |
| Total | 372 (59.3%) | 255 (40.7%) |
Education in Joanna
School Enrollment in Joanna
The most common levels of schooling among the 208 students in Joanna are nursery / preschool (63 | 30.3%), middle school (60 | 28.8%), and elementary school (55 | 26.4%).
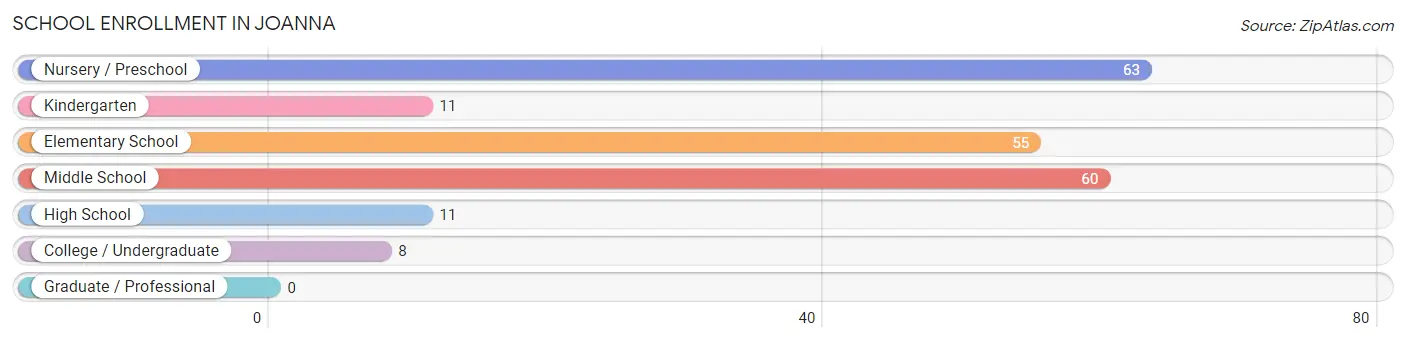
| School Level | # Students | % Students |
| Nursery / Preschool | 63 | 30.3% |
| Kindergarten | 11 | 5.3% |
| Elementary School | 55 | 26.4% |
| Middle School | 60 | 28.8% |
| High School | 11 | 5.3% |
| College / Undergraduate | 8 | 3.8% |
| Graduate / Professional | 0 | 0.0% |
| Total | 208 | 100.0% |
School Enrollment by Age by Funding Source in Joanna
Out of a total of 208 students who are enrolled in schools in Joanna, 36 (17.3%) attend a private institution, while the remaining 172 (82.7%) are enrolled in public schools. The age group of 18 to 19 year olds has the highest likelihood of being enrolled in private schools, with 8 (100.0% in the age bracket) enrolled. Conversely, the age group of 5 to 9 year old has the lowest likelihood of being enrolled in a private school, with 61 (100.0% in the age bracket) attending a public institution.
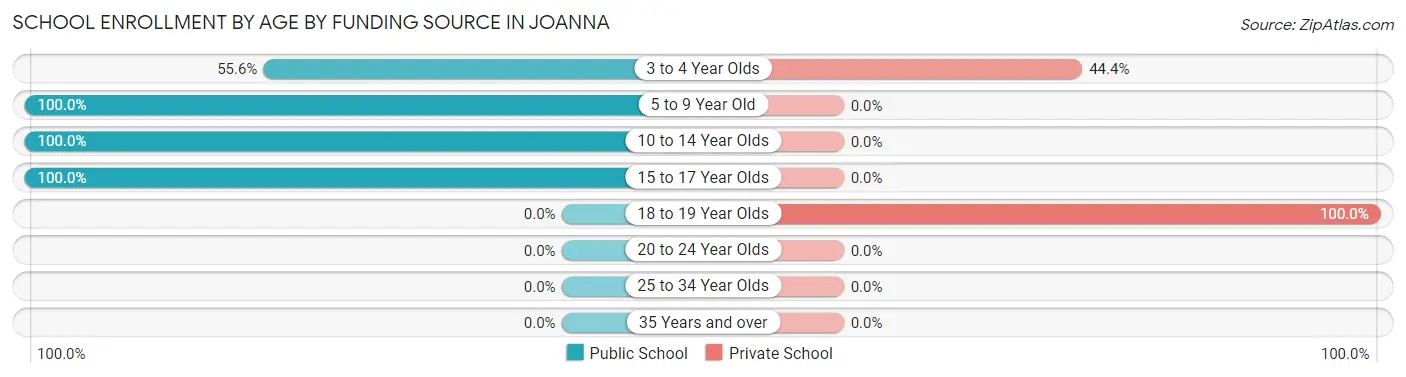
| Age Bracket | Public School | Private School |
| 3 to 4 Year Olds | 35 (55.6%) | 28 (44.4%) |
| 5 to 9 Year Old | 61 (100.0%) | 0 (0.0%) |
| 10 to 14 Year Olds | 65 (100.0%) | 0 (0.0%) |
| 15 to 17 Year Olds | 11 (100.0%) | 0 (0.0%) |
| 18 to 19 Year Olds | 0 (0.0%) | 8 (100.0%) |
| 20 to 24 Year Olds | 0 (0.0%) | 0 (0.0%) |
| 25 to 34 Year Olds | 0 (0.0%) | 0 (0.0%) |
| 35 Years and over | 0 (0.0%) | 0 (0.0%) |
| Total | 172 (82.7%) | 36 (17.3%) |
Educational Attainment by Field of Study in Joanna
Business (94 | 63.1%), bio, nature & agricultural (22 | 14.8%), communications (20 | 13.4%), education (7 | 4.7%), and psychology (6 | 4.0%) are the most common fields of study among 149 individuals in Joanna who have obtained a bachelor's degree or higher.
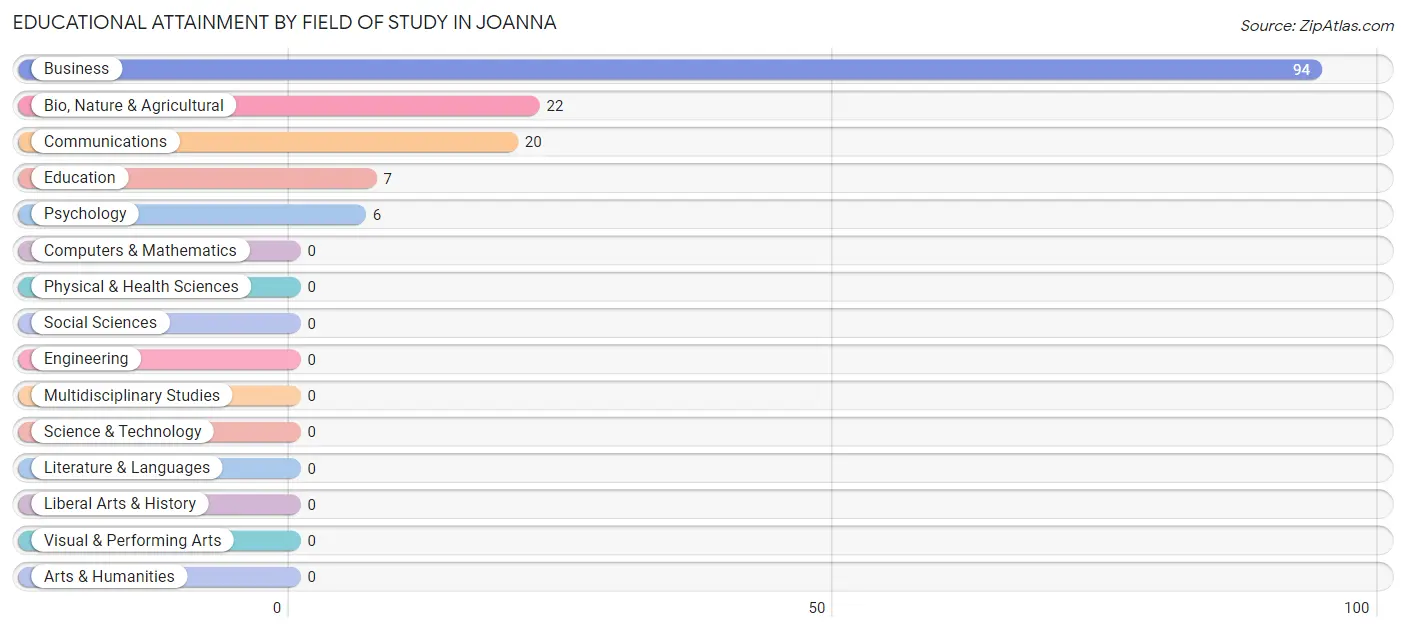
| Field of Study | # Graduates | % Graduates |
| Computers & Mathematics | 0 | 0.0% |
| Bio, Nature & Agricultural | 22 | 14.8% |
| Physical & Health Sciences | 0 | 0.0% |
| Psychology | 6 | 4.0% |
| Social Sciences | 0 | 0.0% |
| Engineering | 0 | 0.0% |
| Multidisciplinary Studies | 0 | 0.0% |
| Science & Technology | 0 | 0.0% |
| Business | 94 | 63.1% |
| Education | 7 | 4.7% |
| Literature & Languages | 0 | 0.0% |
| Liberal Arts & History | 0 | 0.0% |
| Visual & Performing Arts | 0 | 0.0% |
| Communications | 20 | 13.4% |
| Arts & Humanities | 0 | 0.0% |
| Total | 149 | 100.0% |
Transportation & Commute in Joanna
Vehicle Availability by Sex in Joanna
The most prevalent vehicle ownership categories in Joanna are males with 2 vehicles (159, accounting for 42.7%) and females with 2 vehicles (129, making up 62.8%).
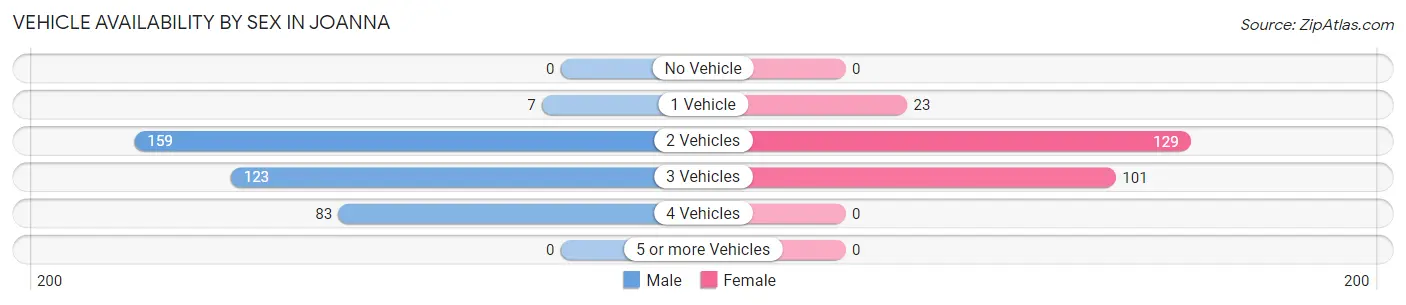
| Vehicles Available | Male | Female |
| No Vehicle | 0 (0.0%) | 0 (0.0%) |
| 1 Vehicle | 7 (1.9%) | 23 (9.1%) |
| 2 Vehicles | 159 (42.7%) | 129 (51.0%) |
| 3 Vehicles | 123 (33.1%) | 101 (39.9%) |
| 4 Vehicles | 83 (22.3%) | 0 (0.0%) |
| 5 or more Vehicles | 0 (0.0%) | 0 (0.0%) |
| Total | 372 (100.0%) | 253 (100.0%) |
Commute Time in Joanna
The most frequently occuring commute durations in Joanna are 15 to 19 minutes (208 commuters, 36.6%), 30 to 34 minutes (98 commuters, 17.2%), and 10 to 14 minutes (60 commuters, 10.5%).
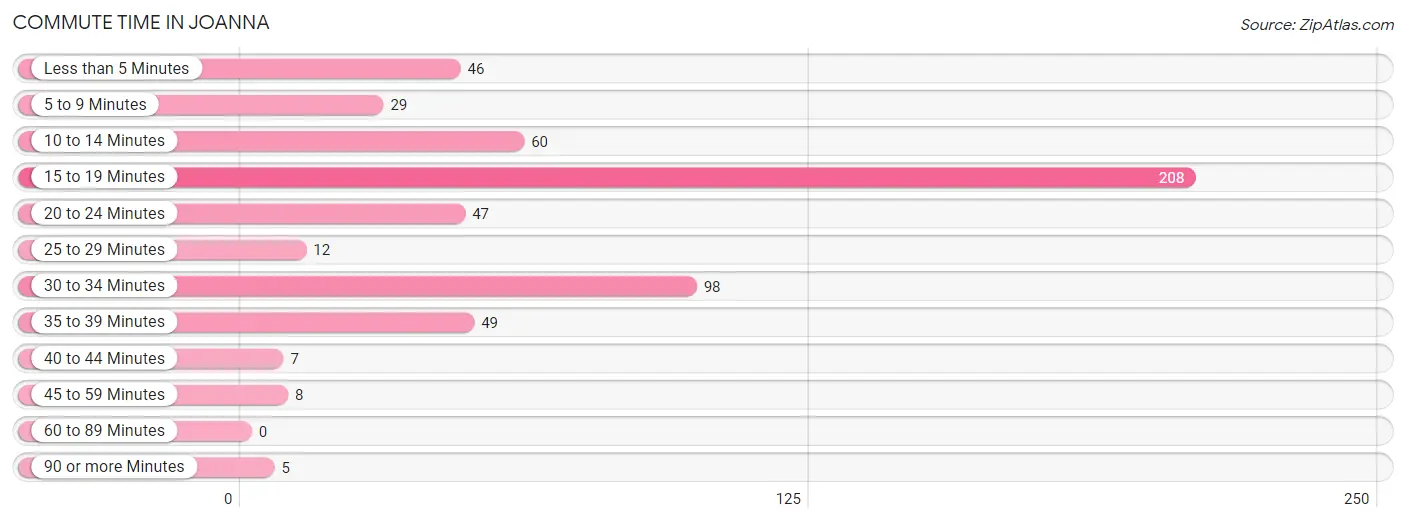
| Commute Time | # Commuters | % Commuters |
| Less than 5 Minutes | 46 | 8.1% |
| 5 to 9 Minutes | 29 | 5.1% |
| 10 to 14 Minutes | 60 | 10.5% |
| 15 to 19 Minutes | 208 | 36.6% |
| 20 to 24 Minutes | 47 | 8.3% |
| 25 to 29 Minutes | 12 | 2.1% |
| 30 to 34 Minutes | 98 | 17.2% |
| 35 to 39 Minutes | 49 | 8.6% |
| 40 to 44 Minutes | 7 | 1.2% |
| 45 to 59 Minutes | 8 | 1.4% |
| 60 to 89 Minutes | 0 | 0.0% |
| 90 or more Minutes | 5 | 0.9% |
Commute Time by Sex in Joanna
The most common commute times in Joanna are 15 to 19 minutes (87 commuters, 27.5%) for males and 15 to 19 minutes (121 commuters, 47.8%) for females.
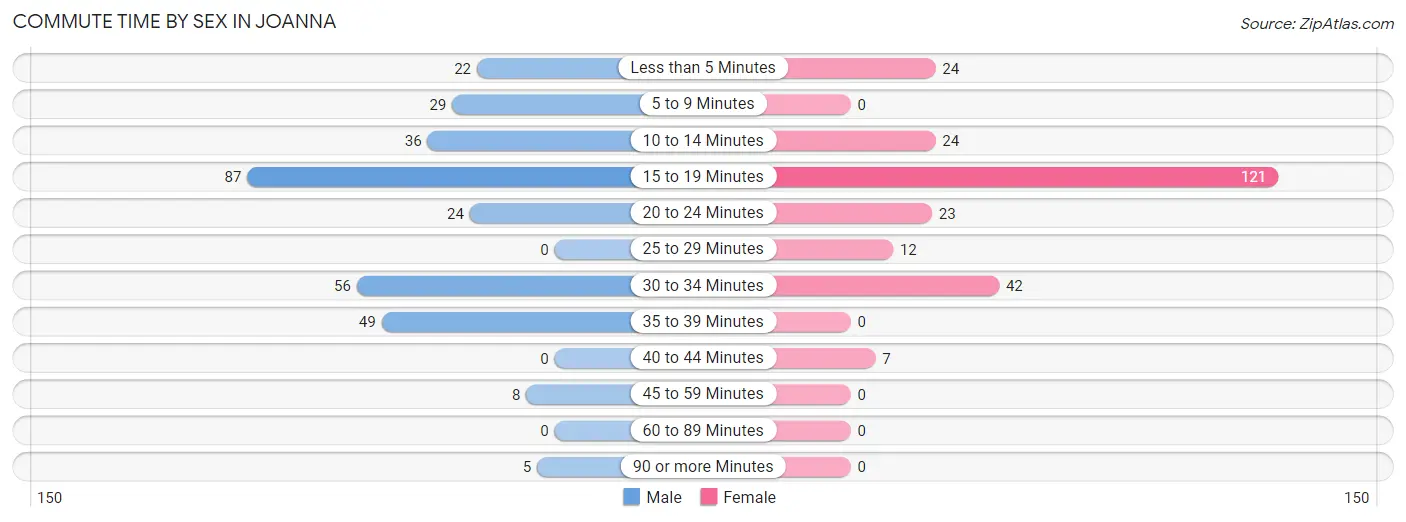
| Commute Time | Male | Female |
| Less than 5 Minutes | 22 (7.0%) | 24 (9.5%) |
| 5 to 9 Minutes | 29 (9.2%) | 0 (0.0%) |
| 10 to 14 Minutes | 36 (11.4%) | 24 (9.5%) |
| 15 to 19 Minutes | 87 (27.5%) | 121 (47.8%) |
| 20 to 24 Minutes | 24 (7.6%) | 23 (9.1%) |
| 25 to 29 Minutes | 0 (0.0%) | 12 (4.7%) |
| 30 to 34 Minutes | 56 (17.7%) | 42 (16.6%) |
| 35 to 39 Minutes | 49 (15.5%) | 0 (0.0%) |
| 40 to 44 Minutes | 0 (0.0%) | 7 (2.8%) |
| 45 to 59 Minutes | 8 (2.5%) | 0 (0.0%) |
| 60 to 89 Minutes | 0 (0.0%) | 0 (0.0%) |
| 90 or more Minutes | 5 (1.6%) | 0 (0.0%) |
Time of Departure to Work by Sex in Joanna
The most frequent times of departure to work in Joanna are 6:30 AM to 6:59 AM (71, 22.5%) for males and 8:00 AM to 8:29 AM (45, 17.8%) for females.
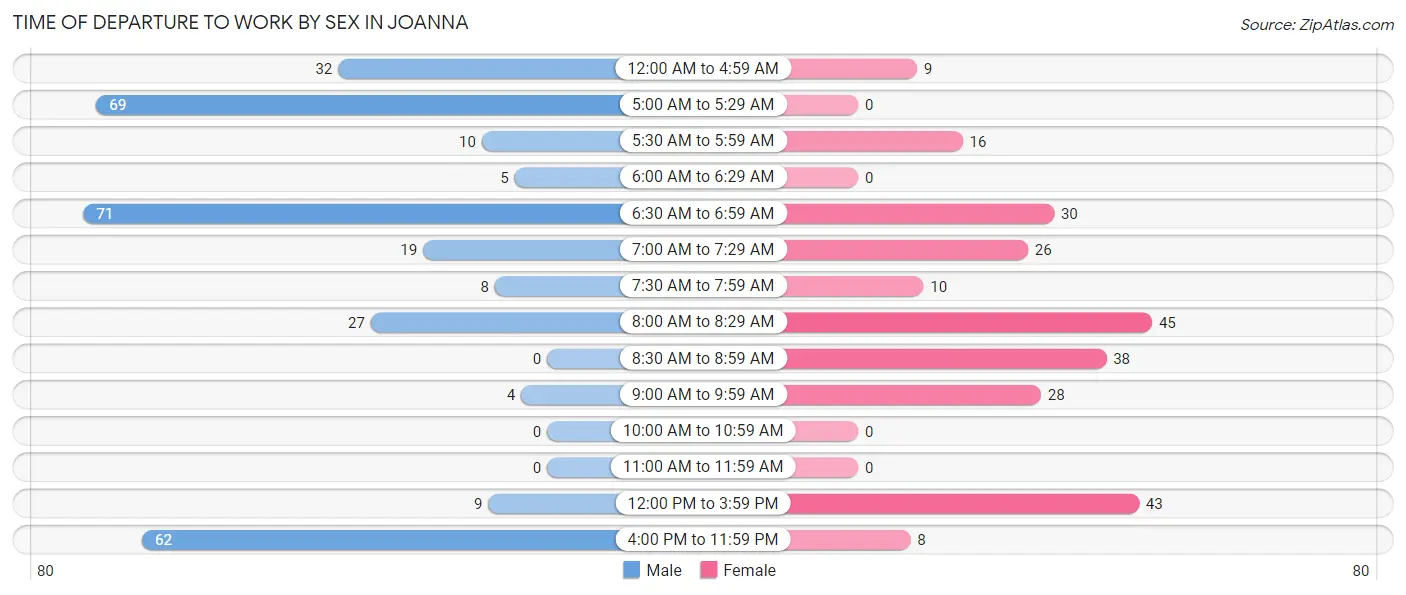
| Time of Departure | Male | Female |
| 12:00 AM to 4:59 AM | 32 (10.1%) | 9 (3.6%) |
| 5:00 AM to 5:29 AM | 69 (21.8%) | 0 (0.0%) |
| 5:30 AM to 5:59 AM | 10 (3.2%) | 16 (6.3%) |
| 6:00 AM to 6:29 AM | 5 (1.6%) | 0 (0.0%) |
| 6:30 AM to 6:59 AM | 71 (22.5%) | 30 (11.9%) |
| 7:00 AM to 7:29 AM | 19 (6.0%) | 26 (10.3%) |
| 7:30 AM to 7:59 AM | 8 (2.5%) | 10 (4.0%) |
| 8:00 AM to 8:29 AM | 27 (8.5%) | 45 (17.8%) |
| 8:30 AM to 8:59 AM | 0 (0.0%) | 38 (15.0%) |
| 9:00 AM to 9:59 AM | 4 (1.3%) | 28 (11.1%) |
| 10:00 AM to 10:59 AM | 0 (0.0%) | 0 (0.0%) |
| 11:00 AM to 11:59 AM | 0 (0.0%) | 0 (0.0%) |
| 12:00 PM to 3:59 PM | 9 (2.9%) | 43 (17.0%) |
| 4:00 PM to 11:59 PM | 62 (19.6%) | 8 (3.2%) |
| Total | 316 (100.0%) | 253 (100.0%) |
Housing Occupancy in Joanna
Occupancy by Ownership in Joanna
Of the total 576 dwellings in Joanna, owner-occupied units account for 394 (68.4%), while renter-occupied units make up 182 (31.6%).
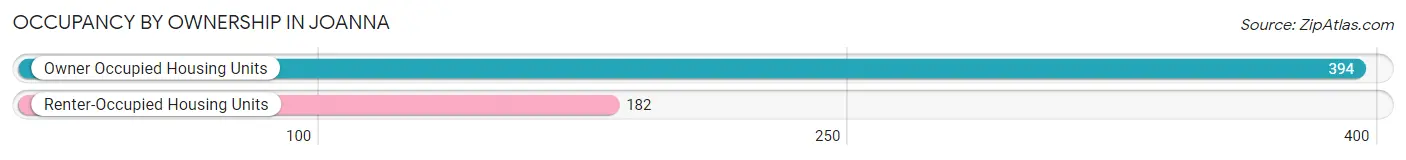
| Occupancy | # Housing Units | % Housing Units |
| Owner Occupied Housing Units | 394 | 68.4% |
| Renter-Occupied Housing Units | 182 | 31.6% |
| Total Occupied Housing Units | 576 | 100.0% |
Occupancy by Household Size in Joanna
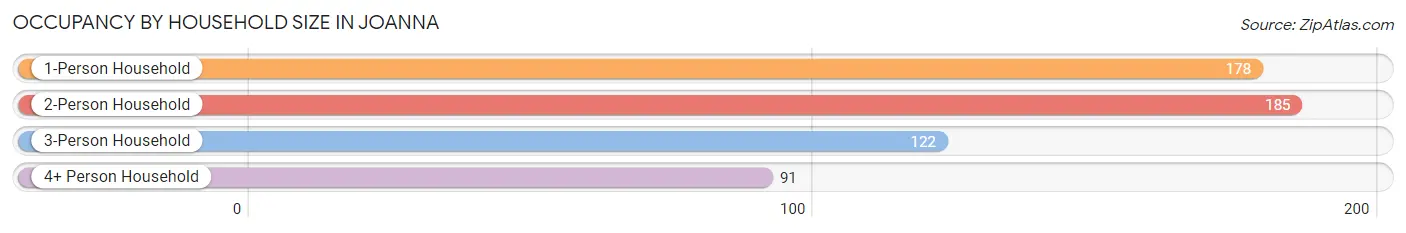
| Household Size | # Housing Units | % Housing Units |
| 1-Person Household | 178 | 30.9% |
| 2-Person Household | 185 | 32.1% |
| 3-Person Household | 122 | 21.2% |
| 4+ Person Household | 91 | 15.8% |
| Total Housing Units | 576 | 100.0% |
Occupancy by Ownership by Household Size in Joanna
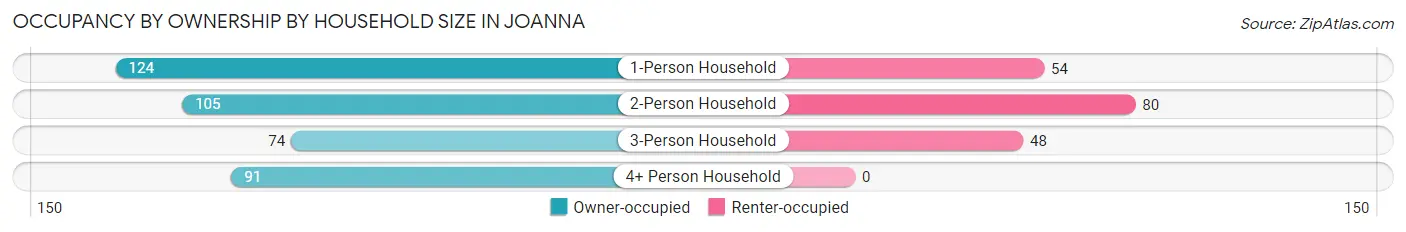
| Household Size | Owner-occupied | Renter-occupied |
| 1-Person Household | 124 (69.7%) | 54 (30.3%) |
| 2-Person Household | 105 (56.8%) | 80 (43.2%) |
| 3-Person Household | 74 (60.7%) | 48 (39.3%) |
| 4+ Person Household | 91 (100.0%) | 0 (0.0%) |
| Total Housing Units | 394 (68.4%) | 182 (31.6%) |
Occupancy by Educational Attainment in Joanna
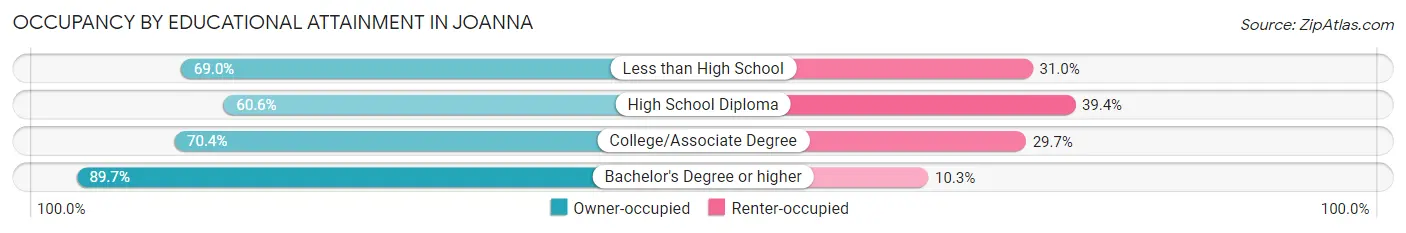
| Household Size | Owner-occupied | Renter-occupied |
| Less than High School | 69 (69.0%) | 31 (31.0%) |
| High School Diploma | 143 (60.6%) | 93 (39.4%) |
| College/Associate Degree | 121 (70.4%) | 51 (29.6%) |
| Bachelor's Degree or higher | 61 (89.7%) | 7 (10.3%) |
Occupancy by Age of Householder in Joanna
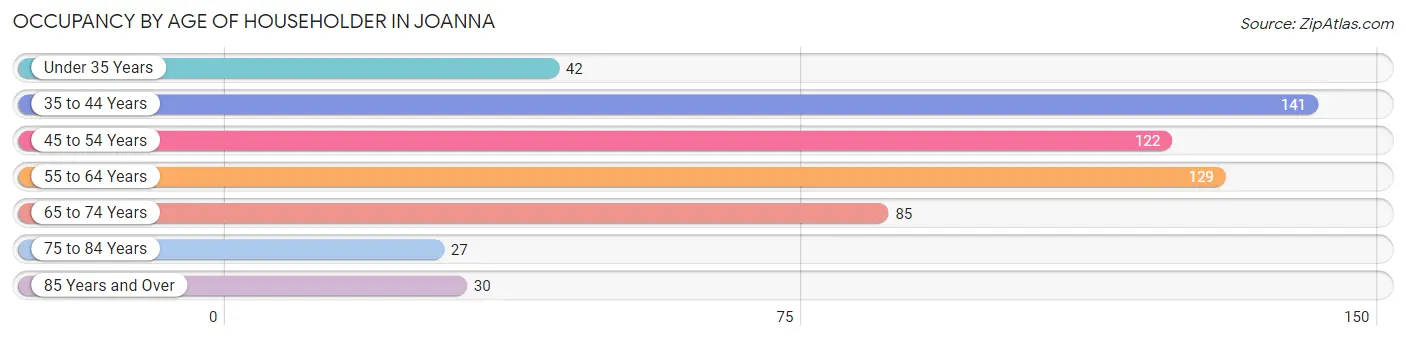
| Age Bracket | # Households | % Households |
| Under 35 Years | 42 | 7.3% |
| 35 to 44 Years | 141 | 24.5% |
| 45 to 54 Years | 122 | 21.2% |
| 55 to 64 Years | 129 | 22.4% |
| 65 to 74 Years | 85 | 14.8% |
| 75 to 84 Years | 27 | 4.7% |
| 85 Years and Over | 30 | 5.2% |
| Total | 576 | 100.0% |
Housing Finances in Joanna
Median Income by Occupancy in Joanna
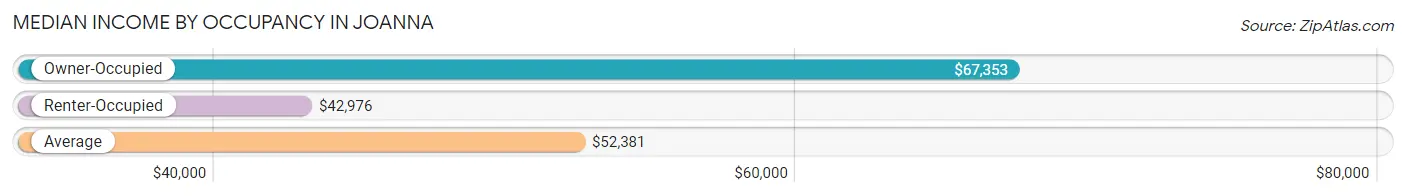
| Occupancy Type | # Households | Median Income |
| Owner-Occupied | 394 (68.4%) | $67,353 |
| Renter-Occupied | 182 (31.6%) | $42,976 |
| Average | 576 (100.0%) | $52,381 |
Occupancy by Householder Income Bracket in Joanna
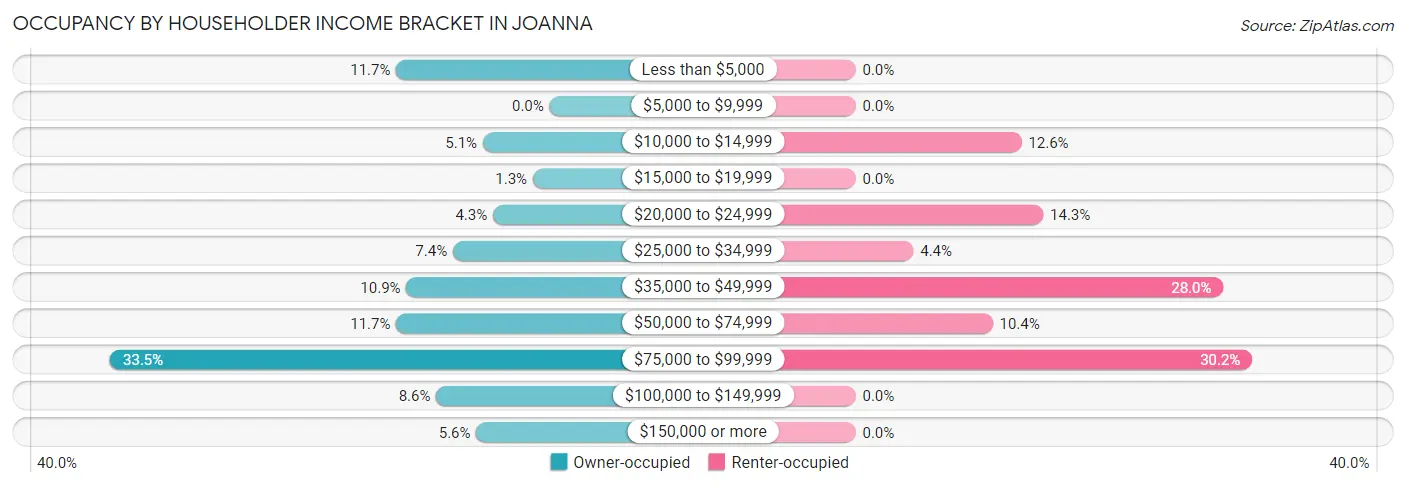
| Income Bracket | Owner-occupied | Renter-occupied |
| Less than $5,000 | 46 (11.7%) | 0 (0.0%) |
| $5,000 to $9,999 | 0 (0.0%) | 0 (0.0%) |
| $10,000 to $14,999 | 20 (5.1%) | 23 (12.6%) |
| $15,000 to $19,999 | 5 (1.3%) | 0 (0.0%) |
| $20,000 to $24,999 | 17 (4.3%) | 26 (14.3%) |
| $25,000 to $34,999 | 29 (7.4%) | 8 (4.4%) |
| $35,000 to $49,999 | 43 (10.9%) | 51 (28.0%) |
| $50,000 to $74,999 | 46 (11.7%) | 19 (10.4%) |
| $75,000 to $99,999 | 132 (33.5%) | 55 (30.2%) |
| $100,000 to $149,999 | 34 (8.6%) | 0 (0.0%) |
| $150,000 or more | 22 (5.6%) | 0 (0.0%) |
| Total | 394 (100.0%) | 182 (100.0%) |
Monthly Housing Cost Tiers in Joanna
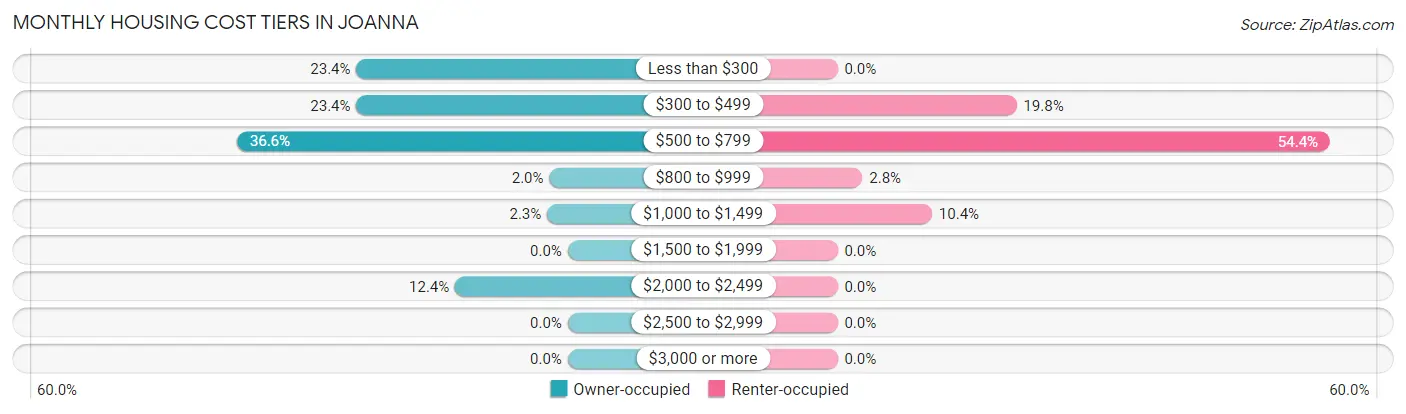
| Monthly Cost | Owner-occupied | Renter-occupied |
| Less than $300 | 92 (23.4%) | 0 (0.0%) |
| $300 to $499 | 92 (23.4%) | 36 (19.8%) |
| $500 to $799 | 144 (36.5%) | 99 (54.4%) |
| $800 to $999 | 8 (2.0%) | 5 (2.8%) |
| $1,000 to $1,499 | 9 (2.3%) | 19 (10.4%) |
| $1,500 to $1,999 | 0 (0.0%) | 0 (0.0%) |
| $2,000 to $2,499 | 49 (12.4%) | 0 (0.0%) |
| $2,500 to $2,999 | 0 (0.0%) | 0 (0.0%) |
| $3,000 or more | 0 (0.0%) | 0 (0.0%) |
| Total | 394 (100.0%) | 182 (100.0%) |
Physical Housing Characteristics in Joanna
Housing Structures in Joanna
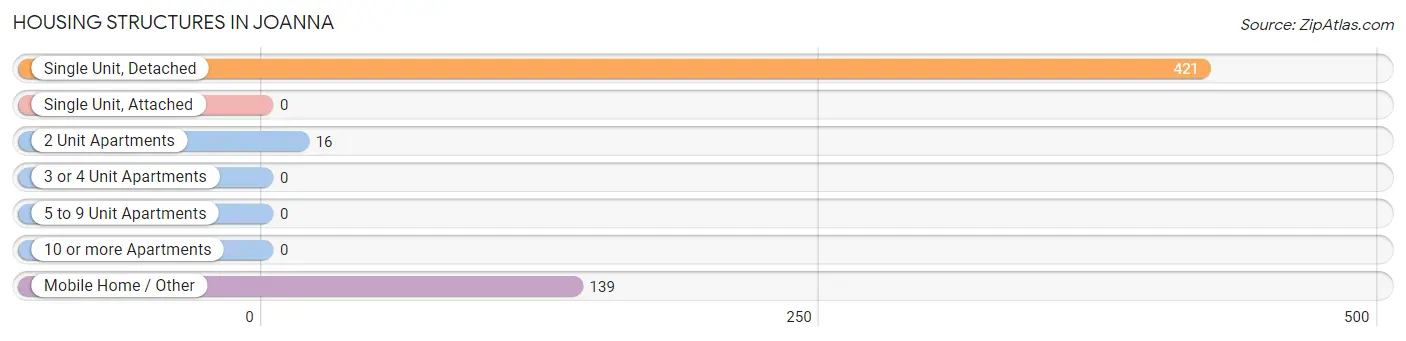
| Structure Type | # Housing Units | % Housing Units |
| Single Unit, Detached | 421 | 73.1% |
| Single Unit, Attached | 0 | 0.0% |
| 2 Unit Apartments | 16 | 2.8% |
| 3 or 4 Unit Apartments | 0 | 0.0% |
| 5 to 9 Unit Apartments | 0 | 0.0% |
| 10 or more Apartments | 0 | 0.0% |
| Mobile Home / Other | 139 | 24.1% |
| Total | 576 | 100.0% |
Housing Structures by Occupancy in Joanna
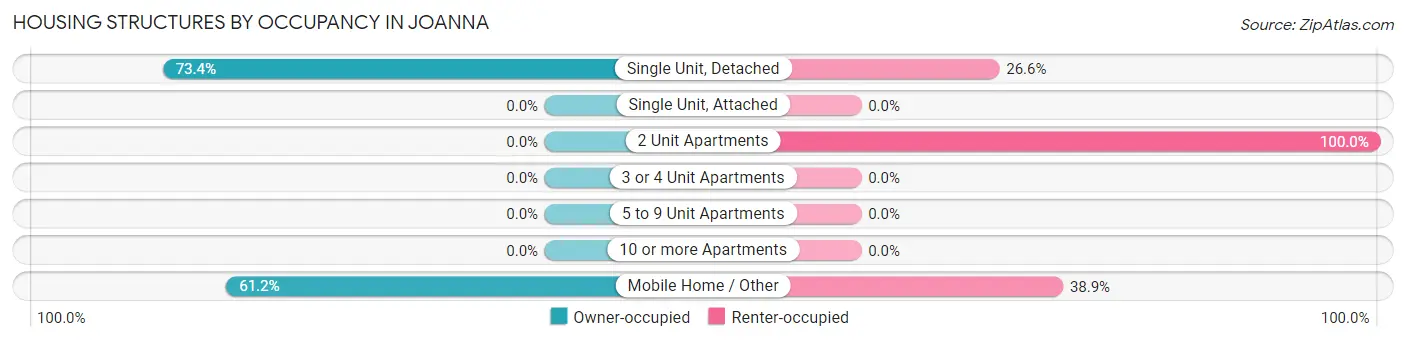
| Structure Type | Owner-occupied | Renter-occupied |
| Single Unit, Detached | 309 (73.4%) | 112 (26.6%) |
| Single Unit, Attached | 0 (0.0%) | 0 (0.0%) |
| 2 Unit Apartments | 0 (0.0%) | 16 (100.0%) |
| 3 or 4 Unit Apartments | 0 (0.0%) | 0 (0.0%) |
| 5 to 9 Unit Apartments | 0 (0.0%) | 0 (0.0%) |
| 10 or more Apartments | 0 (0.0%) | 0 (0.0%) |
| Mobile Home / Other | 85 (61.2%) | 54 (38.9%) |
| Total | 394 (68.4%) | 182 (31.6%) |
Housing Structures by Number of Rooms in Joanna
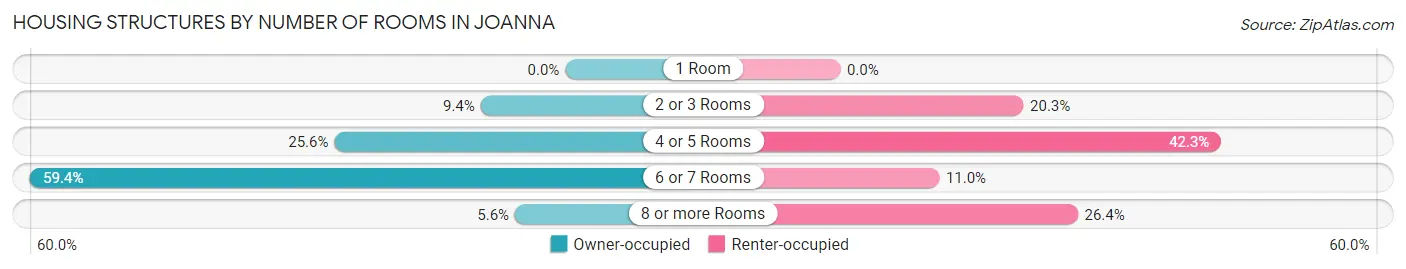
| Number of Rooms | Owner-occupied | Renter-occupied |
| 1 Room | 0 (0.0%) | 0 (0.0%) |
| 2 or 3 Rooms | 37 (9.4%) | 37 (20.3%) |
| 4 or 5 Rooms | 101 (25.6%) | 77 (42.3%) |
| 6 or 7 Rooms | 234 (59.4%) | 20 (11.0%) |
| 8 or more Rooms | 22 (5.6%) | 48 (26.4%) |
| Total | 394 (100.0%) | 182 (100.0%) |
Housing Structure by Heating Type in Joanna
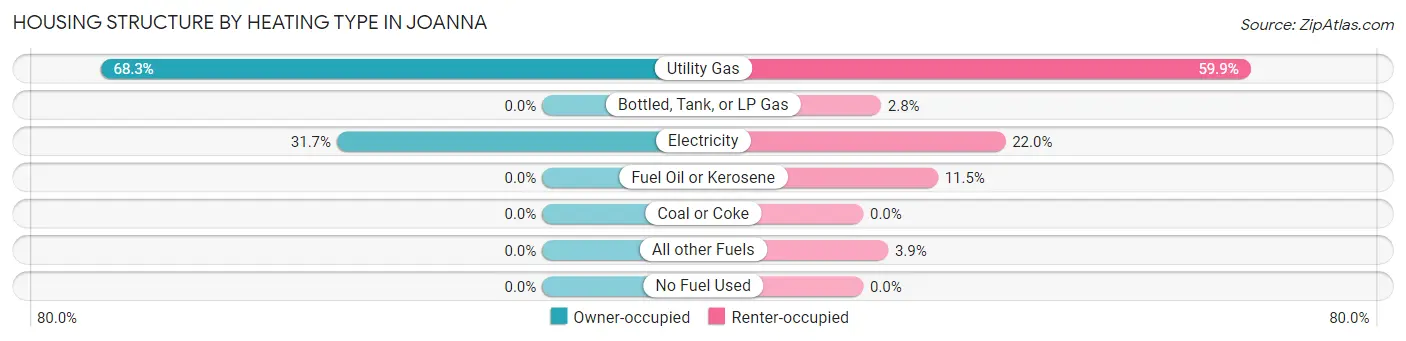
| Heating Type | Owner-occupied | Renter-occupied |
| Utility Gas | 269 (68.3%) | 109 (59.9%) |
| Bottled, Tank, or LP Gas | 0 (0.0%) | 5 (2.8%) |
| Electricity | 125 (31.7%) | 40 (22.0%) |
| Fuel Oil or Kerosene | 0 (0.0%) | 21 (11.5%) |
| Coal or Coke | 0 (0.0%) | 0 (0.0%) |
| All other Fuels | 0 (0.0%) | 7 (3.8%) |
| No Fuel Used | 0 (0.0%) | 0 (0.0%) |
| Total | 394 (100.0%) | 182 (100.0%) |
Household Vehicle Usage in Joanna
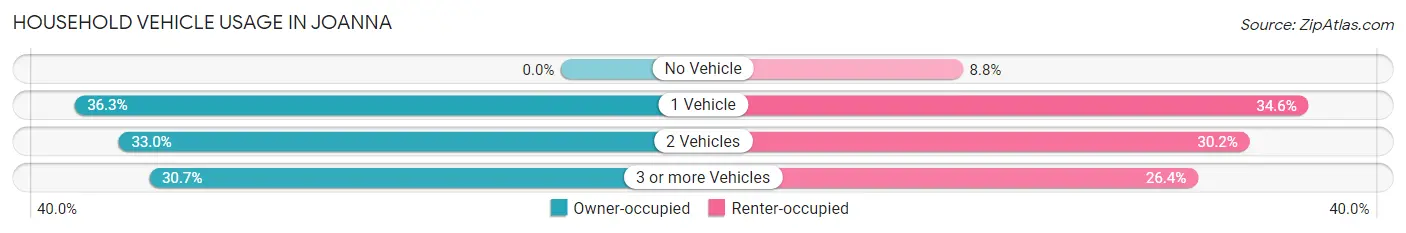
| Vehicles per Household | Owner-occupied | Renter-occupied |
| No Vehicle | 0 (0.0%) | 16 (8.8%) |
| 1 Vehicle | 143 (36.3%) | 63 (34.6%) |
| 2 Vehicles | 130 (33.0%) | 55 (30.2%) |
| 3 or more Vehicles | 121 (30.7%) | 48 (26.4%) |
| Total | 394 (100.0%) | 182 (100.0%) |
Real Estate & Mortgages in Joanna
Real Estate and Mortgage Overview in Joanna
| Characteristic | Without Mortgage | With Mortgage |
| Housing Units | 281 | 113 |
| Median Property Value | - | - |
| Median Household Income | - | - |
| Monthly Housing Costs | $404 | $0 |
| Real Estate Taxes | - | - |
Property Value by Mortgage Status in Joanna
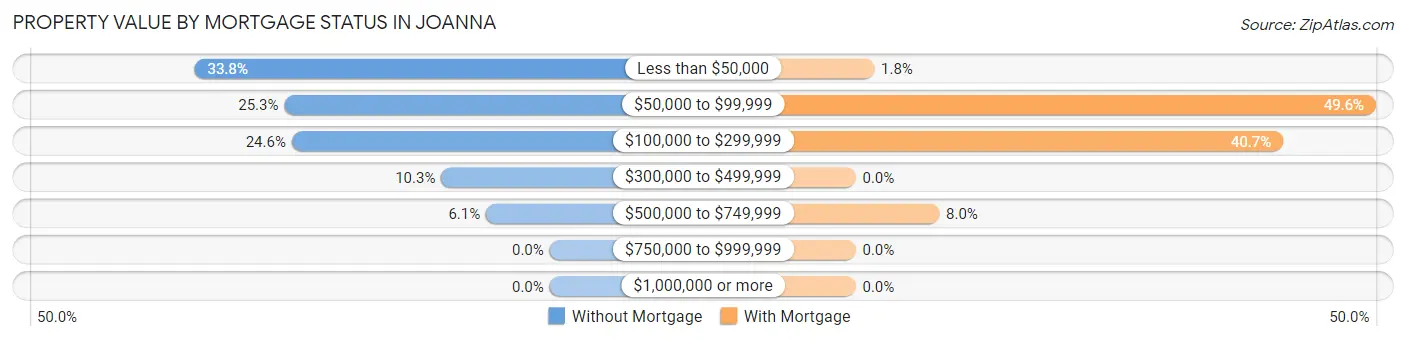
| Property Value | Without Mortgage | With Mortgage |
| Less than $50,000 | 95 (33.8%) | 2 (1.8%) |
| $50,000 to $99,999 | 71 (25.3%) | 56 (49.6%) |
| $100,000 to $299,999 | 69 (24.6%) | 46 (40.7%) |
| $300,000 to $499,999 | 29 (10.3%) | 0 (0.0%) |
| $500,000 to $749,999 | 17 (6.0%) | 9 (8.0%) |
| $750,000 to $999,999 | 0 (0.0%) | 0 (0.0%) |
| $1,000,000 or more | 0 (0.0%) | 0 (0.0%) |
| Total | 281 (100.0%) | 113 (100.0%) |
Household Income by Mortgage Status in Joanna
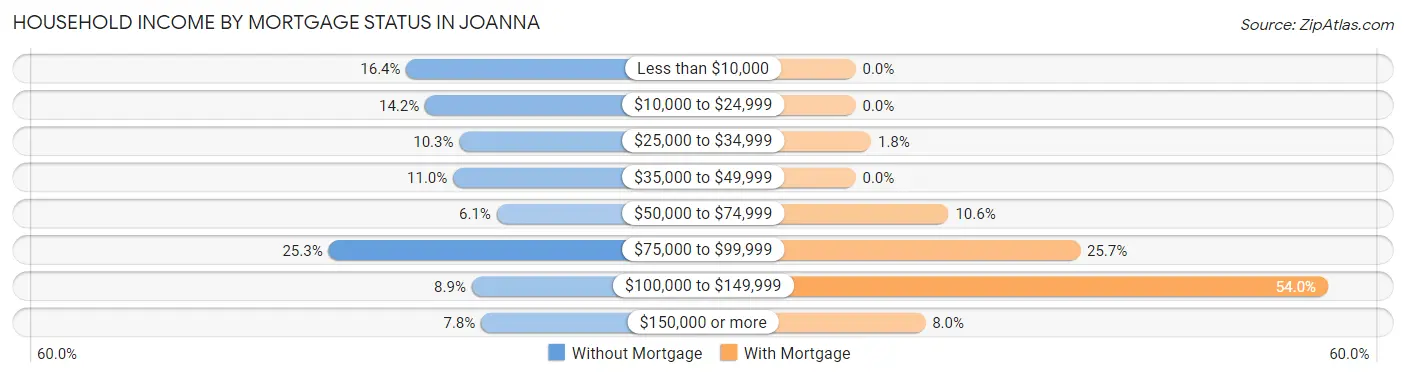
| Household Income | Without Mortgage | With Mortgage |
| Less than $10,000 | 46 (16.4%) | 0 (0.0%) |
| $10,000 to $24,999 | 40 (14.2%) | 0 (0.0%) |
| $25,000 to $34,999 | 29 (10.3%) | 2 (1.8%) |
| $35,000 to $49,999 | 31 (11.0%) | 0 (0.0%) |
| $50,000 to $74,999 | 17 (6.0%) | 12 (10.6%) |
| $75,000 to $99,999 | 71 (25.3%) | 29 (25.7%) |
| $100,000 to $149,999 | 25 (8.9%) | 61 (54.0%) |
| $150,000 or more | 22 (7.8%) | 9 (8.0%) |
| Total | 281 (100.0%) | 113 (100.0%) |
Property Value to Household Income Ratio in Joanna
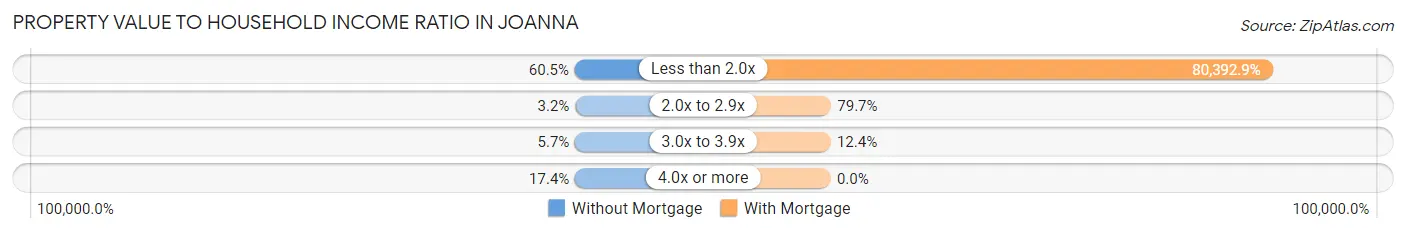
| Value-to-Income Ratio | Without Mortgage | With Mortgage |
| Less than 2.0x | 170 (60.5%) | 90,844 (80,392.9%) |
| 2.0x to 2.9x | 9 (3.2%) | 90 (79.6%) |
| 3.0x to 3.9x | 16 (5.7%) | 14 (12.4%) |
| 4.0x or more | 49 (17.4%) | 0 (0.0%) |
| Total | 281 (100.0%) | 113 (100.0%) |
Real Estate Taxes by Mortgage Status in Joanna
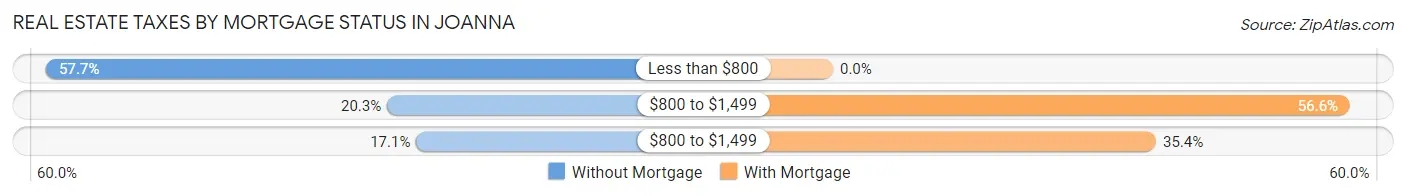
| Property Taxes | Without Mortgage | With Mortgage |
| Less than $800 | 162 (57.7%) | 0 (0.0%) |
| $800 to $1,499 | 57 (20.3%) | 64 (56.6%) |
| $800 to $1,499 | 48 (17.1%) | 40 (35.4%) |
| Total | 281 (100.0%) | 113 (100.0%) |
Health & Disability in Joanna
Health Insurance Coverage by Age in Joanna
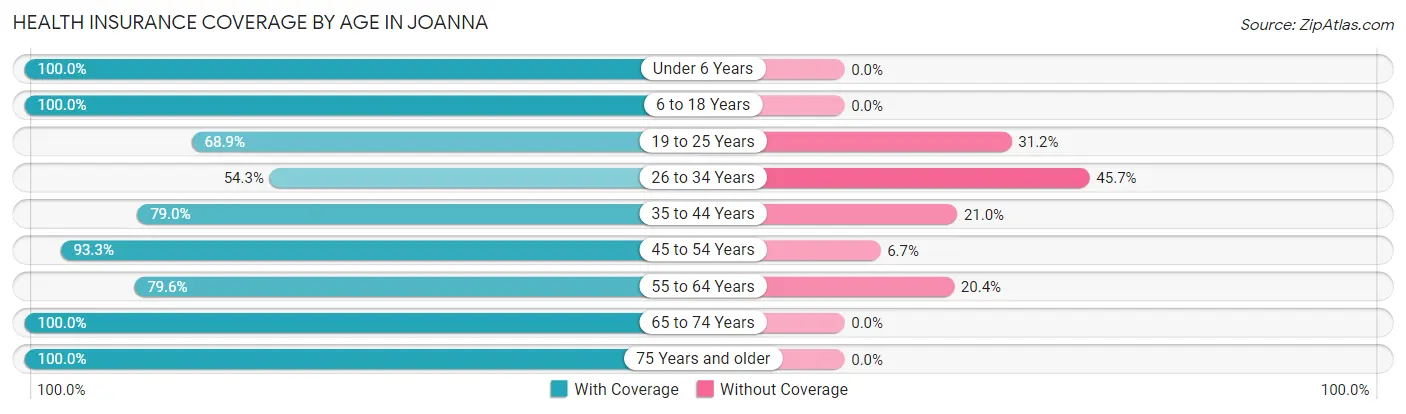
| Age Bracket | With Coverage | Without Coverage |
| Under 6 Years | 105 (100.0%) | 0 (0.0%) |
| 6 to 18 Years | 126 (100.0%) | 0 (0.0%) |
| 19 to 25 Years | 126 (68.9%) | 57 (31.1%) |
| 26 to 34 Years | 38 (54.3%) | 32 (45.7%) |
| 35 to 44 Years | 203 (79.0%) | 54 (21.0%) |
| 45 to 54 Years | 209 (93.3%) | 15 (6.7%) |
| 55 to 64 Years | 144 (79.6%) | 37 (20.4%) |
| 65 to 74 Years | 156 (100.0%) | 0 (0.0%) |
| 75 Years and older | 104 (100.0%) | 0 (0.0%) |
| Total | 1,211 (86.1%) | 195 (13.9%) |
Health Insurance Coverage by Citizenship Status in Joanna
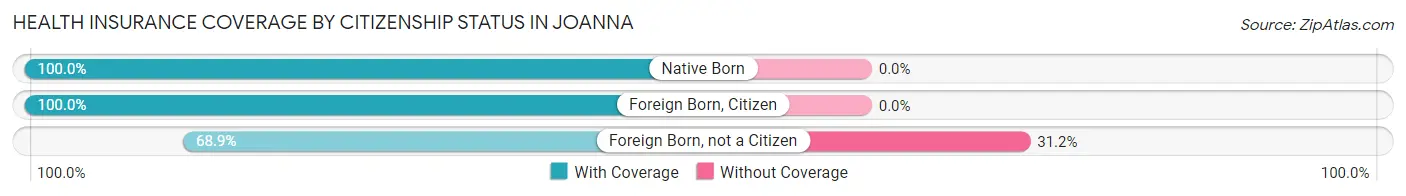
| Citizenship Status | With Coverage | Without Coverage |
| Native Born | 105 (100.0%) | 0 (0.0%) |
| Foreign Born, Citizen | 126 (100.0%) | 0 (0.0%) |
| Foreign Born, not a Citizen | 126 (68.9%) | 57 (31.1%) |
Health Insurance Coverage by Household Income in Joanna
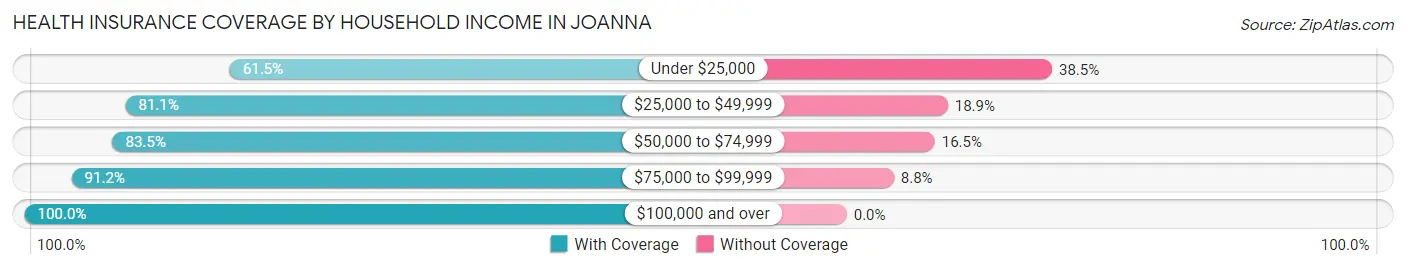
| Household Income | With Coverage | Without Coverage |
| Under $25,000 | 120 (61.5%) | 75 (38.5%) |
| $25,000 to $49,999 | 150 (81.1%) | 35 (18.9%) |
| $50,000 to $74,999 | 162 (83.5%) | 32 (16.5%) |
| $75,000 to $99,999 | 548 (91.2%) | 53 (8.8%) |
| $100,000 and over | 227 (100.0%) | 0 (0.0%) |
Public vs Private Health Insurance Coverage by Age in Joanna
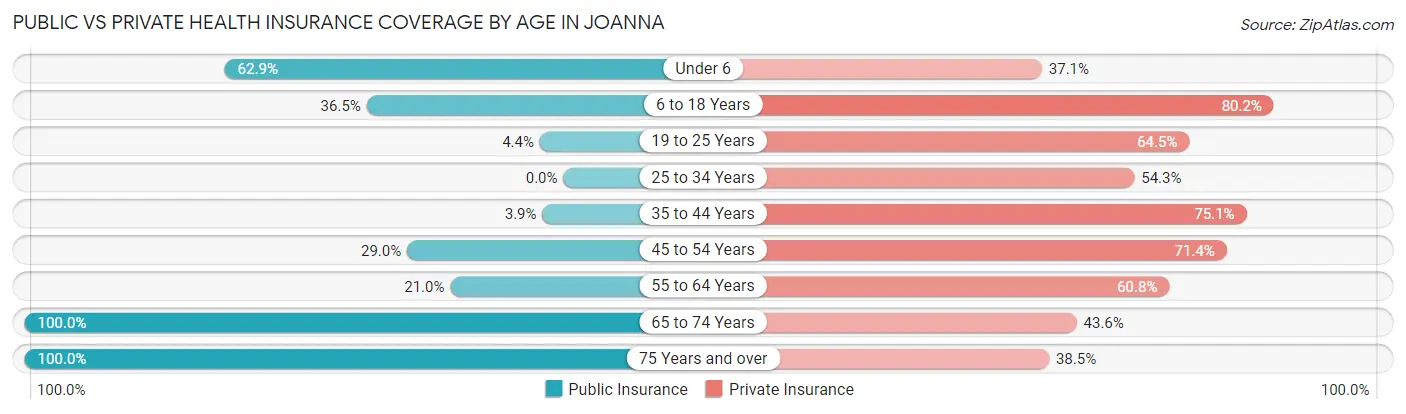
| Age Bracket | Public Insurance | Private Insurance |
| Under 6 | 66 (62.9%) | 39 (37.1%) |
| 6 to 18 Years | 46 (36.5%) | 101 (80.2%) |
| 19 to 25 Years | 8 (4.4%) | 118 (64.5%) |
| 25 to 34 Years | 0 (0.0%) | 38 (54.3%) |
| 35 to 44 Years | 10 (3.9%) | 193 (75.1%) |
| 45 to 54 Years | 65 (29.0%) | 160 (71.4%) |
| 55 to 64 Years | 38 (21.0%) | 110 (60.8%) |
| 65 to 74 Years | 156 (100.0%) | 68 (43.6%) |
| 75 Years and over | 104 (100.0%) | 40 (38.5%) |
| Total | 493 (35.1%) | 867 (61.7%) |
Disability Status by Sex by Age in Joanna
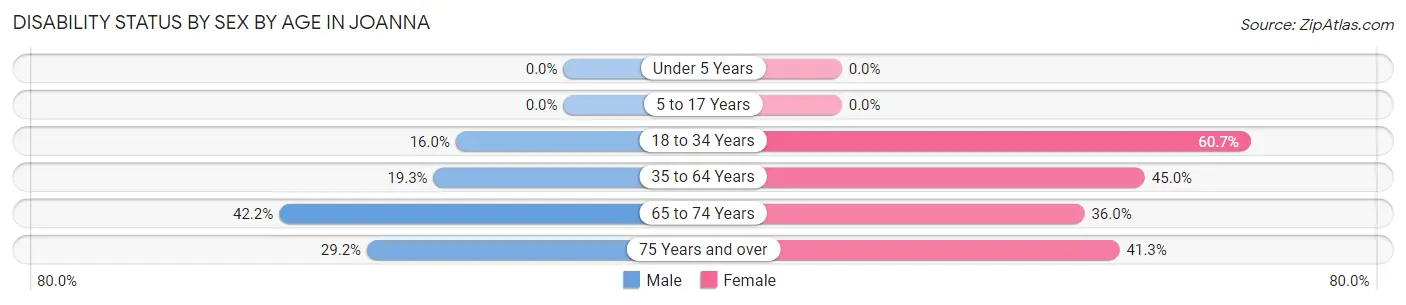
| Age Bracket | Male | Female |
| Under 5 Years | 0 (0.0%) | 0 (0.0%) |
| 5 to 17 Years | 0 (0.0%) | 0 (0.0%) |
| 18 to 34 Years | 27 (16.0%) | 51 (60.7%) |
| 35 to 64 Years | 60 (19.3%) | 158 (45.0%) |
| 65 to 74 Years | 19 (42.2%) | 40 (36.0%) |
| 75 Years and over | 7 (29.2%) | 33 (41.2%) |
Disability Class by Sex by Age in Joanna
Disability Class: Hearing Difficulty
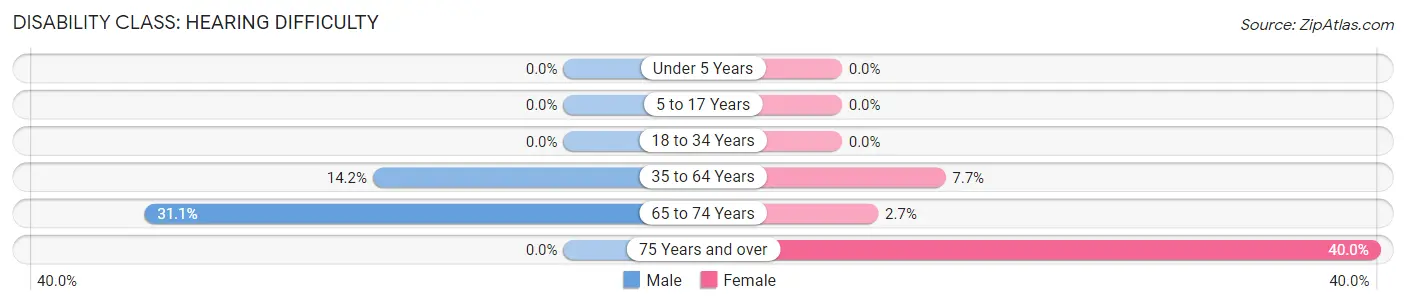
| Age Bracket | Male | Female |
| Under 5 Years | 0 (0.0%) | 0 (0.0%) |
| 5 to 17 Years | 0 (0.0%) | 0 (0.0%) |
| 18 to 34 Years | 0 (0.0%) | 0 (0.0%) |
| 35 to 64 Years | 44 (14.1%) | 27 (7.7%) |
| 65 to 74 Years | 14 (31.1%) | 3 (2.7%) |
| 75 Years and over | 0 (0.0%) | 32 (40.0%) |
Disability Class: Vision Difficulty
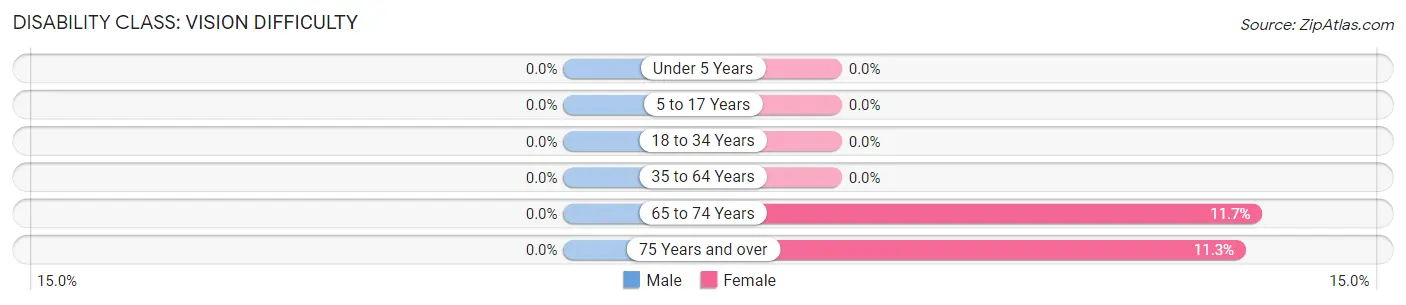
| Age Bracket | Male | Female |
| Under 5 Years | 0 (0.0%) | 0 (0.0%) |
| 5 to 17 Years | 0 (0.0%) | 0 (0.0%) |
| 18 to 34 Years | 0 (0.0%) | 0 (0.0%) |
| 35 to 64 Years | 0 (0.0%) | 0 (0.0%) |
| 65 to 74 Years | 0 (0.0%) | 13 (11.7%) |
| 75 Years and over | 0 (0.0%) | 9 (11.3%) |
Disability Class: Cognitive Difficulty
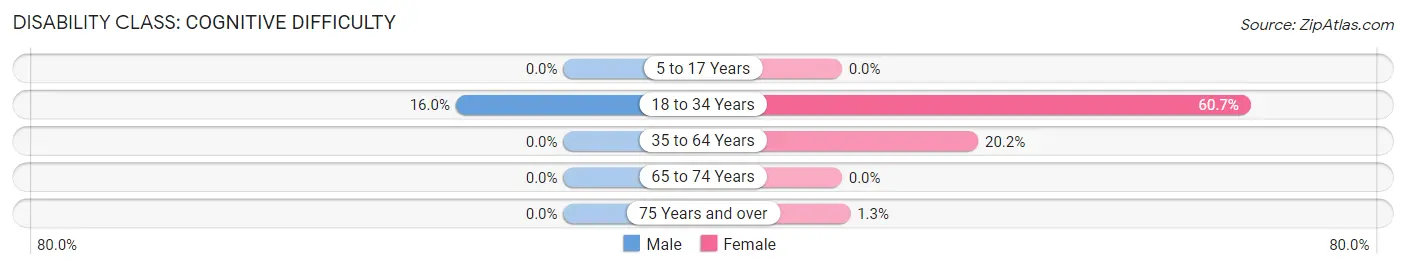
| Age Bracket | Male | Female |
| 5 to 17 Years | 0 (0.0%) | 0 (0.0%) |
| 18 to 34 Years | 27 (16.0%) | 51 (60.7%) |
| 35 to 64 Years | 0 (0.0%) | 71 (20.2%) |
| 65 to 74 Years | 0 (0.0%) | 0 (0.0%) |
| 75 Years and over | 0 (0.0%) | 1 (1.3%) |
Disability Class: Ambulatory Difficulty
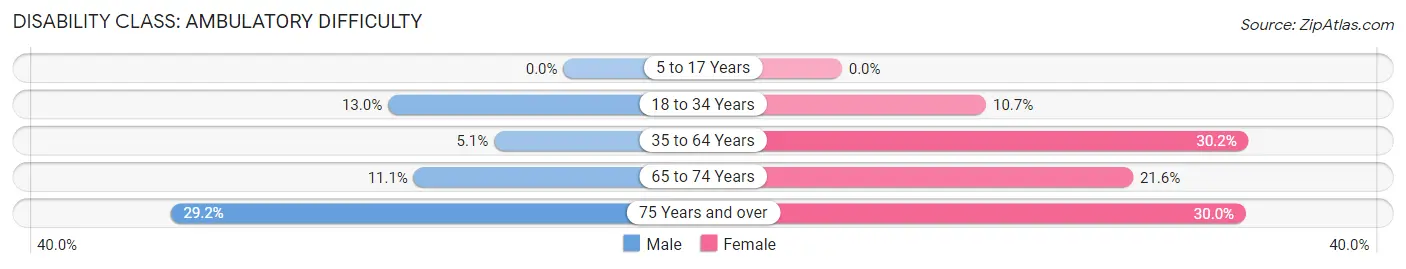
| Age Bracket | Male | Female |
| 5 to 17 Years | 0 (0.0%) | 0 (0.0%) |
| 18 to 34 Years | 22 (13.0%) | 9 (10.7%) |
| 35 to 64 Years | 16 (5.1%) | 106 (30.2%) |
| 65 to 74 Years | 5 (11.1%) | 24 (21.6%) |
| 75 Years and over | 7 (29.2%) | 24 (30.0%) |
Disability Class: Self-Care Difficulty
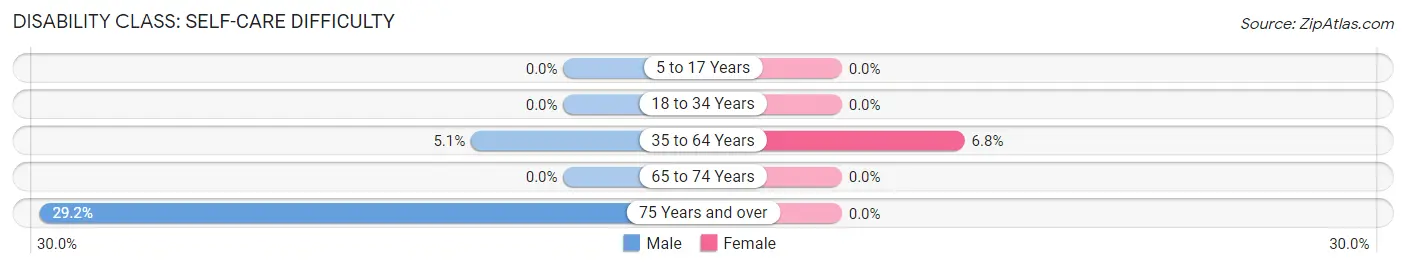
| Age Bracket | Male | Female |
| 5 to 17 Years | 0 (0.0%) | 0 (0.0%) |
| 18 to 34 Years | 0 (0.0%) | 0 (0.0%) |
| 35 to 64 Years | 16 (5.1%) | 24 (6.8%) |
| 65 to 74 Years | 0 (0.0%) | 0 (0.0%) |
| 75 Years and over | 7 (29.2%) | 0 (0.0%) |
Technology Access in Joanna
Computing Device Access in Joanna
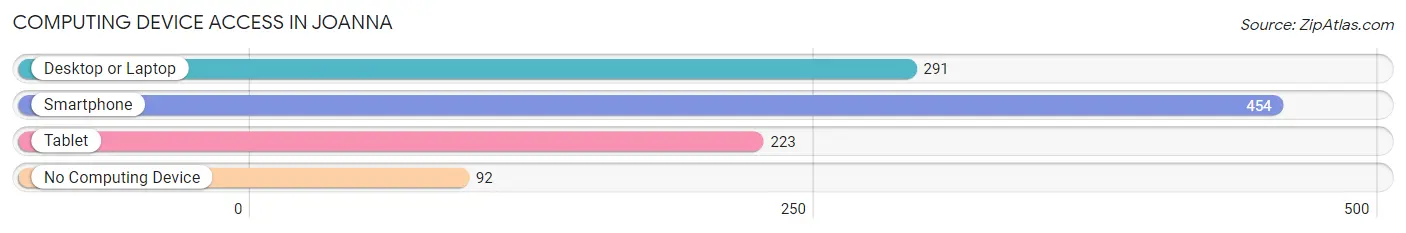
| Device Type | # Households | % Households |
| Desktop or Laptop | 291 | 50.5% |
| Smartphone | 454 | 78.8% |
| Tablet | 223 | 38.7% |
| No Computing Device | 92 | 16.0% |
| Total | 576 | 100.0% |
Internet Access in Joanna
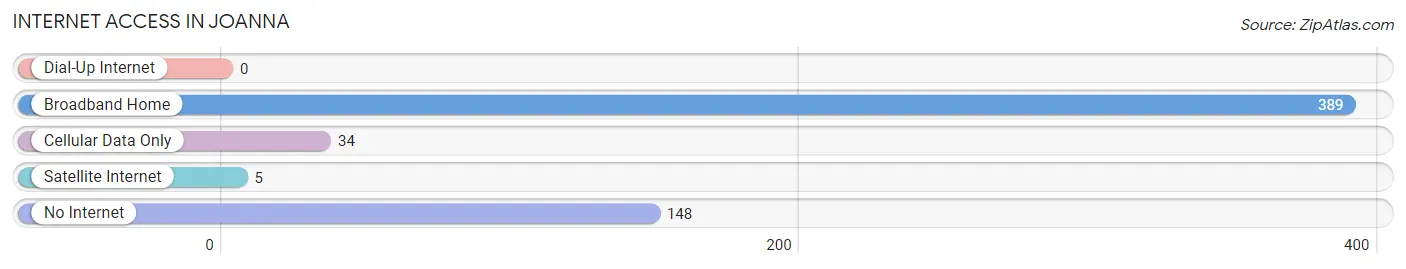
| Internet Type | # Households | % Households |
| Dial-Up Internet | 0 | 0.0% |
| Broadband Home | 389 | 67.5% |
| Cellular Data Only | 34 | 5.9% |
| Satellite Internet | 5 | 0.9% |
| No Internet | 148 | 25.7% |
| Total | 576 | 100.0% |
Joanna Summary
South Carolina is a state located in the southeastern United States. It is bordered by North Carolina to the north, Georgia to the south and west, and the Atlantic Ocean to the east. South Carolina is the 40th most populous state in the United States, with a population of 5.1 million as of 2020.
History
South Carolina was one of the original 13 colonies that formed the United States. It was the eighth state to ratify the U.S. Constitution on May 23, 1788. The state was named after King Charles I of England, who was also known as Charles II of Scotland.
The first permanent European settlement in South Carolina was established in 1670 by English settlers from Barbados. The colony was initially known as Charles Town, and was later renamed Charleston. The colony grew rapidly, and by 1708, it was the fourth largest city in the American colonies.
During the American Revolution, South Carolina was a major battleground. The British captured Charleston in 1780, but the city was recaptured by the Americans in 1782. After the war, South Carolina became a state in 1788.
Geography
South Carolina is located in the southeastern United States, and is bordered by North Carolina to the north, Georgia to the south and west, and the Atlantic Ocean to the east. The state has a total area of 32,020 square miles, making it the 40th largest state in the country.
The state is divided into three distinct geographic regions: the Coastal Plain, the Piedmont, and the Blue Ridge Mountains. The Coastal Plain is a flat, low-lying region that stretches along the Atlantic coast. The Piedmont is a hilly region located in the center of the state. The Blue Ridge Mountains are located in the western part of the state, and are the highest mountains in South Carolina.
Economy
South Carolina has a diverse economy that is driven by agriculture, manufacturing, and tourism. The state’s agricultural sector is the largest in the country, and is responsible for producing a variety of crops, including cotton, soybeans, corn, and tobacco.
Manufacturing is also an important part of the state’s economy. South Carolina is home to a number of major manufacturing companies, including Boeing, Michelin, and BMW. The state is also a major producer of textiles, chemicals, and paper products.
Tourism is also a major contributor to the state’s economy. South Carolina is home to a number of popular tourist destinations, including Myrtle Beach, Hilton Head Island, and Charleston.
Demographics
As of 2020, South Carolina has a population of 5.1 million. The state is racially diverse, with the largest racial group being white (68.5%), followed by African American (27.3%), Hispanic (2.7%), and Asian (1.5%).
The state’s largest cities are Columbia (population of 131,686), Charleston (population of 134,385), and North Charleston (population of 108,304). The state’s capital is Columbia.
South Carolina is also home to a number of Native American tribes, including the Catawba, Cherokee, and Lumbee. The state is also home to a large number of military bases, including Fort Jackson, Shaw Air Force Base, and Marine Corps Air Station Beaufort.
Common Questions
What is Per Capita Income in Joanna?
Per Capita income in Joanna is $29,379.
What is the Median Family Income in Joanna?
Median Family Income in Joanna is $82,600.
What is the Median Household income in Joanna?
Median Household Income in Joanna is $52,381.
What is Income or Wage Gap in Joanna?
Income or Wage Gap in Joanna is 31.2%.
Women in Joanna earn 68.8 cents for every dollar earned by a man.
What is Inequality or Gini Index in Joanna?
Inequality or Gini Index in Joanna is 0.47.
What is the Total Population of Joanna?
Total Population of Joanna is 1,406.
What is the Total Male Population of Joanna?
Total Male Population of Joanna is 704.
What is the Total Female Population of Joanna?
Total Female Population of Joanna is 702.
What is the Ratio of Males per 100 Females in Joanna?
There are 100.28 Males per 100 Females in Joanna.
What is the Ratio of Females per 100 Males in Joanna?
There are 99.72 Females per 100 Males in Joanna.
What is the Median Population Age in Joanna?
Median Population Age in Joanna is 42.4 Years.
What is the Average Family Size in Joanna
Average Family Size in Joanna is 2.9 People.
What is the Average Household Size in Joanna
Average Household Size in Joanna is 2.4 People.
How Large is the Labor Force in Joanna?
There are 627 People in the Labor Forcein in Joanna.
What is the Percentage of People in the Labor Force in Joanna?
52.9% of People are in the Labor Force in Joanna.