Langley, SC Map & Demographics
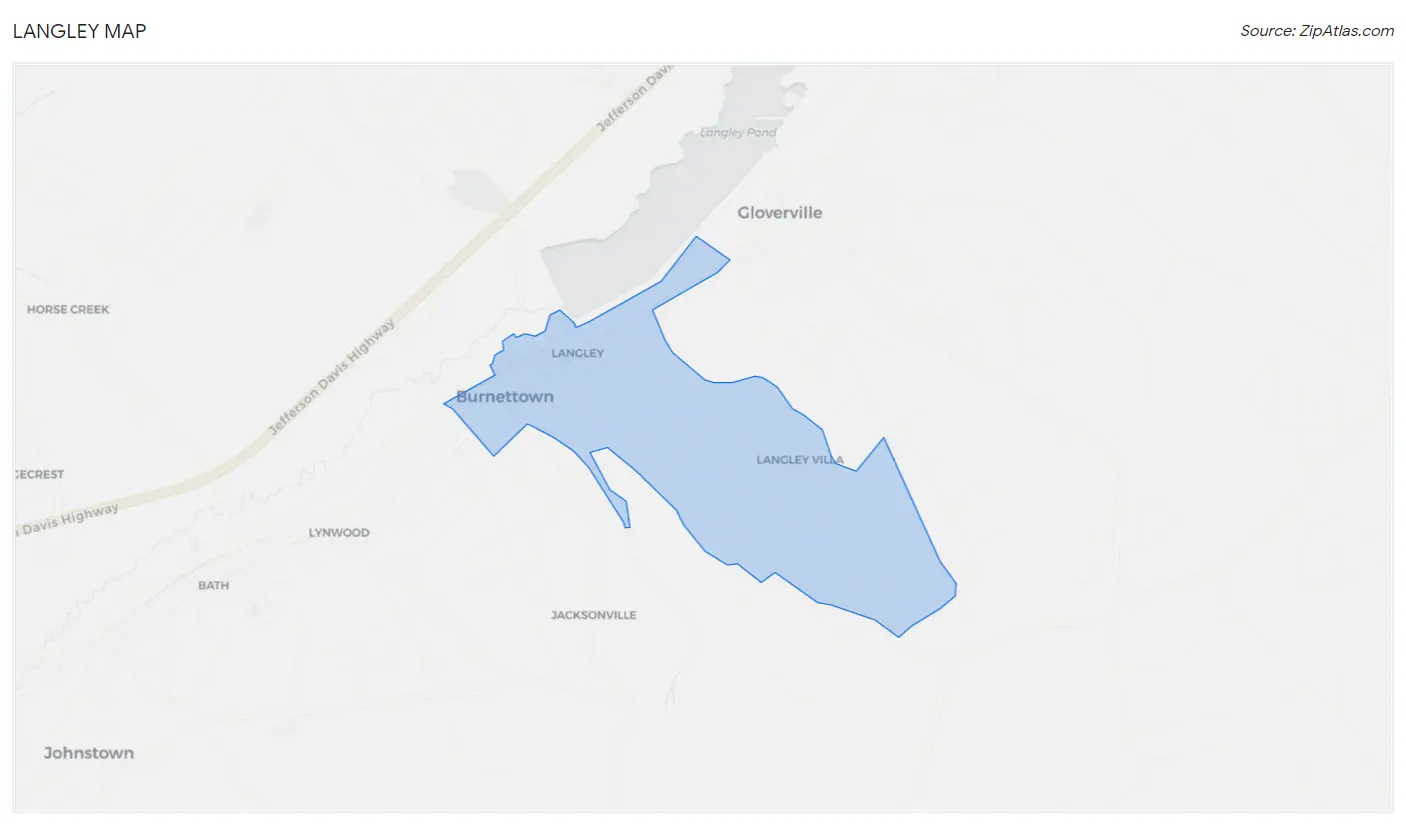
Langley Map
Langley Overview
$15,223
PER CAPITA INCOME
$46,667
AVG FAMILY INCOME
$47,848
AVG HOUSEHOLD INCOME
53.4%
WAGE / INCOME GAP [ % ]
46.6¢/ $1
WAGE / INCOME GAP [ $ ]
$12,374
FAMILY INCOME DEFICIT
0.35
INEQUALITY / GINI INDEX
1,776
TOTAL POPULATION
903
MALE POPULATION
873
FEMALE POPULATION
103.44
MALES / 100 FEMALES
96.68
FEMALES / 100 MALES
29.7
MEDIAN AGE
3.5
AVG FAMILY SIZE
3.2
AVG HOUSEHOLD SIZE
765
LABOR FORCE [ PEOPLE ]
61.7%
PERCENT IN LABOR FORCE
11.6%
UNEMPLOYMENT RATE
Langley Zip Codes
Langley Area Codes
Income in Langley
Income Overview in Langley
Per Capita Income in Langley is $15,223, while median incomes of families and households are $46,667 and $47,848 respectively.
| Characteristic | Number | Measure |
| Per Capita Income | 1,776 | $15,223 |
| Median Family Income | 390 | $46,667 |
| Mean Family Income | 390 | $42,292 |
| Median Household Income | 561 | $47,848 |
| Mean Household Income | 561 | $45,259 |
| Income Deficit | 390 | $12,374 |
| Wage / Income Gap (%) | 1,776 | 53.39% |
| Wage / Income Gap ($) | 1,776 | 46.61¢ per $1 |
| Gini / Inequality Index | 1,776 | 0.35 |
Earnings by Sex in Langley
Average Earnings in Langley are $16,947, $28,603 for men and $13,333 for women, a difference of 53.4%.
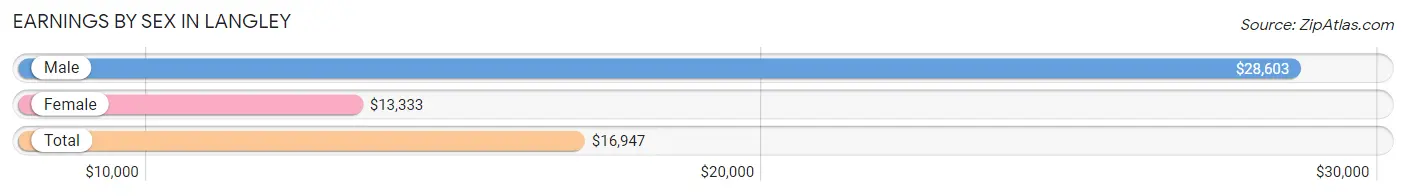
| Sex | Number | Average Earnings |
| Male | 420 (52.9%) | $28,603 |
| Female | 374 (47.1%) | $13,333 |
| Total | 794 (100.0%) | $16,947 |
Earnings by Sex by Income Bracket in Langley
The most common earnings brackets in Langley are $30,000 to $34,999 for men (72 | 17.1%) and $10,000 to $12,499 for women (122 | 32.6%).
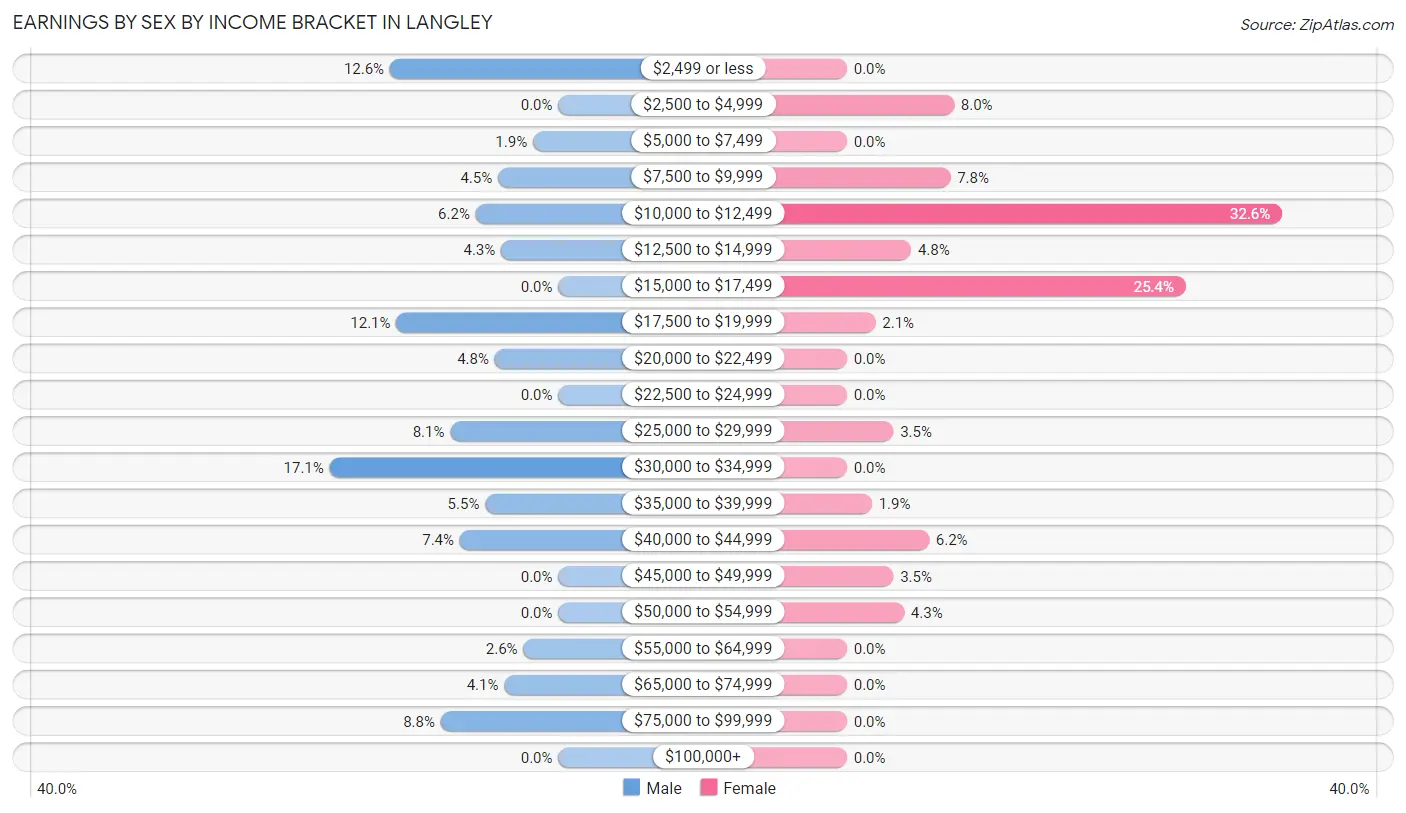
| Income | Male | Female |
| $2,499 or less | 53 (12.6%) | 0 (0.0%) |
| $2,500 to $4,999 | 0 (0.0%) | 30 (8.0%) |
| $5,000 to $7,499 | 8 (1.9%) | 0 (0.0%) |
| $7,500 to $9,999 | 19 (4.5%) | 29 (7.7%) |
| $10,000 to $12,499 | 26 (6.2%) | 122 (32.6%) |
| $12,500 to $14,999 | 18 (4.3%) | 18 (4.8%) |
| $15,000 to $17,499 | 0 (0.0%) | 95 (25.4%) |
| $17,500 to $19,999 | 51 (12.1%) | 8 (2.1%) |
| $20,000 to $22,499 | 20 (4.8%) | 0 (0.0%) |
| $22,500 to $24,999 | 0 (0.0%) | 0 (0.0%) |
| $25,000 to $29,999 | 34 (8.1%) | 13 (3.5%) |
| $30,000 to $34,999 | 72 (17.1%) | 0 (0.0%) |
| $35,000 to $39,999 | 23 (5.5%) | 7 (1.9%) |
| $40,000 to $44,999 | 31 (7.4%) | 23 (6.1%) |
| $45,000 to $49,999 | 0 (0.0%) | 13 (3.5%) |
| $50,000 to $54,999 | 0 (0.0%) | 16 (4.3%) |
| $55,000 to $64,999 | 11 (2.6%) | 0 (0.0%) |
| $65,000 to $74,999 | 17 (4.1%) | 0 (0.0%) |
| $75,000 to $99,999 | 37 (8.8%) | 0 (0.0%) |
| $100,000+ | 0 (0.0%) | 0 (0.0%) |
| Total | 420 (100.0%) | 374 (100.0%) |
Earnings by Sex by Educational Attainment in Langley
Average earnings in Langley are $30,503 for men and $15,474 for women, a difference of 49.3%. Men with an educational attainment of college or associate's degree enjoy the highest average annual earnings of $80,652, while those with less than high school education earn the least with $28,787. Women with an educational attainment of high school diploma earn the most with the average annual earnings of $15,390, while those with high school diploma education have the smallest earnings of $15,390.
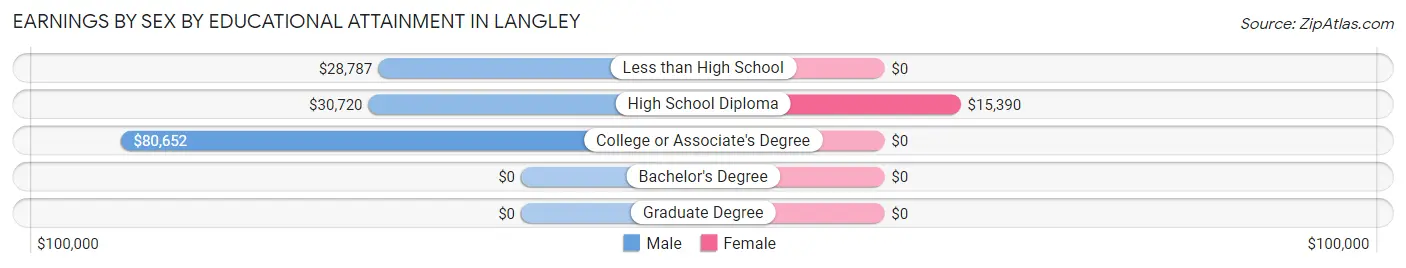
| Educational Attainment | Male Income | Female Income |
| Less than High School | $28,787 | $0 |
| High School Diploma | $30,720 | $15,390 |
| College or Associate's Degree | $80,652 | $0 |
| Bachelor's Degree | - | - |
| Graduate Degree | - | - |
| Total | $30,503 | $15,474 |
Family Income in Langley
Family Income Brackets in Langley
According to the Langley family income data, there are 158 families falling into the $35,000 to $49,999 income range, which is the most common income bracket and makes up 40.5% of all families.
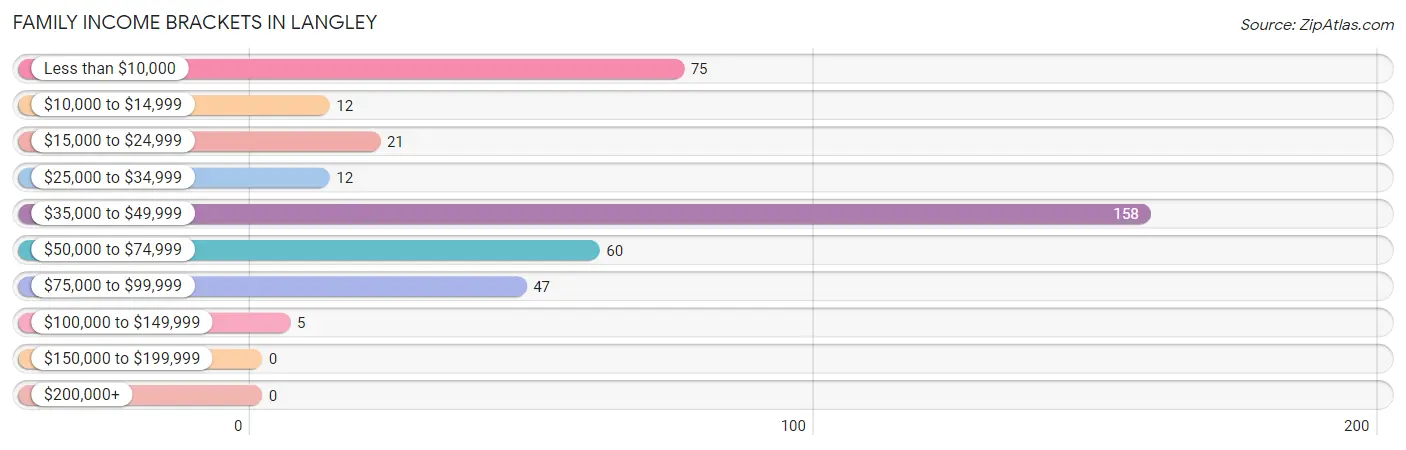
| Income Bracket | # Families | % Families |
| Less than $10,000 | 75 | 19.2% |
| $10,000 to $14,999 | 12 | 3.1% |
| $15,000 to $24,999 | 21 | 5.4% |
| $25,000 to $34,999 | 12 | 3.1% |
| $35,000 to $49,999 | 158 | 40.5% |
| $50,000 to $74,999 | 60 | 15.4% |
| $75,000 to $99,999 | 47 | 12.1% |
| $100,000 to $149,999 | 5 | 1.3% |
| $150,000 to $199,999 | 0 | 0.0% |
| $200,000+ | 0 | 0.0% |
Family Income by Famaliy Size in Langley
2-person families (118 | 30.3%) account for the highest median family income in Langley with $50,887 per family, while 2-person families (118 | 30.3%) have the highest median income of $25,444 per family member.
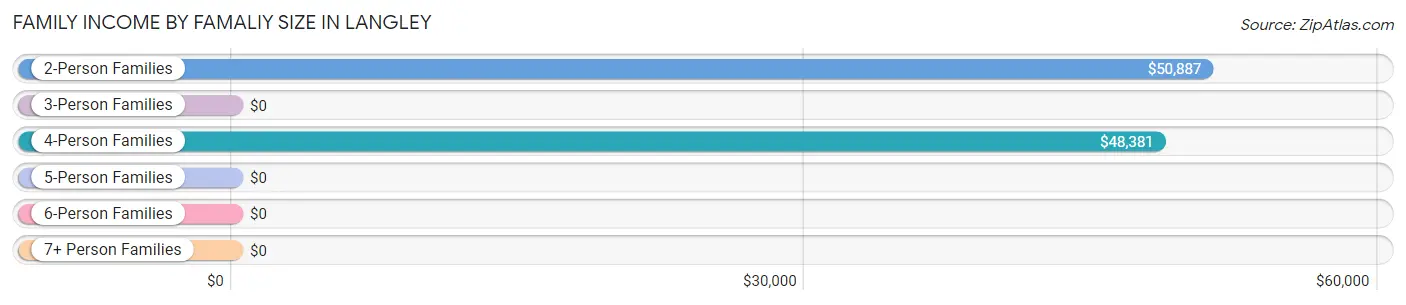
| Income Bracket | # Families | Median Income |
| 2-Person Families | 118 (30.3%) | $50,887 |
| 3-Person Families | 96 (24.6%) | $0 |
| 4-Person Families | 113 (29.0%) | $48,381 |
| 5-Person Families | 35 (9.0%) | $0 |
| 6-Person Families | 0 (0.0%) | $0 |
| 7+ Person Families | 28 (7.2%) | $0 |
| Total | 390 (100.0%) | $46,667 |
Family Income by Number of Earners in Langley
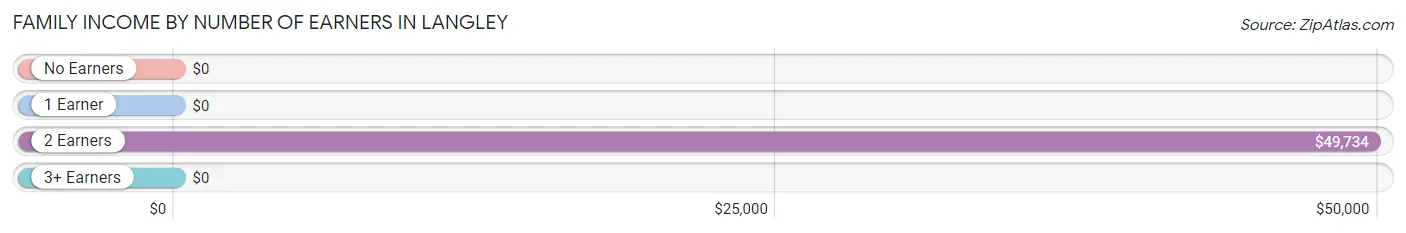
| Number of Earners | # Families | Median Income |
| No Earners | 95 (24.4%) | $0 |
| 1 Earner | 92 (23.6%) | $0 |
| 2 Earners | 195 (50.0%) | $49,734 |
| 3+ Earners | 8 (2.1%) | $0 |
| Total | 390 (100.0%) | $46,667 |
Household Income in Langley
Household Income Brackets in Langley
With 153 households falling in the category, the $50,000 to $74,999 income range is the most frequent in Langley, accounting for 27.3% of all households.
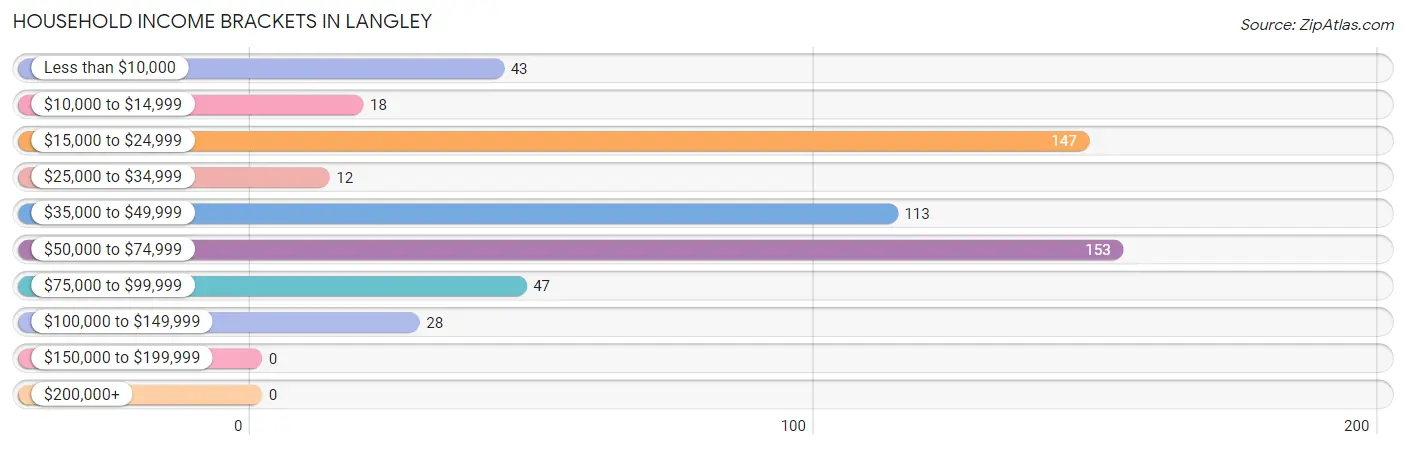
| Income Bracket | # Households | % Households |
| Less than $10,000 | 43 | 7.7% |
| $10,000 to $14,999 | 18 | 3.2% |
| $15,000 to $24,999 | 147 | 26.2% |
| $25,000 to $34,999 | 12 | 2.1% |
| $35,000 to $49,999 | 113 | 20.1% |
| $50,000 to $74,999 | 153 | 27.3% |
| $75,000 to $99,999 | 47 | 8.4% |
| $100,000 to $149,999 | 28 | 5.0% |
| $150,000 to $199,999 | 0 | 0.0% |
| $200,000+ | 0 | 0.0% |
Household Income by Householder Age in Langley
The median household income in Langley is $47,848, with the highest median household income of $51,960 found in the 45 to 64 years age bracket for the primary householder. A total of 243 households (43.3%) fall into this category.
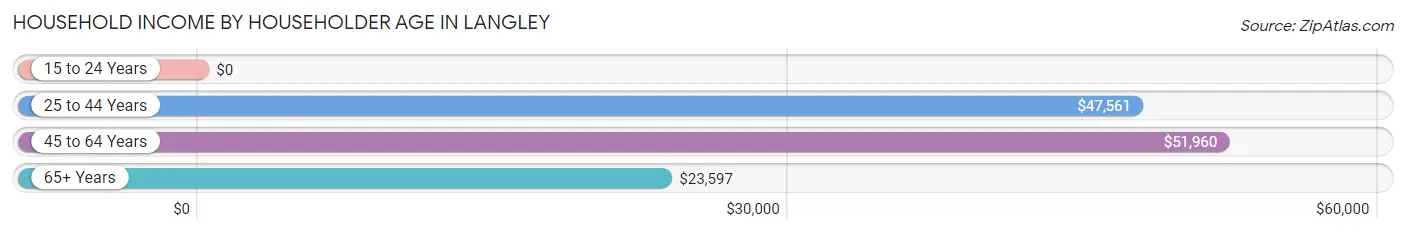
| Income Bracket | # Households | Median Income |
| 15 to 24 Years | 0 (0.0%) | $0 |
| 25 to 44 Years | 179 (31.9%) | $47,561 |
| 45 to 64 Years | 243 (43.3%) | $51,960 |
| 65+ Years | 139 (24.8%) | $23,597 |
| Total | 561 (100.0%) | $47,848 |
Poverty in Langley
Income Below Poverty by Sex and Age in Langley
With 30.0% poverty level for males and 30.4% for females among the residents of Langley, under 5 year old males and 25 to 34 year old females are the most vulnerable to poverty, with 28 males (100.0%) and 139 females (62.6%) in their respective age groups living below the poverty level.
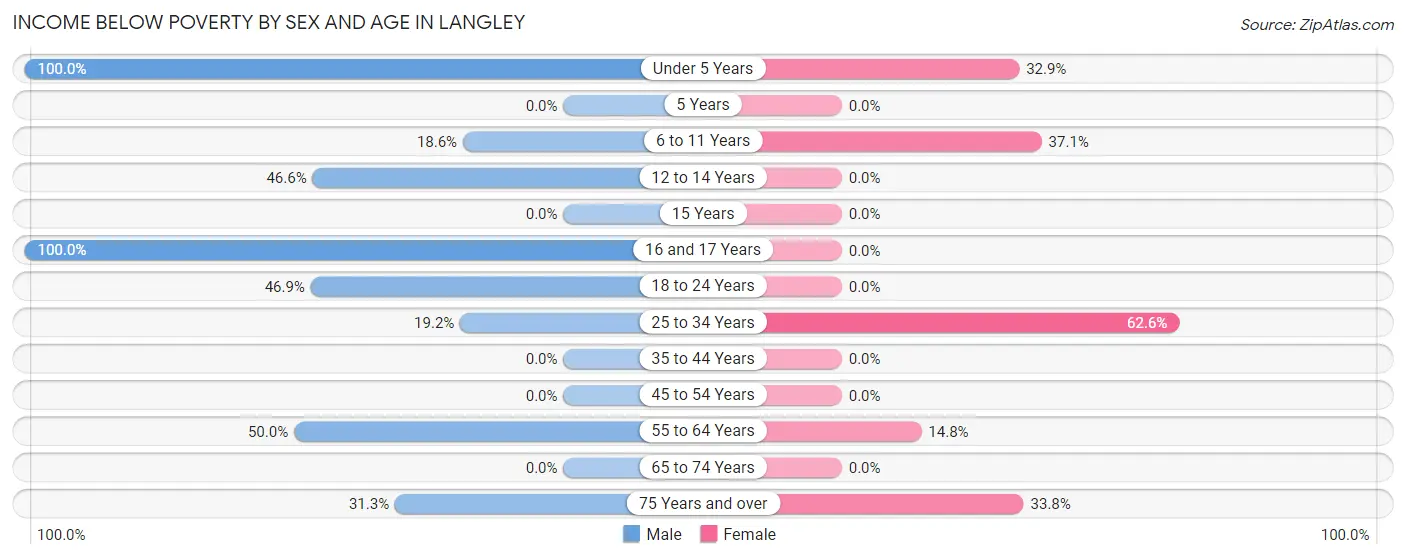
| Age Bracket | Male | Female |
| Under 5 Years | 28 (100.0%) | 27 (32.9%) |
| 5 Years | 0 (0.0%) | 0 (0.0%) |
| 6 to 11 Years | 22 (18.6%) | 46 (37.1%) |
| 12 to 14 Years | 61 (46.6%) | 0 (0.0%) |
| 15 Years | 0 (0.0%) | 0 (0.0%) |
| 16 and 17 Years | 11 (100.0%) | 0 (0.0%) |
| 18 to 24 Years | 53 (46.9%) | 0 (0.0%) |
| 25 to 34 Years | 18 (19.2%) | 139 (62.6%) |
| 35 to 44 Years | 0 (0.0%) | 0 (0.0%) |
| 45 to 54 Years | 0 (0.0%) | 0 (0.0%) |
| 55 to 64 Years | 63 (50.0%) | 17 (14.8%) |
| 65 to 74 Years | 0 (0.0%) | 0 (0.0%) |
| 75 Years and over | 15 (31.2%) | 27 (33.8%) |
| Total | 271 (30.0%) | 256 (30.4%) |
Income Above Poverty by Sex and Age in Langley
According to the poverty statistics in Langley, males aged 35 to 44 years and females aged 15 years are the age groups that are most secure financially, with 100.0% of males and 100.0% of females in these age groups living above the poverty line.
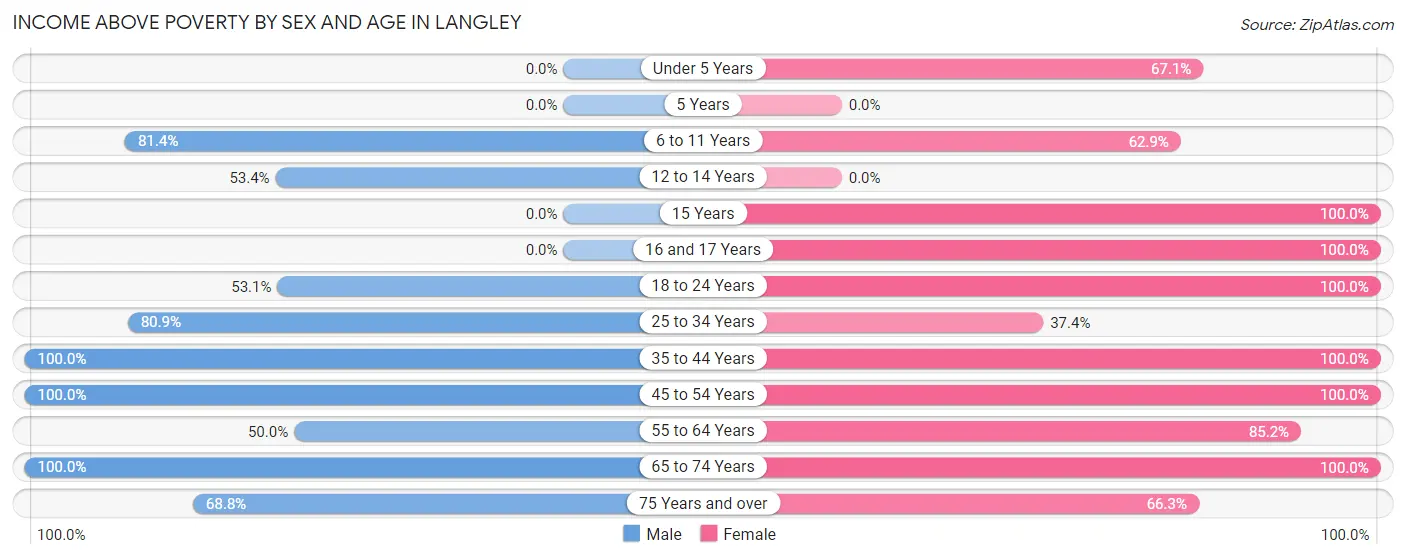
| Age Bracket | Male | Female |
| Under 5 Years | 0 (0.0%) | 55 (67.1%) |
| 5 Years | 0 (0.0%) | 0 (0.0%) |
| 6 to 11 Years | 96 (81.4%) | 78 (62.9%) |
| 12 to 14 Years | 70 (53.4%) | 0 (0.0%) |
| 15 Years | 0 (0.0%) | 23 (100.0%) |
| 16 and 17 Years | 0 (0.0%) | 30 (100.0%) |
| 18 to 24 Years | 60 (53.1%) | 30 (100.0%) |
| 25 to 34 Years | 76 (80.8%) | 83 (37.4%) |
| 35 to 44 Years | 82 (100.0%) | 23 (100.0%) |
| 45 to 54 Years | 64 (100.0%) | 94 (100.0%) |
| 55 to 64 Years | 63 (50.0%) | 98 (85.2%) |
| 65 to 74 Years | 88 (100.0%) | 20 (100.0%) |
| 75 Years and over | 33 (68.8%) | 53 (66.2%) |
| Total | 632 (70.0%) | 587 (69.6%) |
Income Below Poverty Among Married-Couple Families in Langley
The poverty statistics for married-couple families in Langley show that 17.4% or 52 of the total 299 families live below the poverty line. Families with 3 or 4 children have the highest poverty rate of 30.0%, comprising of 12 families. On the other hand, families with 1 or 2 children have the lowest poverty rate of 0.0%, which includes 0 families.
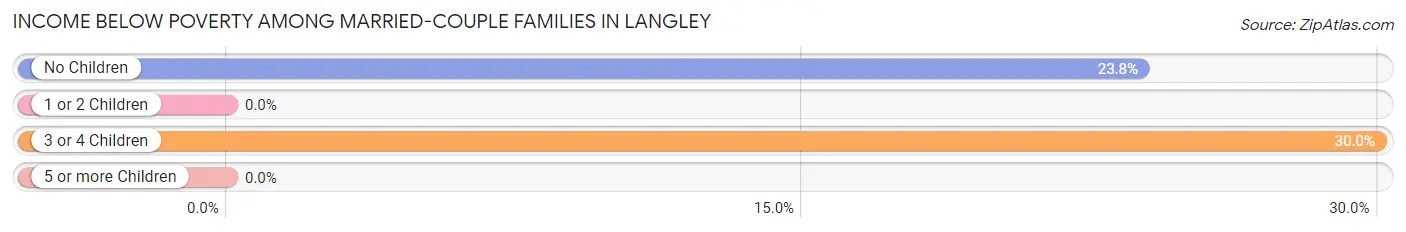
| Children | Above Poverty | Below Poverty |
| No Children | 128 (76.2%) | 40 (23.8%) |
| 1 or 2 Children | 91 (100.0%) | 0 (0.0%) |
| 3 or 4 Children | 28 (70.0%) | 12 (30.0%) |
| 5 or more Children | 0 (0.0%) | 0 (0.0%) |
| Total | 247 (82.6%) | 52 (17.4%) |
Income Below Poverty Among Single-Parent Households in Langley
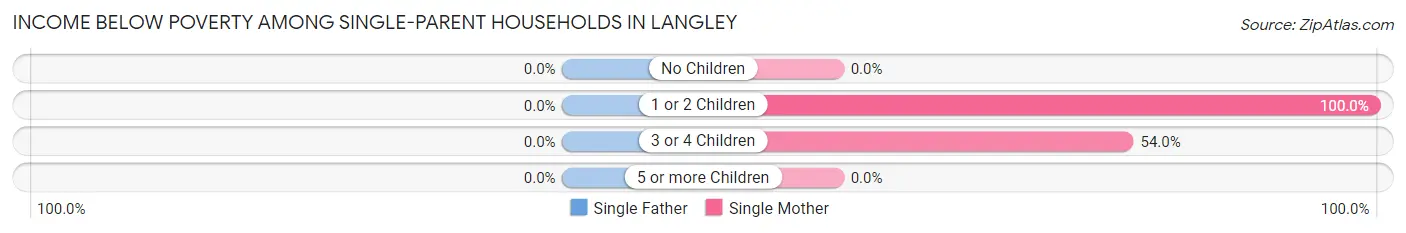
| Children | Single Father | Single Mother |
| No Children | 0 (0.0%) | 0 (0.0%) |
| 1 or 2 Children | 0 (0.0%) | 41 (100.0%) |
| 3 or 4 Children | 0 (0.0%) | 27 (54.0%) |
| 5 or more Children | 0 (0.0%) | 0 (0.0%) |
| Total | 0 (0.0%) | 68 (74.7%) |
Income Below Poverty Among Married-Couple vs Single-Parent Households in Langley
The poverty data for Langley shows that 52 of the married-couple family households (17.4%) and 68 of the single-parent households (74.7%) are living below the poverty level. Within the married-couple family households, those with 3 or 4 children have the highest poverty rate, with 12 households (30.0%) falling below the poverty line. Among the single-parent households, those with 1 or 2 children have the highest poverty rate, with 41 household (100.0%) living below poverty.
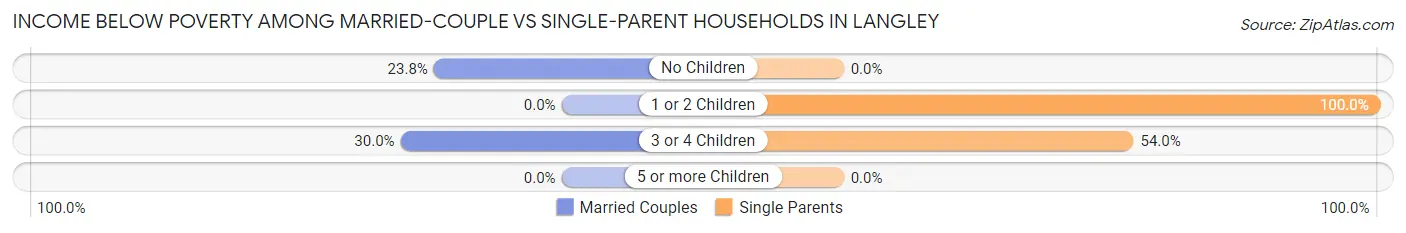
| Children | Married-Couple Families | Single-Parent Households |
| No Children | 40 (23.8%) | 0 (0.0%) |
| 1 or 2 Children | 0 (0.0%) | 41 (100.0%) |
| 3 or 4 Children | 12 (30.0%) | 27 (54.0%) |
| 5 or more Children | 0 (0.0%) | 0 (0.0%) |
| Total | 52 (17.4%) | 68 (74.7%) |
Race in Langley
The most populous races in Langley are White / Caucasian (1,469 | 82.7%), Two or more Races (195 | 11.0%), and Black / African American (112 | 6.3%).
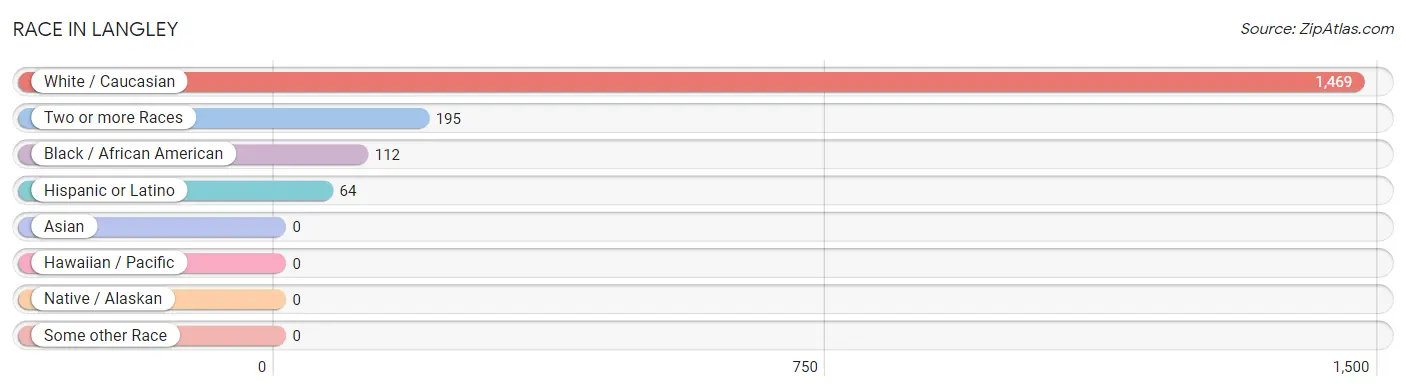
| Race | # Population | % Population |
| Asian | 0 | 0.0% |
| Black / African American | 112 | 6.3% |
| Hawaiian / Pacific | 0 | 0.0% |
| Hispanic or Latino | 64 | 3.6% |
| Native / Alaskan | 0 | 0.0% |
| White / Caucasian | 1,469 | 82.7% |
| Two or more Races | 195 | 11.0% |
| Some other Race | 0 | 0.0% |
| Total | 1,776 | 100.0% |
Ancestry in Langley
The most populous ancestries reported in Langley are American (501 | 28.2%), Irish (227 | 12.8%), English (81 | 4.6%), Mexican (64 | 3.6%), and Dutch (50 | 2.8%), together accounting for 52.0% of all Langley residents.
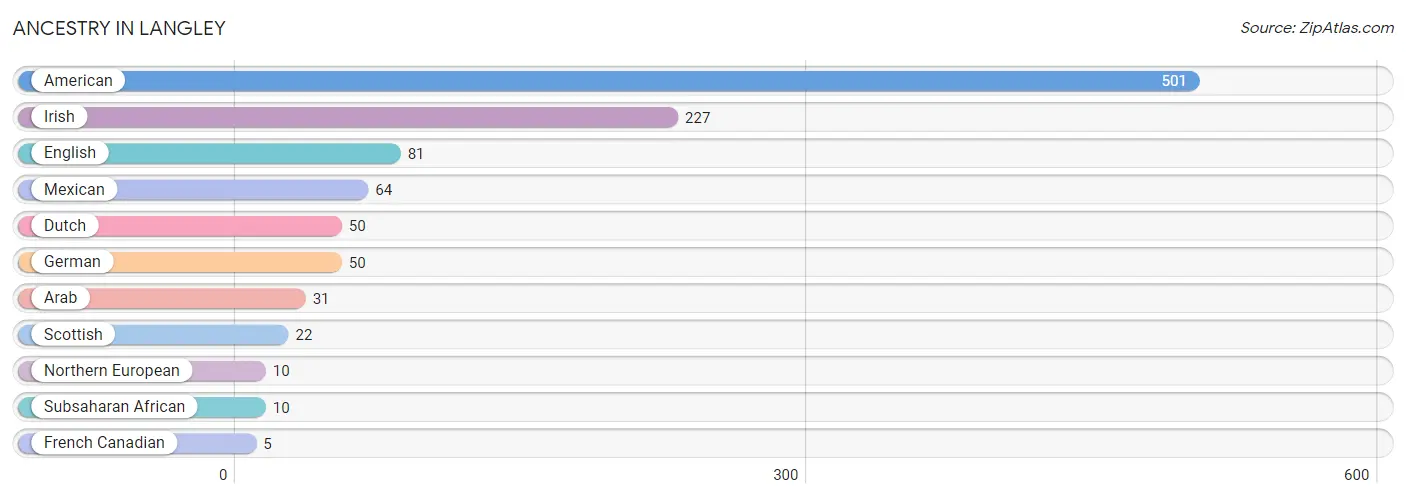
| Ancestry | # Population | % Population |
| American | 501 | 28.2% |
| Arab | 31 | 1.8% |
| Dutch | 50 | 2.8% |
| English | 81 | 4.6% |
| French Canadian | 5 | 0.3% |
| German | 50 | 2.8% |
| Irish | 227 | 12.8% |
| Mexican | 64 | 3.6% |
| Northern European | 10 | 0.6% |
| Scottish | 22 | 1.2% |
| Subsaharan African | 10 | 0.6% | View All 11 Rows |
Immigrants in Langley
The most numerous immigrant groups reported in Langley came from Central America (64 | 3.6%), Latin America (64 | 3.6%), and Mexico (64 | 3.6%), together accounting for 10.8% of all Langley residents.
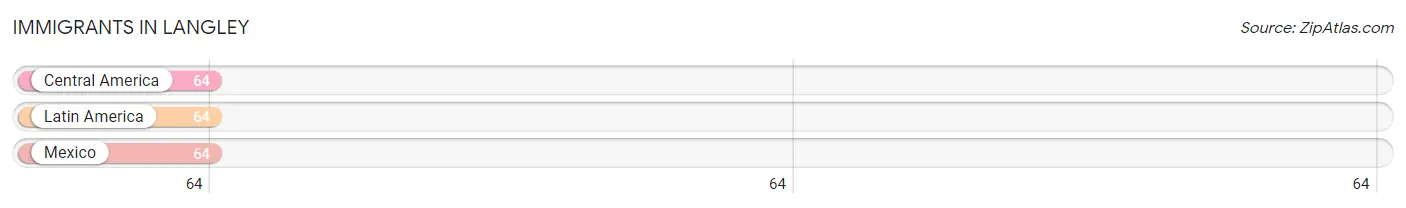
| Immigration Origin | # Population | % Population |
| Central America | 64 | 3.6% |
| Latin America | 64 | 3.6% |
| Mexico | 64 | 3.6% | View All 3 Rows |
Sex and Age in Langley
Sex and Age in Langley
The most populous age groups in Langley are 10 to 14 Years (249 | 27.6%) for men and 25 to 29 Years (175 | 20.1%) for women.
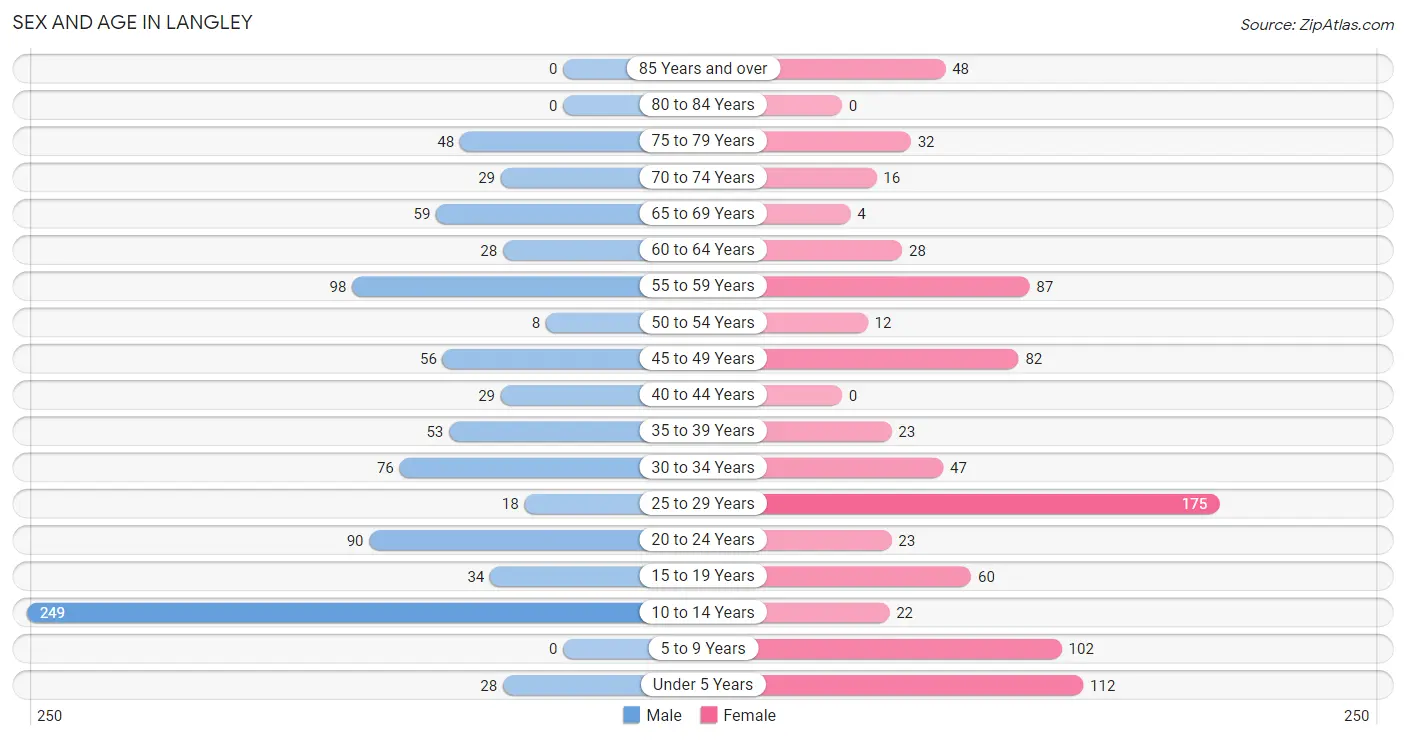
| Age Bracket | Male | Female |
| Under 5 Years | 28 (3.1%) | 112 (12.8%) |
| 5 to 9 Years | 0 (0.0%) | 102 (11.7%) |
| 10 to 14 Years | 249 (27.6%) | 22 (2.5%) |
| 15 to 19 Years | 34 (3.8%) | 60 (6.9%) |
| 20 to 24 Years | 90 (10.0%) | 23 (2.6%) |
| 25 to 29 Years | 18 (2.0%) | 175 (20.1%) |
| 30 to 34 Years | 76 (8.4%) | 47 (5.4%) |
| 35 to 39 Years | 53 (5.9%) | 23 (2.6%) |
| 40 to 44 Years | 29 (3.2%) | 0 (0.0%) |
| 45 to 49 Years | 56 (6.2%) | 82 (9.4%) |
| 50 to 54 Years | 8 (0.9%) | 12 (1.4%) |
| 55 to 59 Years | 98 (10.8%) | 87 (10.0%) |
| 60 to 64 Years | 28 (3.1%) | 28 (3.2%) |
| 65 to 69 Years | 59 (6.5%) | 4 (0.5%) |
| 70 to 74 Years | 29 (3.2%) | 16 (1.8%) |
| 75 to 79 Years | 48 (5.3%) | 32 (3.7%) |
| 80 to 84 Years | 0 (0.0%) | 0 (0.0%) |
| 85 Years and over | 0 (0.0%) | 48 (5.5%) |
| Total | 903 (100.0%) | 873 (100.0%) |
Families and Households in Langley
Median Family Size in Langley
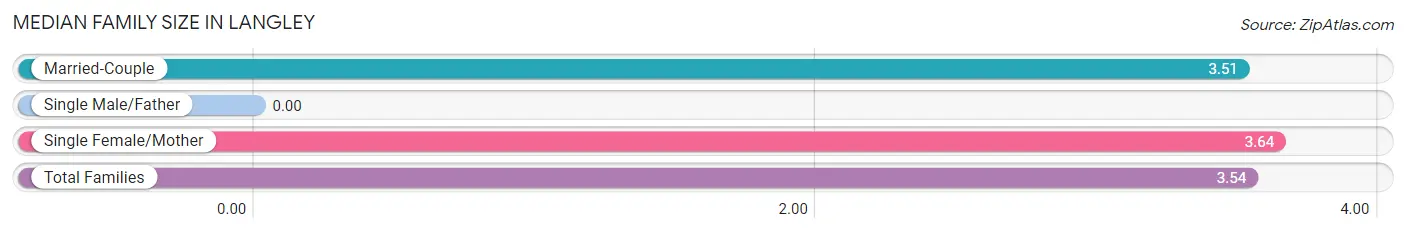
| Family Type | # Families | Family Size |
| Married-Couple | 299 (76.7%) | 3.51 |
| Single Male/Father | 0 (0.0%) | - |
| Single Female/Mother | 91 (23.3%) | 3.64 |
| Total Families | 390 (100.0%) | 3.54 |
Median Household Size in Langley
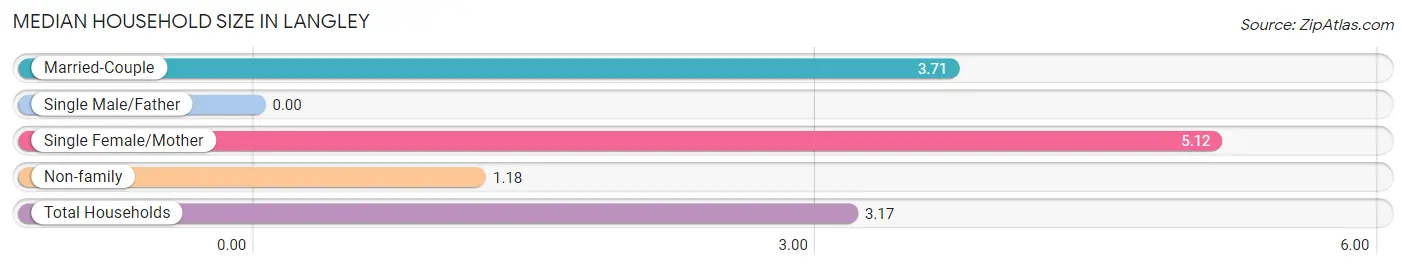
| Household Type | # Households | Household Size |
| Married-Couple | 299 (53.3%) | 3.71 |
| Single Male/Father | 0 (0.0%) | - |
| Single Female/Mother | 91 (16.2%) | 5.12 |
| Non-family | 171 (30.5%) | 1.18 |
| Total Households | 561 (100.0%) | 3.17 |
Household Size by Marriage Status in Langley
Out of a total of 561 households in Langley, 390 (69.5%) are family households, while 171 (30.5%) are nonfamily households. The most numerous type of family households are 2-person households, comprising 118, and the most common type of nonfamily households are 1-person households, comprising 146.
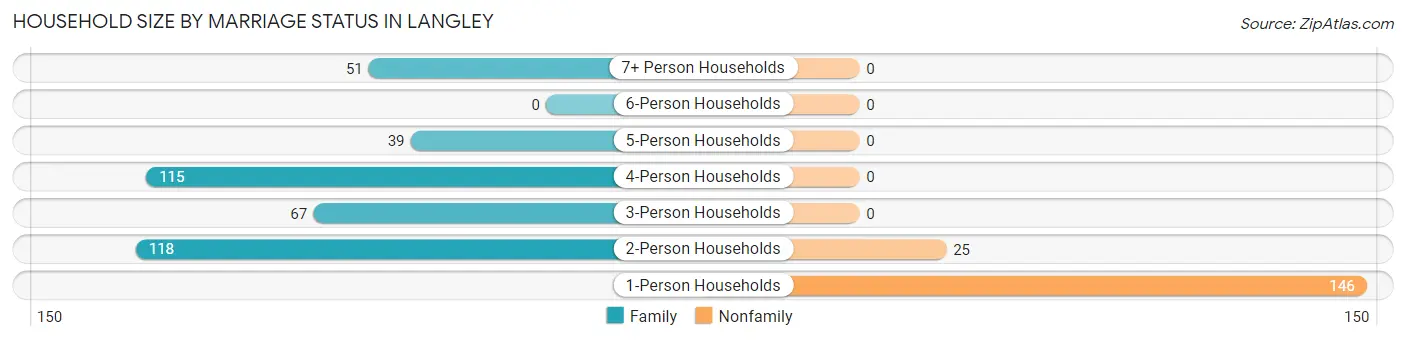
| Household Size | Family Households | Nonfamily Households |
| 1-Person Households | - | 146 (26.0%) |
| 2-Person Households | 118 (21.0%) | 25 (4.5%) |
| 3-Person Households | 67 (11.9%) | 0 (0.0%) |
| 4-Person Households | 115 (20.5%) | 0 (0.0%) |
| 5-Person Households | 39 (7.0%) | 0 (0.0%) |
| 6-Person Households | 0 (0.0%) | 0 (0.0%) |
| 7+ Person Households | 51 (9.1%) | 0 (0.0%) |
| Total | 390 (69.5%) | 171 (30.5%) |
Female Fertility in Langley
Fertility by Age in Langley
Average fertility rate in Langley is 144.0 births per 1,000 women. Women in the age bracket of 20 to 34 years have the highest fertility rate with 241.0 births per 1,000 women. Women in the age bracket of 20 to 34 years acount for 100.0% of all women with births.
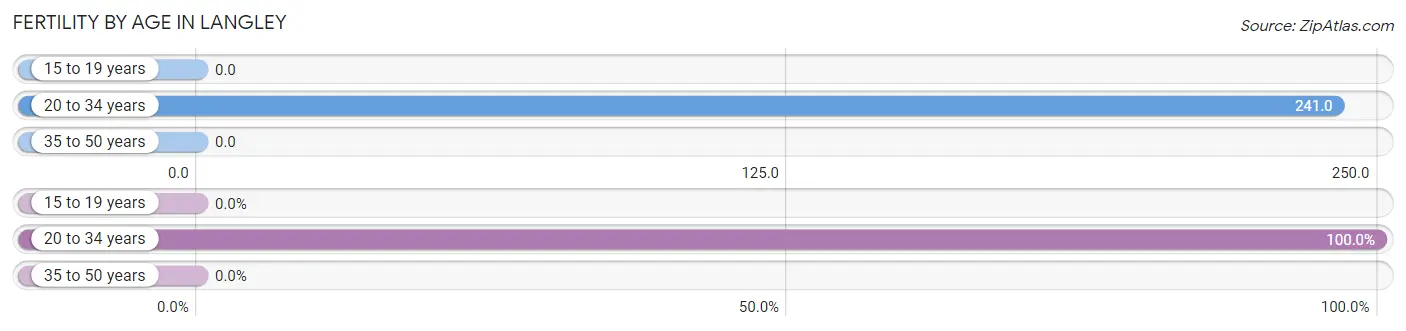
| Age Bracket | Women with Births | Births / 1,000 Women |
| 15 to 19 years | 0 (0.0%) | 0.0 |
| 20 to 34 years | 59 (100.0%) | 241.0 |
| 35 to 50 years | 0 (0.0%) | 0.0 |
| Total | 59 (100.0%) | 144.0 |
Fertility by Age by Marriage Status in Langley
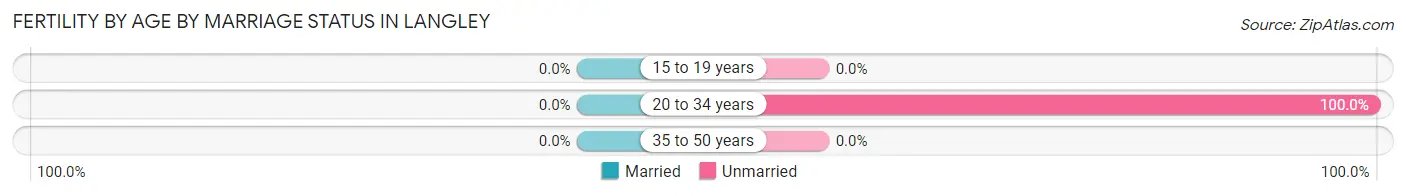
| Age Bracket | Married | Unmarried |
| 15 to 19 years | 0 (0.0%) | 0 (0.0%) |
| 20 to 34 years | 0 (0.0%) | 59 (100.0%) |
| 35 to 50 years | 0 (0.0%) | 0 (0.0%) |
| Total | 0 (0.0%) | 59 (100.0%) |
Fertility by Education in Langley
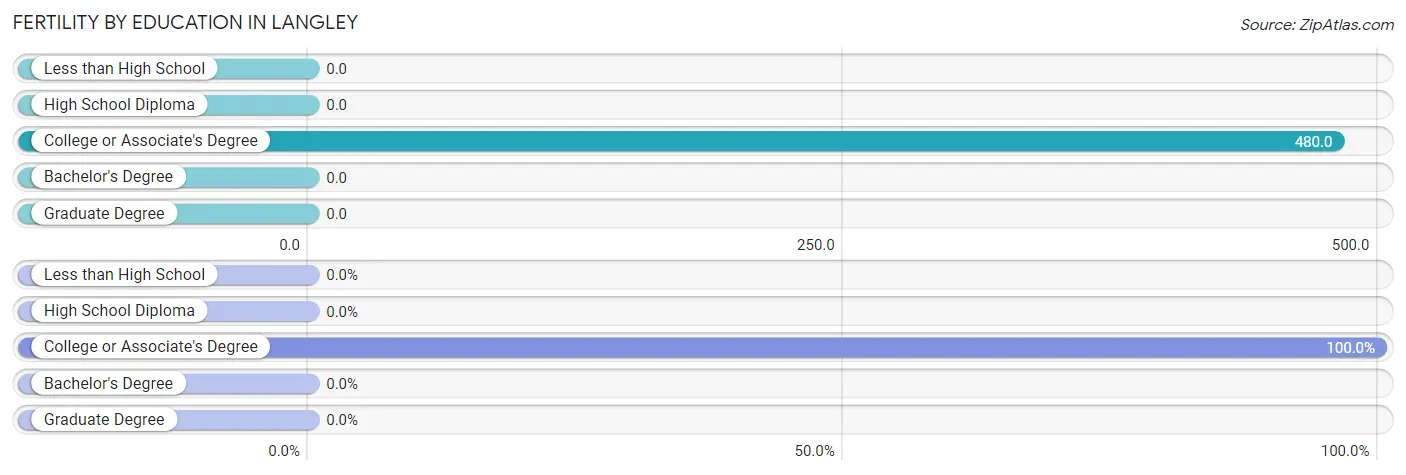
| Educational Attainment | Women with Births | Births / 1,000 Women |
| Less than High School | 0 (0.0%) | 0.0 |
| High School Diploma | 0 (0.0%) | 0.0 |
| College or Associate's Degree | 59 (100.0%) | 480.0 |
| Bachelor's Degree | 0 (0.0%) | 0.0 |
| Graduate Degree | 0 (0.0%) | 0.0 |
| Total | 59 (100.0%) | 144.0 |
Fertility by Education by Marriage Status in Langley
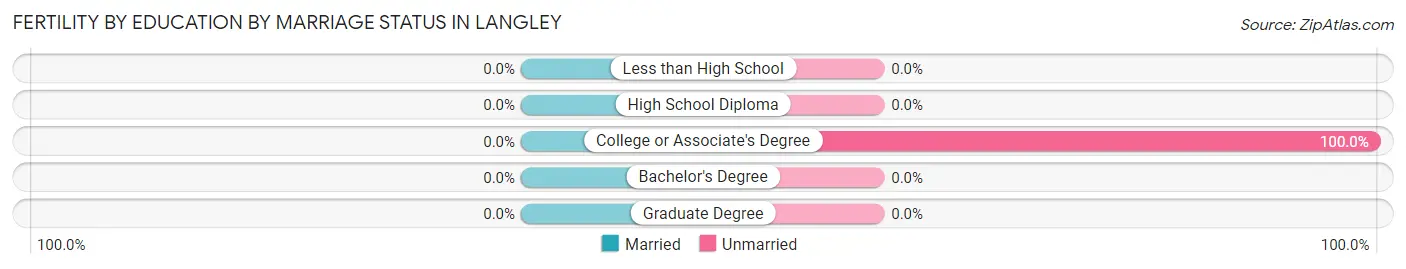
| Educational Attainment | Married | Unmarried |
| Less than High School | 0 (0.0%) | 0 (0.0%) |
| High School Diploma | 0 (0.0%) | 0 (0.0%) |
| College or Associate's Degree | 0 (0.0%) | 59 (100.0%) |
| Bachelor's Degree | 0 (0.0%) | 0 (0.0%) |
| Graduate Degree | 0 (0.0%) | 0 (0.0%) |
| Total | 0 (0.0%) | 59 (100.0%) |
Employment Characteristics in Langley
Employment by Class of Employer in Langley
Among the 680 employed individuals in Langley, private company employees (444 | 65.3%), self-employed (not incorporated) (104 | 15.3%), and state government employees (39 | 5.7%) make up the most common classes of employment.
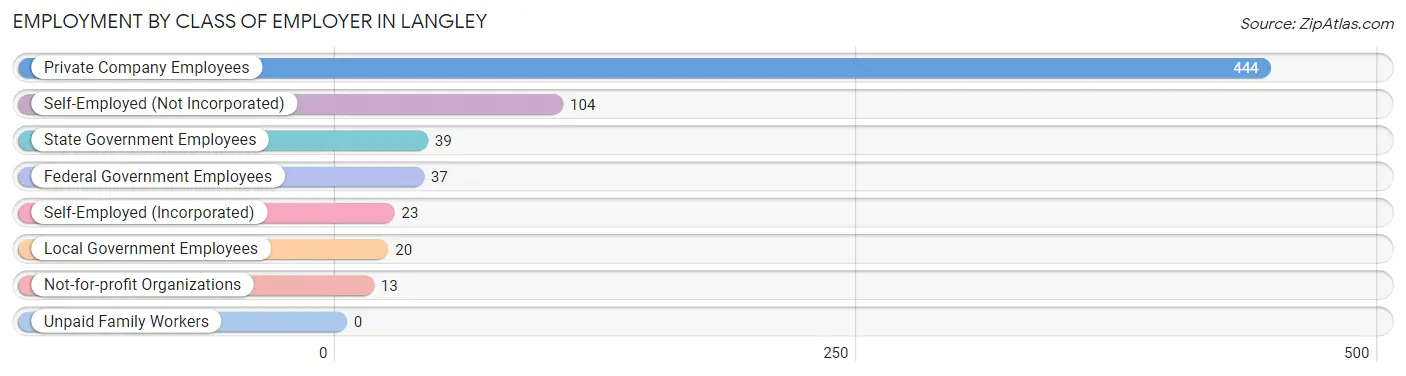
| Employer Class | # Employees | % Employees |
| Private Company Employees | 444 | 65.3% |
| Self-Employed (Incorporated) | 23 | 3.4% |
| Self-Employed (Not Incorporated) | 104 | 15.3% |
| Not-for-profit Organizations | 13 | 1.9% |
| Local Government Employees | 20 | 2.9% |
| State Government Employees | 39 | 5.7% |
| Federal Government Employees | 37 | 5.4% |
| Unpaid Family Workers | 0 | 0.0% |
| Total | 680 | 100.0% |
Employment Status by Age in Langley
According to the labor force statistics for Langley, out of the total population over 16 years of age (1,240), 61.7% or 765 individuals are in the labor force, with 11.6% or 89 of them unemployed. The age group with the highest labor force participation rate is 45 to 54 years, with 96.2% or 152 individuals in the labor force. Within the labor force, the 25 to 29 years age range has the highest percentage of unemployed individuals, with 33.7% or 61 of them being unemployed.
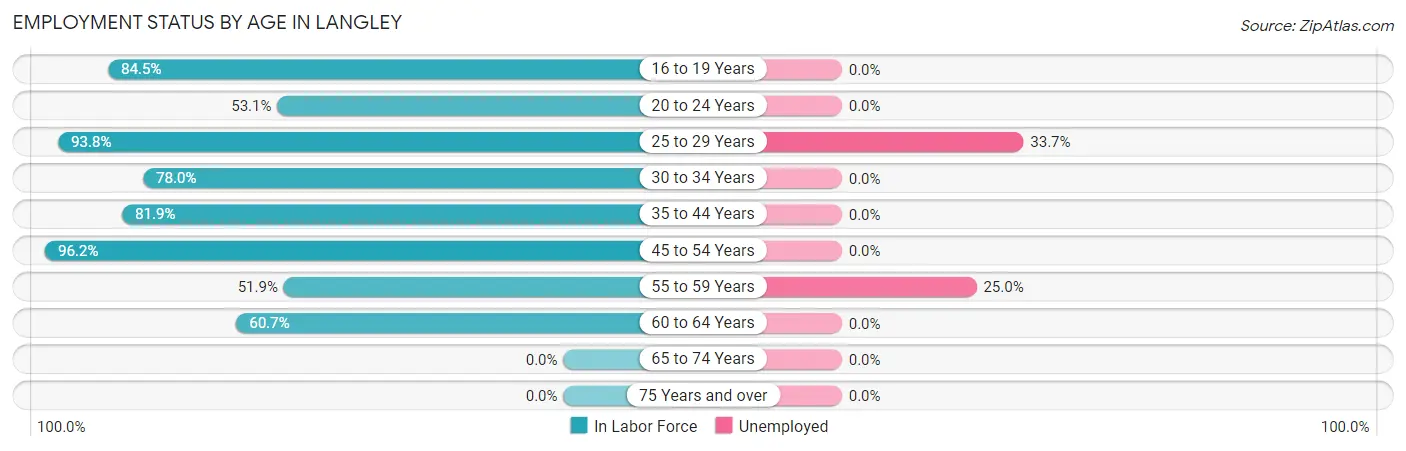
| Age Bracket | In Labor Force | Unemployed |
| 16 to 19 Years | 60 (84.5%) | 0 (0.0%) |
| 20 to 24 Years | 60 (53.1%) | 0 (0.0%) |
| 25 to 29 Years | 181 (93.8%) | 61 (33.7%) |
| 30 to 34 Years | 96 (78.0%) | 0 (0.0%) |
| 35 to 44 Years | 86 (81.9%) | 0 (0.0%) |
| 45 to 54 Years | 152 (96.2%) | 0 (0.0%) |
| 55 to 59 Years | 96 (51.9%) | 24 (25.0%) |
| 60 to 64 Years | 34 (60.7%) | 0 (0.0%) |
| 65 to 74 Years | 0 (0.0%) | 0 (0.0%) |
| 75 Years and over | 0 (0.0%) | 0 (0.0%) |
| Total | 765 (61.7%) | 89 (11.6%) |
Employment Status by Educational Attainment in Langley
According to labor force statistics for Langley, 78.7% of individuals (645) out of the total population between 25 and 64 years of age (820) are in the labor force, with 13.9% or 90 of them being unemployed. The group with the highest labor force participation rate are those with the educational attainment of bachelor's degree or higher, with 100.0% or 46 individuals in the labor force. Within the labor force, individuals with high school diploma education have the highest percentage of unemployment, with 26.6% or 94 of them being unemployed.
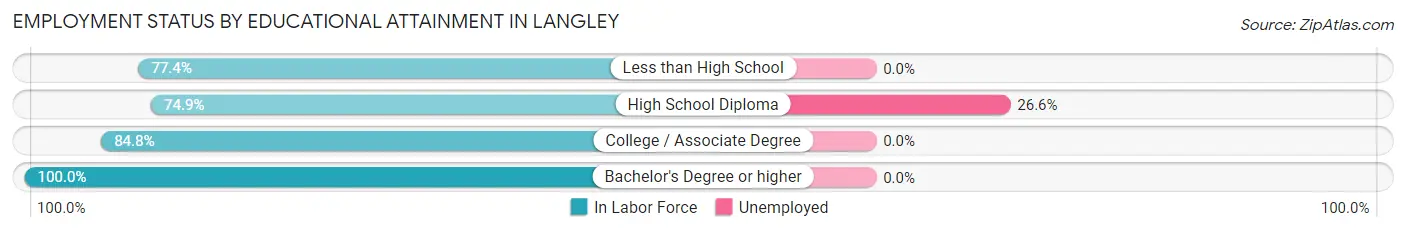
| Educational Attainment | In Labor Force | Unemployed |
| Less than High School | 113 (77.4%) | 0 (0.0%) |
| High School Diploma | 352 (74.9%) | 125 (26.6%) |
| College / Associate Degree | 134 (84.8%) | 0 (0.0%) |
| Bachelor's Degree or higher | 46 (100.0%) | 0 (0.0%) |
| Total | 645 (78.7%) | 114 (13.9%) |
Employment Occupations by Sex in Langley
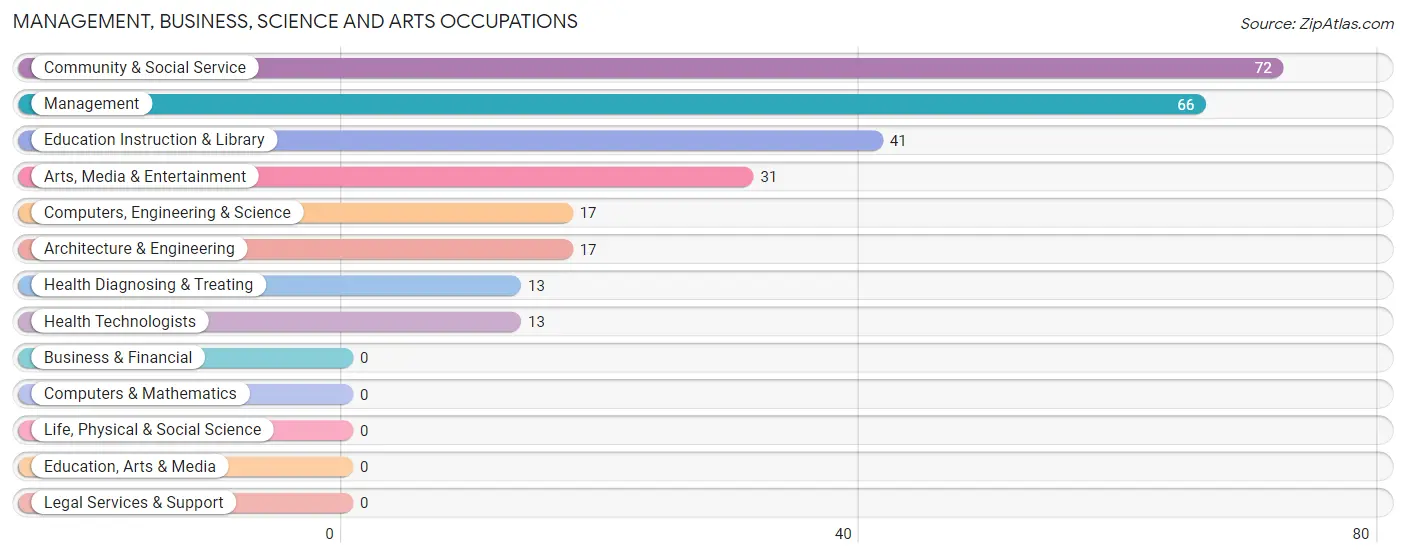
Management, Business, Science and Arts Occupations
The most common Management, Business, Science and Arts occupations in Langley are Community & Social Service (72 | 11.1%), Management (66 | 10.2%), Education Instruction & Library (41 | 6.3%), Arts, Media & Entertainment (31 | 4.8%), and Computers, Engineering & Science (17 | 2.6%).
Management, Business, Science and Arts Occupations by Sex
Within the Management, Business, Science and Arts occupations in Langley, the most male-oriented occupations are Management (100.0%), Computers, Engineering & Science (100.0%), and Architecture & Engineering (100.0%), while the most female-oriented occupations are Health Diagnosing & Treating (100.0%), Health Technologists (100.0%), and Education Instruction & Library (56.1%).
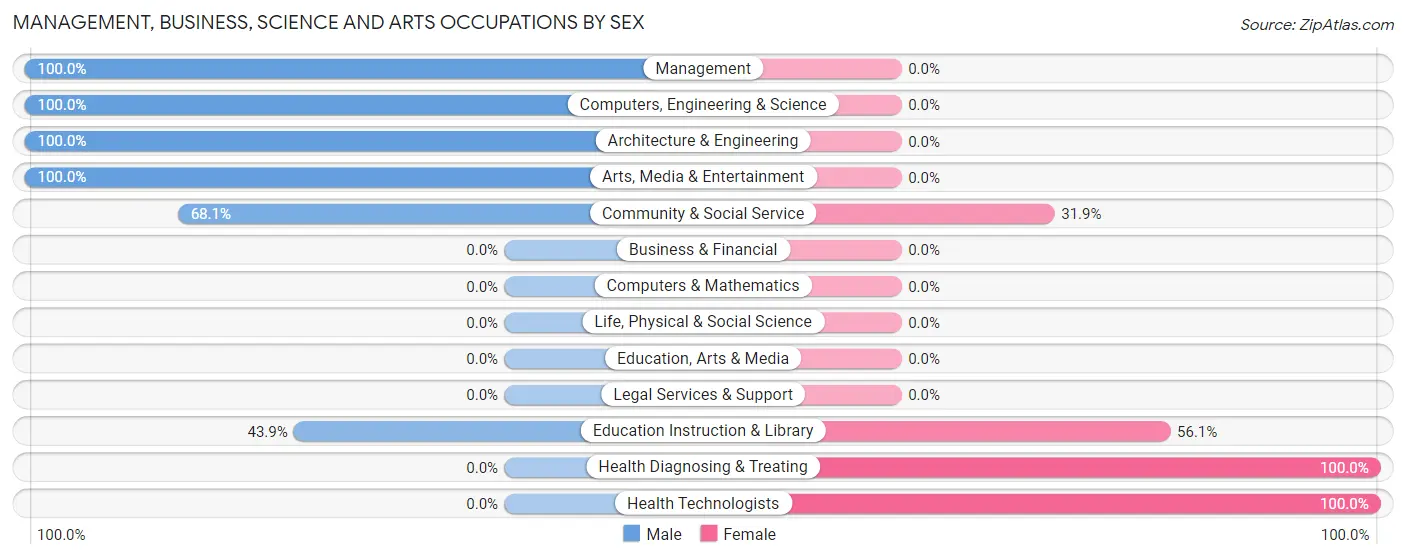
| Occupation | Male | Female |
| Management | 66 (100.0%) | 0 (0.0%) |
| Business & Financial | 0 (0.0%) | 0 (0.0%) |
| Computers, Engineering & Science | 17 (100.0%) | 0 (0.0%) |
| Computers & Mathematics | 0 (0.0%) | 0 (0.0%) |
| Architecture & Engineering | 17 (100.0%) | 0 (0.0%) |
| Life, Physical & Social Science | 0 (0.0%) | 0 (0.0%) |
| Community & Social Service | 49 (68.1%) | 23 (31.9%) |
| Education, Arts & Media | 0 (0.0%) | 0 (0.0%) |
| Legal Services & Support | 0 (0.0%) | 0 (0.0%) |
| Education Instruction & Library | 18 (43.9%) | 23 (56.1%) |
| Arts, Media & Entertainment | 31 (100.0%) | 0 (0.0%) |
| Health Diagnosing & Treating | 0 (0.0%) | 13 (100.0%) |
| Health Technologists | 0 (0.0%) | 13 (100.0%) |
| Total (Category) | 132 (78.6%) | 36 (21.4%) |
| Total (Overall) | 367 (56.7%) | 280 (43.3%) |
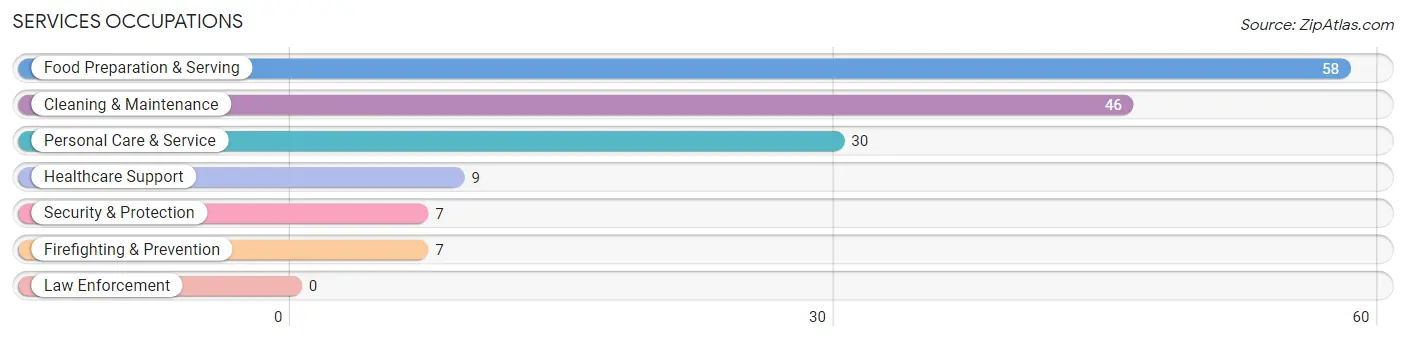
Services Occupations
The most common Services occupations in Langley are Food Preparation & Serving (58 | 9.0%), Cleaning & Maintenance (46 | 7.1%), Personal Care & Service (30 | 4.6%), Healthcare Support (9 | 1.4%), and Security & Protection (7 | 1.1%).
Services Occupations by Sex
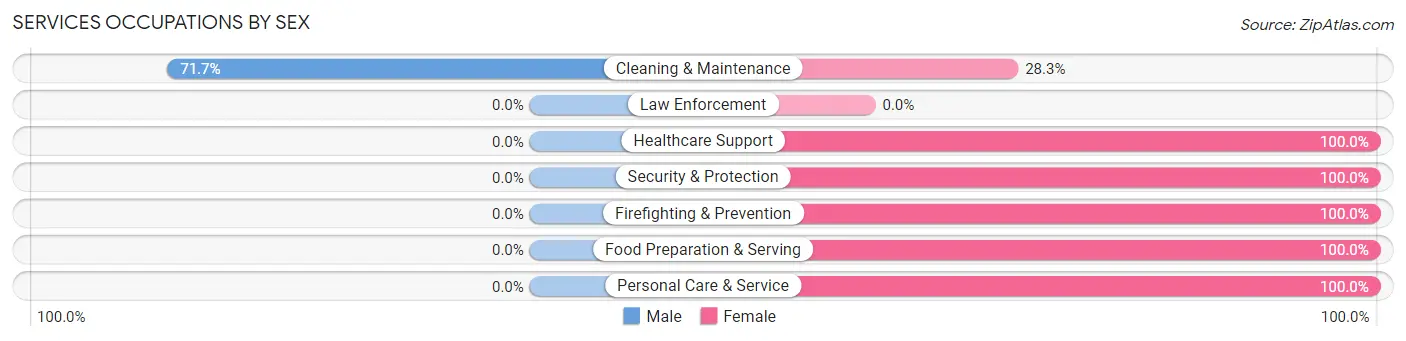
| Occupation | Male | Female |
| Healthcare Support | 0 (0.0%) | 9 (100.0%) |
| Security & Protection | 0 (0.0%) | 7 (100.0%) |
| Firefighting & Prevention | 0 (0.0%) | 7 (100.0%) |
| Law Enforcement | 0 (0.0%) | 0 (0.0%) |
| Food Preparation & Serving | 0 (0.0%) | 58 (100.0%) |
| Cleaning & Maintenance | 33 (71.7%) | 13 (28.3%) |
| Personal Care & Service | 0 (0.0%) | 30 (100.0%) |
| Total (Category) | 33 (22.0%) | 117 (78.0%) |
| Total (Overall) | 367 (56.7%) | 280 (43.3%) |
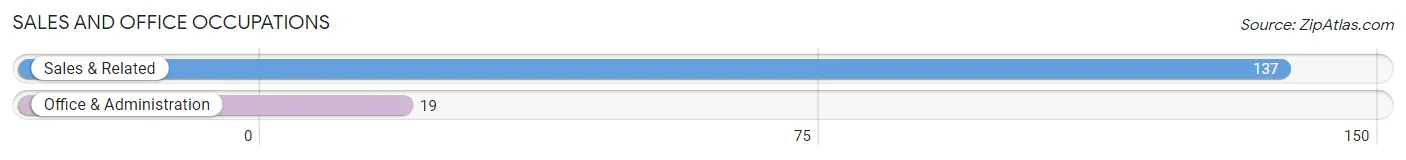
Sales and Office Occupations
The most common Sales and Office occupations in Langley are Sales & Related (137 | 21.2%), and Office & Administration (19 | 2.9%).
Sales and Office Occupations by Sex
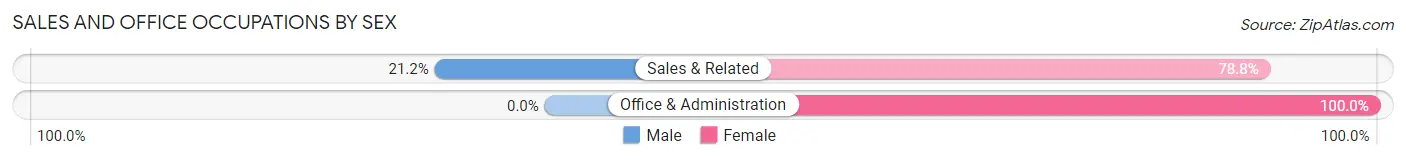
| Occupation | Male | Female |
| Sales & Related | 29 (21.2%) | 108 (78.8%) |
| Office & Administration | 0 (0.0%) | 19 (100.0%) |
| Total (Category) | 29 (18.6%) | 127 (81.4%) |
| Total (Overall) | 367 (56.7%) | 280 (43.3%) |
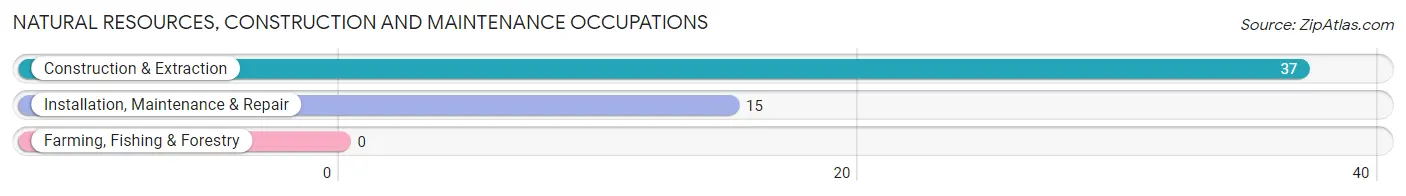
Natural Resources, Construction and Maintenance Occupations
The most common Natural Resources, Construction and Maintenance occupations in Langley are Construction & Extraction (37 | 5.7%), and Installation, Maintenance & Repair (15 | 2.3%).
Natural Resources, Construction and Maintenance Occupations by Sex
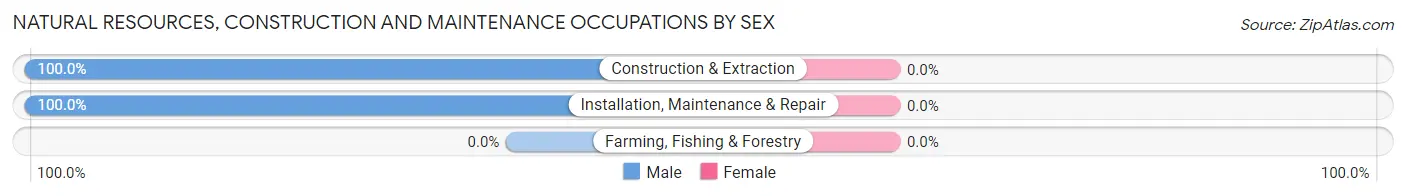
| Occupation | Male | Female |
| Farming, Fishing & Forestry | 0 (0.0%) | 0 (0.0%) |
| Construction & Extraction | 37 (100.0%) | 0 (0.0%) |
| Installation, Maintenance & Repair | 15 (100.0%) | 0 (0.0%) |
| Total (Category) | 52 (100.0%) | 0 (0.0%) |
| Total (Overall) | 367 (56.7%) | 280 (43.3%) |
Production, Transportation and Moving Occupations
The most common Production, Transportation and Moving occupations in Langley are Production (61 | 9.4%), Material Moving (49 | 7.6%), and Transportation (11 | 1.7%).
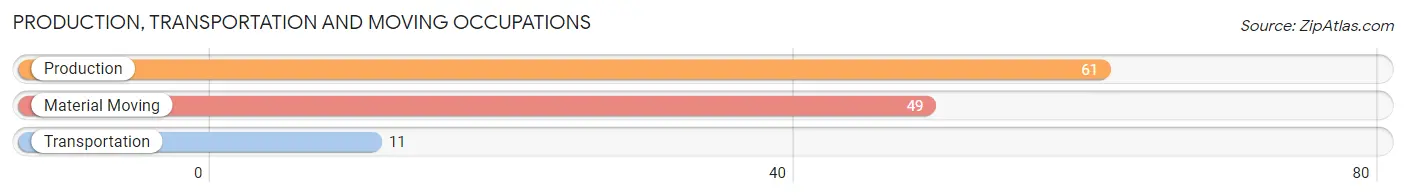
Production, Transportation and Moving Occupations by Sex
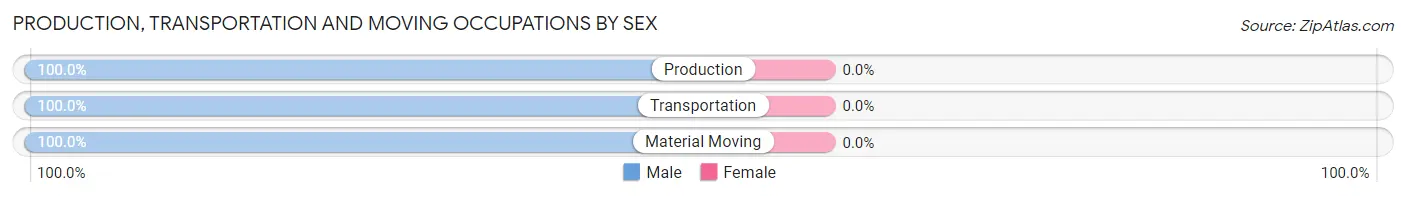
| Occupation | Male | Female |
| Production | 61 (100.0%) | 0 (0.0%) |
| Transportation | 11 (100.0%) | 0 (0.0%) |
| Material Moving | 49 (100.0%) | 0 (0.0%) |
| Total (Category) | 121 (100.0%) | 0 (0.0%) |
| Total (Overall) | 367 (56.7%) | 280 (43.3%) |
Employment Industries by Sex in Langley
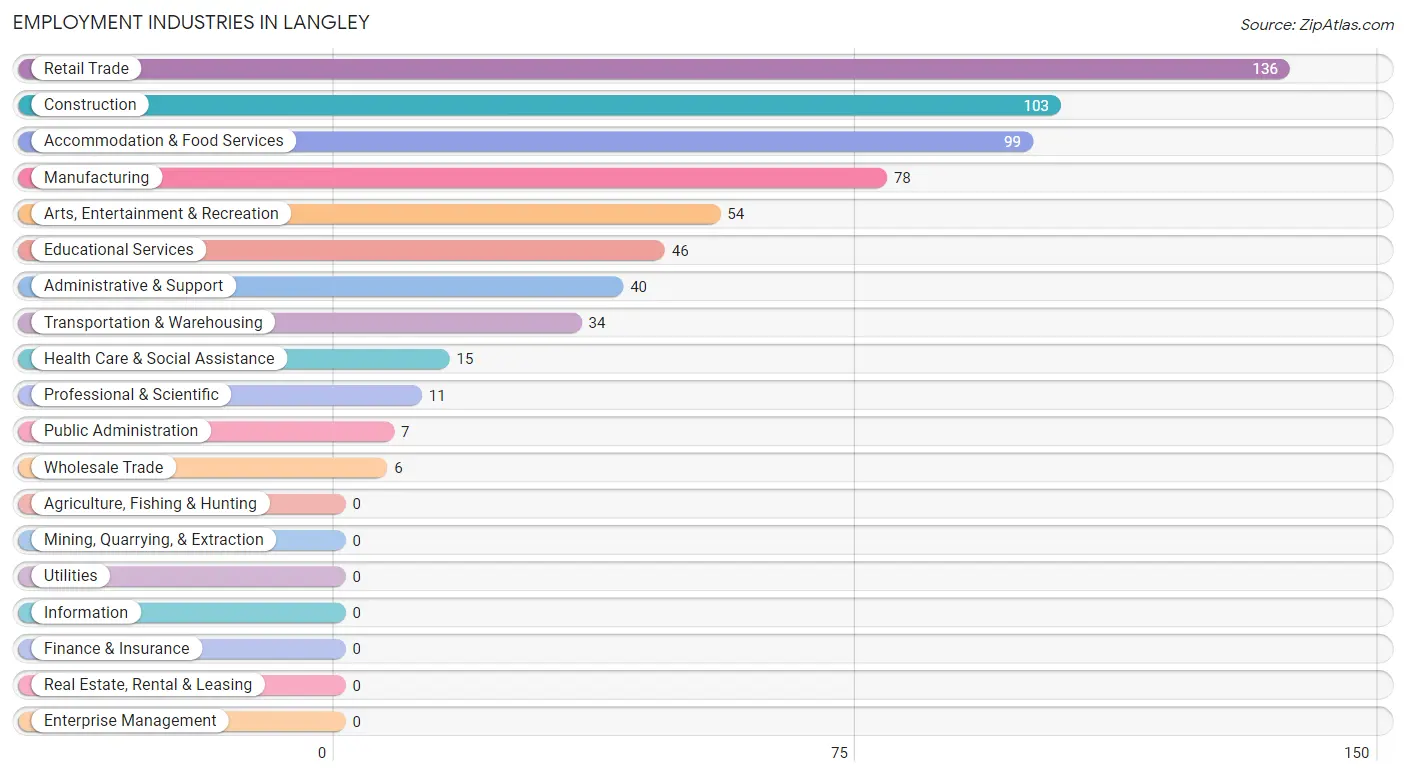
Employment Industries in Langley
The major employment industries in Langley include Retail Trade (136 | 21.0%), Construction (103 | 15.9%), Accommodation & Food Services (99 | 15.3%), Manufacturing (78 | 12.1%), and Arts, Entertainment & Recreation (54 | 8.4%).
Employment Industries by Sex in Langley
The Langley industries that see more men than women are Construction (100.0%), Manufacturing (100.0%), and Wholesale Trade (100.0%), whereas the industries that tend to have a higher number of women are Health Care & Social Assistance (100.0%), Accommodation & Food Services (100.0%), and Public Administration (100.0%).
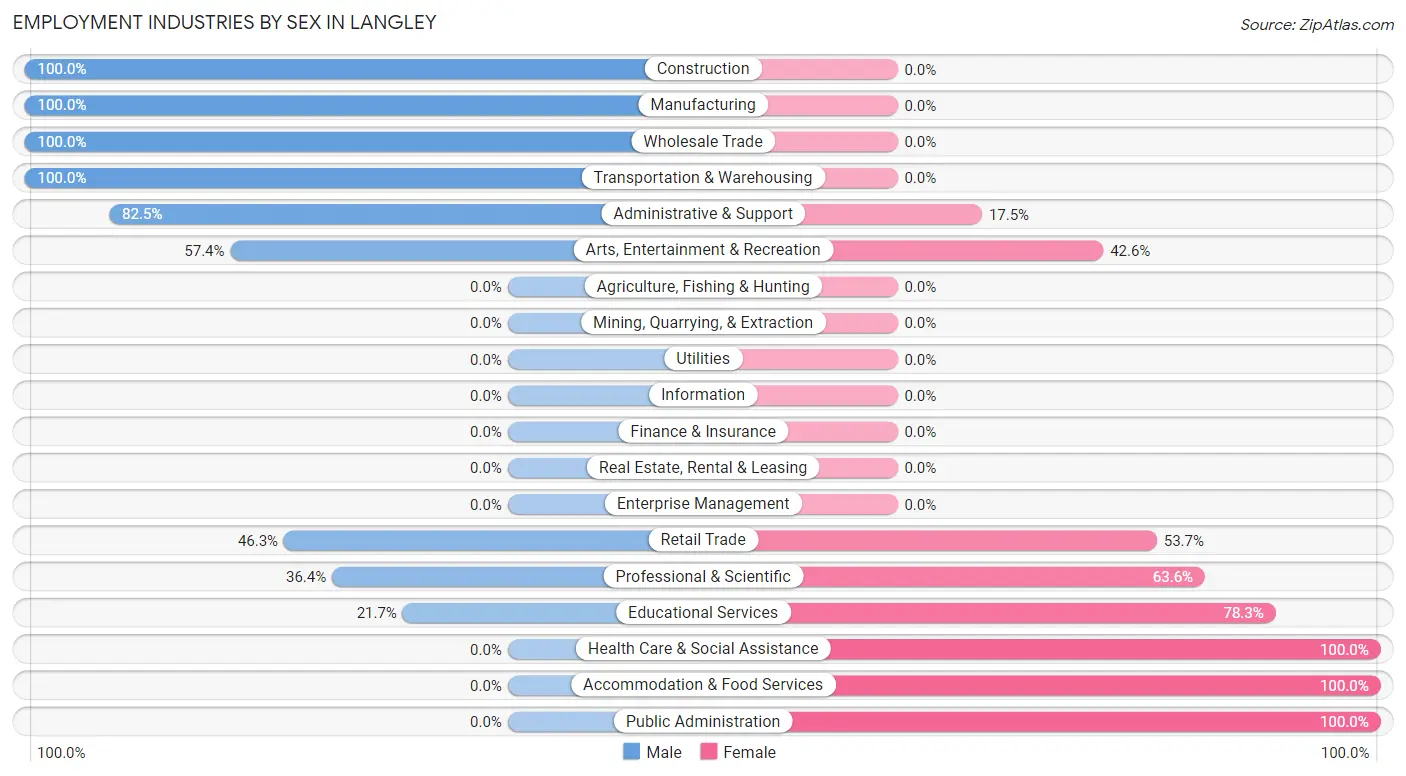
| Industry | Male | Female |
| Agriculture, Fishing & Hunting | 0 (0.0%) | 0 (0.0%) |
| Mining, Quarrying, & Extraction | 0 (0.0%) | 0 (0.0%) |
| Construction | 103 (100.0%) | 0 (0.0%) |
| Manufacturing | 78 (100.0%) | 0 (0.0%) |
| Wholesale Trade | 6 (100.0%) | 0 (0.0%) |
| Retail Trade | 63 (46.3%) | 73 (53.7%) |
| Transportation & Warehousing | 34 (100.0%) | 0 (0.0%) |
| Utilities | 0 (0.0%) | 0 (0.0%) |
| Information | 0 (0.0%) | 0 (0.0%) |
| Finance & Insurance | 0 (0.0%) | 0 (0.0%) |
| Real Estate, Rental & Leasing | 0 (0.0%) | 0 (0.0%) |
| Professional & Scientific | 4 (36.4%) | 7 (63.6%) |
| Enterprise Management | 0 (0.0%) | 0 (0.0%) |
| Administrative & Support | 33 (82.5%) | 7 (17.5%) |
| Educational Services | 10 (21.7%) | 36 (78.3%) |
| Health Care & Social Assistance | 0 (0.0%) | 15 (100.0%) |
| Arts, Entertainment & Recreation | 31 (57.4%) | 23 (42.6%) |
| Accommodation & Food Services | 0 (0.0%) | 99 (100.0%) |
| Public Administration | 0 (0.0%) | 7 (100.0%) |
| Total | 367 (56.7%) | 280 (43.3%) |
Education in Langley
School Enrollment in Langley
The most common levels of schooling among the 508 students in Langley are middle school (241 | 47.4%), elementary school (100 | 19.7%), and high school (77 | 15.2%).
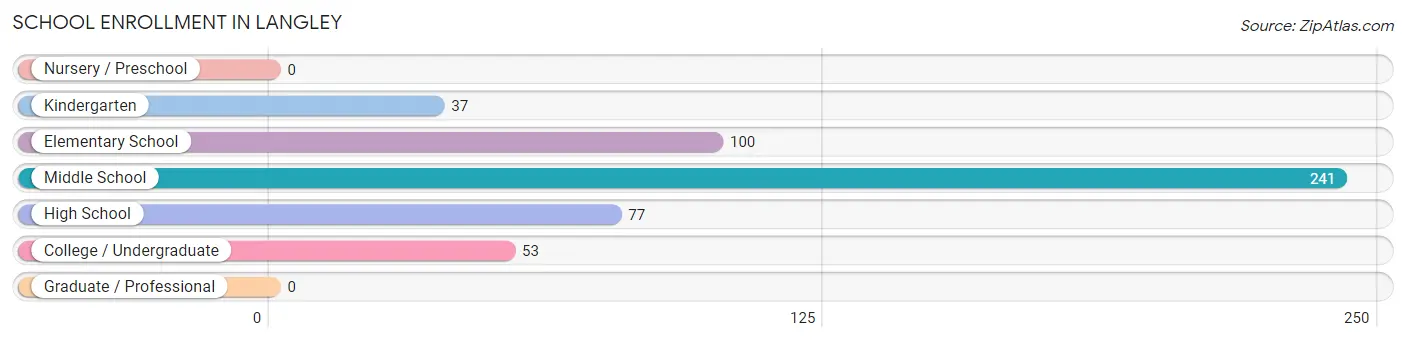
| School Level | # Students | % Students |
| Nursery / Preschool | 0 | 0.0% |
| Kindergarten | 37 | 7.3% |
| Elementary School | 100 | 19.7% |
| Middle School | 241 | 47.4% |
| High School | 77 | 15.2% |
| College / Undergraduate | 53 | 10.4% |
| Graduate / Professional | 0 | 0.0% |
| Total | 508 | 100.0% |
School Enrollment by Age by Funding Source in Langley
Out of a total of 508 students who are enrolled in schools in Langley, 81 (15.9%) attend a private institution, while the remaining 427 (84.1%) are enrolled in public schools. The age group of 20 to 24 year olds has the highest likelihood of being enrolled in private schools, with 23 (100.0% in the age bracket) enrolled. Conversely, the age group of 3 to 4 year olds has the lowest likelihood of being enrolled in a private school, with 13 (100.0% in the age bracket) attending a public institution.
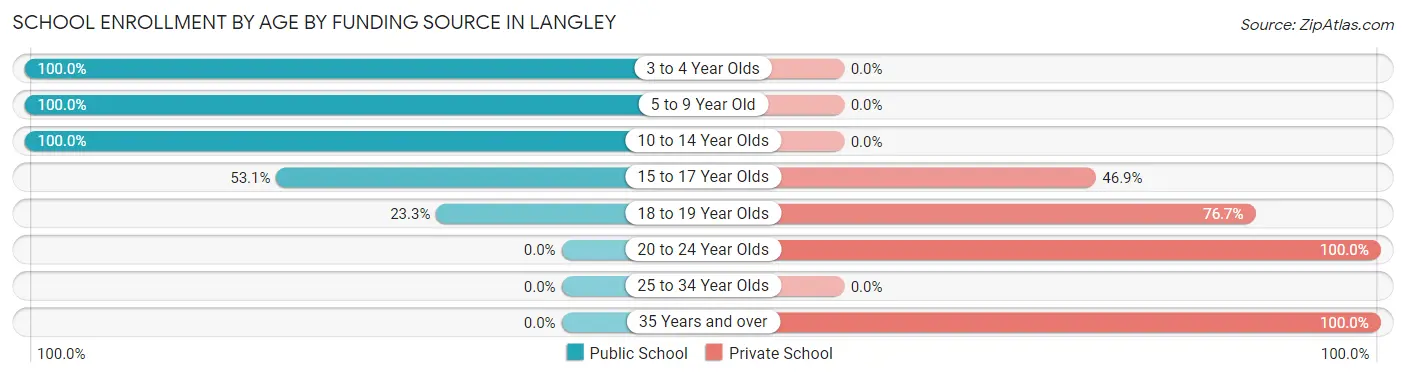
| Age Bracket | Public School | Private School |
| 3 to 4 Year Olds | 13 (100.0%) | 0 (0.0%) |
| 5 to 9 Year Old | 102 (100.0%) | 0 (0.0%) |
| 10 to 14 Year Olds | 271 (100.0%) | 0 (0.0%) |
| 15 to 17 Year Olds | 34 (53.1%) | 30 (46.9%) |
| 18 to 19 Year Olds | 7 (23.3%) | 23 (76.7%) |
| 20 to 24 Year Olds | 0 (0.0%) | 23 (100.0%) |
| 25 to 34 Year Olds | 0 (0.0%) | 0 (0.0%) |
| 35 Years and over | 0 (0.0%) | 5 (100.0%) |
| Total | 427 (84.1%) | 81 (15.9%) |
Educational Attainment by Field of Study in Langley
Education (40 | 87.0%), and science & technology (6 | 13.0%) are the most common fields of study among 46 individuals in Langley who have obtained a bachelor's degree or higher.
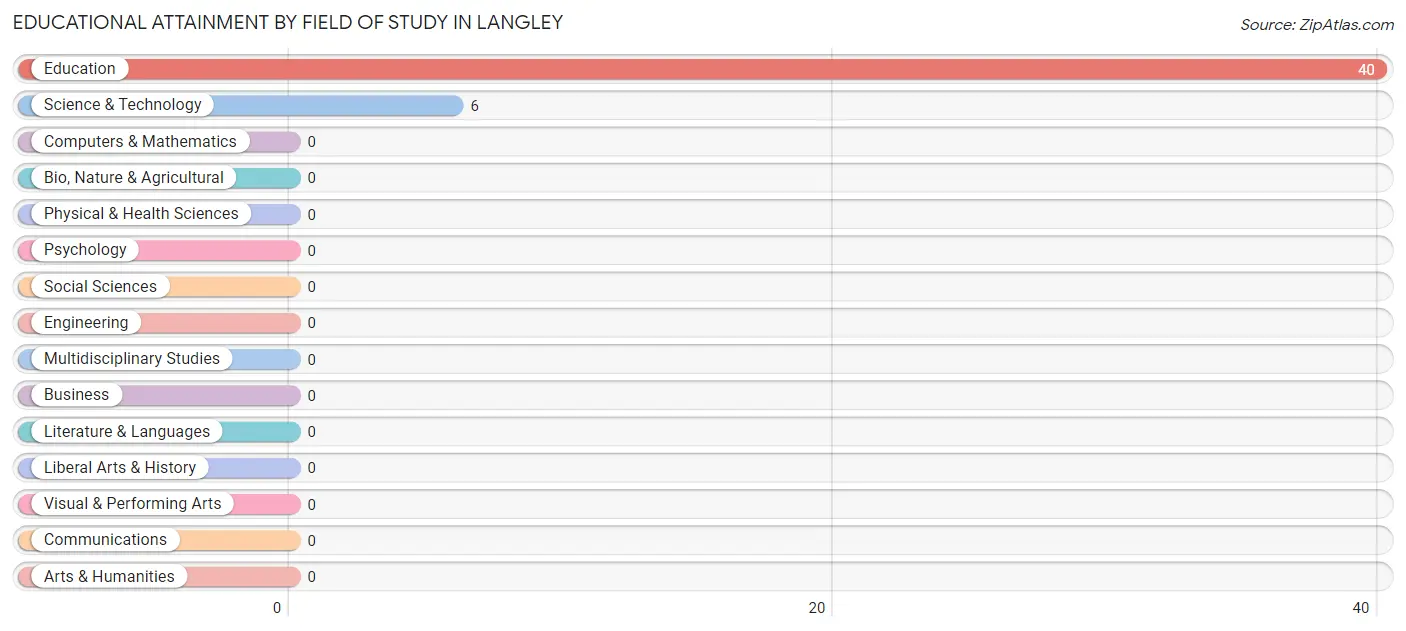
| Field of Study | # Graduates | % Graduates |
| Computers & Mathematics | 0 | 0.0% |
| Bio, Nature & Agricultural | 0 | 0.0% |
| Physical & Health Sciences | 0 | 0.0% |
| Psychology | 0 | 0.0% |
| Social Sciences | 0 | 0.0% |
| Engineering | 0 | 0.0% |
| Multidisciplinary Studies | 0 | 0.0% |
| Science & Technology | 6 | 13.0% |
| Business | 0 | 0.0% |
| Education | 40 | 87.0% |
| Literature & Languages | 0 | 0.0% |
| Liberal Arts & History | 0 | 0.0% |
| Visual & Performing Arts | 0 | 0.0% |
| Communications | 0 | 0.0% |
| Arts & Humanities | 0 | 0.0% |
| Total | 46 | 100.0% |
Transportation & Commute in Langley
Vehicle Availability by Sex in Langley
The most prevalent vehicle ownership categories in Langley are males with 2 vehicles (214, accounting for 58.3%) and females with 2 vehicles (150, making up 68.4%).
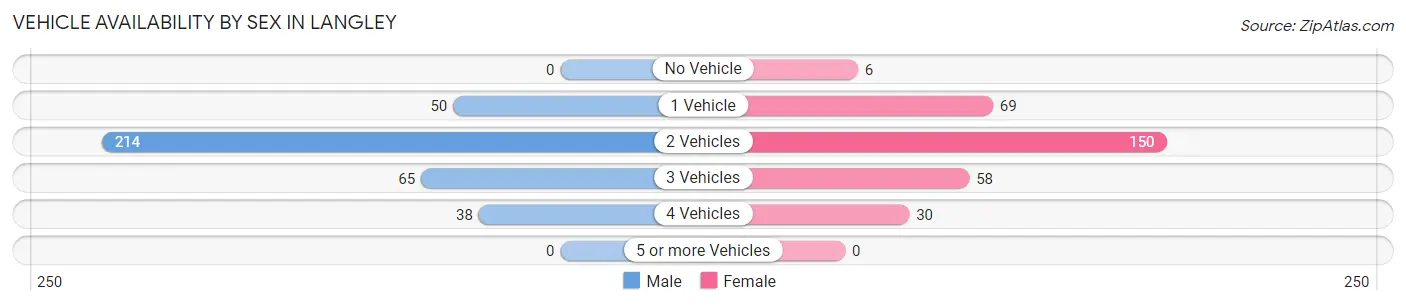
| Vehicles Available | Male | Female |
| No Vehicle | 0 (0.0%) | 6 (1.9%) |
| 1 Vehicle | 50 (13.6%) | 69 (22.0%) |
| 2 Vehicles | 214 (58.3%) | 150 (47.9%) |
| 3 Vehicles | 65 (17.7%) | 58 (18.5%) |
| 4 Vehicles | 38 (10.3%) | 30 (9.6%) |
| 5 or more Vehicles | 0 (0.0%) | 0 (0.0%) |
| Total | 367 (100.0%) | 313 (100.0%) |
Commute Time in Langley
The most frequently occuring commute durations in Langley are 20 to 24 minutes (190 commuters, 28.9%), 30 to 34 minutes (148 commuters, 22.5%), and 15 to 19 minutes (130 commuters, 19.8%).
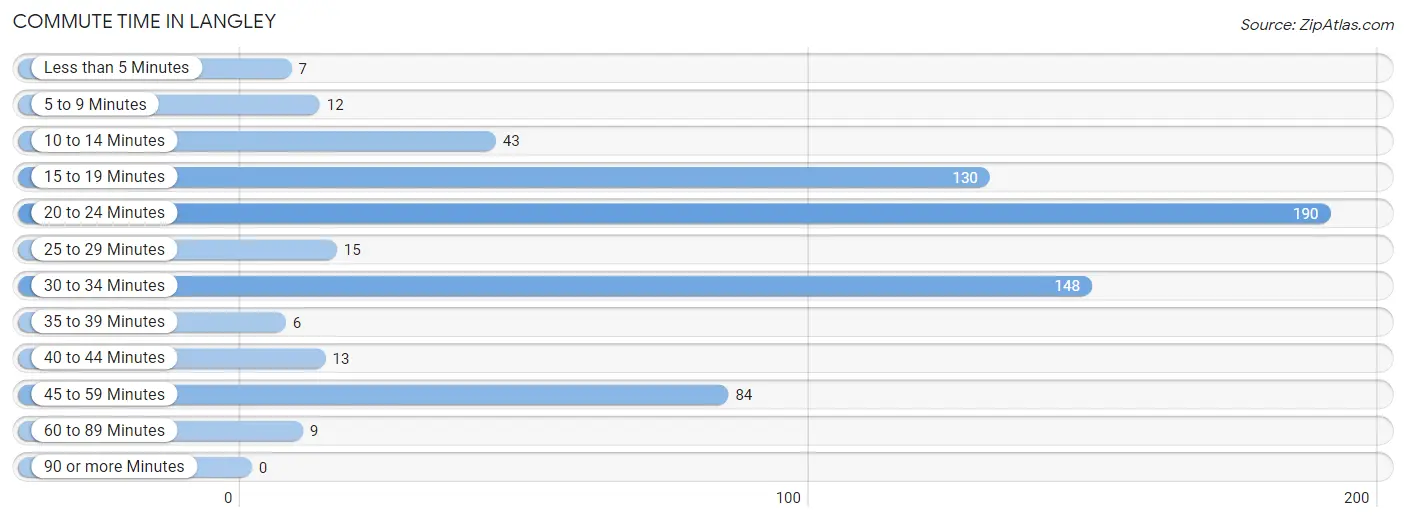
| Commute Time | # Commuters | % Commuters |
| Less than 5 Minutes | 7 | 1.1% |
| 5 to 9 Minutes | 12 | 1.8% |
| 10 to 14 Minutes | 43 | 6.5% |
| 15 to 19 Minutes | 130 | 19.8% |
| 20 to 24 Minutes | 190 | 28.9% |
| 25 to 29 Minutes | 15 | 2.3% |
| 30 to 34 Minutes | 148 | 22.5% |
| 35 to 39 Minutes | 6 | 0.9% |
| 40 to 44 Minutes | 13 | 2.0% |
| 45 to 59 Minutes | 84 | 12.8% |
| 60 to 89 Minutes | 9 | 1.4% |
| 90 or more Minutes | 0 | 0.0% |
Commute Time by Sex in Langley
The most common commute times in Langley are 20 to 24 minutes (92 commuters, 26.7%) for males and 20 to 24 minutes (98 commuters, 31.3%) for females.
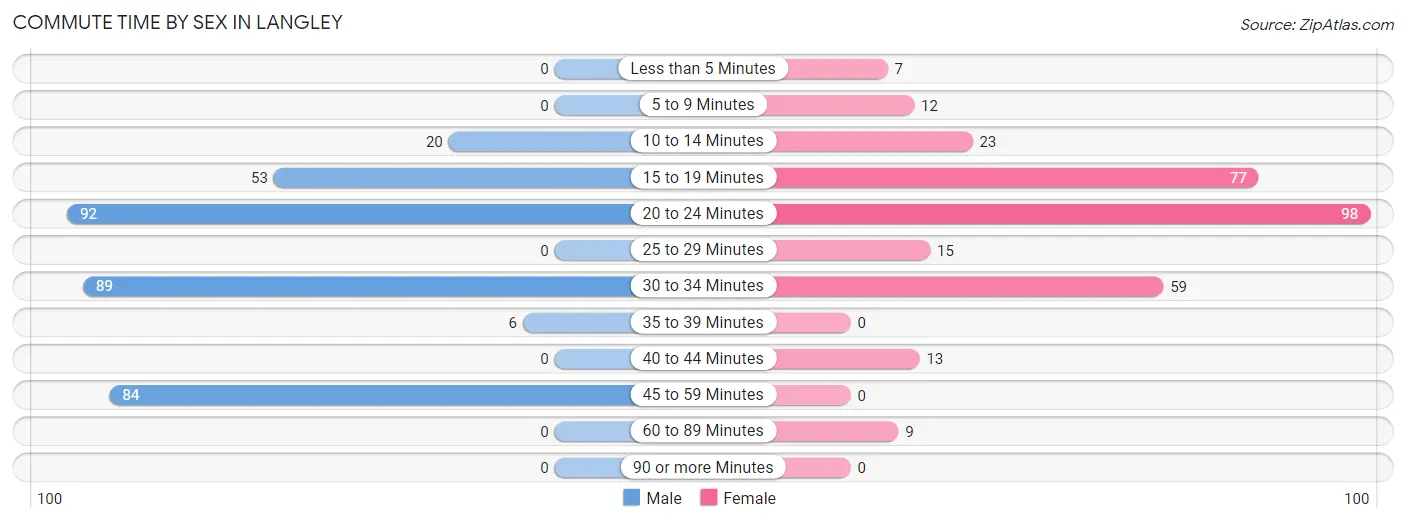
| Commute Time | Male | Female |
| Less than 5 Minutes | 0 (0.0%) | 7 (2.2%) |
| 5 to 9 Minutes | 0 (0.0%) | 12 (3.8%) |
| 10 to 14 Minutes | 20 (5.8%) | 23 (7.3%) |
| 15 to 19 Minutes | 53 (15.4%) | 77 (24.6%) |
| 20 to 24 Minutes | 92 (26.7%) | 98 (31.3%) |
| 25 to 29 Minutes | 0 (0.0%) | 15 (4.8%) |
| 30 to 34 Minutes | 89 (25.9%) | 59 (18.9%) |
| 35 to 39 Minutes | 6 (1.7%) | 0 (0.0%) |
| 40 to 44 Minutes | 0 (0.0%) | 13 (4.2%) |
| 45 to 59 Minutes | 84 (24.4%) | 0 (0.0%) |
| 60 to 89 Minutes | 0 (0.0%) | 9 (2.9%) |
| 90 or more Minutes | 0 (0.0%) | 0 (0.0%) |
Time of Departure to Work by Sex in Langley
The most frequent times of departure to work in Langley are 7:30 AM to 7:59 AM (117, 34.0%) for males and 12:00 AM to 4:59 AM (72, 23.0%) for females.
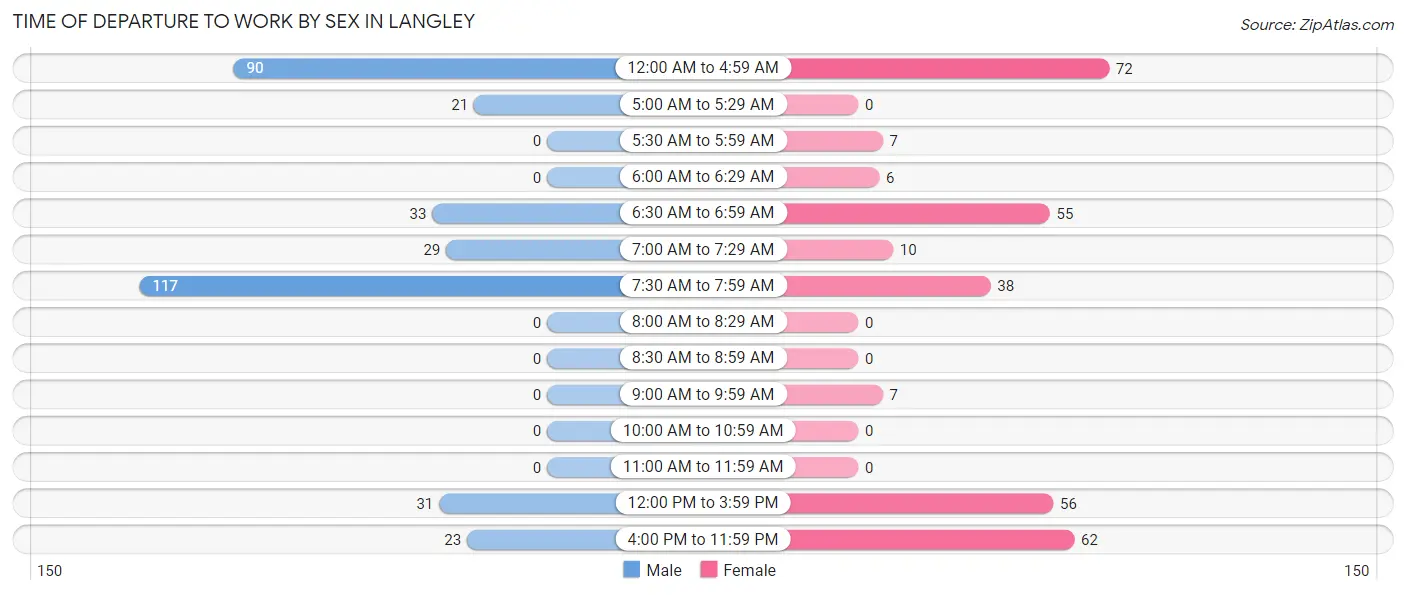
| Time of Departure | Male | Female |
| 12:00 AM to 4:59 AM | 90 (26.2%) | 72 (23.0%) |
| 5:00 AM to 5:29 AM | 21 (6.1%) | 0 (0.0%) |
| 5:30 AM to 5:59 AM | 0 (0.0%) | 7 (2.2%) |
| 6:00 AM to 6:29 AM | 0 (0.0%) | 6 (1.9%) |
| 6:30 AM to 6:59 AM | 33 (9.6%) | 55 (17.6%) |
| 7:00 AM to 7:29 AM | 29 (8.4%) | 10 (3.2%) |
| 7:30 AM to 7:59 AM | 117 (34.0%) | 38 (12.1%) |
| 8:00 AM to 8:29 AM | 0 (0.0%) | 0 (0.0%) |
| 8:30 AM to 8:59 AM | 0 (0.0%) | 0 (0.0%) |
| 9:00 AM to 9:59 AM | 0 (0.0%) | 7 (2.2%) |
| 10:00 AM to 10:59 AM | 0 (0.0%) | 0 (0.0%) |
| 11:00 AM to 11:59 AM | 0 (0.0%) | 0 (0.0%) |
| 12:00 PM to 3:59 PM | 31 (9.0%) | 56 (17.9%) |
| 4:00 PM to 11:59 PM | 23 (6.7%) | 62 (19.8%) |
| Total | 344 (100.0%) | 313 (100.0%) |
Housing Occupancy in Langley
Occupancy by Ownership in Langley
Of the total 561 dwellings in Langley, owner-occupied units account for 393 (70.1%), while renter-occupied units make up 168 (29.9%).
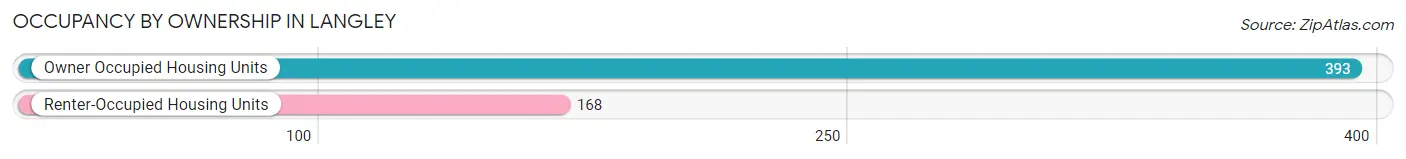
| Occupancy | # Housing Units | % Housing Units |
| Owner Occupied Housing Units | 393 | 70.1% |
| Renter-Occupied Housing Units | 168 | 29.9% |
| Total Occupied Housing Units | 561 | 100.0% |
Occupancy by Household Size in Langley
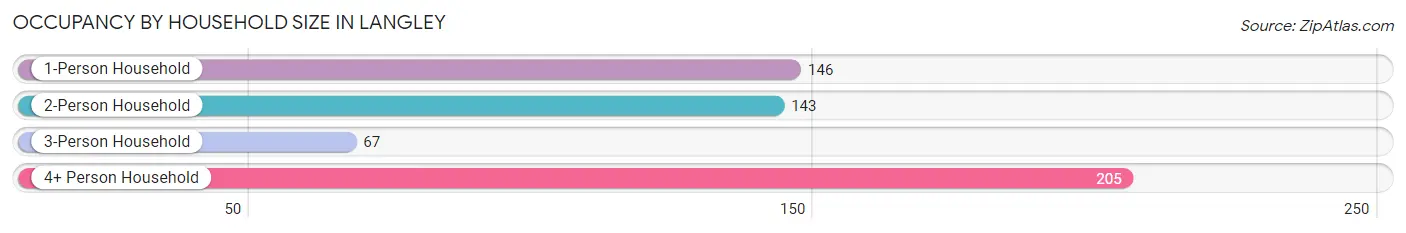
| Household Size | # Housing Units | % Housing Units |
| 1-Person Household | 146 | 26.0% |
| 2-Person Household | 143 | 25.5% |
| 3-Person Household | 67 | 11.9% |
| 4+ Person Household | 205 | 36.5% |
| Total Housing Units | 561 | 100.0% |
Occupancy by Ownership by Household Size in Langley
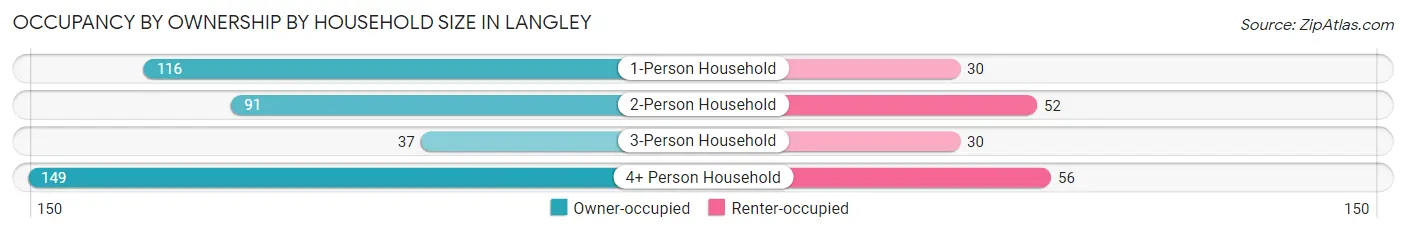
| Household Size | Owner-occupied | Renter-occupied |
| 1-Person Household | 116 (79.4%) | 30 (20.5%) |
| 2-Person Household | 91 (63.6%) | 52 (36.4%) |
| 3-Person Household | 37 (55.2%) | 30 (44.8%) |
| 4+ Person Household | 149 (72.7%) | 56 (27.3%) |
| Total Housing Units | 393 (70.1%) | 168 (29.9%) |
Occupancy by Educational Attainment in Langley
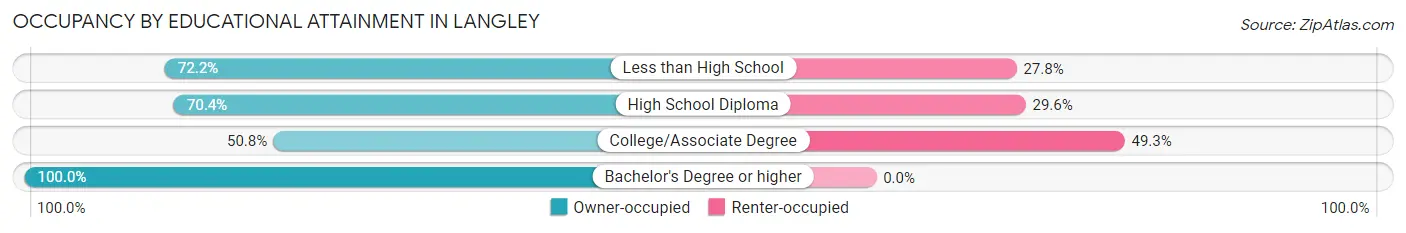
| Household Size | Owner-occupied | Renter-occupied |
| Less than High School | 96 (72.2%) | 37 (27.8%) |
| High School Diploma | 233 (70.4%) | 98 (29.6%) |
| College/Associate Degree | 34 (50.7%) | 33 (49.2%) |
| Bachelor's Degree or higher | 30 (100.0%) | 0 (0.0%) |
Occupancy by Age of Householder in Langley
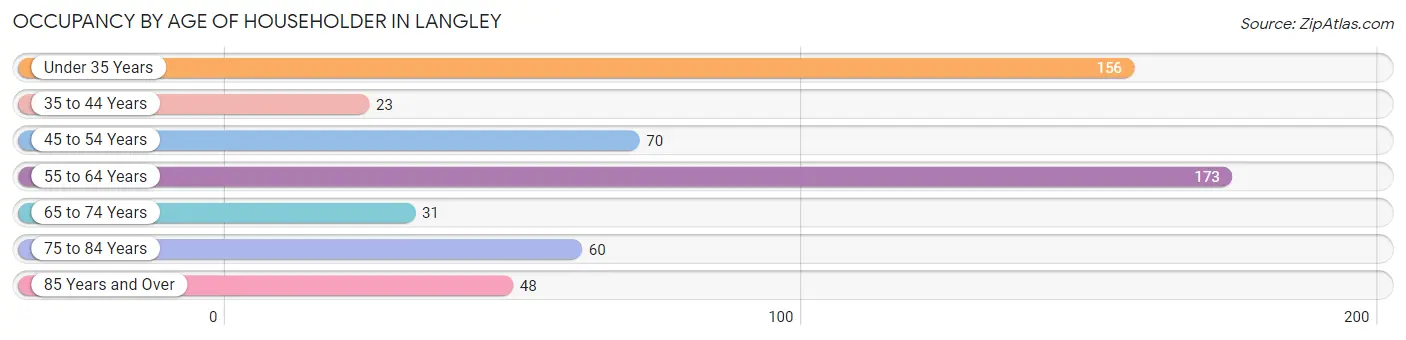
| Age Bracket | # Households | % Households |
| Under 35 Years | 156 | 27.8% |
| 35 to 44 Years | 23 | 4.1% |
| 45 to 54 Years | 70 | 12.5% |
| 55 to 64 Years | 173 | 30.8% |
| 65 to 74 Years | 31 | 5.5% |
| 75 to 84 Years | 60 | 10.7% |
| 85 Years and Over | 48 | 8.6% |
| Total | 561 | 100.0% |
Housing Finances in Langley
Median Income by Occupancy in Langley
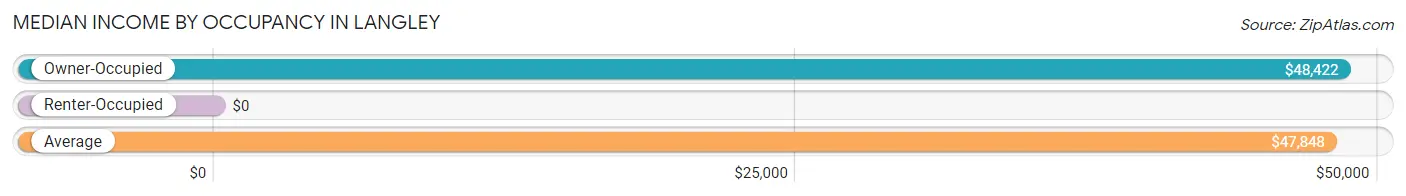
| Occupancy Type | # Households | Median Income |
| Owner-Occupied | 393 (70.1%) | $48,422 |
| Renter-Occupied | 168 (29.9%) | $0 |
| Average | 561 (100.0%) | $47,848 |
Occupancy by Householder Income Bracket in Langley
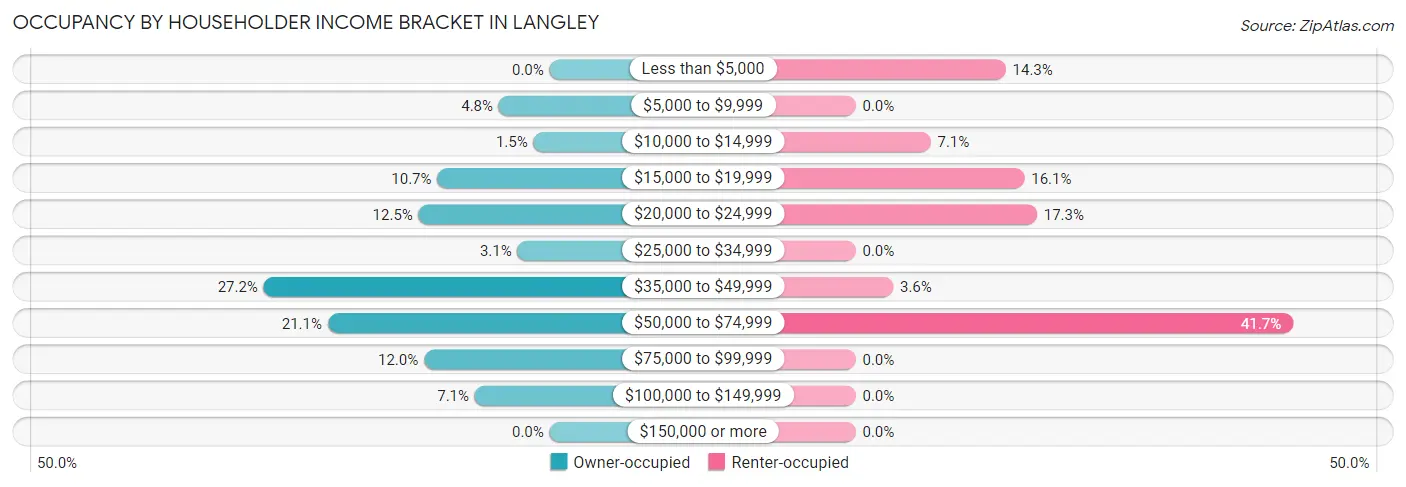
| Income Bracket | Owner-occupied | Renter-occupied |
| Less than $5,000 | 0 (0.0%) | 24 (14.3%) |
| $5,000 to $9,999 | 19 (4.8%) | 0 (0.0%) |
| $10,000 to $14,999 | 6 (1.5%) | 12 (7.1%) |
| $15,000 to $19,999 | 42 (10.7%) | 27 (16.1%) |
| $20,000 to $24,999 | 49 (12.5%) | 29 (17.3%) |
| $25,000 to $34,999 | 12 (3.0%) | 0 (0.0%) |
| $35,000 to $49,999 | 107 (27.2%) | 6 (3.6%) |
| $50,000 to $74,999 | 83 (21.1%) | 70 (41.7%) |
| $75,000 to $99,999 | 47 (12.0%) | 0 (0.0%) |
| $100,000 to $149,999 | 28 (7.1%) | 0 (0.0%) |
| $150,000 or more | 0 (0.0%) | 0 (0.0%) |
| Total | 393 (100.0%) | 168 (100.0%) |
Monthly Housing Cost Tiers in Langley
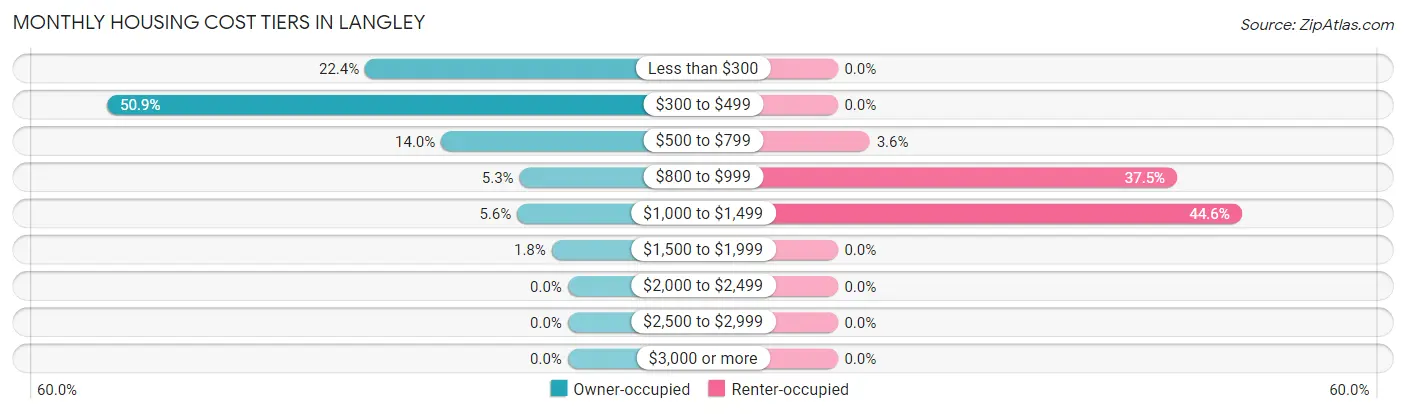
| Monthly Cost | Owner-occupied | Renter-occupied |
| Less than $300 | 88 (22.4%) | 0 (0.0%) |
| $300 to $499 | 200 (50.9%) | 0 (0.0%) |
| $500 to $799 | 55 (14.0%) | 6 (3.6%) |
| $800 to $999 | 21 (5.3%) | 63 (37.5%) |
| $1,000 to $1,499 | 22 (5.6%) | 75 (44.6%) |
| $1,500 to $1,999 | 7 (1.8%) | 0 (0.0%) |
| $2,000 to $2,499 | 0 (0.0%) | 0 (0.0%) |
| $2,500 to $2,999 | 0 (0.0%) | 0 (0.0%) |
| $3,000 or more | 0 (0.0%) | 0 (0.0%) |
| Total | 393 (100.0%) | 168 (100.0%) |
Physical Housing Characteristics in Langley
Housing Structures in Langley
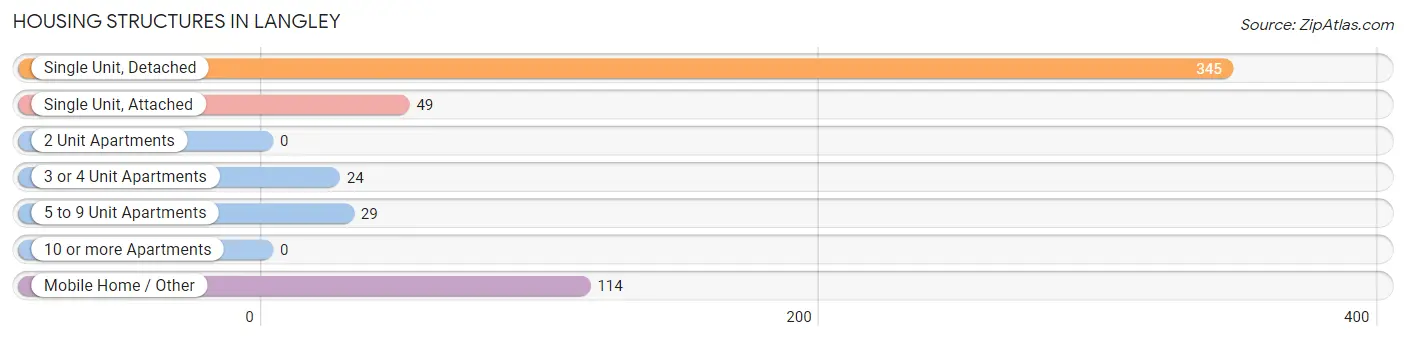
| Structure Type | # Housing Units | % Housing Units |
| Single Unit, Detached | 345 | 61.5% |
| Single Unit, Attached | 49 | 8.7% |
| 2 Unit Apartments | 0 | 0.0% |
| 3 or 4 Unit Apartments | 24 | 4.3% |
| 5 to 9 Unit Apartments | 29 | 5.2% |
| 10 or more Apartments | 0 | 0.0% |
| Mobile Home / Other | 114 | 20.3% |
| Total | 561 | 100.0% |
Housing Structures by Occupancy in Langley
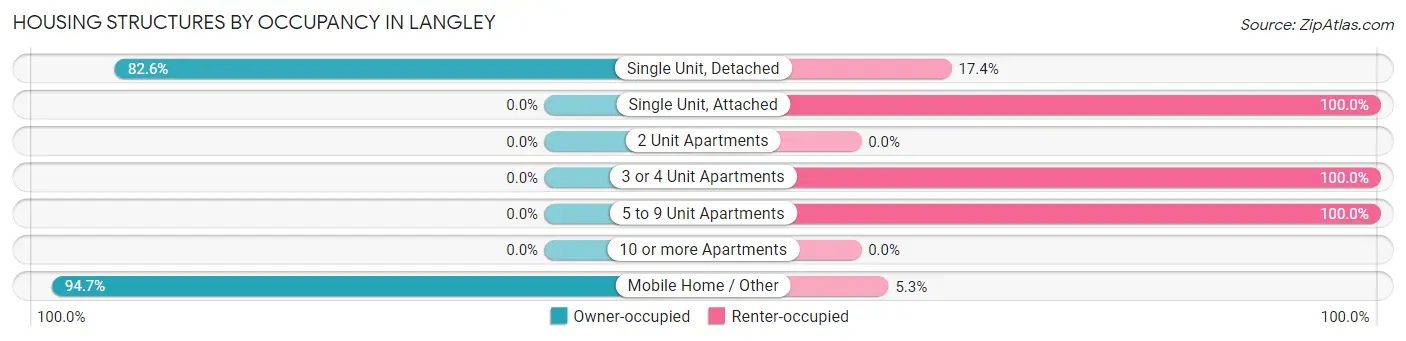
| Structure Type | Owner-occupied | Renter-occupied |
| Single Unit, Detached | 285 (82.6%) | 60 (17.4%) |
| Single Unit, Attached | 0 (0.0%) | 49 (100.0%) |
| 2 Unit Apartments | 0 (0.0%) | 0 (0.0%) |
| 3 or 4 Unit Apartments | 0 (0.0%) | 24 (100.0%) |
| 5 to 9 Unit Apartments | 0 (0.0%) | 29 (100.0%) |
| 10 or more Apartments | 0 (0.0%) | 0 (0.0%) |
| Mobile Home / Other | 108 (94.7%) | 6 (5.3%) |
| Total | 393 (70.1%) | 168 (29.9%) |
Housing Structures by Number of Rooms in Langley
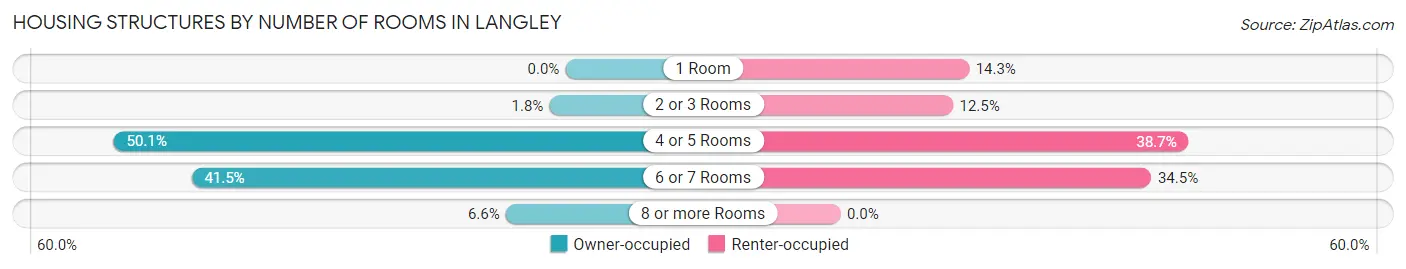
| Number of Rooms | Owner-occupied | Renter-occupied |
| 1 Room | 0 (0.0%) | 24 (14.3%) |
| 2 or 3 Rooms | 7 (1.8%) | 21 (12.5%) |
| 4 or 5 Rooms | 197 (50.1%) | 65 (38.7%) |
| 6 or 7 Rooms | 163 (41.5%) | 58 (34.5%) |
| 8 or more Rooms | 26 (6.6%) | 0 (0.0%) |
| Total | 393 (100.0%) | 168 (100.0%) |
Housing Structure by Heating Type in Langley
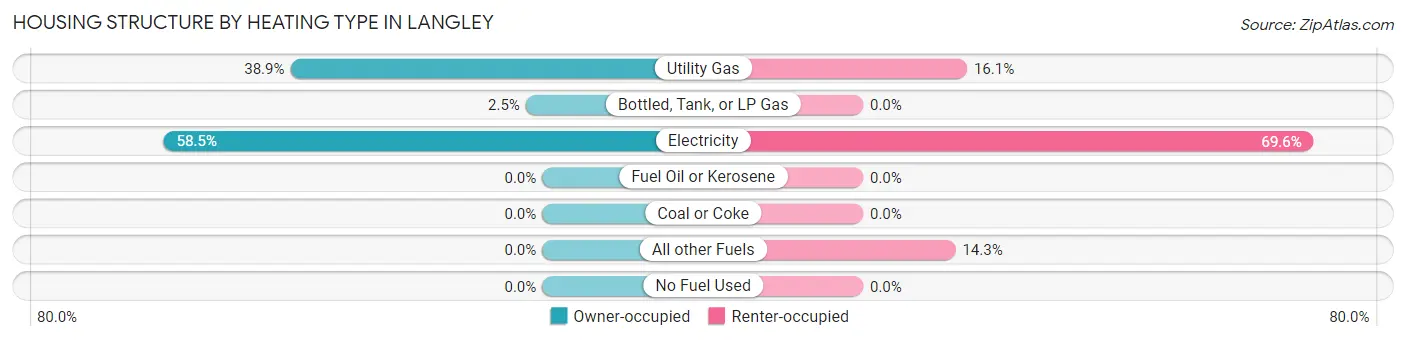
| Heating Type | Owner-occupied | Renter-occupied |
| Utility Gas | 153 (38.9%) | 27 (16.1%) |
| Bottled, Tank, or LP Gas | 10 (2.5%) | 0 (0.0%) |
| Electricity | 230 (58.5%) | 117 (69.6%) |
| Fuel Oil or Kerosene | 0 (0.0%) | 0 (0.0%) |
| Coal or Coke | 0 (0.0%) | 0 (0.0%) |
| All other Fuels | 0 (0.0%) | 24 (14.3%) |
| No Fuel Used | 0 (0.0%) | 0 (0.0%) |
| Total | 393 (100.0%) | 168 (100.0%) |
Household Vehicle Usage in Langley
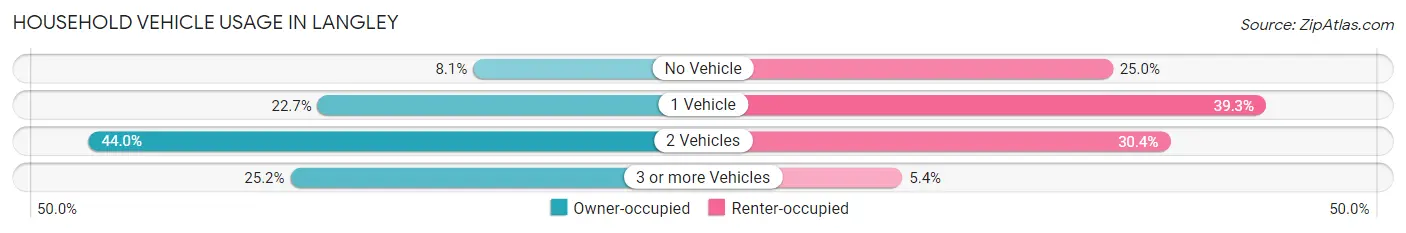
| Vehicles per Household | Owner-occupied | Renter-occupied |
| No Vehicle | 32 (8.1%) | 42 (25.0%) |
| 1 Vehicle | 89 (22.7%) | 66 (39.3%) |
| 2 Vehicles | 173 (44.0%) | 51 (30.4%) |
| 3 or more Vehicles | 99 (25.2%) | 9 (5.4%) |
| Total | 393 (100.0%) | 168 (100.0%) |
Real Estate & Mortgages in Langley
Real Estate and Mortgage Overview in Langley
| Characteristic | Without Mortgage | With Mortgage |
| Housing Units | 312 | 81 |
| Median Property Value | $32,100 | $0 |
| Median Household Income | $46,842 | $0 |
| Monthly Housing Costs | $419 | $0 |
| Real Estate Taxes | $199 | $0 |
Property Value by Mortgage Status in Langley
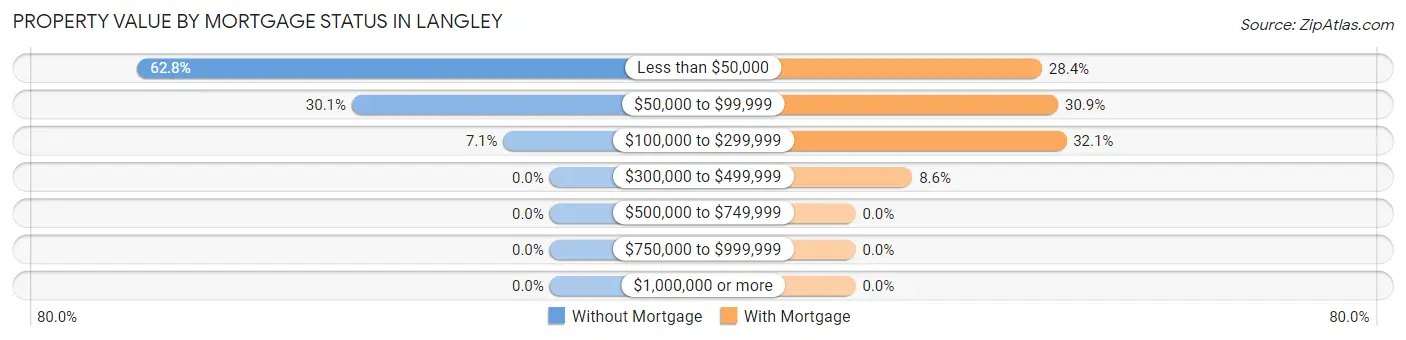
| Property Value | Without Mortgage | With Mortgage |
| Less than $50,000 | 196 (62.8%) | 23 (28.4%) |
| $50,000 to $99,999 | 94 (30.1%) | 25 (30.9%) |
| $100,000 to $299,999 | 22 (7.0%) | 26 (32.1%) |
| $300,000 to $499,999 | 0 (0.0%) | 7 (8.6%) |
| $500,000 to $749,999 | 0 (0.0%) | 0 (0.0%) |
| $750,000 to $999,999 | 0 (0.0%) | 0 (0.0%) |
| $1,000,000 or more | 0 (0.0%) | 0 (0.0%) |
| Total | 312 (100.0%) | 81 (100.0%) |
Household Income by Mortgage Status in Langley
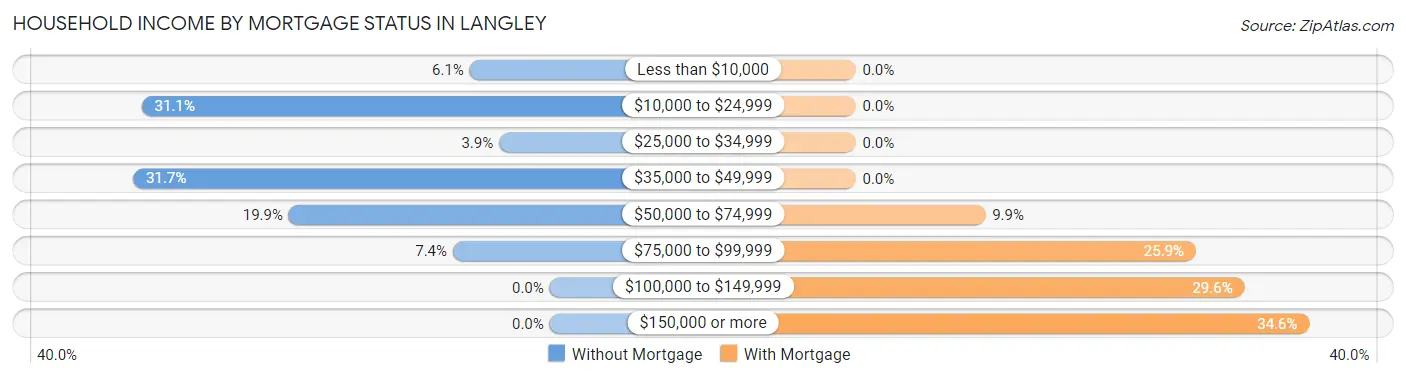
| Household Income | Without Mortgage | With Mortgage |
| Less than $10,000 | 19 (6.1%) | 0 (0.0%) |
| $10,000 to $24,999 | 97 (31.1%) | 0 (0.0%) |
| $25,000 to $34,999 | 12 (3.8%) | 0 (0.0%) |
| $35,000 to $49,999 | 99 (31.7%) | 0 (0.0%) |
| $50,000 to $74,999 | 62 (19.9%) | 8 (9.9%) |
| $75,000 to $99,999 | 23 (7.4%) | 21 (25.9%) |
| $100,000 to $149,999 | 0 (0.0%) | 24 (29.6%) |
| $150,000 or more | 0 (0.0%) | 28 (34.6%) |
| Total | 312 (100.0%) | 81 (100.0%) |
Property Value to Household Income Ratio in Langley
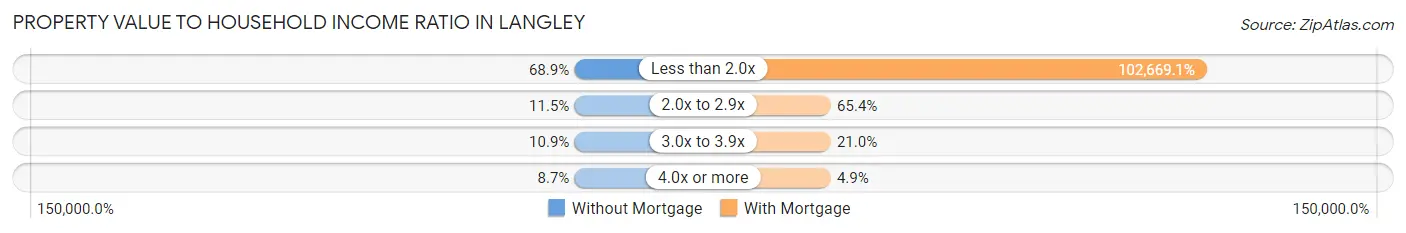
| Value-to-Income Ratio | Without Mortgage | With Mortgage |
| Less than 2.0x | 215 (68.9%) | 83,162 (102,669.1%) |
| 2.0x to 2.9x | 36 (11.5%) | 53 (65.4%) |
| 3.0x to 3.9x | 34 (10.9%) | 17 (21.0%) |
| 4.0x or more | 27 (8.6%) | 4 (4.9%) |
| Total | 312 (100.0%) | 81 (100.0%) |
Real Estate Taxes by Mortgage Status in Langley
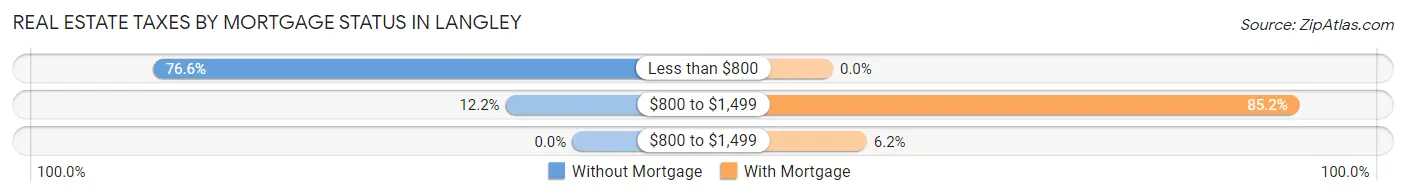
| Property Taxes | Without Mortgage | With Mortgage |
| Less than $800 | 239 (76.6%) | 0 (0.0%) |
| $800 to $1,499 | 38 (12.2%) | 69 (85.2%) |
| $800 to $1,499 | 0 (0.0%) | 5 (6.2%) |
| Total | 312 (100.0%) | 81 (100.0%) |
Health & Disability in Langley
Health Insurance Coverage by Age in Langley
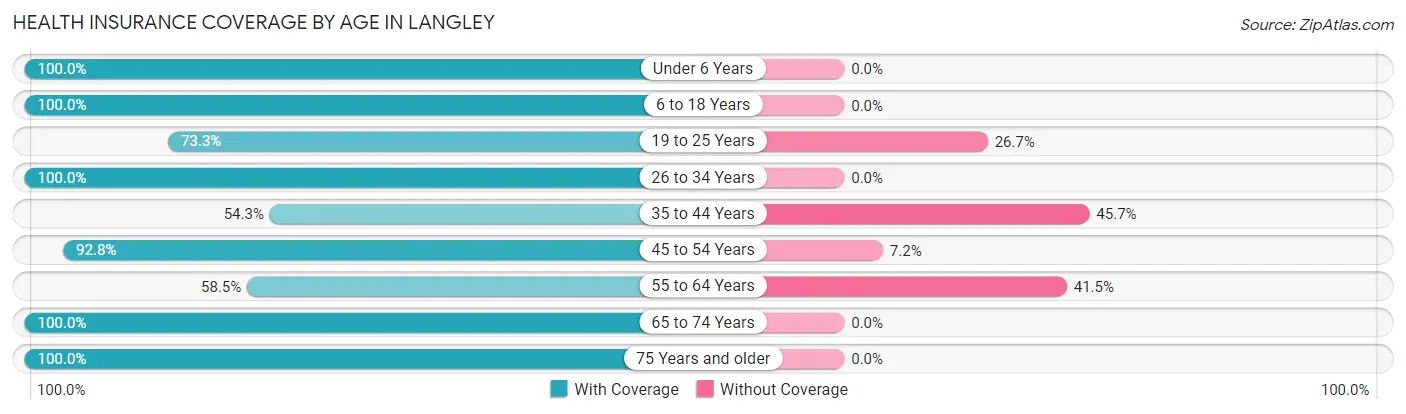
| Age Bracket | With Coverage | Without Coverage |
| Under 6 Years | 140 (100.0%) | 0 (0.0%) |
| 6 to 18 Years | 437 (100.0%) | 0 (0.0%) |
| 19 to 25 Years | 126 (73.3%) | 46 (26.7%) |
| 26 to 34 Years | 287 (100.0%) | 0 (0.0%) |
| 35 to 44 Years | 57 (54.3%) | 48 (45.7%) |
| 45 to 54 Years | 116 (92.8%) | 9 (7.2%) |
| 55 to 64 Years | 141 (58.5%) | 100 (41.5%) |
| 65 to 74 Years | 108 (100.0%) | 0 (0.0%) |
| 75 Years and older | 128 (100.0%) | 0 (0.0%) |
| Total | 1,540 (88.3%) | 203 (11.7%) |
Health Insurance Coverage by Citizenship Status in Langley
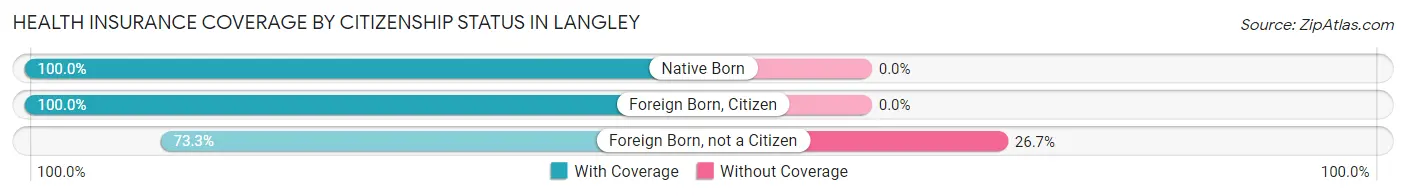
| Citizenship Status | With Coverage | Without Coverage |
| Native Born | 140 (100.0%) | 0 (0.0%) |
| Foreign Born, Citizen | 437 (100.0%) | 0 (0.0%) |
| Foreign Born, not a Citizen | 126 (73.3%) | 46 (26.7%) |
Health Insurance Coverage by Household Income in Langley

| Household Income | With Coverage | Without Coverage |
| Under $25,000 | 376 (80.9%) | 89 (19.1%) |
| $25,000 to $49,999 | 468 (100.0%) | 0 (0.0%) |
| $50,000 to $74,999 | 390 (81.1%) | 91 (18.9%) |
| $75,000 to $99,999 | 122 (84.1%) | 23 (15.9%) |
| $100,000 and over | 184 (100.0%) | 0 (0.0%) |
Public vs Private Health Insurance Coverage by Age in Langley
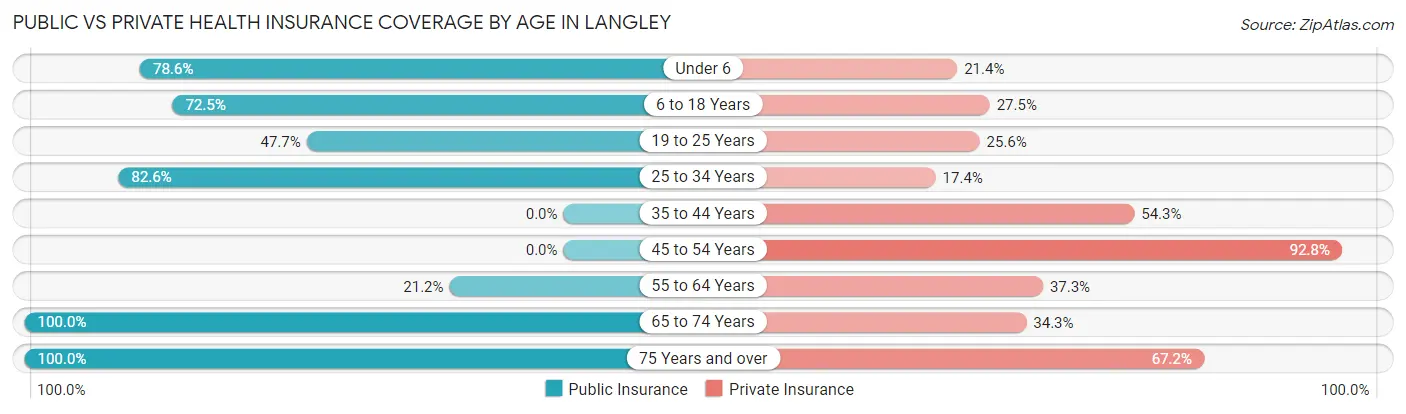
| Age Bracket | Public Insurance | Private Insurance |
| Under 6 | 110 (78.6%) | 30 (21.4%) |
| 6 to 18 Years | 317 (72.5%) | 120 (27.5%) |
| 19 to 25 Years | 82 (47.7%) | 44 (25.6%) |
| 25 to 34 Years | 237 (82.6%) | 50 (17.4%) |
| 35 to 44 Years | 0 (0.0%) | 57 (54.3%) |
| 45 to 54 Years | 0 (0.0%) | 116 (92.8%) |
| 55 to 64 Years | 51 (21.2%) | 90 (37.3%) |
| 65 to 74 Years | 108 (100.0%) | 37 (34.3%) |
| 75 Years and over | 128 (100.0%) | 86 (67.2%) |
| Total | 1,033 (59.3%) | 630 (36.1%) |
Disability Status by Sex by Age in Langley
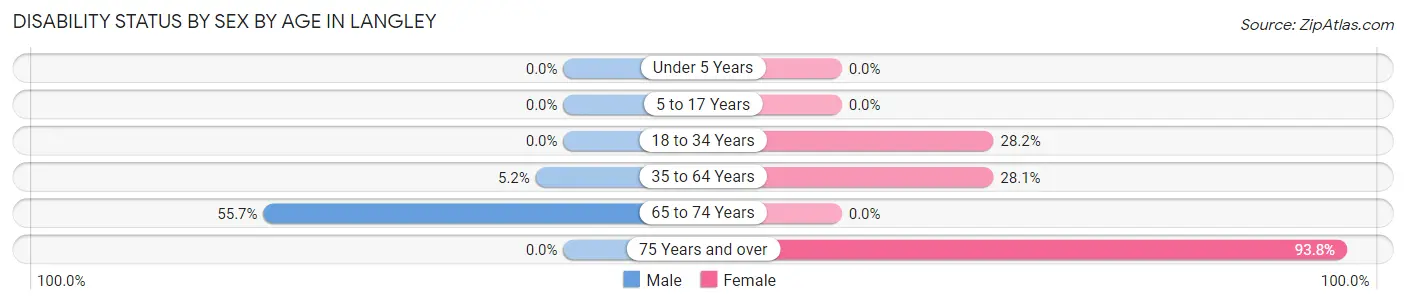
| Age Bracket | Male | Female |
| Under 5 Years | 0 (0.0%) | 0 (0.0%) |
| 5 to 17 Years | 0 (0.0%) | 0 (0.0%) |
| 18 to 34 Years | 0 (0.0%) | 71 (28.2%) |
| 35 to 64 Years | 14 (5.1%) | 56 (28.1%) |
| 65 to 74 Years | 49 (55.7%) | 0 (0.0%) |
| 75 Years and over | 0 (0.0%) | 75 (93.8%) |
Disability Class by Sex by Age in Langley
Disability Class: Hearing Difficulty
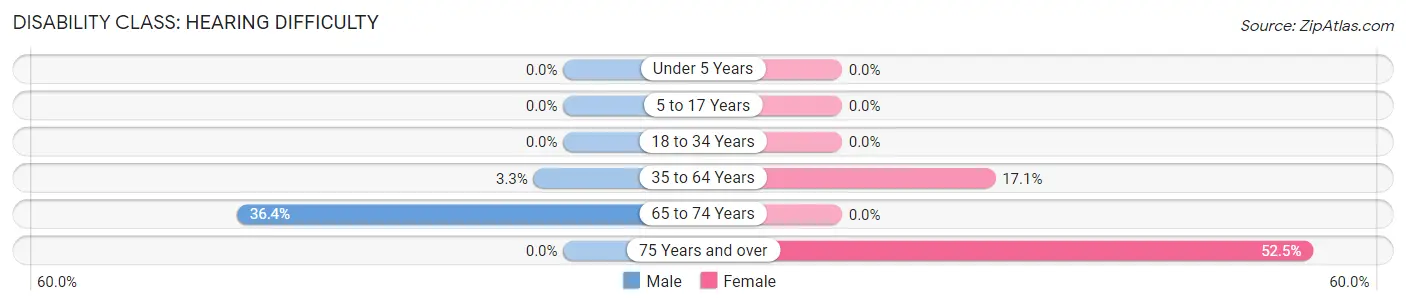
| Age Bracket | Male | Female |
| Under 5 Years | 0 (0.0%) | 0 (0.0%) |
| 5 to 17 Years | 0 (0.0%) | 0 (0.0%) |
| 18 to 34 Years | 0 (0.0%) | 0 (0.0%) |
| 35 to 64 Years | 9 (3.3%) | 34 (17.1%) |
| 65 to 74 Years | 32 (36.4%) | 0 (0.0%) |
| 75 Years and over | 0 (0.0%) | 42 (52.5%) |
Disability Class: Vision Difficulty
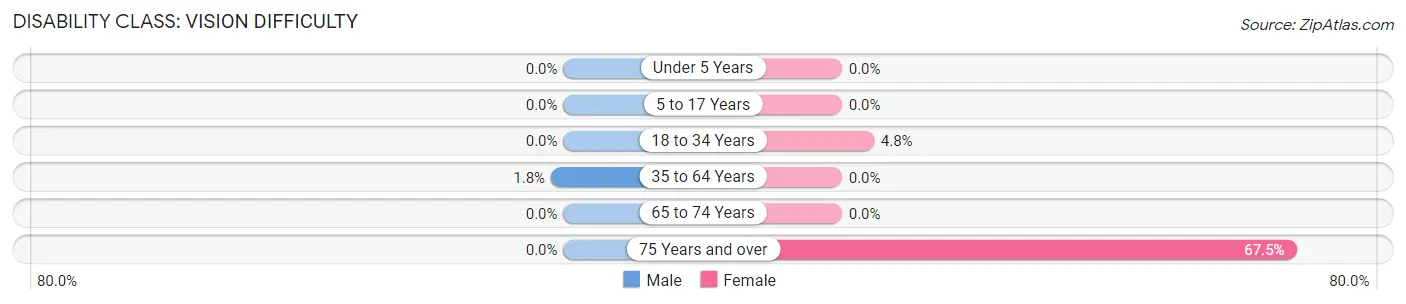
| Age Bracket | Male | Female |
| Under 5 Years | 0 (0.0%) | 0 (0.0%) |
| 5 to 17 Years | 0 (0.0%) | 0 (0.0%) |
| 18 to 34 Years | 0 (0.0%) | 12 (4.8%) |
| 35 to 64 Years | 5 (1.8%) | 0 (0.0%) |
| 65 to 74 Years | 0 (0.0%) | 0 (0.0%) |
| 75 Years and over | 0 (0.0%) | 54 (67.5%) |
Disability Class: Cognitive Difficulty
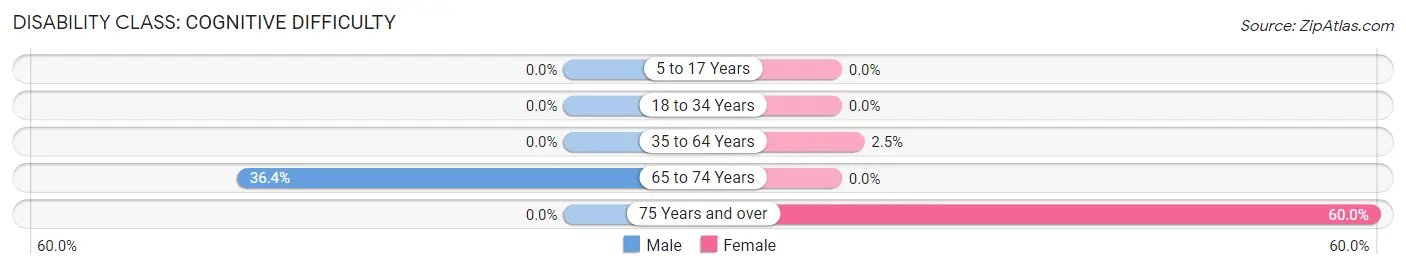
| Age Bracket | Male | Female |
| 5 to 17 Years | 0 (0.0%) | 0 (0.0%) |
| 18 to 34 Years | 0 (0.0%) | 0 (0.0%) |
| 35 to 64 Years | 0 (0.0%) | 5 (2.5%) |
| 65 to 74 Years | 32 (36.4%) | 0 (0.0%) |
| 75 Years and over | 0 (0.0%) | 48 (60.0%) |
Disability Class: Ambulatory Difficulty
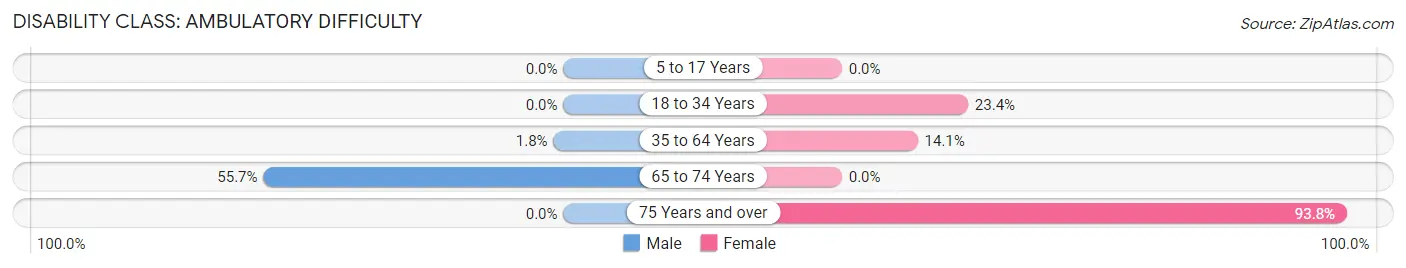
| Age Bracket | Male | Female |
| 5 to 17 Years | 0 (0.0%) | 0 (0.0%) |
| 18 to 34 Years | 0 (0.0%) | 59 (23.4%) |
| 35 to 64 Years | 5 (1.8%) | 28 (14.1%) |
| 65 to 74 Years | 49 (55.7%) | 0 (0.0%) |
| 75 Years and over | 0 (0.0%) | 75 (93.8%) |
Disability Class: Self-Care Difficulty
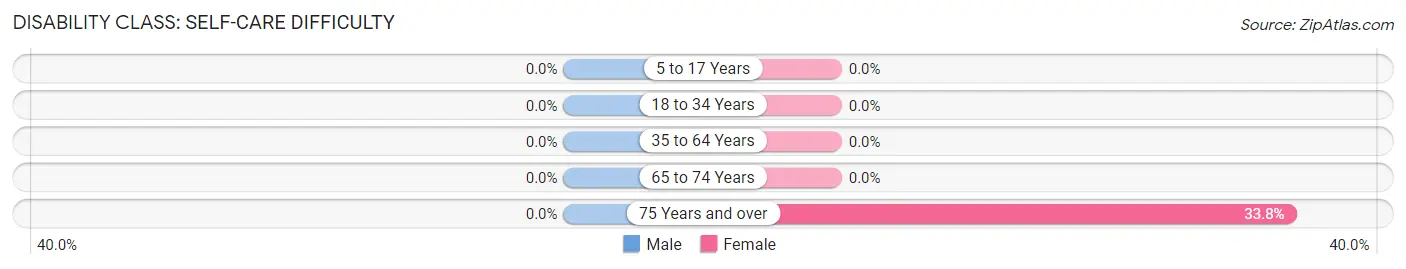
| Age Bracket | Male | Female |
| 5 to 17 Years | 0 (0.0%) | 0 (0.0%) |
| 18 to 34 Years | 0 (0.0%) | 0 (0.0%) |
| 35 to 64 Years | 0 (0.0%) | 0 (0.0%) |
| 65 to 74 Years | 0 (0.0%) | 0 (0.0%) |
| 75 Years and over | 0 (0.0%) | 27 (33.8%) |
Technology Access in Langley
Computing Device Access in Langley
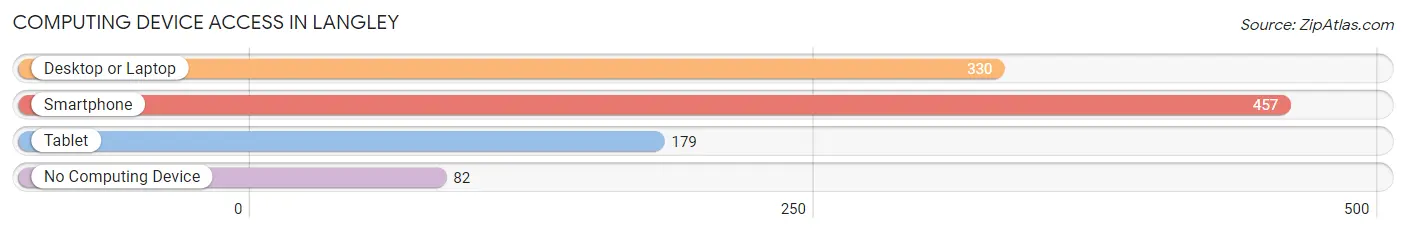
| Device Type | # Households | % Households |
| Desktop or Laptop | 330 | 58.8% |
| Smartphone | 457 | 81.5% |
| Tablet | 179 | 31.9% |
| No Computing Device | 82 | 14.6% |
| Total | 561 | 100.0% |
Internet Access in Langley
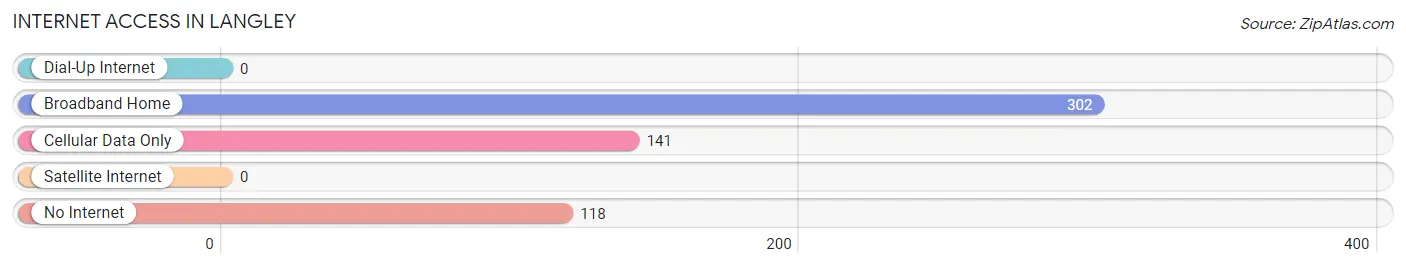
| Internet Type | # Households | % Households |
| Dial-Up Internet | 0 | 0.0% |
| Broadband Home | 302 | 53.8% |
| Cellular Data Only | 141 | 25.1% |
| Satellite Internet | 0 | 0.0% |
| No Internet | 118 | 21.0% |
| Total | 561 | 100.0% |
Langley Summary
Langley is a small town located in Aiken County, South Carolina. It is situated in the western part of the state, about 25 miles from Augusta, Georgia. The town has a population of approximately 1,500 people and is part of the Augusta-Aiken metropolitan area.
Geography
Langley is located in the western part of Aiken County, South Carolina. It is situated in the Savannah River Valley, which is part of the larger Piedmont region of the state. The town is located on the banks of the Savannah River, which forms the border between South Carolina and Georgia. The town is surrounded by rolling hills and forests, and is located near the Savannah River National Wildlife Refuge.
The climate in Langley is humid subtropical, with hot, humid summers and mild winters. The average annual temperature is around 70 degrees Fahrenheit, with average highs in the summer reaching the mid-90s and lows in the winter dipping into the mid-30s. The town receives an average of 48 inches of precipitation per year, with most of it falling in the summer months.
Economy
Langley’s economy is largely based on agriculture and manufacturing. The town is home to several large farms, which produce a variety of crops, including cotton, corn, soybeans, and peanuts. The town also has several manufacturing plants, which produce a variety of products, including furniture, textiles, and automotive parts.
The town is also home to several small businesses, including restaurants, retail stores, and service providers. The town is also home to a number of tourist attractions, including the Savannah River National Wildlife Refuge, the Aiken County Historical Museum, and the Langley Speedway.
Demographics
As of the 2010 census, the population of Langley was 1,521. The racial makeup of the town was 79.3% White, 17.2% African American, 0.3% Native American, 0.7% Asian, 0.1% Pacific Islander, and 2.4% from other races. Hispanic or Latino of any race were 2.7% of the population.
The median household income in Langley was $37,917, and the median family income was $45,938. The per capita income for the town was $19,945. About 15.3% of families and 18.2% of the population were below the poverty line, including 25.2% of those under age 18 and 11.2% of those age 65 or over.
Conclusion
Langley is a small town located in Aiken County, South Carolina. It is situated in the western part of the state, about 25 miles from Augusta, Georgia. The town has a population of approximately 1,500 people and is part of the Augusta-Aiken metropolitan area. The town’s economy is largely based on agriculture and manufacturing, and it is home to several tourist attractions. The town has a diverse population, with a median household income of $37,917 and a median family income of $45,938.
Common Questions
What is Per Capita Income in Langley?
Per Capita income in Langley is $15,223.
What is the Median Family Income in Langley?
Median Family Income in Langley is $46,667.
What is the Median Household income in Langley?
Median Household Income in Langley is $47,848.
What is Income or Wage Gap in Langley?
Income or Wage Gap in Langley is 53.4%.
Women in Langley earn 46.6 cents for every dollar earned by a man.
What is Family Income Deficit in Langley?
Family Income Deficit in Langley is $12,374.
Families that are below poverty line in Langley earn $12,374 less on average than the poverty threshold level.
What is Inequality or Gini Index in Langley?
Inequality or Gini Index in Langley is 0.35.
What is the Total Population of Langley?
Total Population of Langley is 1,776.
What is the Total Male Population of Langley?
Total Male Population of Langley is 903.
What is the Total Female Population of Langley?
Total Female Population of Langley is 873.
What is the Ratio of Males per 100 Females in Langley?
There are 103.44 Males per 100 Females in Langley.
What is the Ratio of Females per 100 Males in Langley?
There are 96.68 Females per 100 Males in Langley.
What is the Median Population Age in Langley?
Median Population Age in Langley is 29.7 Years.
What is the Average Family Size in Langley
Average Family Size in Langley is 3.5 People.
What is the Average Household Size in Langley
Average Household Size in Langley is 3.2 People.
How Large is the Labor Force in Langley?
There are 765 People in the Labor Forcein in Langley.
What is the Percentage of People in the Labor Force in Langley?
61.7% of People are in the Labor Force in Langley.
What is the Unemployment Rate in Langley?
Unemployment Rate in Langley is 11.6%.