Homeland Park, SC Map & Demographics
Homeland Park Map
Homeland Park Overview
$19,621
PER CAPITA INCOME
$39,933
AVG FAMILY INCOME
$37,308
AVG HOUSEHOLD INCOME
17.0%
WAGE / INCOME GAP [ % ]
83.0¢/ $1
WAGE / INCOME GAP [ $ ]
0.48
INEQUALITY / GINI INDEX
7,451
TOTAL POPULATION
3,451
MALE POPULATION
4,000
FEMALE POPULATION
86.28
MALES / 100 FEMALES
115.91
FEMALES / 100 MALES
40.8
MEDIAN AGE
3.0
AVG FAMILY SIZE
2.5
AVG HOUSEHOLD SIZE
3,545
LABOR FORCE [ PEOPLE ]
58.1%
PERCENT IN LABOR FORCE
13.2%
UNEMPLOYMENT RATE
Income in Homeland Park
Income Overview in Homeland Park
Per Capita Income in Homeland Park is $19,621, while median incomes of families and households are $39,933 and $37,308 respectively.
| Characteristic | Number | Measure |
| Per Capita Income | 7,451 | $19,621 |
| Median Family Income | 2,112 | $39,933 |
| Mean Family Income | 2,112 | $46,830 |
| Median Household Income | 2,932 | $37,308 |
| Mean Household Income | 2,932 | $48,408 |
| Income Deficit | 2,112 | $0 |
| Wage / Income Gap (%) | 7,451 | 17.01% |
| Wage / Income Gap ($) | 7,451 | 82.99¢ per $1 |
| Gini / Inequality Index | 7,451 | 0.48 |
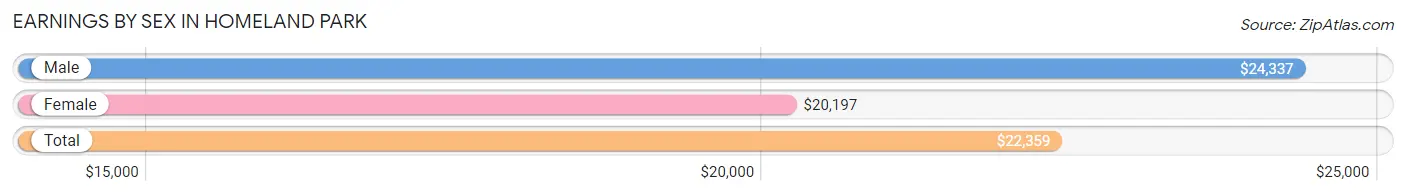
Earnings by Sex in Homeland Park
Average Earnings in Homeland Park are $22,359, $24,337 for men and $20,197 for women, a difference of 17.0%.
| Sex | Number | Average Earnings |
| Male | 1,738 (49.9%) | $24,337 |
| Female | 1,743 (50.1%) | $20,197 |
| Total | 3,481 (100.0%) | $22,359 |
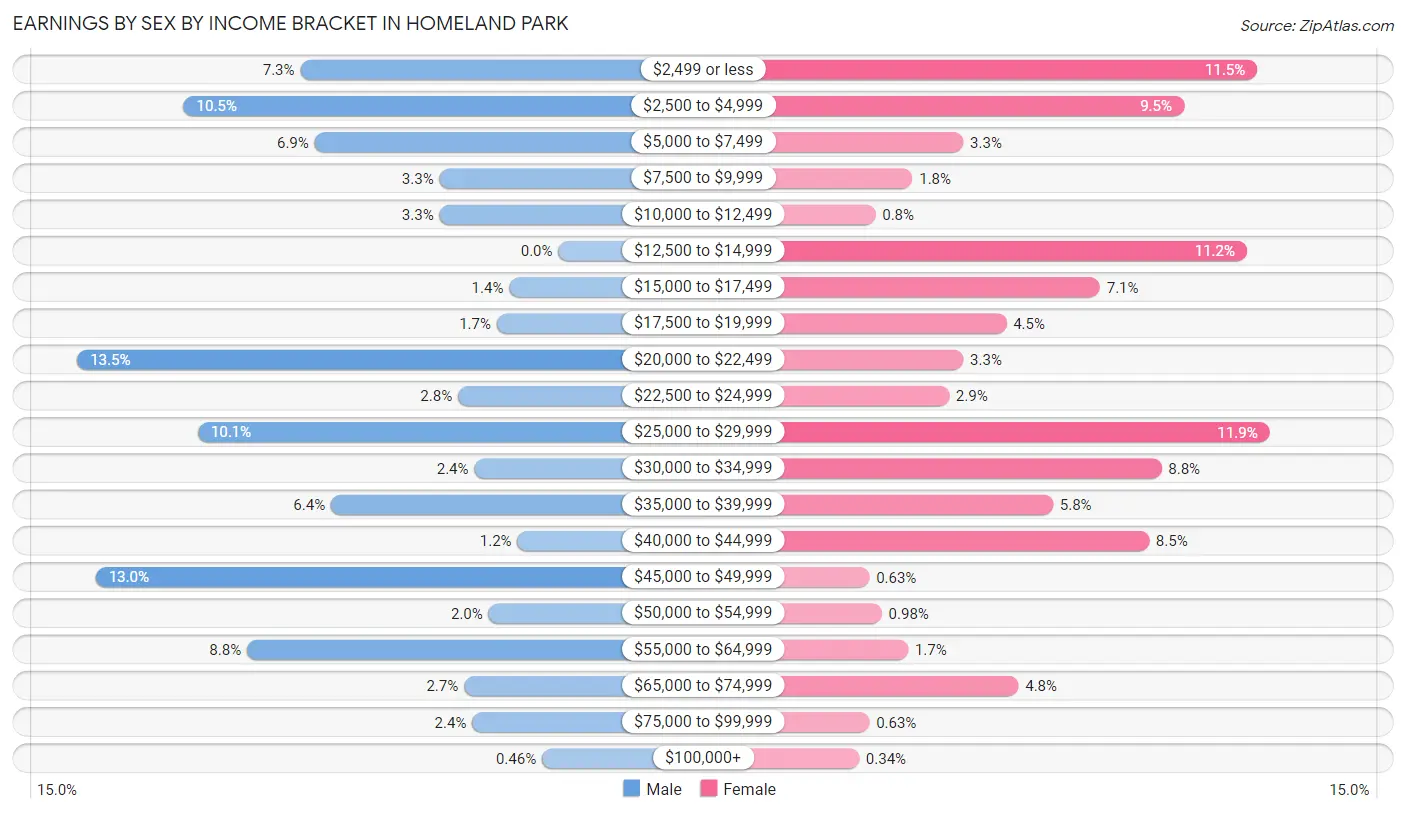
Earnings by Sex by Income Bracket in Homeland Park
The most common earnings brackets in Homeland Park are $20,000 to $22,499 for men (235 | 13.5%) and $25,000 to $29,999 for women (207 | 11.9%).
| Income | Male | Female |
| $2,499 or less | 126 (7.2%) | 201 (11.5%) |
| $2,500 to $4,999 | 183 (10.5%) | 165 (9.5%) |
| $5,000 to $7,499 | 119 (6.9%) | 57 (3.3%) |
| $7,500 to $9,999 | 58 (3.3%) | 32 (1.8%) |
| $10,000 to $12,499 | 58 (3.3%) | 14 (0.8%) |
| $12,500 to $14,999 | 0 (0.0%) | 196 (11.2%) |
| $15,000 to $17,499 | 24 (1.4%) | 124 (7.1%) |
| $17,500 to $19,999 | 30 (1.7%) | 78 (4.5%) |
| $20,000 to $22,499 | 235 (13.5%) | 57 (3.3%) |
| $22,500 to $24,999 | 49 (2.8%) | 50 (2.9%) |
| $25,000 to $29,999 | 176 (10.1%) | 207 (11.9%) |
| $30,000 to $34,999 | 41 (2.4%) | 154 (8.8%) |
| $35,000 to $39,999 | 111 (6.4%) | 101 (5.8%) |
| $40,000 to $44,999 | 20 (1.1%) | 148 (8.5%) |
| $45,000 to $49,999 | 226 (13.0%) | 11 (0.6%) |
| $50,000 to $54,999 | 34 (2.0%) | 17 (1.0%) |
| $55,000 to $64,999 | 152 (8.7%) | 30 (1.7%) |
| $65,000 to $74,999 | 46 (2.6%) | 84 (4.8%) |
| $75,000 to $99,999 | 42 (2.4%) | 11 (0.6%) |
| $100,000+ | 8 (0.5%) | 6 (0.3%) |
| Total | 1,738 (100.0%) | 1,743 (100.0%) |
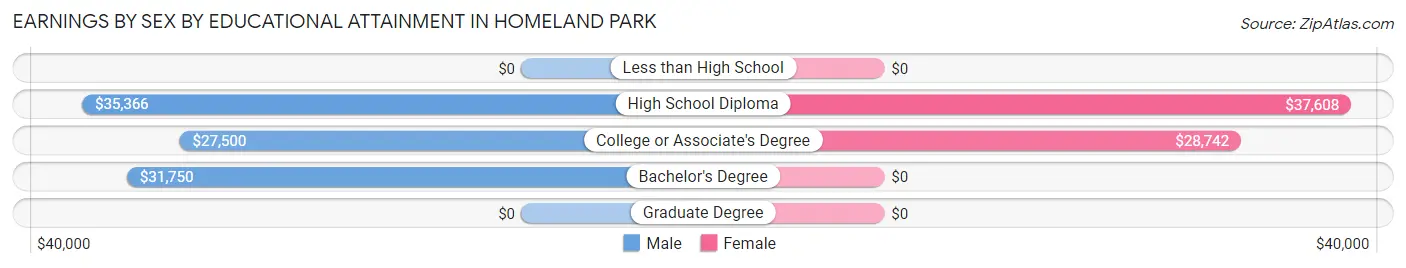
Earnings by Sex by Educational Attainment in Homeland Park
Average earnings in Homeland Park are $29,571 for men and $23,661 for women, a difference of 20.0%. Men with an educational attainment of high school diploma enjoy the highest average annual earnings of $35,366, while those with college or associate's degree education earn the least with $27,500. Women with an educational attainment of high school diploma earn the most with the average annual earnings of $37,608, while those with college or associate's degree education have the smallest earnings of $28,742.
| Educational Attainment | Male Income | Female Income |
| Less than High School | - | - |
| High School Diploma | $35,366 | $37,608 |
| College or Associate's Degree | $27,500 | $28,742 |
| Bachelor's Degree | $31,750 | $0 |
| Graduate Degree | - | - |
| Total | $29,571 | $23,661 |
Family Income in Homeland Park
Family Income Brackets in Homeland Park
According to the Homeland Park family income data, there are 524 families falling into the $35,000 to $49,999 income range, which is the most common income bracket and makes up 24.8% of all families. Conversely, the $200,000+ income bracket is the least frequent group with only 8 families (0.4%) belonging to this category.
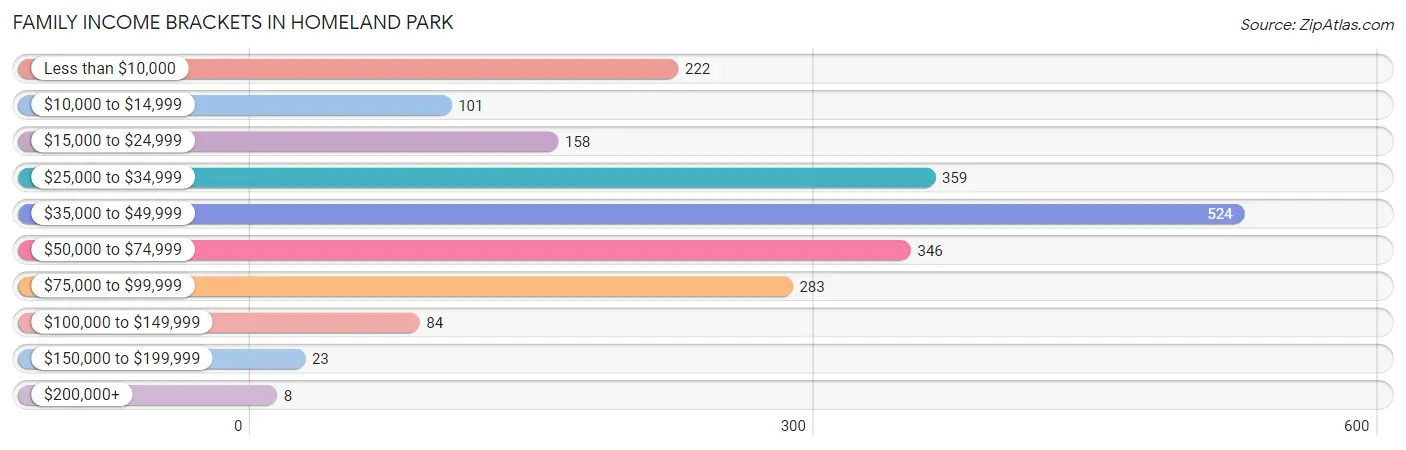
| Income Bracket | # Families | % Families |
| Less than $10,000 | 222 | 10.5% |
| $10,000 to $14,999 | 101 | 4.8% |
| $15,000 to $24,999 | 158 | 7.5% |
| $25,000 to $34,999 | 359 | 17.0% |
| $35,000 to $49,999 | 524 | 24.8% |
| $50,000 to $74,999 | 346 | 16.4% |
| $75,000 to $99,999 | 283 | 13.4% |
| $100,000 to $149,999 | 84 | 4.0% |
| $150,000 to $199,999 | 23 | 1.1% |
| $200,000+ | 8 | 0.4% |
Family Income by Famaliy Size in Homeland Park
3-person families (669 | 31.7%) account for the highest median family income in Homeland Park with $65,375 per family, while 3-person families (669 | 31.7%) have the highest median income of $21,792 per family member.
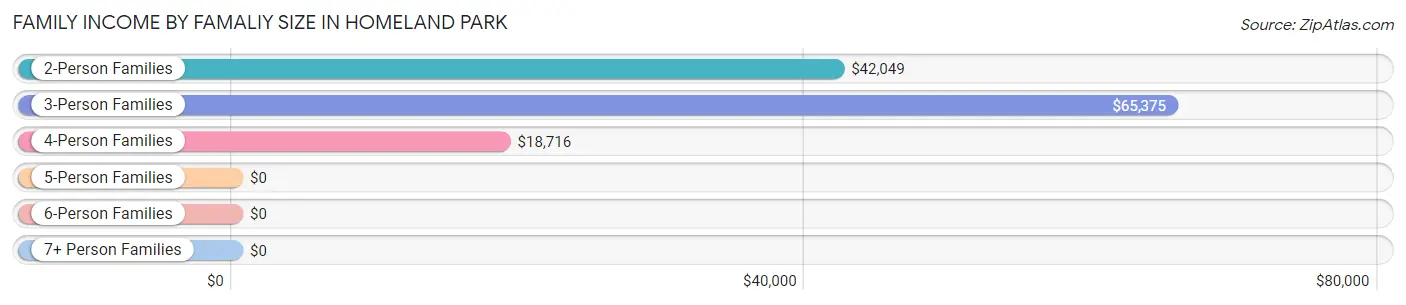
| Income Bracket | # Families | Median Income |
| 2-Person Families | 931 (44.1%) | $42,049 |
| 3-Person Families | 669 (31.7%) | $65,375 |
| 4-Person Families | 327 (15.5%) | $18,716 |
| 5-Person Families | 77 (3.6%) | $0 |
| 6-Person Families | 66 (3.1%) | $0 |
| 7+ Person Families | 42 (2.0%) | $0 |
| Total | 2,112 (100.0%) | $39,933 |
Family Income by Number of Earners in Homeland Park
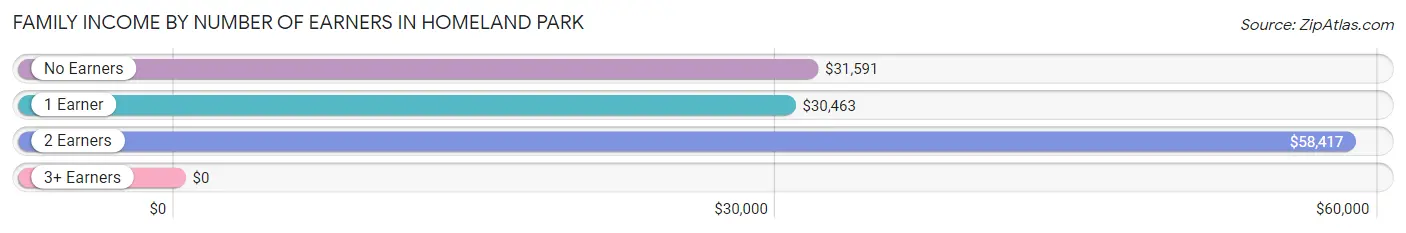
| Number of Earners | # Families | Median Income |
| No Earners | 520 (24.6%) | $31,591 |
| 1 Earner | 660 (31.2%) | $30,463 |
| 2 Earners | 757 (35.8%) | $58,417 |
| 3+ Earners | 175 (8.3%) | $0 |
| Total | 2,112 (100.0%) | $39,933 |
Household Income in Homeland Park
Household Income Brackets in Homeland Park
With 642 households falling in the category, the $35,000 to $49,999 income range is the most frequent in Homeland Park, accounting for 21.9% of all households. In contrast, only 26 households (0.9%) fall into the $200,000+ income bracket, making it the least populous group.
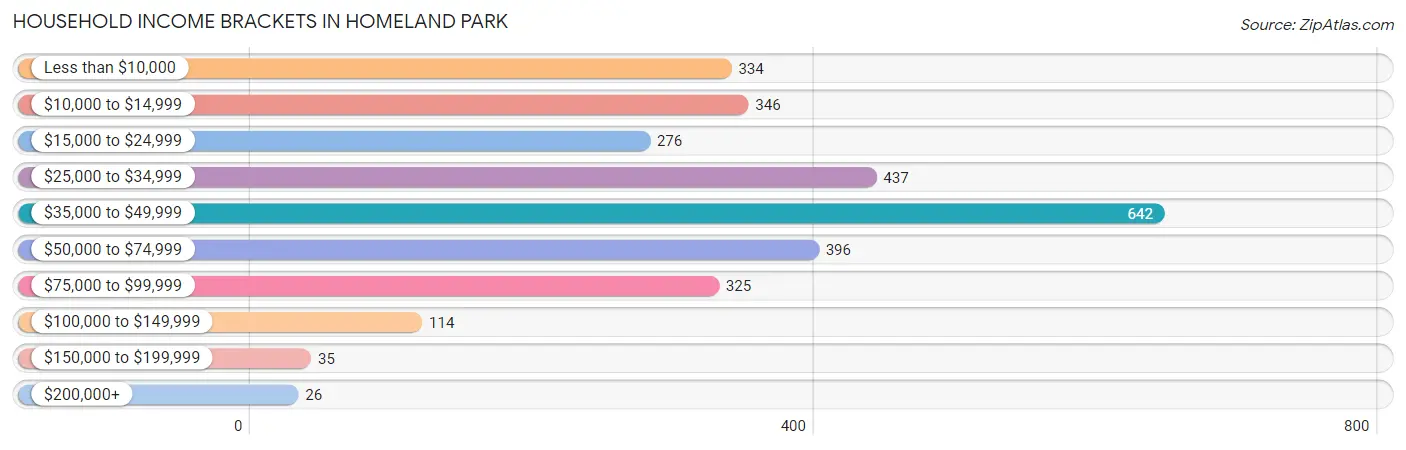
| Income Bracket | # Households | % Households |
| Less than $10,000 | 334 | 11.4% |
| $10,000 to $14,999 | 346 | 11.8% |
| $15,000 to $24,999 | 276 | 9.4% |
| $25,000 to $34,999 | 437 | 14.9% |
| $35,000 to $49,999 | 642 | 21.9% |
| $50,000 to $74,999 | 396 | 13.5% |
| $75,000 to $99,999 | 325 | 11.1% |
| $100,000 to $149,999 | 114 | 3.9% |
| $150,000 to $199,999 | 35 | 1.2% |
| $200,000+ | 26 | 0.9% |
Household Income by Householder Age in Homeland Park
The median household income in Homeland Park is $37,308, with the highest median household income of $43,661 found in the 45 to 64 years age bracket for the primary householder. A total of 1,057 households (36.0%) fall into this category. Meanwhile, the 15 to 24 years age bracket for the primary householder has the lowest median household income of $0, with 94 households (3.2%) in this group.
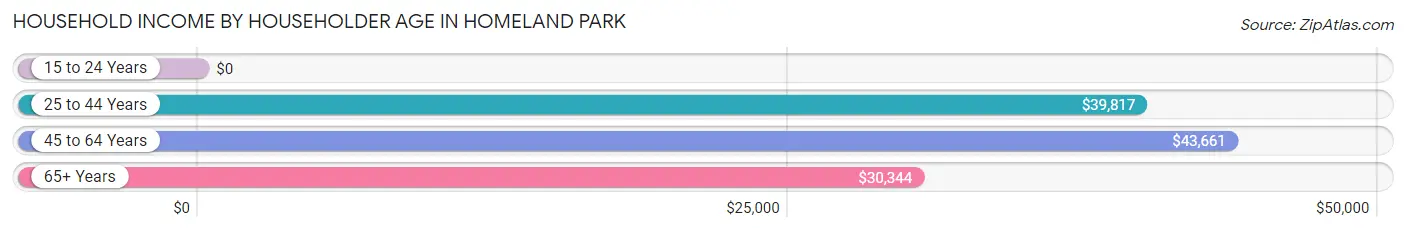
| Income Bracket | # Households | Median Income |
| 15 to 24 Years | 94 (3.2%) | $0 |
| 25 to 44 Years | 954 (32.5%) | $39,817 |
| 45 to 64 Years | 1,057 (36.0%) | $43,661 |
| 65+ Years | 827 (28.2%) | $30,344 |
| Total | 2,932 (100.0%) | $37,308 |
Poverty in Homeland Park
Income Below Poverty by Sex and Age in Homeland Park
With 30.0% poverty level for males and 37.9% for females among the residents of Homeland Park, under 5 year old males and 5 year old females are the most vulnerable to poverty, with 139 males (56.3%) and 47 females (97.9%) in their respective age groups living below the poverty level.
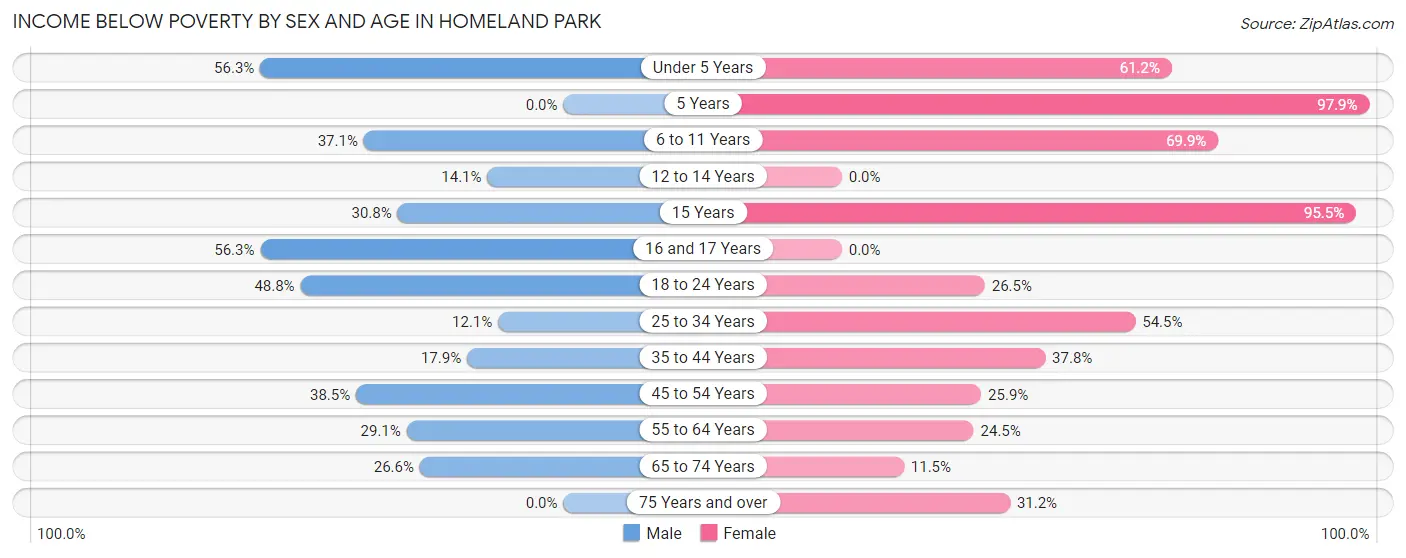
| Age Bracket | Male | Female |
| Under 5 Years | 139 (56.3%) | 109 (61.2%) |
| 5 Years | 0 (0.0%) | 47 (97.9%) |
| 6 to 11 Years | 103 (37.0%) | 292 (69.9%) |
| 12 to 14 Years | 11 (14.1%) | 0 (0.0%) |
| 15 Years | 8 (30.8%) | 42 (95.5%) |
| 16 and 17 Years | 36 (56.2%) | 0 (0.0%) |
| 18 to 24 Years | 265 (48.8%) | 86 (26.5%) |
| 25 to 34 Years | 46 (12.1%) | 317 (54.5%) |
| 35 to 44 Years | 124 (17.9%) | 211 (37.8%) |
| 45 to 54 Years | 157 (38.5%) | 163 (25.9%) |
| 55 to 64 Years | 80 (29.1%) | 92 (24.5%) |
| 65 to 74 Years | 65 (26.6%) | 50 (11.5%) |
| 75 Years and over | 0 (0.0%) | 108 (31.2%) |
| Total | 1,034 (30.0%) | 1,517 (37.9%) |
Income Above Poverty by Sex and Age in Homeland Park
According to the poverty statistics in Homeland Park, males aged 75 years and over and females aged 12 to 14 years are the age groups that are most secure financially, with 100.0% of males and 100.0% of females in these age groups living above the poverty line.
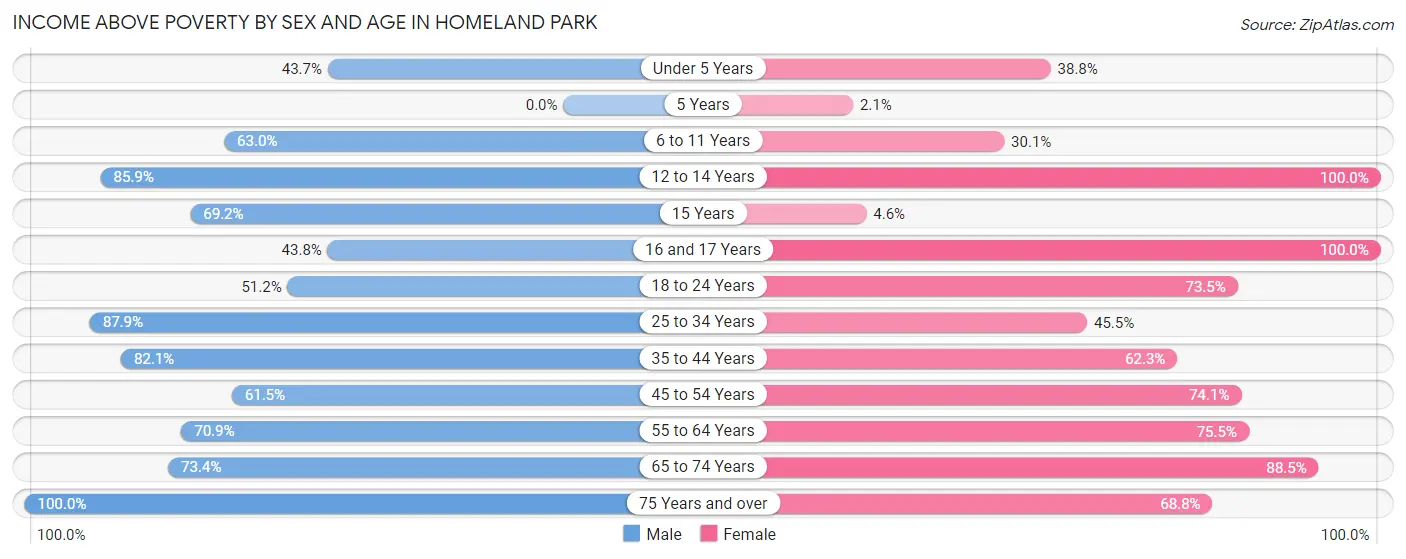
| Age Bracket | Male | Female |
| Under 5 Years | 108 (43.7%) | 69 (38.8%) |
| 5 Years | 0 (0.0%) | 1 (2.1%) |
| 6 to 11 Years | 175 (62.9%) | 126 (30.1%) |
| 12 to 14 Years | 67 (85.9%) | 32 (100.0%) |
| 15 Years | 18 (69.2%) | 2 (4.5%) |
| 16 and 17 Years | 28 (43.8%) | 29 (100.0%) |
| 18 to 24 Years | 278 (51.2%) | 238 (73.5%) |
| 25 to 34 Years | 334 (87.9%) | 265 (45.5%) |
| 35 to 44 Years | 569 (82.1%) | 348 (62.3%) |
| 45 to 54 Years | 251 (61.5%) | 467 (74.1%) |
| 55 to 64 Years | 195 (70.9%) | 284 (75.5%) |
| 65 to 74 Years | 179 (73.4%) | 384 (88.5%) |
| 75 Years and over | 214 (100.0%) | 238 (68.8%) |
| Total | 2,416 (70.0%) | 2,483 (62.1%) |
Income Below Poverty Among Married-Couple Families in Homeland Park
The poverty statistics for married-couple families in Homeland Park show that 14.5% or 201 of the total 1,384 families live below the poverty line. Families with 3 or 4 children have the highest poverty rate of 49.7%, comprising of 92 families. On the other hand, families with no children have the lowest poverty rate of 5.1%, which includes 50 families.
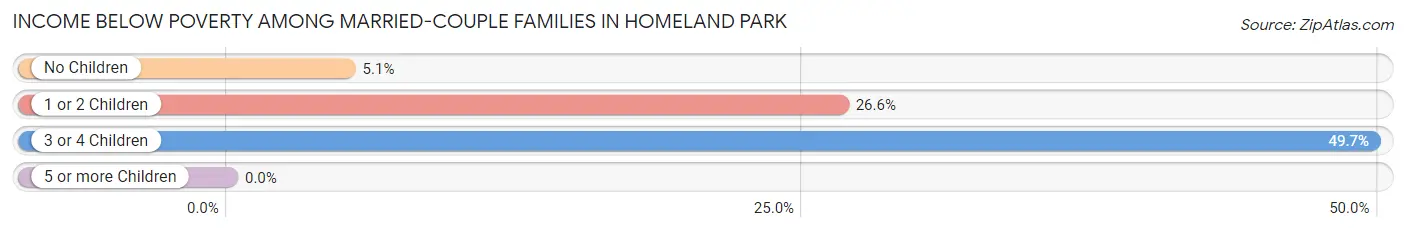
| Children | Above Poverty | Below Poverty |
| No Children | 927 (94.9%) | 50 (5.1%) |
| 1 or 2 Children | 163 (73.4%) | 59 (26.6%) |
| 3 or 4 Children | 93 (50.3%) | 92 (49.7%) |
| 5 or more Children | 0 (0.0%) | 0 (0.0%) |
| Total | 1,183 (85.5%) | 201 (14.5%) |
Income Below Poverty Among Single-Parent Households in Homeland Park
According to the poverty data in Homeland Park, 35.6% or 36 single-father households and 48.2% or 302 single-mother households are living below the poverty line. Among single-father households, those with no children have the highest poverty rate, with 36 households (51.4%) experiencing poverty. Likewise, among single-mother households, those with 3 or 4 children have the highest poverty rate, with 51 households (76.1%) falling below the poverty line.
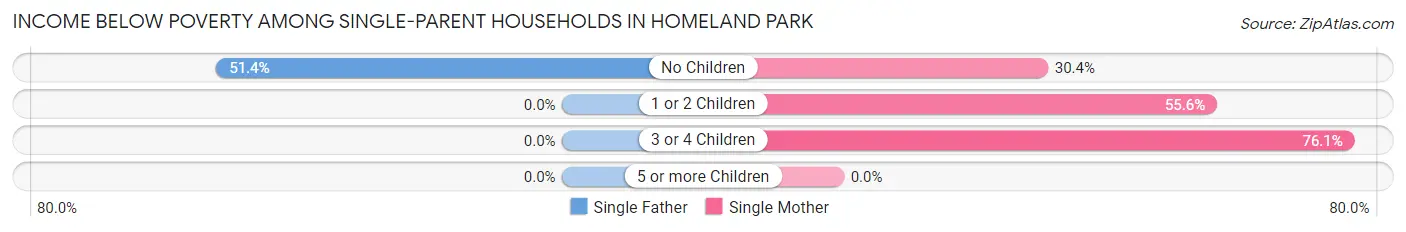
| Children | Single Father | Single Mother |
| No Children | 36 (51.4%) | 73 (30.4%) |
| 1 or 2 Children | 0 (0.0%) | 178 (55.6%) |
| 3 or 4 Children | 0 (0.0%) | 51 (76.1%) |
| 5 or more Children | 0 (0.0%) | 0 (0.0%) |
| Total | 36 (35.6%) | 302 (48.2%) |
Income Below Poverty Among Married-Couple vs Single-Parent Households in Homeland Park
The poverty data for Homeland Park shows that 201 of the married-couple family households (14.5%) and 338 of the single-parent households (46.4%) are living below the poverty level. Within the married-couple family households, those with 3 or 4 children have the highest poverty rate, with 92 households (49.7%) falling below the poverty line. Among the single-parent households, those with 3 or 4 children have the highest poverty rate, with 51 household (76.1%) living below poverty.
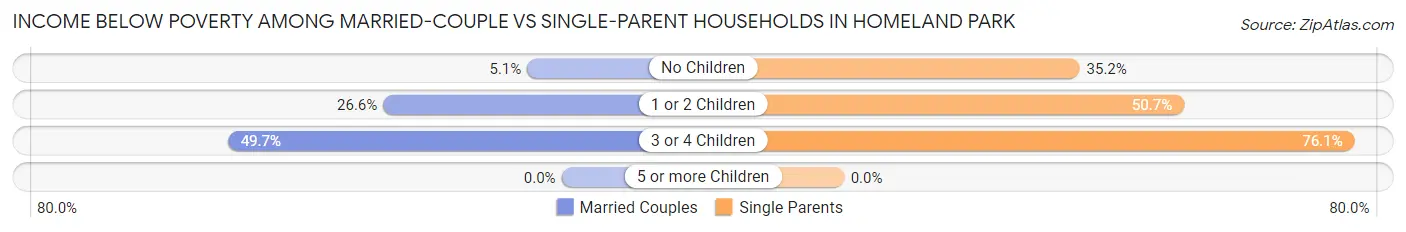
| Children | Married-Couple Families | Single-Parent Households |
| No Children | 50 (5.1%) | 109 (35.2%) |
| 1 or 2 Children | 59 (26.6%) | 178 (50.7%) |
| 3 or 4 Children | 92 (49.7%) | 51 (76.1%) |
| 5 or more Children | 0 (0.0%) | 0 (0.0%) |
| Total | 201 (14.5%) | 338 (46.4%) |
Race in Homeland Park
The most populous races in Homeland Park are White / Caucasian (4,018 | 53.9%), Black / African American (2,946 | 39.5%), and Hispanic or Latino (543 | 7.3%).
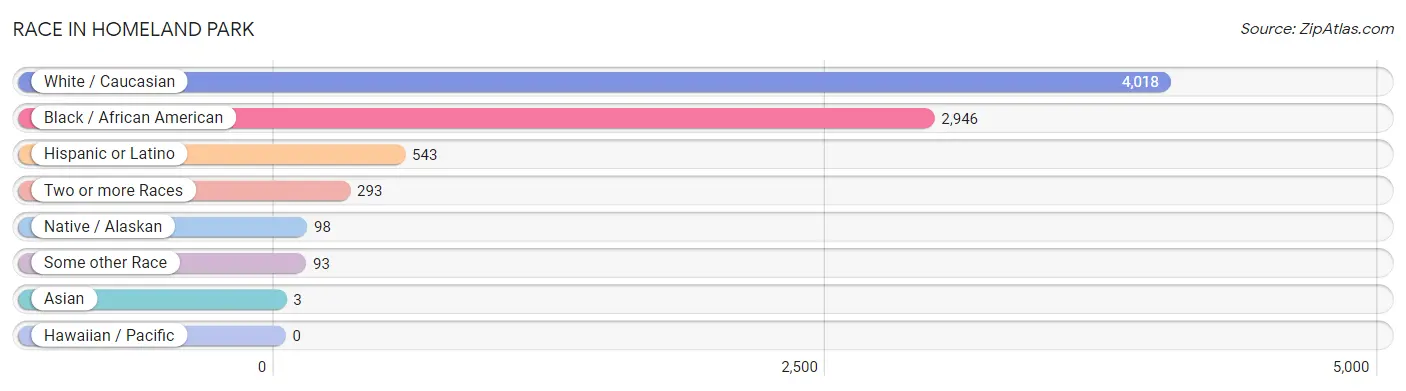
| Race | # Population | % Population |
| Asian | 3 | 0.0% |
| Black / African American | 2,946 | 39.5% |
| Hawaiian / Pacific | 0 | 0.0% |
| Hispanic or Latino | 543 | 7.3% |
| Native / Alaskan | 98 | 1.3% |
| White / Caucasian | 4,018 | 53.9% |
| Two or more Races | 293 | 3.9% |
| Some other Race | 93 | 1.3% |
| Total | 7,451 | 100.0% |
Ancestry in Homeland Park
The most populous ancestries reported in Homeland Park are Irish (736 | 9.9%), American (631 | 8.5%), English (533 | 7.1%), Mexican (470 | 6.3%), and German (369 | 5.0%), together accounting for 36.8% of all Homeland Park residents.
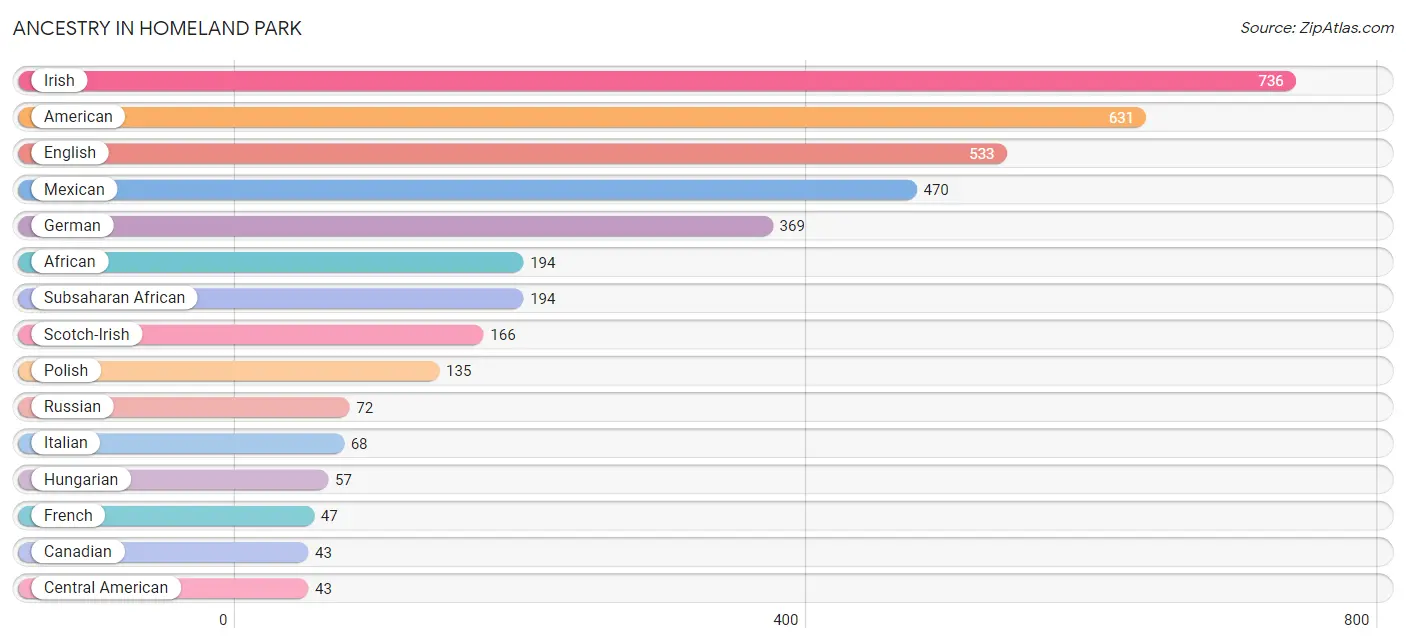
| Ancestry | # Population | % Population |
| African | 194 | 2.6% |
| American | 631 | 8.5% |
| Belizean | 16 | 0.2% |
| Canadian | 43 | 0.6% |
| Central American | 43 | 0.6% |
| Danish | 17 | 0.2% |
| Dominican | 30 | 0.4% |
| Dutch | 13 | 0.2% |
| English | 533 | 7.1% |
| European | 15 | 0.2% |
| French | 47 | 0.6% |
| German | 369 | 5.0% |
| Greek | 7 | 0.1% |
| Hungarian | 57 | 0.8% |
| Irish | 736 | 9.9% |
| Italian | 68 | 0.9% |
| Jamaican | 13 | 0.2% |
| Korean | 4 | 0.1% |
| Mexican | 470 | 6.3% |
| Polish | 135 | 1.8% |
| Portuguese | 11 | 0.2% |
| Russian | 72 | 1.0% |
| Salvadoran | 43 | 0.6% |
| Scotch-Irish | 166 | 2.2% |
| Subsaharan African | 194 | 2.6% | View All 25 Rows |
Immigrants in Homeland Park
The most numerous immigrant groups reported in Homeland Park came from Latin America (220 | 2.9%), Central America (190 | 2.5%), Mexico (190 | 2.5%), Caribbean (30 | 0.4%), and Dominican Republic (30 | 0.4%), together accounting for 8.8% of all Homeland Park residents.
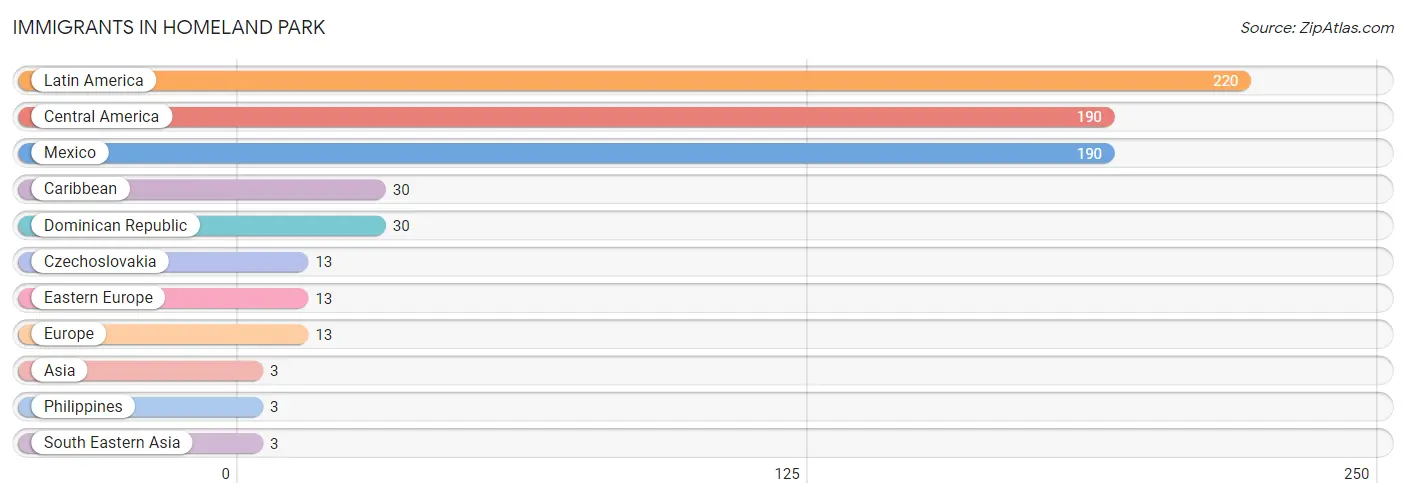
| Immigration Origin | # Population | % Population |
| Asia | 3 | 0.0% |
| Caribbean | 30 | 0.4% |
| Central America | 190 | 2.5% |
| Czechoslovakia | 13 | 0.2% |
| Dominican Republic | 30 | 0.4% |
| Eastern Europe | 13 | 0.2% |
| Europe | 13 | 0.2% |
| Latin America | 220 | 2.9% |
| Mexico | 190 | 2.5% |
| Philippines | 3 | 0.0% |
| South Eastern Asia | 3 | 0.0% | View All 11 Rows |
Sex and Age in Homeland Park
Sex and Age in Homeland Park
The most populous age groups in Homeland Park are 40 to 44 Years (532 | 15.4%) for men and 40 to 44 Years (378 | 9.5%) for women.
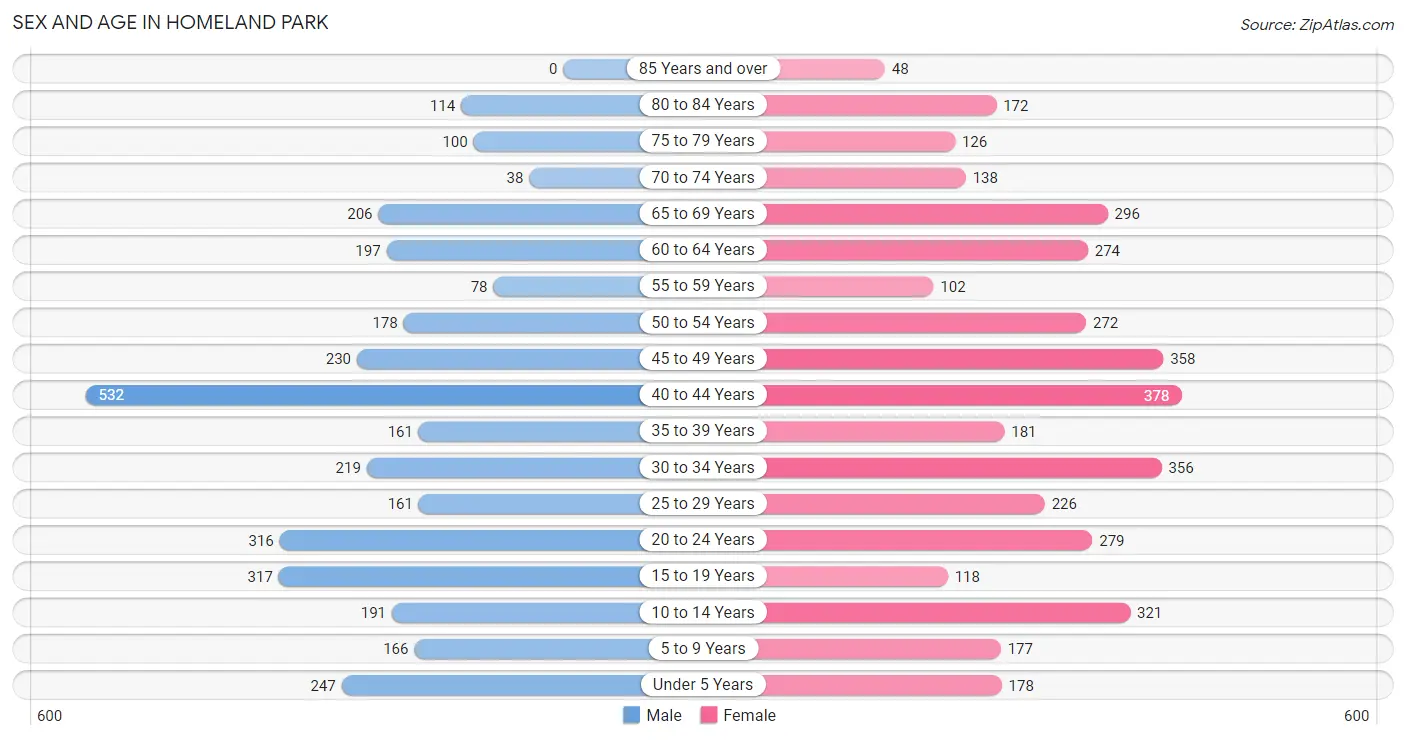
| Age Bracket | Male | Female |
| Under 5 Years | 247 (7.2%) | 178 (4.4%) |
| 5 to 9 Years | 166 (4.8%) | 177 (4.4%) |
| 10 to 14 Years | 191 (5.5%) | 321 (8.0%) |
| 15 to 19 Years | 317 (9.2%) | 118 (2.9%) |
| 20 to 24 Years | 316 (9.2%) | 279 (7.0%) |
| 25 to 29 Years | 161 (4.7%) | 226 (5.7%) |
| 30 to 34 Years | 219 (6.4%) | 356 (8.9%) |
| 35 to 39 Years | 161 (4.7%) | 181 (4.5%) |
| 40 to 44 Years | 532 (15.4%) | 378 (9.5%) |
| 45 to 49 Years | 230 (6.7%) | 358 (8.9%) |
| 50 to 54 Years | 178 (5.2%) | 272 (6.8%) |
| 55 to 59 Years | 78 (2.3%) | 102 (2.5%) |
| 60 to 64 Years | 197 (5.7%) | 274 (6.9%) |
| 65 to 69 Years | 206 (6.0%) | 296 (7.4%) |
| 70 to 74 Years | 38 (1.1%) | 138 (3.5%) |
| 75 to 79 Years | 100 (2.9%) | 126 (3.2%) |
| 80 to 84 Years | 114 (3.3%) | 172 (4.3%) |
| 85 Years and over | 0 (0.0%) | 48 (1.2%) |
| Total | 3,451 (100.0%) | 4,000 (100.0%) |
Families and Households in Homeland Park
Median Family Size in Homeland Park
The median family size in Homeland Park is 3.03 persons per family, with single female/mother families (627 | 29.7%) accounting for the largest median family size of 3.5 persons per family. On the other hand, single male/father families (101 | 4.8%) represent the smallest median family size with 2.78 persons per family.
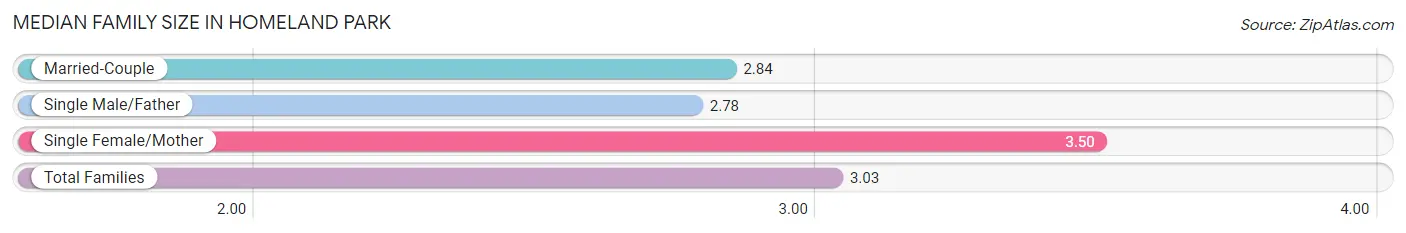
| Family Type | # Families | Family Size |
| Married-Couple | 1,384 (65.5%) | 2.84 |
| Single Male/Father | 101 (4.8%) | 2.78 |
| Single Female/Mother | 627 (29.7%) | 3.50 |
| Total Families | 2,112 (100.0%) | 3.03 |
Median Household Size in Homeland Park
The median household size in Homeland Park is 2.54 persons per household, with single female/mother households (627 | 21.4%) accounting for the largest median household size of 3.6 persons per household. non-family households (820 | 28.0%) represent the smallest median household size with 1.14 persons per household.
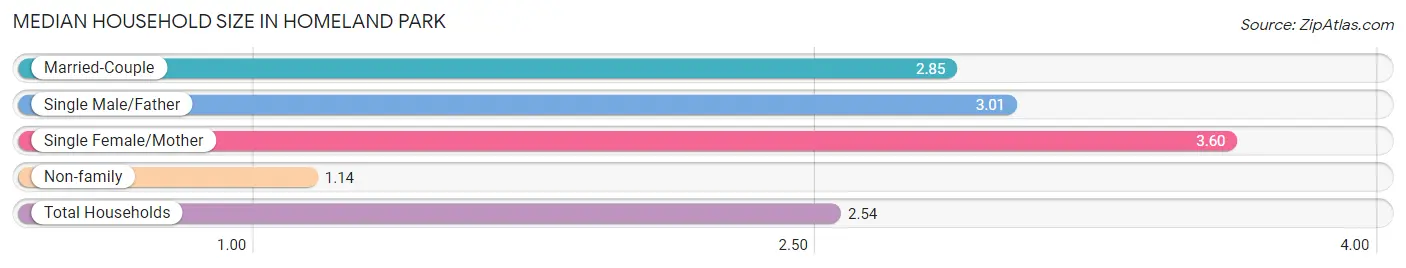
| Household Type | # Households | Household Size |
| Married-Couple | 1,384 (47.2%) | 2.85 |
| Single Male/Father | 101 (3.4%) | 3.01 |
| Single Female/Mother | 627 (21.4%) | 3.60 |
| Non-family | 820 (28.0%) | 1.14 |
| Total Households | 2,932 (100.0%) | 2.54 |
Household Size by Marriage Status in Homeland Park
Out of a total of 2,932 households in Homeland Park, 2,112 (72.0%) are family households, while 820 (28.0%) are nonfamily households. The most numerous type of family households are 2-person households, comprising 915, and the most common type of nonfamily households are 1-person households, comprising 729.
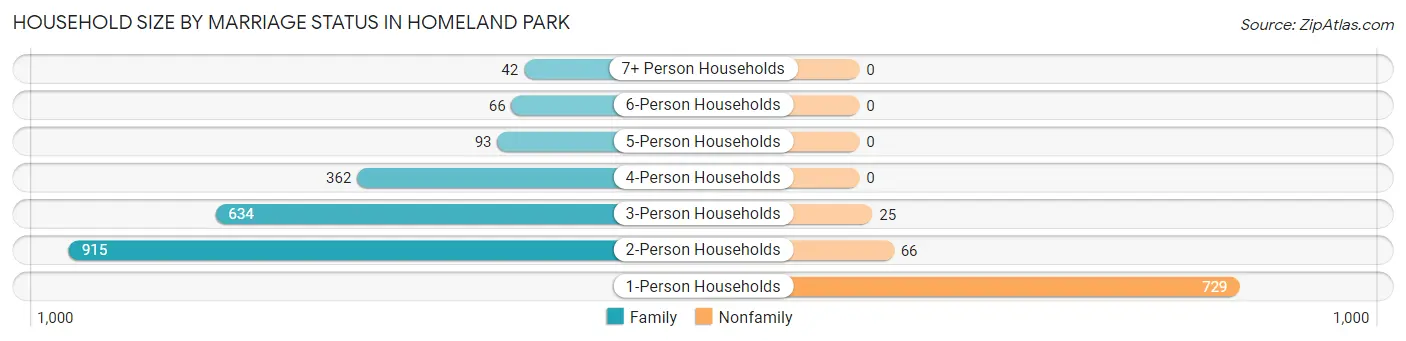
| Household Size | Family Households | Nonfamily Households |
| 1-Person Households | - | 729 (24.9%) |
| 2-Person Households | 915 (31.2%) | 66 (2.2%) |
| 3-Person Households | 634 (21.6%) | 25 (0.9%) |
| 4-Person Households | 362 (12.3%) | 0 (0.0%) |
| 5-Person Households | 93 (3.2%) | 0 (0.0%) |
| 6-Person Households | 66 (2.2%) | 0 (0.0%) |
| 7+ Person Households | 42 (1.4%) | 0 (0.0%) |
| Total | 2,112 (72.0%) | 820 (28.0%) |
Female Fertility in Homeland Park
Fertility by Age in Homeland Park
Average fertility rate in Homeland Park is 53.0 births per 1,000 women. Women in the age bracket of 20 to 34 years have the highest fertility rate with 71.0 births per 1,000 women. Women in the age bracket of 20 to 34 years acount for 58.1% of all women with births.
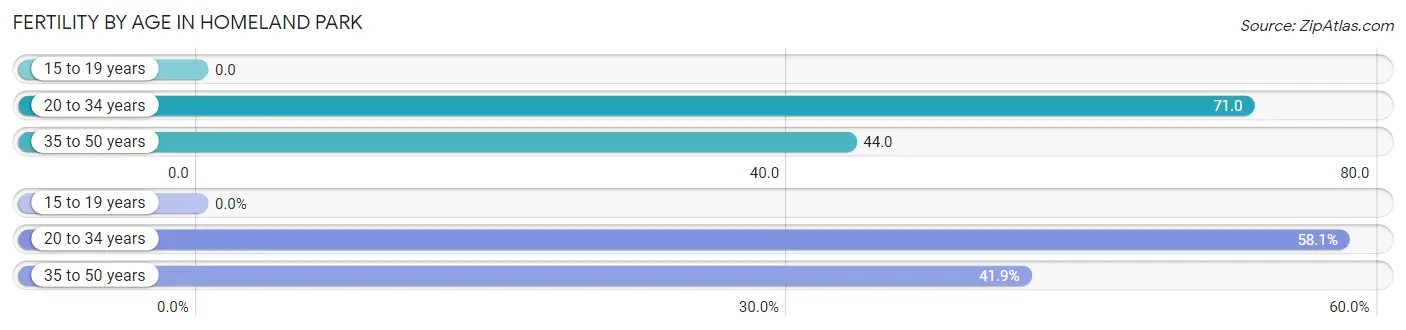
| Age Bracket | Women with Births | Births / 1,000 Women |
| 15 to 19 years | 0 (0.0%) | 0.0 |
| 20 to 34 years | 61 (58.1%) | 71.0 |
| 35 to 50 years | 44 (41.9%) | 44.0 |
| Total | 105 (100.0%) | 53.0 |
Fertility by Age by Marriage Status in Homeland Park
36.2% of women with births (105) in Homeland Park are married. The highest percentage of unmarried women with births falls into 20 to 34 years age bracket with 68.9% of them unmarried at the time of birth, while the lowest percentage of unmarried women with births belong to 35 to 50 years age bracket with 56.8% of them unmarried.
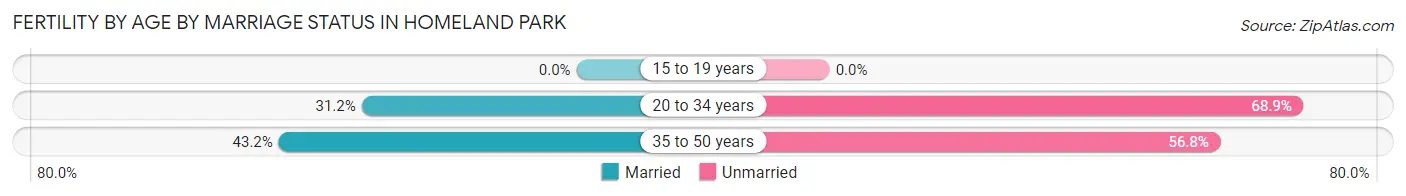
| Age Bracket | Married | Unmarried |
| 15 to 19 years | 0 (0.0%) | 0 (0.0%) |
| 20 to 34 years | 19 (31.1%) | 42 (68.9%) |
| 35 to 50 years | 19 (43.2%) | 25 (56.8%) |
| Total | 38 (36.2%) | 67 (63.8%) |
Fertility by Education in Homeland Park
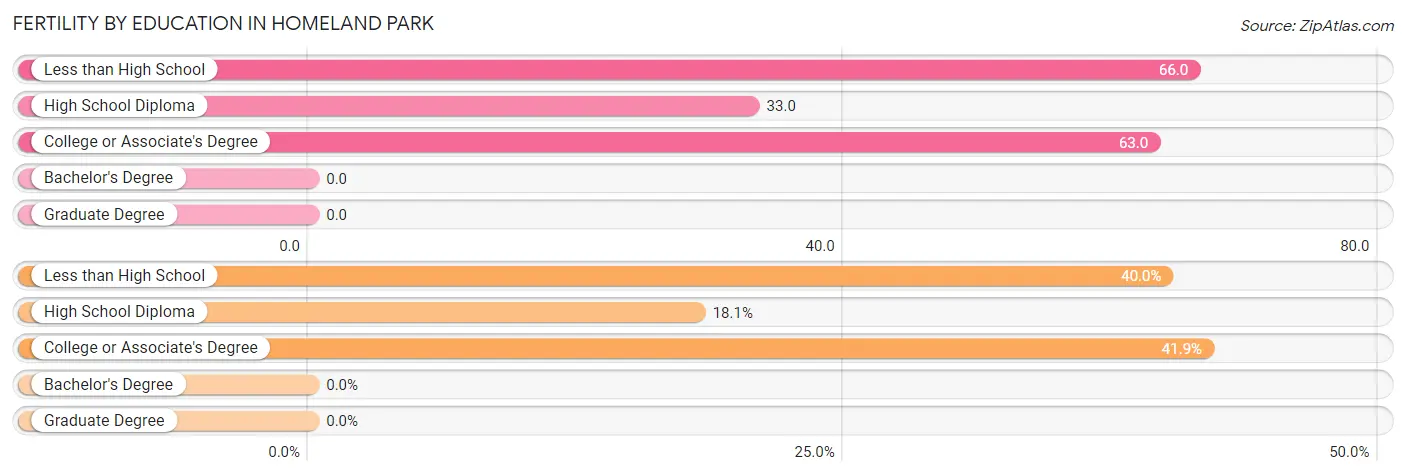
| Educational Attainment | Women with Births | Births / 1,000 Women |
| Less than High School | 42 (40.0%) | 66.0 |
| High School Diploma | 19 (18.1%) | 33.0 |
| College or Associate's Degree | 44 (41.9%) | 63.0 |
| Bachelor's Degree | 0 (0.0%) | 0.0 |
| Graduate Degree | 0 (0.0%) | 0.0 |
| Total | 105 (100.0%) | 53.0 |
Fertility by Education by Marriage Status in Homeland Park
63.8% of women with births in Homeland Park are unmarried. Women with the educational attainment of high school diploma are most likely to be married with 100.0% of them married at childbirth, while women with the educational attainment of less than high school are least likely to be married with 100.0% of them unmarried at childbirth.
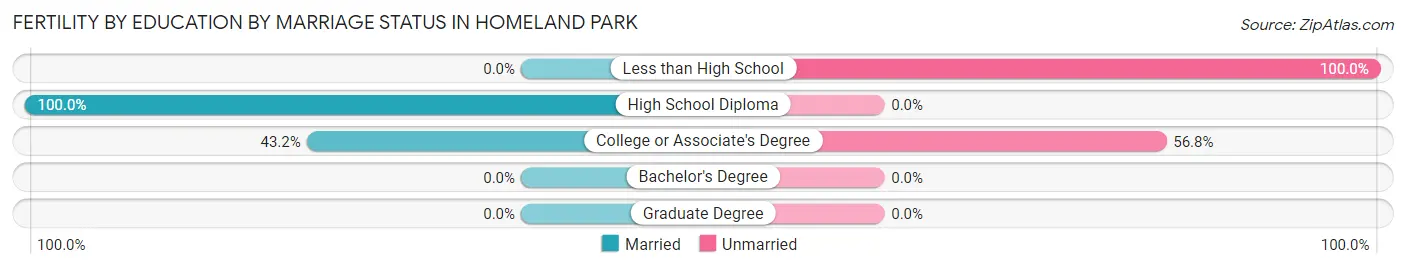
| Educational Attainment | Married | Unmarried |
| Less than High School | 0 (0.0%) | 42 (100.0%) |
| High School Diploma | 19 (100.0%) | 0 (0.0%) |
| College or Associate's Degree | 19 (43.2%) | 25 (56.8%) |
| Bachelor's Degree | 0 (0.0%) | 0 (0.0%) |
| Graduate Degree | 0 (0.0%) | 0 (0.0%) |
| Total | 38 (36.2%) | 67 (63.8%) |
Employment Characteristics in Homeland Park
Employment by Class of Employer in Homeland Park
Among the 2,971 employed individuals in Homeland Park, private company employees (2,164 | 72.8%), federal government employees (179 | 6.0%), and not-for-profit organizations (172 | 5.8%) make up the most common classes of employment.
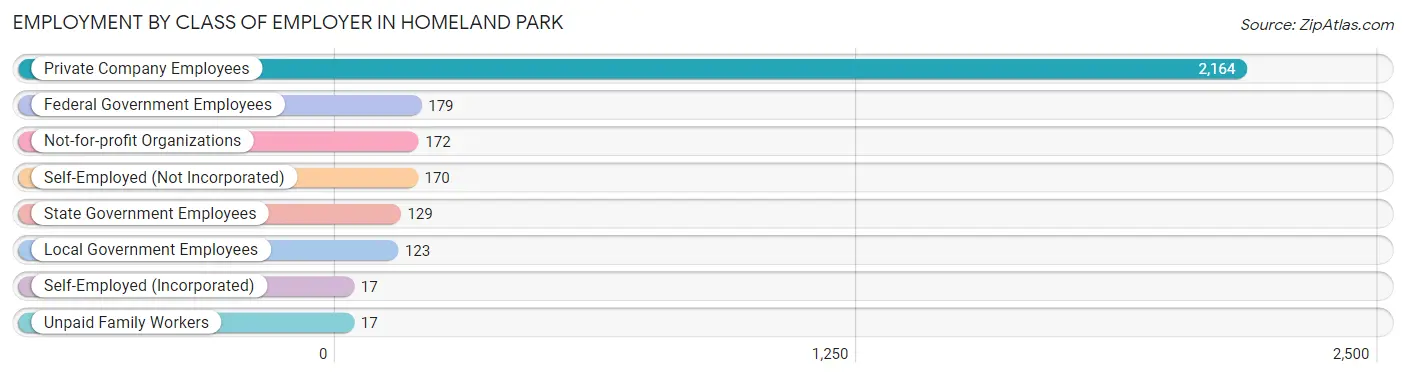
| Employer Class | # Employees | % Employees |
| Private Company Employees | 2,164 | 72.8% |
| Self-Employed (Incorporated) | 17 | 0.6% |
| Self-Employed (Not Incorporated) | 170 | 5.7% |
| Not-for-profit Organizations | 172 | 5.8% |
| Local Government Employees | 123 | 4.1% |
| State Government Employees | 129 | 4.3% |
| Federal Government Employees | 179 | 6.0% |
| Unpaid Family Workers | 17 | 0.6% |
| Total | 2,971 | 100.0% |
Employment Status by Age in Homeland Park
According to the labor force statistics for Homeland Park, out of the total population over 16 years of age (6,101), 58.1% or 3,545 individuals are in the labor force, with 13.2% or 468 of them unemployed. The age group with the highest labor force participation rate is 25 to 29 years, with 91.0% or 352 individuals in the labor force. Within the labor force, the 20 to 24 years age range has the highest percentage of unemployed individuals, with 30.4% or 135 of them being unemployed.
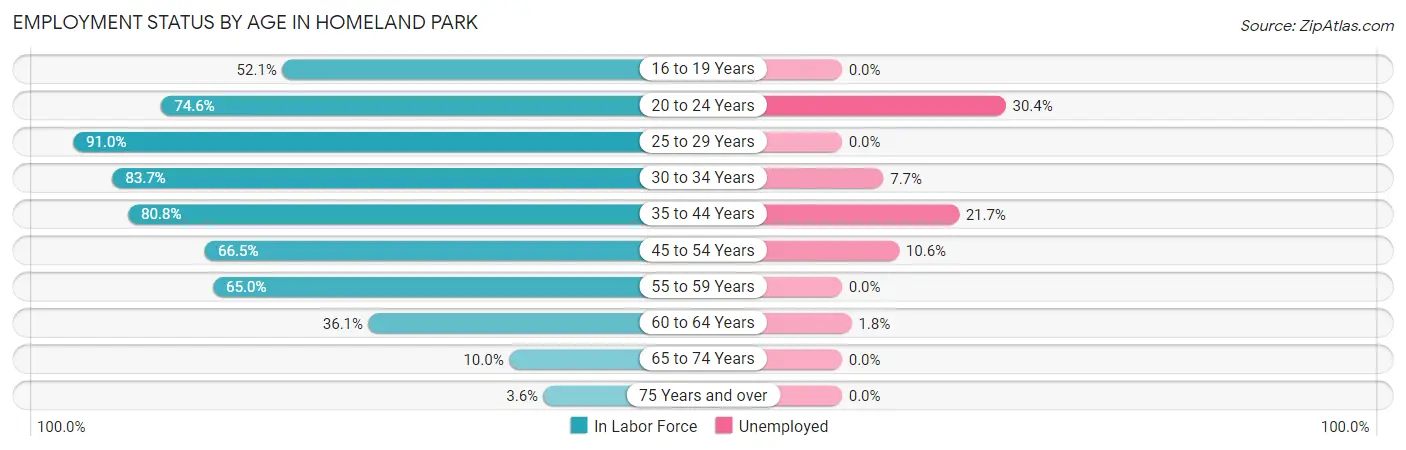
| Age Bracket | In Labor Force | Unemployed |
| 16 to 19 Years | 190 (52.1%) | 0 (0.0%) |
| 20 to 24 Years | 444 (74.6%) | 135 (30.4%) |
| 25 to 29 Years | 352 (91.0%) | 0 (0.0%) |
| 30 to 34 Years | 481 (83.7%) | 37 (7.7%) |
| 35 to 44 Years | 1,012 (80.8%) | 220 (21.7%) |
| 45 to 54 Years | 690 (66.5%) | 73 (10.6%) |
| 55 to 59 Years | 117 (65.0%) | 0 (0.0%) |
| 60 to 64 Years | 170 (36.1%) | 3 (1.8%) |
| 65 to 74 Years | 68 (10.0%) | 0 (0.0%) |
| 75 Years and over | 20 (3.6%) | 0 (0.0%) |
| Total | 3,545 (58.1%) | 468 (13.2%) |
Employment Status by Educational Attainment in Homeland Park
According to labor force statistics for Homeland Park, 72.3% of individuals (2,822) out of the total population between 25 and 64 years of age (3,903) are in the labor force, with 11.8% or 333 of them being unemployed. The group with the highest labor force participation rate are those with the educational attainment of high school diploma, with 82.6% or 1,250 individuals in the labor force. Within the labor force, individuals with less than high school education have the highest percentage of unemployment, with 28.0% or 206 of them being unemployed.
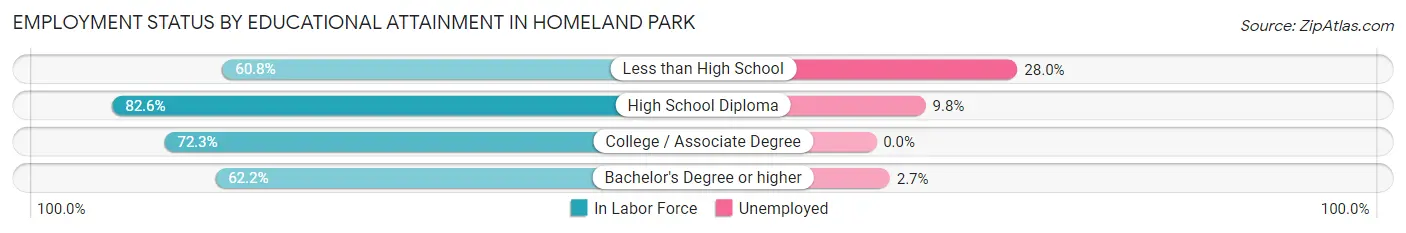
| Educational Attainment | In Labor Force | Unemployed |
| Less than High School | 736 (60.8%) | 339 (28.0%) |
| High School Diploma | 1,250 (82.6%) | 148 (9.8%) |
| College / Associate Degree | 723 (72.3%) | 0 (0.0%) |
| Bachelor's Degree or higher | 112 (62.2%) | 5 (2.7%) |
| Total | 2,822 (72.3%) | 461 (11.8%) |
Employment Occupations by Sex in Homeland Park
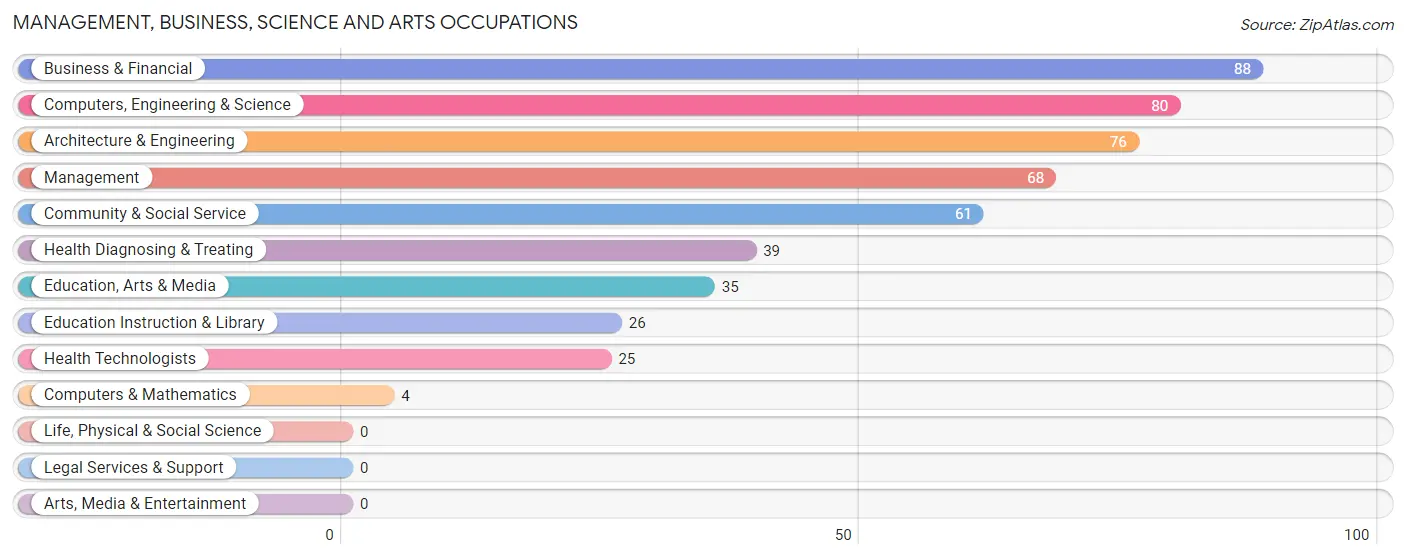
Management, Business, Science and Arts Occupations
The most common Management, Business, Science and Arts occupations in Homeland Park are Business & Financial (88 | 2.9%), Computers, Engineering & Science (80 | 2.6%), Architecture & Engineering (76 | 2.5%), Management (68 | 2.2%), and Community & Social Service (61 | 2.0%).
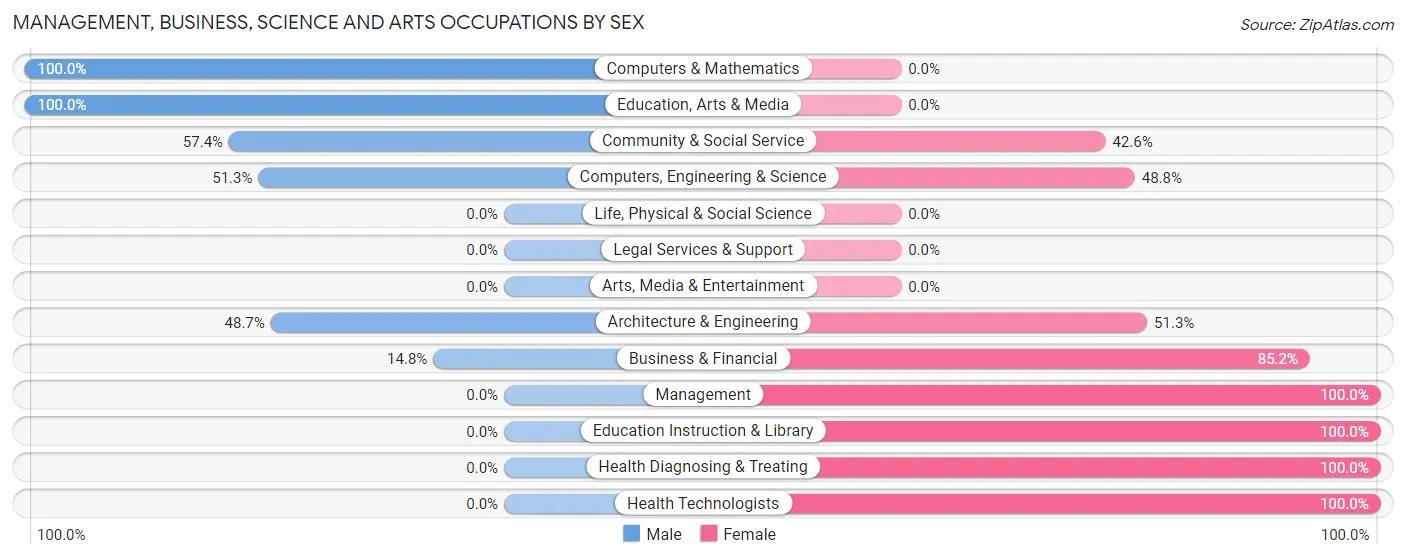
Management, Business, Science and Arts Occupations by Sex
Within the Management, Business, Science and Arts occupations in Homeland Park, the most male-oriented occupations are Computers & Mathematics (100.0%), Education, Arts & Media (100.0%), and Community & Social Service (57.4%), while the most female-oriented occupations are Management (100.0%), Education Instruction & Library (100.0%), and Health Diagnosing & Treating (100.0%).
| Occupation | Male | Female |
| Management | 0 (0.0%) | 68 (100.0%) |
| Business & Financial | 13 (14.8%) | 75 (85.2%) |
| Computers, Engineering & Science | 41 (51.2%) | 39 (48.7%) |
| Computers & Mathematics | 4 (100.0%) | 0 (0.0%) |
| Architecture & Engineering | 37 (48.7%) | 39 (51.3%) |
| Life, Physical & Social Science | 0 (0.0%) | 0 (0.0%) |
| Community & Social Service | 35 (57.4%) | 26 (42.6%) |
| Education, Arts & Media | 35 (100.0%) | 0 (0.0%) |
| Legal Services & Support | 0 (0.0%) | 0 (0.0%) |
| Education Instruction & Library | 0 (0.0%) | 26 (100.0%) |
| Arts, Media & Entertainment | 0 (0.0%) | 0 (0.0%) |
| Health Diagnosing & Treating | 0 (0.0%) | 39 (100.0%) |
| Health Technologists | 0 (0.0%) | 25 (100.0%) |
| Total (Category) | 89 (26.5%) | 247 (73.5%) |
| Total (Overall) | 1,551 (50.4%) | 1,525 (49.6%) |
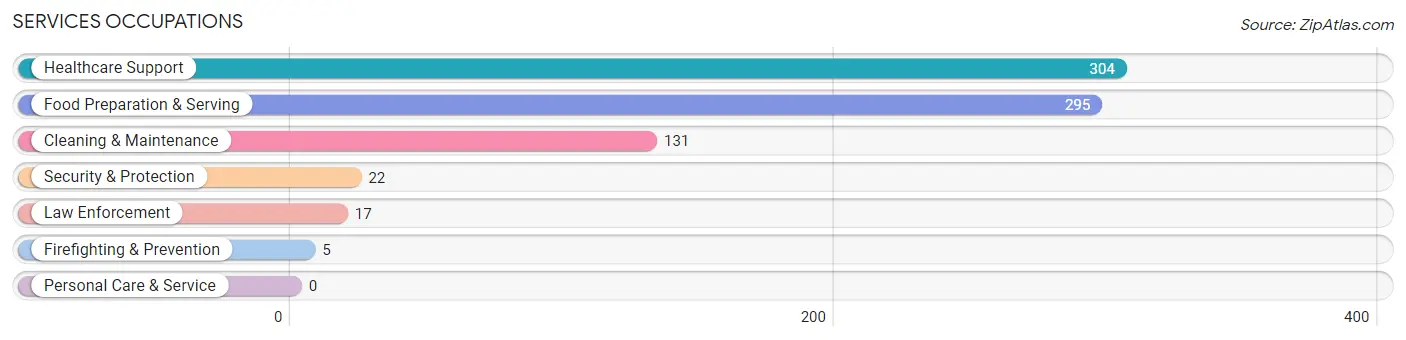
Services Occupations
The most common Services occupations in Homeland Park are Healthcare Support (304 | 9.9%), Food Preparation & Serving (295 | 9.6%), Cleaning & Maintenance (131 | 4.3%), Security & Protection (22 | 0.7%), and Law Enforcement (17 | 0.5%).
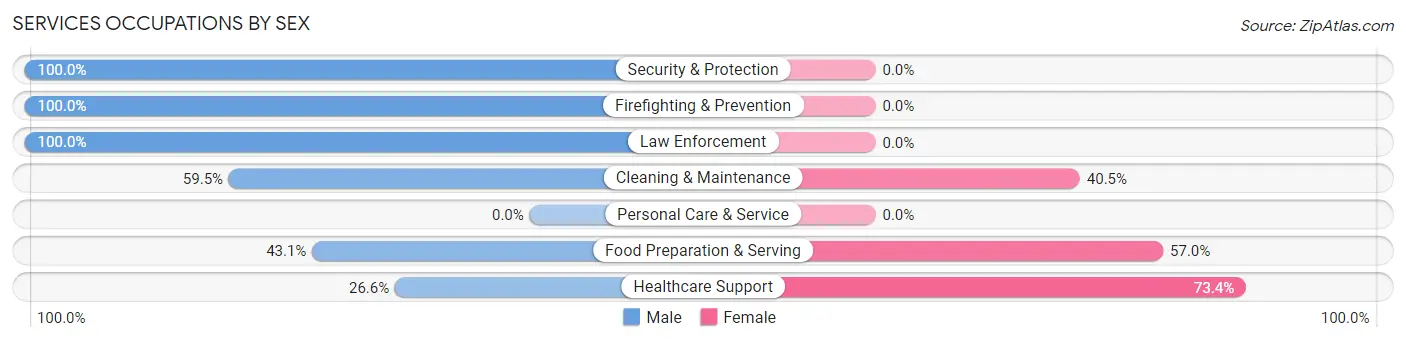
Services Occupations by Sex
Within the Services occupations in Homeland Park, the most male-oriented occupations are Security & Protection (100.0%), Firefighting & Prevention (100.0%), and Law Enforcement (100.0%), while the most female-oriented occupations are Healthcare Support (73.4%), Food Preparation & Serving (57.0%), and Cleaning & Maintenance (40.5%).
| Occupation | Male | Female |
| Healthcare Support | 81 (26.6%) | 223 (73.4%) |
| Security & Protection | 22 (100.0%) | 0 (0.0%) |
| Firefighting & Prevention | 5 (100.0%) | 0 (0.0%) |
| Law Enforcement | 17 (100.0%) | 0 (0.0%) |
| Food Preparation & Serving | 127 (43.0%) | 168 (57.0%) |
| Cleaning & Maintenance | 78 (59.5%) | 53 (40.5%) |
| Personal Care & Service | 0 (0.0%) | 0 (0.0%) |
| Total (Category) | 308 (41.0%) | 444 (59.0%) |
| Total (Overall) | 1,551 (50.4%) | 1,525 (49.6%) |
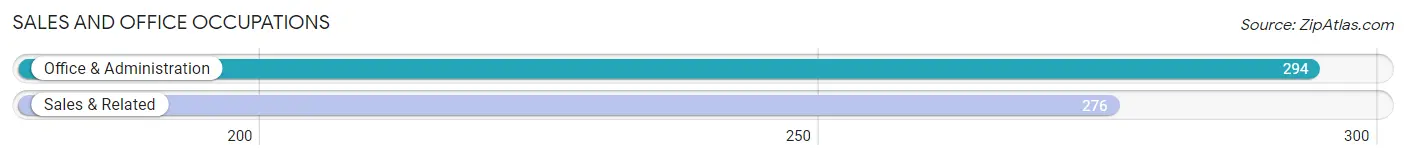
Sales and Office Occupations
The most common Sales and Office occupations in Homeland Park are Office & Administration (294 | 9.6%), and Sales & Related (276 | 9.0%).
Sales and Office Occupations by Sex
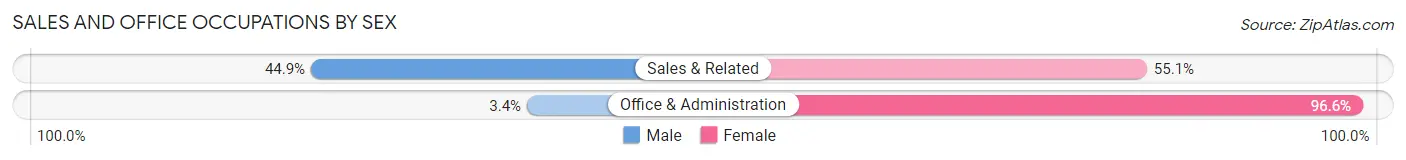
| Occupation | Male | Female |
| Sales & Related | 124 (44.9%) | 152 (55.1%) |
| Office & Administration | 10 (3.4%) | 284 (96.6%) |
| Total (Category) | 134 (23.5%) | 436 (76.5%) |
| Total (Overall) | 1,551 (50.4%) | 1,525 (49.6%) |
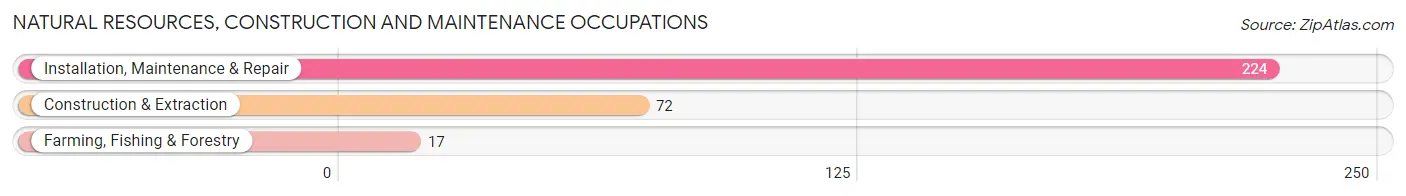
Natural Resources, Construction and Maintenance Occupations
The most common Natural Resources, Construction and Maintenance occupations in Homeland Park are Installation, Maintenance & Repair (224 | 7.3%), Construction & Extraction (72 | 2.3%), and Farming, Fishing & Forestry (17 | 0.5%).
Natural Resources, Construction and Maintenance Occupations by Sex
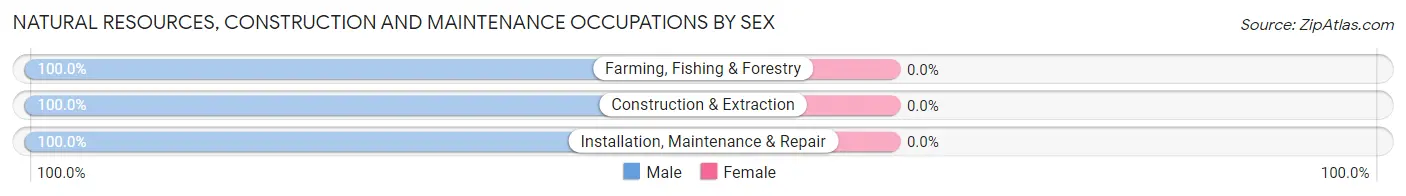
| Occupation | Male | Female |
| Farming, Fishing & Forestry | 17 (100.0%) | 0 (0.0%) |
| Construction & Extraction | 72 (100.0%) | 0 (0.0%) |
| Installation, Maintenance & Repair | 224 (100.0%) | 0 (0.0%) |
| Total (Category) | 313 (100.0%) | 0 (0.0%) |
| Total (Overall) | 1,551 (50.4%) | 1,525 (49.6%) |
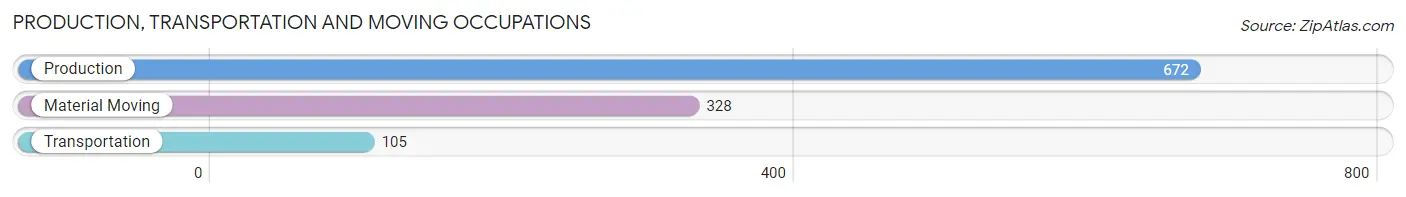
Production, Transportation and Moving Occupations
The most common Production, Transportation and Moving occupations in Homeland Park are Production (672 | 21.8%), Material Moving (328 | 10.7%), and Transportation (105 | 3.4%).
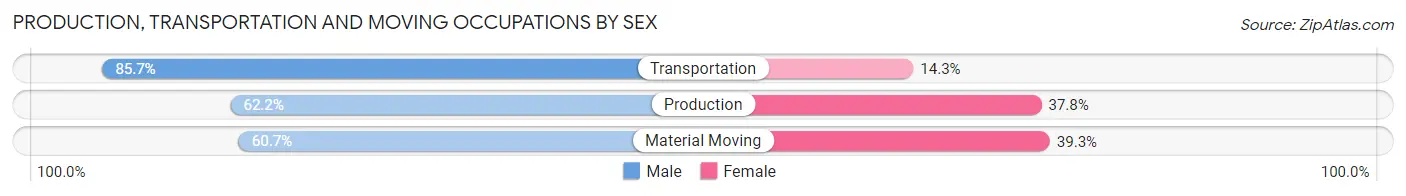
Production, Transportation and Moving Occupations by Sex
| Occupation | Male | Female |
| Production | 418 (62.2%) | 254 (37.8%) |
| Transportation | 90 (85.7%) | 15 (14.3%) |
| Material Moving | 199 (60.7%) | 129 (39.3%) |
| Total (Category) | 707 (64.0%) | 398 (36.0%) |
| Total (Overall) | 1,551 (50.4%) | 1,525 (49.6%) |
Employment Industries by Sex in Homeland Park
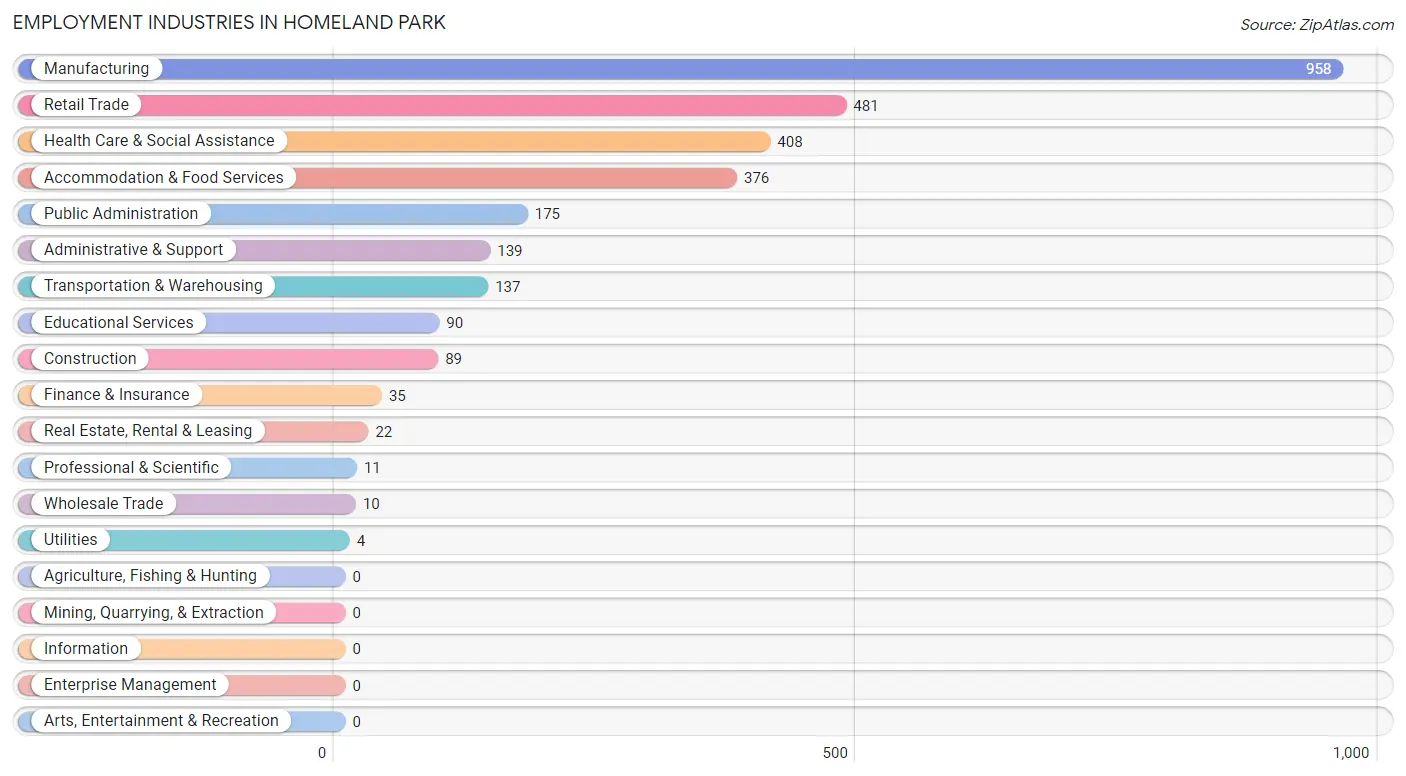
Employment Industries in Homeland Park
The major employment industries in Homeland Park include Manufacturing (958 | 31.1%), Retail Trade (481 | 15.6%), Health Care & Social Assistance (408 | 13.3%), Accommodation & Food Services (376 | 12.2%), and Public Administration (175 | 5.7%).
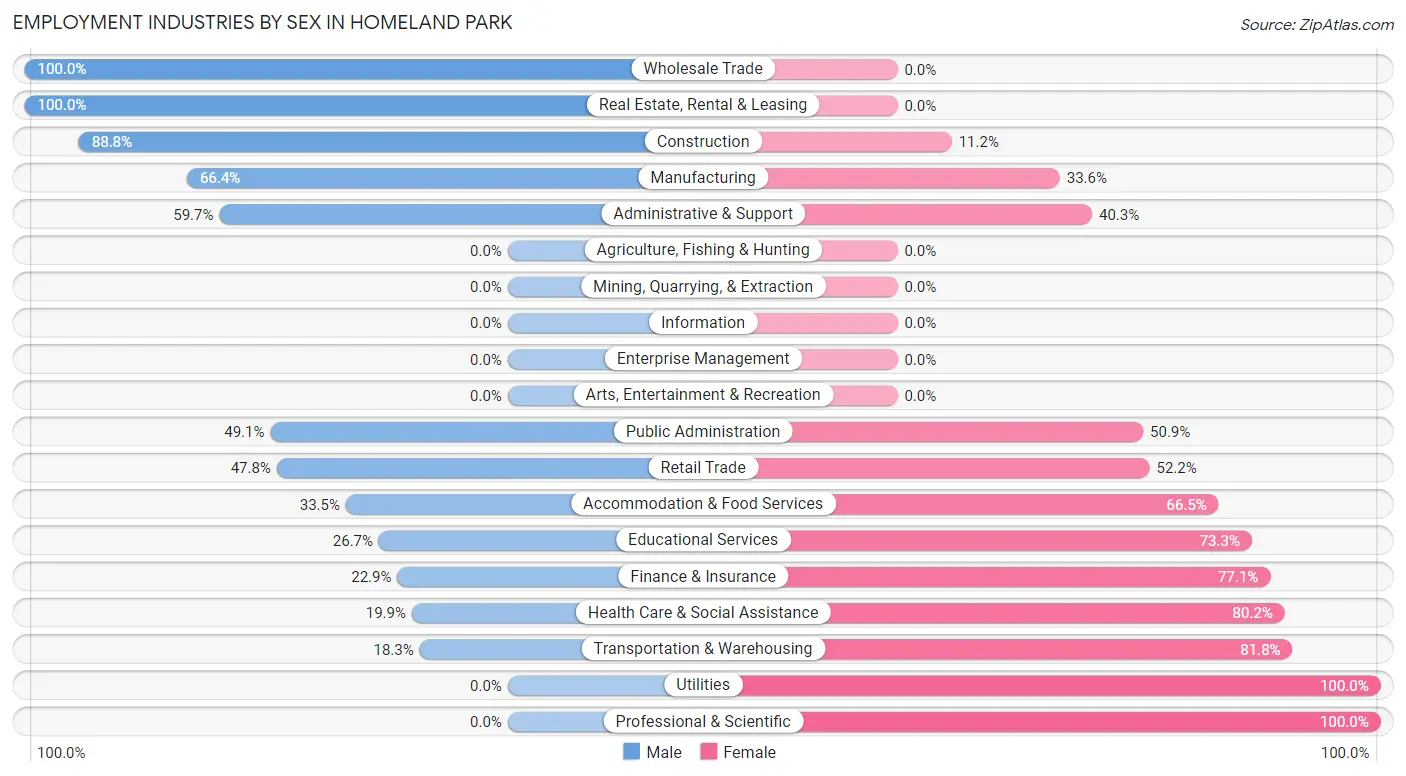
Employment Industries by Sex in Homeland Park
The Homeland Park industries that see more men than women are Wholesale Trade (100.0%), Real Estate, Rental & Leasing (100.0%), and Construction (88.8%), whereas the industries that tend to have a higher number of women are Utilities (100.0%), Professional & Scientific (100.0%), and Transportation & Warehousing (81.8%).
| Industry | Male | Female |
| Agriculture, Fishing & Hunting | 0 (0.0%) | 0 (0.0%) |
| Mining, Quarrying, & Extraction | 0 (0.0%) | 0 (0.0%) |
| Construction | 79 (88.8%) | 10 (11.2%) |
| Manufacturing | 636 (66.4%) | 322 (33.6%) |
| Wholesale Trade | 10 (100.0%) | 0 (0.0%) |
| Retail Trade | 230 (47.8%) | 251 (52.2%) |
| Transportation & Warehousing | 25 (18.2%) | 112 (81.8%) |
| Utilities | 0 (0.0%) | 4 (100.0%) |
| Information | 0 (0.0%) | 0 (0.0%) |
| Finance & Insurance | 8 (22.9%) | 27 (77.1%) |
| Real Estate, Rental & Leasing | 22 (100.0%) | 0 (0.0%) |
| Professional & Scientific | 0 (0.0%) | 11 (100.0%) |
| Enterprise Management | 0 (0.0%) | 0 (0.0%) |
| Administrative & Support | 83 (59.7%) | 56 (40.3%) |
| Educational Services | 24 (26.7%) | 66 (73.3%) |
| Health Care & Social Assistance | 81 (19.9%) | 327 (80.1%) |
| Arts, Entertainment & Recreation | 0 (0.0%) | 0 (0.0%) |
| Accommodation & Food Services | 126 (33.5%) | 250 (66.5%) |
| Public Administration | 86 (49.1%) | 89 (50.9%) |
| Total | 1,551 (50.4%) | 1,525 (49.6%) |
Education in Homeland Park
School Enrollment in Homeland Park
The most common levels of schooling among the 1,423 students in Homeland Park are elementary school (446 | 31.3%), high school (374 | 26.3%), and middle school (320 | 22.5%).
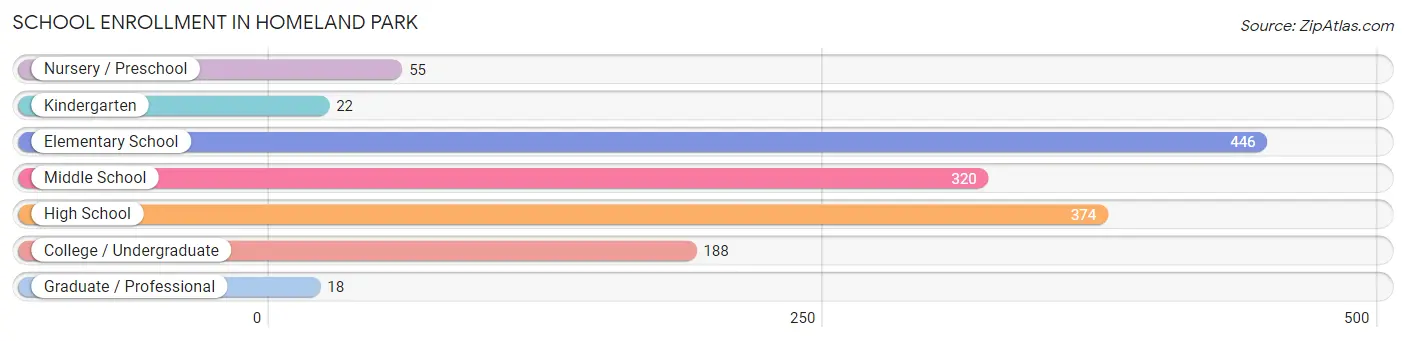
| School Level | # Students | % Students |
| Nursery / Preschool | 55 | 3.9% |
| Kindergarten | 22 | 1.5% |
| Elementary School | 446 | 31.3% |
| Middle School | 320 | 22.5% |
| High School | 374 | 26.3% |
| College / Undergraduate | 188 | 13.2% |
| Graduate / Professional | 18 | 1.3% |
| Total | 1,423 | 100.0% |
School Enrollment by Age by Funding Source in Homeland Park
Out of a total of 1,423 students who are enrolled in schools in Homeland Park, 134 (9.4%) attend a private institution, while the remaining 1,289 (90.6%) are enrolled in public schools. The age group of 3 to 4 year olds has the highest likelihood of being enrolled in private schools, with 55 (100.0% in the age bracket) enrolled. Conversely, the age group of 15 to 17 year olds has the lowest likelihood of being enrolled in a private school, with 163 (100.0% in the age bracket) attending a public institution.
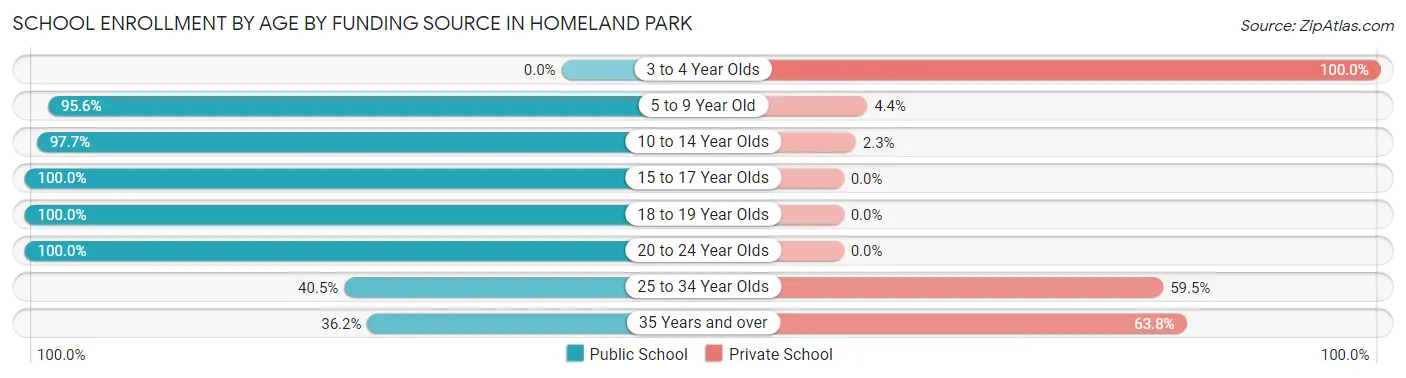
| Age Bracket | Public School | Private School |
| 3 to 4 Year Olds | 0 (0.0%) | 55 (100.0%) |
| 5 to 9 Year Old | 283 (95.6%) | 13 (4.4%) |
| 10 to 14 Year Olds | 473 (97.7%) | 11 (2.3%) |
| 15 to 17 Year Olds | 163 (100.0%) | 0 (0.0%) |
| 18 to 19 Year Olds | 125 (100.0%) | 0 (0.0%) |
| 20 to 24 Year Olds | 211 (100.0%) | 0 (0.0%) |
| 25 to 34 Year Olds | 17 (40.5%) | 25 (59.5%) |
| 35 Years and over | 17 (36.2%) | 30 (63.8%) |
| Total | 1,289 (90.6%) | 134 (9.4%) |
Educational Attainment by Field of Study in Homeland Park
Education (151 | 41.5%), liberal arts & history (126 | 34.6%), business (25 | 6.9%), literature & languages (22 | 6.0%), and psychology (20 | 5.5%) are the most common fields of study among 364 individuals in Homeland Park who have obtained a bachelor's degree or higher.
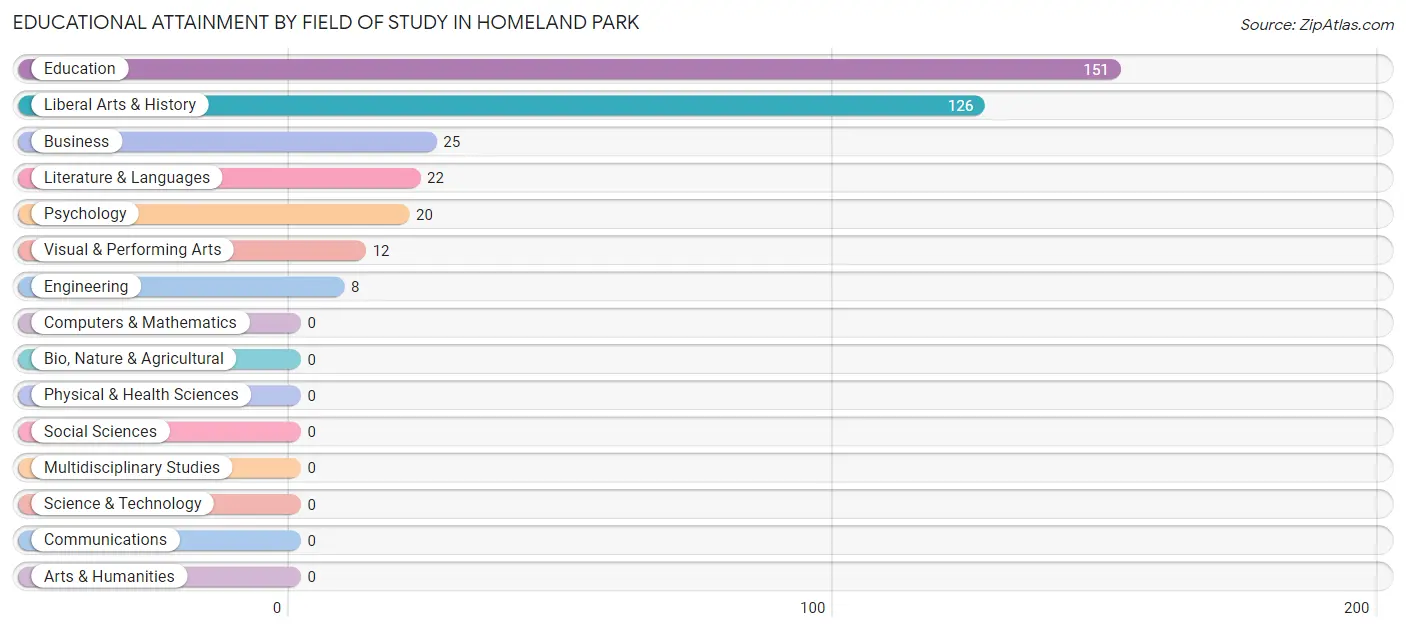
| Field of Study | # Graduates | % Graduates |
| Computers & Mathematics | 0 | 0.0% |
| Bio, Nature & Agricultural | 0 | 0.0% |
| Physical & Health Sciences | 0 | 0.0% |
| Psychology | 20 | 5.5% |
| Social Sciences | 0 | 0.0% |
| Engineering | 8 | 2.2% |
| Multidisciplinary Studies | 0 | 0.0% |
| Science & Technology | 0 | 0.0% |
| Business | 25 | 6.9% |
| Education | 151 | 41.5% |
| Literature & Languages | 22 | 6.0% |
| Liberal Arts & History | 126 | 34.6% |
| Visual & Performing Arts | 12 | 3.3% |
| Communications | 0 | 0.0% |
| Arts & Humanities | 0 | 0.0% |
| Total | 364 | 100.0% |
Transportation & Commute in Homeland Park
Vehicle Availability by Sex in Homeland Park
The most prevalent vehicle ownership categories in Homeland Park are males with 1 vehicle (382, accounting for 25.9%) and females with 1 vehicle (665, making up 25.6%).
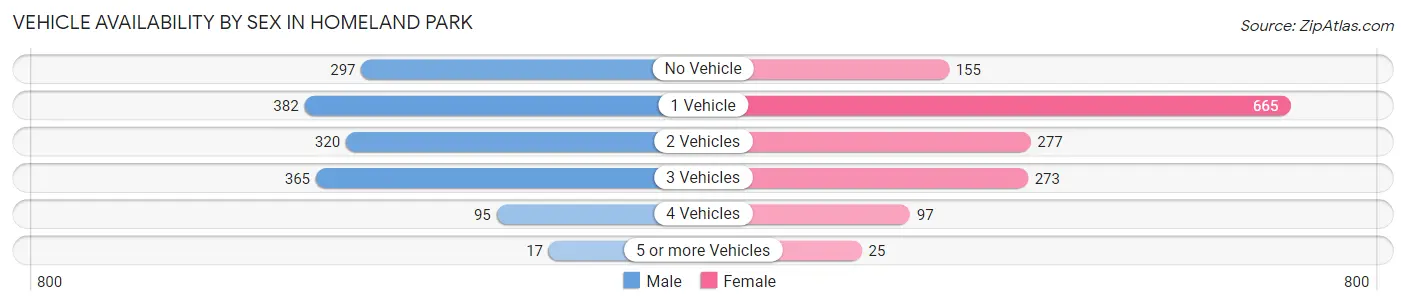
| Vehicles Available | Male | Female |
| No Vehicle | 297 (20.1%) | 155 (10.4%) |
| 1 Vehicle | 382 (25.9%) | 665 (44.6%) |
| 2 Vehicles | 320 (21.7%) | 277 (18.6%) |
| 3 Vehicles | 365 (24.7%) | 273 (18.3%) |
| 4 Vehicles | 95 (6.4%) | 97 (6.5%) |
| 5 or more Vehicles | 17 (1.1%) | 25 (1.7%) |
| Total | 1,476 (100.0%) | 1,492 (100.0%) |
Commute Time in Homeland Park
The most frequently occuring commute durations in Homeland Park are 15 to 19 minutes (801 commuters, 27.7%), 30 to 34 minutes (482 commuters, 16.7%), and 5 to 9 minutes (428 commuters, 14.8%).
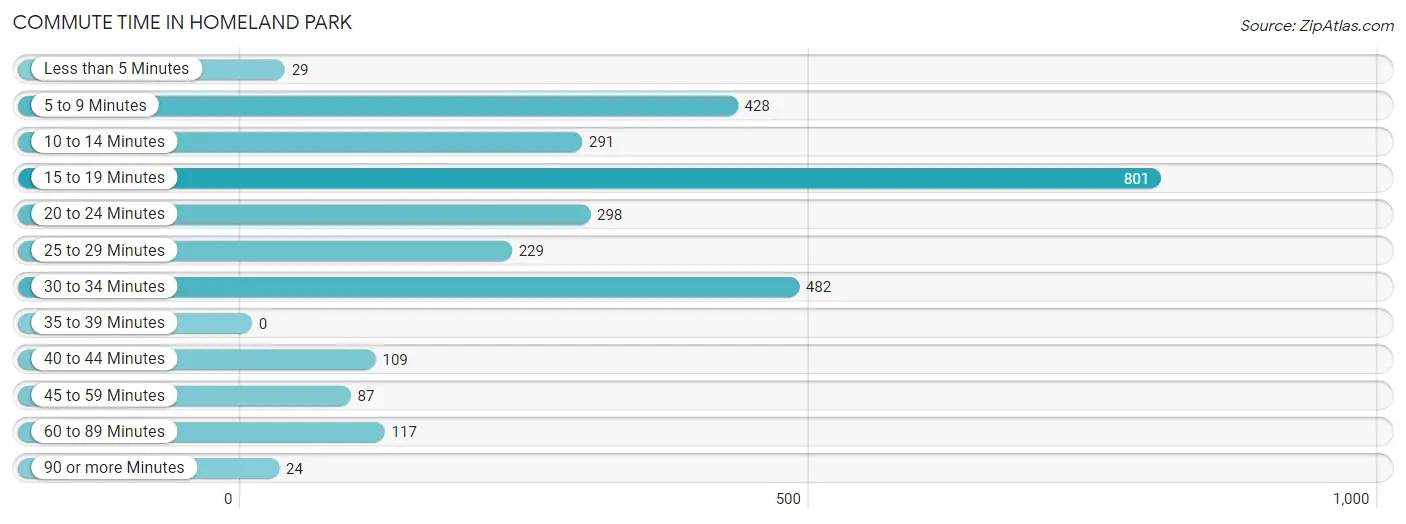
| Commute Time | # Commuters | % Commuters |
| Less than 5 Minutes | 29 | 1.0% |
| 5 to 9 Minutes | 428 | 14.8% |
| 10 to 14 Minutes | 291 | 10.1% |
| 15 to 19 Minutes | 801 | 27.7% |
| 20 to 24 Minutes | 298 | 10.3% |
| 25 to 29 Minutes | 229 | 7.9% |
| 30 to 34 Minutes | 482 | 16.7% |
| 35 to 39 Minutes | 0 | 0.0% |
| 40 to 44 Minutes | 109 | 3.8% |
| 45 to 59 Minutes | 87 | 3.0% |
| 60 to 89 Minutes | 117 | 4.0% |
| 90 or more Minutes | 24 | 0.8% |
Commute Time by Sex in Homeland Park
The most common commute times in Homeland Park are 15 to 19 minutes (374 commuters, 25.3%) for males and 15 to 19 minutes (427 commuters, 30.2%) for females.
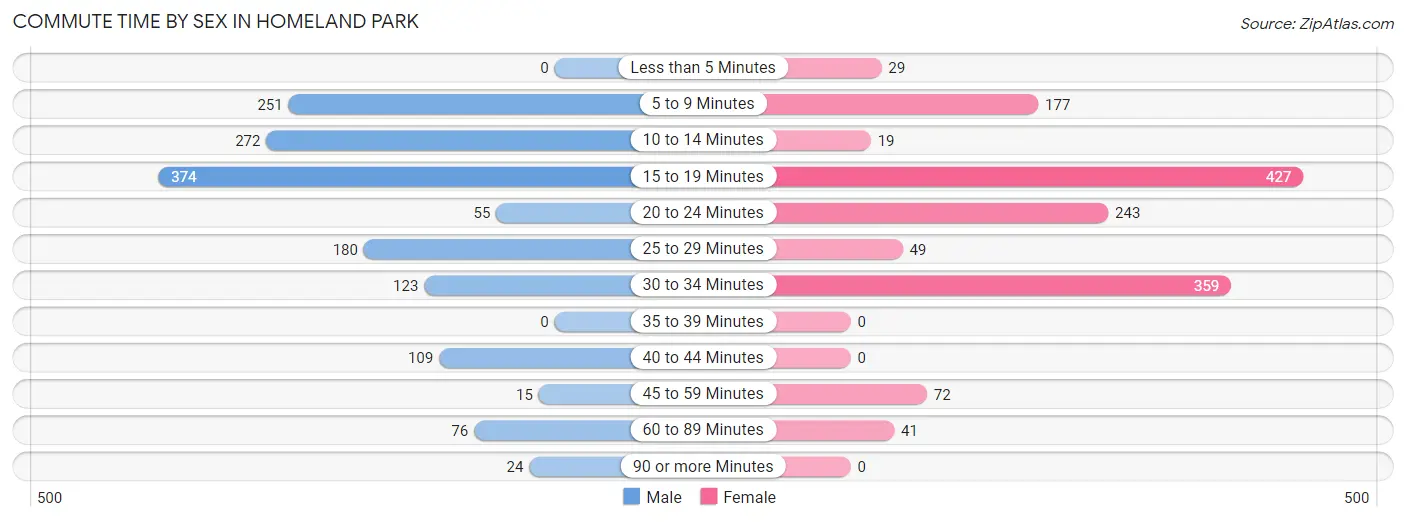
| Commute Time | Male | Female |
| Less than 5 Minutes | 0 (0.0%) | 29 (2.1%) |
| 5 to 9 Minutes | 251 (17.0%) | 177 (12.5%) |
| 10 to 14 Minutes | 272 (18.4%) | 19 (1.3%) |
| 15 to 19 Minutes | 374 (25.3%) | 427 (30.2%) |
| 20 to 24 Minutes | 55 (3.7%) | 243 (17.2%) |
| 25 to 29 Minutes | 180 (12.2%) | 49 (3.5%) |
| 30 to 34 Minutes | 123 (8.3%) | 359 (25.4%) |
| 35 to 39 Minutes | 0 (0.0%) | 0 (0.0%) |
| 40 to 44 Minutes | 109 (7.4%) | 0 (0.0%) |
| 45 to 59 Minutes | 15 (1.0%) | 72 (5.1%) |
| 60 to 89 Minutes | 76 (5.1%) | 41 (2.9%) |
| 90 or more Minutes | 24 (1.6%) | 0 (0.0%) |
Time of Departure to Work by Sex in Homeland Park
The most frequent times of departure to work in Homeland Park are 12:00 PM to 3:59 PM (493, 33.3%) for males and 4:00 PM to 11:59 PM (234, 16.5%) for females.
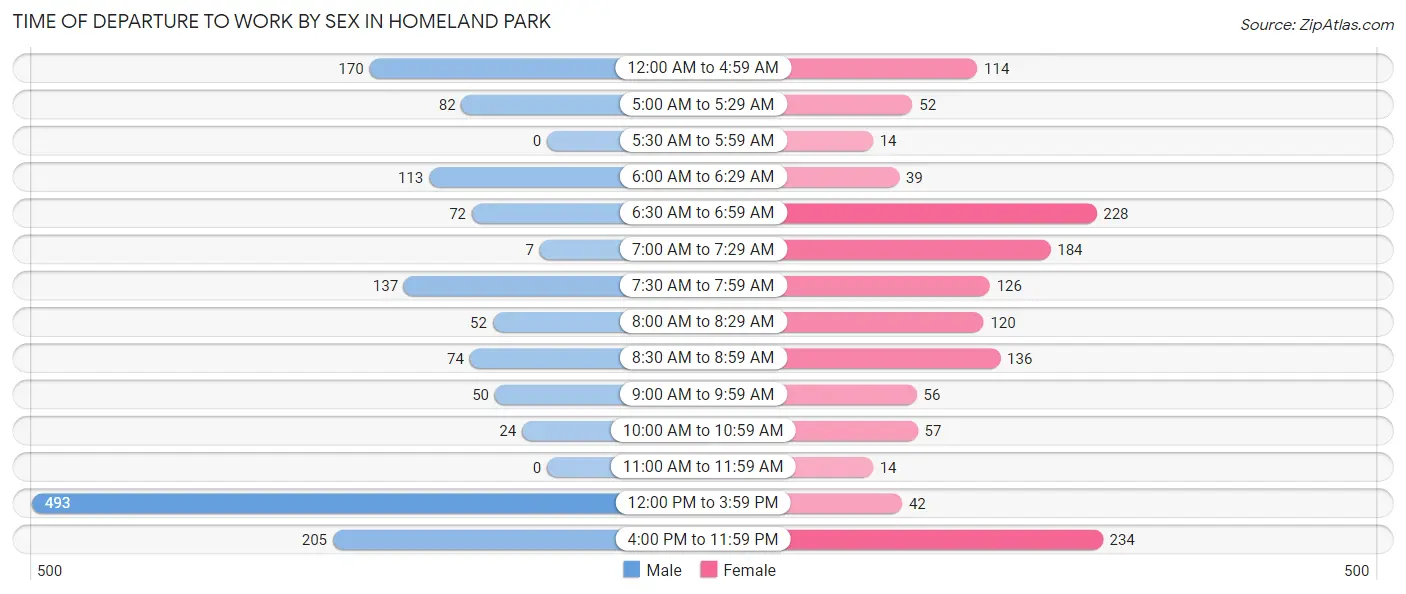
| Time of Departure | Male | Female |
| 12:00 AM to 4:59 AM | 170 (11.5%) | 114 (8.1%) |
| 5:00 AM to 5:29 AM | 82 (5.5%) | 52 (3.7%) |
| 5:30 AM to 5:59 AM | 0 (0.0%) | 14 (1.0%) |
| 6:00 AM to 6:29 AM | 113 (7.6%) | 39 (2.8%) |
| 6:30 AM to 6:59 AM | 72 (4.9%) | 228 (16.1%) |
| 7:00 AM to 7:29 AM | 7 (0.5%) | 184 (13.0%) |
| 7:30 AM to 7:59 AM | 137 (9.3%) | 126 (8.9%) |
| 8:00 AM to 8:29 AM | 52 (3.5%) | 120 (8.5%) |
| 8:30 AM to 8:59 AM | 74 (5.0%) | 136 (9.6%) |
| 9:00 AM to 9:59 AM | 50 (3.4%) | 56 (4.0%) |
| 10:00 AM to 10:59 AM | 24 (1.6%) | 57 (4.0%) |
| 11:00 AM to 11:59 AM | 0 (0.0%) | 14 (1.0%) |
| 12:00 PM to 3:59 PM | 493 (33.3%) | 42 (3.0%) |
| 4:00 PM to 11:59 PM | 205 (13.9%) | 234 (16.5%) |
| Total | 1,479 (100.0%) | 1,416 (100.0%) |
Housing Occupancy in Homeland Park
Occupancy by Ownership in Homeland Park
Of the total 2,932 dwellings in Homeland Park, owner-occupied units account for 1,633 (55.7%), while renter-occupied units make up 1,299 (44.3%).
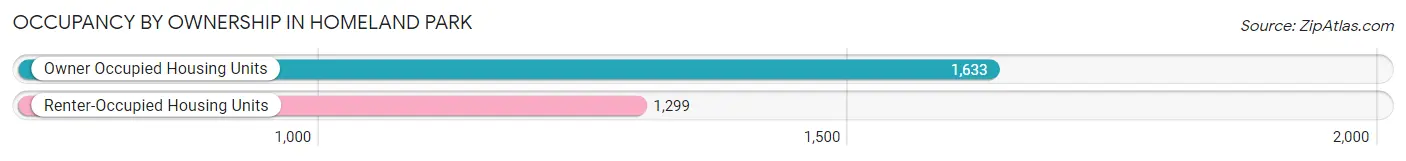
| Occupancy | # Housing Units | % Housing Units |
| Owner Occupied Housing Units | 1,633 | 55.7% |
| Renter-Occupied Housing Units | 1,299 | 44.3% |
| Total Occupied Housing Units | 2,932 | 100.0% |
Occupancy by Household Size in Homeland Park
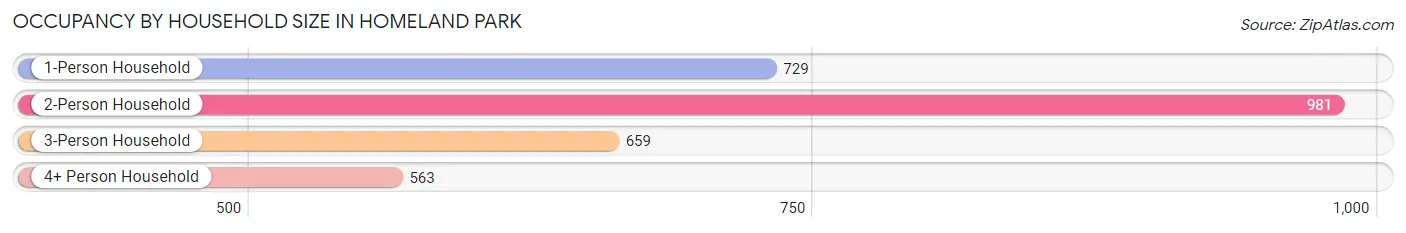
| Household Size | # Housing Units | % Housing Units |
| 1-Person Household | 729 | 24.9% |
| 2-Person Household | 981 | 33.5% |
| 3-Person Household | 659 | 22.5% |
| 4+ Person Household | 563 | 19.2% |
| Total Housing Units | 2,932 | 100.0% |
Occupancy by Ownership by Household Size in Homeland Park
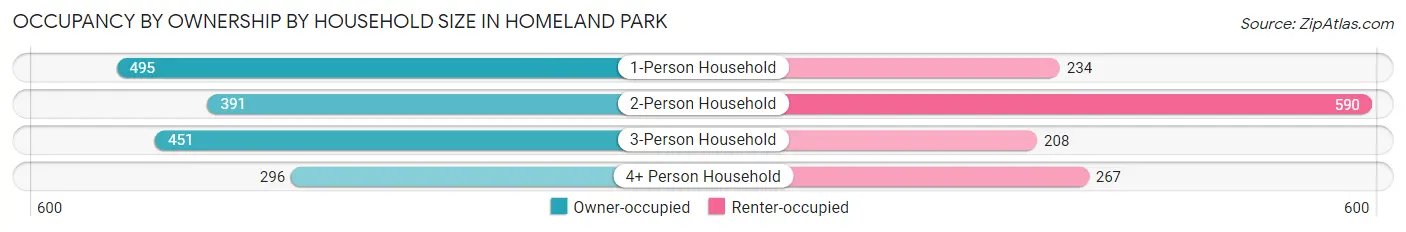
| Household Size | Owner-occupied | Renter-occupied |
| 1-Person Household | 495 (67.9%) | 234 (32.1%) |
| 2-Person Household | 391 (39.9%) | 590 (60.1%) |
| 3-Person Household | 451 (68.4%) | 208 (31.6%) |
| 4+ Person Household | 296 (52.6%) | 267 (47.4%) |
| Total Housing Units | 1,633 (55.7%) | 1,299 (44.3%) |
Occupancy by Educational Attainment in Homeland Park
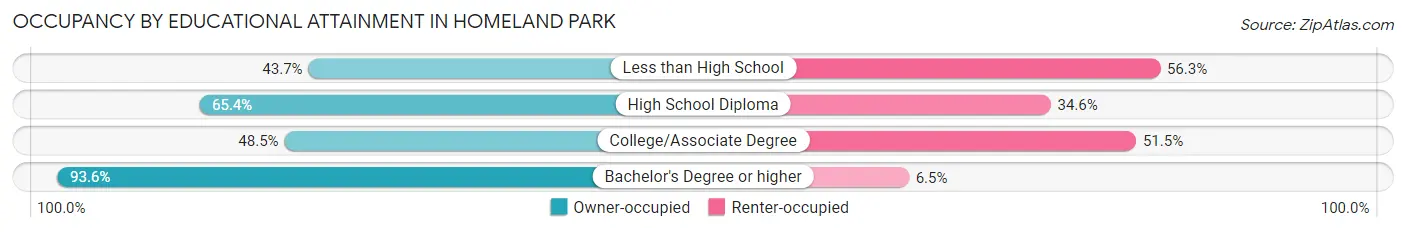
| Household Size | Owner-occupied | Renter-occupied |
| Less than High School | 387 (43.7%) | 498 (56.3%) |
| High School Diploma | 655 (65.4%) | 346 (34.6%) |
| College/Associate Degree | 417 (48.5%) | 443 (51.5%) |
| Bachelor's Degree or higher | 174 (93.5%) | 12 (6.5%) |
Occupancy by Age of Householder in Homeland Park
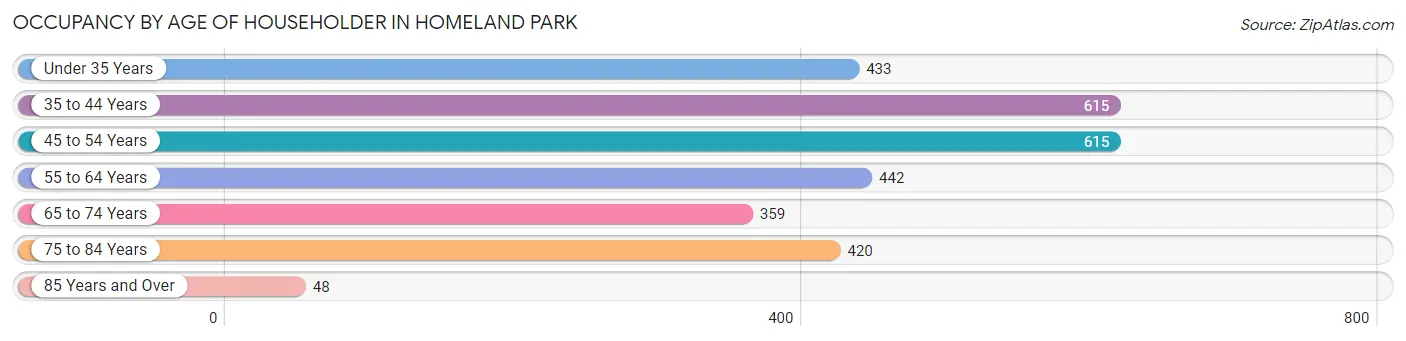
| Age Bracket | # Households | % Households |
| Under 35 Years | 433 | 14.8% |
| 35 to 44 Years | 615 | 21.0% |
| 45 to 54 Years | 615 | 21.0% |
| 55 to 64 Years | 442 | 15.1% |
| 65 to 74 Years | 359 | 12.2% |
| 75 to 84 Years | 420 | 14.3% |
| 85 Years and Over | 48 | 1.6% |
| Total | 2,932 | 100.0% |
Housing Finances in Homeland Park
Median Income by Occupancy in Homeland Park
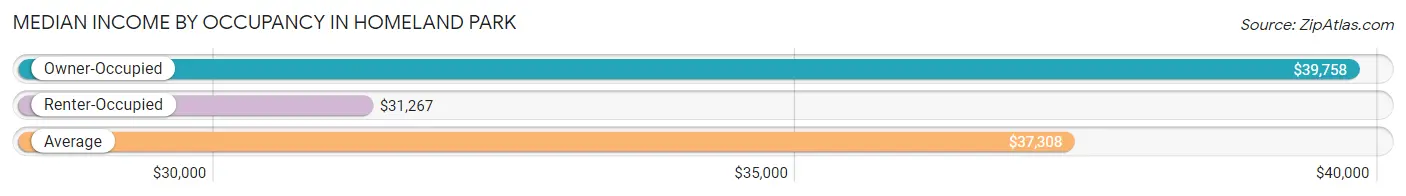
| Occupancy Type | # Households | Median Income |
| Owner-Occupied | 1,633 (55.7%) | $39,758 |
| Renter-Occupied | 1,299 (44.3%) | $31,267 |
| Average | 2,932 (100.0%) | $37,308 |
Occupancy by Householder Income Bracket in Homeland Park
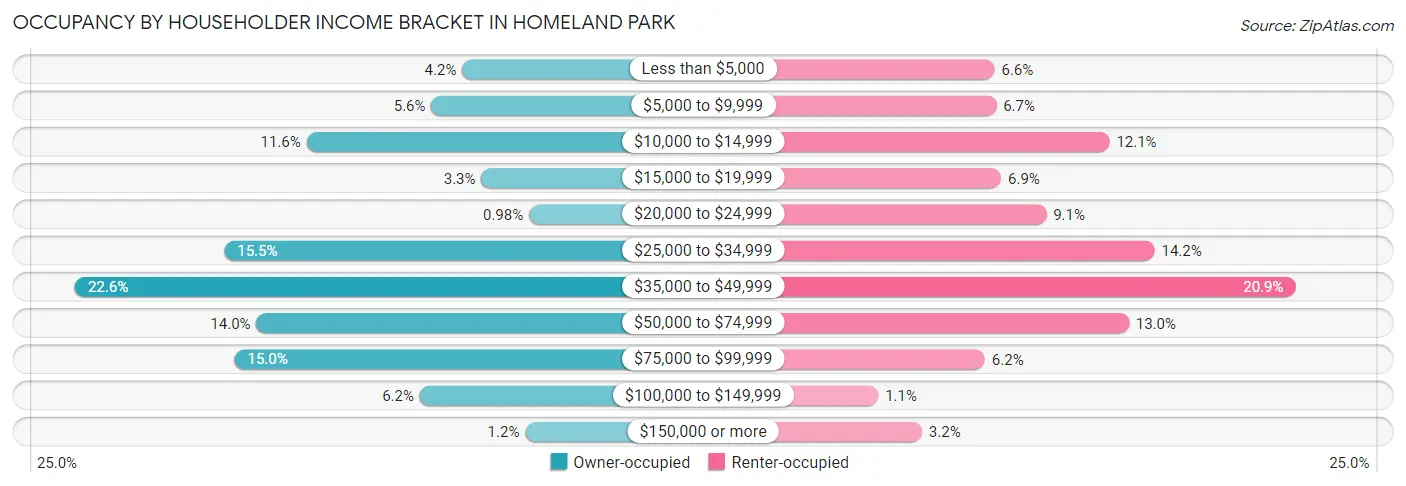
| Income Bracket | Owner-occupied | Renter-occupied |
| Less than $5,000 | 68 (4.2%) | 86 (6.6%) |
| $5,000 to $9,999 | 92 (5.6%) | 87 (6.7%) |
| $10,000 to $14,999 | 189 (11.6%) | 157 (12.1%) |
| $15,000 to $19,999 | 53 (3.3%) | 90 (6.9%) |
| $20,000 to $24,999 | 16 (1.0%) | 118 (9.1%) |
| $25,000 to $34,999 | 253 (15.5%) | 185 (14.2%) |
| $35,000 to $49,999 | 369 (22.6%) | 272 (20.9%) |
| $50,000 to $74,999 | 228 (14.0%) | 169 (13.0%) |
| $75,000 to $99,999 | 245 (15.0%) | 80 (6.2%) |
| $100,000 to $149,999 | 101 (6.2%) | 14 (1.1%) |
| $150,000 or more | 19 (1.2%) | 41 (3.2%) |
| Total | 1,633 (100.0%) | 1,299 (100.0%) |
Monthly Housing Cost Tiers in Homeland Park
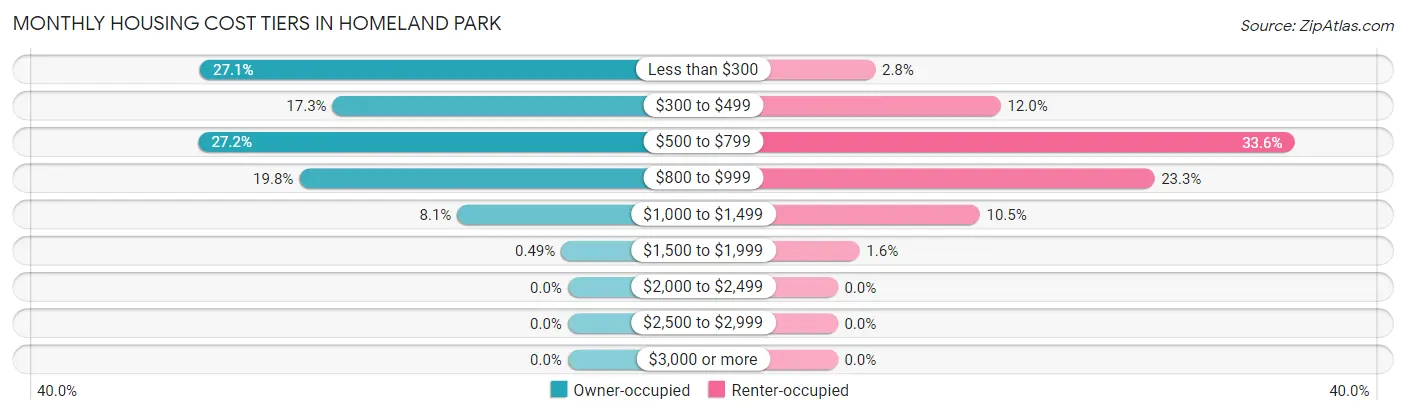
| Monthly Cost | Owner-occupied | Renter-occupied |
| Less than $300 | 442 (27.1%) | 36 (2.8%) |
| $300 to $499 | 283 (17.3%) | 156 (12.0%) |
| $500 to $799 | 444 (27.2%) | 437 (33.6%) |
| $800 to $999 | 323 (19.8%) | 303 (23.3%) |
| $1,000 to $1,499 | 133 (8.1%) | 136 (10.5%) |
| $1,500 to $1,999 | 8 (0.5%) | 21 (1.6%) |
| $2,000 to $2,499 | 0 (0.0%) | 0 (0.0%) |
| $2,500 to $2,999 | 0 (0.0%) | 0 (0.0%) |
| $3,000 or more | 0 (0.0%) | 0 (0.0%) |
| Total | 1,633 (100.0%) | 1,299 (100.0%) |
Physical Housing Characteristics in Homeland Park
Housing Structures in Homeland Park
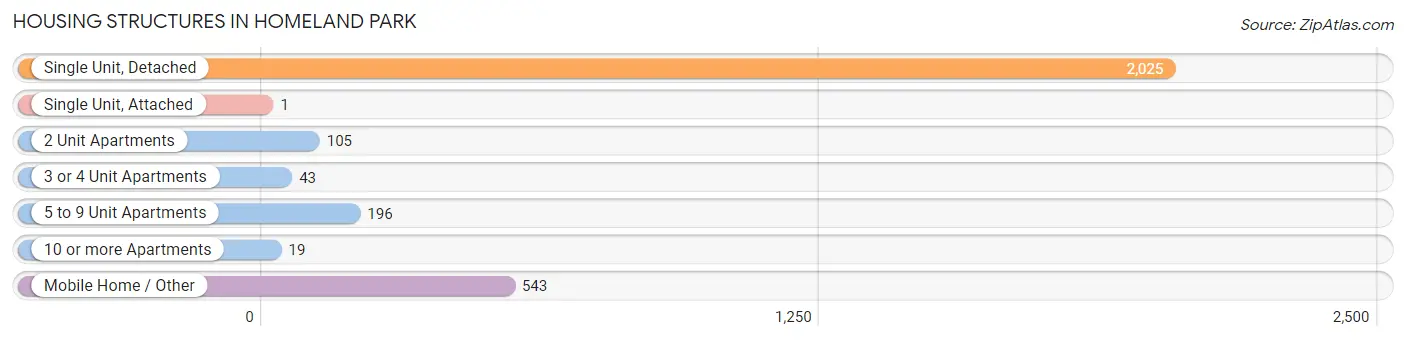
| Structure Type | # Housing Units | % Housing Units |
| Single Unit, Detached | 2,025 | 69.1% |
| Single Unit, Attached | 1 | 0.0% |
| 2 Unit Apartments | 105 | 3.6% |
| 3 or 4 Unit Apartments | 43 | 1.5% |
| 5 to 9 Unit Apartments | 196 | 6.7% |
| 10 or more Apartments | 19 | 0.6% |
| Mobile Home / Other | 543 | 18.5% |
| Total | 2,932 | 100.0% |
Housing Structures by Occupancy in Homeland Park
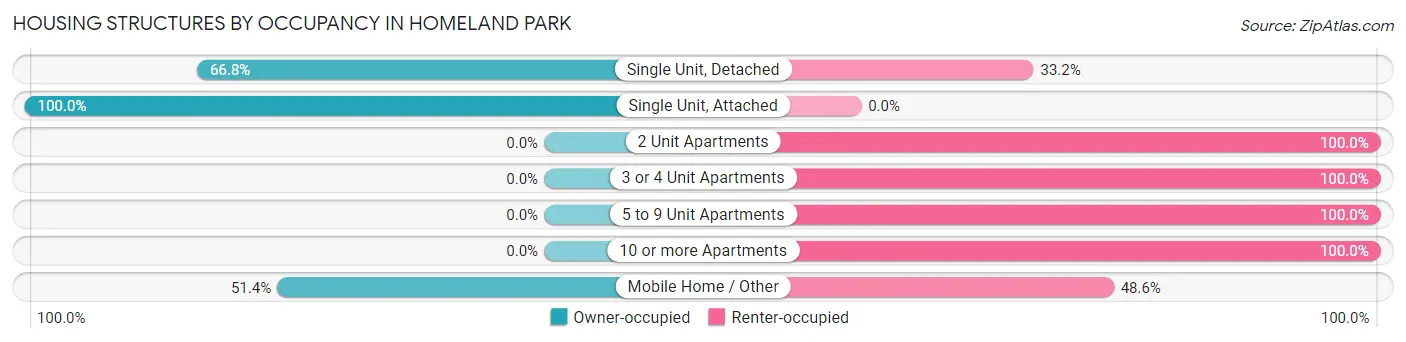
| Structure Type | Owner-occupied | Renter-occupied |
| Single Unit, Detached | 1,353 (66.8%) | 672 (33.2%) |
| Single Unit, Attached | 1 (100.0%) | 0 (0.0%) |
| 2 Unit Apartments | 0 (0.0%) | 105 (100.0%) |
| 3 or 4 Unit Apartments | 0 (0.0%) | 43 (100.0%) |
| 5 to 9 Unit Apartments | 0 (0.0%) | 196 (100.0%) |
| 10 or more Apartments | 0 (0.0%) | 19 (100.0%) |
| Mobile Home / Other | 279 (51.4%) | 264 (48.6%) |
| Total | 1,633 (55.7%) | 1,299 (44.3%) |
Housing Structures by Number of Rooms in Homeland Park
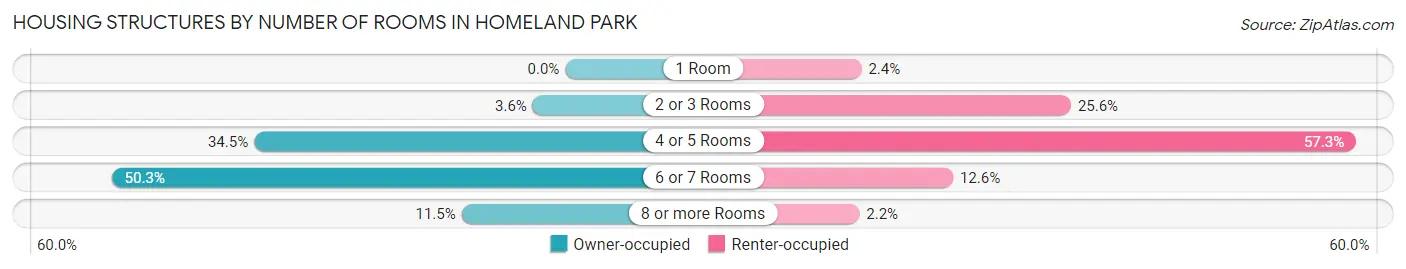
| Number of Rooms | Owner-occupied | Renter-occupied |
| 1 Room | 0 (0.0%) | 31 (2.4%) |
| 2 or 3 Rooms | 59 (3.6%) | 333 (25.6%) |
| 4 or 5 Rooms | 564 (34.5%) | 744 (57.3%) |
| 6 or 7 Rooms | 822 (50.3%) | 163 (12.6%) |
| 8 or more Rooms | 188 (11.5%) | 28 (2.2%) |
| Total | 1,633 (100.0%) | 1,299 (100.0%) |
Housing Structure by Heating Type in Homeland Park
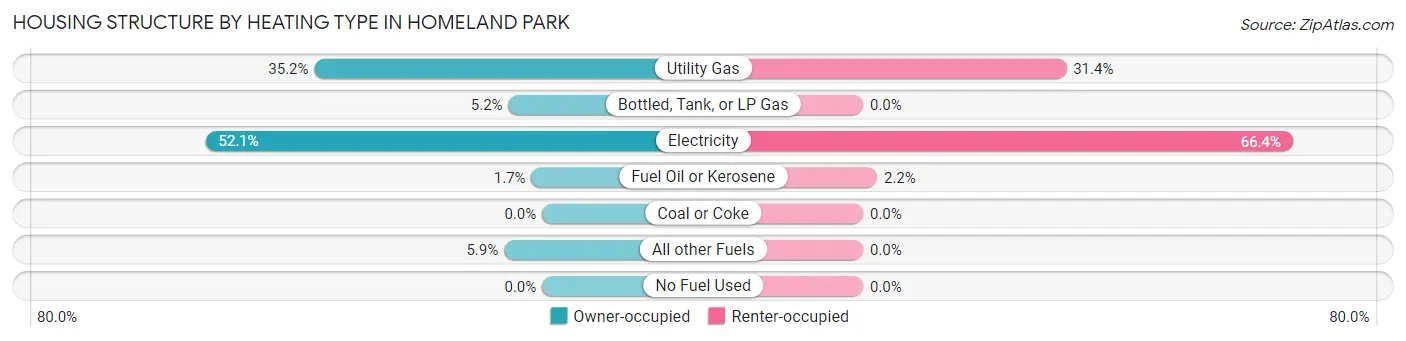
| Heating Type | Owner-occupied | Renter-occupied |
| Utility Gas | 575 (35.2%) | 408 (31.4%) |
| Bottled, Tank, or LP Gas | 85 (5.2%) | 0 (0.0%) |
| Electricity | 850 (52.0%) | 863 (66.4%) |
| Fuel Oil or Kerosene | 27 (1.7%) | 28 (2.2%) |
| Coal or Coke | 0 (0.0%) | 0 (0.0%) |
| All other Fuels | 96 (5.9%) | 0 (0.0%) |
| No Fuel Used | 0 (0.0%) | 0 (0.0%) |
| Total | 1,633 (100.0%) | 1,299 (100.0%) |
Household Vehicle Usage in Homeland Park
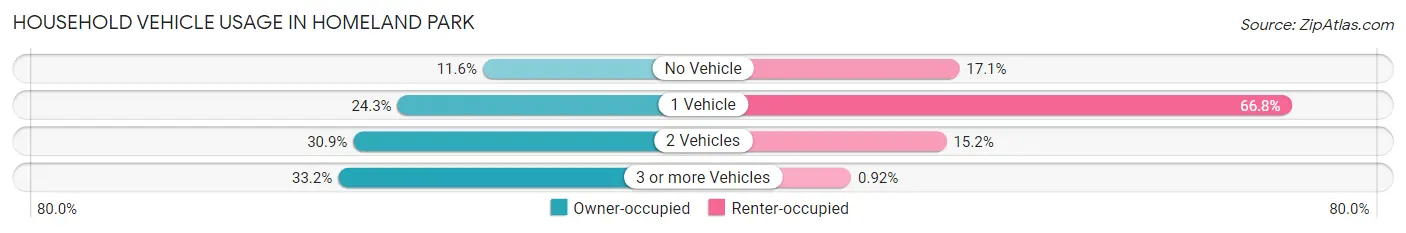
| Vehicles per Household | Owner-occupied | Renter-occupied |
| No Vehicle | 189 (11.6%) | 222 (17.1%) |
| 1 Vehicle | 397 (24.3%) | 868 (66.8%) |
| 2 Vehicles | 505 (30.9%) | 197 (15.2%) |
| 3 or more Vehicles | 542 (33.2%) | 12 (0.9%) |
| Total | 1,633 (100.0%) | 1,299 (100.0%) |
Real Estate & Mortgages in Homeland Park
Real Estate and Mortgage Overview in Homeland Park
| Characteristic | Without Mortgage | With Mortgage |
| Housing Units | 772 | 861 |
| Median Property Value | $68,400 | $91,500 |
| Median Household Income | $26,976 | $19 |
| Monthly Housing Costs | $262 | $0 |
| Real Estate Taxes | $280 | $59 |
Property Value by Mortgage Status in Homeland Park
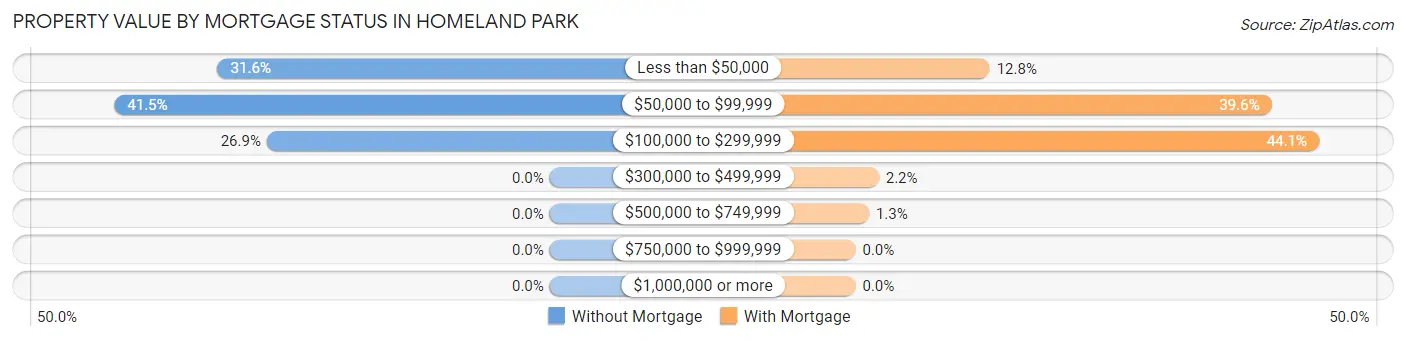
| Property Value | Without Mortgage | With Mortgage |
| Less than $50,000 | 244 (31.6%) | 110 (12.8%) |
| $50,000 to $99,999 | 320 (41.4%) | 341 (39.6%) |
| $100,000 to $299,999 | 208 (26.9%) | 380 (44.1%) |
| $300,000 to $499,999 | 0 (0.0%) | 19 (2.2%) |
| $500,000 to $749,999 | 0 (0.0%) | 11 (1.3%) |
| $750,000 to $999,999 | 0 (0.0%) | 0 (0.0%) |
| $1,000,000 or more | 0 (0.0%) | 0 (0.0%) |
| Total | 772 (100.0%) | 861 (100.0%) |
Household Income by Mortgage Status in Homeland Park
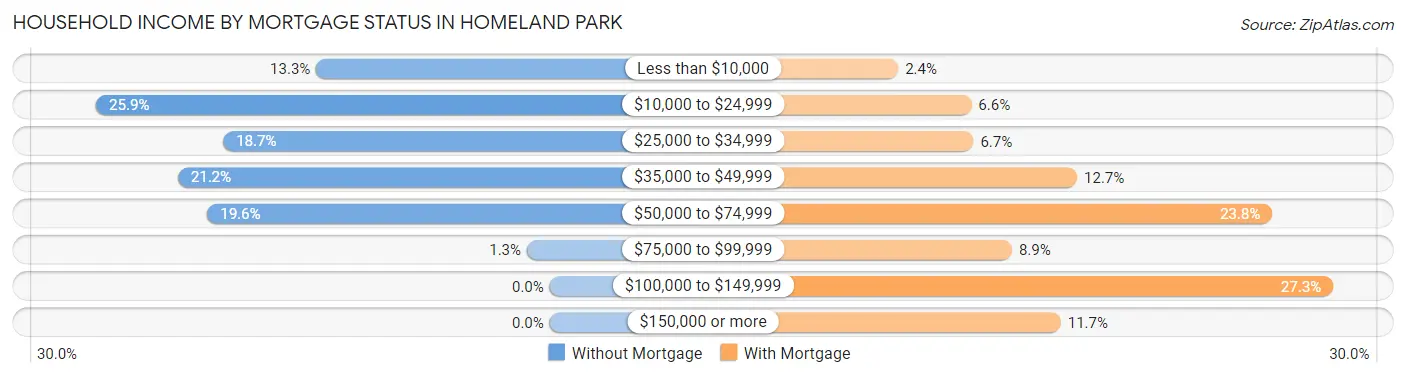
| Household Income | Without Mortgage | With Mortgage |
| Less than $10,000 | 103 (13.3%) | 21 (2.4%) |
| $10,000 to $24,999 | 200 (25.9%) | 57 (6.6%) |
| $25,000 to $34,999 | 144 (18.6%) | 58 (6.7%) |
| $35,000 to $49,999 | 164 (21.2%) | 109 (12.7%) |
| $50,000 to $74,999 | 151 (19.6%) | 205 (23.8%) |
| $75,000 to $99,999 | 10 (1.3%) | 77 (8.9%) |
| $100,000 to $149,999 | 0 (0.0%) | 235 (27.3%) |
| $150,000 or more | 0 (0.0%) | 101 (11.7%) |
| Total | 772 (100.0%) | 861 (100.0%) |
Property Value to Household Income Ratio in Homeland Park
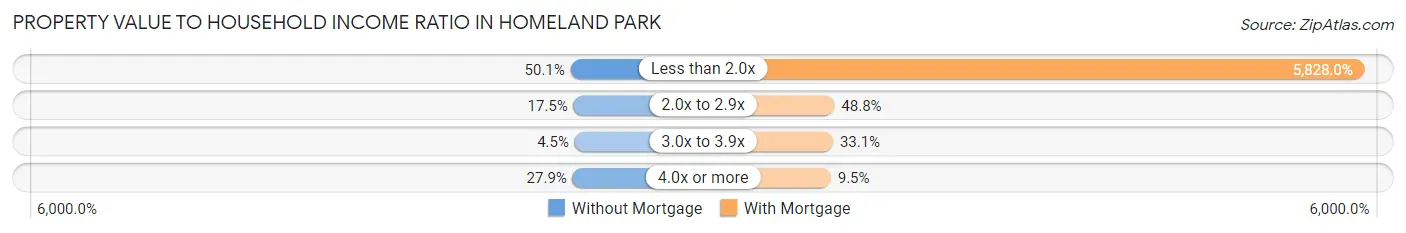
| Value-to-Income Ratio | Without Mortgage | With Mortgage |
| Less than 2.0x | 387 (50.1%) | 50,179 (5,828.0%) |
| 2.0x to 2.9x | 135 (17.5%) | 420 (48.8%) |
| 3.0x to 3.9x | 35 (4.5%) | 285 (33.1%) |
| 4.0x or more | 215 (27.9%) | 82 (9.5%) |
| Total | 772 (100.0%) | 861 (100.0%) |
Real Estate Taxes by Mortgage Status in Homeland Park
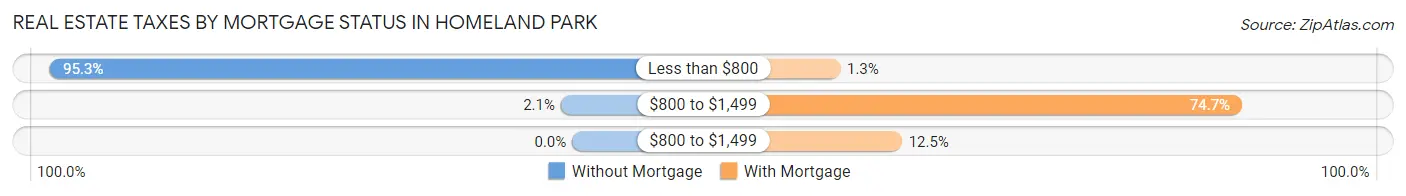
| Property Taxes | Without Mortgage | With Mortgage |
| Less than $800 | 736 (95.3%) | 11 (1.3%) |
| $800 to $1,499 | 16 (2.1%) | 643 (74.7%) |
| $800 to $1,499 | 0 (0.0%) | 108 (12.5%) |
| Total | 772 (100.0%) | 861 (100.0%) |
Health & Disability in Homeland Park
Health Insurance Coverage by Age in Homeland Park
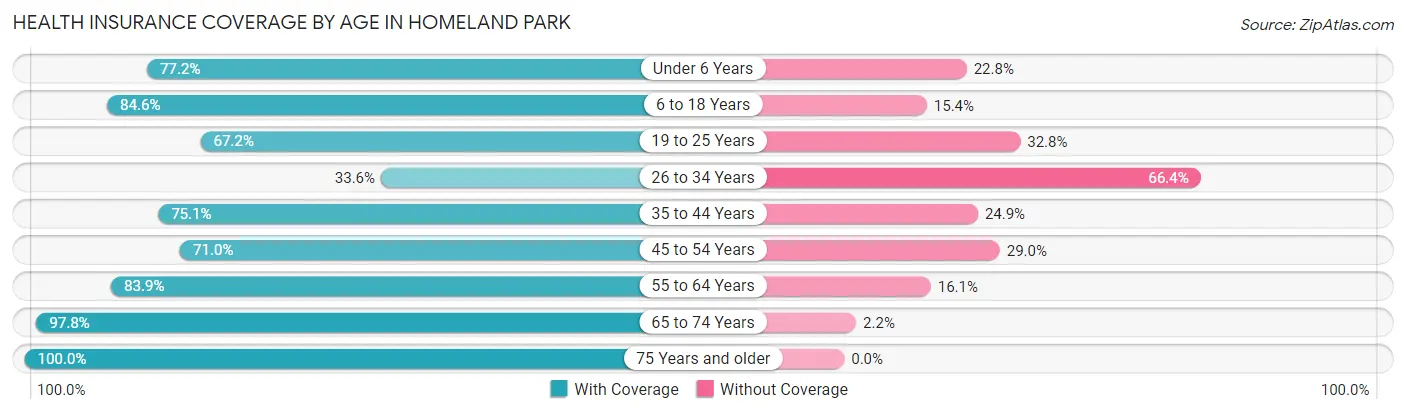
| Age Bracket | With Coverage | Without Coverage |
| Under 6 Years | 365 (77.2%) | 108 (22.8%) |
| 6 to 18 Years | 945 (84.6%) | 172 (15.4%) |
| 19 to 25 Years | 565 (67.2%) | 276 (32.8%) |
| 26 to 34 Years | 282 (33.6%) | 558 (66.4%) |
| 35 to 44 Years | 940 (75.1%) | 312 (24.9%) |
| 45 to 54 Years | 737 (71.0%) | 301 (29.0%) |
| 55 to 64 Years | 546 (83.9%) | 105 (16.1%) |
| 65 to 74 Years | 663 (97.8%) | 15 (2.2%) |
| 75 Years and older | 560 (100.0%) | 0 (0.0%) |
| Total | 5,603 (75.2%) | 1,847 (24.8%) |
Health Insurance Coverage by Citizenship Status in Homeland Park
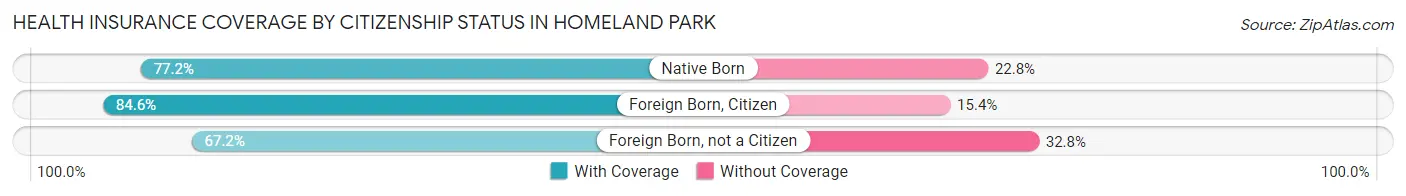
| Citizenship Status | With Coverage | Without Coverage |
| Native Born | 365 (77.2%) | 108 (22.8%) |
| Foreign Born, Citizen | 945 (84.6%) | 172 (15.4%) |
| Foreign Born, not a Citizen | 565 (67.2%) | 276 (32.8%) |
Health Insurance Coverage by Household Income in Homeland Park
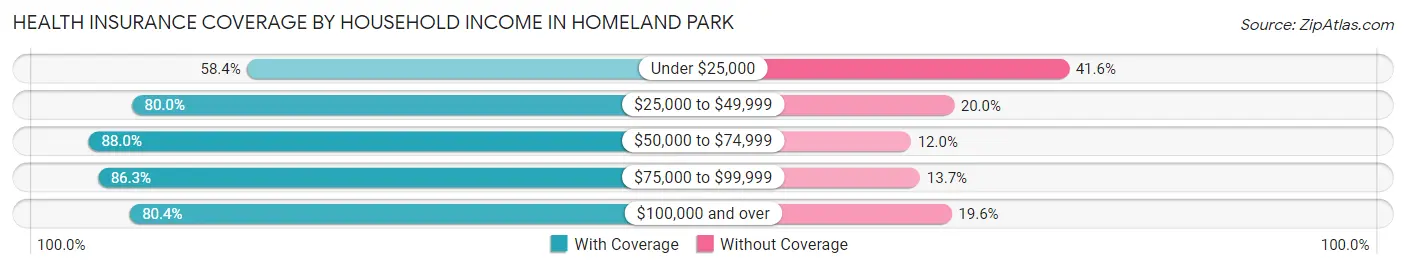
| Household Income | With Coverage | Without Coverage |
| Under $25,000 | 1,315 (58.4%) | 936 (41.6%) |
| $25,000 to $49,999 | 2,271 (80.0%) | 569 (20.0%) |
| $50,000 to $74,999 | 786 (88.0%) | 107 (12.0%) |
| $75,000 to $99,999 | 825 (86.3%) | 131 (13.7%) |
| $100,000 and over | 402 (80.4%) | 98 (19.6%) |
Public vs Private Health Insurance Coverage by Age in Homeland Park
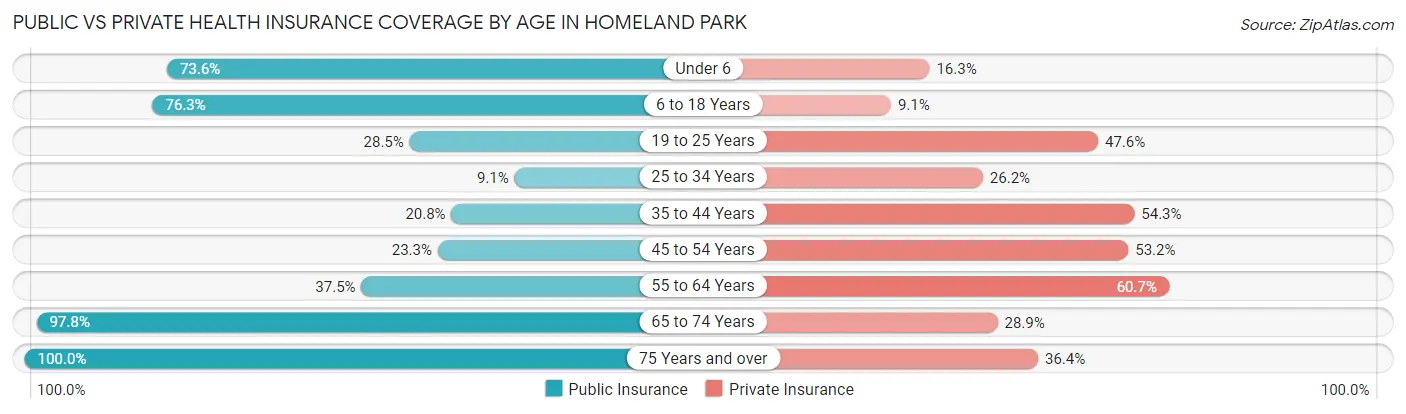
| Age Bracket | Public Insurance | Private Insurance |
| Under 6 | 348 (73.6%) | 77 (16.3%) |
| 6 to 18 Years | 852 (76.3%) | 102 (9.1%) |
| 19 to 25 Years | 240 (28.5%) | 400 (47.6%) |
| 25 to 34 Years | 76 (9.0%) | 220 (26.2%) |
| 35 to 44 Years | 260 (20.8%) | 680 (54.3%) |
| 45 to 54 Years | 242 (23.3%) | 552 (53.2%) |
| 55 to 64 Years | 244 (37.5%) | 395 (60.7%) |
| 65 to 74 Years | 663 (97.8%) | 196 (28.9%) |
| 75 Years and over | 560 (100.0%) | 204 (36.4%) |
| Total | 3,485 (46.8%) | 2,826 (37.9%) |
Disability Status by Sex by Age in Homeland Park
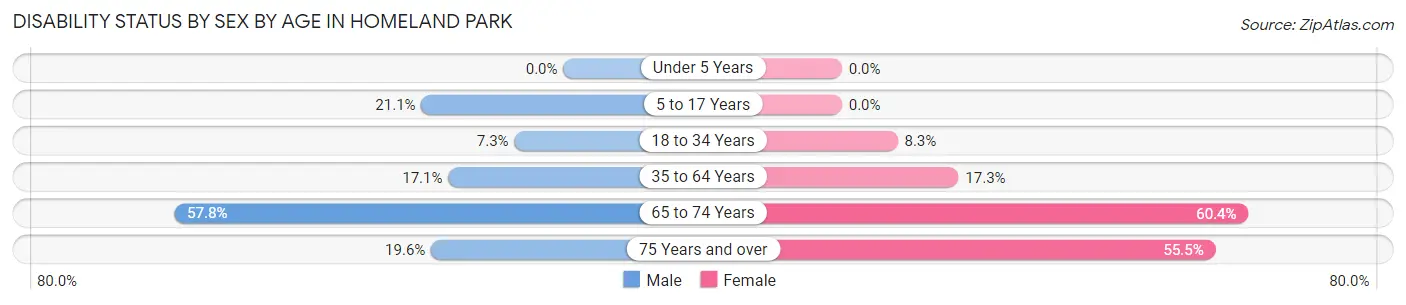
| Age Bracket | Male | Female |
| Under 5 Years | 0 (0.0%) | 0 (0.0%) |
| 5 to 17 Years | 94 (21.1%) | 0 (0.0%) |
| 18 to 34 Years | 67 (7.3%) | 75 (8.3%) |
| 35 to 64 Years | 235 (17.1%) | 271 (17.3%) |
| 65 to 74 Years | 141 (57.8%) | 262 (60.4%) |
| 75 Years and over | 42 (19.6%) | 192 (55.5%) |
Disability Class by Sex by Age in Homeland Park
Disability Class: Hearing Difficulty
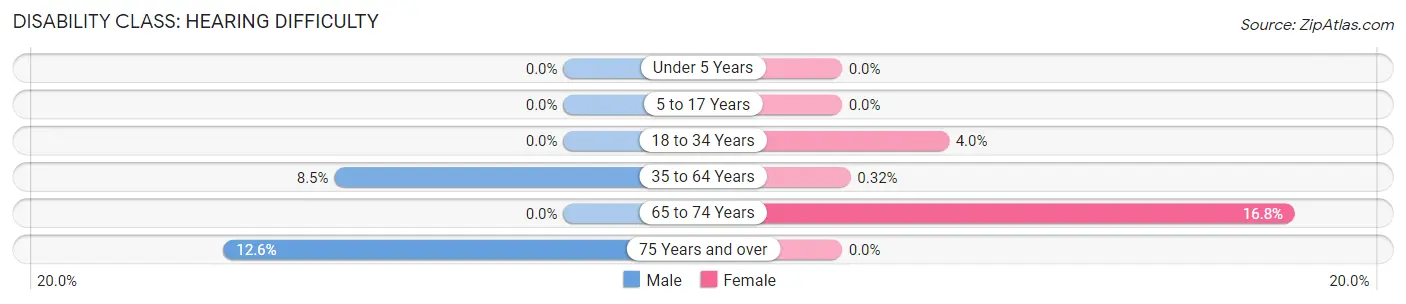
| Age Bracket | Male | Female |
| Under 5 Years | 0 (0.0%) | 0 (0.0%) |
| 5 to 17 Years | 0 (0.0%) | 0 (0.0%) |
| 18 to 34 Years | 0 (0.0%) | 36 (4.0%) |
| 35 to 64 Years | 117 (8.5%) | 5 (0.3%) |
| 65 to 74 Years | 0 (0.0%) | 73 (16.8%) |
| 75 Years and over | 27 (12.6%) | 0 (0.0%) |
Disability Class: Vision Difficulty
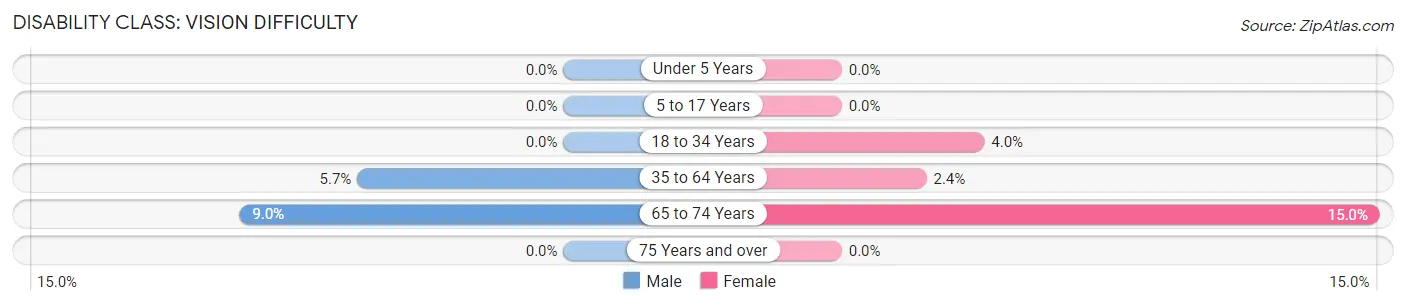
| Age Bracket | Male | Female |
| Under 5 Years | 0 (0.0%) | 0 (0.0%) |
| 5 to 17 Years | 0 (0.0%) | 0 (0.0%) |
| 18 to 34 Years | 0 (0.0%) | 36 (4.0%) |
| 35 to 64 Years | 79 (5.7%) | 37 (2.4%) |
| 65 to 74 Years | 22 (9.0%) | 65 (15.0%) |
| 75 Years and over | 0 (0.0%) | 0 (0.0%) |
Disability Class: Cognitive Difficulty
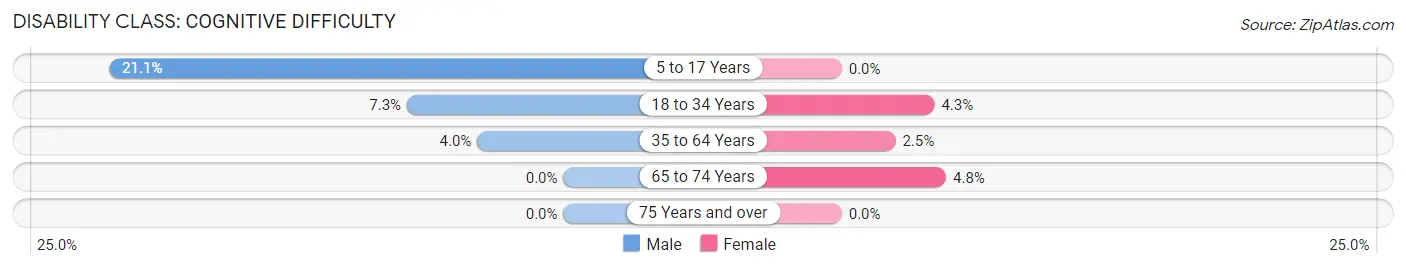
| Age Bracket | Male | Female |
| 5 to 17 Years | 94 (21.1%) | 0 (0.0%) |
| 18 to 34 Years | 67 (7.3%) | 39 (4.3%) |
| 35 to 64 Years | 55 (4.0%) | 39 (2.5%) |
| 65 to 74 Years | 0 (0.0%) | 21 (4.8%) |
| 75 Years and over | 0 (0.0%) | 0 (0.0%) |
Disability Class: Ambulatory Difficulty
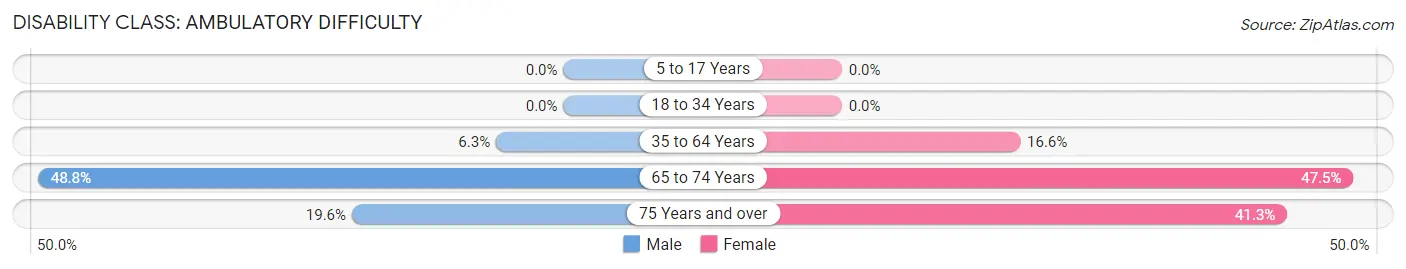
| Age Bracket | Male | Female |
| 5 to 17 Years | 0 (0.0%) | 0 (0.0%) |
| 18 to 34 Years | 0 (0.0%) | 0 (0.0%) |
| 35 to 64 Years | 86 (6.2%) | 259 (16.6%) |
| 65 to 74 Years | 119 (48.8%) | 206 (47.5%) |
| 75 Years and over | 42 (19.6%) | 143 (41.3%) |
Disability Class: Self-Care Difficulty
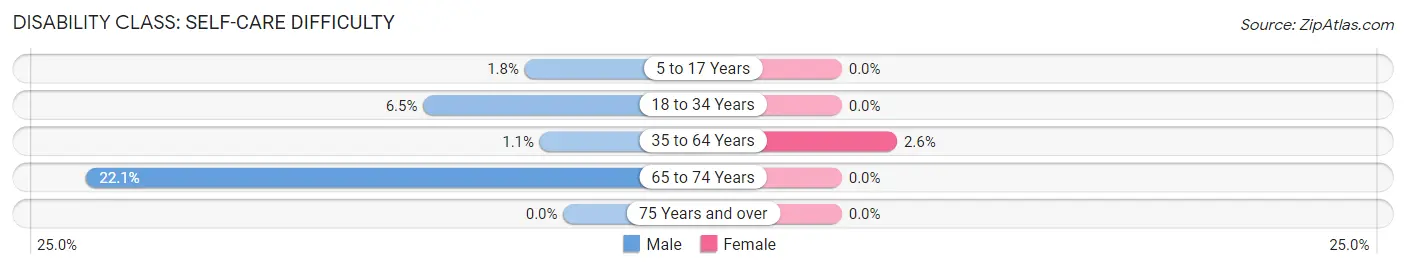
| Age Bracket | Male | Female |
| 5 to 17 Years | 8 (1.8%) | 0 (0.0%) |
| 18 to 34 Years | 60 (6.5%) | 0 (0.0%) |
| 35 to 64 Years | 15 (1.1%) | 40 (2.6%) |
| 65 to 74 Years | 54 (22.1%) | 0 (0.0%) |
| 75 Years and over | 0 (0.0%) | 0 (0.0%) |
Technology Access in Homeland Park
Computing Device Access in Homeland Park
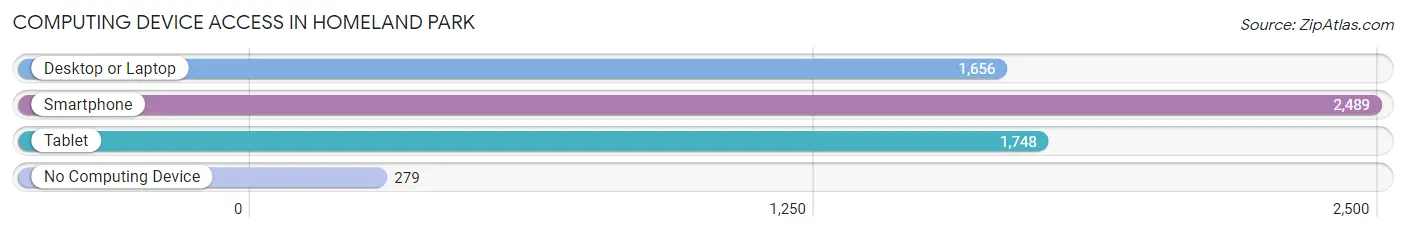
| Device Type | # Households | % Households |
| Desktop or Laptop | 1,656 | 56.5% |
| Smartphone | 2,489 | 84.9% |
| Tablet | 1,748 | 59.6% |
| No Computing Device | 279 | 9.5% |
| Total | 2,932 | 100.0% |
Internet Access in Homeland Park
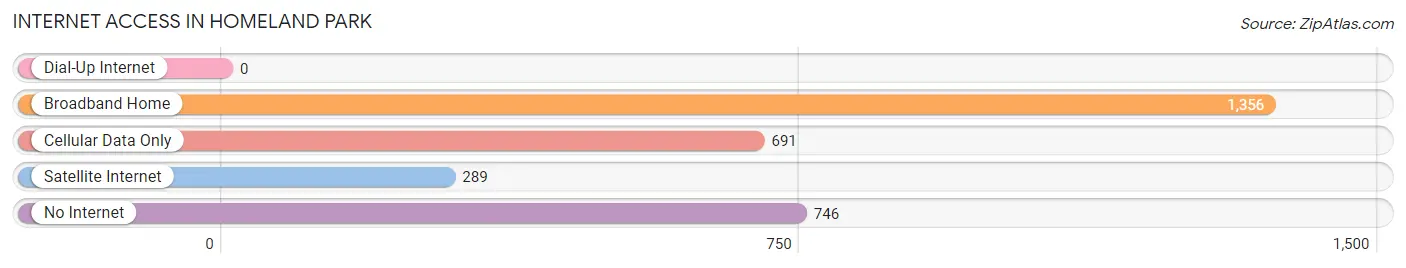
| Internet Type | # Households | % Households |
| Dial-Up Internet | 0 | 0.0% |
| Broadband Home | 1,356 | 46.3% |
| Cellular Data Only | 691 | 23.6% |
| Satellite Internet | 289 | 9.9% |
| No Internet | 746 | 25.4% |
| Total | 2,932 | 100.0% |
Homeland Park Summary
Homeland Park is a small unincorporated community located in Anderson County, South Carolina. It is situated along the banks of Lake Hartwell, a large reservoir created by the Hartwell Dam on the Savannah River. The community is located approximately 10 miles south of Anderson, the county seat, and is part of the Anderson Metropolitan Statistical Area.
History
The area that is now Homeland Park was originally inhabited by the Cherokee Indians. The first European settlers arrived in the area in the late 1700s and early 1800s. The community was originally known as “Homeland” and was established in 1820. The name was changed to “Homeland Park” in the early 1900s.
The community was primarily an agricultural area, with cotton and tobacco being the main crops. In the early 1900s, the community began to develop as a resort area, with several hotels and resorts being built along the lake. The area also became a popular destination for fishing and boating.
In the 1950s, the community began to experience rapid growth as the Anderson area became more industrialized. The population of Homeland Park increased from 1,000 in 1950 to over 5,000 by the end of the decade.
Geography
Homeland Park is located in Anderson County, South Carolina, approximately 10 miles south of Anderson, the county seat. The community is situated along the banks of Lake Hartwell, a large reservoir created by the Hartwell Dam on the Savannah River. The lake is a popular destination for fishing, boating, and other recreational activities.
The community is located in the foothills of the Blue Ridge Mountains and is surrounded by rolling hills and forests. The climate is mild, with temperatures ranging from the mid-50s in the winter to the mid-80s in the summer.
Economy
The economy of Homeland Park is largely based on tourism and recreation. The community is a popular destination for fishing, boating, and other recreational activities. There are several hotels and resorts located in the area, as well as several restaurants and shops.
The community is also home to several manufacturing and industrial businesses, including a paper mill and a plastics plant. The local economy is also supported by agriculture, with cotton and tobacco being the main crops.
Demographics
As of the 2010 census, the population of Homeland Park was 5,845. The racial makeup of the community was 79.3% White, 16.2% African American, 0.7% Native American, 0.7% Asian, 0.1% Pacific Islander, and 2.9% from other races. The median household income was $37,917, and the median family income was $45,938.
The majority of the population (90.3%) is over the age of 18, and the median age is 41. The population is evenly split between males and females, with 50.2% being male and 49.8% being female. The majority of the population (90.3%) is over the age of 18, and the median age is 41.
Conclusion
Homeland Park is a small unincorporated community located in Anderson County, South Carolina. It is situated along the banks of Lake Hartwell, a large reservoir created by the Hartwell Dam on the Savannah River. The community is primarily a tourist and recreational destination, with several hotels and resorts located in the area. The economy is also supported by manufacturing and industrial businesses, as well as agriculture. The population of Homeland Park is 5,845, with the majority of the population being over the age of 18 and the median age being 41.
Common Questions
What is Per Capita Income in Homeland Park?
Per Capita income in Homeland Park is $19,621.
What is the Median Family Income in Homeland Park?
Median Family Income in Homeland Park is $39,933.
What is the Median Household income in Homeland Park?
Median Household Income in Homeland Park is $37,308.
What is Income or Wage Gap in Homeland Park?
Income or Wage Gap in Homeland Park is 17.0%.
Women in Homeland Park earn 83.0 cents for every dollar earned by a man.
What is Inequality or Gini Index in Homeland Park?
Inequality or Gini Index in Homeland Park is 0.48.
What is the Total Population of Homeland Park?
Total Population of Homeland Park is 7,451.
What is the Total Male Population of Homeland Park?
Total Male Population of Homeland Park is 3,451.
What is the Total Female Population of Homeland Park?
Total Female Population of Homeland Park is 4,000.
What is the Ratio of Males per 100 Females in Homeland Park?
There are 86.28 Males per 100 Females in Homeland Park.
What is the Ratio of Females per 100 Males in Homeland Park?
There are 115.91 Females per 100 Males in Homeland Park.
What is the Median Population Age in Homeland Park?
Median Population Age in Homeland Park is 40.8 Years.
What is the Average Family Size in Homeland Park
Average Family Size in Homeland Park is 3.0 People.
What is the Average Household Size in Homeland Park
Average Household Size in Homeland Park is 2.5 People.
How Large is the Labor Force in Homeland Park?
There are 3,545 People in the Labor Forcein in Homeland Park.
What is the Percentage of People in the Labor Force in Homeland Park?
58.1% of People are in the Labor Force in Homeland Park.
What is the Unemployment Rate in Homeland Park?
Unemployment Rate in Homeland Park is 13.2%.