Sans Souci, SC Map & Demographics
Sans Souci Map
Sans Souci Overview
$28,238
PER CAPITA INCOME
$58,143
AVG FAMILY INCOME
$40,995
AVG HOUSEHOLD INCOME
18.0%
WAGE / INCOME GAP [ % ]
82.0¢/ $1
WAGE / INCOME GAP [ $ ]
0.45
INEQUALITY / GINI INDEX
8,042
TOTAL POPULATION
3,772
MALE POPULATION
4,270
FEMALE POPULATION
88.34
MALES / 100 FEMALES
113.20
FEMALES / 100 MALES
40.5
MEDIAN AGE
3.0
AVG FAMILY SIZE
2.1
AVG HOUSEHOLD SIZE
4,467
LABOR FORCE [ PEOPLE ]
66.7%
PERCENT IN LABOR FORCE
4.5%
UNEMPLOYMENT RATE
Income in Sans Souci
Income Overview in Sans Souci
Per Capita Income in Sans Souci is $28,238, while median incomes of families and households are $58,143 and $40,995 respectively.
| Characteristic | Number | Measure |
| Per Capita Income | 8,042 | $28,238 |
| Median Family Income | 1,822 | $58,143 |
| Mean Family Income | 1,822 | $70,276 |
| Median Household Income | 3,801 | $40,995 |
| Mean Household Income | 3,801 | $57,533 |
| Income Deficit | 1,822 | $0 |
| Wage / Income Gap (%) | 8,042 | 17.96% |
| Wage / Income Gap ($) | 8,042 | 82.04¢ per $1 |
| Gini / Inequality Index | 8,042 | 0.45 |
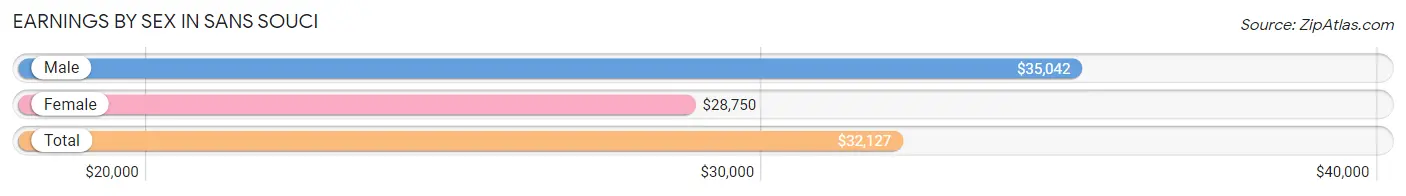
Earnings by Sex in Sans Souci
Average Earnings in Sans Souci are $32,127, $35,042 for men and $28,750 for women, a difference of 18.0%.
| Sex | Number | Average Earnings |
| Male | 2,399 (52.2%) | $35,042 |
| Female | 2,200 (47.8%) | $28,750 |
| Total | 4,599 (100.0%) | $32,127 |
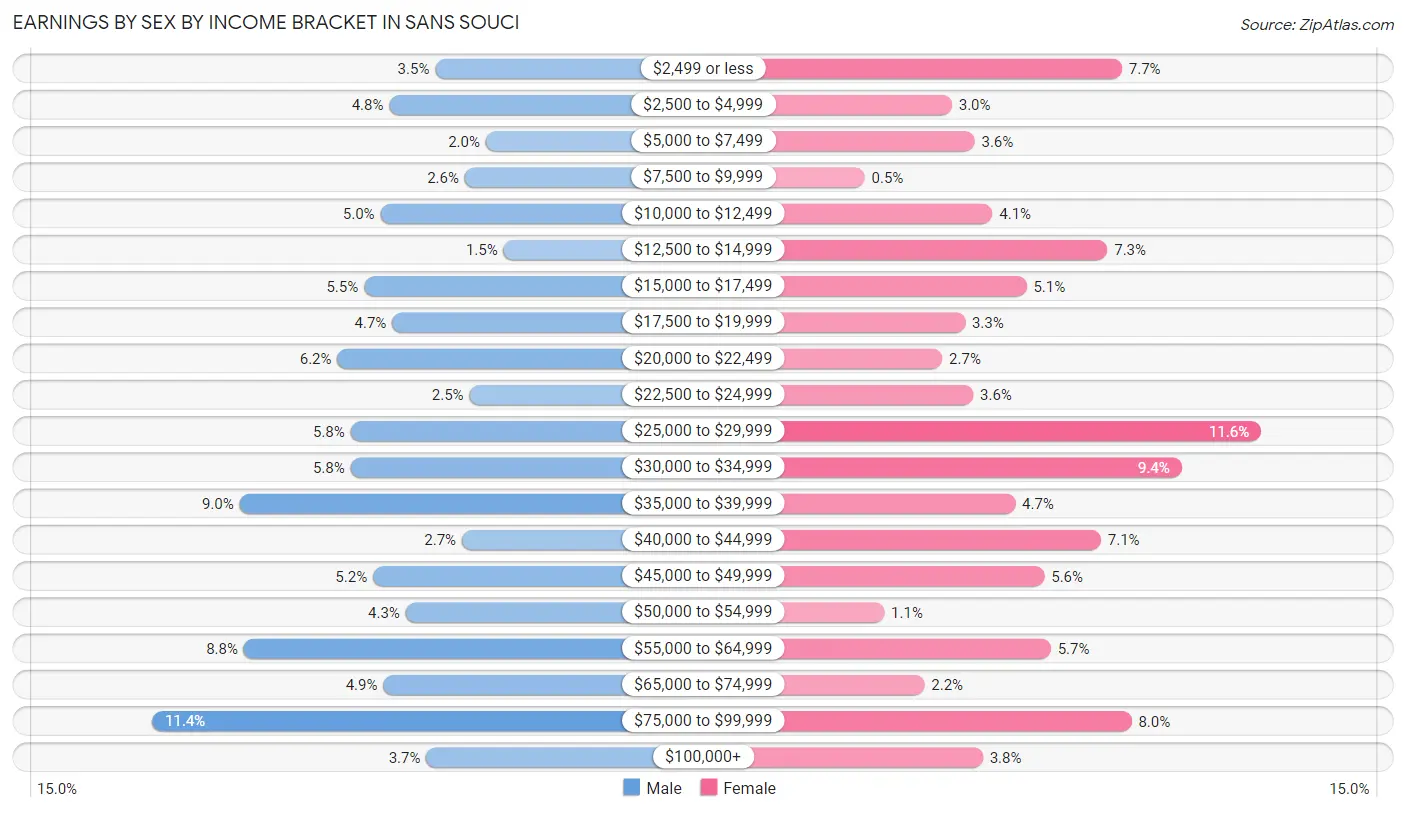
Earnings by Sex by Income Bracket in Sans Souci
The most common earnings brackets in Sans Souci are $75,000 to $99,999 for men (274 | 11.4%) and $25,000 to $29,999 for women (256 | 11.6%).
| Income | Male | Female |
| $2,499 or less | 83 (3.5%) | 170 (7.7%) |
| $2,500 to $4,999 | 114 (4.8%) | 65 (2.9%) |
| $5,000 to $7,499 | 49 (2.0%) | 79 (3.6%) |
| $7,500 to $9,999 | 63 (2.6%) | 11 (0.5%) |
| $10,000 to $12,499 | 120 (5.0%) | 90 (4.1%) |
| $12,500 to $14,999 | 37 (1.5%) | 161 (7.3%) |
| $15,000 to $17,499 | 131 (5.5%) | 111 (5.1%) |
| $17,500 to $19,999 | 112 (4.7%) | 73 (3.3%) |
| $20,000 to $22,499 | 149 (6.2%) | 59 (2.7%) |
| $22,500 to $24,999 | 60 (2.5%) | 78 (3.5%) |
| $25,000 to $29,999 | 140 (5.8%) | 256 (11.6%) |
| $30,000 to $34,999 | 140 (5.8%) | 207 (9.4%) |
| $35,000 to $39,999 | 215 (9.0%) | 104 (4.7%) |
| $40,000 to $44,999 | 65 (2.7%) | 157 (7.1%) |
| $45,000 to $49,999 | 125 (5.2%) | 122 (5.6%) |
| $50,000 to $54,999 | 103 (4.3%) | 23 (1.1%) |
| $55,000 to $64,999 | 212 (8.8%) | 126 (5.7%) |
| $65,000 to $74,999 | 118 (4.9%) | 48 (2.2%) |
| $75,000 to $99,999 | 274 (11.4%) | 176 (8.0%) |
| $100,000+ | 89 (3.7%) | 84 (3.8%) |
| Total | 2,399 (100.0%) | 2,200 (100.0%) |
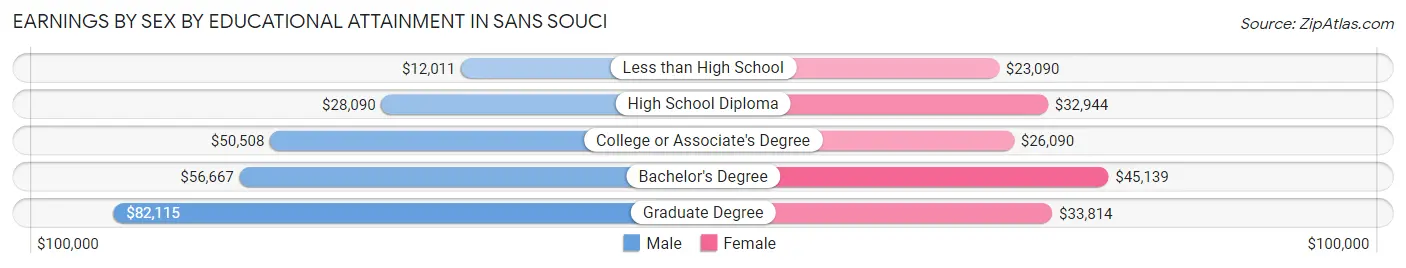
Earnings by Sex by Educational Attainment in Sans Souci
Average earnings in Sans Souci are $36,333 for men and $30,411 for women, a difference of 16.3%. Men with an educational attainment of graduate degree enjoy the highest average annual earnings of $82,115, while those with less than high school education earn the least with $12,011. Women with an educational attainment of bachelor's degree earn the most with the average annual earnings of $45,139, while those with less than high school education have the smallest earnings of $23,090.
| Educational Attainment | Male Income | Female Income |
| Less than High School | $12,011 | $23,090 |
| High School Diploma | $28,090 | $32,944 |
| College or Associate's Degree | $50,508 | $26,090 |
| Bachelor's Degree | $56,667 | $45,139 |
| Graduate Degree | $82,115 | $33,814 |
| Total | $36,333 | $30,411 |
Family Income in Sans Souci
Family Income Brackets in Sans Souci
According to the Sans Souci family income data, there are 404 families falling into the $35,000 to $49,999 income range, which is the most common income bracket and makes up 22.2% of all families. Conversely, the $10,000 to $14,999 income bracket is the least frequent group with only 35 families (1.9%) belonging to this category.
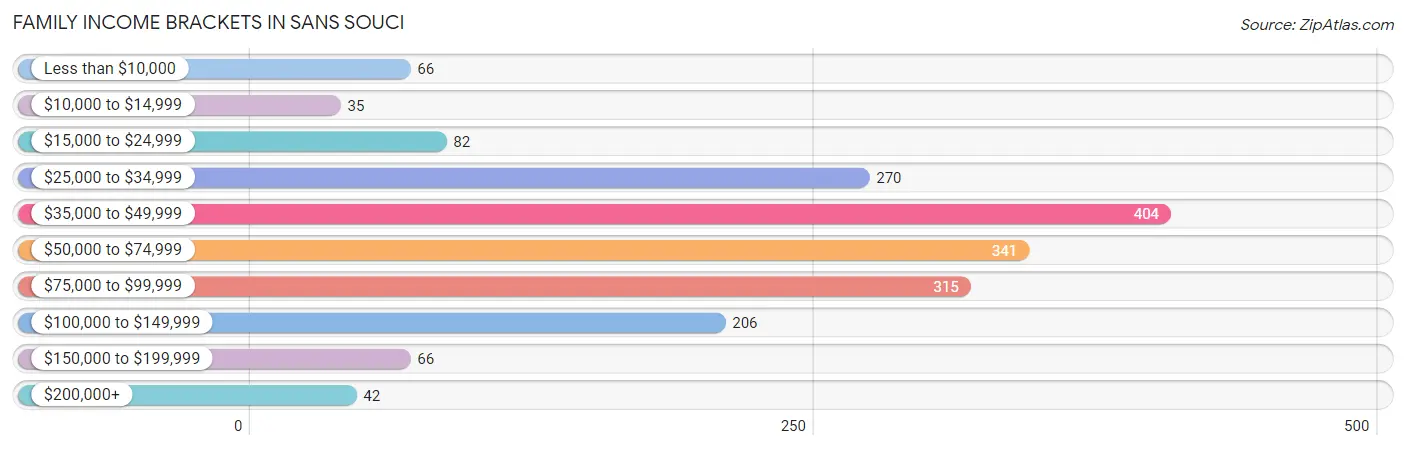
| Income Bracket | # Families | % Families |
| Less than $10,000 | 66 | 3.6% |
| $10,000 to $14,999 | 35 | 1.9% |
| $15,000 to $24,999 | 82 | 4.5% |
| $25,000 to $34,999 | 270 | 14.8% |
| $35,000 to $49,999 | 404 | 22.2% |
| $50,000 to $74,999 | 341 | 18.7% |
| $75,000 to $99,999 | 315 | 17.3% |
| $100,000 to $149,999 | 206 | 11.3% |
| $150,000 to $199,999 | 66 | 3.6% |
| $200,000+ | 42 | 2.3% |
Family Income by Famaliy Size in Sans Souci
5-person families (68 | 3.7%) account for the highest median family income in Sans Souci with $117,656 per family, while 2-person families (883 | 48.5%) have the highest median income of $28,164 per family member.
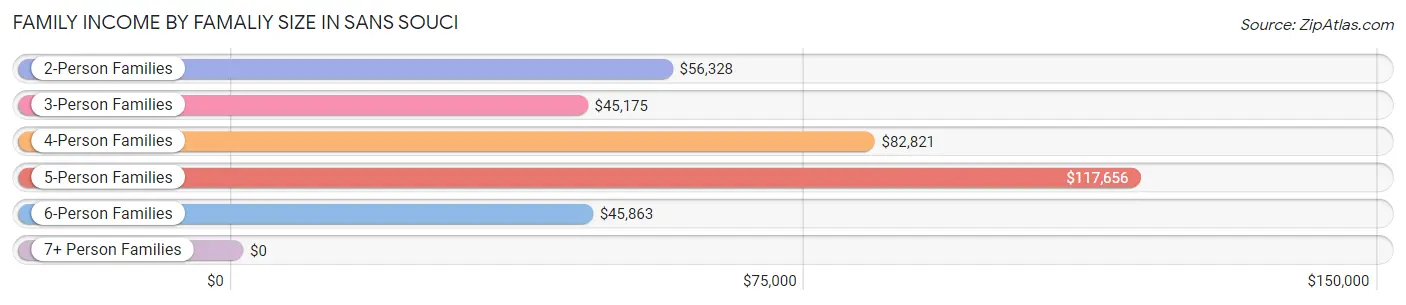
| Income Bracket | # Families | Median Income |
| 2-Person Families | 883 (48.5%) | $56,328 |
| 3-Person Families | 429 (23.5%) | $45,175 |
| 4-Person Families | 320 (17.6%) | $82,821 |
| 5-Person Families | 68 (3.7%) | $117,656 |
| 6-Person Families | 107 (5.9%) | $45,863 |
| 7+ Person Families | 15 (0.8%) | $0 |
| Total | 1,822 (100.0%) | $58,143 |
Family Income by Number of Earners in Sans Souci
The median family income in Sans Souci is $58,143, with families comprising 3+ earners (190) having the highest median family income of $88,553, while families with no earners (222) have the lowest median family income of $34,143, accounting for 10.4% and 12.2% of families, respectively.
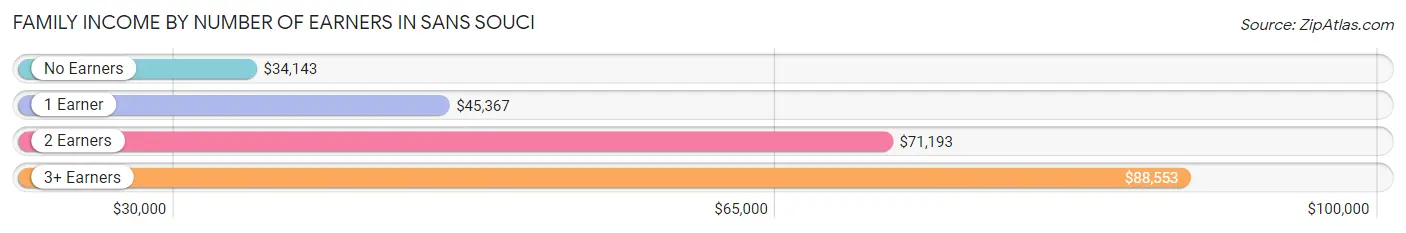
| Number of Earners | # Families | Median Income |
| No Earners | 222 (12.2%) | $34,143 |
| 1 Earner | 729 (40.0%) | $45,367 |
| 2 Earners | 681 (37.4%) | $71,193 |
| 3+ Earners | 190 (10.4%) | $88,553 |
| Total | 1,822 (100.0%) | $58,143 |
Household Income in Sans Souci
Household Income Brackets in Sans Souci
With 707 households falling in the category, the $35,000 to $49,999 income range is the most frequent in Sans Souci, accounting for 18.6% of all households. In contrast, only 68 households (1.8%) fall into the $200,000+ income bracket, making it the least populous group.
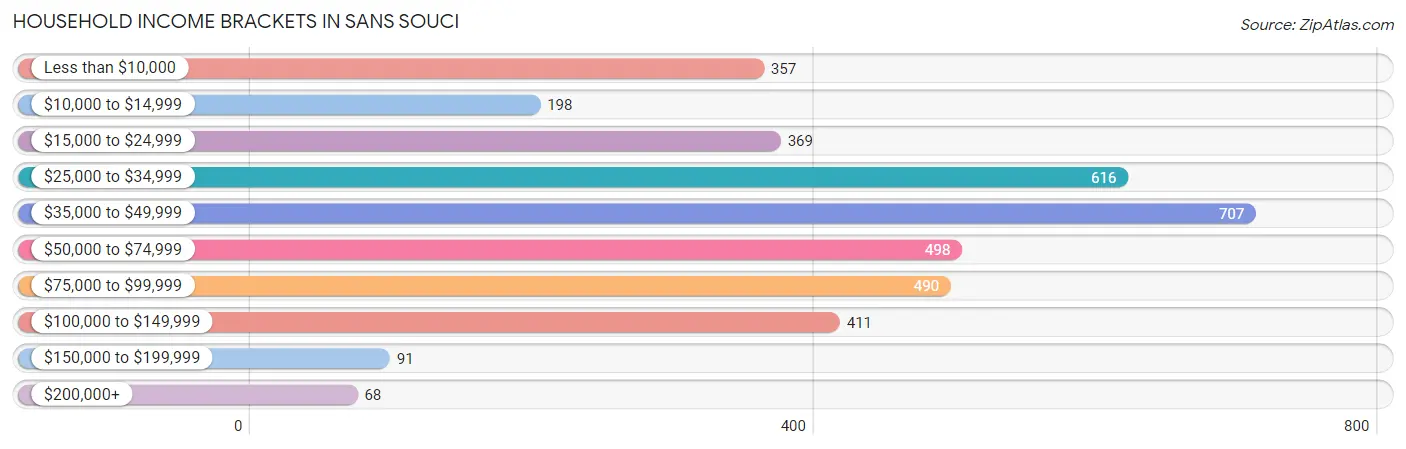
| Income Bracket | # Households | % Households |
| Less than $10,000 | 357 | 9.4% |
| $10,000 to $14,999 | 198 | 5.2% |
| $15,000 to $24,999 | 369 | 9.7% |
| $25,000 to $34,999 | 616 | 16.2% |
| $35,000 to $49,999 | 707 | 18.6% |
| $50,000 to $74,999 | 498 | 13.1% |
| $75,000 to $99,999 | 490 | 12.9% |
| $100,000 to $149,999 | 411 | 10.8% |
| $150,000 to $199,999 | 91 | 2.4% |
| $200,000+ | 68 | 1.8% |
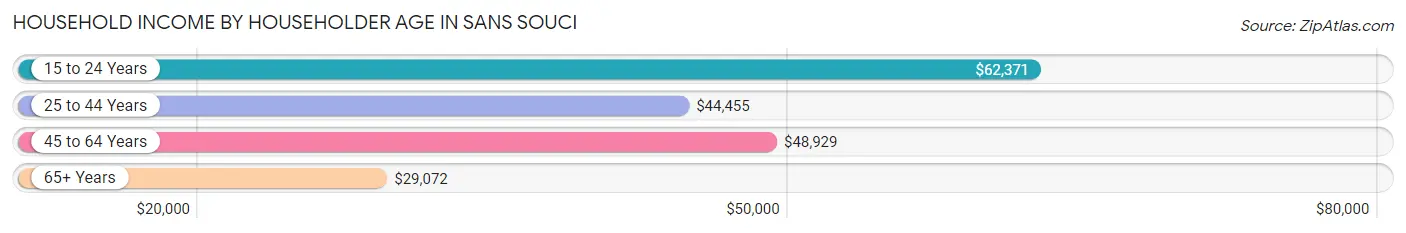
Household Income by Householder Age in Sans Souci
The median household income in Sans Souci is $40,995, with the highest median household income of $62,371 found in the 15 to 24 years age bracket for the primary householder. A total of 143 households (3.8%) fall into this category. Meanwhile, the 65+ years age bracket for the primary householder has the lowest median household income of $29,072, with 941 households (24.8%) in this group.
| Income Bracket | # Households | Median Income |
| 15 to 24 Years | 143 (3.8%) | $62,371 |
| 25 to 44 Years | 1,403 (36.9%) | $44,455 |
| 45 to 64 Years | 1,314 (34.6%) | $48,929 |
| 65+ Years | 941 (24.8%) | $29,072 |
| Total | 3,801 (100.0%) | $40,995 |
Poverty in Sans Souci
Income Below Poverty by Sex and Age in Sans Souci
With 11.9% poverty level for males and 17.5% for females among the residents of Sans Souci, 5 year old males and 75 year old and over females are the most vulnerable to poverty, with 24 males (61.5%) and 218 females (46.7%) in their respective age groups living below the poverty level.
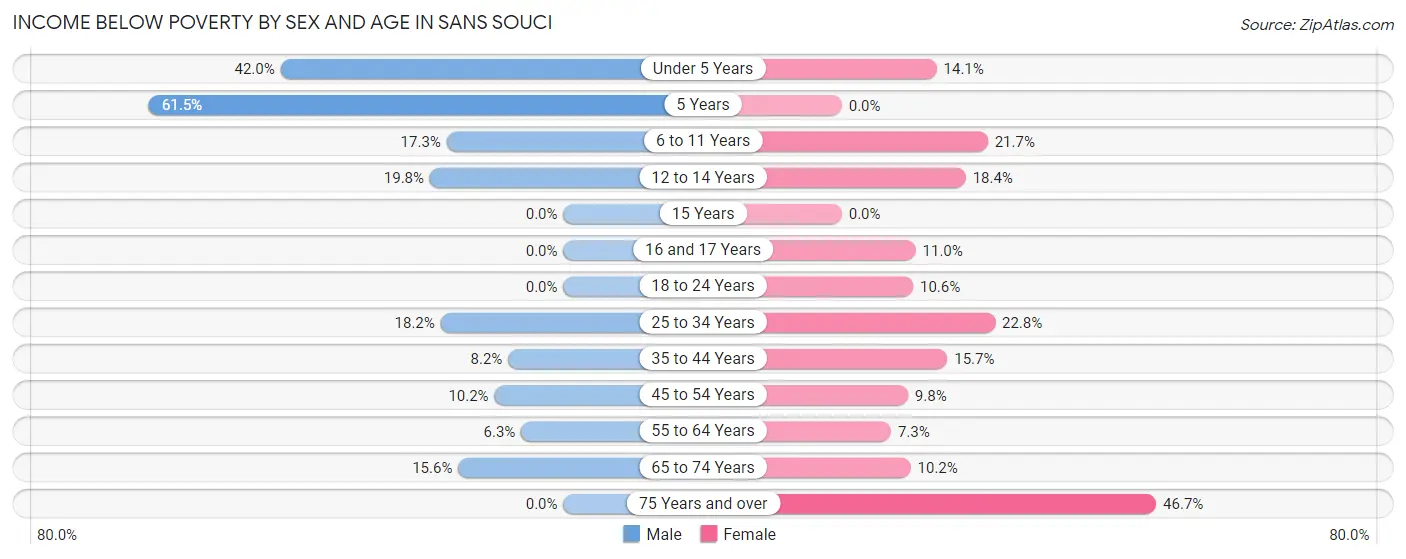
| Age Bracket | Male | Female |
| Under 5 Years | 63 (42.0%) | 48 (14.1%) |
| 5 Years | 24 (61.5%) | 0 (0.0%) |
| 6 to 11 Years | 35 (17.3%) | 44 (21.7%) |
| 12 to 14 Years | 22 (19.8%) | 23 (18.4%) |
| 15 Years | 0 (0.0%) | 0 (0.0%) |
| 16 and 17 Years | 0 (0.0%) | 8 (11.0%) |
| 18 to 24 Years | 0 (0.0%) | 29 (10.6%) |
| 25 to 34 Years | 103 (18.2%) | 188 (22.8%) |
| 35 to 44 Years | 62 (8.2%) | 60 (15.7%) |
| 45 to 54 Years | 54 (10.2%) | 44 (9.8%) |
| 55 to 64 Years | 34 (6.3%) | 52 (7.3%) |
| 65 to 74 Years | 47 (15.6%) | 32 (10.2%) |
| 75 Years and over | 0 (0.0%) | 218 (46.7%) |
| Total | 444 (11.9%) | 746 (17.5%) |
Income Above Poverty by Sex and Age in Sans Souci
According to the poverty statistics in Sans Souci, males aged 15 years and females aged 5 years are the age groups that are most secure financially, with 100.0% of males and 100.0% of females in these age groups living above the poverty line.
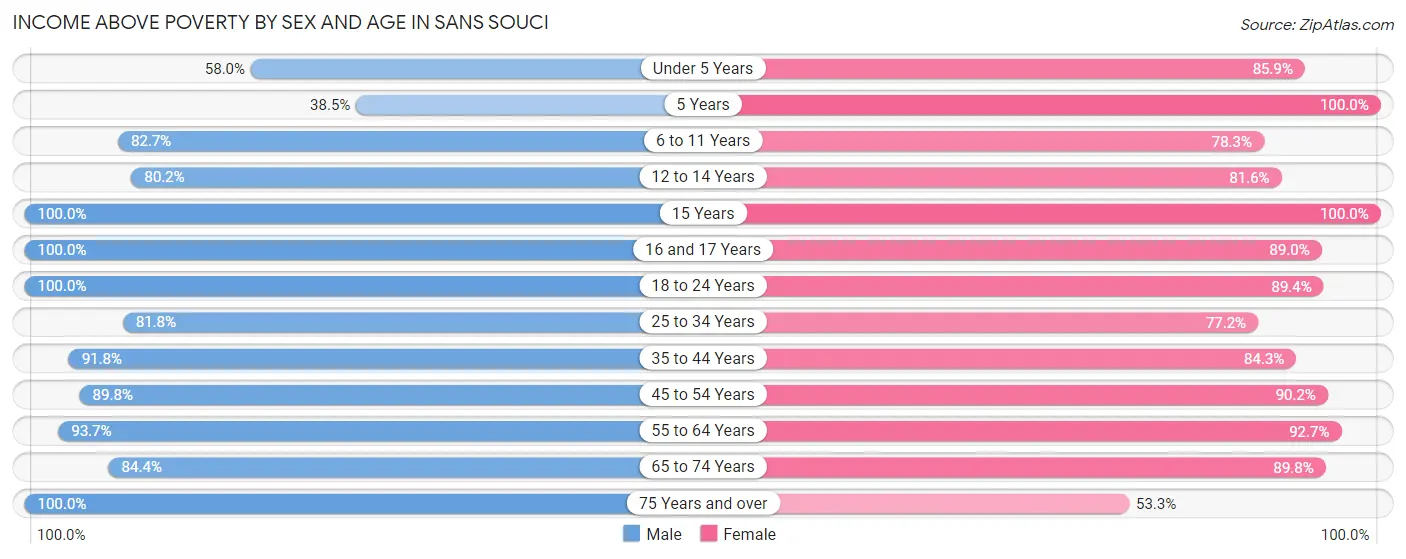
| Age Bracket | Male | Female |
| Under 5 Years | 87 (58.0%) | 293 (85.9%) |
| 5 Years | 15 (38.5%) | 54 (100.0%) |
| 6 to 11 Years | 167 (82.7%) | 159 (78.3%) |
| 12 to 14 Years | 89 (80.2%) | 102 (81.6%) |
| 15 Years | 21 (100.0%) | 40 (100.0%) |
| 16 and 17 Years | 140 (100.0%) | 65 (89.0%) |
| 18 to 24 Years | 194 (100.0%) | 245 (89.4%) |
| 25 to 34 Years | 462 (81.8%) | 638 (77.2%) |
| 35 to 44 Years | 695 (91.8%) | 323 (84.3%) |
| 45 to 54 Years | 474 (89.8%) | 404 (90.2%) |
| 55 to 64 Years | 509 (93.7%) | 660 (92.7%) |
| 65 to 74 Years | 254 (84.4%) | 281 (89.8%) |
| 75 Years and over | 166 (100.0%) | 249 (53.3%) |
| Total | 3,273 (88.0%) | 3,513 (82.5%) |
Income Below Poverty Among Married-Couple Families in Sans Souci
The poverty statistics for married-couple families in Sans Souci show that 3.9% or 46 of the total 1,168 families live below the poverty line. Families with 3 or 4 children have the highest poverty rate of 13.1%, comprising of 11 families. On the other hand, families with no children have the lowest poverty rate of 1.7%, which includes 10 families.
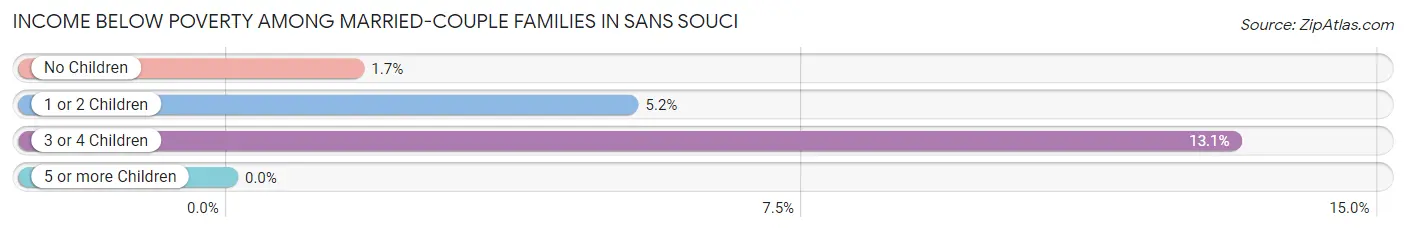
| Children | Above Poverty | Below Poverty |
| No Children | 596 (98.4%) | 10 (1.7%) |
| 1 or 2 Children | 453 (94.8%) | 25 (5.2%) |
| 3 or 4 Children | 73 (86.9%) | 11 (13.1%) |
| 5 or more Children | 0 (0.0%) | 0 (0.0%) |
| Total | 1,122 (96.1%) | 46 (3.9%) |
Income Below Poverty Among Single-Parent Households in Sans Souci
According to the poverty data in Sans Souci, 20.8% or 48 single-father households and 20.6% or 87 single-mother households are living below the poverty line. Among single-father households, those with 3 or 4 children have the highest poverty rate, with 48 households (100.0%) experiencing poverty. Likewise, among single-mother households, those with 1 or 2 children have the highest poverty rate, with 71 households (27.3%) falling below the poverty line.
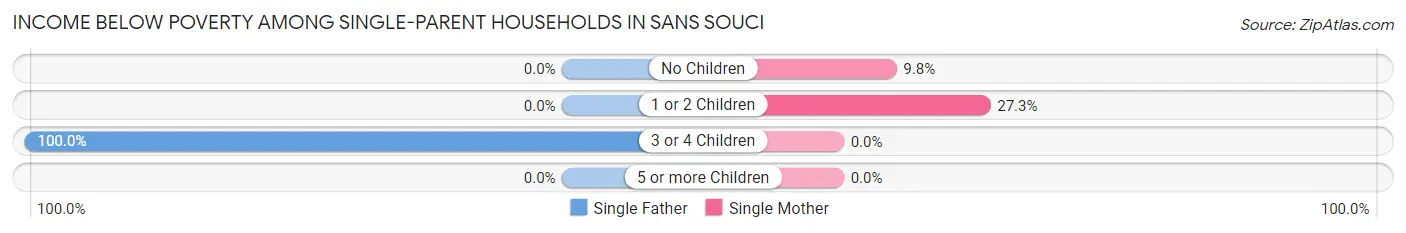
| Children | Single Father | Single Mother |
| No Children | 0 (0.0%) | 16 (9.8%) |
| 1 or 2 Children | 0 (0.0%) | 71 (27.3%) |
| 3 or 4 Children | 48 (100.0%) | 0 (0.0%) |
| 5 or more Children | 0 (0.0%) | 0 (0.0%) |
| Total | 48 (20.8%) | 87 (20.6%) |
Income Below Poverty Among Married-Couple vs Single-Parent Households in Sans Souci
The poverty data for Sans Souci shows that 46 of the married-couple family households (3.9%) and 135 of the single-parent households (20.6%) are living below the poverty level. Within the married-couple family households, those with 3 or 4 children have the highest poverty rate, with 11 households (13.1%) falling below the poverty line. Among the single-parent households, those with 3 or 4 children have the highest poverty rate, with 48 household (100.0%) living below poverty.
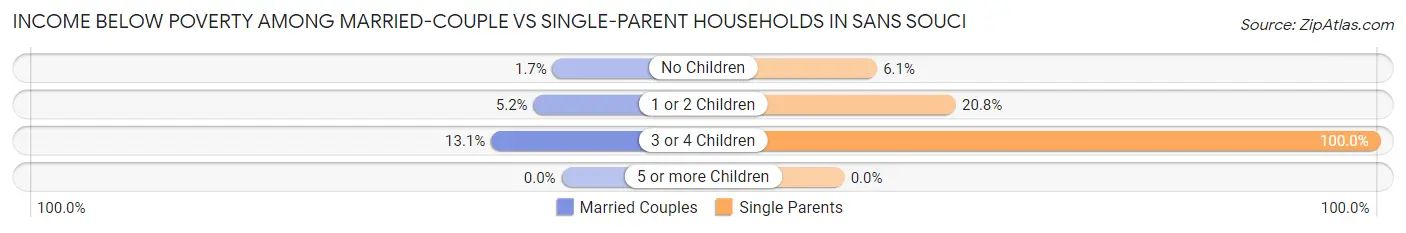
| Children | Married-Couple Families | Single-Parent Households |
| No Children | 10 (1.7%) | 16 (6.1%) |
| 1 or 2 Children | 25 (5.2%) | 71 (20.8%) |
| 3 or 4 Children | 11 (13.1%) | 48 (100.0%) |
| 5 or more Children | 0 (0.0%) | 0 (0.0%) |
| Total | 46 (3.9%) | 135 (20.6%) |
Race in Sans Souci
The most populous races in Sans Souci are White / Caucasian (4,702 | 58.5%), Hispanic or Latino (1,605 | 20.0%), and Black / African American (1,463 | 18.2%).
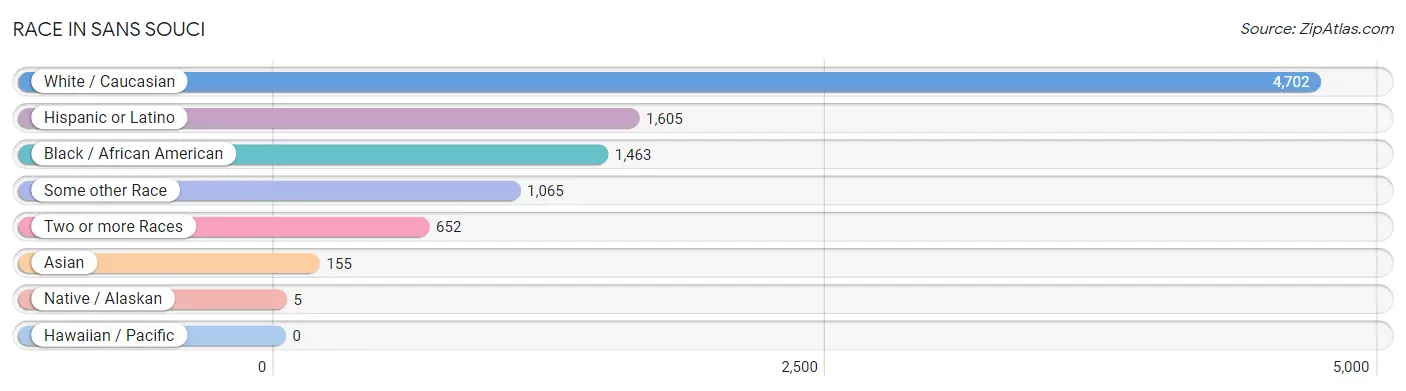
| Race | # Population | % Population |
| Asian | 155 | 1.9% |
| Black / African American | 1,463 | 18.2% |
| Hawaiian / Pacific | 0 | 0.0% |
| Hispanic or Latino | 1,605 | 20.0% |
| Native / Alaskan | 5 | 0.1% |
| White / Caucasian | 4,702 | 58.5% |
| Two or more Races | 652 | 8.1% |
| Some other Race | 1,065 | 13.2% |
| Total | 8,042 | 100.0% |
Ancestry in Sans Souci
The most populous ancestries reported in Sans Souci are American (858 | 10.7%), Mexican (685 | 8.5%), English (504 | 6.3%), Irish (393 | 4.9%), and German (380 | 4.7%), together accounting for 35.1% of all Sans Souci residents.
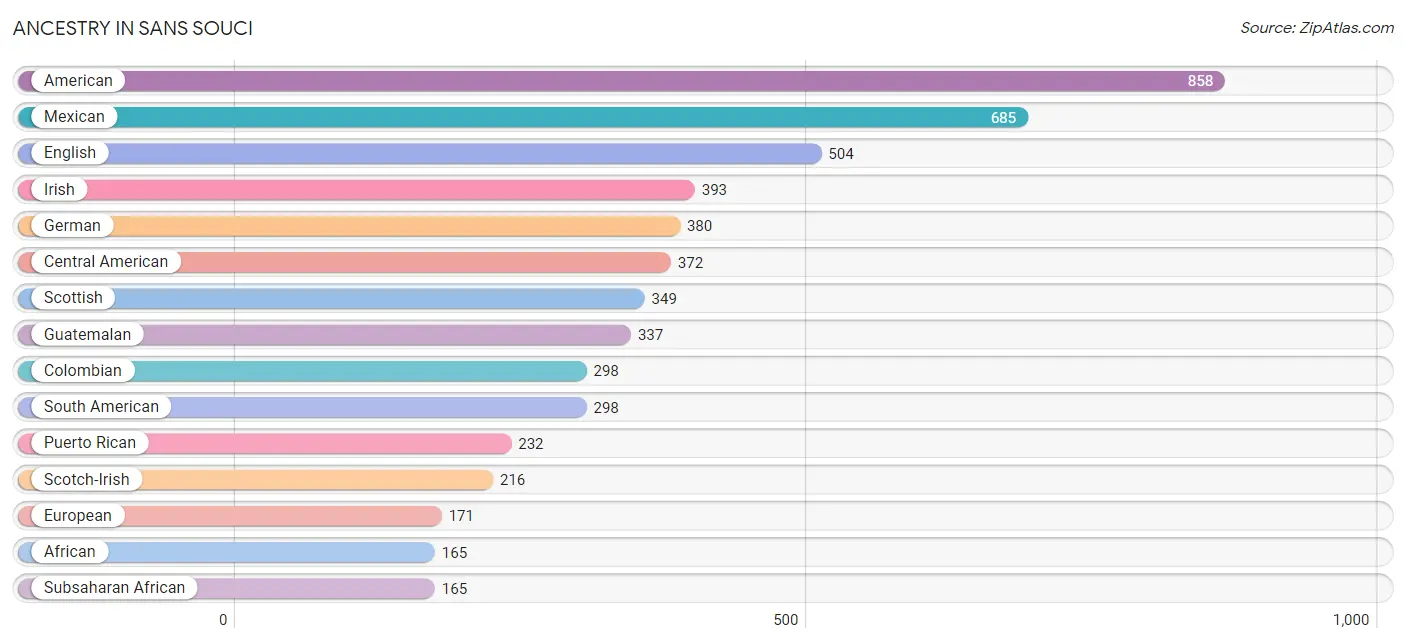
| Ancestry | # Population | % Population |
| African | 165 | 2.1% |
| American | 858 | 10.7% |
| Austrian | 7 | 0.1% |
| British | 41 | 0.5% |
| Burmese | 18 | 0.2% |
| Central American | 372 | 4.6% |
| Central American Indian | 82 | 1.0% |
| Cherokee | 57 | 0.7% |
| Colombian | 298 | 3.7% |
| Costa Rican | 7 | 0.1% |
| Cuban | 18 | 0.2% |
| Danish | 9 | 0.1% |
| Dutch | 44 | 0.5% |
| English | 504 | 6.3% |
| European | 171 | 2.1% |
| French | 81 | 1.0% |
| French Canadian | 38 | 0.5% |
| German | 380 | 4.7% |
| Greek | 15 | 0.2% |
| Guatemalan | 337 | 4.2% |
| Honduran | 28 | 0.4% |
| Hungarian | 22 | 0.3% |
| Irish | 393 | 4.9% |
| Italian | 155 | 1.9% |
| Korean | 48 | 0.6% |
| Mexican | 685 | 8.5% |
| Norwegian | 8 | 0.1% |
| Pakistani | 122 | 1.5% |
| Polish | 98 | 1.2% |
| Puerto Rican | 232 | 2.9% |
| Russian | 54 | 0.7% |
| Scotch-Irish | 216 | 2.7% |
| Scottish | 349 | 4.3% |
| Serbian | 8 | 0.1% |
| Slovak | 5 | 0.1% |
| South American | 298 | 3.7% |
| Sri Lankan | 33 | 0.4% |
| Subsaharan African | 165 | 2.1% |
| Swedish | 19 | 0.2% |
| Swiss | 12 | 0.2% |
| Trinidadian and Tobagonian | 12 | 0.2% |
| U.S. Virgin Islander | 9 | 0.1% |
| Ukrainian | 33 | 0.4% |
| Welsh | 35 | 0.4% | View All 44 Rows |
Immigrants in Sans Souci
The most numerous immigrant groups reported in Sans Souci came from Latin America (829 | 10.3%), Central America (576 | 7.2%), Guatemala (276 | 3.4%), Mexico (272 | 3.4%), and Colombia (253 | 3.2%), together accounting for 27.4% of all Sans Souci residents.
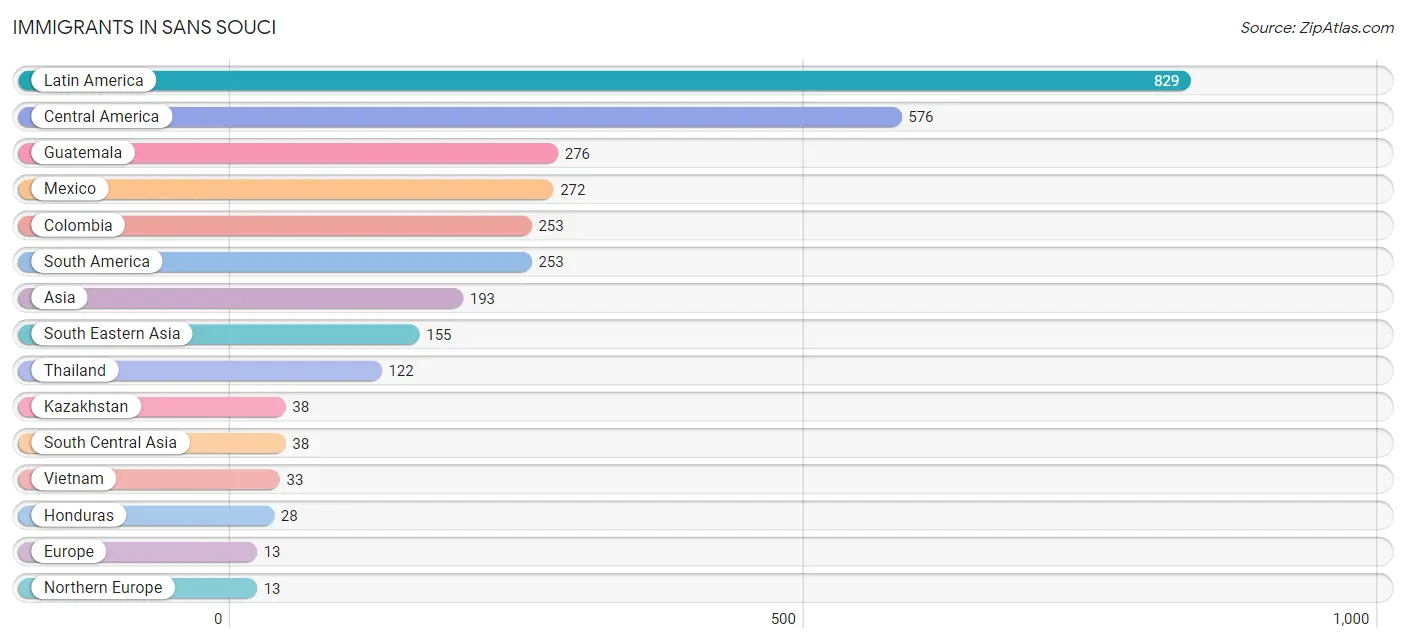
| Immigration Origin | # Population | % Population |
| Asia | 193 | 2.4% |
| Central America | 576 | 7.2% |
| Colombia | 253 | 3.2% |
| Europe | 13 | 0.2% |
| Guatemala | 276 | 3.4% |
| Honduras | 28 | 0.4% |
| Kazakhstan | 38 | 0.5% |
| Latin America | 829 | 10.3% |
| Mexico | 272 | 3.4% |
| Northern Europe | 13 | 0.2% |
| South America | 253 | 3.2% |
| South Central Asia | 38 | 0.5% |
| South Eastern Asia | 155 | 1.9% |
| Thailand | 122 | 1.5% |
| Vietnam | 33 | 0.4% | View All 15 Rows |
Sex and Age in Sans Souci
Sex and Age in Sans Souci
The most populous age groups in Sans Souci are 40 to 44 Years (429 | 11.4%) for men and 25 to 29 Years (421 | 9.9%) for women.
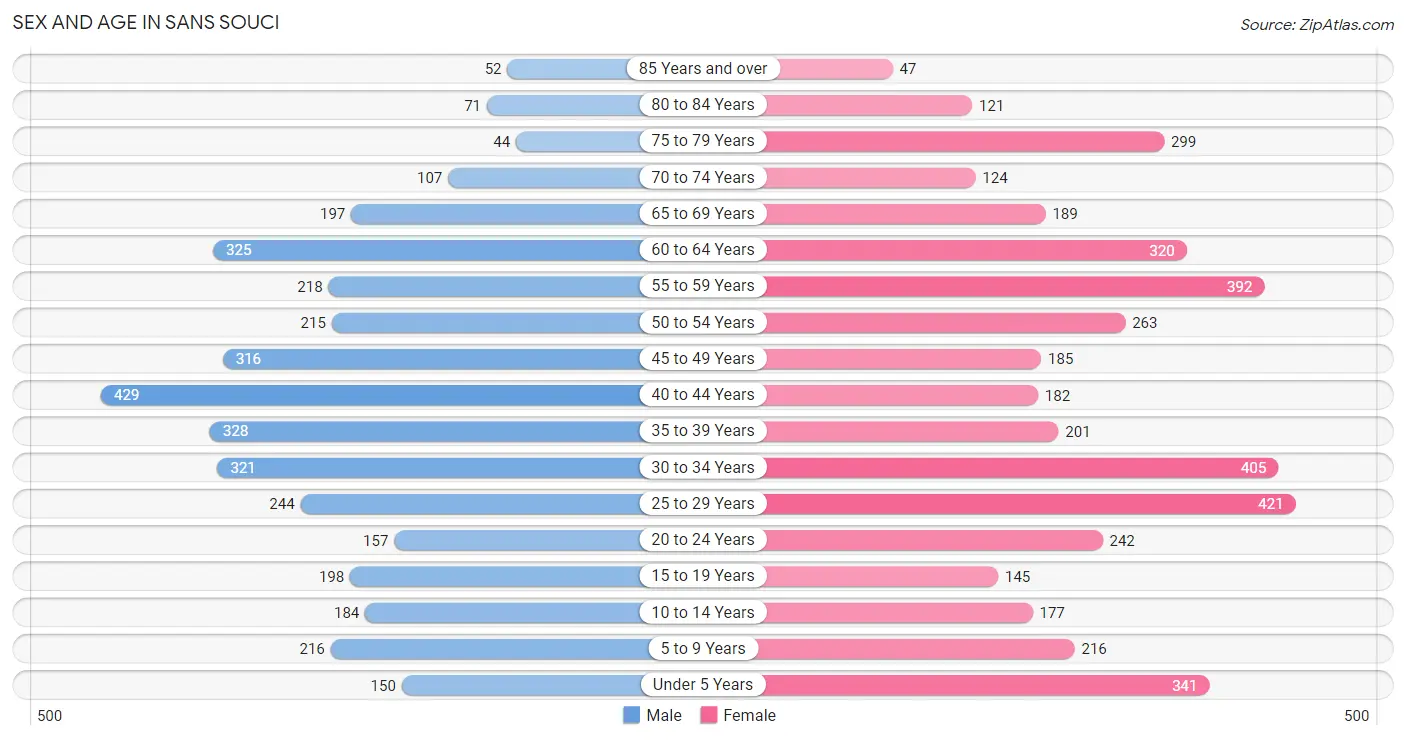
| Age Bracket | Male | Female |
| Under 5 Years | 150 (4.0%) | 341 (8.0%) |
| 5 to 9 Years | 216 (5.7%) | 216 (5.1%) |
| 10 to 14 Years | 184 (4.9%) | 177 (4.2%) |
| 15 to 19 Years | 198 (5.2%) | 145 (3.4%) |
| 20 to 24 Years | 157 (4.2%) | 242 (5.7%) |
| 25 to 29 Years | 244 (6.5%) | 421 (9.9%) |
| 30 to 34 Years | 321 (8.5%) | 405 (9.5%) |
| 35 to 39 Years | 328 (8.7%) | 201 (4.7%) |
| 40 to 44 Years | 429 (11.4%) | 182 (4.3%) |
| 45 to 49 Years | 316 (8.4%) | 185 (4.3%) |
| 50 to 54 Years | 215 (5.7%) | 263 (6.2%) |
| 55 to 59 Years | 218 (5.8%) | 392 (9.2%) |
| 60 to 64 Years | 325 (8.6%) | 320 (7.5%) |
| 65 to 69 Years | 197 (5.2%) | 189 (4.4%) |
| 70 to 74 Years | 107 (2.8%) | 124 (2.9%) |
| 75 to 79 Years | 44 (1.2%) | 299 (7.0%) |
| 80 to 84 Years | 71 (1.9%) | 121 (2.8%) |
| 85 Years and over | 52 (1.4%) | 47 (1.1%) |
| Total | 3,772 (100.0%) | 4,270 (100.0%) |
Families and Households in Sans Souci
Median Family Size in Sans Souci
The median family size in Sans Souci is 2.95 persons per family, with married-couple families (1,168 | 64.1%) accounting for the largest median family size of 3.03 persons per family. On the other hand, single female/mother families (423 | 23.2%) represent the smallest median family size with 2.74 persons per family.
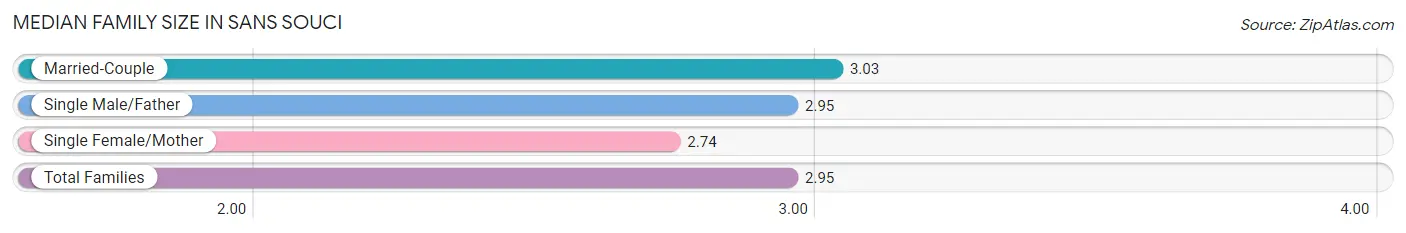
| Family Type | # Families | Family Size |
| Married-Couple | 1,168 (64.1%) | 3.03 |
| Single Male/Father | 231 (12.7%) | 2.95 |
| Single Female/Mother | 423 (23.2%) | 2.74 |
| Total Families | 1,822 (100.0%) | 2.95 |
Median Household Size in Sans Souci
The median household size in Sans Souci is 2.11 persons per household, with single male/father households (231 | 6.1%) accounting for the largest median household size of 3.4 persons per household. non-family households (1,979 | 52.1%) represent the smallest median household size with 1.20 persons per household.
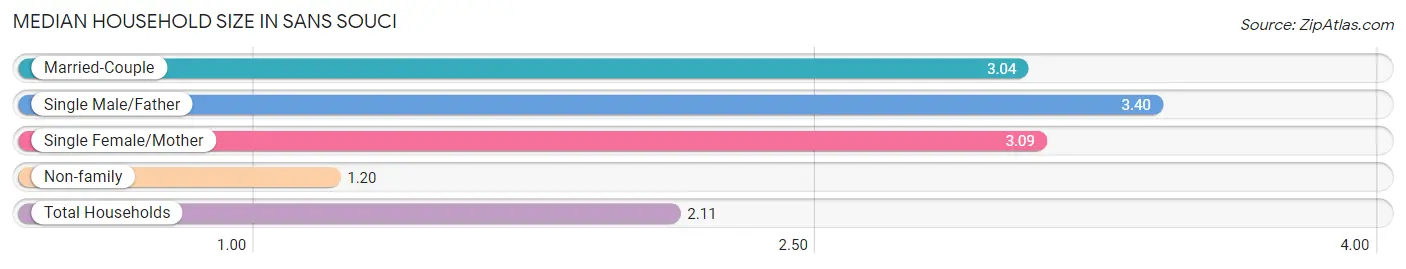
| Household Type | # Households | Household Size |
| Married-Couple | 1,168 (30.7%) | 3.04 |
| Single Male/Father | 231 (6.1%) | 3.40 |
| Single Female/Mother | 423 (11.1%) | 3.09 |
| Non-family | 1,979 (52.1%) | 1.20 |
| Total Households | 3,801 (100.0%) | 2.11 |
Household Size by Marriage Status in Sans Souci
Out of a total of 3,801 households in Sans Souci, 1,822 (47.9%) are family households, while 1,979 (52.1%) are nonfamily households. The most numerous type of family households are 2-person households, comprising 830, and the most common type of nonfamily households are 1-person households, comprising 1,707.
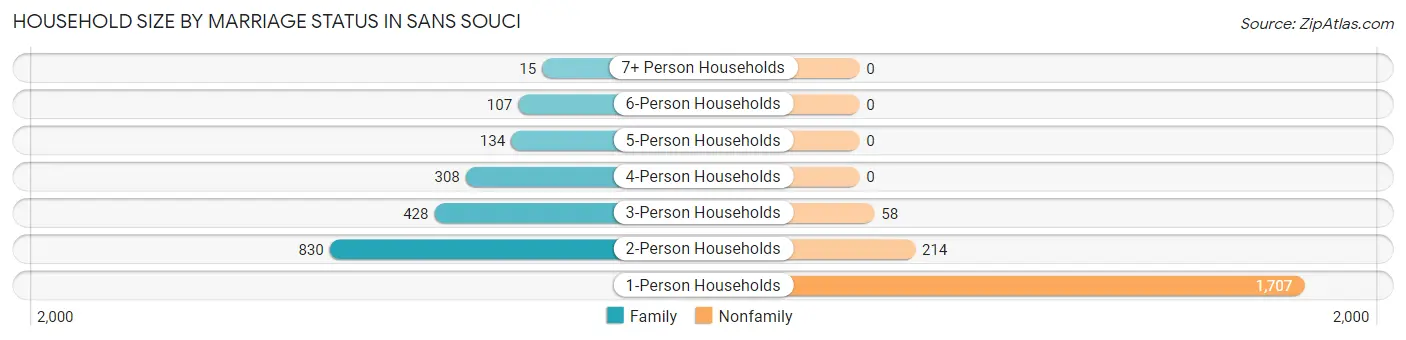
| Household Size | Family Households | Nonfamily Households |
| 1-Person Households | - | 1,707 (44.9%) |
| 2-Person Households | 830 (21.8%) | 214 (5.6%) |
| 3-Person Households | 428 (11.3%) | 58 (1.5%) |
| 4-Person Households | 308 (8.1%) | 0 (0.0%) |
| 5-Person Households | 134 (3.5%) | 0 (0.0%) |
| 6-Person Households | 107 (2.8%) | 0 (0.0%) |
| 7+ Person Households | 15 (0.4%) | 0 (0.0%) |
| Total | 1,822 (47.9%) | 1,979 (52.1%) |
Female Fertility in Sans Souci
Fertility by Age in Sans Souci
Average fertility rate in Sans Souci is 65.0 births per 1,000 women. Women in the age bracket of 20 to 34 years have the highest fertility rate with 89.0 births per 1,000 women. Women in the age bracket of 20 to 34 years acount for 81.9% of all women with births.
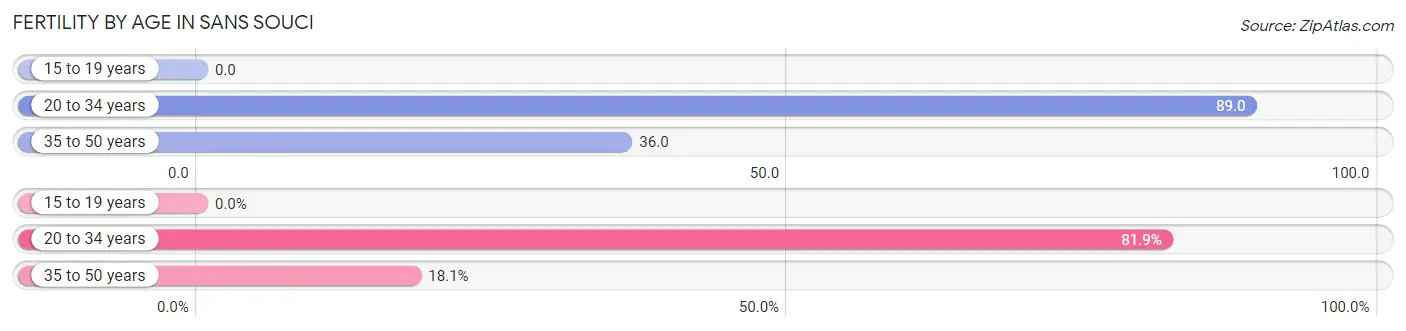
| Age Bracket | Women with Births | Births / 1,000 Women |
| 15 to 19 years | 0 (0.0%) | 0.0 |
| 20 to 34 years | 95 (81.9%) | 89.0 |
| 35 to 50 years | 21 (18.1%) | 36.0 |
| Total | 116 (100.0%) | 65.0 |
Fertility by Age by Marriage Status in Sans Souci
74.1% of women with births (116) in Sans Souci are married. The highest percentage of unmarried women with births falls into 20 to 34 years age bracket with 31.6% of them unmarried at the time of birth, while the lowest percentage of unmarried women with births belong to 35 to 50 years age bracket with 0.0% of them unmarried.
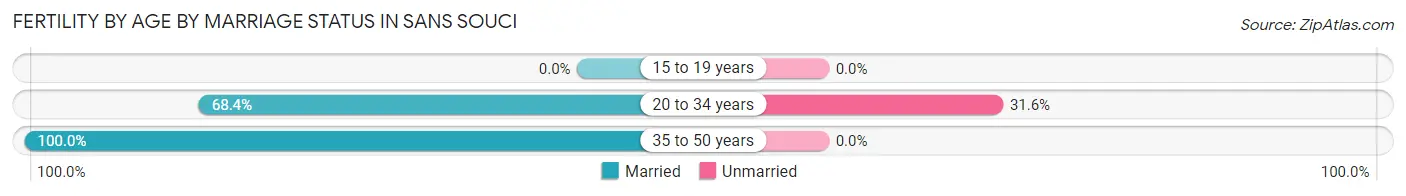
| Age Bracket | Married | Unmarried |
| 15 to 19 years | 0 (0.0%) | 0 (0.0%) |
| 20 to 34 years | 65 (68.4%) | 30 (31.6%) |
| 35 to 50 years | 21 (100.0%) | 0 (0.0%) |
| Total | 86 (74.1%) | 30 (25.9%) |
Fertility by Education in Sans Souci
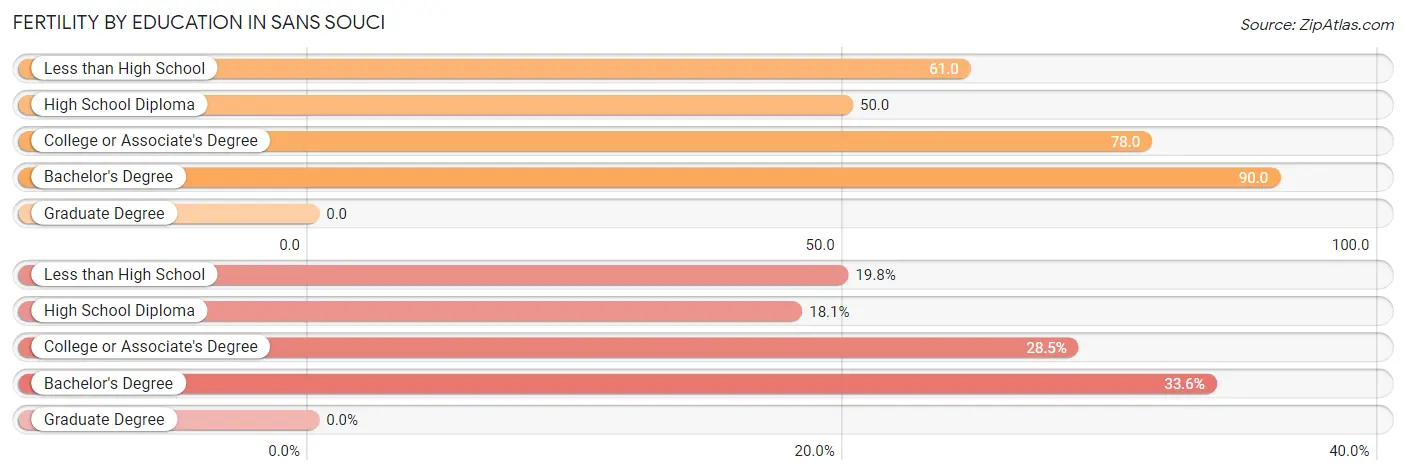
| Educational Attainment | Women with Births | Births / 1,000 Women |
| Less than High School | 23 (19.8%) | 61.0 |
| High School Diploma | 21 (18.1%) | 50.0 |
| College or Associate's Degree | 33 (28.4%) | 78.0 |
| Bachelor's Degree | 39 (33.6%) | 90.0 |
| Graduate Degree | 0 (0.0%) | 0.0 |
| Total | 116 (100.0%) | 65.0 |
Fertility by Education by Marriage Status in Sans Souci
25.9% of women with births in Sans Souci are unmarried. Women with the educational attainment of less than high school are most likely to be married with 100.0% of them married at childbirth, while women with the educational attainment of high school diploma are least likely to be married with 100.0% of them unmarried at childbirth.
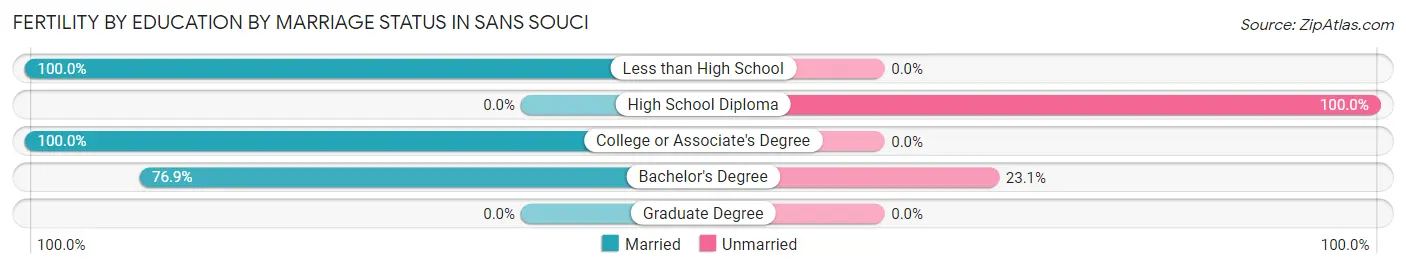
| Educational Attainment | Married | Unmarried |
| Less than High School | 23 (100.0%) | 0 (0.0%) |
| High School Diploma | 0 (0.0%) | 21 (100.0%) |
| College or Associate's Degree | 33 (100.0%) | 0 (0.0%) |
| Bachelor's Degree | 30 (76.9%) | 9 (23.1%) |
| Graduate Degree | 0 (0.0%) | 0 (0.0%) |
| Total | 86 (74.1%) | 30 (25.9%) |
Employment Characteristics in Sans Souci
Employment by Class of Employer in Sans Souci
Among the 4,202 employed individuals in Sans Souci, private company employees (3,061 | 72.9%), not-for-profit organizations (337 | 8.0%), and self-employed (not incorporated) (243 | 5.8%) make up the most common classes of employment.
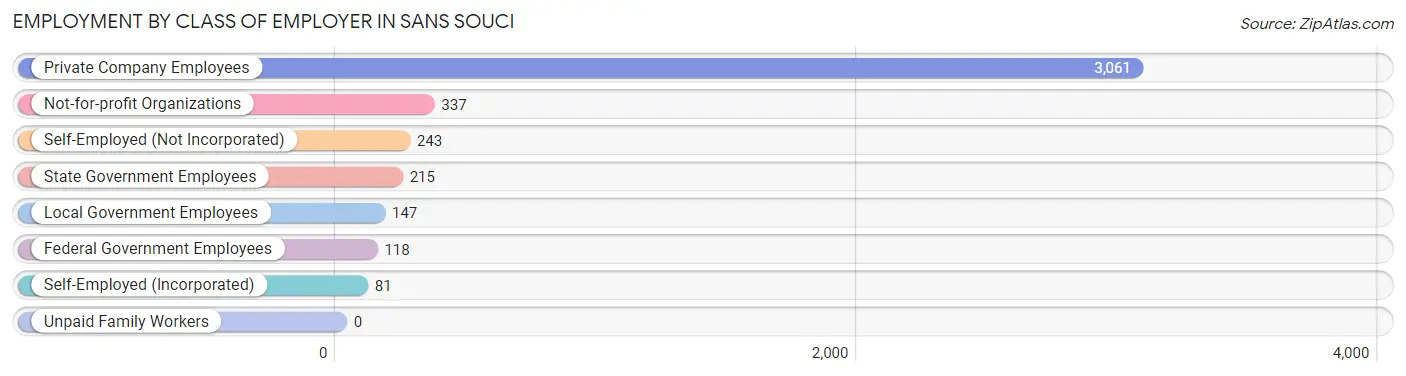
| Employer Class | # Employees | % Employees |
| Private Company Employees | 3,061 | 72.9% |
| Self-Employed (Incorporated) | 81 | 1.9% |
| Self-Employed (Not Incorporated) | 243 | 5.8% |
| Not-for-profit Organizations | 337 | 8.0% |
| Local Government Employees | 147 | 3.5% |
| State Government Employees | 215 | 5.1% |
| Federal Government Employees | 118 | 2.8% |
| Unpaid Family Workers | 0 | 0.0% |
| Total | 4,202 | 100.0% |
Employment Status by Age in Sans Souci
According to the labor force statistics for Sans Souci, out of the total population over 16 years of age (6,697), 66.7% or 4,467 individuals are in the labor force, with 4.5% or 201 of them unemployed. The age group with the highest labor force participation rate is 20 to 24 years, with 97.5% or 389 individuals in the labor force. Within the labor force, the 75 years and over age range has the highest percentage of unemployed individuals, with 21.8% or 12 of them being unemployed.
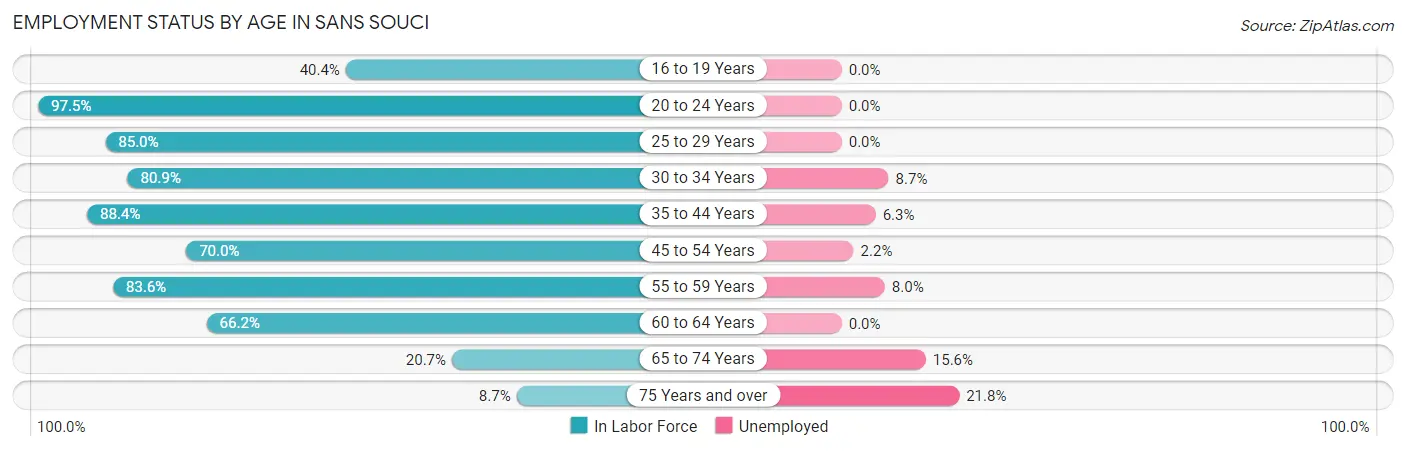
| Age Bracket | In Labor Force | Unemployed |
| 16 to 19 Years | 114 (40.4%) | 0 (0.0%) |
| 20 to 24 Years | 389 (97.5%) | 0 (0.0%) |
| 25 to 29 Years | 565 (85.0%) | 0 (0.0%) |
| 30 to 34 Years | 587 (80.9%) | 51 (8.7%) |
| 35 to 44 Years | 1,008 (88.4%) | 64 (6.3%) |
| 45 to 54 Years | 685 (70.0%) | 15 (2.2%) |
| 55 to 59 Years | 510 (83.6%) | 41 (8.0%) |
| 60 to 64 Years | 427 (66.2%) | 0 (0.0%) |
| 65 to 74 Years | 128 (20.7%) | 20 (15.6%) |
| 75 Years and over | 55 (8.7%) | 12 (21.8%) |
| Total | 4,467 (66.7%) | 201 (4.5%) |
Employment Status by Educational Attainment in Sans Souci
According to labor force statistics for Sans Souci, 79.4% of individuals (3,783) out of the total population between 25 and 64 years of age (4,765) are in the labor force, with 4.5% or 170 of them being unemployed. The group with the highest labor force participation rate are those with the educational attainment of bachelor's degree or higher, with 86.9% or 978 individuals in the labor force. Within the labor force, individuals with less than high school education have the highest percentage of unemployment, with 6.9% or 41 of them being unemployed.
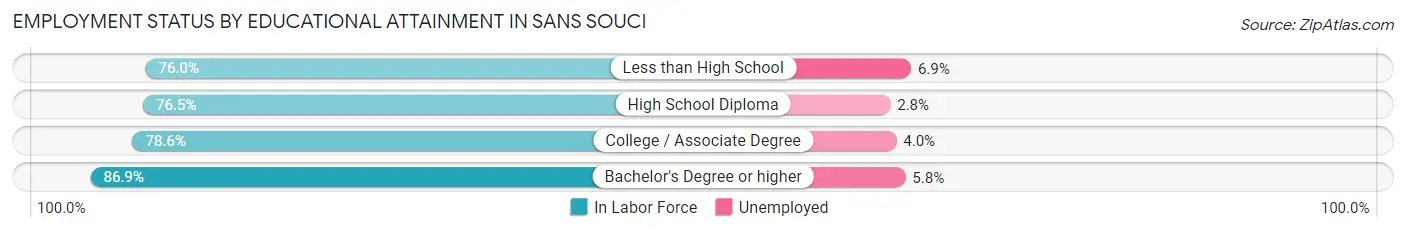
| Educational Attainment | In Labor Force | Unemployed |
| Less than High School | 591 (76.0%) | 54 (6.9%) |
| High School Diploma | 1,336 (76.5%) | 49 (2.8%) |
| College / Associate Degree | 876 (78.6%) | 45 (4.0%) |
| Bachelor's Degree or higher | 978 (86.9%) | 65 (5.8%) |
| Total | 3,783 (79.4%) | 214 (4.5%) |
Employment Occupations by Sex in Sans Souci
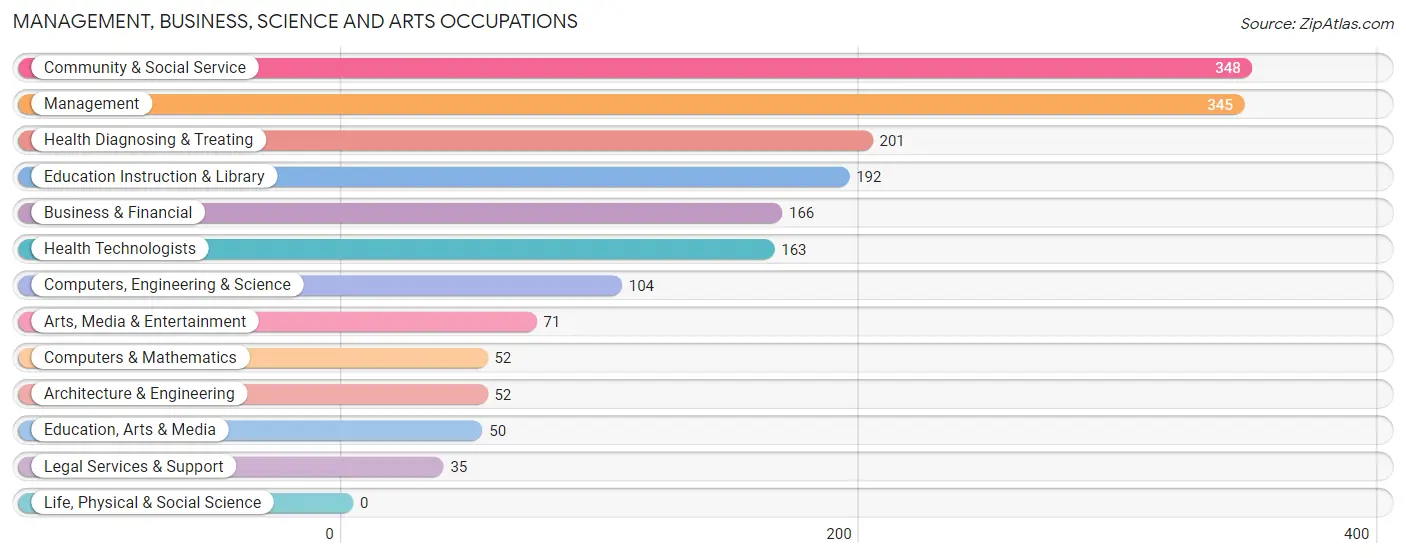
Management, Business, Science and Arts Occupations
The most common Management, Business, Science and Arts occupations in Sans Souci are Community & Social Service (348 | 8.2%), Management (345 | 8.1%), Health Diagnosing & Treating (201 | 4.7%), Education Instruction & Library (192 | 4.5%), and Business & Financial (166 | 3.9%).
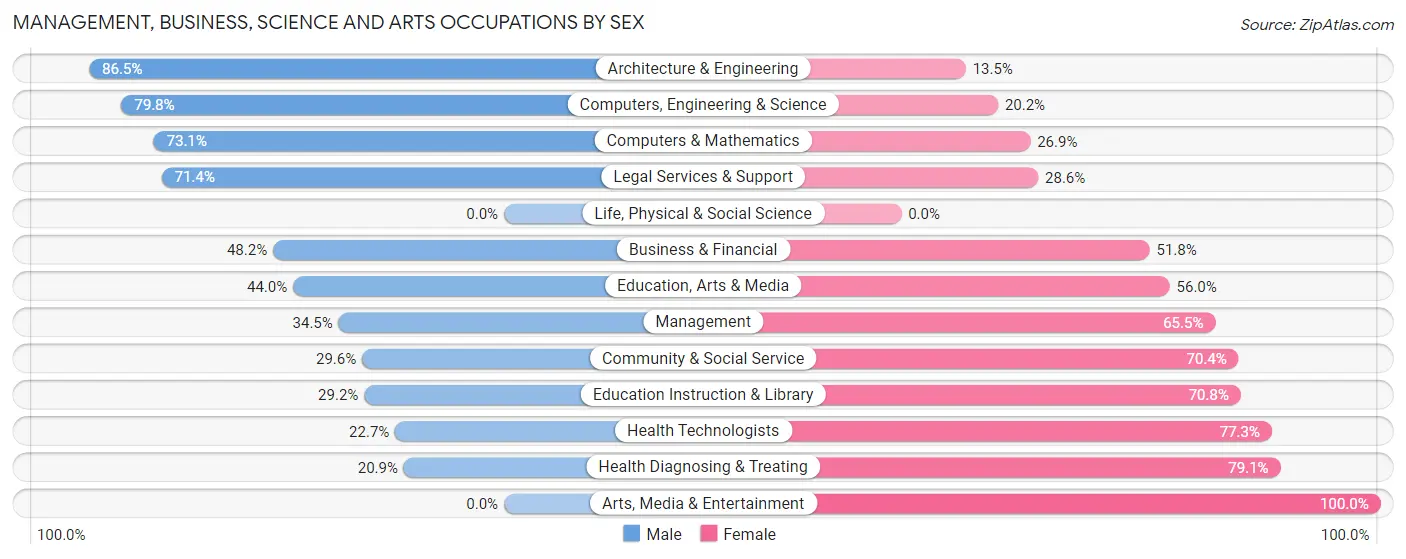
Management, Business, Science and Arts Occupations by Sex
Within the Management, Business, Science and Arts occupations in Sans Souci, the most male-oriented occupations are Architecture & Engineering (86.5%), Computers, Engineering & Science (79.8%), and Computers & Mathematics (73.1%), while the most female-oriented occupations are Arts, Media & Entertainment (100.0%), Health Diagnosing & Treating (79.1%), and Health Technologists (77.3%).
| Occupation | Male | Female |
| Management | 119 (34.5%) | 226 (65.5%) |
| Business & Financial | 80 (48.2%) | 86 (51.8%) |
| Computers, Engineering & Science | 83 (79.8%) | 21 (20.2%) |
| Computers & Mathematics | 38 (73.1%) | 14 (26.9%) |
| Architecture & Engineering | 45 (86.5%) | 7 (13.5%) |
| Life, Physical & Social Science | 0 (0.0%) | 0 (0.0%) |
| Community & Social Service | 103 (29.6%) | 245 (70.4%) |
| Education, Arts & Media | 22 (44.0%) | 28 (56.0%) |
| Legal Services & Support | 25 (71.4%) | 10 (28.6%) |
| Education Instruction & Library | 56 (29.2%) | 136 (70.8%) |
| Arts, Media & Entertainment | 0 (0.0%) | 71 (100.0%) |
| Health Diagnosing & Treating | 42 (20.9%) | 159 (79.1%) |
| Health Technologists | 37 (22.7%) | 126 (77.3%) |
| Total (Category) | 427 (36.7%) | 737 (63.3%) |
| Total (Overall) | 2,343 (54.9%) | 1,922 (45.1%) |
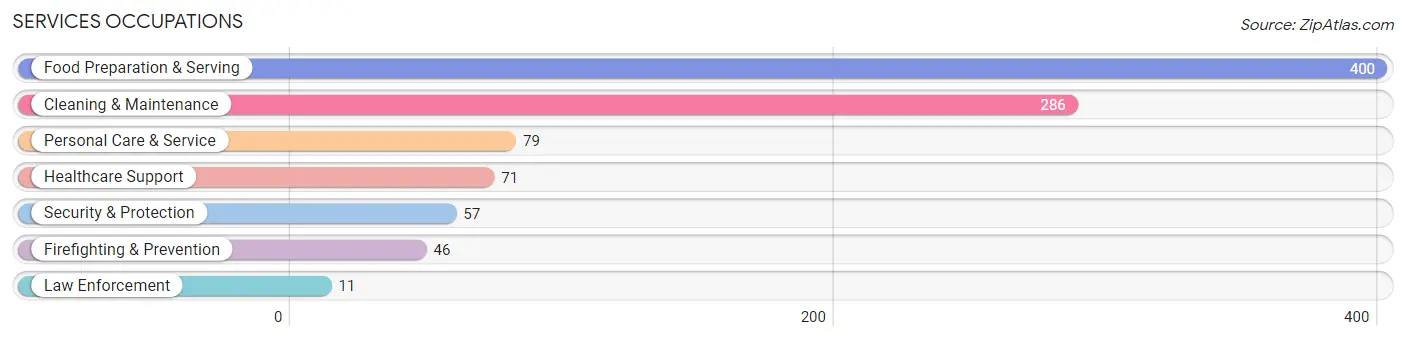
Services Occupations
The most common Services occupations in Sans Souci are Food Preparation & Serving (400 | 9.4%), Cleaning & Maintenance (286 | 6.7%), Personal Care & Service (79 | 1.8%), Healthcare Support (71 | 1.7%), and Security & Protection (57 | 1.3%).
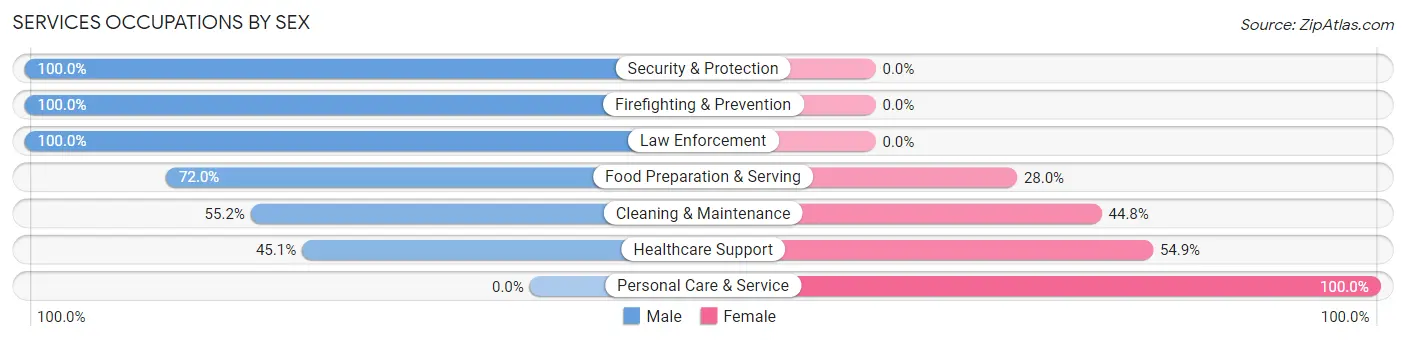
Services Occupations by Sex
Within the Services occupations in Sans Souci, the most male-oriented occupations are Security & Protection (100.0%), Firefighting & Prevention (100.0%), and Law Enforcement (100.0%), while the most female-oriented occupations are Personal Care & Service (100.0%), Healthcare Support (54.9%), and Cleaning & Maintenance (44.8%).
| Occupation | Male | Female |
| Healthcare Support | 32 (45.1%) | 39 (54.9%) |
| Security & Protection | 57 (100.0%) | 0 (0.0%) |
| Firefighting & Prevention | 46 (100.0%) | 0 (0.0%) |
| Law Enforcement | 11 (100.0%) | 0 (0.0%) |
| Food Preparation & Serving | 288 (72.0%) | 112 (28.0%) |
| Cleaning & Maintenance | 158 (55.2%) | 128 (44.8%) |
| Personal Care & Service | 0 (0.0%) | 79 (100.0%) |
| Total (Category) | 535 (59.9%) | 358 (40.1%) |
| Total (Overall) | 2,343 (54.9%) | 1,922 (45.1%) |
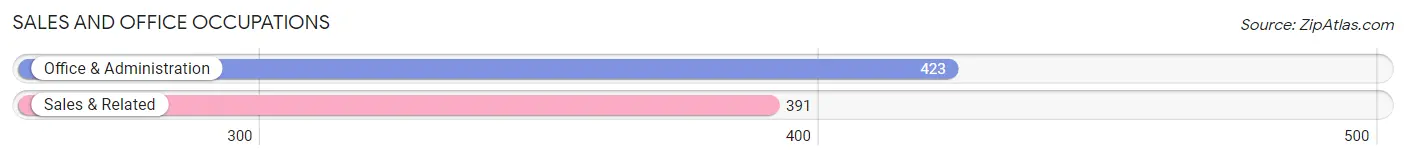
Sales and Office Occupations
The most common Sales and Office occupations in Sans Souci are Office & Administration (423 | 9.9%), and Sales & Related (391 | 9.2%).
Sales and Office Occupations by Sex
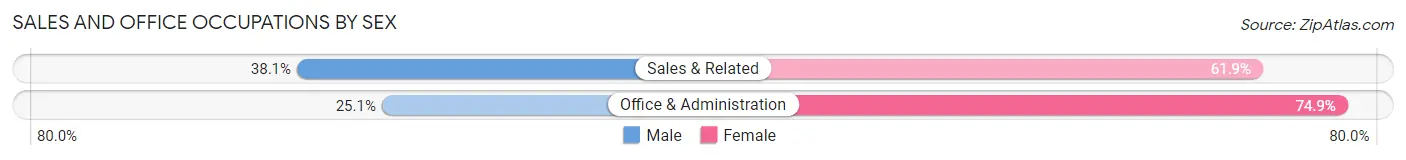
| Occupation | Male | Female |
| Sales & Related | 149 (38.1%) | 242 (61.9%) |
| Office & Administration | 106 (25.1%) | 317 (74.9%) |
| Total (Category) | 255 (31.3%) | 559 (68.7%) |
| Total (Overall) | 2,343 (54.9%) | 1,922 (45.1%) |
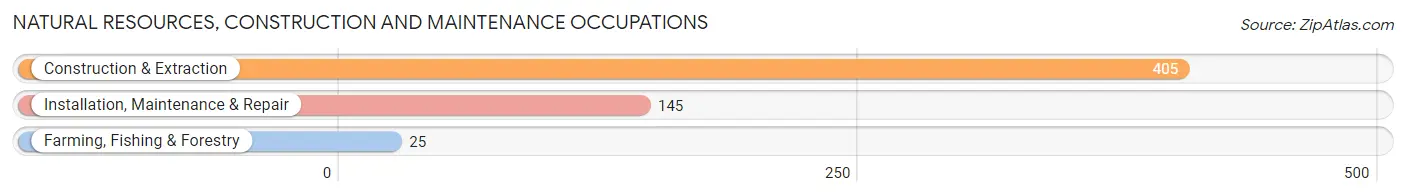
Natural Resources, Construction and Maintenance Occupations
The most common Natural Resources, Construction and Maintenance occupations in Sans Souci are Construction & Extraction (405 | 9.5%), Installation, Maintenance & Repair (145 | 3.4%), and Farming, Fishing & Forestry (25 | 0.6%).
Natural Resources, Construction and Maintenance Occupations by Sex
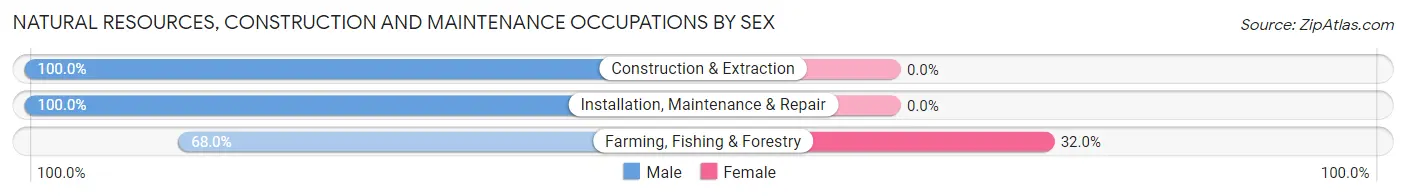
| Occupation | Male | Female |
| Farming, Fishing & Forestry | 17 (68.0%) | 8 (32.0%) |
| Construction & Extraction | 405 (100.0%) | 0 (0.0%) |
| Installation, Maintenance & Repair | 145 (100.0%) | 0 (0.0%) |
| Total (Category) | 567 (98.6%) | 8 (1.4%) |
| Total (Overall) | 2,343 (54.9%) | 1,922 (45.1%) |
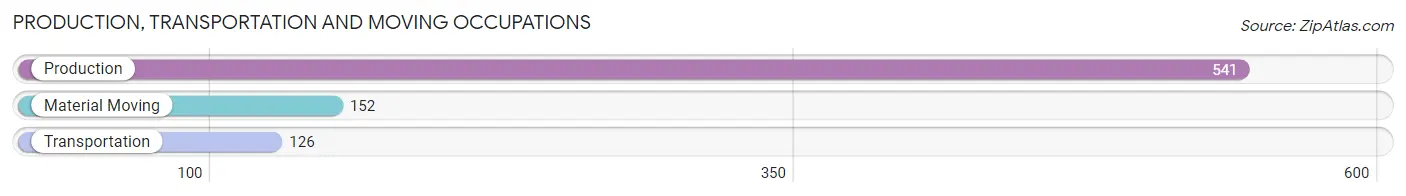
Production, Transportation and Moving Occupations
The most common Production, Transportation and Moving occupations in Sans Souci are Production (541 | 12.7%), Material Moving (152 | 3.6%), and Transportation (126 | 2.9%).
Production, Transportation and Moving Occupations by Sex
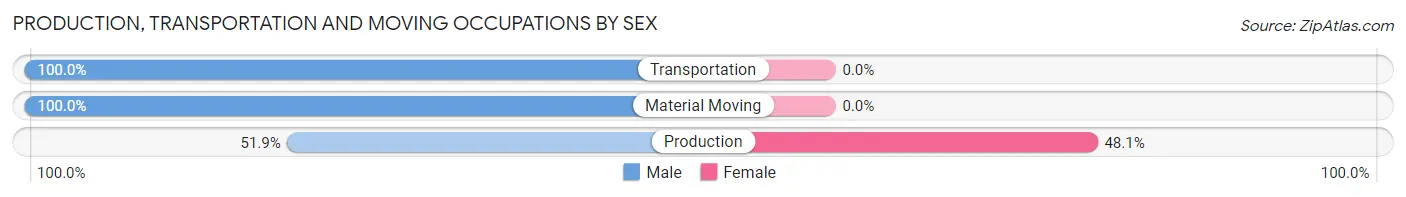
| Occupation | Male | Female |
| Production | 281 (51.9%) | 260 (48.1%) |
| Transportation | 126 (100.0%) | 0 (0.0%) |
| Material Moving | 152 (100.0%) | 0 (0.0%) |
| Total (Category) | 559 (68.2%) | 260 (31.8%) |
| Total (Overall) | 2,343 (54.9%) | 1,922 (45.1%) |
Employment Industries by Sex in Sans Souci
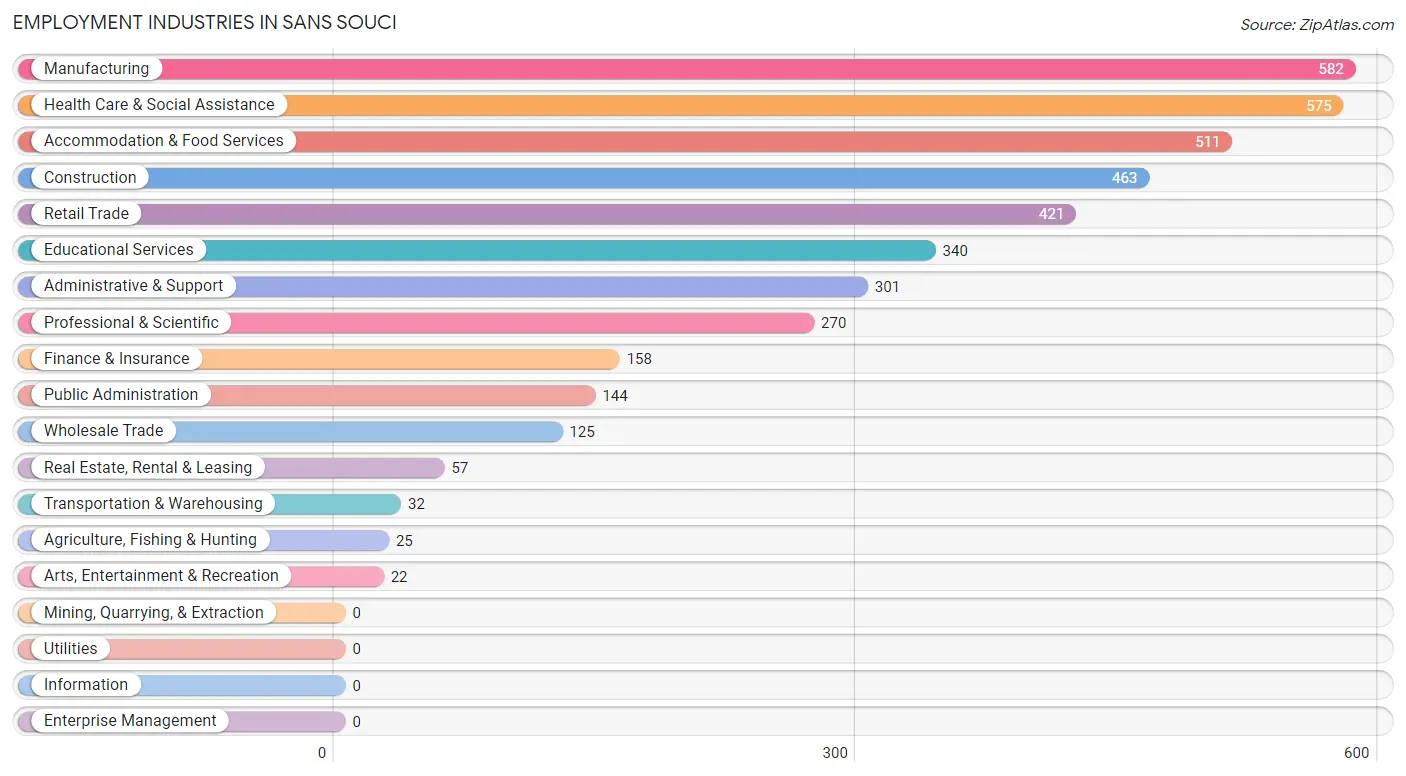
Employment Industries in Sans Souci
The major employment industries in Sans Souci include Manufacturing (582 | 13.7%), Health Care & Social Assistance (575 | 13.5%), Accommodation & Food Services (511 | 12.0%), Construction (463 | 10.9%), and Retail Trade (421 | 9.9%).
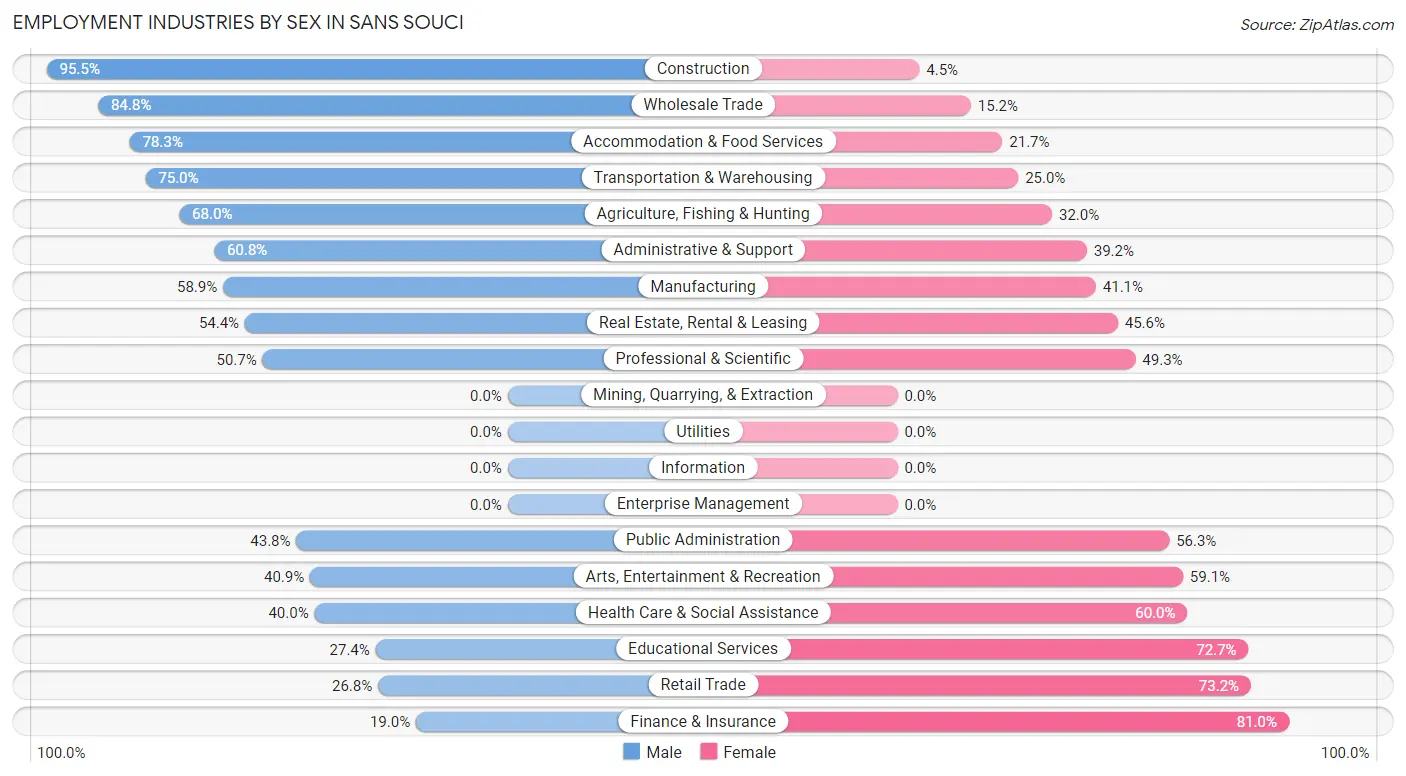
Employment Industries by Sex in Sans Souci
The Sans Souci industries that see more men than women are Construction (95.5%), Wholesale Trade (84.8%), and Accommodation & Food Services (78.3%), whereas the industries that tend to have a higher number of women are Finance & Insurance (81.0%), Retail Trade (73.2%), and Educational Services (72.7%).
| Industry | Male | Female |
| Agriculture, Fishing & Hunting | 17 (68.0%) | 8 (32.0%) |
| Mining, Quarrying, & Extraction | 0 (0.0%) | 0 (0.0%) |
| Construction | 442 (95.5%) | 21 (4.5%) |
| Manufacturing | 343 (58.9%) | 239 (41.1%) |
| Wholesale Trade | 106 (84.8%) | 19 (15.2%) |
| Retail Trade | 113 (26.8%) | 308 (73.2%) |
| Transportation & Warehousing | 24 (75.0%) | 8 (25.0%) |
| Utilities | 0 (0.0%) | 0 (0.0%) |
| Information | 0 (0.0%) | 0 (0.0%) |
| Finance & Insurance | 30 (19.0%) | 128 (81.0%) |
| Real Estate, Rental & Leasing | 31 (54.4%) | 26 (45.6%) |
| Professional & Scientific | 137 (50.7%) | 133 (49.3%) |
| Enterprise Management | 0 (0.0%) | 0 (0.0%) |
| Administrative & Support | 183 (60.8%) | 118 (39.2%) |
| Educational Services | 93 (27.4%) | 247 (72.7%) |
| Health Care & Social Assistance | 230 (40.0%) | 345 (60.0%) |
| Arts, Entertainment & Recreation | 9 (40.9%) | 13 (59.1%) |
| Accommodation & Food Services | 400 (78.3%) | 111 (21.7%) |
| Public Administration | 63 (43.8%) | 81 (56.2%) |
| Total | 2,343 (54.9%) | 1,922 (45.1%) |
Education in Sans Souci
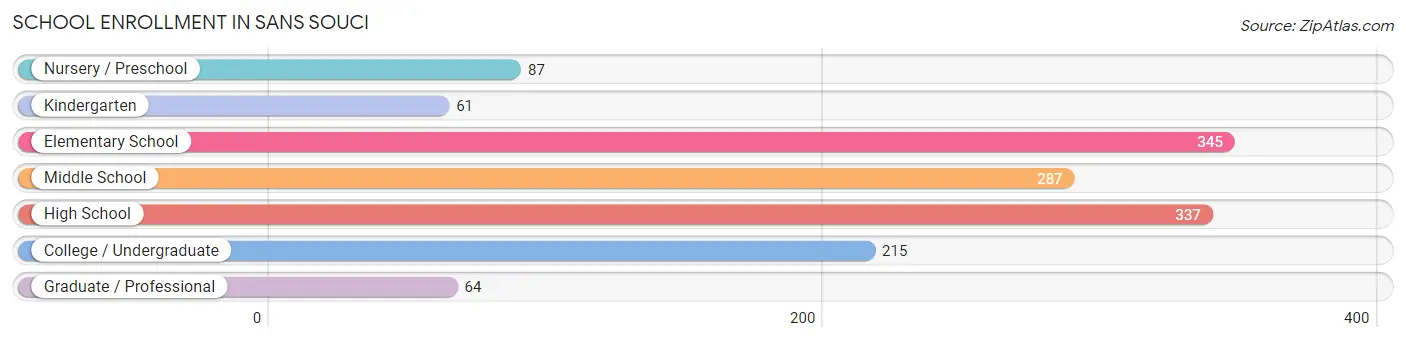
School Enrollment in Sans Souci
The most common levels of schooling among the 1,396 students in Sans Souci are elementary school (345 | 24.7%), high school (337 | 24.1%), and middle school (287 | 20.6%).
| School Level | # Students | % Students |
| Nursery / Preschool | 87 | 6.2% |
| Kindergarten | 61 | 4.4% |
| Elementary School | 345 | 24.7% |
| Middle School | 287 | 20.6% |
| High School | 337 | 24.1% |
| College / Undergraduate | 215 | 15.4% |
| Graduate / Professional | 64 | 4.6% |
| Total | 1,396 | 100.0% |
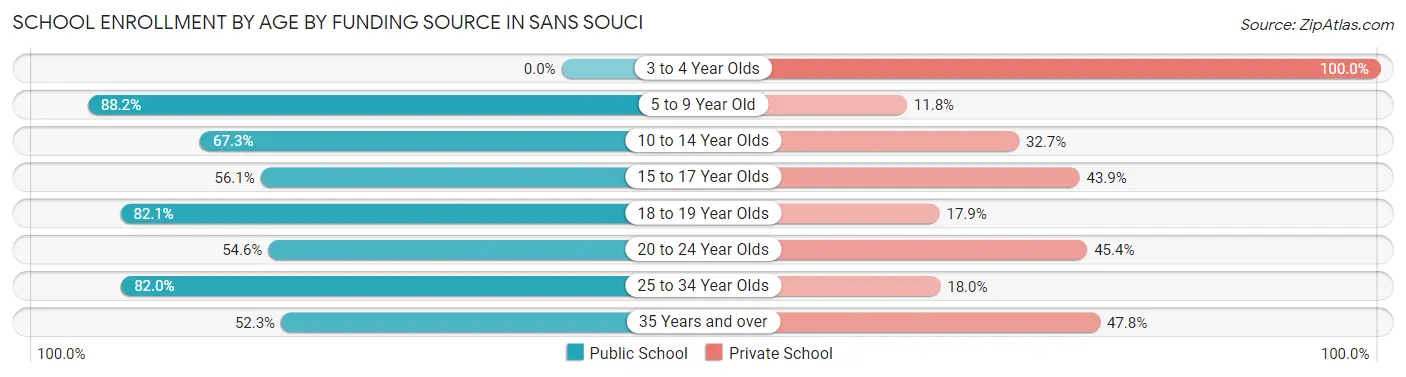
School Enrollment by Age by Funding Source in Sans Souci
Out of a total of 1,396 students who are enrolled in schools in Sans Souci, 438 (31.4%) attend a private institution, while the remaining 958 (68.6%) are enrolled in public schools. The age group of 3 to 4 year olds has the highest likelihood of being enrolled in private schools, with 36 (100.0% in the age bracket) enrolled. Conversely, the age group of 5 to 9 year old has the lowest likelihood of being enrolled in a private school, with 367 (88.2% in the age bracket) attending a public institution.
| Age Bracket | Public School | Private School |
| 3 to 4 Year Olds | 0 (0.0%) | 36 (100.0%) |
| 5 to 9 Year Old | 367 (88.2%) | 49 (11.8%) |
| 10 to 14 Year Olds | 239 (67.3%) | 116 (32.7%) |
| 15 to 17 Year Olds | 148 (56.1%) | 116 (43.9%) |
| 18 to 19 Year Olds | 46 (82.1%) | 10 (17.9%) |
| 20 to 24 Year Olds | 59 (54.6%) | 49 (45.4%) |
| 25 to 34 Year Olds | 41 (82.0%) | 9 (18.0%) |
| 35 Years and over | 58 (52.2%) | 53 (47.7%) |
| Total | 958 (68.6%) | 438 (31.4%) |
Educational Attainment by Field of Study in Sans Souci
Business (297 | 22.5%), education (150 | 11.4%), social sciences (137 | 10.4%), visual & performing arts (136 | 10.3%), and science & technology (118 | 8.9%) are the most common fields of study among 1,318 individuals in Sans Souci who have obtained a bachelor's degree or higher.
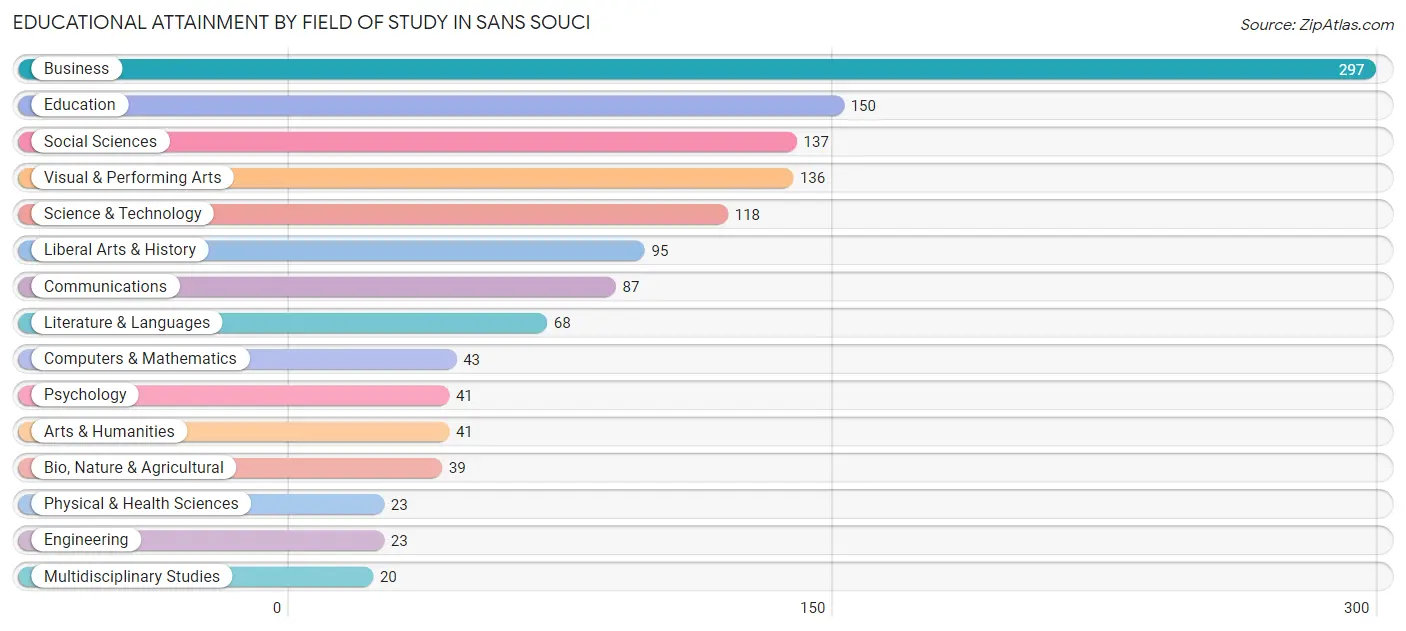
| Field of Study | # Graduates | % Graduates |
| Computers & Mathematics | 43 | 3.3% |
| Bio, Nature & Agricultural | 39 | 3.0% |
| Physical & Health Sciences | 23 | 1.8% |
| Psychology | 41 | 3.1% |
| Social Sciences | 137 | 10.4% |
| Engineering | 23 | 1.8% |
| Multidisciplinary Studies | 20 | 1.5% |
| Science & Technology | 118 | 8.9% |
| Business | 297 | 22.5% |
| Education | 150 | 11.4% |
| Literature & Languages | 68 | 5.2% |
| Liberal Arts & History | 95 | 7.2% |
| Visual & Performing Arts | 136 | 10.3% |
| Communications | 87 | 6.6% |
| Arts & Humanities | 41 | 3.1% |
| Total | 1,318 | 100.0% |
Transportation & Commute in Sans Souci
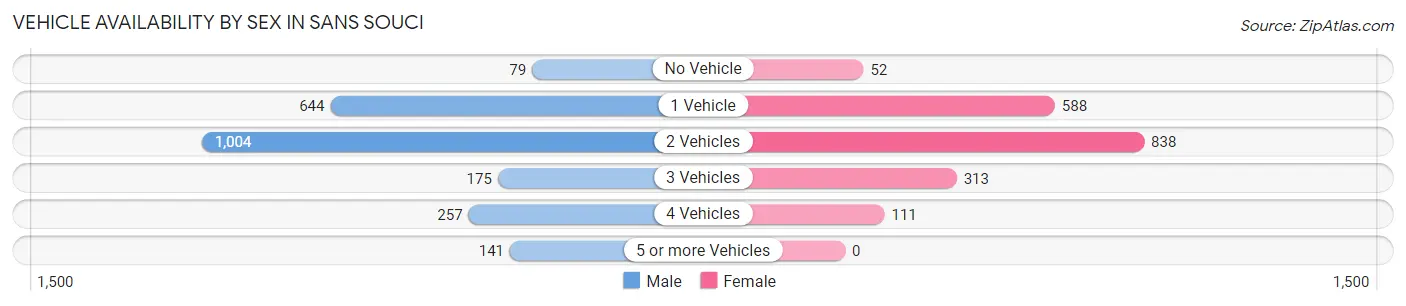
Vehicle Availability by Sex in Sans Souci
The most prevalent vehicle ownership categories in Sans Souci are males with 2 vehicles (1,004, accounting for 43.6%) and females with 2 vehicles (838, making up 52.8%).
| Vehicles Available | Male | Female |
| No Vehicle | 79 (3.4%) | 52 (2.7%) |
| 1 Vehicle | 644 (28.0%) | 588 (30.9%) |
| 2 Vehicles | 1,004 (43.6%) | 838 (44.1%) |
| 3 Vehicles | 175 (7.6%) | 313 (16.5%) |
| 4 Vehicles | 257 (11.2%) | 111 (5.8%) |
| 5 or more Vehicles | 141 (6.1%) | 0 (0.0%) |
| Total | 2,300 (100.0%) | 1,902 (100.0%) |
Commute Time in Sans Souci
The most frequently occuring commute durations in Sans Souci are 20 to 24 minutes (787 commuters, 20.3%), 10 to 14 minutes (619 commuters, 16.0%), and 15 to 19 minutes (573 commuters, 14.8%).
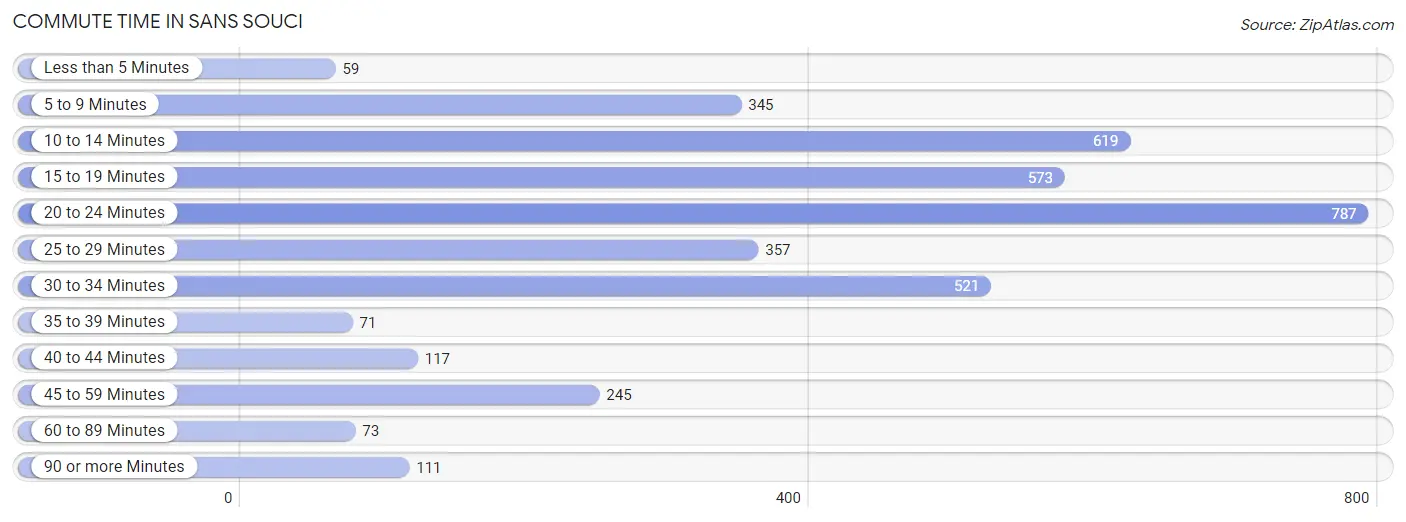
| Commute Time | # Commuters | % Commuters |
| Less than 5 Minutes | 59 | 1.5% |
| 5 to 9 Minutes | 345 | 8.9% |
| 10 to 14 Minutes | 619 | 16.0% |
| 15 to 19 Minutes | 573 | 14.8% |
| 20 to 24 Minutes | 787 | 20.3% |
| 25 to 29 Minutes | 357 | 9.2% |
| 30 to 34 Minutes | 521 | 13.4% |
| 35 to 39 Minutes | 71 | 1.8% |
| 40 to 44 Minutes | 117 | 3.0% |
| 45 to 59 Minutes | 245 | 6.3% |
| 60 to 89 Minutes | 73 | 1.9% |
| 90 or more Minutes | 111 | 2.9% |
Commute Time by Sex in Sans Souci
The most common commute times in Sans Souci are 20 to 24 minutes (426 commuters, 19.8%) for males and 20 to 24 minutes (361 commuters, 20.9%) for females.
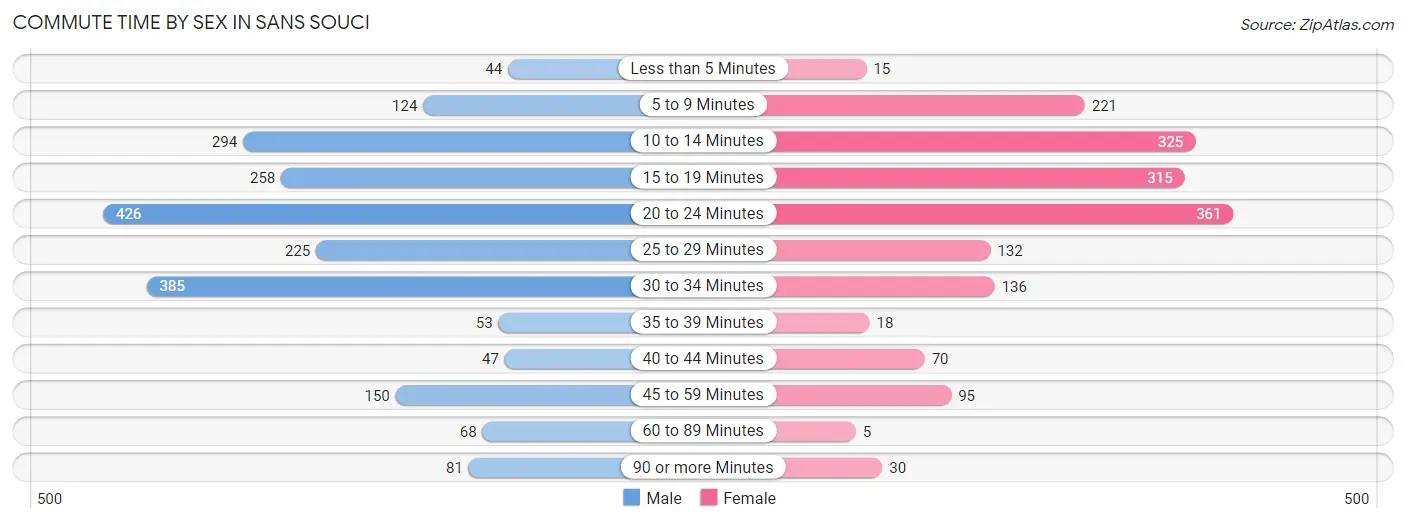
| Commute Time | Male | Female |
| Less than 5 Minutes | 44 (2.0%) | 15 (0.9%) |
| 5 to 9 Minutes | 124 (5.8%) | 221 (12.8%) |
| 10 to 14 Minutes | 294 (13.6%) | 325 (18.9%) |
| 15 to 19 Minutes | 258 (12.0%) | 315 (18.3%) |
| 20 to 24 Minutes | 426 (19.8%) | 361 (20.9%) |
| 25 to 29 Minutes | 225 (10.4%) | 132 (7.7%) |
| 30 to 34 Minutes | 385 (17.9%) | 136 (7.9%) |
| 35 to 39 Minutes | 53 (2.5%) | 18 (1.0%) |
| 40 to 44 Minutes | 47 (2.2%) | 70 (4.1%) |
| 45 to 59 Minutes | 150 (7.0%) | 95 (5.5%) |
| 60 to 89 Minutes | 68 (3.2%) | 5 (0.3%) |
| 90 or more Minutes | 81 (3.8%) | 30 (1.7%) |
Time of Departure to Work by Sex in Sans Souci
The most frequent times of departure to work in Sans Souci are 7:30 AM to 7:59 AM (388, 18.0%) for males and 6:00 AM to 6:29 AM (290, 16.8%) for females.
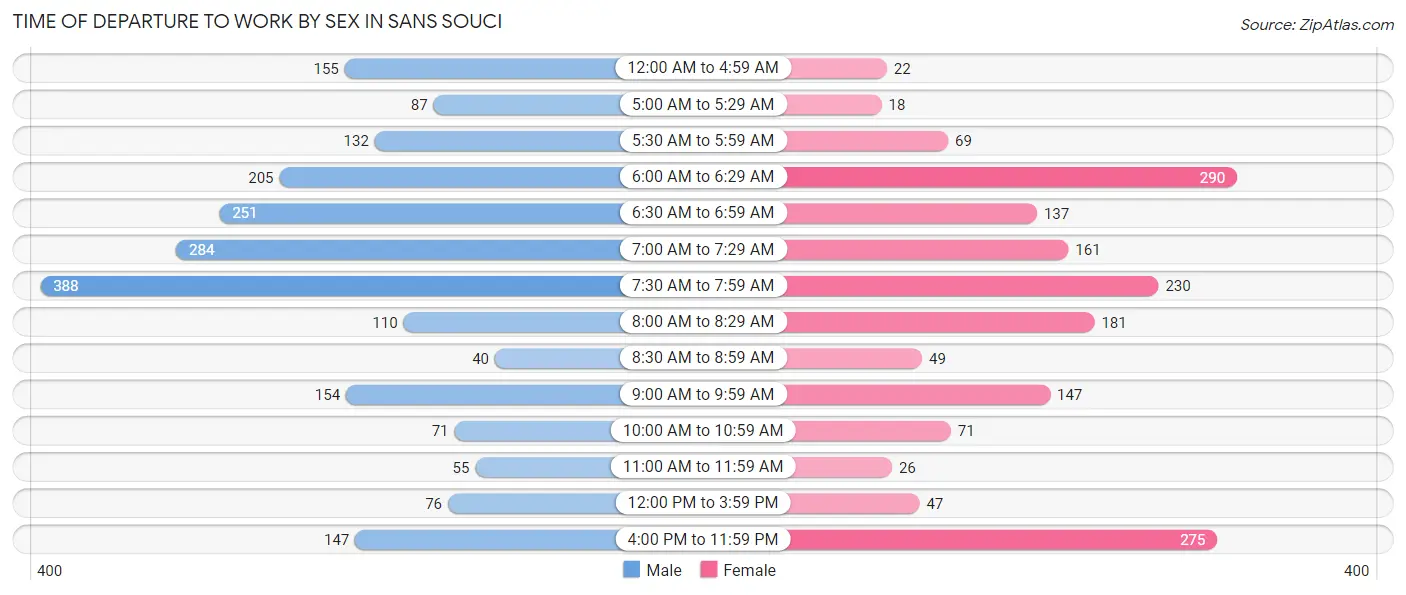
| Time of Departure | Male | Female |
| 12:00 AM to 4:59 AM | 155 (7.2%) | 22 (1.3%) |
| 5:00 AM to 5:29 AM | 87 (4.0%) | 18 (1.0%) |
| 5:30 AM to 5:59 AM | 132 (6.1%) | 69 (4.0%) |
| 6:00 AM to 6:29 AM | 205 (9.5%) | 290 (16.8%) |
| 6:30 AM to 6:59 AM | 251 (11.7%) | 137 (8.0%) |
| 7:00 AM to 7:29 AM | 284 (13.2%) | 161 (9.3%) |
| 7:30 AM to 7:59 AM | 388 (18.0%) | 230 (13.4%) |
| 8:00 AM to 8:29 AM | 110 (5.1%) | 181 (10.5%) |
| 8:30 AM to 8:59 AM | 40 (1.9%) | 49 (2.8%) |
| 9:00 AM to 9:59 AM | 154 (7.1%) | 147 (8.5%) |
| 10:00 AM to 10:59 AM | 71 (3.3%) | 71 (4.1%) |
| 11:00 AM to 11:59 AM | 55 (2.5%) | 26 (1.5%) |
| 12:00 PM to 3:59 PM | 76 (3.5%) | 47 (2.7%) |
| 4:00 PM to 11:59 PM | 147 (6.8%) | 275 (16.0%) |
| Total | 2,155 (100.0%) | 1,723 (100.0%) |
Housing Occupancy in Sans Souci
Occupancy by Ownership in Sans Souci
Of the total 3,801 dwellings in Sans Souci, owner-occupied units account for 2,314 (60.9%), while renter-occupied units make up 1,487 (39.1%).
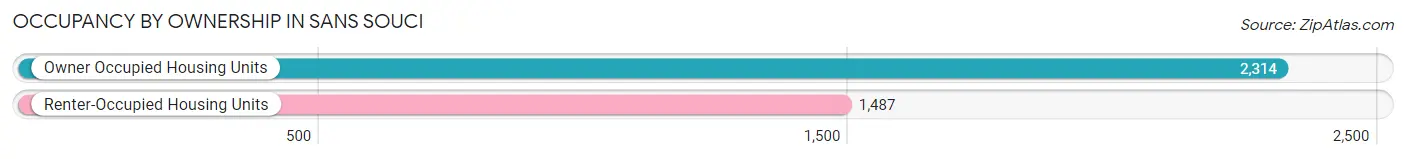
| Occupancy | # Housing Units | % Housing Units |
| Owner Occupied Housing Units | 2,314 | 60.9% |
| Renter-Occupied Housing Units | 1,487 | 39.1% |
| Total Occupied Housing Units | 3,801 | 100.0% |
Occupancy by Household Size in Sans Souci
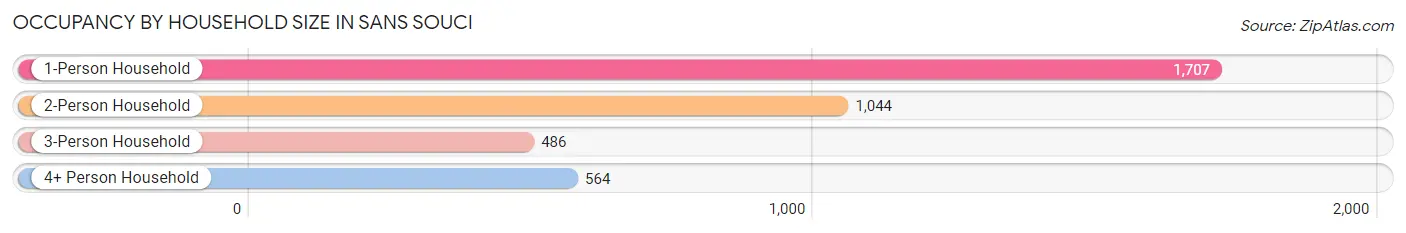
| Household Size | # Housing Units | % Housing Units |
| 1-Person Household | 1,707 | 44.9% |
| 2-Person Household | 1,044 | 27.5% |
| 3-Person Household | 486 | 12.8% |
| 4+ Person Household | 564 | 14.8% |
| Total Housing Units | 3,801 | 100.0% |
Occupancy by Ownership by Household Size in Sans Souci
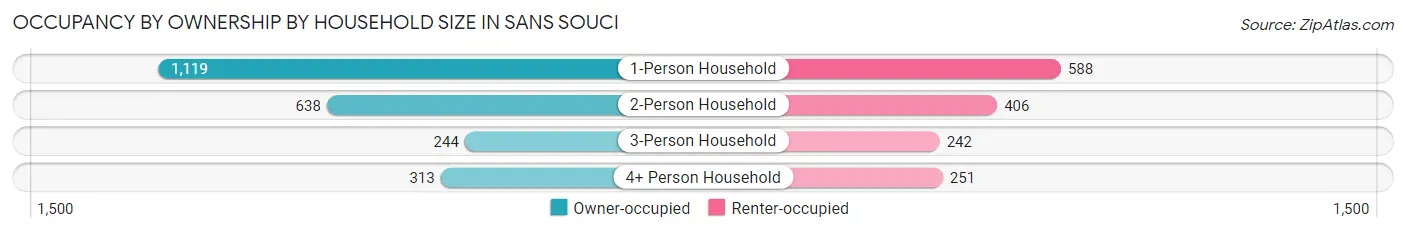
| Household Size | Owner-occupied | Renter-occupied |
| 1-Person Household | 1,119 (65.5%) | 588 (34.4%) |
| 2-Person Household | 638 (61.1%) | 406 (38.9%) |
| 3-Person Household | 244 (50.2%) | 242 (49.8%) |
| 4+ Person Household | 313 (55.5%) | 251 (44.5%) |
| Total Housing Units | 2,314 (60.9%) | 1,487 (39.1%) |
Occupancy by Educational Attainment in Sans Souci
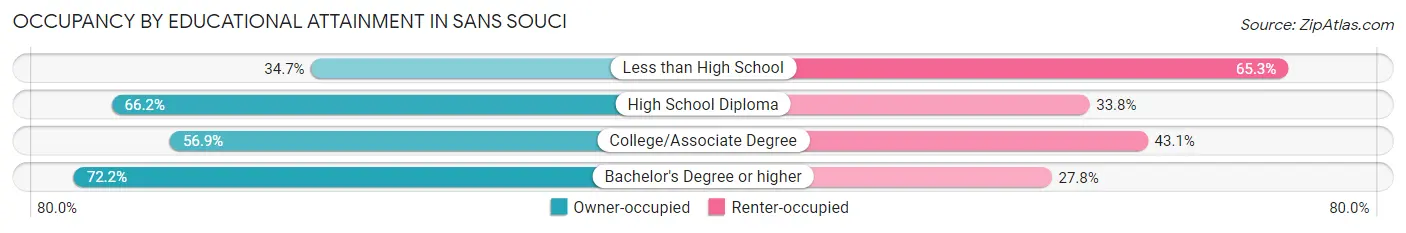
| Household Size | Owner-occupied | Renter-occupied |
| Less than High School | 182 (34.7%) | 343 (65.3%) |
| High School Diploma | 920 (66.2%) | 470 (33.8%) |
| College/Associate Degree | 558 (56.9%) | 422 (43.1%) |
| Bachelor's Degree or higher | 654 (72.2%) | 252 (27.8%) |
Occupancy by Age of Householder in Sans Souci
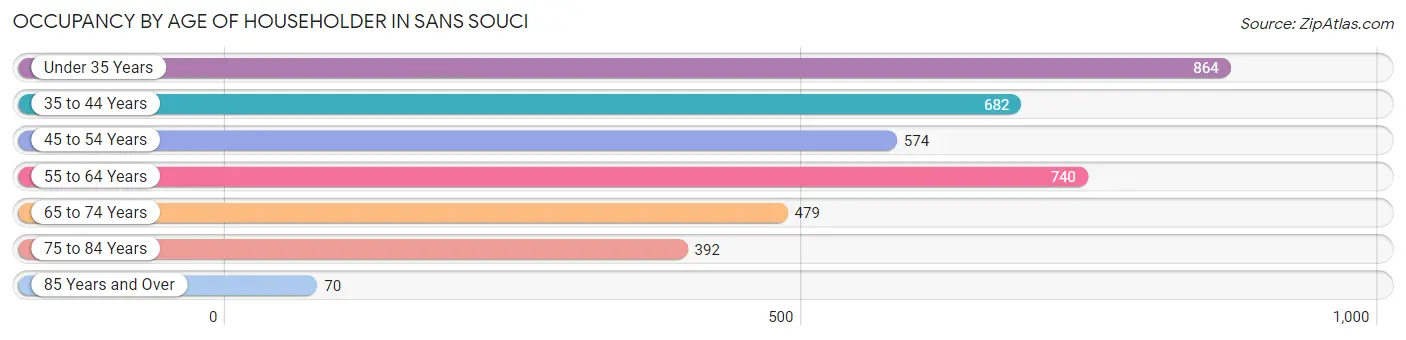
| Age Bracket | # Households | % Households |
| Under 35 Years | 864 | 22.7% |
| 35 to 44 Years | 682 | 17.9% |
| 45 to 54 Years | 574 | 15.1% |
| 55 to 64 Years | 740 | 19.5% |
| 65 to 74 Years | 479 | 12.6% |
| 75 to 84 Years | 392 | 10.3% |
| 85 Years and Over | 70 | 1.8% |
| Total | 3,801 | 100.0% |
Housing Finances in Sans Souci
Median Income by Occupancy in Sans Souci
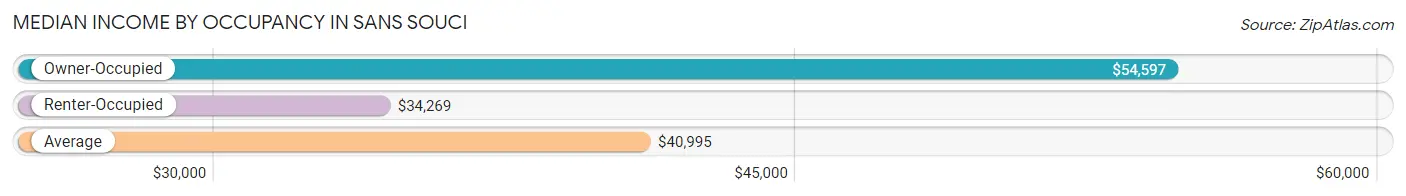
| Occupancy Type | # Households | Median Income |
| Owner-Occupied | 2,314 (60.9%) | $54,597 |
| Renter-Occupied | 1,487 (39.1%) | $34,269 |
| Average | 3,801 (100.0%) | $40,995 |
Occupancy by Householder Income Bracket in Sans Souci
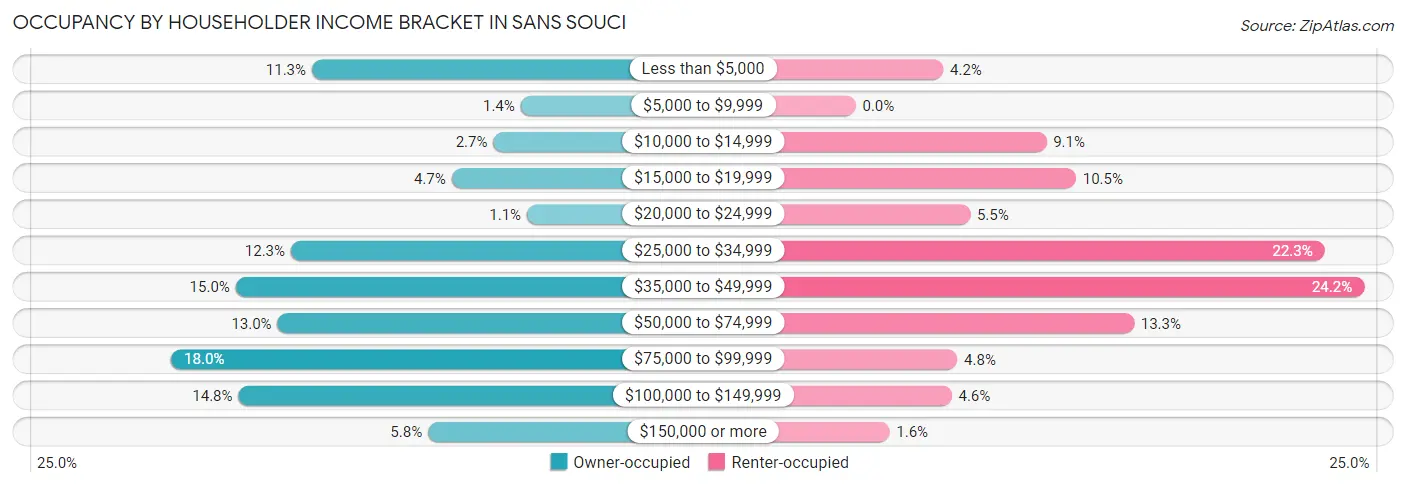
| Income Bracket | Owner-occupied | Renter-occupied |
| Less than $5,000 | 262 (11.3%) | 62 (4.2%) |
| $5,000 to $9,999 | 32 (1.4%) | 0 (0.0%) |
| $10,000 to $14,999 | 62 (2.7%) | 135 (9.1%) |
| $15,000 to $19,999 | 108 (4.7%) | 156 (10.5%) |
| $20,000 to $24,999 | 25 (1.1%) | 81 (5.4%) |
| $25,000 to $34,999 | 285 (12.3%) | 332 (22.3%) |
| $35,000 to $49,999 | 346 (14.9%) | 360 (24.2%) |
| $50,000 to $74,999 | 300 (13.0%) | 197 (13.3%) |
| $75,000 to $99,999 | 417 (18.0%) | 72 (4.8%) |
| $100,000 to $149,999 | 343 (14.8%) | 68 (4.6%) |
| $150,000 or more | 134 (5.8%) | 24 (1.6%) |
| Total | 2,314 (100.0%) | 1,487 (100.0%) |
Monthly Housing Cost Tiers in Sans Souci
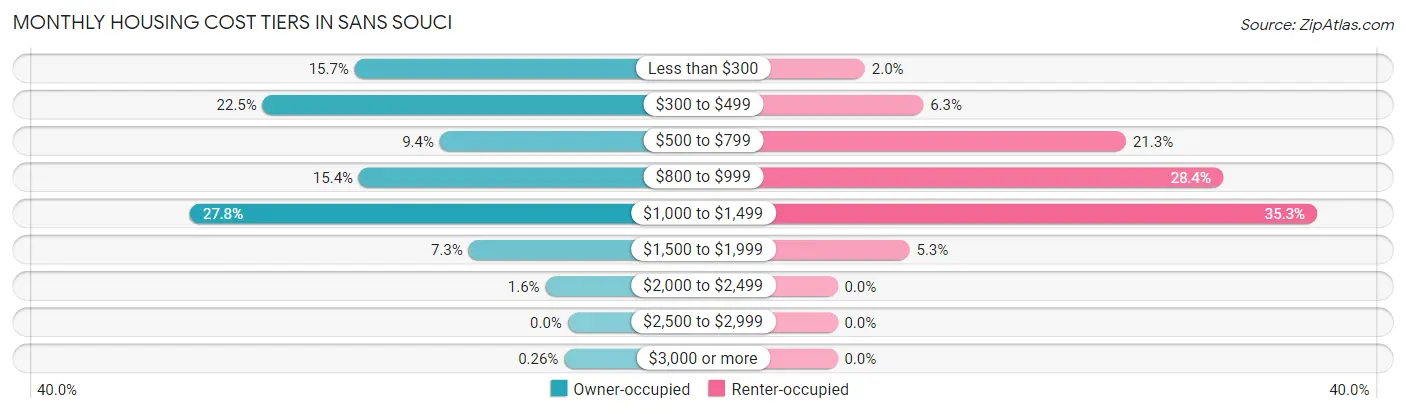
| Monthly Cost | Owner-occupied | Renter-occupied |
| Less than $300 | 363 (15.7%) | 30 (2.0%) |
| $300 to $499 | 520 (22.5%) | 94 (6.3%) |
| $500 to $799 | 218 (9.4%) | 316 (21.2%) |
| $800 to $999 | 356 (15.4%) | 422 (28.4%) |
| $1,000 to $1,499 | 644 (27.8%) | 525 (35.3%) |
| $1,500 to $1,999 | 169 (7.3%) | 79 (5.3%) |
| $2,000 to $2,499 | 38 (1.6%) | 0 (0.0%) |
| $2,500 to $2,999 | 0 (0.0%) | 0 (0.0%) |
| $3,000 or more | 6 (0.3%) | 0 (0.0%) |
| Total | 2,314 (100.0%) | 1,487 (100.0%) |
Physical Housing Characteristics in Sans Souci
Housing Structures in Sans Souci
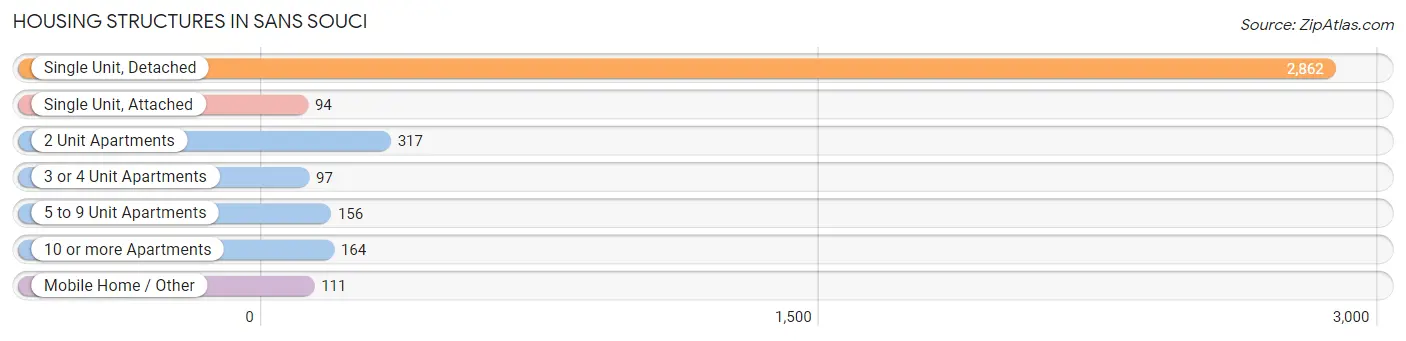
| Structure Type | # Housing Units | % Housing Units |
| Single Unit, Detached | 2,862 | 75.3% |
| Single Unit, Attached | 94 | 2.5% |
| 2 Unit Apartments | 317 | 8.3% |
| 3 or 4 Unit Apartments | 97 | 2.5% |
| 5 to 9 Unit Apartments | 156 | 4.1% |
| 10 or more Apartments | 164 | 4.3% |
| Mobile Home / Other | 111 | 2.9% |
| Total | 3,801 | 100.0% |
Housing Structures by Occupancy in Sans Souci
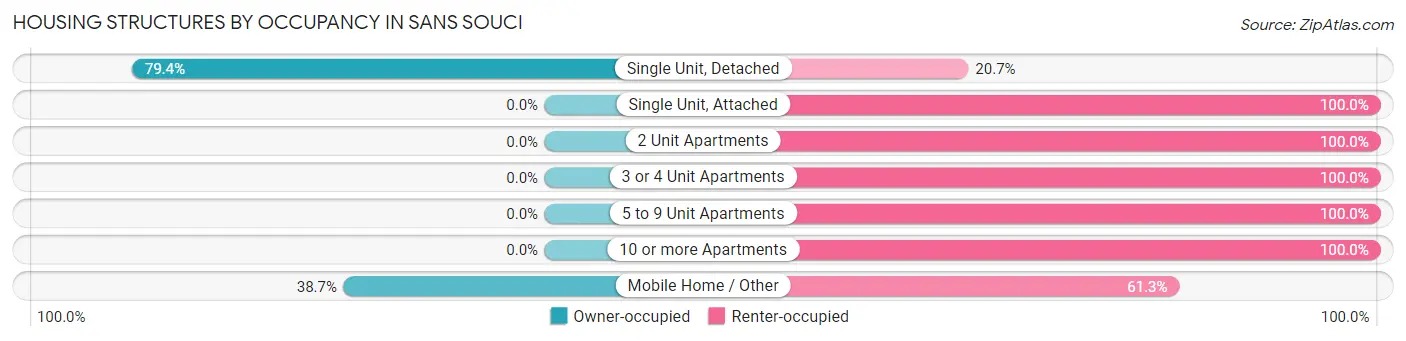
| Structure Type | Owner-occupied | Renter-occupied |
| Single Unit, Detached | 2,271 (79.3%) | 591 (20.6%) |
| Single Unit, Attached | 0 (0.0%) | 94 (100.0%) |
| 2 Unit Apartments | 0 (0.0%) | 317 (100.0%) |
| 3 or 4 Unit Apartments | 0 (0.0%) | 97 (100.0%) |
| 5 to 9 Unit Apartments | 0 (0.0%) | 156 (100.0%) |
| 10 or more Apartments | 0 (0.0%) | 164 (100.0%) |
| Mobile Home / Other | 43 (38.7%) | 68 (61.3%) |
| Total | 2,314 (60.9%) | 1,487 (39.1%) |
Housing Structures by Number of Rooms in Sans Souci
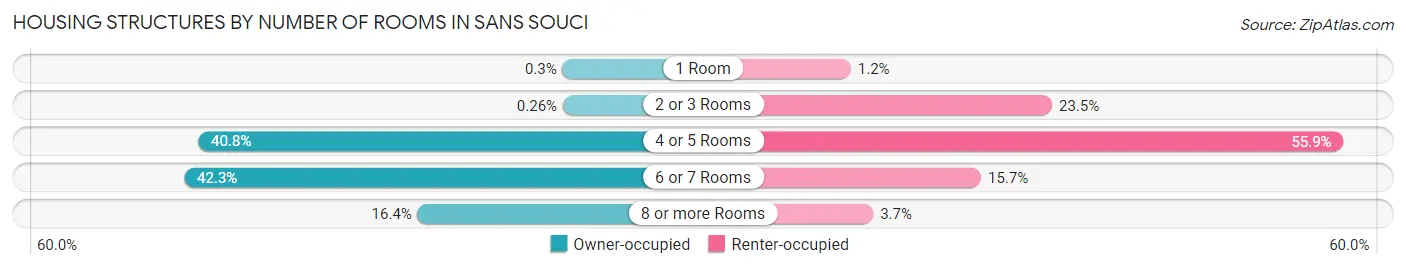
| Number of Rooms | Owner-occupied | Renter-occupied |
| 1 Room | 7 (0.3%) | 18 (1.2%) |
| 2 or 3 Rooms | 6 (0.3%) | 350 (23.5%) |
| 4 or 5 Rooms | 943 (40.7%) | 831 (55.9%) |
| 6 or 7 Rooms | 979 (42.3%) | 233 (15.7%) |
| 8 or more Rooms | 379 (16.4%) | 55 (3.7%) |
| Total | 2,314 (100.0%) | 1,487 (100.0%) |
Housing Structure by Heating Type in Sans Souci
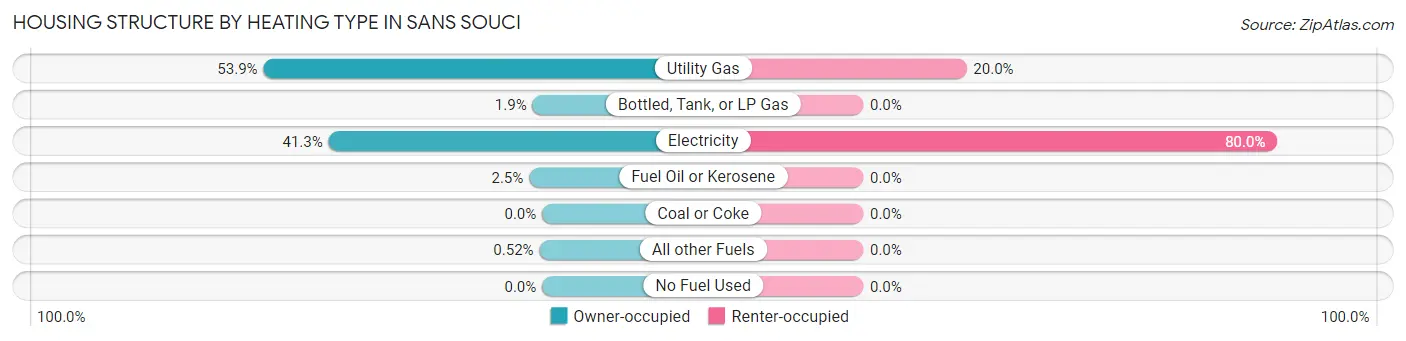
| Heating Type | Owner-occupied | Renter-occupied |
| Utility Gas | 1,246 (53.8%) | 297 (20.0%) |
| Bottled, Tank, or LP Gas | 43 (1.9%) | 0 (0.0%) |
| Electricity | 955 (41.3%) | 1,190 (80.0%) |
| Fuel Oil or Kerosene | 58 (2.5%) | 0 (0.0%) |
| Coal or Coke | 0 (0.0%) | 0 (0.0%) |
| All other Fuels | 12 (0.5%) | 0 (0.0%) |
| No Fuel Used | 0 (0.0%) | 0 (0.0%) |
| Total | 2,314 (100.0%) | 1,487 (100.0%) |
Household Vehicle Usage in Sans Souci
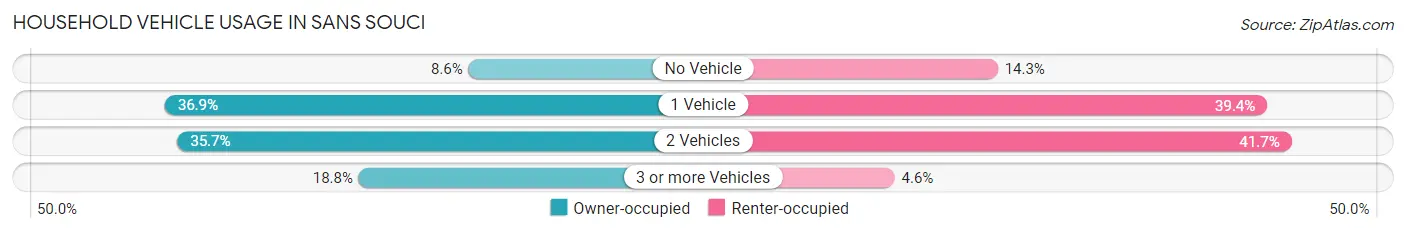
| Vehicles per Household | Owner-occupied | Renter-occupied |
| No Vehicle | 198 (8.6%) | 212 (14.3%) |
| 1 Vehicle | 854 (36.9%) | 586 (39.4%) |
| 2 Vehicles | 827 (35.7%) | 620 (41.7%) |
| 3 or more Vehicles | 435 (18.8%) | 69 (4.6%) |
| Total | 2,314 (100.0%) | 1,487 (100.0%) |
Real Estate & Mortgages in Sans Souci
Real Estate and Mortgage Overview in Sans Souci
| Characteristic | Without Mortgage | With Mortgage |
| Housing Units | 859 | 1,455 |
| Median Property Value | $176,800 | $173,500 |
| Median Household Income | $39,141 | $108 |
| Monthly Housing Costs | $351 | $6 |
| Real Estate Taxes | $1,004 | $24 |
Property Value by Mortgage Status in Sans Souci
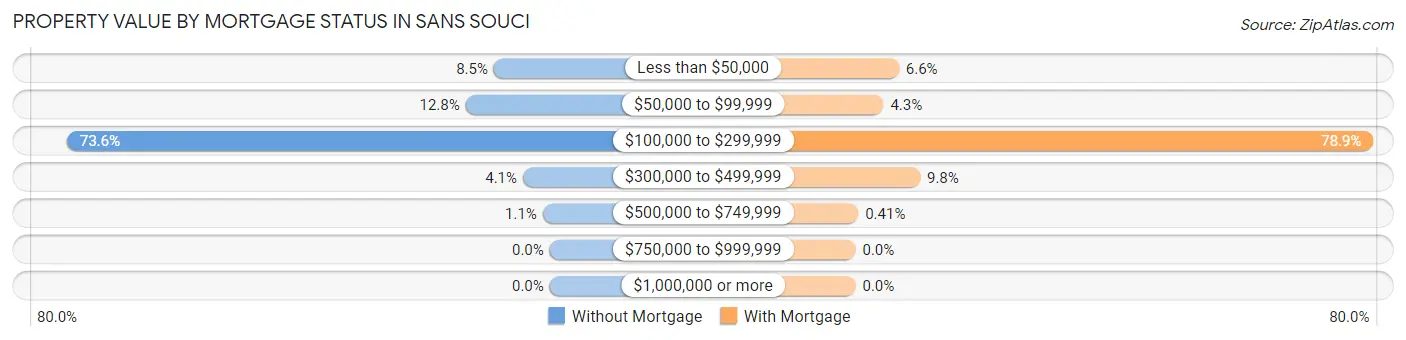
| Property Value | Without Mortgage | With Mortgage |
| Less than $50,000 | 73 (8.5%) | 96 (6.6%) |
| $50,000 to $99,999 | 110 (12.8%) | 62 (4.3%) |
| $100,000 to $299,999 | 632 (73.6%) | 1,148 (78.9%) |
| $300,000 to $499,999 | 35 (4.1%) | 143 (9.8%) |
| $500,000 to $749,999 | 9 (1.1%) | 6 (0.4%) |
| $750,000 to $999,999 | 0 (0.0%) | 0 (0.0%) |
| $1,000,000 or more | 0 (0.0%) | 0 (0.0%) |
| Total | 859 (100.0%) | 1,455 (100.0%) |
Household Income by Mortgage Status in Sans Souci
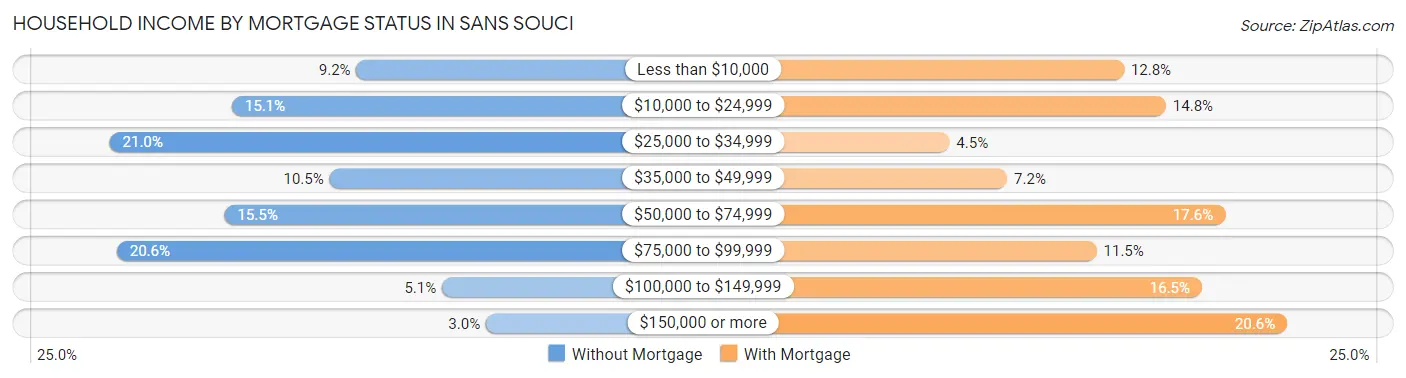
| Household Income | Without Mortgage | With Mortgage |
| Less than $10,000 | 79 (9.2%) | 186 (12.8%) |
| $10,000 to $24,999 | 130 (15.1%) | 215 (14.8%) |
| $25,000 to $34,999 | 180 (20.9%) | 65 (4.5%) |
| $35,000 to $49,999 | 90 (10.5%) | 105 (7.2%) |
| $50,000 to $74,999 | 133 (15.5%) | 256 (17.6%) |
| $75,000 to $99,999 | 177 (20.6%) | 167 (11.5%) |
| $100,000 to $149,999 | 44 (5.1%) | 240 (16.5%) |
| $150,000 or more | 26 (3.0%) | 299 (20.5%) |
| Total | 859 (100.0%) | 1,455 (100.0%) |
Property Value to Household Income Ratio in Sans Souci
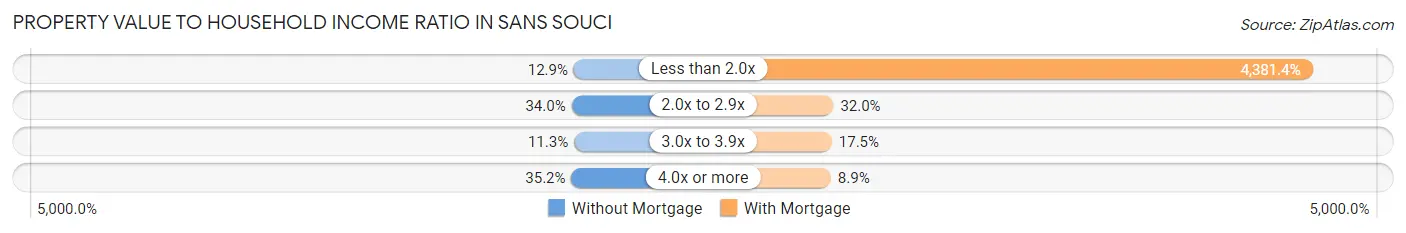
| Value-to-Income Ratio | Without Mortgage | With Mortgage |
| Less than 2.0x | 111 (12.9%) | 63,750 (4,381.4%) |
| 2.0x to 2.9x | 292 (34.0%) | 465 (32.0%) |
| 3.0x to 3.9x | 97 (11.3%) | 254 (17.5%) |
| 4.0x or more | 302 (35.2%) | 129 (8.9%) |
| Total | 859 (100.0%) | 1,455 (100.0%) |
Real Estate Taxes by Mortgage Status in Sans Souci
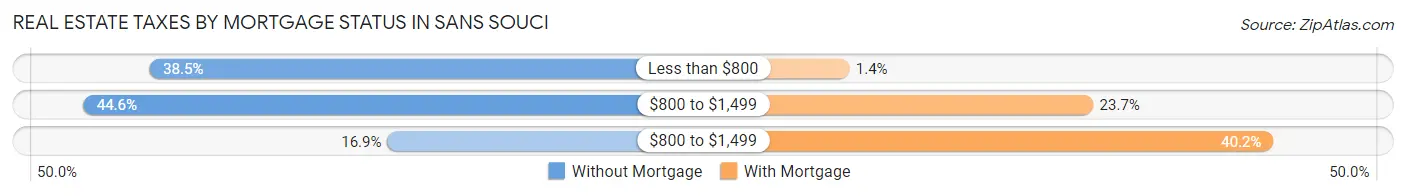
| Property Taxes | Without Mortgage | With Mortgage |
| Less than $800 | 331 (38.5%) | 21 (1.4%) |
| $800 to $1,499 | 383 (44.6%) | 345 (23.7%) |
| $800 to $1,499 | 145 (16.9%) | 585 (40.2%) |
| Total | 859 (100.0%) | 1,455 (100.0%) |
Health & Disability in Sans Souci
Health Insurance Coverage by Age in Sans Souci
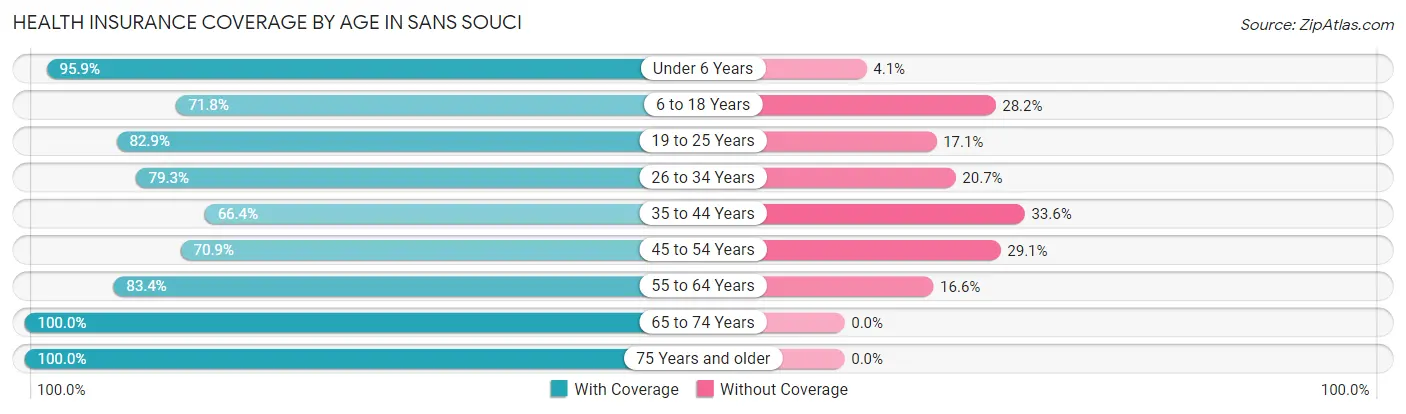
| Age Bracket | With Coverage | Without Coverage |
| Under 6 Years | 560 (95.9%) | 24 (4.1%) |
| 6 to 18 Years | 740 (71.8%) | 290 (28.2%) |
| 19 to 25 Years | 406 (82.9%) | 84 (17.1%) |
| 26 to 34 Years | 1,041 (79.3%) | 272 (20.7%) |
| 35 to 44 Years | 757 (66.4%) | 383 (33.6%) |
| 45 to 54 Years | 692 (70.9%) | 284 (29.1%) |
| 55 to 64 Years | 1,047 (83.4%) | 208 (16.6%) |
| 65 to 74 Years | 614 (100.0%) | 0 (0.0%) |
| 75 Years and older | 633 (100.0%) | 0 (0.0%) |
| Total | 6,490 (80.8%) | 1,545 (19.2%) |
Health Insurance Coverage by Citizenship Status in Sans Souci
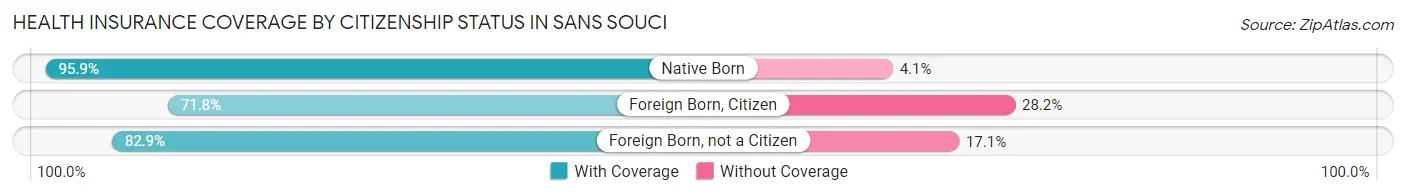
| Citizenship Status | With Coverage | Without Coverage |
| Native Born | 560 (95.9%) | 24 (4.1%) |
| Foreign Born, Citizen | 740 (71.8%) | 290 (28.2%) |
| Foreign Born, not a Citizen | 406 (82.9%) | 84 (17.1%) |
Health Insurance Coverage by Household Income in Sans Souci
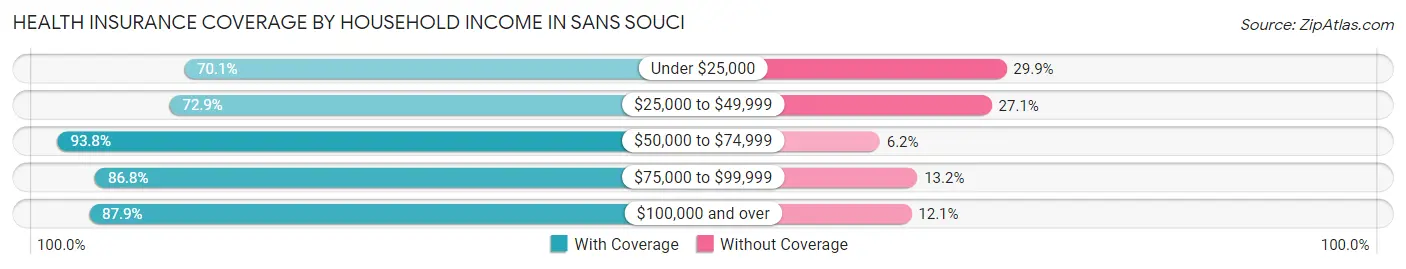
| Household Income | With Coverage | Without Coverage |
| Under $25,000 | 912 (70.1%) | 389 (29.9%) |
| $25,000 to $49,999 | 1,901 (72.9%) | 708 (27.1%) |
| $50,000 to $74,999 | 1,033 (93.8%) | 68 (6.2%) |
| $75,000 to $99,999 | 1,170 (86.8%) | 178 (13.2%) |
| $100,000 and over | 1,467 (87.9%) | 202 (12.1%) |
Public vs Private Health Insurance Coverage by Age in Sans Souci
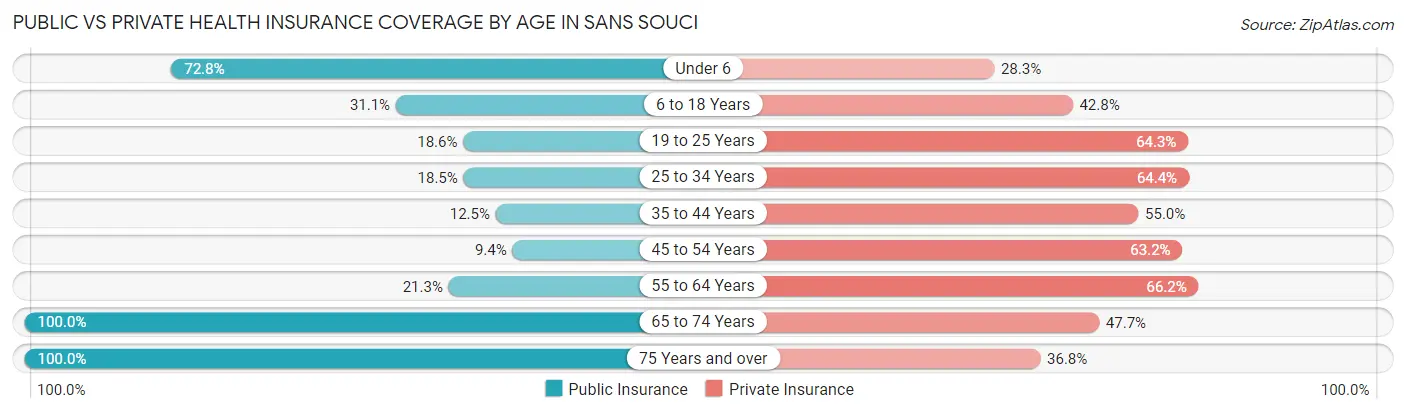
| Age Bracket | Public Insurance | Private Insurance |
| Under 6 | 425 (72.8%) | 165 (28.2%) |
| 6 to 18 Years | 320 (31.1%) | 441 (42.8%) |
| 19 to 25 Years | 91 (18.6%) | 315 (64.3%) |
| 25 to 34 Years | 243 (18.5%) | 846 (64.4%) |
| 35 to 44 Years | 143 (12.5%) | 627 (55.0%) |
| 45 to 54 Years | 92 (9.4%) | 617 (63.2%) |
| 55 to 64 Years | 267 (21.3%) | 831 (66.2%) |
| 65 to 74 Years | 614 (100.0%) | 293 (47.7%) |
| 75 Years and over | 633 (100.0%) | 233 (36.8%) |
| Total | 2,828 (35.2%) | 4,368 (54.4%) |
Disability Status by Sex by Age in Sans Souci
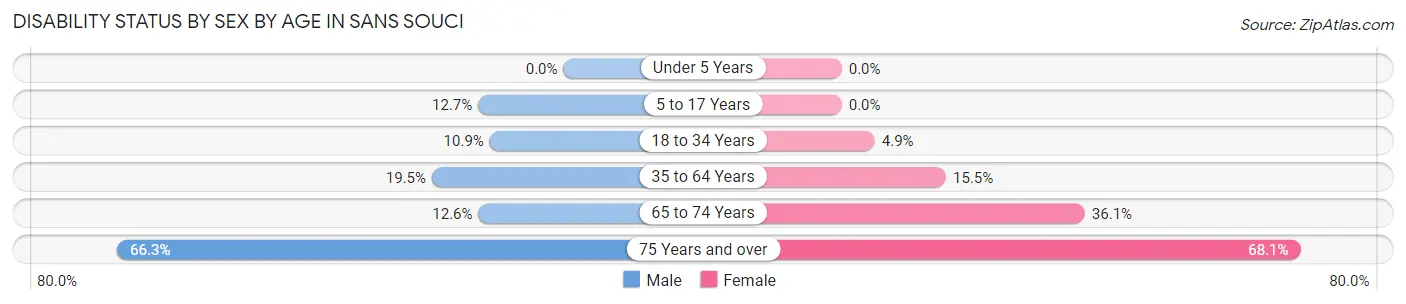
| Age Bracket | Male | Female |
| Under 5 Years | 0 (0.0%) | 0 (0.0%) |
| 5 to 17 Years | 71 (12.7%) | 0 (0.0%) |
| 18 to 34 Years | 83 (10.9%) | 54 (4.9%) |
| 35 to 64 Years | 357 (19.5%) | 239 (15.5%) |
| 65 to 74 Years | 38 (12.6%) | 113 (36.1%) |
| 75 Years and over | 110 (66.3%) | 318 (68.1%) |
Disability Class by Sex by Age in Sans Souci
Disability Class: Hearing Difficulty
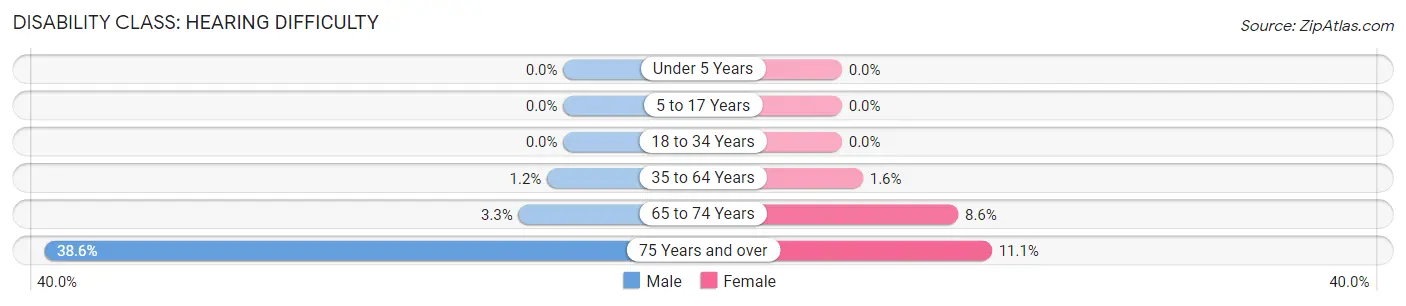
| Age Bracket | Male | Female |
| Under 5 Years | 0 (0.0%) | 0 (0.0%) |
| 5 to 17 Years | 0 (0.0%) | 0 (0.0%) |
| 18 to 34 Years | 0 (0.0%) | 0 (0.0%) |
| 35 to 64 Years | 22 (1.2%) | 24 (1.6%) |
| 65 to 74 Years | 10 (3.3%) | 27 (8.6%) |
| 75 Years and over | 64 (38.6%) | 52 (11.1%) |
Disability Class: Vision Difficulty
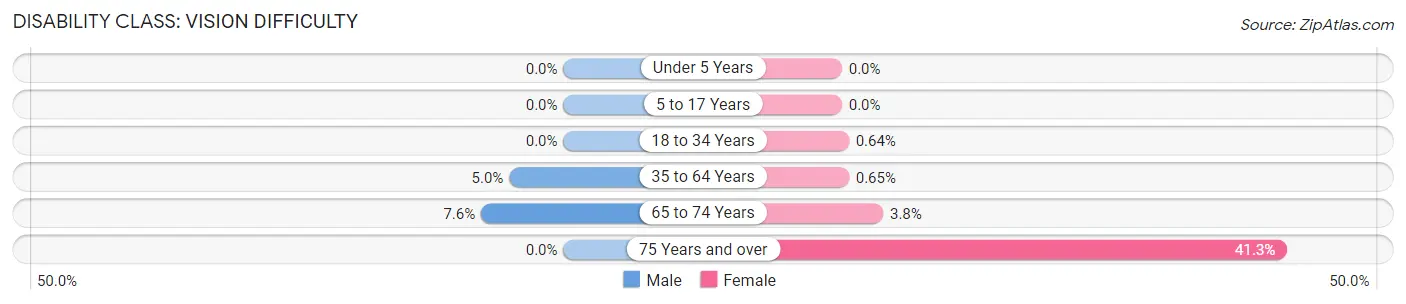
| Age Bracket | Male | Female |
| Under 5 Years | 0 (0.0%) | 0 (0.0%) |
| 5 to 17 Years | 0 (0.0%) | 0 (0.0%) |
| 18 to 34 Years | 0 (0.0%) | 7 (0.6%) |
| 35 to 64 Years | 92 (5.0%) | 10 (0.6%) |
| 65 to 74 Years | 23 (7.6%) | 12 (3.8%) |
| 75 Years and over | 0 (0.0%) | 193 (41.3%) |
Disability Class: Cognitive Difficulty
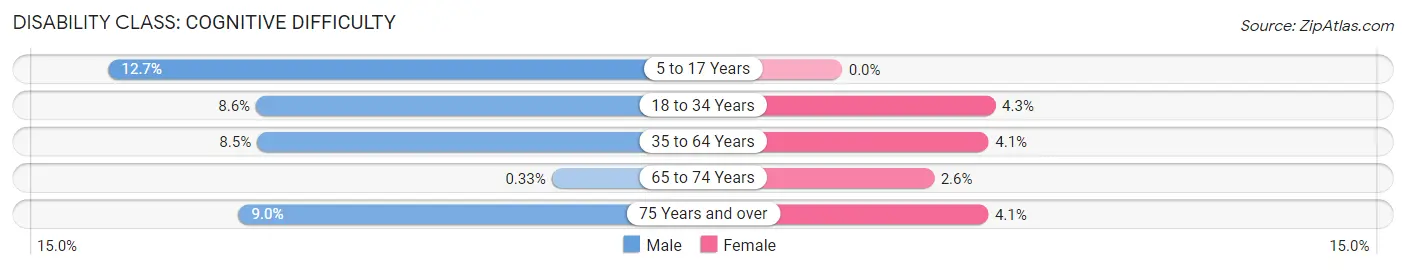
| Age Bracket | Male | Female |
| 5 to 17 Years | 71 (12.7%) | 0 (0.0%) |
| 18 to 34 Years | 65 (8.6%) | 47 (4.3%) |
| 35 to 64 Years | 156 (8.5%) | 63 (4.1%) |
| 65 to 74 Years | 1 (0.3%) | 8 (2.6%) |
| 75 Years and over | 15 (9.0%) | 19 (4.1%) |
Disability Class: Ambulatory Difficulty
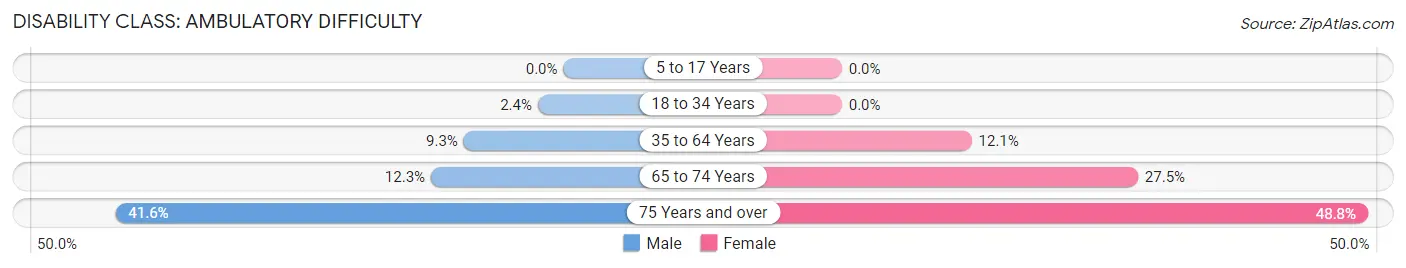
| Age Bracket | Male | Female |
| 5 to 17 Years | 0 (0.0%) | 0 (0.0%) |
| 18 to 34 Years | 18 (2.4%) | 0 (0.0%) |
| 35 to 64 Years | 169 (9.2%) | 186 (12.0%) |
| 65 to 74 Years | 37 (12.3%) | 86 (27.5%) |
| 75 Years and over | 69 (41.6%) | 228 (48.8%) |
Disability Class: Self-Care Difficulty
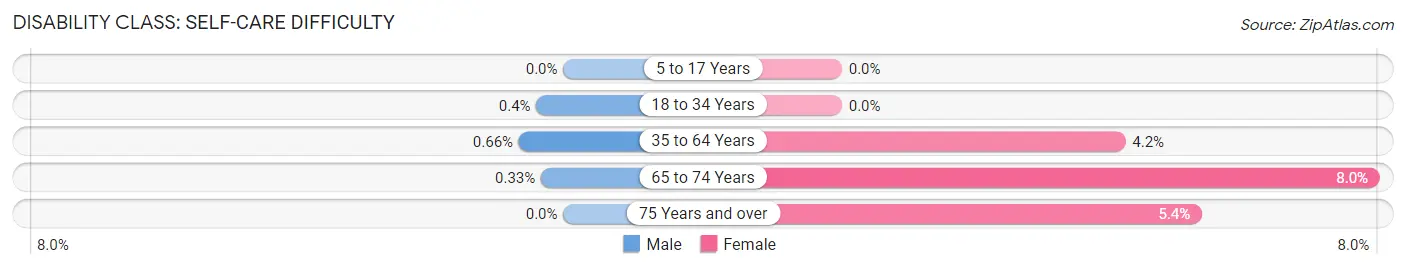
| Age Bracket | Male | Female |
| 5 to 17 Years | 0 (0.0%) | 0 (0.0%) |
| 18 to 34 Years | 3 (0.4%) | 0 (0.0%) |
| 35 to 64 Years | 12 (0.7%) | 65 (4.2%) |
| 65 to 74 Years | 1 (0.3%) | 25 (8.0%) |
| 75 Years and over | 0 (0.0%) | 25 (5.3%) |
Technology Access in Sans Souci
Computing Device Access in Sans Souci
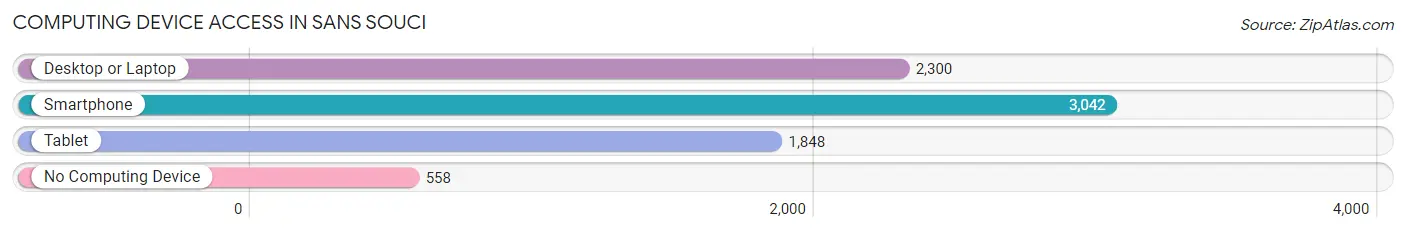
| Device Type | # Households | % Households |
| Desktop or Laptop | 2,300 | 60.5% |
| Smartphone | 3,042 | 80.0% |
| Tablet | 1,848 | 48.6% |
| No Computing Device | 558 | 14.7% |
| Total | 3,801 | 100.0% |
Internet Access in Sans Souci
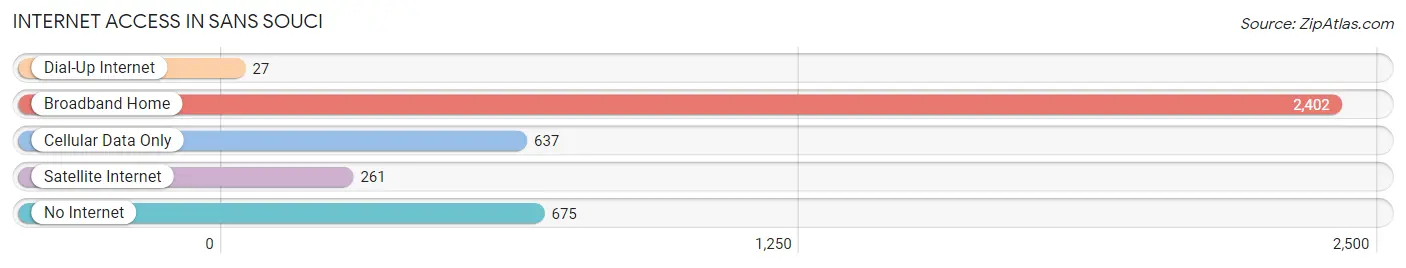
| Internet Type | # Households | % Households |
| Dial-Up Internet | 27 | 0.7% |
| Broadband Home | 2,402 | 63.2% |
| Cellular Data Only | 637 | 16.8% |
| Satellite Internet | 261 | 6.9% |
| No Internet | 675 | 17.8% |
| Total | 3,801 | 100.0% |
Sans Souci Summary
Sans Souci is a small unincorporated community located in the state of South Carolina, United States. It is situated in the northern part of the state, in Spartanburg County, and is part of the Spartanburg-Greenville-Anderson Combined Statistical Area. The population of Sans Souci was estimated to be around 1,000 in 2020.
History
Sans Souci was first settled in the late 1700s by French Huguenots who had fled religious persecution in their homeland. The name Sans Souci is French for “without worry” and was chosen to reflect the peaceful nature of the community. The area was originally part of the Cherokee Nation, but was ceded to the United States in 1777.
In the early 1800s, the area was home to a number of cotton plantations, and the town was a major center for cotton production. The town was also home to a number of churches, including the Sans Souci Presbyterian Church, which was founded in 1820.
In the late 1800s, the town began to decline as the cotton industry moved away from the area. The town was eventually abandoned in the early 1900s, and the population dwindled to just a few hundred people.
Geography
Sans Souci is located in the northern part of South Carolina, in Spartanburg County. It is situated in the foothills of the Blue Ridge Mountains, and is approximately 25 miles northwest of Spartanburg. The town is located along the Pacolet River, and is surrounded by the towns of Boiling Springs, Inman, and Cowpens.
The climate in Sans Souci is humid subtropical, with hot, humid summers and mild winters. The average annual temperature is around 63°F, and the average annual precipitation is around 48 inches.
Economy
The economy of Sans Souci is largely based on agriculture. The town is home to a number of farms, and the surrounding area is known for its production of cotton, corn, soybeans, and other crops. The town is also home to a number of small businesses, including restaurants, convenience stores, and auto repair shops.
Demographics
As of the 2020 census, the population of Sans Souci was estimated to be around 1,000. The racial makeup of the town was 94.2% White, 2.7% African American, 0.7% Native American, 0.3% Asian, and 2.1% from other races. The median household income was $37,500, and the median home value was $125,000.
Conclusion
Sans Souci is a small unincorporated community located in the northern part of South Carolina. It was first settled in the late 1700s by French Huguenots, and was once a major center for cotton production. The economy of the town is largely based on agriculture, and the population was estimated to be around 1,000 in 2020.
Common Questions
What is Per Capita Income in Sans Souci?
Per Capita income in Sans Souci is $28,238.
What is the Median Family Income in Sans Souci?
Median Family Income in Sans Souci is $58,143.
What is the Median Household income in Sans Souci?
Median Household Income in Sans Souci is $40,995.
What is Income or Wage Gap in Sans Souci?
Income or Wage Gap in Sans Souci is 18.0%.
Women in Sans Souci earn 82.0 cents for every dollar earned by a man.
What is Inequality or Gini Index in Sans Souci?
Inequality or Gini Index in Sans Souci is 0.45.
What is the Total Population of Sans Souci?
Total Population of Sans Souci is 8,042.
What is the Total Male Population of Sans Souci?
Total Male Population of Sans Souci is 3,772.
What is the Total Female Population of Sans Souci?
Total Female Population of Sans Souci is 4,270.
What is the Ratio of Males per 100 Females in Sans Souci?
There are 88.34 Males per 100 Females in Sans Souci.
What is the Ratio of Females per 100 Males in Sans Souci?
There are 113.20 Females per 100 Males in Sans Souci.
What is the Median Population Age in Sans Souci?
Median Population Age in Sans Souci is 40.5 Years.
What is the Average Family Size in Sans Souci
Average Family Size in Sans Souci is 3.0 People.
What is the Average Household Size in Sans Souci
Average Household Size in Sans Souci is 2.1 People.
How Large is the Labor Force in Sans Souci?
There are 4,467 People in the Labor Forcein in Sans Souci.
What is the Percentage of People in the Labor Force in Sans Souci?
66.7% of People are in the Labor Force in Sans Souci.
What is the Unemployment Rate in Sans Souci?
Unemployment Rate in Sans Souci is 4.5%.