Mangum, OK Map & Demographics
Mangum Map
Mangum Overview
$19,313
PER CAPITA INCOME
$62,775
AVG FAMILY INCOME
$47,917
AVG HOUSEHOLD INCOME
30.2%
WAGE / INCOME GAP [ % ]
69.8¢/ $1
WAGE / INCOME GAP [ $ ]
0.44
INEQUALITY / GINI INDEX
2,775
TOTAL POPULATION
1,346
MALE POPULATION
1,429
FEMALE POPULATION
94.19
MALES / 100 FEMALES
106.17
FEMALES / 100 MALES
32.3
MEDIAN AGE
3.0
AVG FAMILY SIZE
2.4
AVG HOUSEHOLD SIZE
991
LABOR FORCE [ PEOPLE ]
48.2%
PERCENT IN LABOR FORCE
11.1%
UNEMPLOYMENT RATE
Mangum Zip Codes
Mangum Area Codes
Income in Mangum
Income Overview in Mangum
Per Capita Income in Mangum is $19,313, while median incomes of families and households are $62,775 and $47,917 respectively.
| Characteristic | Number | Measure |
| Per Capita Income | 2,775 | $19,313 |
| Median Family Income | 727 | $62,775 |
| Mean Family Income | 727 | $67,305 |
| Median Household Income | 1,100 | $47,917 |
| Mean Household Income | 1,100 | $53,031 |
| Income Deficit | 727 | $0 |
| Wage / Income Gap (%) | 2,775 | 30.23% |
| Wage / Income Gap ($) | 2,775 | 69.77¢ per $1 |
| Gini / Inequality Index | 2,775 | 0.44 |
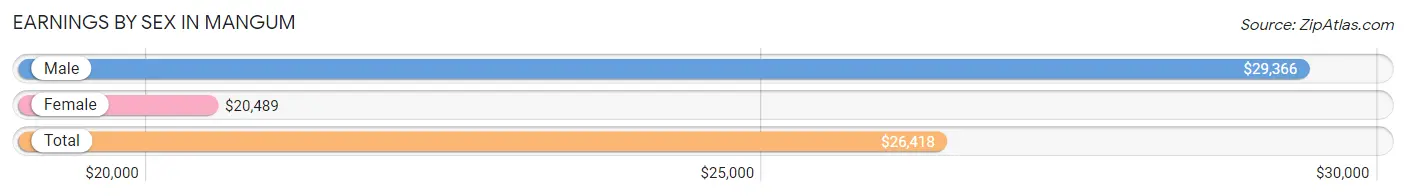
Earnings by Sex in Mangum
Average Earnings in Mangum are $26,418, $29,366 for men and $20,489 for women, a difference of 30.2%.
| Sex | Number | Average Earnings |
| Male | 536 (47.2%) | $29,366 |
| Female | 599 (52.8%) | $20,489 |
| Total | 1,135 (100.0%) | $26,418 |
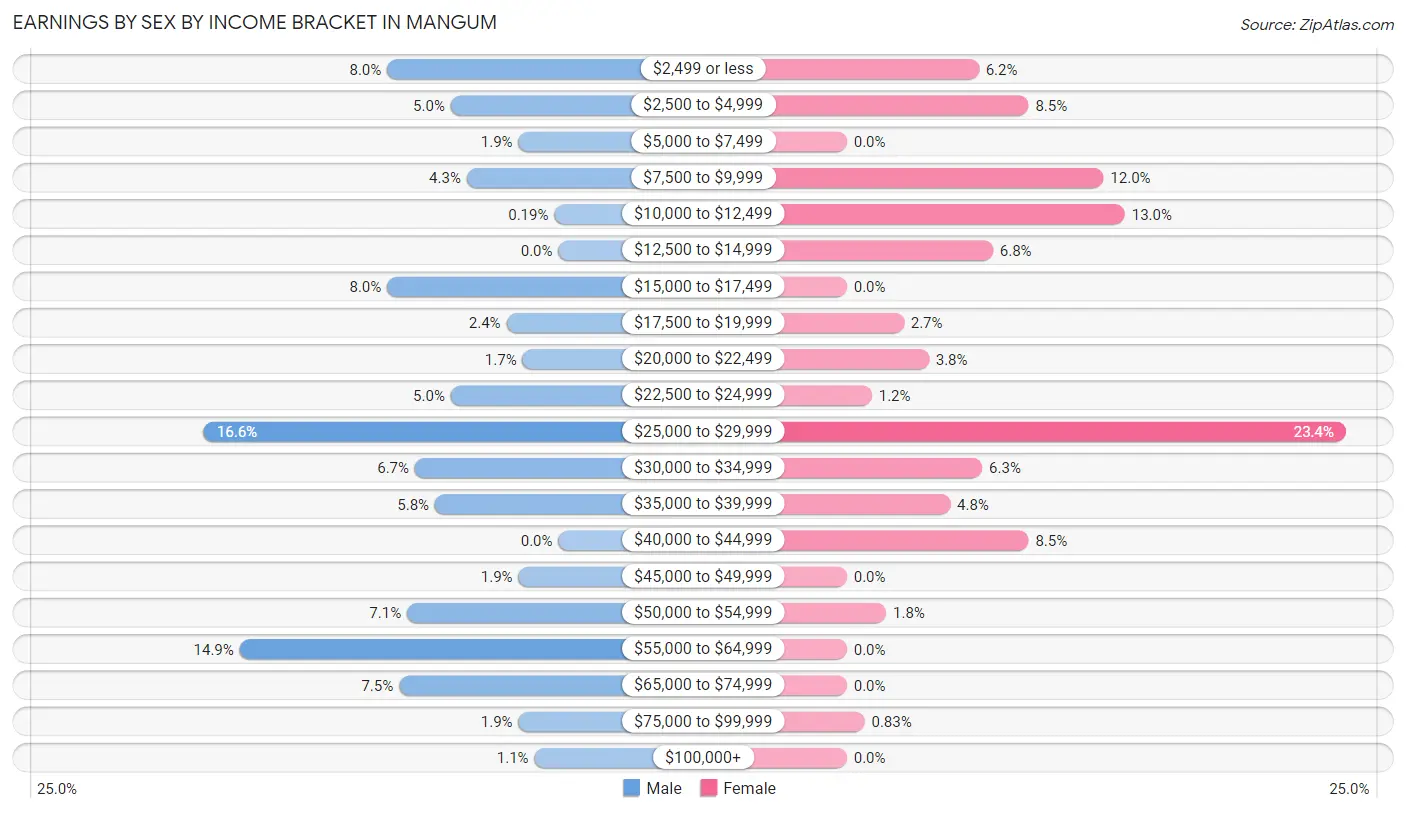
Earnings by Sex by Income Bracket in Mangum
The most common earnings brackets in Mangum are $25,000 to $29,999 for men (89 | 16.6%) and $25,000 to $29,999 for women (140 | 23.4%).
| Income | Male | Female |
| $2,499 or less | 43 (8.0%) | 37 (6.2%) |
| $2,500 to $4,999 | 27 (5.0%) | 51 (8.5%) |
| $5,000 to $7,499 | 10 (1.9%) | 0 (0.0%) |
| $7,500 to $9,999 | 23 (4.3%) | 72 (12.0%) |
| $10,000 to $12,499 | 1 (0.2%) | 78 (13.0%) |
| $12,500 to $14,999 | 0 (0.0%) | 41 (6.8%) |
| $15,000 to $17,499 | 43 (8.0%) | 0 (0.0%) |
| $17,500 to $19,999 | 13 (2.4%) | 16 (2.7%) |
| $20,000 to $22,499 | 9 (1.7%) | 23 (3.8%) |
| $22,500 to $24,999 | 27 (5.0%) | 7 (1.2%) |
| $25,000 to $29,999 | 89 (16.6%) | 140 (23.4%) |
| $30,000 to $34,999 | 36 (6.7%) | 38 (6.3%) |
| $35,000 to $39,999 | 31 (5.8%) | 29 (4.8%) |
| $40,000 to $44,999 | 0 (0.0%) | 51 (8.5%) |
| $45,000 to $49,999 | 10 (1.9%) | 0 (0.0%) |
| $50,000 to $54,999 | 38 (7.1%) | 11 (1.8%) |
| $55,000 to $64,999 | 80 (14.9%) | 0 (0.0%) |
| $65,000 to $74,999 | 40 (7.5%) | 0 (0.0%) |
| $75,000 to $99,999 | 10 (1.9%) | 5 (0.8%) |
| $100,000+ | 6 (1.1%) | 0 (0.0%) |
| Total | 536 (100.0%) | 599 (100.0%) |
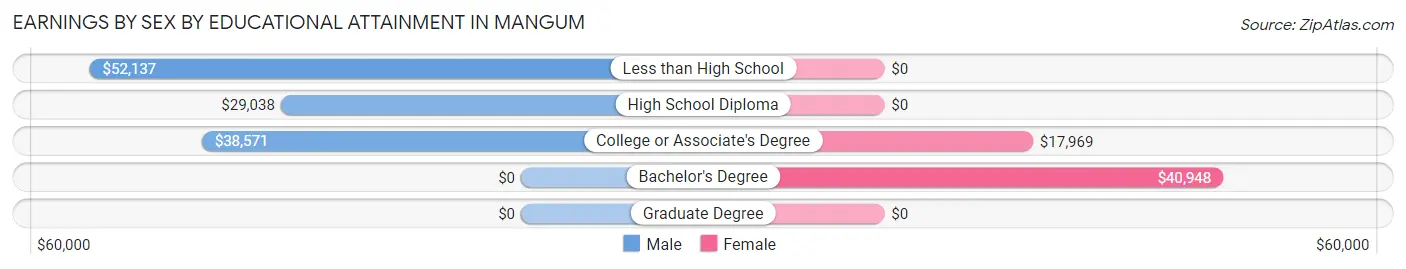
Earnings by Sex by Educational Attainment in Mangum
Average earnings in Mangum are $33,426 for men and $18,281 for women, a difference of 45.3%. Men with an educational attainment of less than high school enjoy the highest average annual earnings of $52,137, while those with high school diploma education earn the least with $29,038. Women with an educational attainment of bachelor's degree earn the most with the average annual earnings of $40,948, while those with college or associate's degree education have the smallest earnings of $17,969.
| Educational Attainment | Male Income | Female Income |
| Less than High School | $52,137 | $0 |
| High School Diploma | $29,038 | $0 |
| College or Associate's Degree | $38,571 | $17,969 |
| Bachelor's Degree | - | - |
| Graduate Degree | - | - |
| Total | $33,426 | $18,281 |
Family Income in Mangum
Family Income Brackets in Mangum
According to the Mangum family income data, there are 284 families falling into the $50,000 to $74,999 income range, which is the most common income bracket and makes up 39.1% of all families.
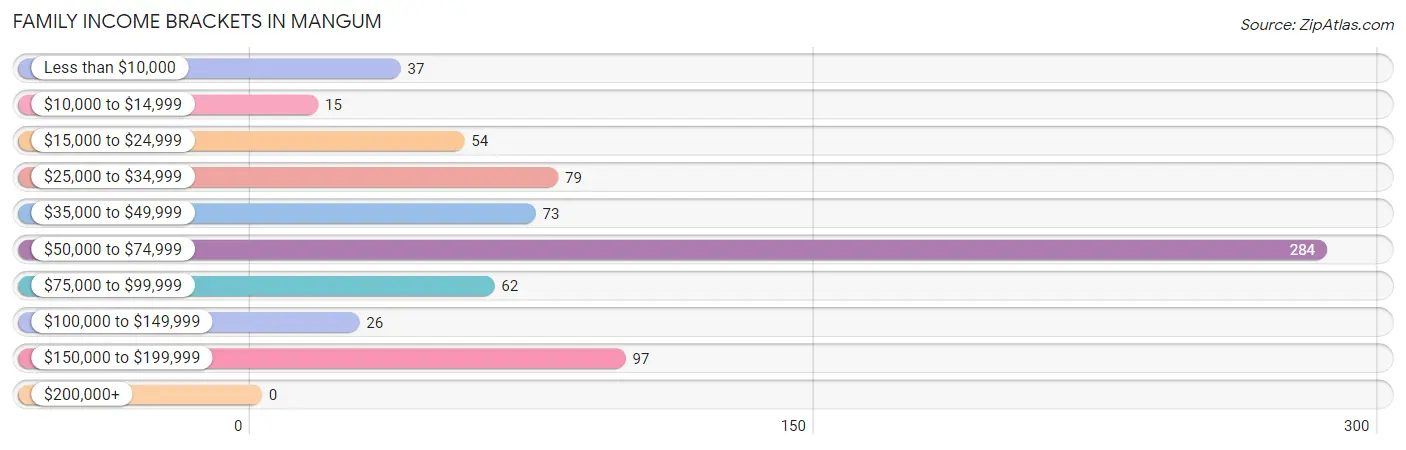
| Income Bracket | # Families | % Families |
| Less than $10,000 | 37 | 5.1% |
| $10,000 to $14,999 | 15 | 2.1% |
| $15,000 to $24,999 | 54 | 7.4% |
| $25,000 to $34,999 | 79 | 10.9% |
| $35,000 to $49,999 | 73 | 10.0% |
| $50,000 to $74,999 | 284 | 39.1% |
| $75,000 to $99,999 | 62 | 8.5% |
| $100,000 to $149,999 | 26 | 3.6% |
| $150,000 to $199,999 | 97 | 13.3% |
| $200,000+ | 0 | 0.0% |
Family Income by Famaliy Size in Mangum
5-person families (136 | 18.7%) account for the highest median family income in Mangum with $165,632 per family, while 5-person families (136 | 18.7%) have the highest median income of $33,126 per family member.
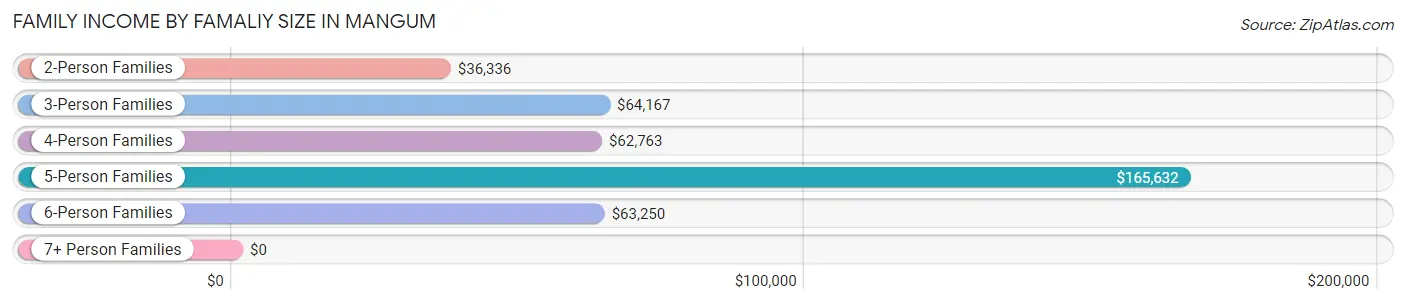
| Income Bracket | # Families | Median Income |
| 2-Person Families | 279 (38.4%) | $36,336 |
| 3-Person Families | 148 (20.4%) | $64,167 |
| 4-Person Families | 34 (4.7%) | $62,763 |
| 5-Person Families | 136 (18.7%) | $165,632 |
| 6-Person Families | 130 (17.9%) | $63,250 |
| 7+ Person Families | 0 (0.0%) | $0 |
| Total | 727 (100.0%) | $62,775 |
Family Income by Number of Earners in Mangum
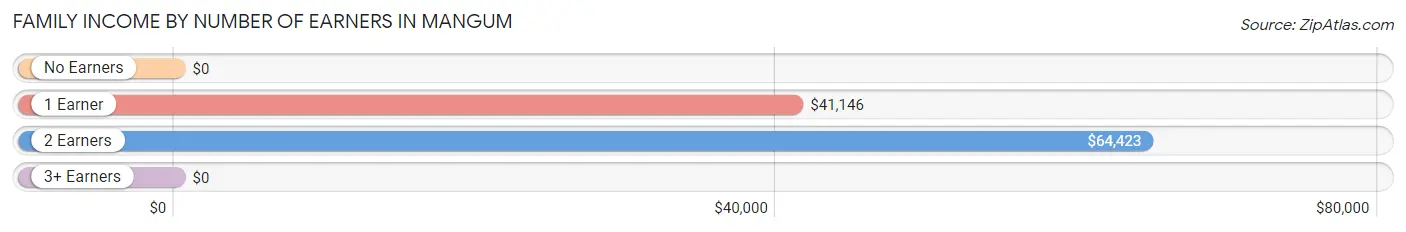
| Number of Earners | # Families | Median Income |
| No Earners | 118 (16.2%) | $0 |
| 1 Earner | 263 (36.2%) | $41,146 |
| 2 Earners | 270 (37.1%) | $64,423 |
| 3+ Earners | 76 (10.4%) | $0 |
| Total | 727 (100.0%) | $62,775 |
Household Income in Mangum
Household Income Brackets in Mangum
With 348 households falling in the category, the $50,000 to $74,999 income range is the most frequent in Mangum, accounting for 31.6% of all households.
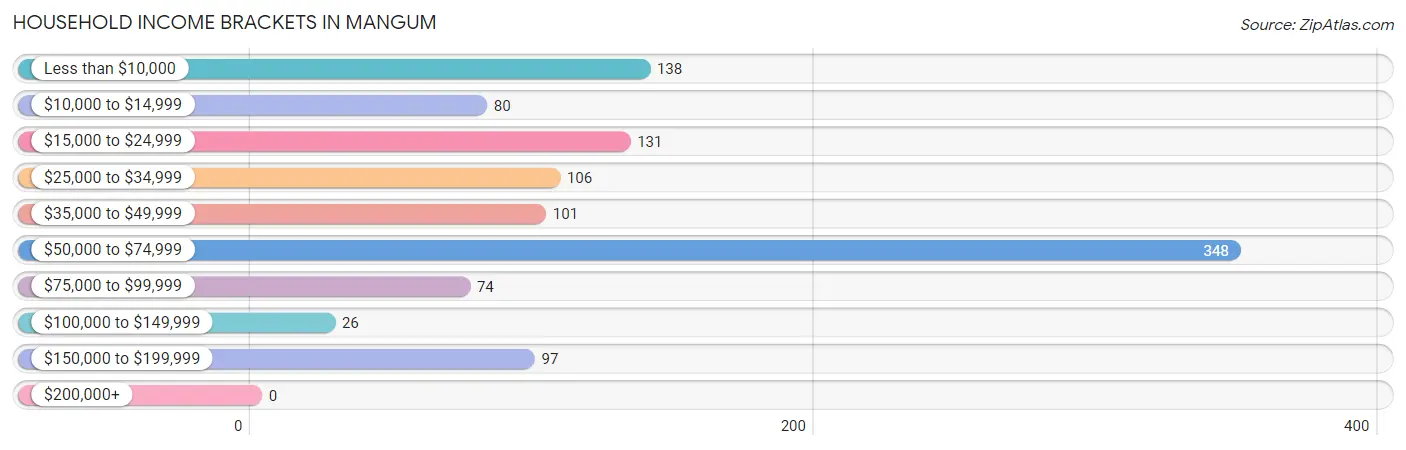
| Income Bracket | # Households | % Households |
| Less than $10,000 | 138 | 12.5% |
| $10,000 to $14,999 | 80 | 7.3% |
| $15,000 to $24,999 | 131 | 11.9% |
| $25,000 to $34,999 | 106 | 9.6% |
| $35,000 to $49,999 | 101 | 9.2% |
| $50,000 to $74,999 | 348 | 31.6% |
| $75,000 to $99,999 | 74 | 6.7% |
| $100,000 to $149,999 | 26 | 2.4% |
| $150,000 to $199,999 | 97 | 8.8% |
| $200,000+ | 0 | 0.0% |
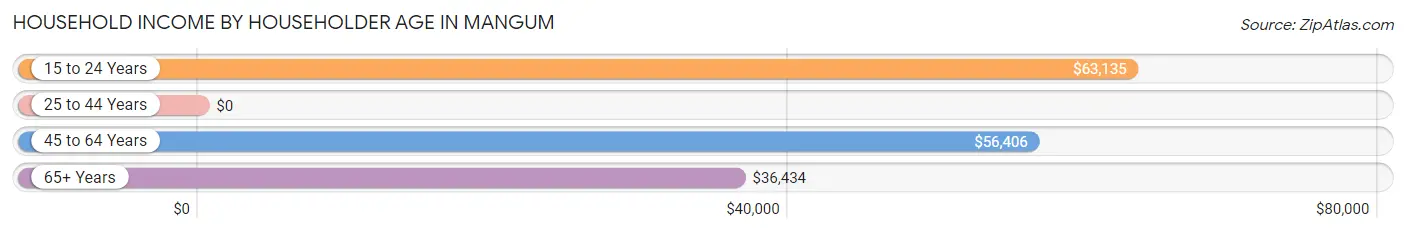
Household Income by Householder Age in Mangum
The median household income in Mangum is $47,917, with the highest median household income of $63,135 found in the 15 to 24 years age bracket for the primary householder. A total of 123 households (11.2%) fall into this category. Meanwhile, the 25 to 44 years age bracket for the primary householder has the lowest median household income of $0, with 246 households (22.4%) in this group.
| Income Bracket | # Households | Median Income |
| 15 to 24 Years | 123 (11.2%) | $63,135 |
| 25 to 44 Years | 246 (22.4%) | $0 |
| 45 to 64 Years | 350 (31.8%) | $56,406 |
| 65+ Years | 381 (34.6%) | $36,434 |
| Total | 1,100 (100.0%) | $47,917 |
Poverty in Mangum
Income Below Poverty by Sex and Age in Mangum
With 17.4% poverty level for males and 24.6% for females among the residents of Mangum, 6 to 11 year old males and 65 to 74 year old females are the most vulnerable to poverty, with 55 males (46.6%) and 68 females (51.5%) in their respective age groups living below the poverty level.
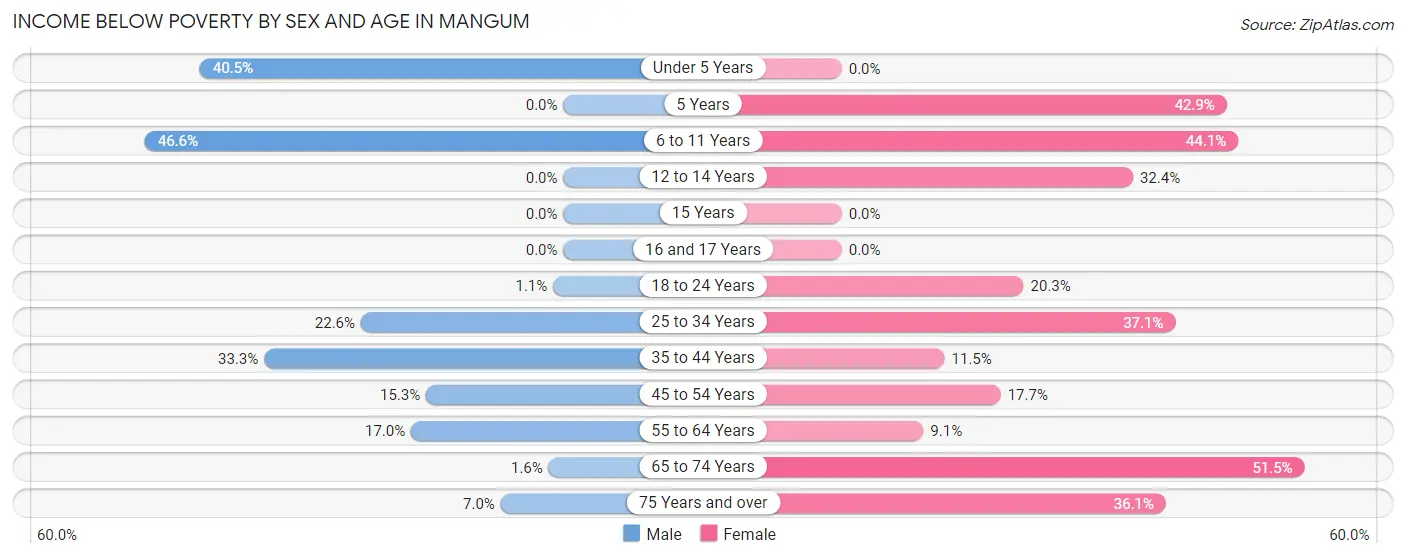
| Age Bracket | Male | Female |
| Under 5 Years | 34 (40.5%) | 0 (0.0%) |
| 5 Years | 0 (0.0%) | 9 (42.9%) |
| 6 to 11 Years | 55 (46.6%) | 49 (44.1%) |
| 12 to 14 Years | 0 (0.0%) | 12 (32.4%) |
| 15 Years | 0 (0.0%) | 0 (0.0%) |
| 16 and 17 Years | 0 (0.0%) | 0 (0.0%) |
| 18 to 24 Years | 1 (1.1%) | 33 (20.3%) |
| 25 to 34 Years | 53 (22.6%) | 62 (37.1%) |
| 35 to 44 Years | 28 (33.3%) | 15 (11.5%) |
| 45 to 54 Years | 24 (15.3%) | 20 (17.7%) |
| 55 to 64 Years | 19 (17.0%) | 19 (9.1%) |
| 65 to 74 Years | 2 (1.6%) | 68 (51.5%) |
| 75 Years and over | 3 (7.0%) | 48 (36.1%) |
| Total | 219 (17.4%) | 335 (24.6%) |
Income Above Poverty by Sex and Age in Mangum
According to the poverty statistics in Mangum, males aged 5 years and females aged under 5 years are the age groups that are most secure financially, with 100.0% of males and 100.0% of females in these age groups living above the poverty line.
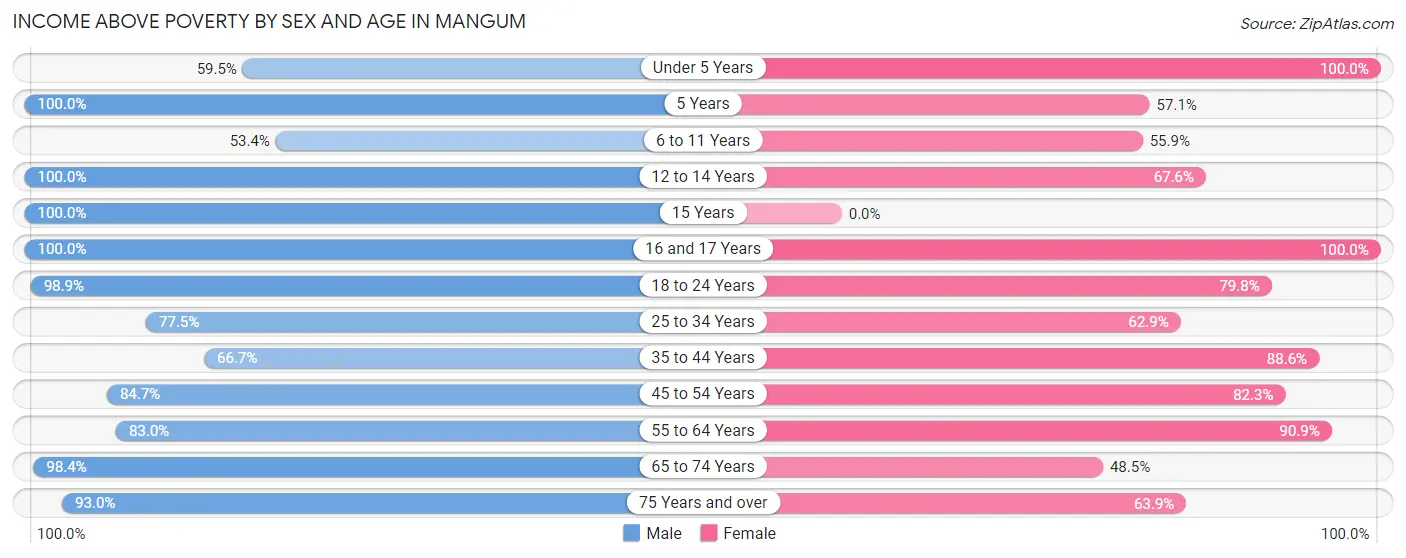
| Age Bracket | Male | Female |
| Under 5 Years | 50 (59.5%) | 125 (100.0%) |
| 5 Years | 67 (100.0%) | 12 (57.1%) |
| 6 to 11 Years | 63 (53.4%) | 62 (55.9%) |
| 12 to 14 Years | 78 (100.0%) | 25 (67.6%) |
| 15 Years | 14 (100.0%) | 0 (0.0%) |
| 16 and 17 Years | 55 (100.0%) | 20 (100.0%) |
| 18 to 24 Years | 87 (98.9%) | 130 (79.7%) |
| 25 to 34 Years | 182 (77.4%) | 105 (62.9%) |
| 35 to 44 Years | 56 (66.7%) | 116 (88.5%) |
| 45 to 54 Years | 133 (84.7%) | 93 (82.3%) |
| 55 to 64 Years | 93 (83.0%) | 190 (90.9%) |
| 65 to 74 Years | 120 (98.4%) | 64 (48.5%) |
| 75 Years and over | 40 (93.0%) | 85 (63.9%) |
| Total | 1,038 (82.6%) | 1,027 (75.4%) |
Income Below Poverty Among Married-Couple Families in Mangum
The poverty statistics for married-couple families in Mangum show that 4.6% or 22 of the total 481 families live below the poverty line. Families with no children have the highest poverty rate of 10.4%, comprising of 14 families. On the other hand, families with 1 or 2 children have the lowest poverty rate of 0.0%, which includes 0 families.
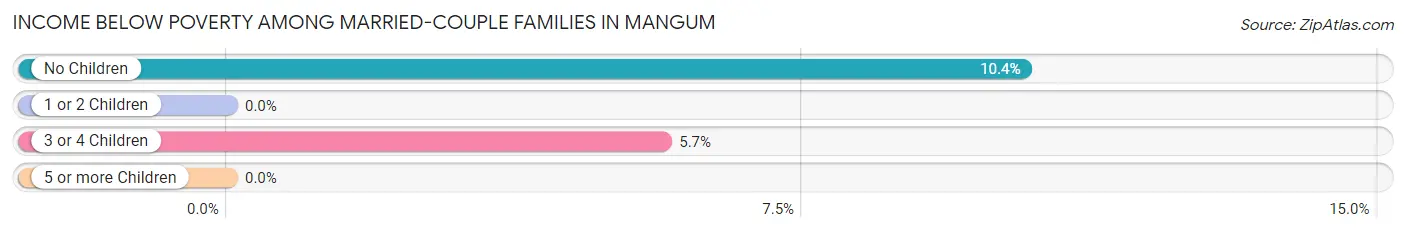
| Children | Above Poverty | Below Poverty |
| No Children | 121 (89.6%) | 14 (10.4%) |
| 1 or 2 Children | 205 (100.0%) | 0 (0.0%) |
| 3 or 4 Children | 133 (94.3%) | 8 (5.7%) |
| 5 or more Children | 0 (0.0%) | 0 (0.0%) |
| Total | 459 (95.4%) | 22 (4.6%) |
Income Below Poverty Among Single-Parent Households in Mangum
According to the poverty data in Mangum, 18.9% or 7 single-father households and 43.1% or 90 single-mother households are living below the poverty line. Among single-father households, those with 1 or 2 children have the highest poverty rate, with 7 households (43.8%) experiencing poverty. Likewise, among single-mother households, those with 3 or 4 children have the highest poverty rate, with 31 households (100.0%) falling below the poverty line.
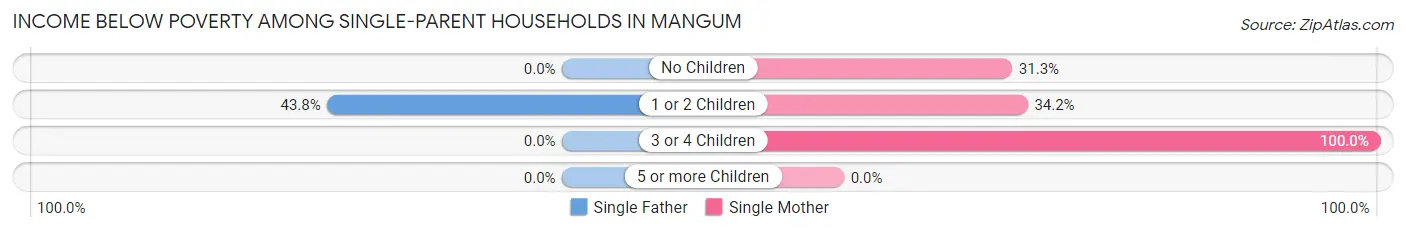
| Children | Single Father | Single Mother |
| No Children | 0 (0.0%) | 21 (31.3%) |
| 1 or 2 Children | 7 (43.8%) | 38 (34.2%) |
| 3 or 4 Children | 0 (0.0%) | 31 (100.0%) |
| 5 or more Children | 0 (0.0%) | 0 (0.0%) |
| Total | 7 (18.9%) | 90 (43.1%) |
Income Below Poverty Among Married-Couple vs Single-Parent Households in Mangum
The poverty data for Mangum shows that 22 of the married-couple family households (4.6%) and 97 of the single-parent households (39.4%) are living below the poverty level. Within the married-couple family households, those with no children have the highest poverty rate, with 14 households (10.4%) falling below the poverty line. Among the single-parent households, those with 3 or 4 children have the highest poverty rate, with 31 household (100.0%) living below poverty.
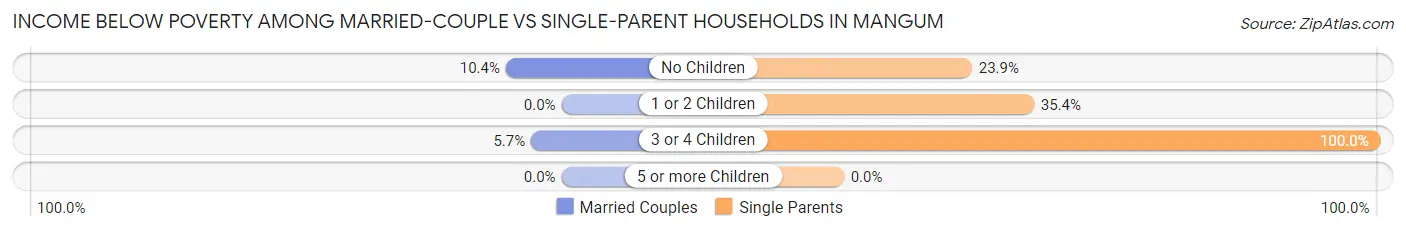
| Children | Married-Couple Families | Single-Parent Households |
| No Children | 14 (10.4%) | 21 (23.9%) |
| 1 or 2 Children | 0 (0.0%) | 45 (35.4%) |
| 3 or 4 Children | 8 (5.7%) | 31 (100.0%) |
| 5 or more Children | 0 (0.0%) | 0 (0.0%) |
| Total | 22 (4.6%) | 97 (39.4%) |
Race in Mangum
The most populous races in Mangum are White / Caucasian (2,359 | 85.0%), Hispanic or Latino (464 | 16.7%), and Two or more Races (232 | 8.4%).
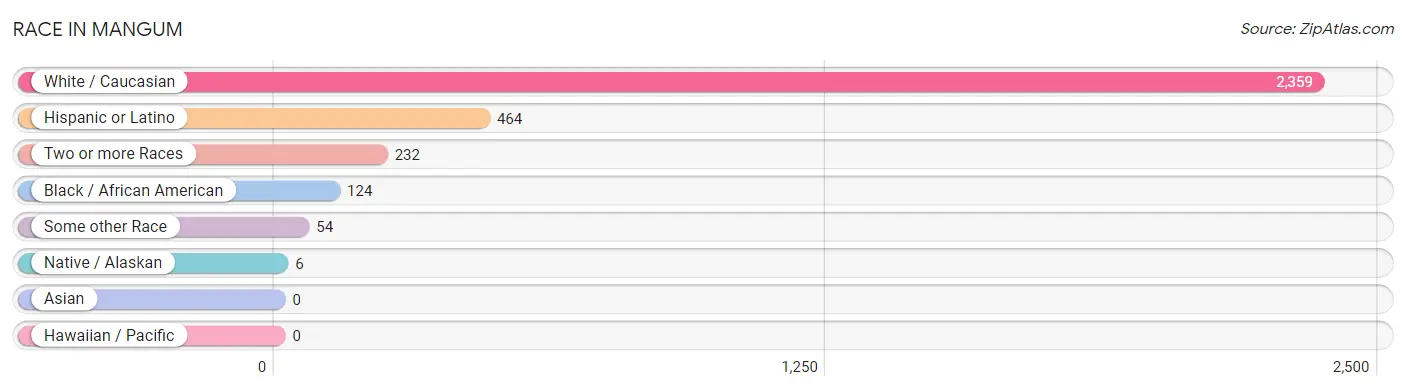
| Race | # Population | % Population |
| Asian | 0 | 0.0% |
| Black / African American | 124 | 4.5% |
| Hawaiian / Pacific | 0 | 0.0% |
| Hispanic or Latino | 464 | 16.7% |
| Native / Alaskan | 6 | 0.2% |
| White / Caucasian | 2,359 | 85.0% |
| Two or more Races | 232 | 8.4% |
| Some other Race | 54 | 1.9% |
| Total | 2,775 | 100.0% |
Ancestry in Mangum
The most populous ancestries reported in Mangum are Irish (482 | 17.4%), Mexican (446 | 16.1%), German (356 | 12.8%), American (346 | 12.5%), and Dutch (146 | 5.3%), together accounting for 64.0% of all Mangum residents.
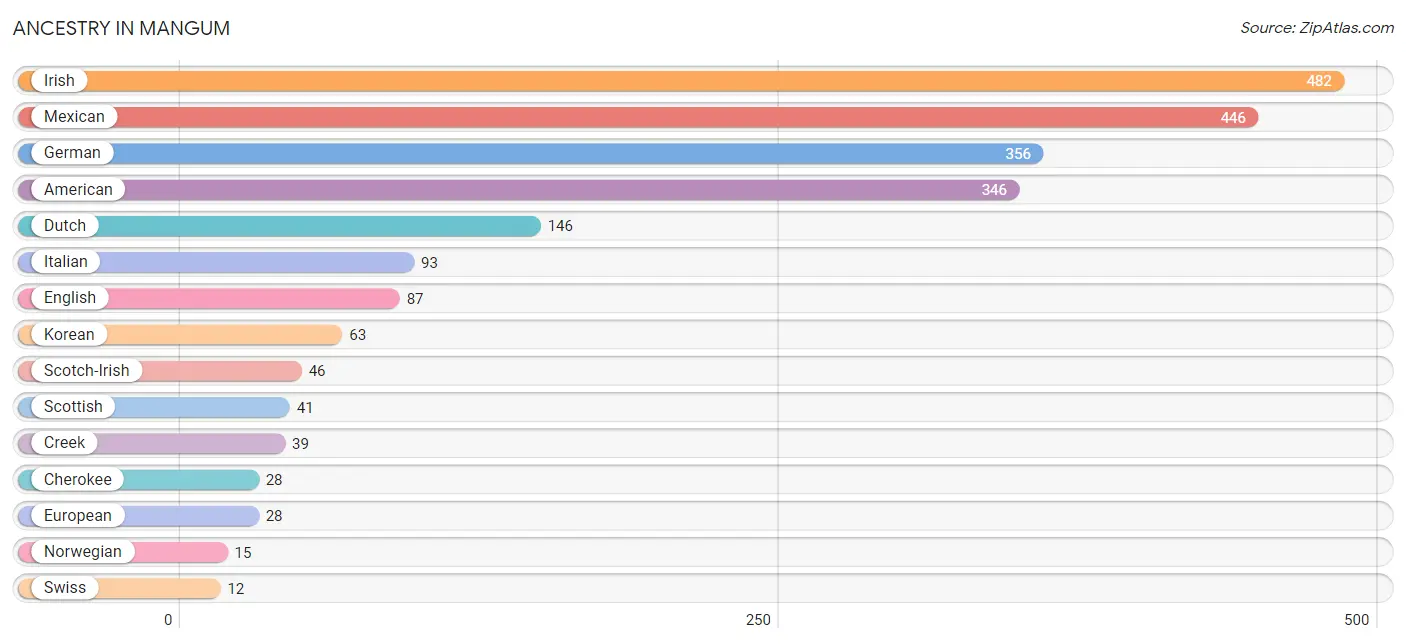
| Ancestry | # Population | % Population |
| American | 346 | 12.5% |
| Apache | 8 | 0.3% |
| Cherokee | 28 | 1.0% |
| Choctaw | 4 | 0.1% |
| Creek | 39 | 1.4% |
| Dutch | 146 | 5.3% |
| English | 87 | 3.1% |
| European | 28 | 1.0% |
| French Canadian | 5 | 0.2% |
| German | 356 | 12.8% |
| Irish | 482 | 17.4% |
| Italian | 93 | 3.4% |
| Korean | 63 | 2.3% |
| Mexican | 446 | 16.1% |
| Norwegian | 15 | 0.5% |
| Osage | 2 | 0.1% |
| Scotch-Irish | 46 | 1.7% |
| Scottish | 41 | 1.5% |
| Spaniard | 5 | 0.2% |
| Swiss | 12 | 0.4% | View All 20 Rows |
Immigrants in Mangum

| Immigration Origin | # Population | % Population | View All 0 Rows |
Sex and Age in Mangum
Sex and Age in Mangum
The most populous age groups in Mangum are 5 to 9 Years (183 | 13.6%) for men and 20 to 24 Years (161 | 11.3%) for women.
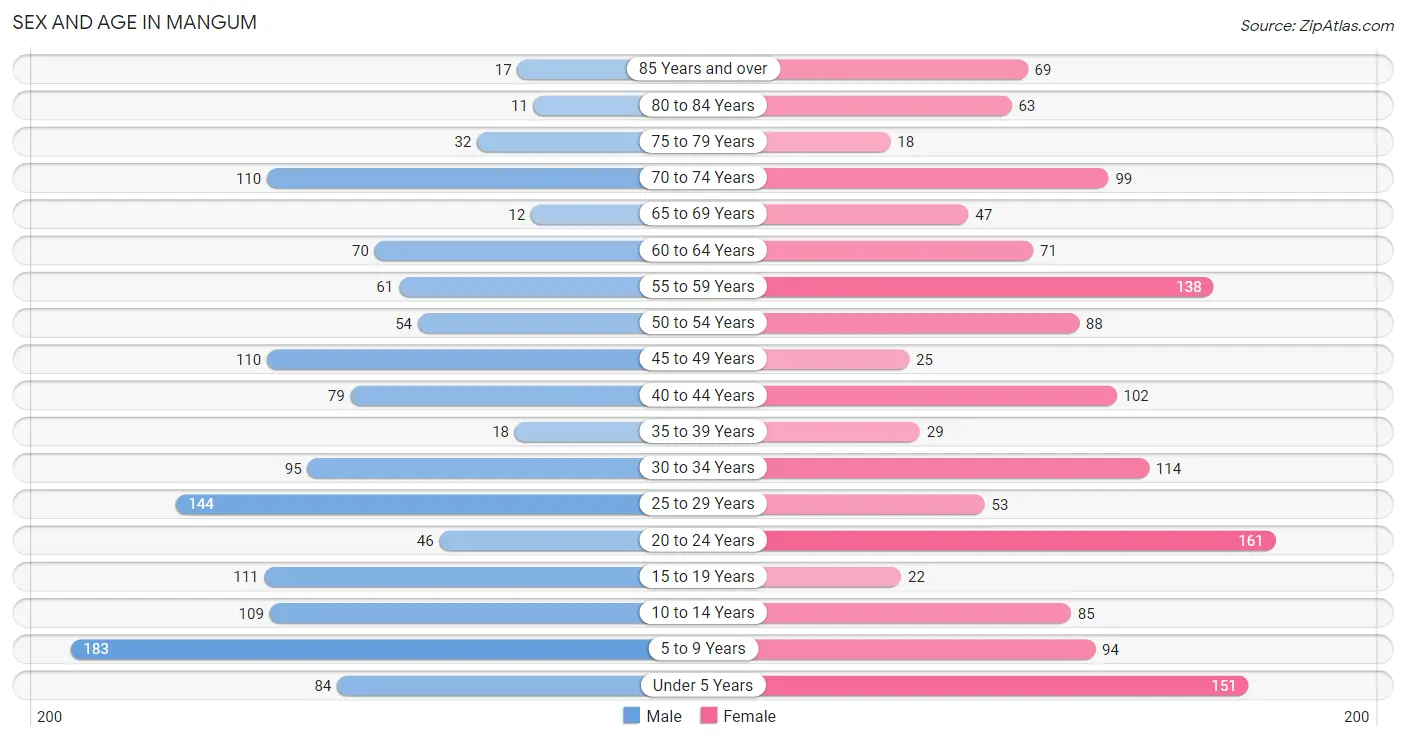
| Age Bracket | Male | Female |
| Under 5 Years | 84 (6.2%) | 151 (10.6%) |
| 5 to 9 Years | 183 (13.6%) | 94 (6.6%) |
| 10 to 14 Years | 109 (8.1%) | 85 (5.9%) |
| 15 to 19 Years | 111 (8.3%) | 22 (1.5%) |
| 20 to 24 Years | 46 (3.4%) | 161 (11.3%) |
| 25 to 29 Years | 144 (10.7%) | 53 (3.7%) |
| 30 to 34 Years | 95 (7.1%) | 114 (8.0%) |
| 35 to 39 Years | 18 (1.3%) | 29 (2.0%) |
| 40 to 44 Years | 79 (5.9%) | 102 (7.1%) |
| 45 to 49 Years | 110 (8.2%) | 25 (1.8%) |
| 50 to 54 Years | 54 (4.0%) | 88 (6.2%) |
| 55 to 59 Years | 61 (4.5%) | 138 (9.7%) |
| 60 to 64 Years | 70 (5.2%) | 71 (5.0%) |
| 65 to 69 Years | 12 (0.9%) | 47 (3.3%) |
| 70 to 74 Years | 110 (8.2%) | 99 (6.9%) |
| 75 to 79 Years | 32 (2.4%) | 18 (1.3%) |
| 80 to 84 Years | 11 (0.8%) | 63 (4.4%) |
| 85 Years and over | 17 (1.3%) | 69 (4.8%) |
| Total | 1,346 (100.0%) | 1,429 (100.0%) |
Families and Households in Mangum
Median Family Size in Mangum
The median family size in Mangum is 2.96 persons per family, with married-couple families (481 | 66.2%) accounting for the largest median family size of 3.27 persons per family. On the other hand, single female/mother families (209 | 28.7%) represent the smallest median family size with 2.22 persons per family.
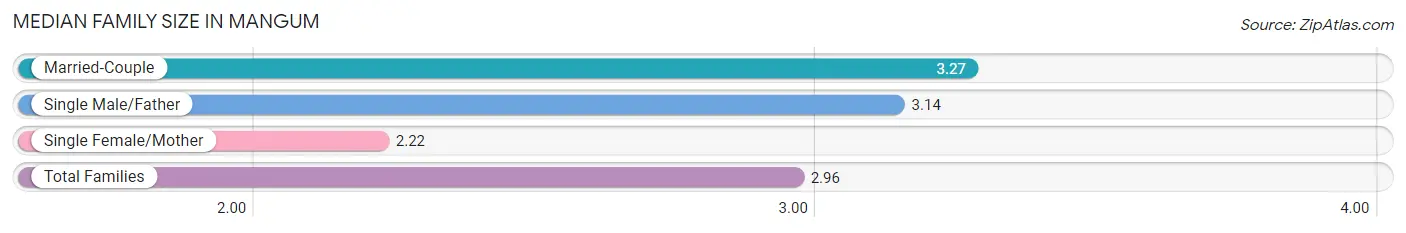
| Family Type | # Families | Family Size |
| Married-Couple | 481 (66.2%) | 3.27 |
| Single Male/Father | 37 (5.1%) | 3.14 |
| Single Female/Mother | 209 (28.7%) | 2.22 |
| Total Families | 727 (100.0%) | 2.96 |
Median Household Size in Mangum
The median household size in Mangum is 2.44 persons per household, with married-couple households (481 | 43.7%) accounting for the largest median household size of 3.41 persons per household. non-family households (373 | 33.9%) represent the smallest median household size with 1.14 persons per household.
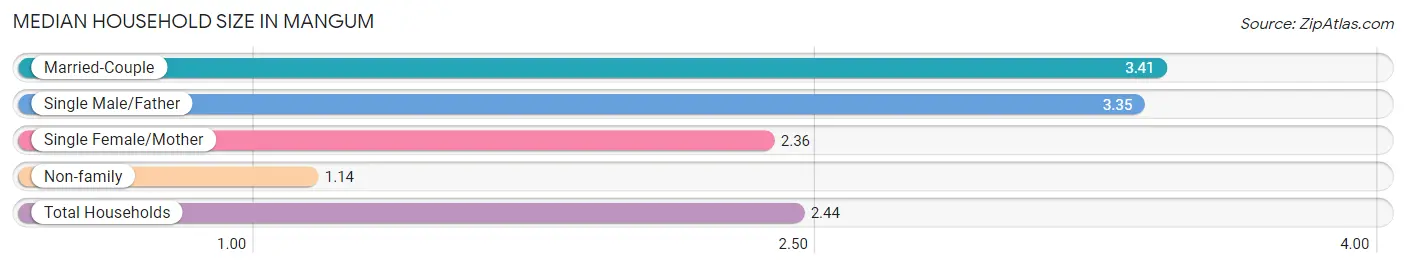
| Household Type | # Households | Household Size |
| Married-Couple | 481 (43.7%) | 3.41 |
| Single Male/Father | 37 (3.4%) | 3.35 |
| Single Female/Mother | 209 (19.0%) | 2.36 |
| Non-family | 373 (33.9%) | 1.14 |
| Total Households | 1,100 (100.0%) | 2.44 |
Household Size by Marriage Status in Mangum
Out of a total of 1,100 households in Mangum, 727 (66.1%) are family households, while 373 (33.9%) are nonfamily households. The most numerous type of family households are 2-person households, comprising 240, and the most common type of nonfamily households are 1-person households, comprising 335.
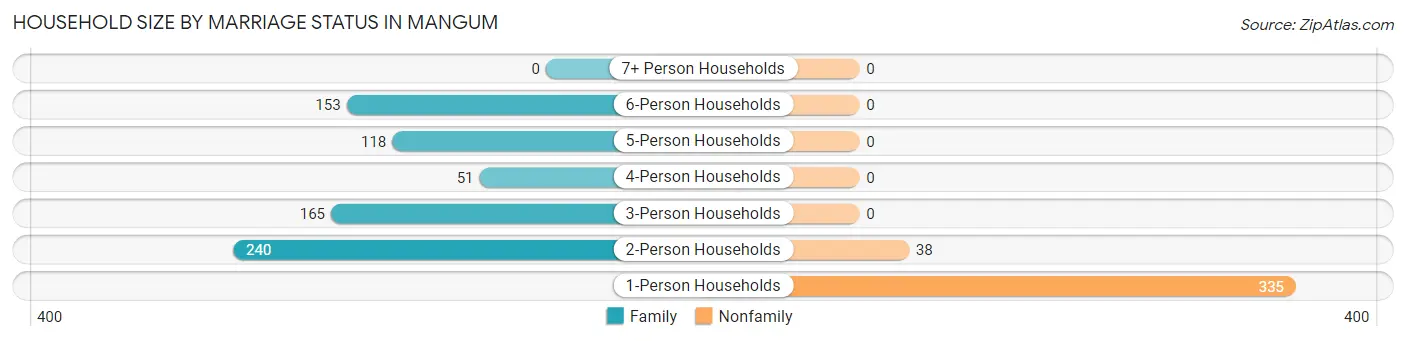
| Household Size | Family Households | Nonfamily Households |
| 1-Person Households | - | 335 (30.4%) |
| 2-Person Households | 240 (21.8%) | 38 (3.5%) |
| 3-Person Households | 165 (15.0%) | 0 (0.0%) |
| 4-Person Households | 51 (4.6%) | 0 (0.0%) |
| 5-Person Households | 118 (10.7%) | 0 (0.0%) |
| 6-Person Households | 153 (13.9%) | 0 (0.0%) |
| 7+ Person Households | 0 (0.0%) | 0 (0.0%) |
| Total | 727 (66.1%) | 373 (33.9%) |
Female Fertility in Mangum
Fertility by Age in Mangum
Average fertility rate in Mangum is 227.0 births per 1,000 women. Women in the age bracket of 20 to 34 years have the highest fertility rate with 387.0 births per 1,000 women. Women in the age bracket of 20 to 34 years acount for 100.0% of all women with births.
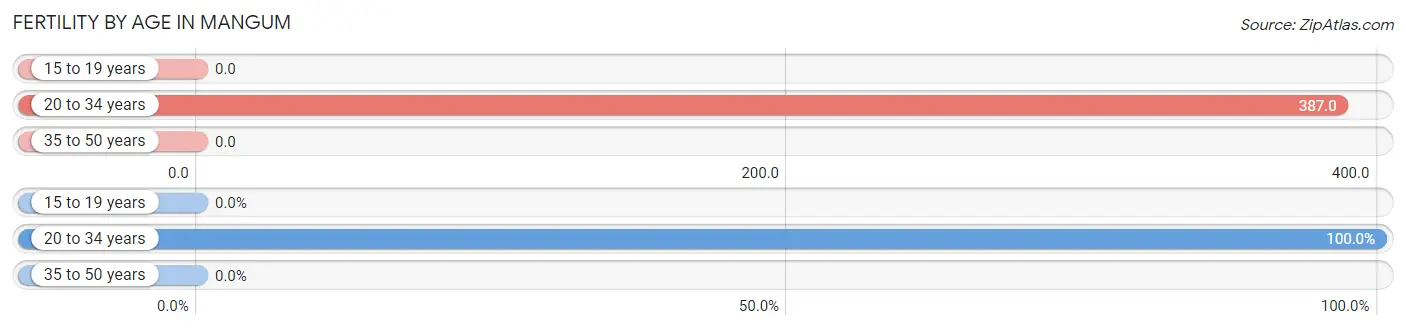
| Age Bracket | Women with Births | Births / 1,000 Women |
| 15 to 19 years | 0 (0.0%) | 0.0 |
| 20 to 34 years | 127 (100.0%) | 387.0 |
| 35 to 50 years | 0 (0.0%) | 0.0 |
| Total | 127 (100.0%) | 227.0 |
Fertility by Age by Marriage Status in Mangum
81.1% of women with births (127) in Mangum are married. The highest percentage of unmarried women with births falls into 20 to 34 years age bracket with 18.9% of them unmarried at the time of birth, while the lowest percentage of unmarried women with births belong to 20 to 34 years age bracket with 18.9% of them unmarried.
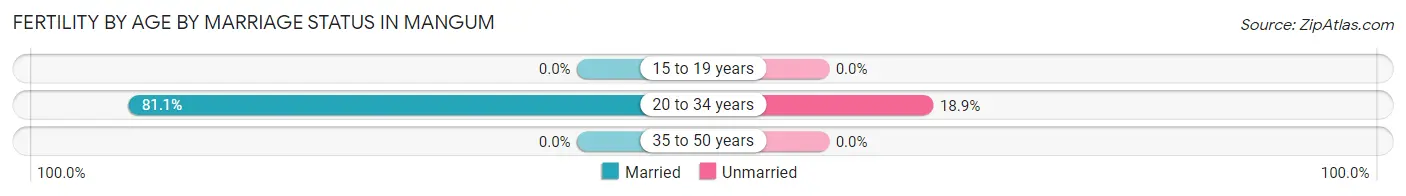
| Age Bracket | Married | Unmarried |
| 15 to 19 years | 0 (0.0%) | 0 (0.0%) |
| 20 to 34 years | 103 (81.1%) | 24 (18.9%) |
| 35 to 50 years | 0 (0.0%) | 0 (0.0%) |
| Total | 103 (81.1%) | 24 (18.9%) |
Fertility by Education in Mangum
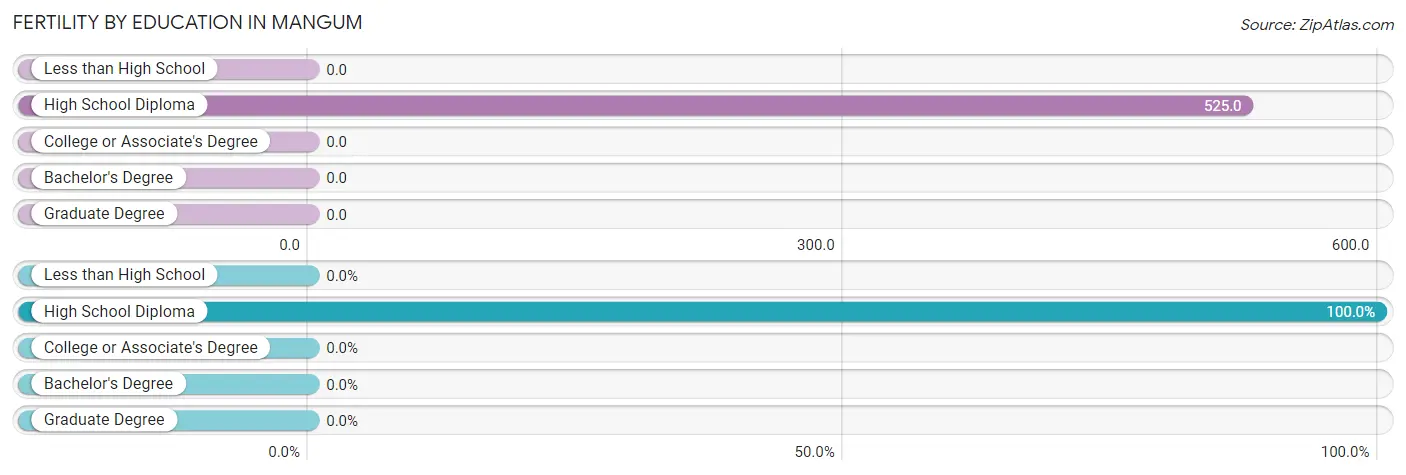
| Educational Attainment | Women with Births | Births / 1,000 Women |
| Less than High School | 0 (0.0%) | 0.0 |
| High School Diploma | 127 (100.0%) | 525.0 |
| College or Associate's Degree | 0 (0.0%) | 0.0 |
| Bachelor's Degree | 0 (0.0%) | 0.0 |
| Graduate Degree | 0 (0.0%) | 0.0 |
| Total | 127 (100.0%) | 227.0 |
Fertility by Education by Marriage Status in Mangum
18.9% of women with births in Mangum are unmarried. Women with the educational attainment of high school diploma are most likely to be married with 81.1% of them married at childbirth, while women with the educational attainment of high school diploma are least likely to be married with 18.9% of them unmarried at childbirth.
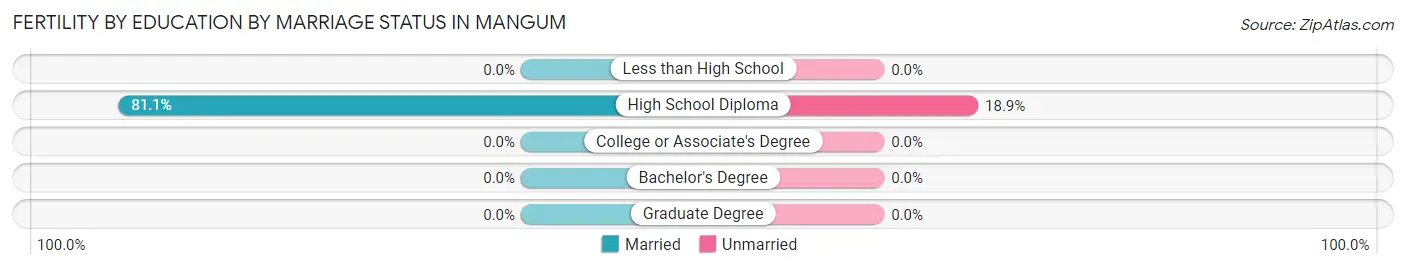
| Educational Attainment | Married | Unmarried |
| Less than High School | 0 (0.0%) | 0 (0.0%) |
| High School Diploma | 103 (81.1%) | 24 (18.9%) |
| College or Associate's Degree | 0 (0.0%) | 0 (0.0%) |
| Bachelor's Degree | 0 (0.0%) | 0 (0.0%) |
| Graduate Degree | 0 (0.0%) | 0 (0.0%) |
| Total | 103 (81.1%) | 24 (18.9%) |
Employment Characteristics in Mangum
Employment by Class of Employer in Mangum
Among the 865 employed individuals in Mangum, private company employees (519 | 60.0%), self-employed (not incorporated) (95 | 11.0%), and federal government employees (91 | 10.5%) make up the most common classes of employment.
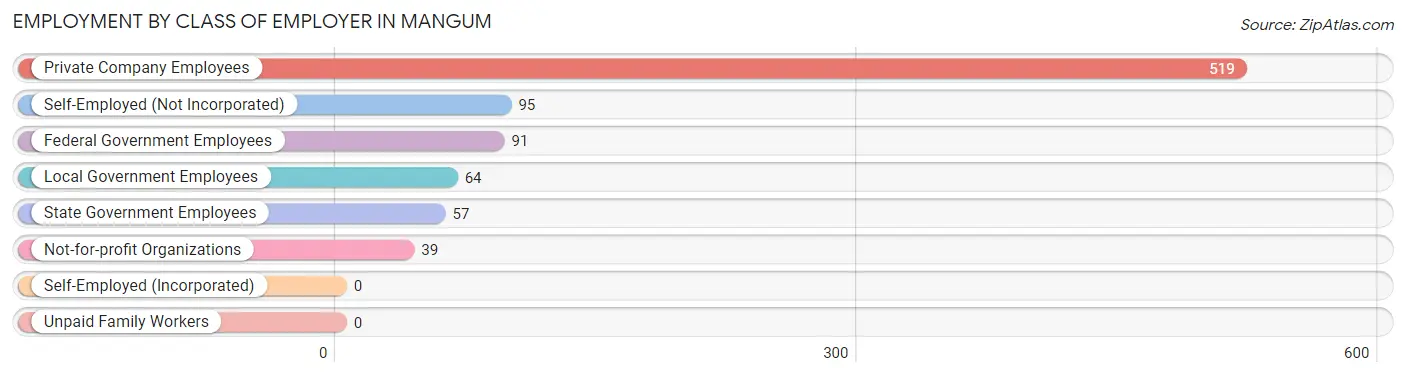
| Employer Class | # Employees | % Employees |
| Private Company Employees | 519 | 60.0% |
| Self-Employed (Incorporated) | 0 | 0.0% |
| Self-Employed (Not Incorporated) | 95 | 11.0% |
| Not-for-profit Organizations | 39 | 4.5% |
| Local Government Employees | 64 | 7.4% |
| State Government Employees | 57 | 6.6% |
| Federal Government Employees | 91 | 10.5% |
| Unpaid Family Workers | 0 | 0.0% |
| Total | 865 | 100.0% |
Employment Status by Age in Mangum
According to the labor force statistics for Mangum, out of the total population over 16 years of age (2,055), 48.2% or 991 individuals are in the labor force, with 11.1% or 110 of them unemployed. The age group with the highest labor force participation rate is 20 to 24 years, with 95.2% or 197 individuals in the labor force. Within the labor force, the 30 to 34 years age range has the highest percentage of unemployed individuals, with 31.3% or 56 of them being unemployed.
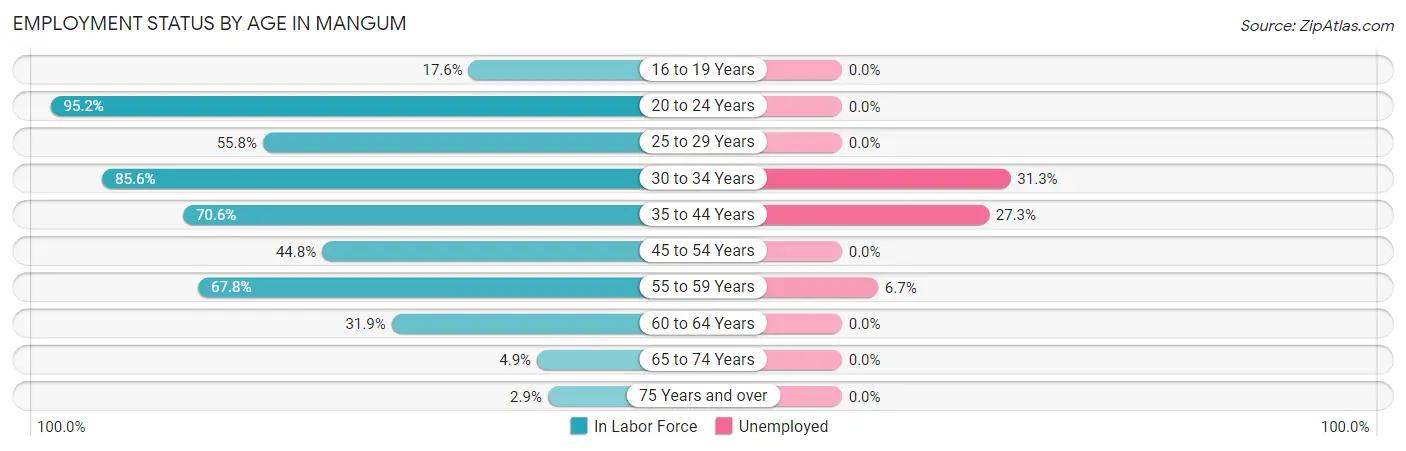
| Age Bracket | In Labor Force | Unemployed |
| 16 to 19 Years | 21 (17.6%) | 0 (0.0%) |
| 20 to 24 Years | 197 (95.2%) | 0 (0.0%) |
| 25 to 29 Years | 110 (55.8%) | 0 (0.0%) |
| 30 to 34 Years | 179 (85.6%) | 56 (31.3%) |
| 35 to 44 Years | 161 (70.6%) | 44 (27.3%) |
| 45 to 54 Years | 124 (44.8%) | 0 (0.0%) |
| 55 to 59 Years | 135 (67.8%) | 9 (6.7%) |
| 60 to 64 Years | 45 (31.9%) | 0 (0.0%) |
| 65 to 74 Years | 13 (4.9%) | 0 (0.0%) |
| 75 Years and over | 6 (2.9%) | 0 (0.0%) |
| Total | 991 (48.2%) | 110 (11.1%) |
Employment Status by Educational Attainment in Mangum
According to labor force statistics for Mangum, 60.3% of individuals (754) out of the total population between 25 and 64 years of age (1,251) are in the labor force, with 14.6% or 110 of them being unemployed. The group with the highest labor force participation rate are those with the educational attainment of high school diploma, with 68.1% or 331 individuals in the labor force. Within the labor force, individuals with college / associate degree education have the highest percentage of unemployment, with 20.9% or 54 of them being unemployed.
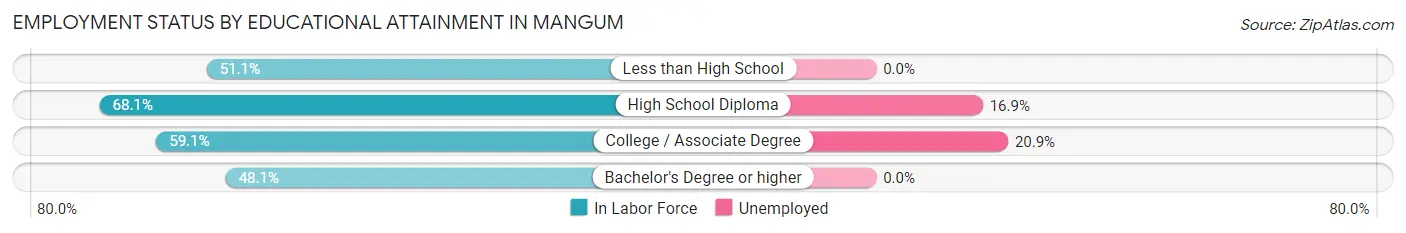
| Educational Attainment | In Labor Force | Unemployed |
| Less than High School | 113 (51.1%) | 0 (0.0%) |
| High School Diploma | 331 (68.1%) | 82 (16.9%) |
| College / Associate Degree | 259 (59.1%) | 92 (20.9%) |
| Bachelor's Degree or higher | 51 (48.1%) | 0 (0.0%) |
| Total | 754 (60.3%) | 183 (14.6%) |
Employment Occupations by Sex in Mangum
Management, Business, Science and Arts Occupations
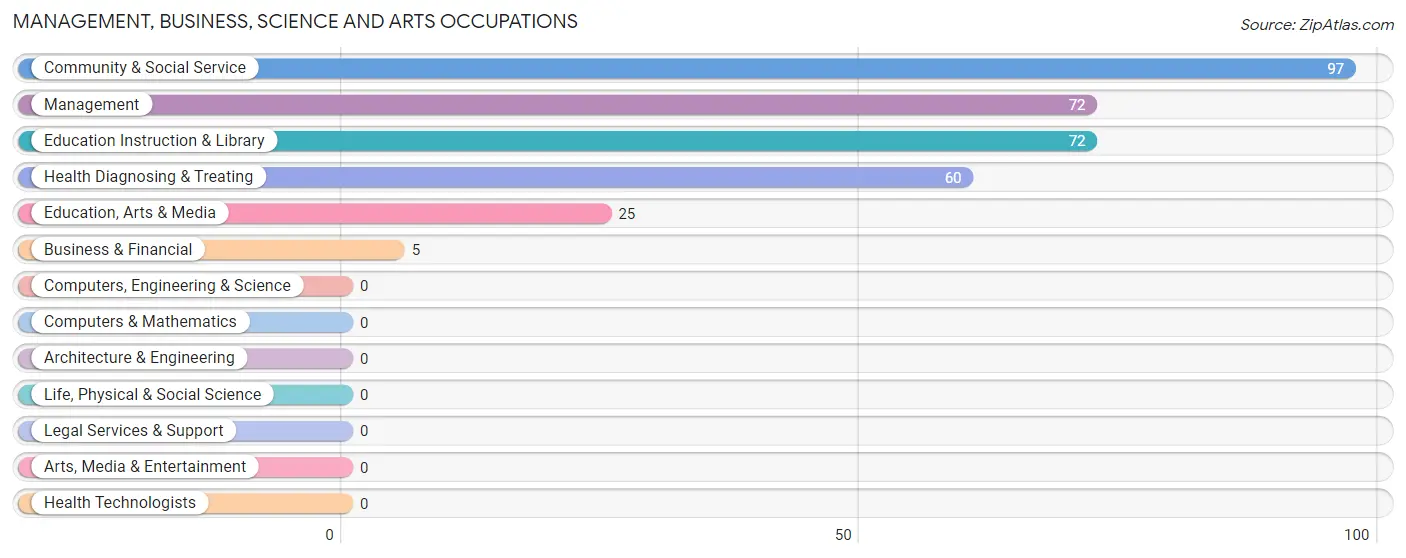
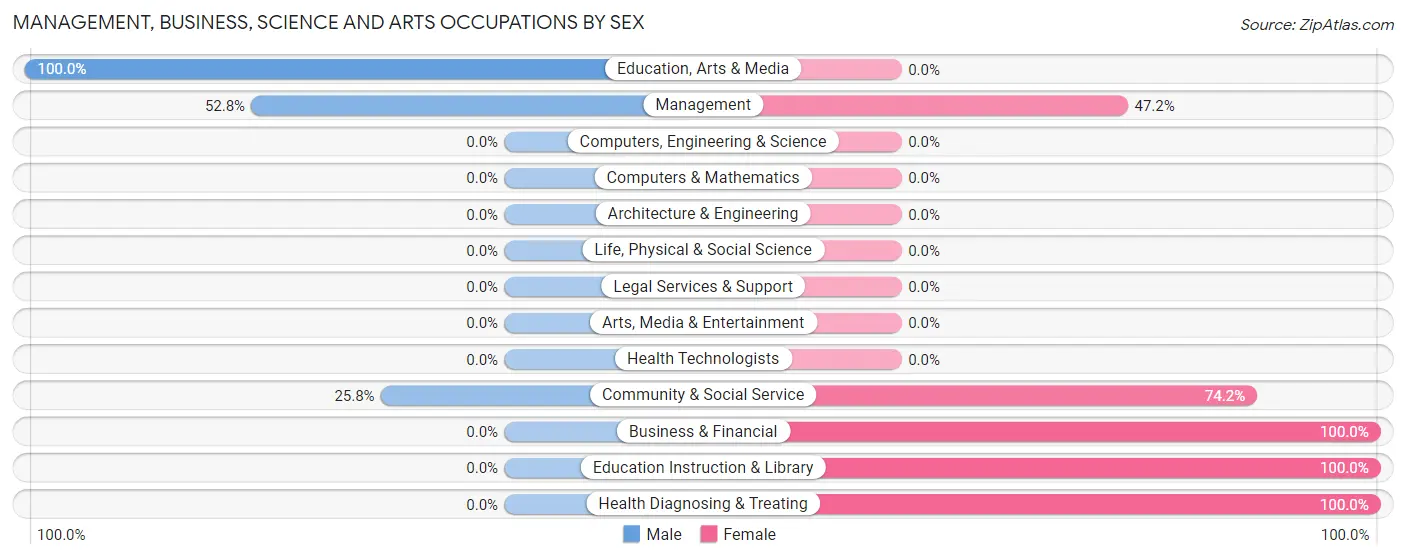
The most common Management, Business, Science and Arts occupations in Mangum are Community & Social Service (97 | 11.1%), Management (72 | 8.2%), Education Instruction & Library (72 | 8.2%), Health Diagnosing & Treating (60 | 6.8%), and Education, Arts & Media (25 | 2.9%).
Management, Business, Science and Arts Occupations by Sex
Within the Management, Business, Science and Arts occupations in Mangum, the most male-oriented occupations are Education, Arts & Media (100.0%), Management (52.8%), and Community & Social Service (25.8%), while the most female-oriented occupations are Business & Financial (100.0%), Education Instruction & Library (100.0%), and Health Diagnosing & Treating (100.0%).
| Occupation | Male | Female |
| Management | 38 (52.8%) | 34 (47.2%) |
| Business & Financial | 0 (0.0%) | 5 (100.0%) |
| Computers, Engineering & Science | 0 (0.0%) | 0 (0.0%) |
| Computers & Mathematics | 0 (0.0%) | 0 (0.0%) |
| Architecture & Engineering | 0 (0.0%) | 0 (0.0%) |
| Life, Physical & Social Science | 0 (0.0%) | 0 (0.0%) |
| Community & Social Service | 25 (25.8%) | 72 (74.2%) |
| Education, Arts & Media | 25 (100.0%) | 0 (0.0%) |
| Legal Services & Support | 0 (0.0%) | 0 (0.0%) |
| Education Instruction & Library | 0 (0.0%) | 72 (100.0%) |
| Arts, Media & Entertainment | 0 (0.0%) | 0 (0.0%) |
| Health Diagnosing & Treating | 0 (0.0%) | 60 (100.0%) |
| Health Technologists | 0 (0.0%) | 0 (0.0%) |
| Total (Category) | 63 (26.9%) | 171 (73.1%) |
| Total (Overall) | 359 (40.9%) | 518 (59.1%) |
Services Occupations
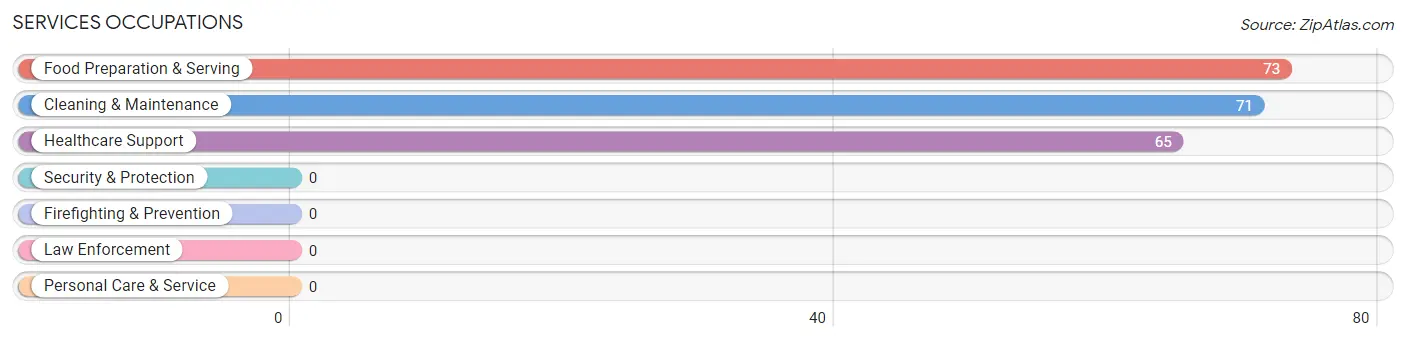
The most common Services occupations in Mangum are Food Preparation & Serving (73 | 8.3%), Cleaning & Maintenance (71 | 8.1%), and Healthcare Support (65 | 7.4%).
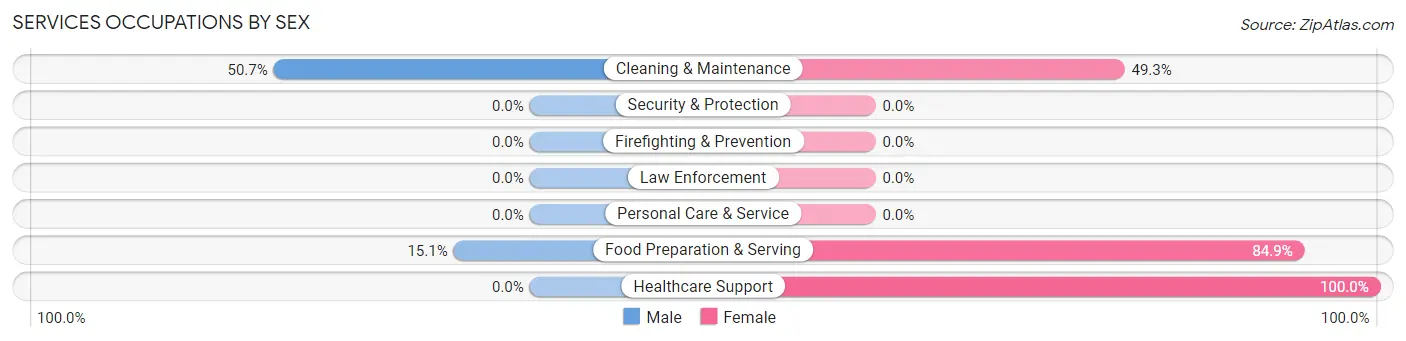
Services Occupations by Sex
Within the Services occupations in Mangum, the most male-oriented occupations are Cleaning & Maintenance (50.7%), and Food Preparation & Serving (15.1%), while the most female-oriented occupations are Healthcare Support (100.0%), Food Preparation & Serving (84.9%), and Cleaning & Maintenance (49.3%).
| Occupation | Male | Female |
| Healthcare Support | 0 (0.0%) | 65 (100.0%) |
| Security & Protection | 0 (0.0%) | 0 (0.0%) |
| Firefighting & Prevention | 0 (0.0%) | 0 (0.0%) |
| Law Enforcement | 0 (0.0%) | 0 (0.0%) |
| Food Preparation & Serving | 11 (15.1%) | 62 (84.9%) |
| Cleaning & Maintenance | 36 (50.7%) | 35 (49.3%) |
| Personal Care & Service | 0 (0.0%) | 0 (0.0%) |
| Total (Category) | 47 (22.5%) | 162 (77.5%) |
| Total (Overall) | 359 (40.9%) | 518 (59.1%) |
Sales and Office Occupations
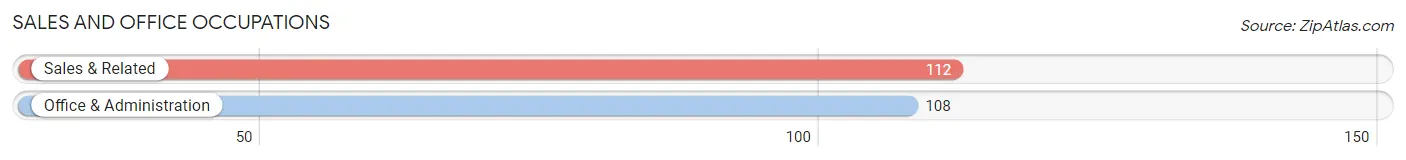
The most common Sales and Office occupations in Mangum are Sales & Related (112 | 12.8%), and Office & Administration (108 | 12.3%).
Sales and Office Occupations by Sex

| Occupation | Male | Female |
| Sales & Related | 54 (48.2%) | 58 (51.8%) |
| Office & Administration | 17 (15.7%) | 91 (84.3%) |
| Total (Category) | 71 (32.3%) | 149 (67.7%) |
| Total (Overall) | 359 (40.9%) | 518 (59.1%) |
Natural Resources, Construction and Maintenance Occupations
The most common Natural Resources, Construction and Maintenance occupations in Mangum are Construction & Extraction (47 | 5.4%), Installation, Maintenance & Repair (40 | 4.6%), and Farming, Fishing & Forestry (9 | 1.0%).
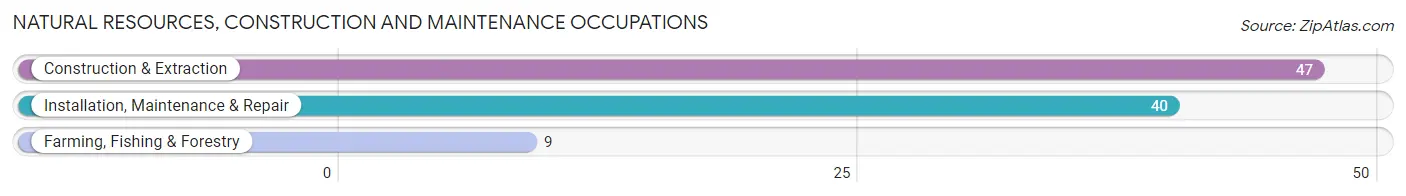
Natural Resources, Construction and Maintenance Occupations by Sex
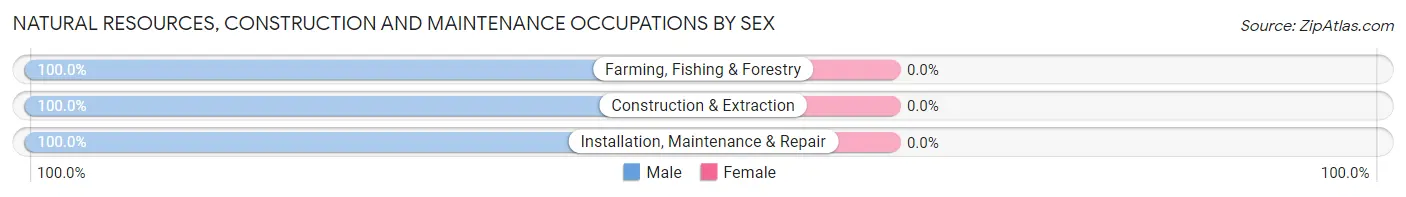
| Occupation | Male | Female |
| Farming, Fishing & Forestry | 9 (100.0%) | 0 (0.0%) |
| Construction & Extraction | 47 (100.0%) | 0 (0.0%) |
| Installation, Maintenance & Repair | 40 (100.0%) | 0 (0.0%) |
| Total (Category) | 96 (100.0%) | 0 (0.0%) |
| Total (Overall) | 359 (40.9%) | 518 (59.1%) |
Production, Transportation and Moving Occupations
The most common Production, Transportation and Moving occupations in Mangum are Transportation (58 | 6.6%), Production (36 | 4.1%), and Material Moving (24 | 2.7%).
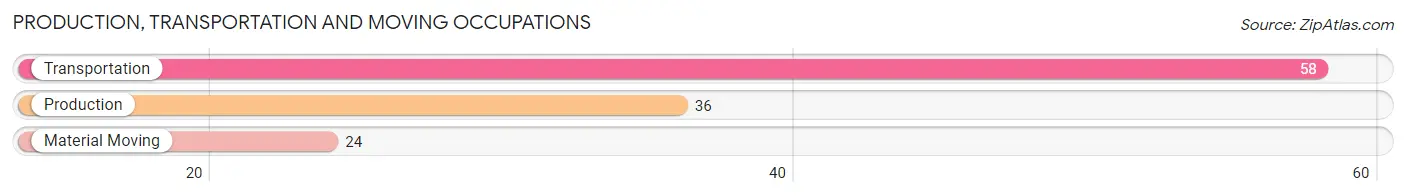
Production, Transportation and Moving Occupations by Sex
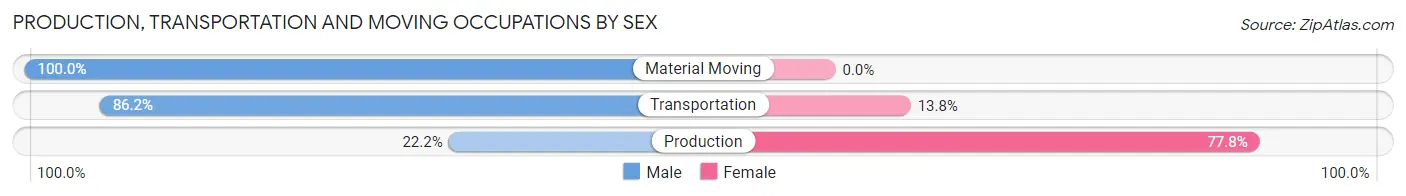
| Occupation | Male | Female |
| Production | 8 (22.2%) | 28 (77.8%) |
| Transportation | 50 (86.2%) | 8 (13.8%) |
| Material Moving | 24 (100.0%) | 0 (0.0%) |
| Total (Category) | 82 (69.5%) | 36 (30.5%) |
| Total (Overall) | 359 (40.9%) | 518 (59.1%) |
Employment Industries by Sex in Mangum
Employment Industries in Mangum
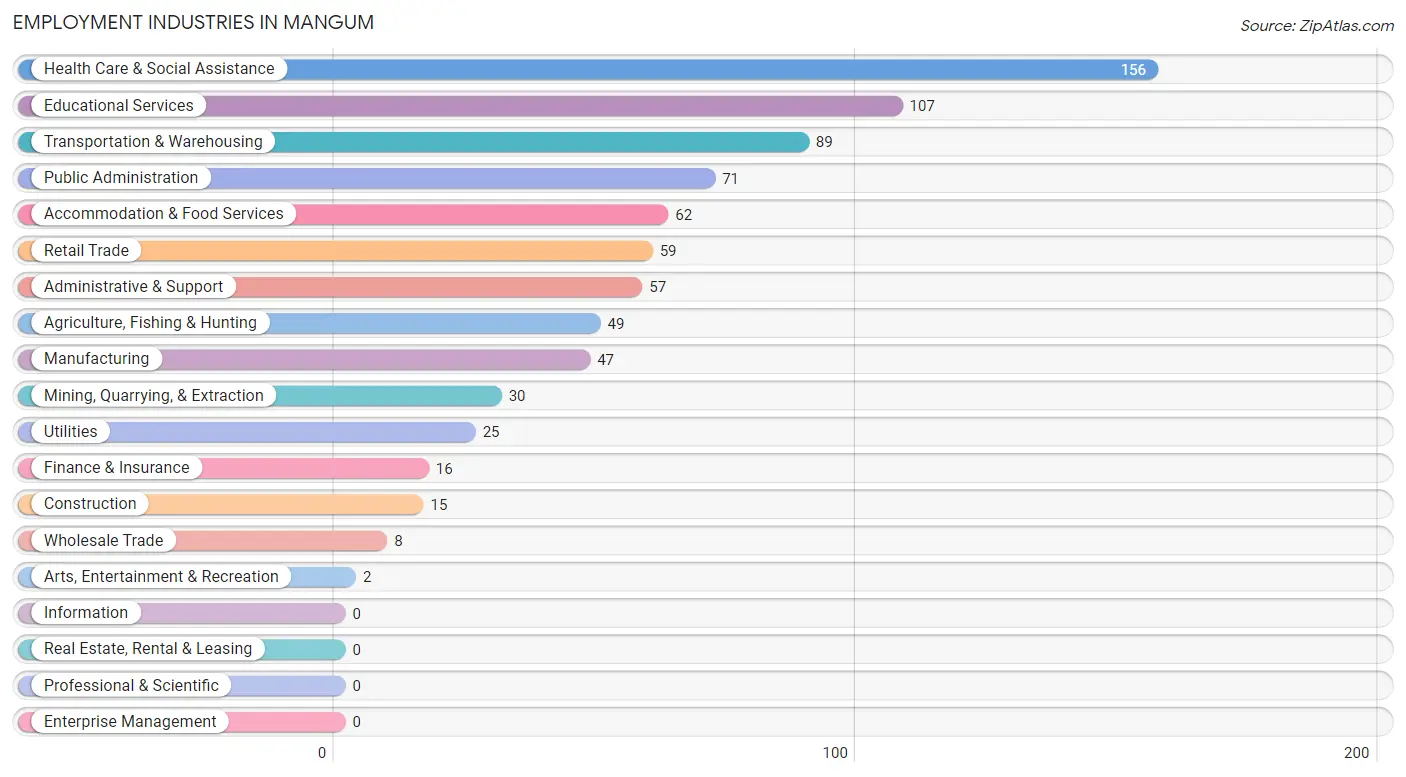
The major employment industries in Mangum include Health Care & Social Assistance (156 | 17.8%), Educational Services (107 | 12.2%), Transportation & Warehousing (89 | 10.2%), Public Administration (71 | 8.1%), and Accommodation & Food Services (62 | 7.1%).
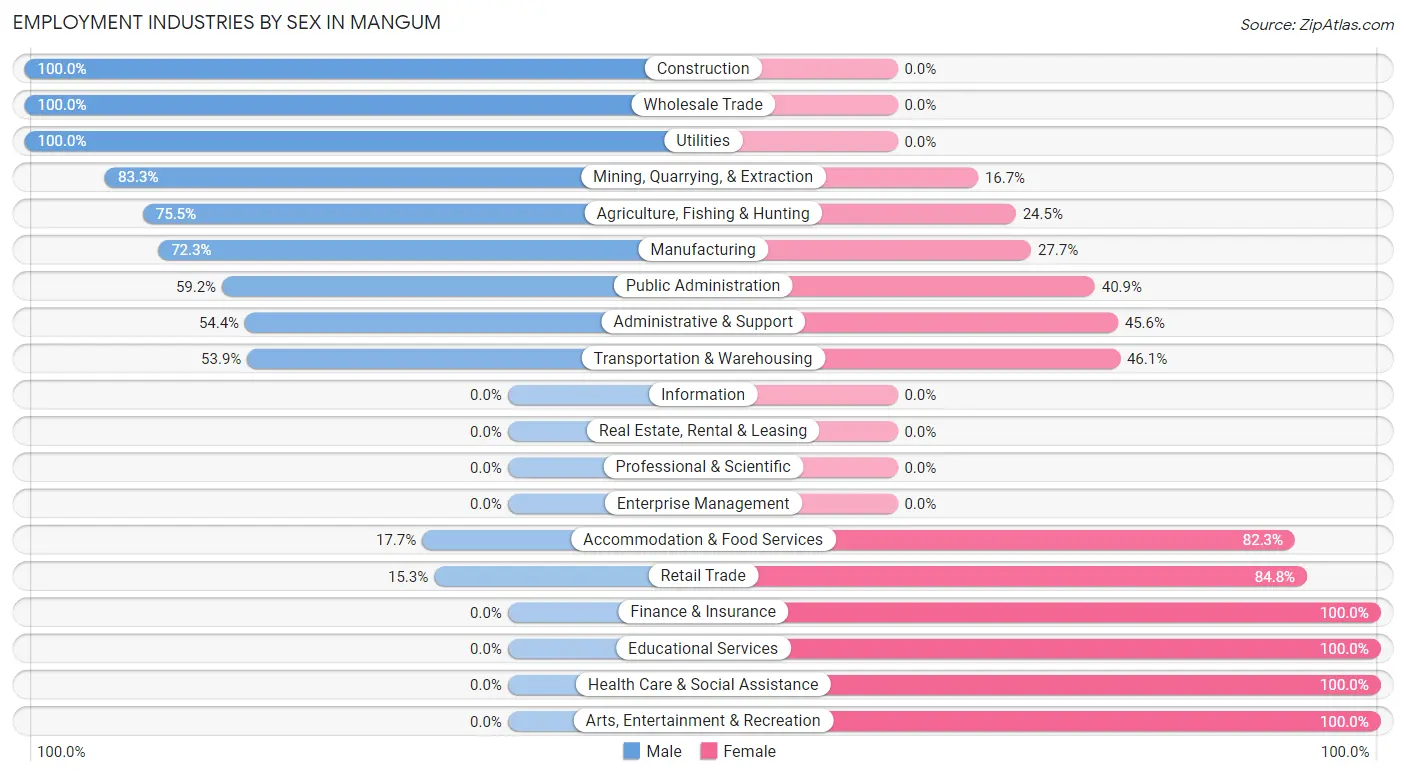
Employment Industries by Sex in Mangum
The Mangum industries that see more men than women are Construction (100.0%), Wholesale Trade (100.0%), and Utilities (100.0%), whereas the industries that tend to have a higher number of women are Finance & Insurance (100.0%), Educational Services (100.0%), and Health Care & Social Assistance (100.0%).
| Industry | Male | Female |
| Agriculture, Fishing & Hunting | 37 (75.5%) | 12 (24.5%) |
| Mining, Quarrying, & Extraction | 25 (83.3%) | 5 (16.7%) |
| Construction | 15 (100.0%) | 0 (0.0%) |
| Manufacturing | 34 (72.3%) | 13 (27.7%) |
| Wholesale Trade | 8 (100.0%) | 0 (0.0%) |
| Retail Trade | 9 (15.2%) | 50 (84.8%) |
| Transportation & Warehousing | 48 (53.9%) | 41 (46.1%) |
| Utilities | 25 (100.0%) | 0 (0.0%) |
| Information | 0 (0.0%) | 0 (0.0%) |
| Finance & Insurance | 0 (0.0%) | 16 (100.0%) |
| Real Estate, Rental & Leasing | 0 (0.0%) | 0 (0.0%) |
| Professional & Scientific | 0 (0.0%) | 0 (0.0%) |
| Enterprise Management | 0 (0.0%) | 0 (0.0%) |
| Administrative & Support | 31 (54.4%) | 26 (45.6%) |
| Educational Services | 0 (0.0%) | 107 (100.0%) |
| Health Care & Social Assistance | 0 (0.0%) | 156 (100.0%) |
| Arts, Entertainment & Recreation | 0 (0.0%) | 2 (100.0%) |
| Accommodation & Food Services | 11 (17.7%) | 51 (82.3%) |
| Public Administration | 42 (59.2%) | 29 (40.8%) |
| Total | 359 (40.9%) | 518 (59.1%) |
Education in Mangum
School Enrollment in Mangum
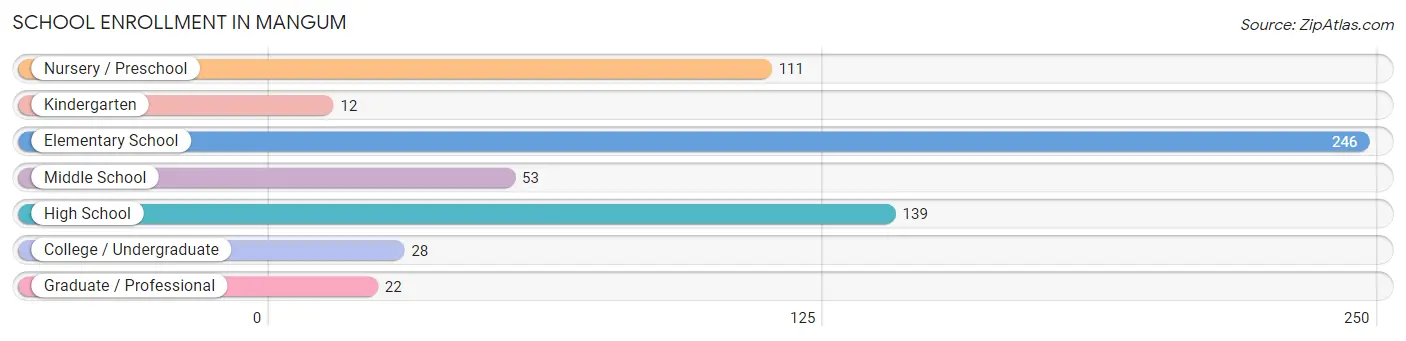
The most common levels of schooling among the 611 students in Mangum are elementary school (246 | 40.3%), high school (139 | 22.8%), and nursery / preschool (111 | 18.2%).
| School Level | # Students | % Students |
| Nursery / Preschool | 111 | 18.2% |
| Kindergarten | 12 | 2.0% |
| Elementary School | 246 | 40.3% |
| Middle School | 53 | 8.7% |
| High School | 139 | 22.8% |
| College / Undergraduate | 28 | 4.6% |
| Graduate / Professional | 22 | 3.6% |
| Total | 611 | 100.0% |
School Enrollment by Age by Funding Source in Mangum
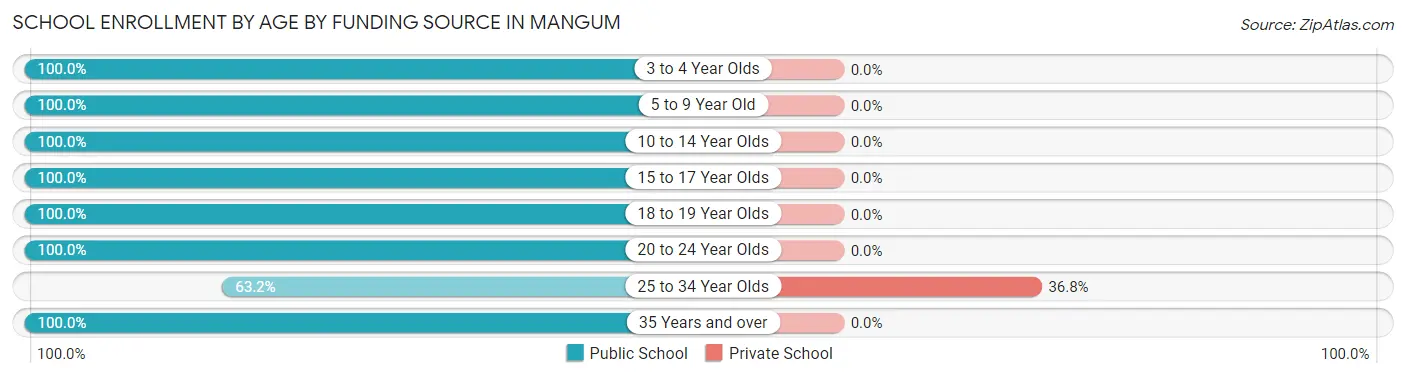
Out of a total of 611 students who are enrolled in schools in Mangum, 7 (1.1%) attend a private institution, while the remaining 604 (98.9%) are enrolled in public schools. The age group of 25 to 34 year olds has the highest likelihood of being enrolled in private schools, with 7 (36.8% in the age bracket) enrolled. Conversely, the age group of 3 to 4 year olds has the lowest likelihood of being enrolled in a private school, with 35 (100.0% in the age bracket) attending a public institution.
| Age Bracket | Public School | Private School |
| 3 to 4 Year Olds | 35 (100.0%) | 0 (0.0%) |
| 5 to 9 Year Old | 277 (100.0%) | 0 (0.0%) |
| 10 to 14 Year Olds | 142 (100.0%) | 0 (0.0%) |
| 15 to 17 Year Olds | 65 (100.0%) | 0 (0.0%) |
| 18 to 19 Year Olds | 42 (100.0%) | 0 (0.0%) |
| 20 to 24 Year Olds | 16 (100.0%) | 0 (0.0%) |
| 25 to 34 Year Olds | 12 (63.2%) | 7 (36.8%) |
| 35 Years and over | 15 (100.0%) | 0 (0.0%) |
| Total | 604 (98.9%) | 7 (1.1%) |
Educational Attainment by Field of Study in Mangum
Education (60 | 41.7%), arts & humanities (34 | 23.6%), psychology (28 | 19.4%), engineering (15 | 10.4%), and computers & mathematics (7 | 4.9%) are the most common fields of study among 144 individuals in Mangum who have obtained a bachelor's degree or higher.
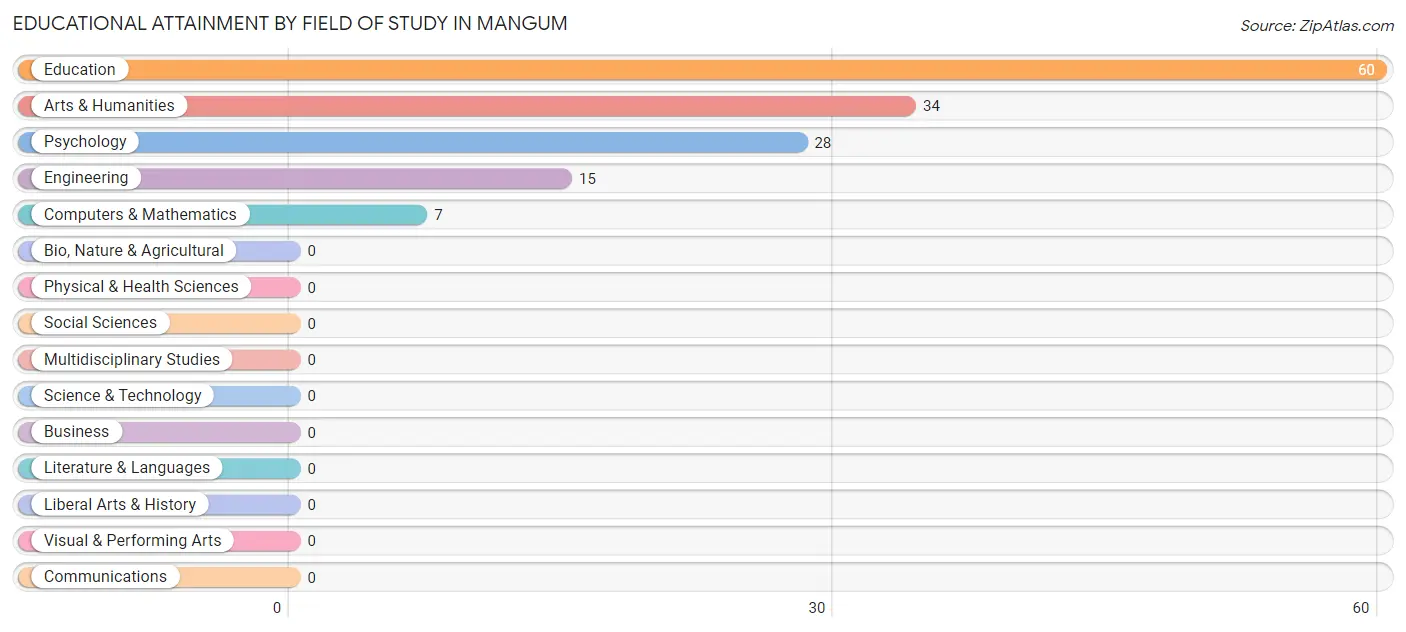
| Field of Study | # Graduates | % Graduates |
| Computers & Mathematics | 7 | 4.9% |
| Bio, Nature & Agricultural | 0 | 0.0% |
| Physical & Health Sciences | 0 | 0.0% |
| Psychology | 28 | 19.4% |
| Social Sciences | 0 | 0.0% |
| Engineering | 15 | 10.4% |
| Multidisciplinary Studies | 0 | 0.0% |
| Science & Technology | 0 | 0.0% |
| Business | 0 | 0.0% |
| Education | 60 | 41.7% |
| Literature & Languages | 0 | 0.0% |
| Liberal Arts & History | 0 | 0.0% |
| Visual & Performing Arts | 0 | 0.0% |
| Communications | 0 | 0.0% |
| Arts & Humanities | 34 | 23.6% |
| Total | 144 | 100.0% |
Transportation & Commute in Mangum
Vehicle Availability by Sex in Mangum
The most prevalent vehicle ownership categories in Mangum are males with 2 vehicles (166, accounting for 45.6%) and females with 2 vehicles (190, making up 33.1%).
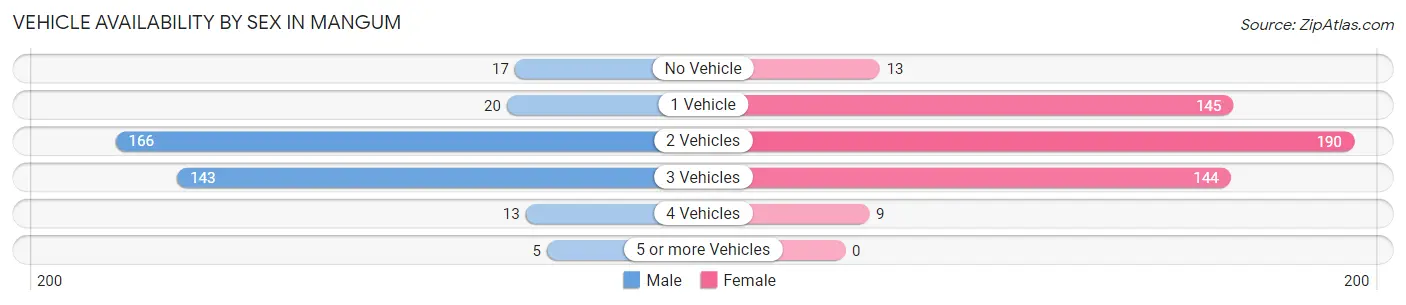
| Vehicles Available | Male | Female |
| No Vehicle | 17 (4.7%) | 13 (2.6%) |
| 1 Vehicle | 20 (5.5%) | 145 (28.9%) |
| 2 Vehicles | 166 (45.6%) | 190 (37.9%) |
| 3 Vehicles | 143 (39.3%) | 144 (28.7%) |
| 4 Vehicles | 13 (3.6%) | 9 (1.8%) |
| 5 or more Vehicles | 5 (1.4%) | 0 (0.0%) |
| Total | 364 (100.0%) | 501 (100.0%) |
Commute Time in Mangum
The most frequently occuring commute durations in Mangum are 5 to 9 minutes (236 commuters, 28.7%), 30 to 34 minutes (117 commuters, 14.2%), and 15 to 19 minutes (106 commuters, 12.9%).
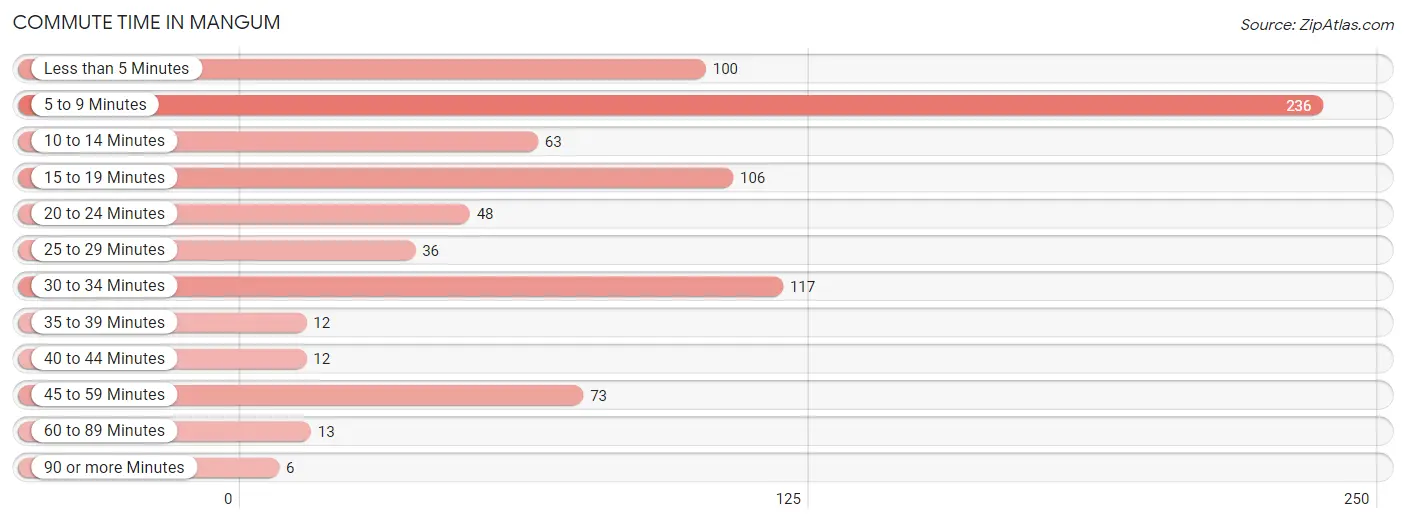
| Commute Time | # Commuters | % Commuters |
| Less than 5 Minutes | 100 | 12.2% |
| 5 to 9 Minutes | 236 | 28.7% |
| 10 to 14 Minutes | 63 | 7.7% |
| 15 to 19 Minutes | 106 | 12.9% |
| 20 to 24 Minutes | 48 | 5.8% |
| 25 to 29 Minutes | 36 | 4.4% |
| 30 to 34 Minutes | 117 | 14.2% |
| 35 to 39 Minutes | 12 | 1.5% |
| 40 to 44 Minutes | 12 | 1.5% |
| 45 to 59 Minutes | 73 | 8.9% |
| 60 to 89 Minutes | 13 | 1.6% |
| 90 or more Minutes | 6 | 0.7% |
Commute Time by Sex in Mangum
The most common commute times in Mangum are 15 to 19 minutes (67 commuters, 20.5%) for males and 5 to 9 minutes (182 commuters, 36.7%) for females.
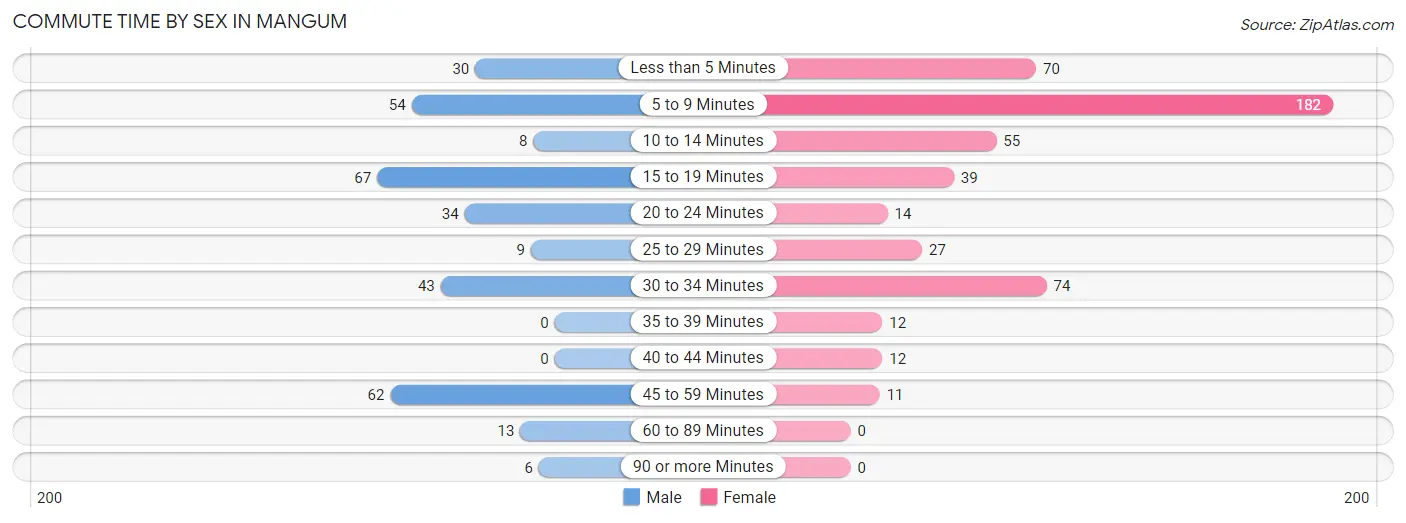
| Commute Time | Male | Female |
| Less than 5 Minutes | 30 (9.2%) | 70 (14.1%) |
| 5 to 9 Minutes | 54 (16.6%) | 182 (36.7%) |
| 10 to 14 Minutes | 8 (2.5%) | 55 (11.1%) |
| 15 to 19 Minutes | 67 (20.5%) | 39 (7.9%) |
| 20 to 24 Minutes | 34 (10.4%) | 14 (2.8%) |
| 25 to 29 Minutes | 9 (2.8%) | 27 (5.4%) |
| 30 to 34 Minutes | 43 (13.2%) | 74 (14.9%) |
| 35 to 39 Minutes | 0 (0.0%) | 12 (2.4%) |
| 40 to 44 Minutes | 0 (0.0%) | 12 (2.4%) |
| 45 to 59 Minutes | 62 (19.0%) | 11 (2.2%) |
| 60 to 89 Minutes | 13 (4.0%) | 0 (0.0%) |
| 90 or more Minutes | 6 (1.8%) | 0 (0.0%) |
Time of Departure to Work by Sex in Mangum
The most frequent times of departure to work in Mangum are 7:30 AM to 7:59 AM (88, 27.0%) for males and 7:00 AM to 7:29 AM (195, 39.3%) for females.
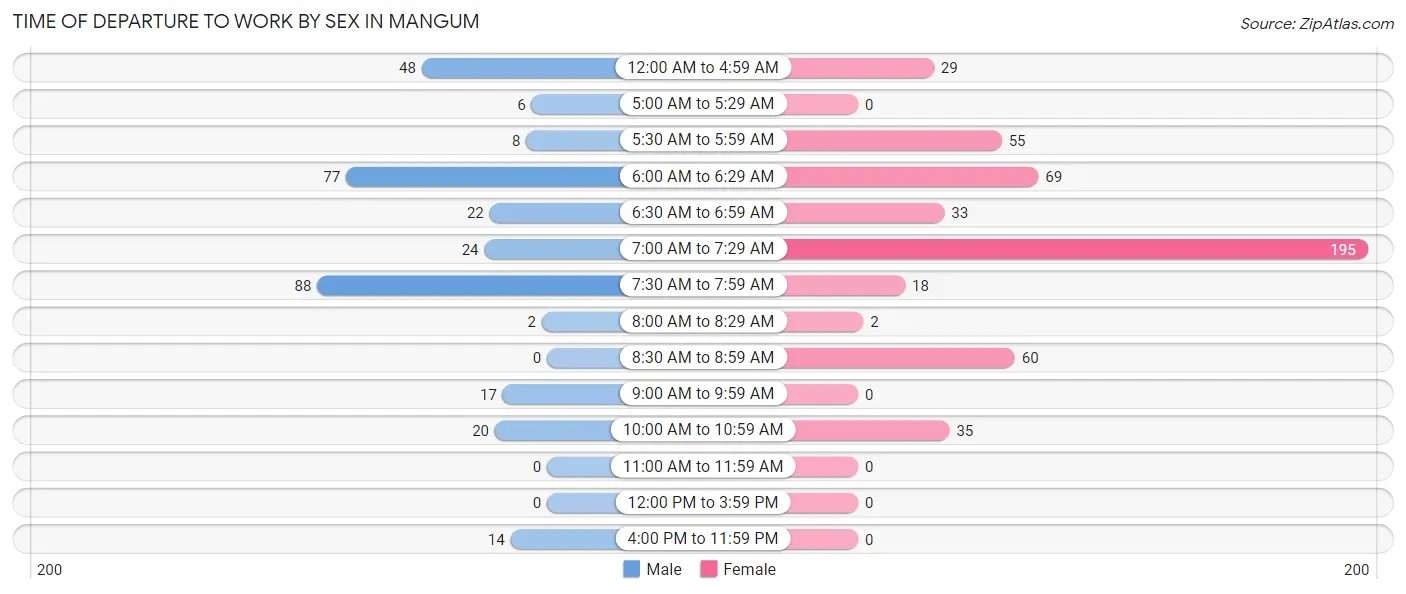
| Time of Departure | Male | Female |
| 12:00 AM to 4:59 AM | 48 (14.7%) | 29 (5.9%) |
| 5:00 AM to 5:29 AM | 6 (1.8%) | 0 (0.0%) |
| 5:30 AM to 5:59 AM | 8 (2.5%) | 55 (11.1%) |
| 6:00 AM to 6:29 AM | 77 (23.6%) | 69 (13.9%) |
| 6:30 AM to 6:59 AM | 22 (6.8%) | 33 (6.7%) |
| 7:00 AM to 7:29 AM | 24 (7.4%) | 195 (39.3%) |
| 7:30 AM to 7:59 AM | 88 (27.0%) | 18 (3.6%) |
| 8:00 AM to 8:29 AM | 2 (0.6%) | 2 (0.4%) |
| 8:30 AM to 8:59 AM | 0 (0.0%) | 60 (12.1%) |
| 9:00 AM to 9:59 AM | 17 (5.2%) | 0 (0.0%) |
| 10:00 AM to 10:59 AM | 20 (6.1%) | 35 (7.1%) |
| 11:00 AM to 11:59 AM | 0 (0.0%) | 0 (0.0%) |
| 12:00 PM to 3:59 PM | 0 (0.0%) | 0 (0.0%) |
| 4:00 PM to 11:59 PM | 14 (4.3%) | 0 (0.0%) |
| Total | 326 (100.0%) | 496 (100.0%) |
Housing Occupancy in Mangum
Occupancy by Ownership in Mangum
Of the total 1,100 dwellings in Mangum, owner-occupied units account for 695 (63.2%), while renter-occupied units make up 405 (36.8%).
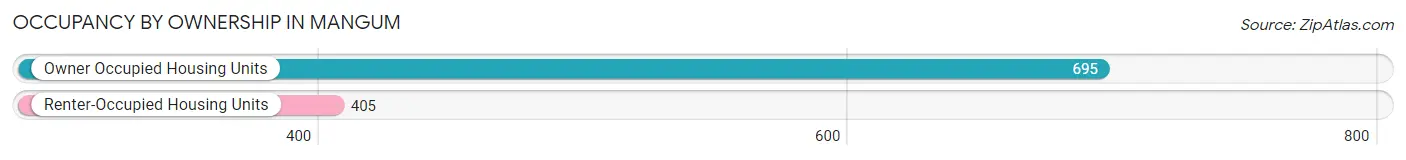
| Occupancy | # Housing Units | % Housing Units |
| Owner Occupied Housing Units | 695 | 63.2% |
| Renter-Occupied Housing Units | 405 | 36.8% |
| Total Occupied Housing Units | 1,100 | 100.0% |
Occupancy by Household Size in Mangum
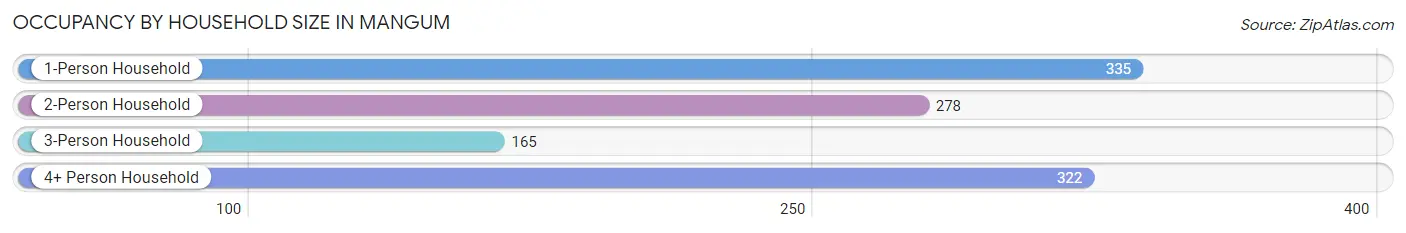
| Household Size | # Housing Units | % Housing Units |
| 1-Person Household | 335 | 30.4% |
| 2-Person Household | 278 | 25.3% |
| 3-Person Household | 165 | 15.0% |
| 4+ Person Household | 322 | 29.3% |
| Total Housing Units | 1,100 | 100.0% |
Occupancy by Ownership by Household Size in Mangum
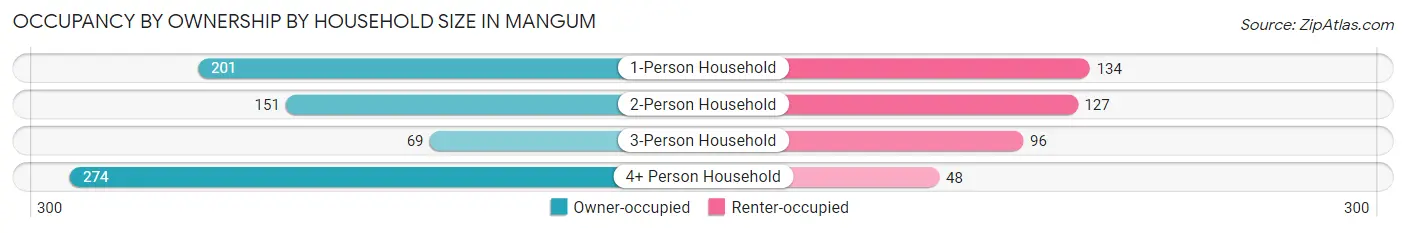
| Household Size | Owner-occupied | Renter-occupied |
| 1-Person Household | 201 (60.0%) | 134 (40.0%) |
| 2-Person Household | 151 (54.3%) | 127 (45.7%) |
| 3-Person Household | 69 (41.8%) | 96 (58.2%) |
| 4+ Person Household | 274 (85.1%) | 48 (14.9%) |
| Total Housing Units | 695 (63.2%) | 405 (36.8%) |
Occupancy by Educational Attainment in Mangum
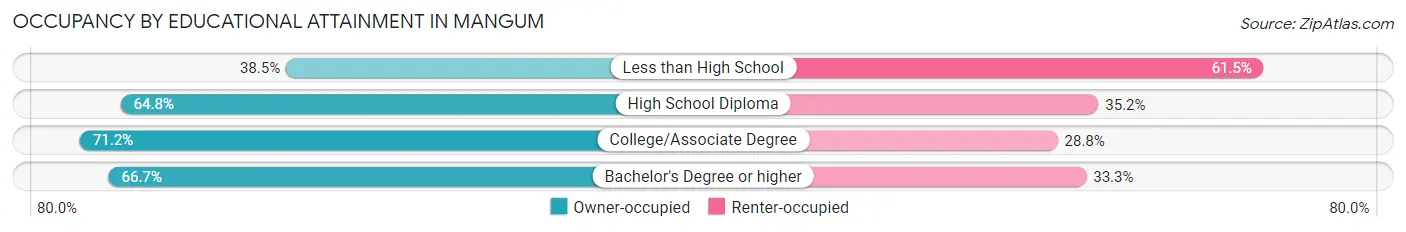
| Household Size | Owner-occupied | Renter-occupied |
| Less than High School | 74 (38.5%) | 118 (61.5%) |
| High School Diploma | 226 (64.8%) | 123 (35.2%) |
| College/Associate Degree | 349 (71.2%) | 141 (28.8%) |
| Bachelor's Degree or higher | 46 (66.7%) | 23 (33.3%) |
Occupancy by Age of Householder in Mangum
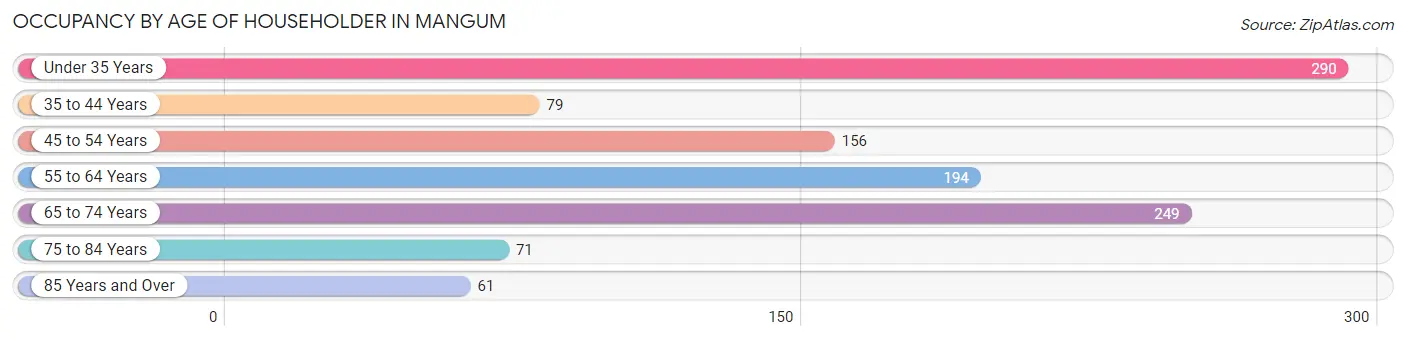
| Age Bracket | # Households | % Households |
| Under 35 Years | 290 | 26.4% |
| 35 to 44 Years | 79 | 7.2% |
| 45 to 54 Years | 156 | 14.2% |
| 55 to 64 Years | 194 | 17.6% |
| 65 to 74 Years | 249 | 22.6% |
| 75 to 84 Years | 71 | 6.5% |
| 85 Years and Over | 61 | 5.6% |
| Total | 1,100 | 100.0% |
Housing Finances in Mangum
Median Income by Occupancy in Mangum
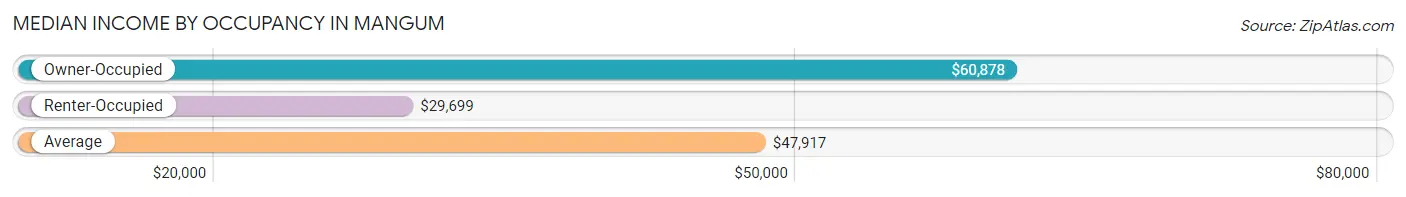
| Occupancy Type | # Households | Median Income |
| Owner-Occupied | 695 (63.2%) | $60,878 |
| Renter-Occupied | 405 (36.8%) | $29,699 |
| Average | 1,100 (100.0%) | $47,917 |
Occupancy by Householder Income Bracket in Mangum
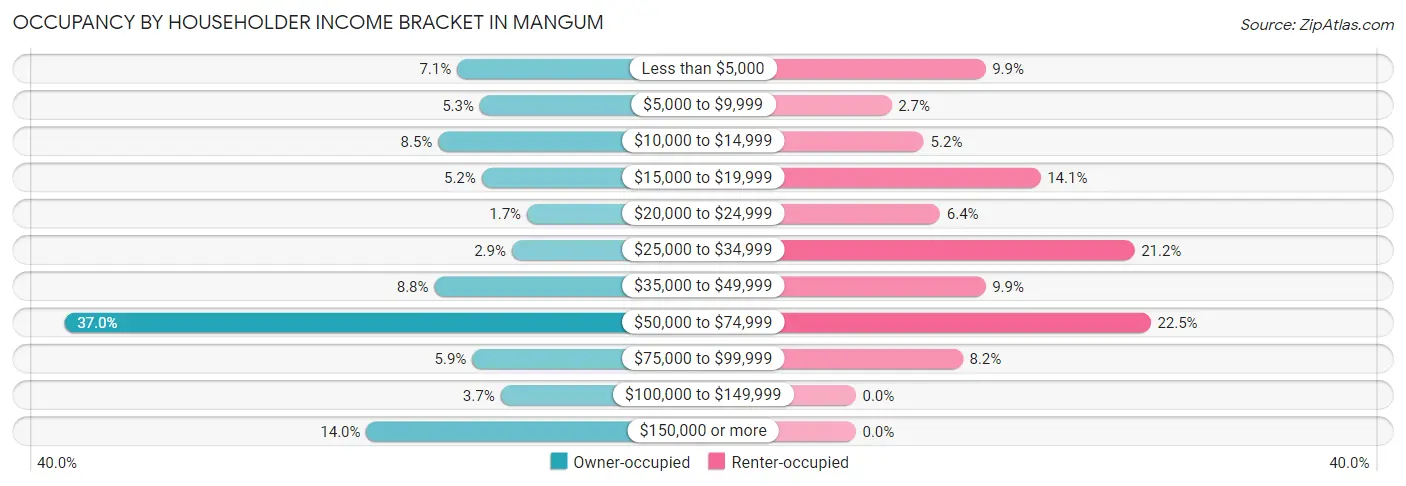
| Income Bracket | Owner-occupied | Renter-occupied |
| Less than $5,000 | 49 (7.0%) | 40 (9.9%) |
| $5,000 to $9,999 | 37 (5.3%) | 11 (2.7%) |
| $10,000 to $14,999 | 59 (8.5%) | 21 (5.2%) |
| $15,000 to $19,999 | 36 (5.2%) | 57 (14.1%) |
| $20,000 to $24,999 | 12 (1.7%) | 26 (6.4%) |
| $25,000 to $34,999 | 20 (2.9%) | 86 (21.2%) |
| $35,000 to $49,999 | 61 (8.8%) | 40 (9.9%) |
| $50,000 to $74,999 | 257 (37.0%) | 91 (22.5%) |
| $75,000 to $99,999 | 41 (5.9%) | 33 (8.2%) |
| $100,000 to $149,999 | 26 (3.7%) | 0 (0.0%) |
| $150,000 or more | 97 (14.0%) | 0 (0.0%) |
| Total | 695 (100.0%) | 405 (100.0%) |
Monthly Housing Cost Tiers in Mangum
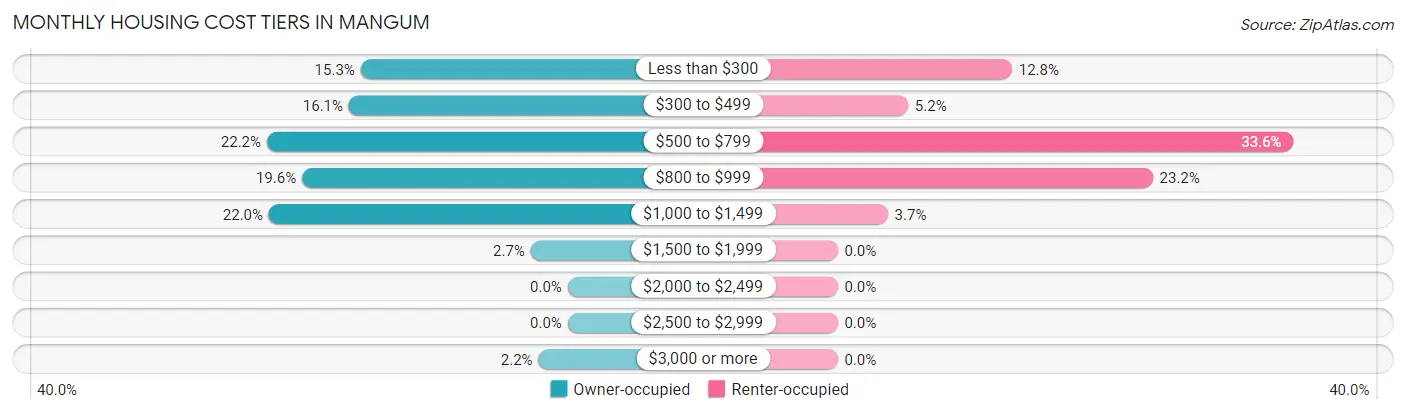
| Monthly Cost | Owner-occupied | Renter-occupied |
| Less than $300 | 106 (15.2%) | 52 (12.8%) |
| $300 to $499 | 112 (16.1%) | 21 (5.2%) |
| $500 to $799 | 154 (22.2%) | 136 (33.6%) |
| $800 to $999 | 136 (19.6%) | 94 (23.2%) |
| $1,000 to $1,499 | 153 (22.0%) | 15 (3.7%) |
| $1,500 to $1,999 | 19 (2.7%) | 0 (0.0%) |
| $2,000 to $2,499 | 0 (0.0%) | 0 (0.0%) |
| $2,500 to $2,999 | 0 (0.0%) | 0 (0.0%) |
| $3,000 or more | 15 (2.2%) | 0 (0.0%) |
| Total | 695 (100.0%) | 405 (100.0%) |
Physical Housing Characteristics in Mangum
Housing Structures in Mangum
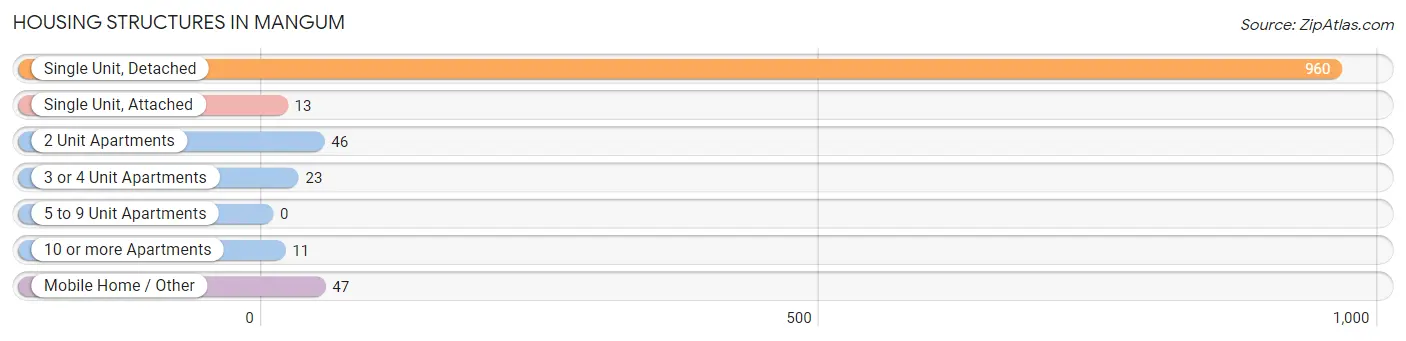
| Structure Type | # Housing Units | % Housing Units |
| Single Unit, Detached | 960 | 87.3% |
| Single Unit, Attached | 13 | 1.2% |
| 2 Unit Apartments | 46 | 4.2% |
| 3 or 4 Unit Apartments | 23 | 2.1% |
| 5 to 9 Unit Apartments | 0 | 0.0% |
| 10 or more Apartments | 11 | 1.0% |
| Mobile Home / Other | 47 | 4.3% |
| Total | 1,100 | 100.0% |
Housing Structures by Occupancy in Mangum
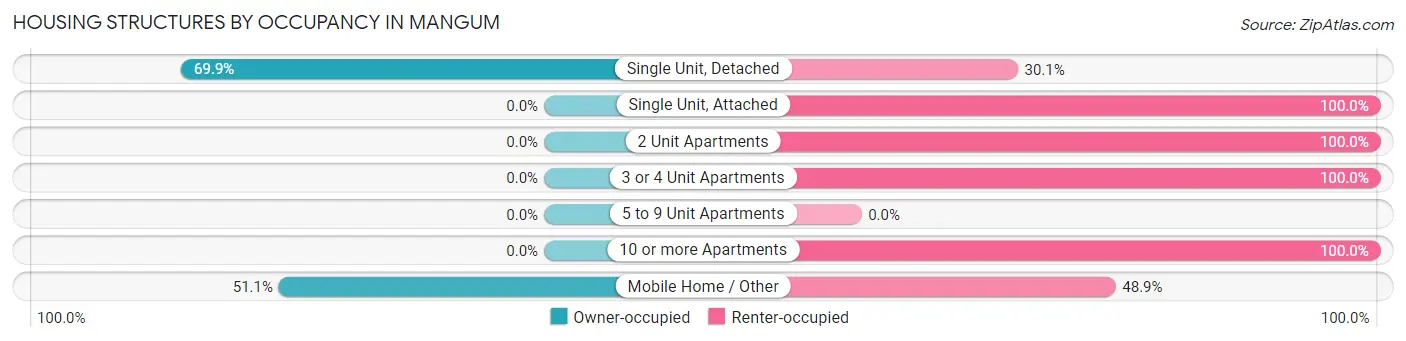
| Structure Type | Owner-occupied | Renter-occupied |
| Single Unit, Detached | 671 (69.9%) | 289 (30.1%) |
| Single Unit, Attached | 0 (0.0%) | 13 (100.0%) |
| 2 Unit Apartments | 0 (0.0%) | 46 (100.0%) |
| 3 or 4 Unit Apartments | 0 (0.0%) | 23 (100.0%) |
| 5 to 9 Unit Apartments | 0 (0.0%) | 0 (0.0%) |
| 10 or more Apartments | 0 (0.0%) | 11 (100.0%) |
| Mobile Home / Other | 24 (51.1%) | 23 (48.9%) |
| Total | 695 (63.2%) | 405 (36.8%) |
Housing Structures by Number of Rooms in Mangum
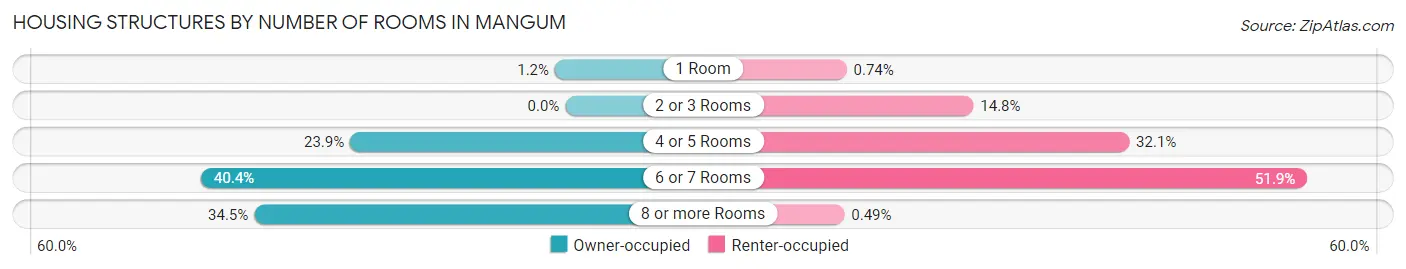
| Number of Rooms | Owner-occupied | Renter-occupied |
| 1 Room | 8 (1.1%) | 3 (0.7%) |
| 2 or 3 Rooms | 0 (0.0%) | 60 (14.8%) |
| 4 or 5 Rooms | 166 (23.9%) | 130 (32.1%) |
| 6 or 7 Rooms | 281 (40.4%) | 210 (51.8%) |
| 8 or more Rooms | 240 (34.5%) | 2 (0.5%) |
| Total | 695 (100.0%) | 405 (100.0%) |
Housing Structure by Heating Type in Mangum
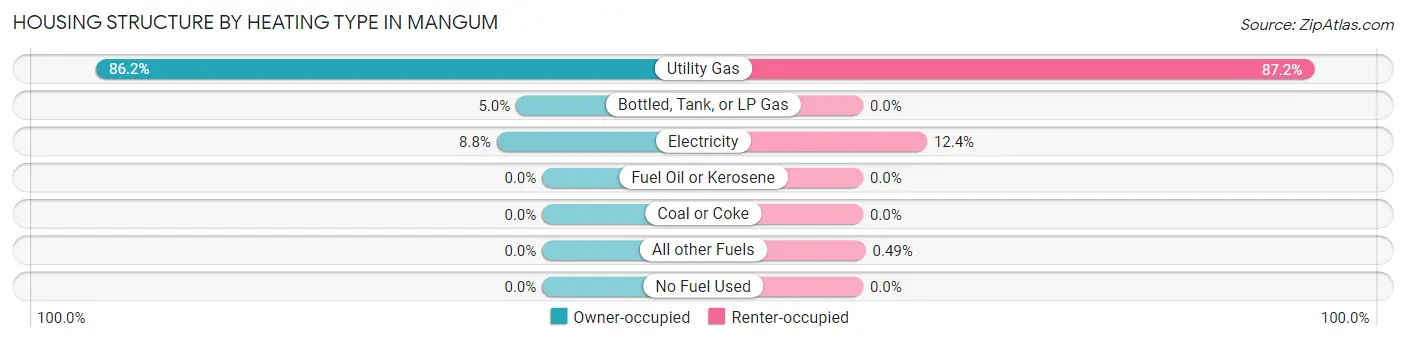
| Heating Type | Owner-occupied | Renter-occupied |
| Utility Gas | 599 (86.2%) | 353 (87.2%) |
| Bottled, Tank, or LP Gas | 35 (5.0%) | 0 (0.0%) |
| Electricity | 61 (8.8%) | 50 (12.3%) |
| Fuel Oil or Kerosene | 0 (0.0%) | 0 (0.0%) |
| Coal or Coke | 0 (0.0%) | 0 (0.0%) |
| All other Fuels | 0 (0.0%) | 2 (0.5%) |
| No Fuel Used | 0 (0.0%) | 0 (0.0%) |
| Total | 695 (100.0%) | 405 (100.0%) |
Household Vehicle Usage in Mangum
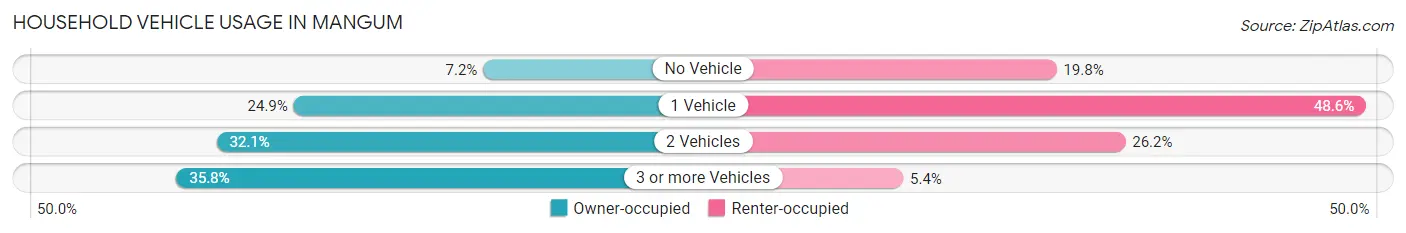
| Vehicles per Household | Owner-occupied | Renter-occupied |
| No Vehicle | 50 (7.2%) | 80 (19.8%) |
| 1 Vehicle | 173 (24.9%) | 197 (48.6%) |
| 2 Vehicles | 223 (32.1%) | 106 (26.2%) |
| 3 or more Vehicles | 249 (35.8%) | 22 (5.4%) |
| Total | 695 (100.0%) | 405 (100.0%) |
Real Estate & Mortgages in Mangum
Real Estate and Mortgage Overview in Mangum
| Characteristic | Without Mortgage | With Mortgage |
| Housing Units | 435 | 260 |
| Median Property Value | $83,800 | $92,800 |
| Median Household Income | $49,688 | $0 |
| Monthly Housing Costs | $533 | $0 |
| Real Estate Taxes | $537 | $1 |
Property Value by Mortgage Status in Mangum
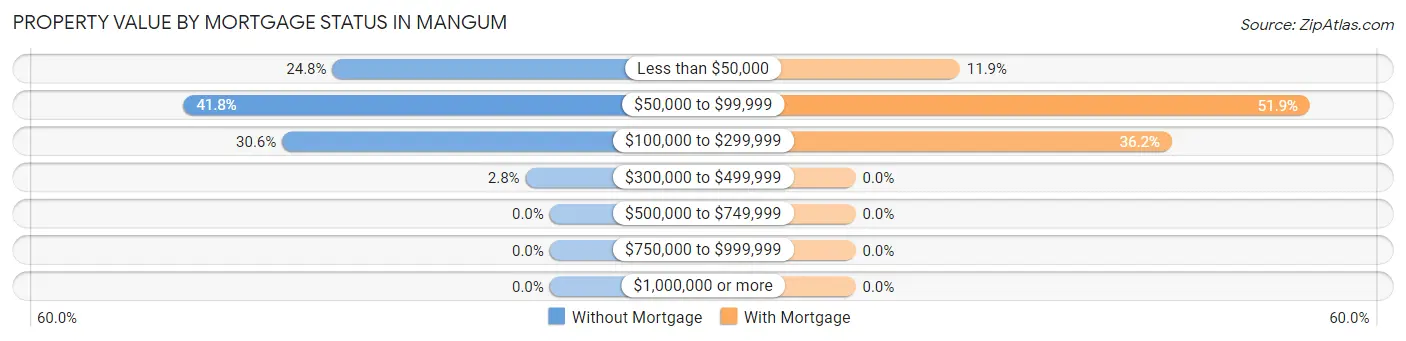
| Property Value | Without Mortgage | With Mortgage |
| Less than $50,000 | 108 (24.8%) | 31 (11.9%) |
| $50,000 to $99,999 | 182 (41.8%) | 135 (51.9%) |
| $100,000 to $299,999 | 133 (30.6%) | 94 (36.1%) |
| $300,000 to $499,999 | 12 (2.8%) | 0 (0.0%) |
| $500,000 to $749,999 | 0 (0.0%) | 0 (0.0%) |
| $750,000 to $999,999 | 0 (0.0%) | 0 (0.0%) |
| $1,000,000 or more | 0 (0.0%) | 0 (0.0%) |
| Total | 435 (100.0%) | 260 (100.0%) |
Household Income by Mortgage Status in Mangum
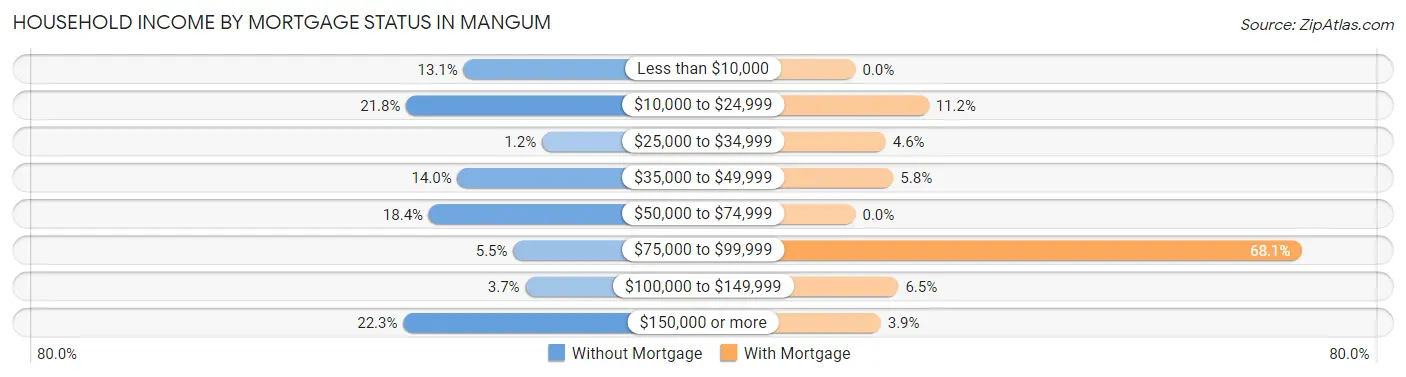
| Household Income | Without Mortgage | With Mortgage |
| Less than $10,000 | 57 (13.1%) | 0 (0.0%) |
| $10,000 to $24,999 | 95 (21.8%) | 29 (11.2%) |
| $25,000 to $34,999 | 5 (1.1%) | 12 (4.6%) |
| $35,000 to $49,999 | 61 (14.0%) | 15 (5.8%) |
| $50,000 to $74,999 | 80 (18.4%) | 0 (0.0%) |
| $75,000 to $99,999 | 24 (5.5%) | 177 (68.1%) |
| $100,000 to $149,999 | 16 (3.7%) | 17 (6.5%) |
| $150,000 or more | 97 (22.3%) | 10 (3.8%) |
| Total | 435 (100.0%) | 260 (100.0%) |
Property Value to Household Income Ratio in Mangum
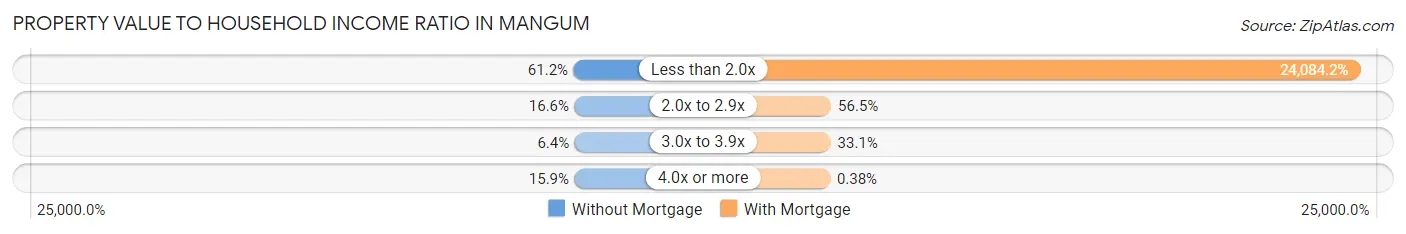
| Value-to-Income Ratio | Without Mortgage | With Mortgage |
| Less than 2.0x | 266 (61.2%) | 62,619 (24,084.2%) |
| 2.0x to 2.9x | 72 (16.6%) | 147 (56.5%) |
| 3.0x to 3.9x | 28 (6.4%) | 86 (33.1%) |
| 4.0x or more | 69 (15.9%) | 1 (0.4%) |
| Total | 435 (100.0%) | 260 (100.0%) |
Real Estate Taxes by Mortgage Status in Mangum
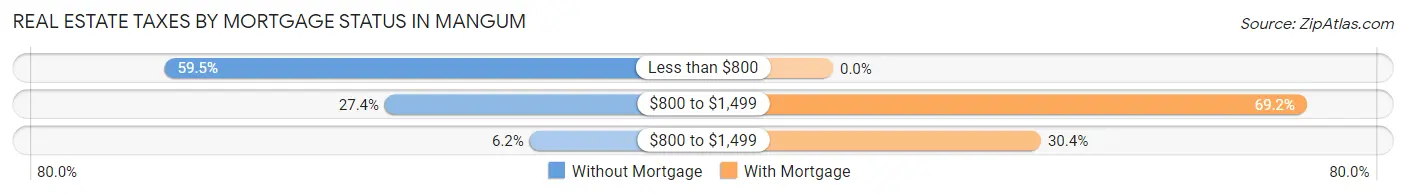
| Property Taxes | Without Mortgage | With Mortgage |
| Less than $800 | 259 (59.5%) | 0 (0.0%) |
| $800 to $1,499 | 119 (27.4%) | 180 (69.2%) |
| $800 to $1,499 | 27 (6.2%) | 79 (30.4%) |
| Total | 435 (100.0%) | 260 (100.0%) |
Health & Disability in Mangum
Health Insurance Coverage by Age in Mangum
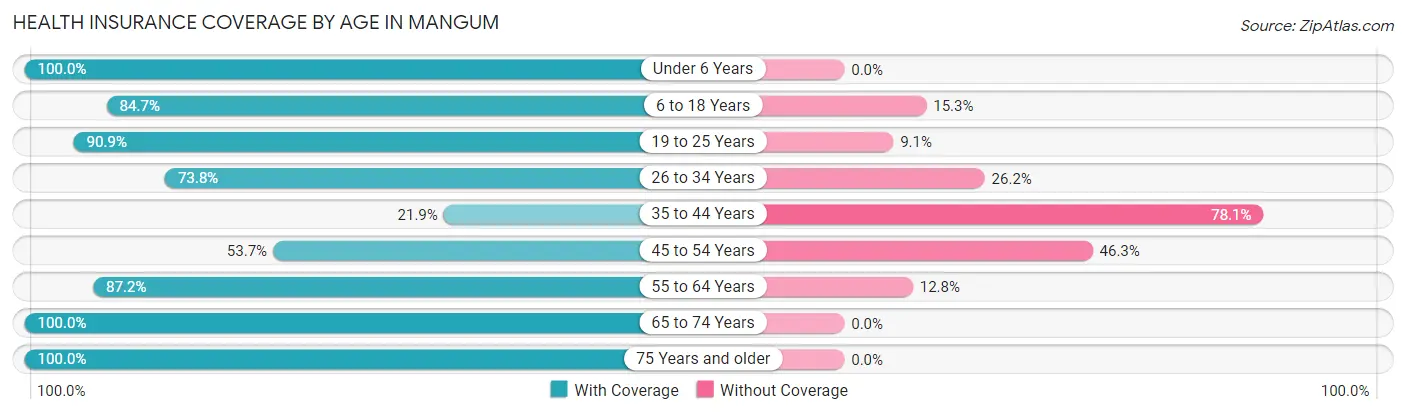
| Age Bracket | With Coverage | Without Coverage |
| Under 6 Years | 323 (100.0%) | 0 (0.0%) |
| 6 to 18 Years | 421 (84.7%) | 76 (15.3%) |
| 19 to 25 Years | 219 (90.9%) | 22 (9.1%) |
| 26 to 34 Years | 282 (73.8%) | 100 (26.2%) |
| 35 to 44 Years | 47 (21.9%) | 168 (78.1%) |
| 45 to 54 Years | 145 (53.7%) | 125 (46.3%) |
| 55 to 64 Years | 280 (87.2%) | 41 (12.8%) |
| 65 to 74 Years | 254 (100.0%) | 0 (0.0%) |
| 75 Years and older | 176 (100.0%) | 0 (0.0%) |
| Total | 2,147 (80.1%) | 532 (19.9%) |
Health Insurance Coverage by Citizenship Status in Mangum
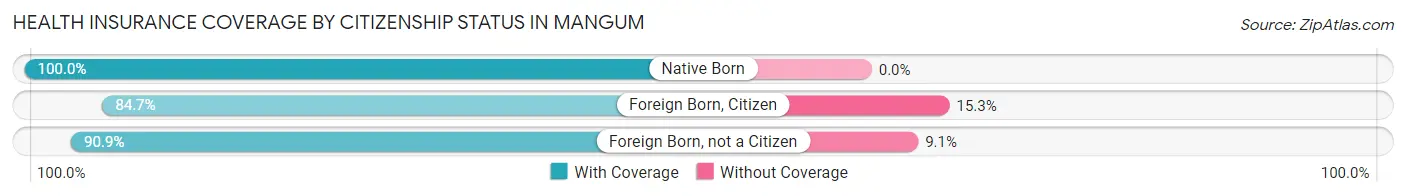
| Citizenship Status | With Coverage | Without Coverage |
| Native Born | 323 (100.0%) | 0 (0.0%) |
| Foreign Born, Citizen | 421 (84.7%) | 76 (15.3%) |
| Foreign Born, not a Citizen | 219 (90.9%) | 22 (9.1%) |
Health Insurance Coverage by Household Income in Mangum
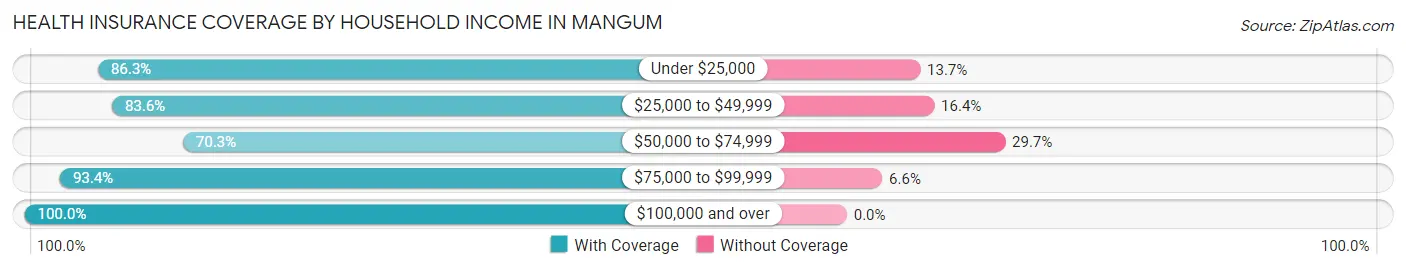
| Household Income | With Coverage | Without Coverage |
| Under $25,000 | 477 (86.3%) | 76 (13.7%) |
| $25,000 to $49,999 | 475 (83.6%) | 93 (16.4%) |
| $50,000 to $74,999 | 830 (70.3%) | 350 (29.7%) |
| $75,000 to $99,999 | 169 (93.4%) | 12 (6.6%) |
| $100,000 and over | 194 (100.0%) | 0 (0.0%) |
Public vs Private Health Insurance Coverage by Age in Mangum
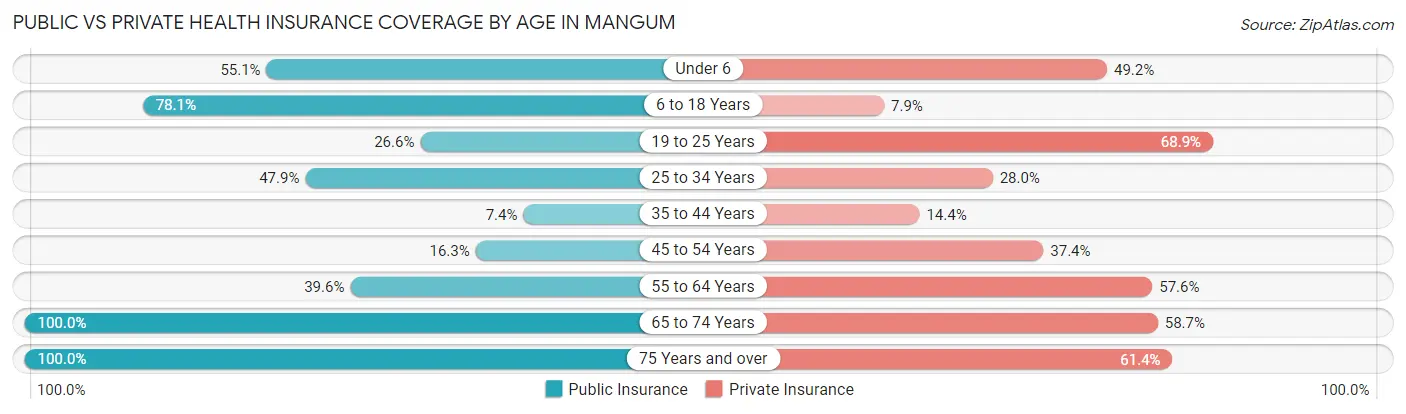
| Age Bracket | Public Insurance | Private Insurance |
| Under 6 | 178 (55.1%) | 159 (49.2%) |
| 6 to 18 Years | 388 (78.1%) | 39 (7.9%) |
| 19 to 25 Years | 64 (26.6%) | 166 (68.9%) |
| 25 to 34 Years | 183 (47.9%) | 107 (28.0%) |
| 35 to 44 Years | 16 (7.4%) | 31 (14.4%) |
| 45 to 54 Years | 44 (16.3%) | 101 (37.4%) |
| 55 to 64 Years | 127 (39.6%) | 185 (57.6%) |
| 65 to 74 Years | 254 (100.0%) | 149 (58.7%) |
| 75 Years and over | 176 (100.0%) | 108 (61.4%) |
| Total | 1,430 (53.4%) | 1,045 (39.0%) |
Disability Status by Sex by Age in Mangum
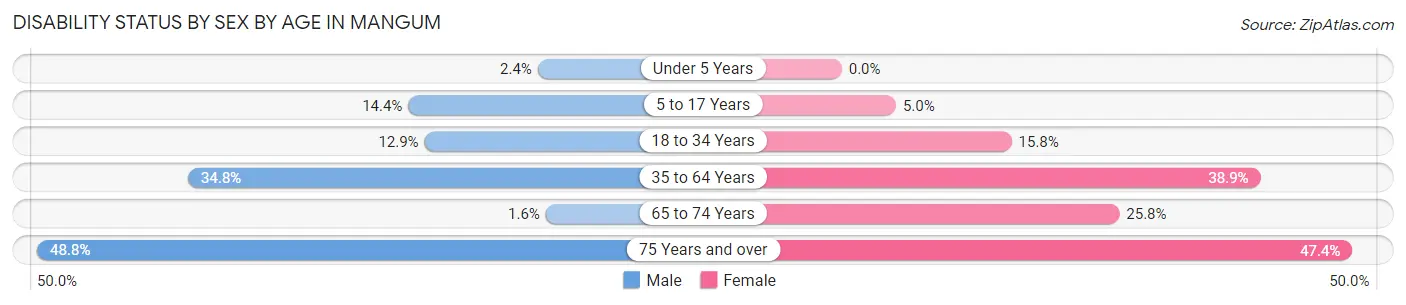
| Age Bracket | Male | Female |
| Under 5 Years | 2 (2.4%) | 0 (0.0%) |
| 5 to 17 Years | 52 (14.4%) | 10 (5.0%) |
| 18 to 34 Years | 41 (12.9%) | 52 (15.8%) |
| 35 to 64 Years | 123 (34.8%) | 176 (38.9%) |
| 65 to 74 Years | 2 (1.6%) | 34 (25.8%) |
| 75 Years and over | 21 (48.8%) | 63 (47.4%) |
Disability Class by Sex by Age in Mangum
Disability Class: Hearing Difficulty
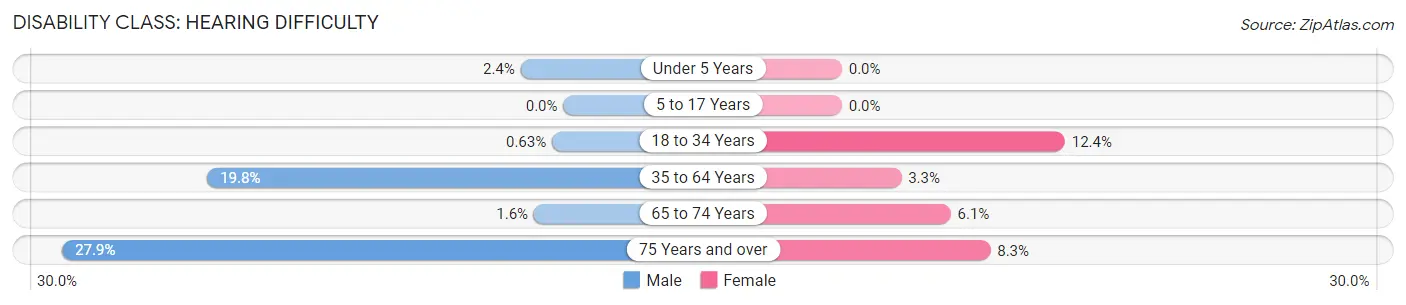
| Age Bracket | Male | Female |
| Under 5 Years | 2 (2.4%) | 0 (0.0%) |
| 5 to 17 Years | 0 (0.0%) | 0 (0.0%) |
| 18 to 34 Years | 2 (0.6%) | 41 (12.4%) |
| 35 to 64 Years | 70 (19.8%) | 15 (3.3%) |
| 65 to 74 Years | 2 (1.6%) | 8 (6.1%) |
| 75 Years and over | 12 (27.9%) | 11 (8.3%) |
Disability Class: Vision Difficulty
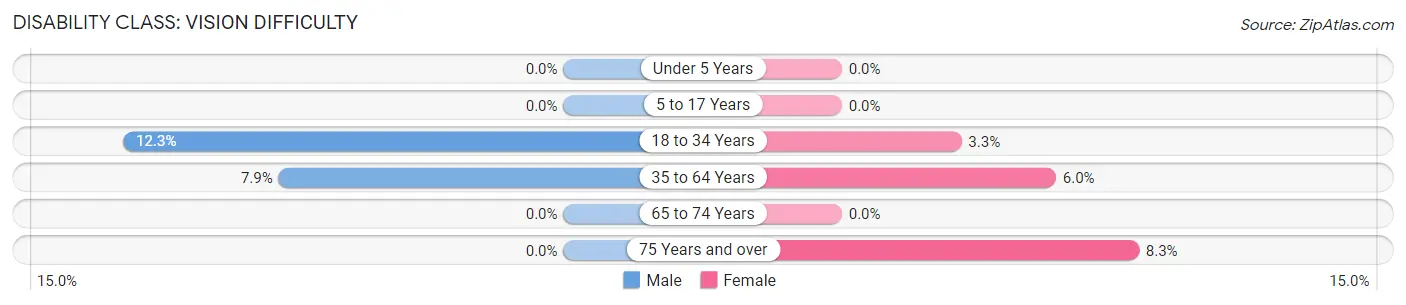
| Age Bracket | Male | Female |
| Under 5 Years | 0 (0.0%) | 0 (0.0%) |
| 5 to 17 Years | 0 (0.0%) | 0 (0.0%) |
| 18 to 34 Years | 39 (12.3%) | 11 (3.3%) |
| 35 to 64 Years | 28 (7.9%) | 27 (6.0%) |
| 65 to 74 Years | 0 (0.0%) | 0 (0.0%) |
| 75 Years and over | 0 (0.0%) | 11 (8.3%) |
Disability Class: Cognitive Difficulty
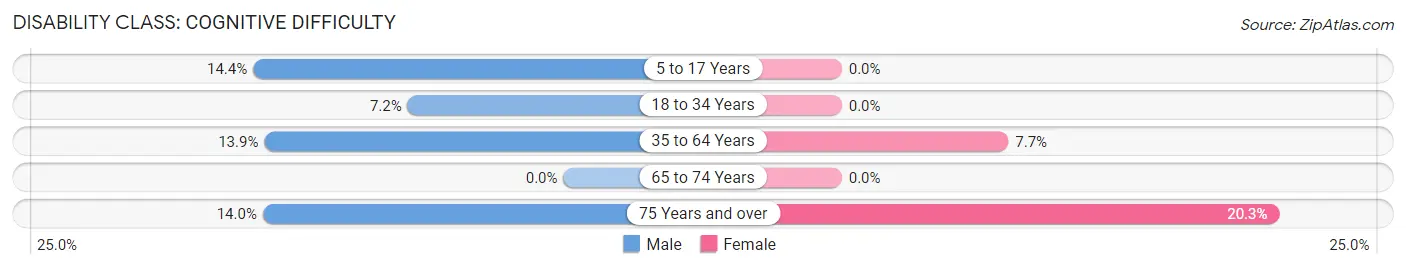
| Age Bracket | Male | Female |
| 5 to 17 Years | 52 (14.4%) | 0 (0.0%) |
| 18 to 34 Years | 23 (7.2%) | 0 (0.0%) |
| 35 to 64 Years | 49 (13.9%) | 35 (7.7%) |
| 65 to 74 Years | 0 (0.0%) | 0 (0.0%) |
| 75 Years and over | 6 (14.0%) | 27 (20.3%) |
Disability Class: Ambulatory Difficulty
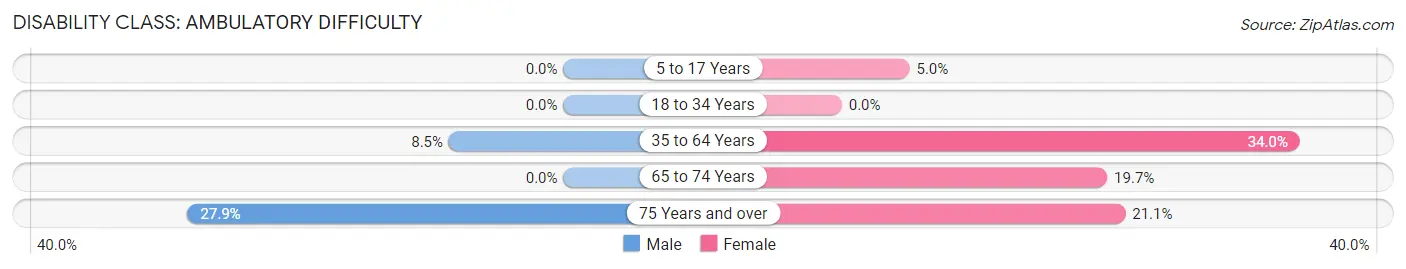
| Age Bracket | Male | Female |
| 5 to 17 Years | 0 (0.0%) | 10 (5.0%) |
| 18 to 34 Years | 0 (0.0%) | 0 (0.0%) |
| 35 to 64 Years | 30 (8.5%) | 154 (34.0%) |
| 65 to 74 Years | 0 (0.0%) | 26 (19.7%) |
| 75 Years and over | 12 (27.9%) | 28 (21.0%) |
Disability Class: Self-Care Difficulty
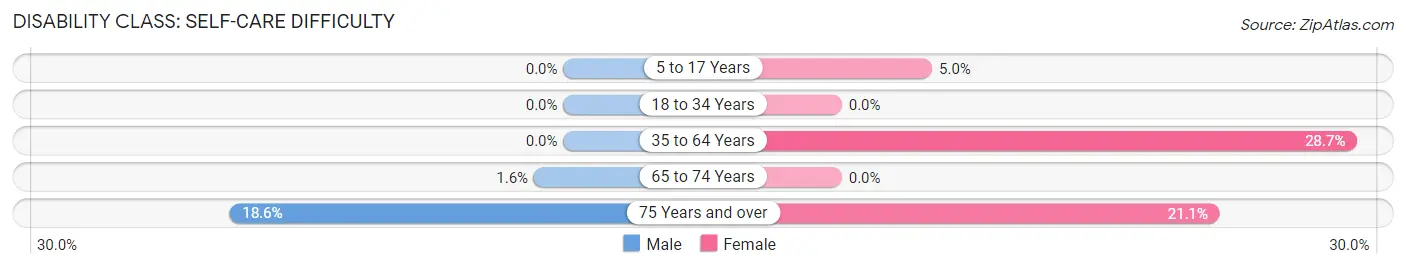
| Age Bracket | Male | Female |
| 5 to 17 Years | 0 (0.0%) | 10 (5.0%) |
| 18 to 34 Years | 0 (0.0%) | 0 (0.0%) |
| 35 to 64 Years | 0 (0.0%) | 130 (28.7%) |
| 65 to 74 Years | 2 (1.6%) | 0 (0.0%) |
| 75 Years and over | 8 (18.6%) | 28 (21.0%) |
Technology Access in Mangum
Computing Device Access in Mangum
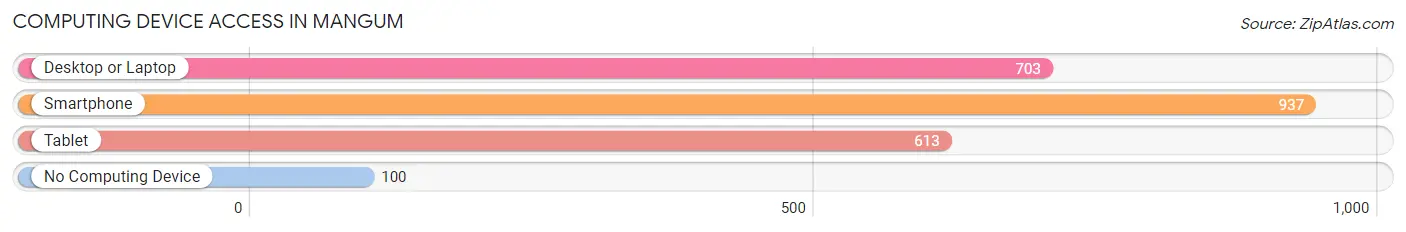
| Device Type | # Households | % Households |
| Desktop or Laptop | 703 | 63.9% |
| Smartphone | 937 | 85.2% |
| Tablet | 613 | 55.7% |
| No Computing Device | 100 | 9.1% |
| Total | 1,100 | 100.0% |
Internet Access in Mangum
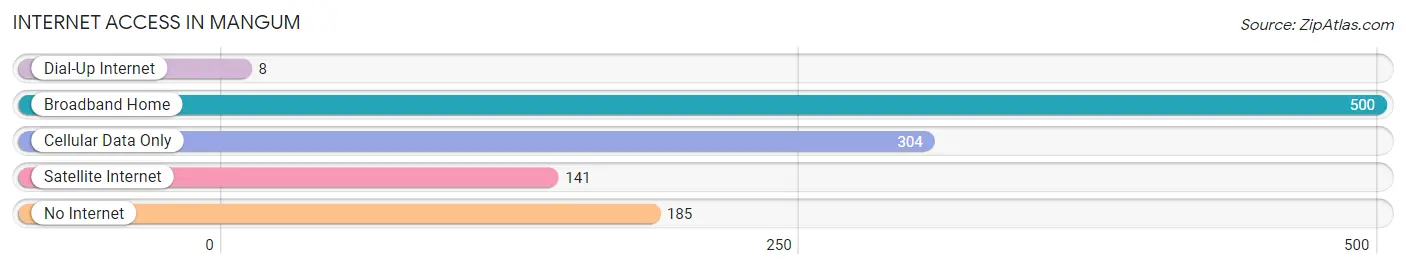
| Internet Type | # Households | % Households |
| Dial-Up Internet | 8 | 0.7% |
| Broadband Home | 500 | 45.5% |
| Cellular Data Only | 304 | 27.6% |
| Satellite Internet | 141 | 12.8% |
| No Internet | 185 | 16.8% |
| Total | 1,100 | 100.0% |
Mangum Summary
Mangum is a city located in Greer County, Oklahoma. It is the county seat of Greer County and is located in the southwestern part of the state. The population of Mangum was 2,845 at the 2010 census, an increase of 4.3 percent from 2,726 at the 2000 census.
Mangum was founded in 1891 when the Choctaw, Oklahoma and Gulf Railroad was built through the area. The town was named for William Mangum, a railroad official. The post office was established in 1892.
Geography
Mangum is located at the intersection of U.S. Route 283 and State Highway 6. It is approximately 75 miles southwest of Oklahoma City and 90 miles northeast of Amarillo, Texas.
The city is situated in the Red Bed Plains region of Oklahoma, which is characterized by flat terrain and red-colored soils. The elevation of Mangum is 1,845 feet above sea level.
Climate
Mangum has a humid subtropical climate, with hot summers and mild winters. The average annual temperature is 64.3°F, with an average high of 87.2°F in July and an average low of 37.2°F in January. The average annual precipitation is 33.2 inches, with an average of 4.2 inches of snowfall per year.
Demographics
As of the 2010 census, there were 2,845 people, 1,093 households, and 745 families residing in the city. The population density was 1,092.3 people per square mile. The racial makeup of the city was 81.2% White, 0.7% African American, 1.2% Native American, 0.2% Asian, 0.1% Pacific Islander, 14.7% from other races, and 2.0% from two or more races. Hispanic or Latino of any race were 24.2% of the population.
The median income for a household in the city was $30,938, and the median income for a family was $36,250. Males had a median income of $27,917 versus $20,938 for females. The per capita income for the city was $14,945. About 16.2% of families and 20.2% of the population were below the poverty line, including 28.2% of those under age 18 and 14.2% of those age 65 or over.
Economy
Mangum's economy is largely based on agriculture and oil production. The city is home to several oil and gas companies, including Apache Corporation, Devon Energy, and Chesapeake Energy.
Agriculture is also an important part of the local economy. The city is home to several large farms, including the Mangum Farms, which produces wheat, corn, and soybeans.
The city is also home to several small businesses, including restaurants, retail stores, and service providers. The city is served by the Mangum Public School District, which includes two elementary schools, one middle school, and one high school.
Mangum is also home to several churches, including the First United Methodist Church, the First Baptist Church, and the Church of Christ. The city is served by the Mangum Municipal Airport, which offers general aviation services.
Conclusion
Mangum is a small city located in Greer County, Oklahoma. It is the county seat of Greer County and is located in the southwestern part of the state. The city has a population of 2,845 and is home to several oil and gas companies, farms, and small businesses. The city is served by the Mangum Public School District and several churches. The city is also served by the Mangum Municipal Airport, which offers general aviation services.
Common Questions
What is Per Capita Income in Mangum?
Per Capita income in Mangum is $19,313.
What is the Median Family Income in Mangum?
Median Family Income in Mangum is $62,775.
What is the Median Household income in Mangum?
Median Household Income in Mangum is $47,917.
What is Income or Wage Gap in Mangum?
Income or Wage Gap in Mangum is 30.2%.
Women in Mangum earn 69.8 cents for every dollar earned by a man.
What is Inequality or Gini Index in Mangum?
Inequality or Gini Index in Mangum is 0.44.
What is the Total Population of Mangum?
Total Population of Mangum is 2,775.
What is the Total Male Population of Mangum?
Total Male Population of Mangum is 1,346.
What is the Total Female Population of Mangum?
Total Female Population of Mangum is 1,429.
What is the Ratio of Males per 100 Females in Mangum?
There are 94.19 Males per 100 Females in Mangum.
What is the Ratio of Females per 100 Males in Mangum?
There are 106.17 Females per 100 Males in Mangum.
What is the Median Population Age in Mangum?
Median Population Age in Mangum is 32.3 Years.
What is the Average Family Size in Mangum
Average Family Size in Mangum is 3.0 People.
What is the Average Household Size in Mangum
Average Household Size in Mangum is 2.4 People.
How Large is the Labor Force in Mangum?
There are 991 People in the Labor Forcein in Mangum.
What is the Percentage of People in the Labor Force in Mangum?
48.2% of People are in the Labor Force in Mangum.
What is the Unemployment Rate in Mangum?
Unemployment Rate in Mangum is 11.1%.