Valley Park, OK Map & Demographics
Valley Park Map
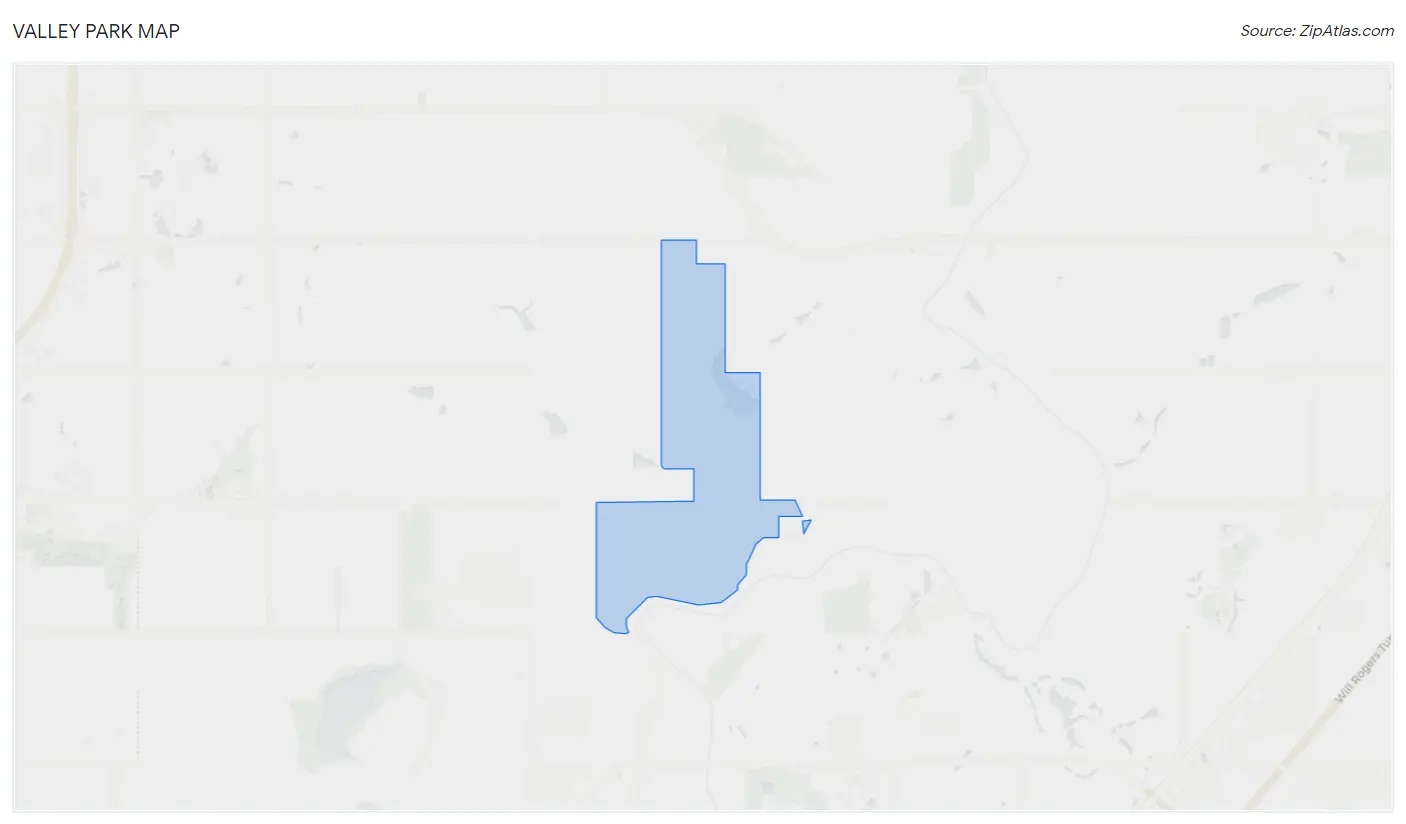
Valley Park Overview
$71,321
PER CAPITA INCOME
0.50
INEQUALITY / GINI INDEX
14
TOTAL POPULATION
8
MALE POPULATION
6
FEMALE POPULATION
133.33
MALES / 100 FEMALES
75.00
FEMALES / 100 MALES
56.3
MEDIAN AGE
2.8
AVG FAMILY SIZE
2.8
AVG HOUSEHOLD SIZE
9
LABOR FORCE [ PEOPLE ]
75.0%
PERCENT IN LABOR FORCE
Valley Park Area Codes
Income in Valley Park
Income Overview in Valley Park
| Characteristic | Number | Measure |
| Per Capita Income | 14 | $71,321 |
| Median Family Income | 5 | $0 |
| Mean Family Income | 5 | $193,600 |
| Median Household Income | 5 | $0 |
| Mean Household Income | 5 | $193,600 |
| Income Deficit | 5 | $0 |
| Wage / Income Gap (%) | 14 | 0.00% |
| Wage / Income Gap ($) | 14 | 100.00¢ per $1 |
| Gini / Inequality Index | 14 | 0.50 |
Earnings by Sex in Valley Park
| Sex | Number | Average Earnings |
| Male | 5 (55.6%) | $0 |
| Female | 4 (44.4%) | $0 |
| Total | 9 (100.0%) | $0 |
Earnings by Sex by Income Bracket in Valley Park
The most common earnings brackets in Valley Park are $30,000 to $34,999 for men (2 | 40.0%) and $30,000 to $34,999 for women (1 | 25.0%).
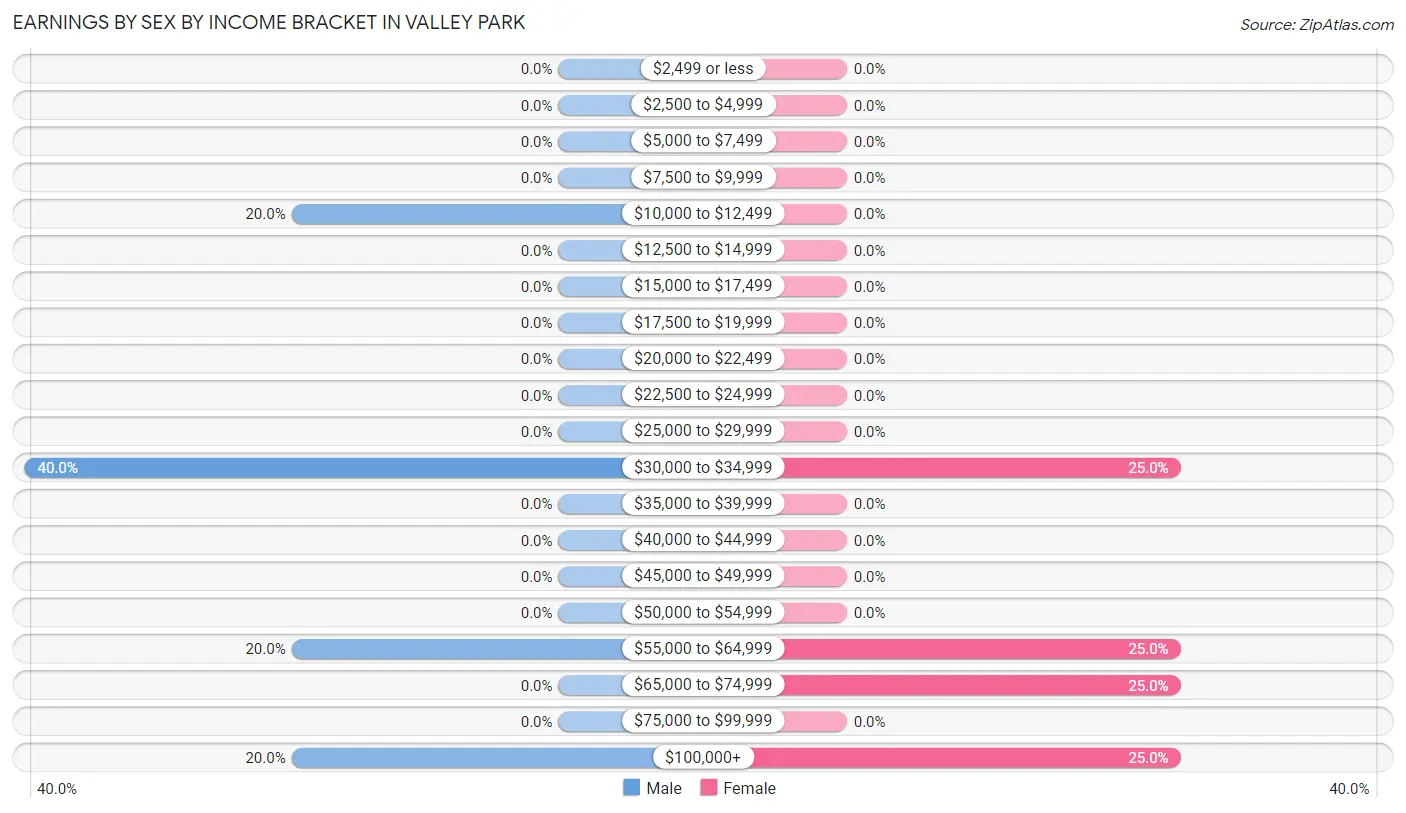
| Income | Male | Female |
| $2,499 or less | 0 (0.0%) | 0 (0.0%) |
| $2,500 to $4,999 | 0 (0.0%) | 0 (0.0%) |
| $5,000 to $7,499 | 0 (0.0%) | 0 (0.0%) |
| $7,500 to $9,999 | 0 (0.0%) | 0 (0.0%) |
| $10,000 to $12,499 | 1 (20.0%) | 0 (0.0%) |
| $12,500 to $14,999 | 0 (0.0%) | 0 (0.0%) |
| $15,000 to $17,499 | 0 (0.0%) | 0 (0.0%) |
| $17,500 to $19,999 | 0 (0.0%) | 0 (0.0%) |
| $20,000 to $22,499 | 0 (0.0%) | 0 (0.0%) |
| $22,500 to $24,999 | 0 (0.0%) | 0 (0.0%) |
| $25,000 to $29,999 | 0 (0.0%) | 0 (0.0%) |
| $30,000 to $34,999 | 2 (40.0%) | 1 (25.0%) |
| $35,000 to $39,999 | 0 (0.0%) | 0 (0.0%) |
| $40,000 to $44,999 | 0 (0.0%) | 0 (0.0%) |
| $45,000 to $49,999 | 0 (0.0%) | 0 (0.0%) |
| $50,000 to $54,999 | 0 (0.0%) | 0 (0.0%) |
| $55,000 to $64,999 | 1 (20.0%) | 1 (25.0%) |
| $65,000 to $74,999 | 0 (0.0%) | 1 (25.0%) |
| $75,000 to $99,999 | 0 (0.0%) | 0 (0.0%) |
| $100,000+ | 1 (20.0%) | 1 (25.0%) |
| Total | 5 (100.0%) | 4 (100.0%) |
Earnings by Sex by Educational Attainment in Valley Park
| Educational Attainment | Male Income | Female Income |
| Less than High School | - | - |
| High School Diploma | - | - |
| College or Associate's Degree | - | - |
| Bachelor's Degree | - | - |
| Graduate Degree | - | - |
| Total | - | - |
Family Income in Valley Park
Family Income Brackets in Valley Park
According to the Valley Park family income data, there are 2 families falling into the $200,000+ income range, which is the most common income bracket and makes up 40.0% of all families.
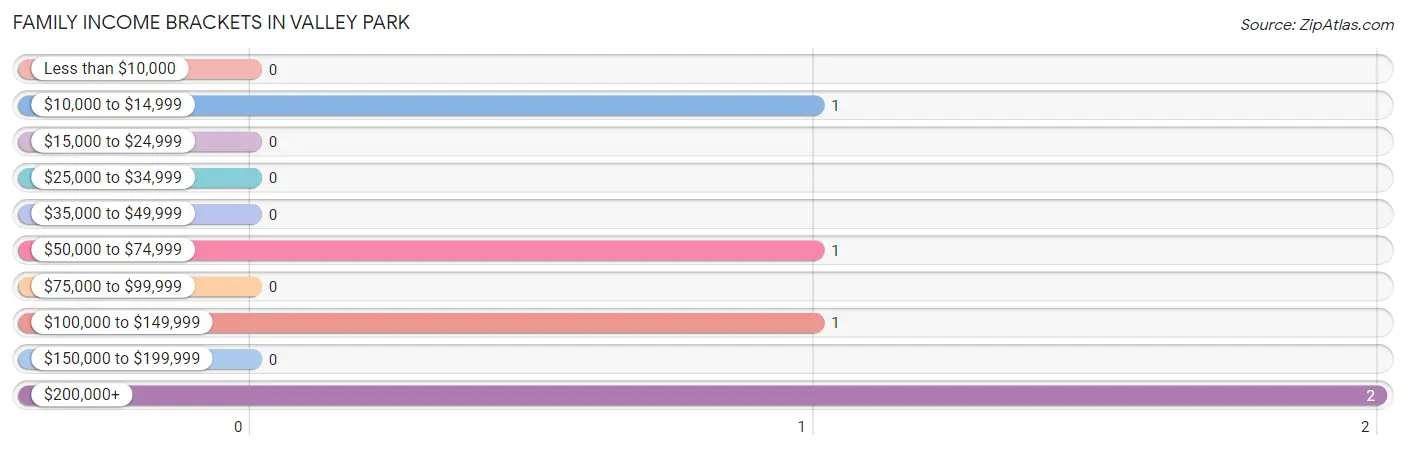
| Income Bracket | # Families | % Families |
| Less than $10,000 | 0 | 0.0% |
| $10,000 to $14,999 | 1 | 20.0% |
| $15,000 to $24,999 | 0 | 0.0% |
| $25,000 to $34,999 | 0 | 0.0% |
| $35,000 to $49,999 | 0 | 0.0% |
| $50,000 to $74,999 | 1 | 20.0% |
| $75,000 to $99,999 | 0 | 0.0% |
| $100,000 to $149,999 | 1 | 20.0% |
| $150,000 to $199,999 | 0 | 0.0% |
| $200,000+ | 2 | 40.0% |
Family Income by Famaliy Size in Valley Park
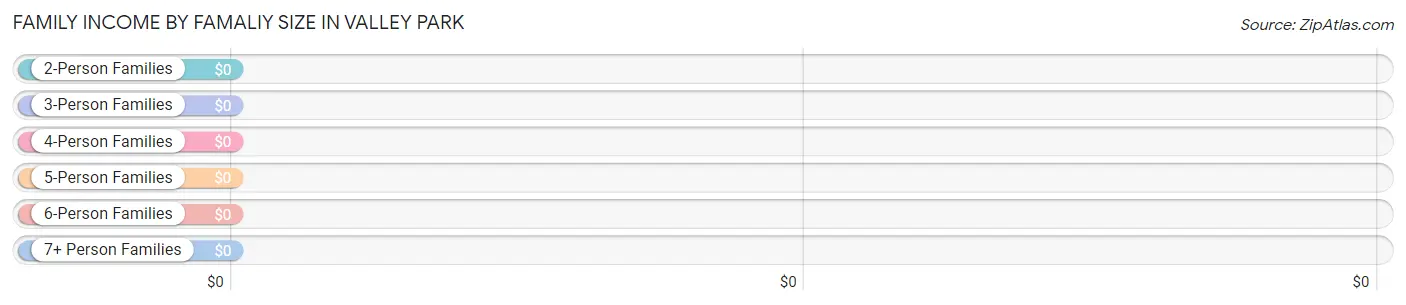
| Income Bracket | # Families | Median Income |
| 2-Person Families | 3 (60.0%) | $0 |
| 3-Person Families | 1 (20.0%) | $0 |
| 4-Person Families | 1 (20.0%) | $0 |
| 5-Person Families | 0 (0.0%) | $0 |
| 6-Person Families | 0 (0.0%) | $0 |
| 7+ Person Families | 0 (0.0%) | $0 |
| Total | 5 (100.0%) | $0 |
Family Income by Number of Earners in Valley Park
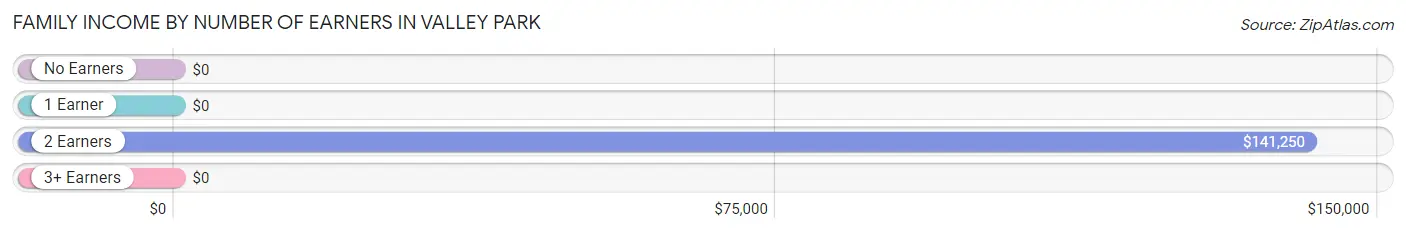
| Number of Earners | # Families | Median Income |
| No Earners | 0 (0.0%) | $0 |
| 1 Earner | 2 (40.0%) | $0 |
| 2 Earners | 3 (60.0%) | $141,250 |
| 3+ Earners | 0 (0.0%) | $0 |
| Total | 5 (100.0%) | $0 |
Household Income in Valley Park
Household Income Brackets in Valley Park
With 2 households falling in the category, the $200,000+ income range is the most frequent in Valley Park, accounting for 40.0% of all households.
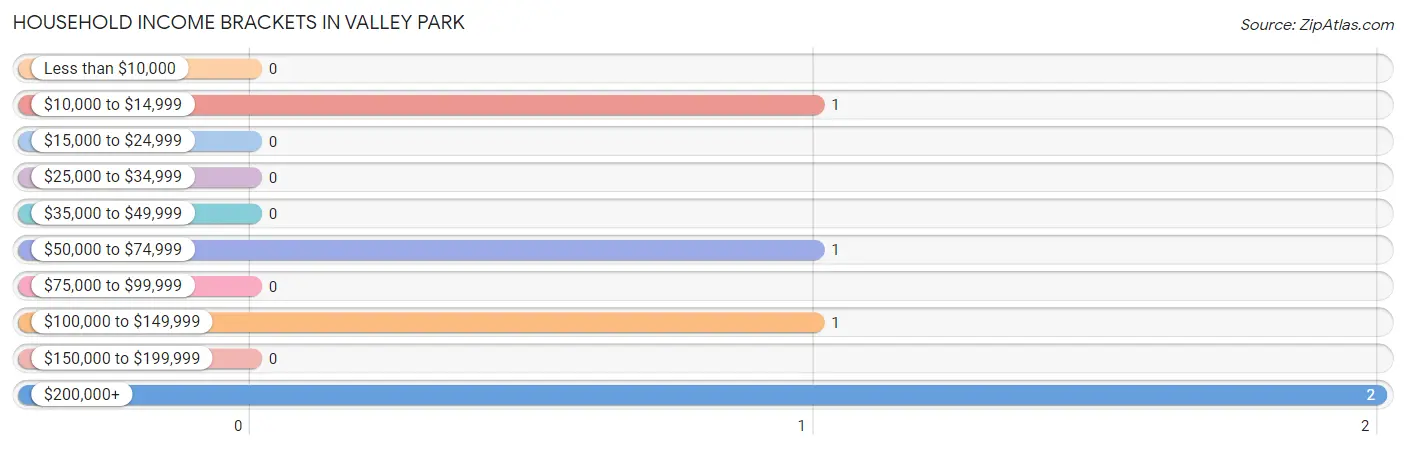
| Income Bracket | # Households | % Households |
| Less than $10,000 | 0 | 0.0% |
| $10,000 to $14,999 | 1 | 20.0% |
| $15,000 to $24,999 | 0 | 0.0% |
| $25,000 to $34,999 | 0 | 0.0% |
| $35,000 to $49,999 | 0 | 0.0% |
| $50,000 to $74,999 | 1 | 20.0% |
| $75,000 to $99,999 | 0 | 0.0% |
| $100,000 to $149,999 | 1 | 20.0% |
| $150,000 to $199,999 | 0 | 0.0% |
| $200,000+ | 2 | 40.0% |
Household Income by Householder Age in Valley Park
The median household income in Valley Park is $0, with the highest median household income of $178,750 found in the 45 to 64 years age bracket for the primary householder. A total of 4 households (80.0%) fall into this category.
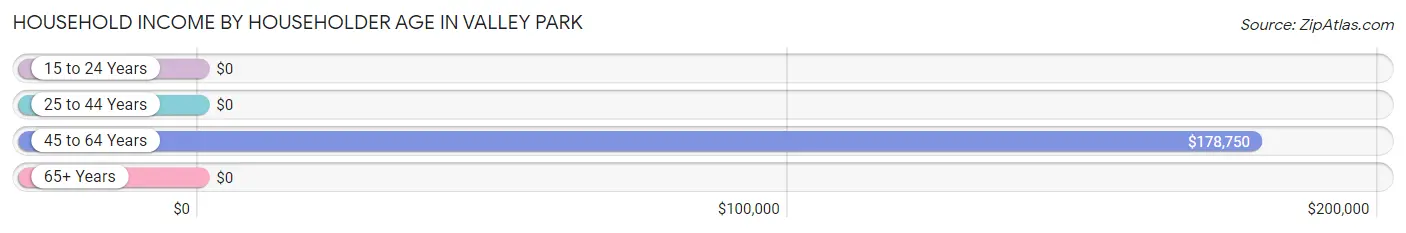
| Income Bracket | # Households | Median Income |
| 15 to 24 Years | 0 (0.0%) | $0 |
| 25 to 44 Years | 1 (20.0%) | $0 |
| 45 to 64 Years | 4 (80.0%) | $178,750 |
| 65+ Years | 0 (0.0%) | $0 |
| Total | 5 (100.0%) | $0 |
Poverty in Valley Park
Income Below Poverty by Sex and Age in Valley Park
With 12.5% poverty level for males and 16.7% for females among the residents of Valley Park, 55 to 64 year old males and 55 to 64 year old females are the most vulnerable to poverty, with 1 males (16.7%) and 1 females (25.0%) in their respective age groups living below the poverty level.
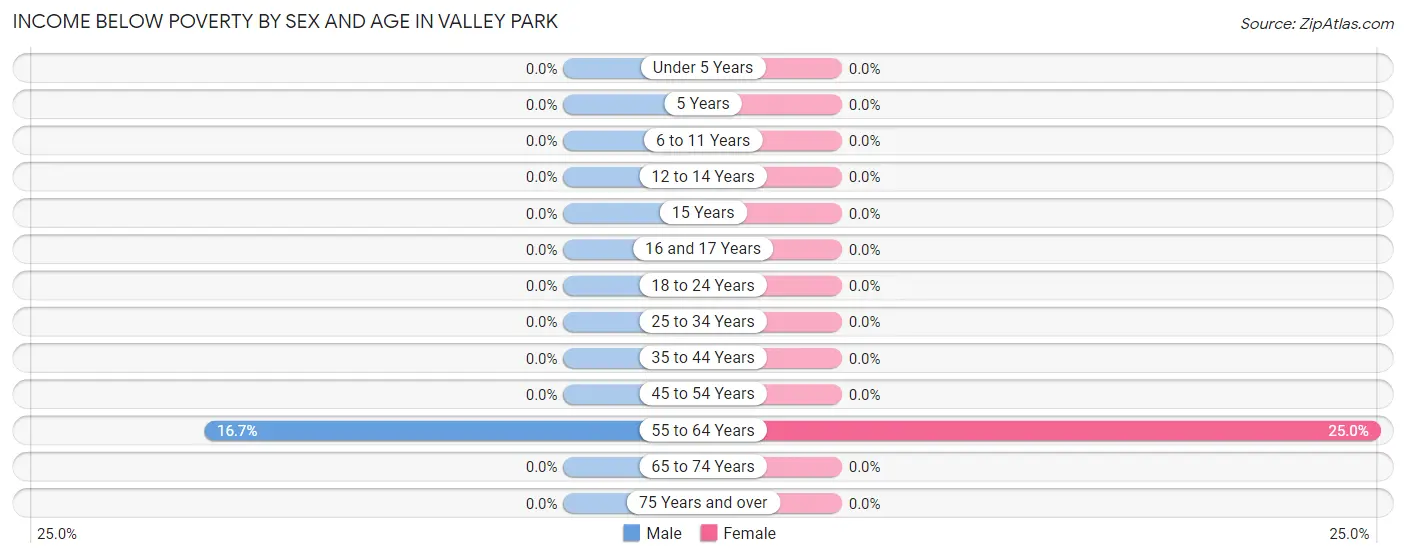
| Age Bracket | Male | Female |
| Under 5 Years | 0 (0.0%) | 0 (0.0%) |
| 5 Years | 0 (0.0%) | 0 (0.0%) |
| 6 to 11 Years | 0 (0.0%) | 0 (0.0%) |
| 12 to 14 Years | 0 (0.0%) | 0 (0.0%) |
| 15 Years | 0 (0.0%) | 0 (0.0%) |
| 16 and 17 Years | 0 (0.0%) | 0 (0.0%) |
| 18 to 24 Years | 0 (0.0%) | 0 (0.0%) |
| 25 to 34 Years | 0 (0.0%) | 0 (0.0%) |
| 35 to 44 Years | 0 (0.0%) | 0 (0.0%) |
| 45 to 54 Years | 0 (0.0%) | 0 (0.0%) |
| 55 to 64 Years | 1 (16.7%) | 1 (25.0%) |
| 65 to 74 Years | 0 (0.0%) | 0 (0.0%) |
| 75 Years and over | 0 (0.0%) | 0 (0.0%) |
| Total | 1 (12.5%) | 1 (16.7%) |
Income Above Poverty by Sex and Age in Valley Park
According to the poverty statistics in Valley Park, males aged under 5 years and females aged 16 and 17 years are the age groups that are most secure financially, with 100.0% of males and 100.0% of females in these age groups living above the poverty line.
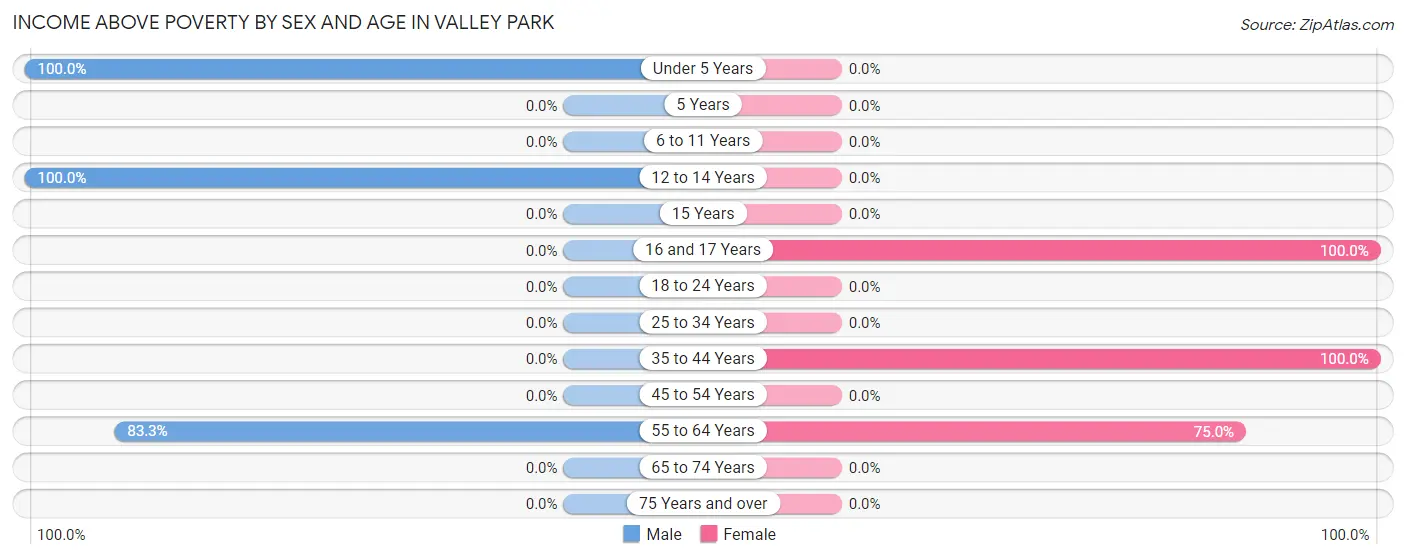
| Age Bracket | Male | Female |
| Under 5 Years | 1 (100.0%) | 0 (0.0%) |
| 5 Years | 0 (0.0%) | 0 (0.0%) |
| 6 to 11 Years | 0 (0.0%) | 0 (0.0%) |
| 12 to 14 Years | 1 (100.0%) | 0 (0.0%) |
| 15 Years | 0 (0.0%) | 0 (0.0%) |
| 16 and 17 Years | 0 (0.0%) | 1 (100.0%) |
| 18 to 24 Years | 0 (0.0%) | 0 (0.0%) |
| 25 to 34 Years | 0 (0.0%) | 0 (0.0%) |
| 35 to 44 Years | 0 (0.0%) | 1 (100.0%) |
| 45 to 54 Years | 0 (0.0%) | 0 (0.0%) |
| 55 to 64 Years | 5 (83.3%) | 3 (75.0%) |
| 65 to 74 Years | 0 (0.0%) | 0 (0.0%) |
| 75 Years and over | 0 (0.0%) | 0 (0.0%) |
| Total | 7 (87.5%) | 5 (83.3%) |
Income Below Poverty Among Married-Couple Families in Valley Park
The poverty statistics for married-couple families in Valley Park show that 25.0% or 1 of the total 4 families live below the poverty line. Families with no children have the highest poverty rate of 33.3%, comprising of 1 families. On the other hand, families with 1 or 2 children have the lowest poverty rate of 0.0%, which includes 0 families.
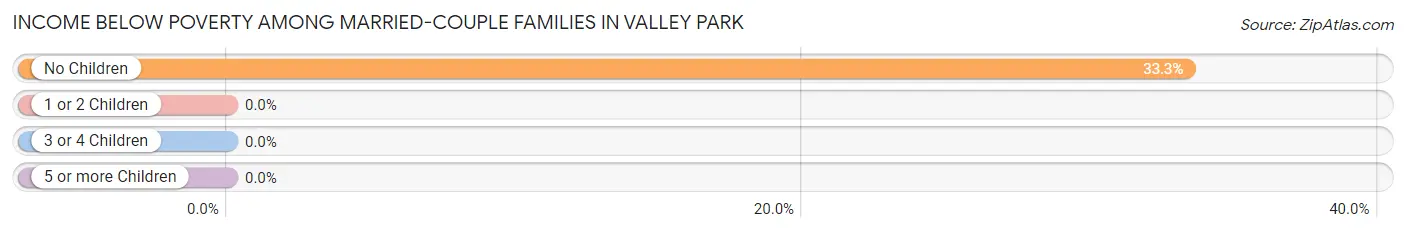
| Children | Above Poverty | Below Poverty |
| No Children | 2 (66.7%) | 1 (33.3%) |
| 1 or 2 Children | 1 (100.0%) | 0 (0.0%) |
| 3 or 4 Children | 0 (0.0%) | 0 (0.0%) |
| 5 or more Children | 0 (0.0%) | 0 (0.0%) |
| Total | 3 (75.0%) | 1 (25.0%) |
Income Below Poverty Among Single-Parent Households in Valley Park
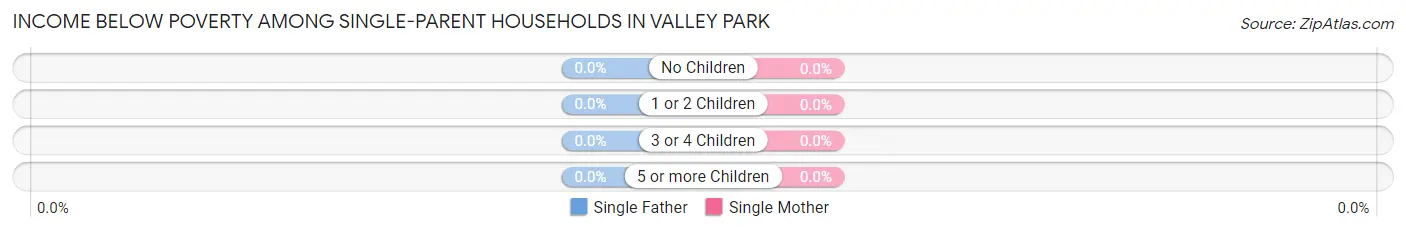
| Children | Single Father | Single Mother |
| No Children | 0 (0.0%) | 0 (0.0%) |
| 1 or 2 Children | 0 (0.0%) | 0 (0.0%) |
| 3 or 4 Children | 0 (0.0%) | 0 (0.0%) |
| 5 or more Children | 0 (0.0%) | 0 (0.0%) |
| Total | 0 (0.0%) | 0 (0.0%) |
Income Below Poverty Among Married-Couple vs Single-Parent Households in Valley Park
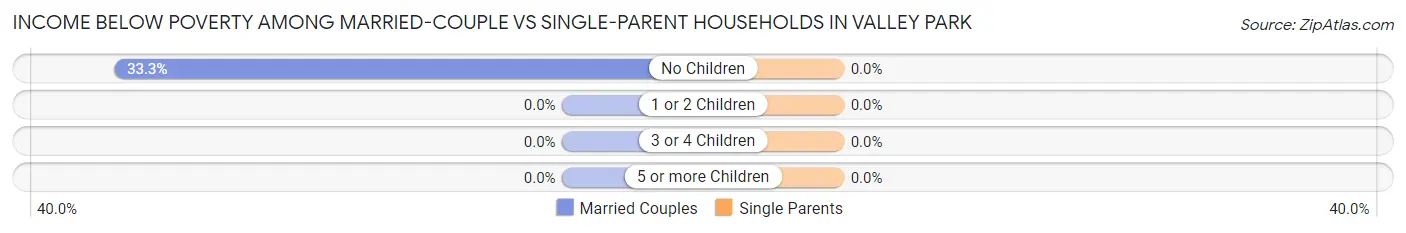
| Children | Married-Couple Families | Single-Parent Households |
| No Children | 1 (33.3%) | 0 (0.0%) |
| 1 or 2 Children | 0 (0.0%) | 0 (0.0%) |
| 3 or 4 Children | 0 (0.0%) | 0 (0.0%) |
| 5 or more Children | 0 (0.0%) | 0 (0.0%) |
| Total | 1 (25.0%) | 0 (0.0%) |
Race in Valley Park
The most populous races in Valley Park are White / Caucasian (10 | 71.4%), Hispanic or Latino (5 | 35.7%), and Two or more Races (4 | 28.6%).
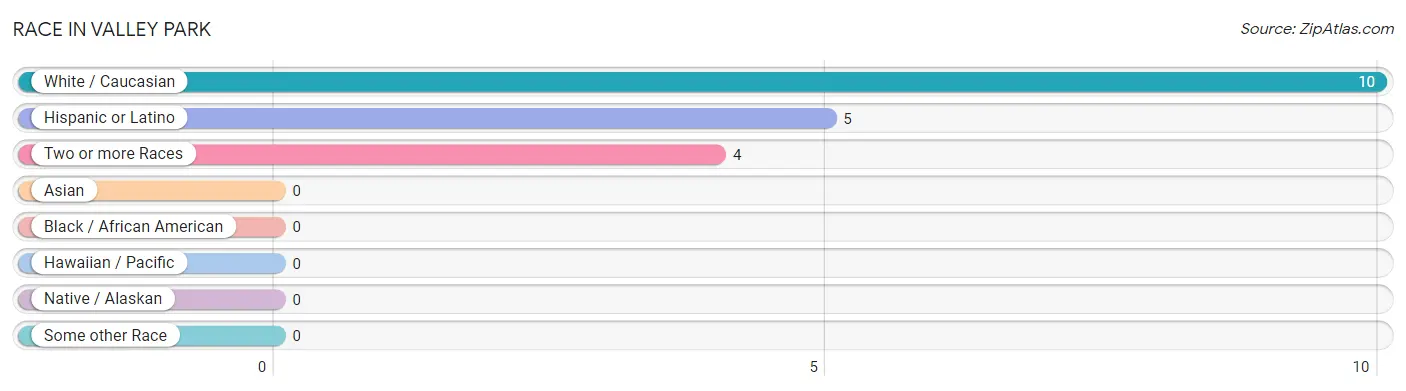
| Race | # Population | % Population |
| Asian | 0 | 0.0% |
| Black / African American | 0 | 0.0% |
| Hawaiian / Pacific | 0 | 0.0% |
| Hispanic or Latino | 5 | 35.7% |
| Native / Alaskan | 0 | 0.0% |
| White / Caucasian | 10 | 71.4% |
| Two or more Races | 4 | 28.6% |
| Some other Race | 0 | 0.0% |
| Total | 14 | 100.0% |
Ancestry in Valley Park
The most populous ancestries reported in Valley Park are Mexican (5 | 35.7%), Cherokee (2 | 14.3%), Irish (2 | 14.3%), English (1 | 7.1%), and European (1 | 7.1%), together accounting for 78.6% of all Valley Park residents.
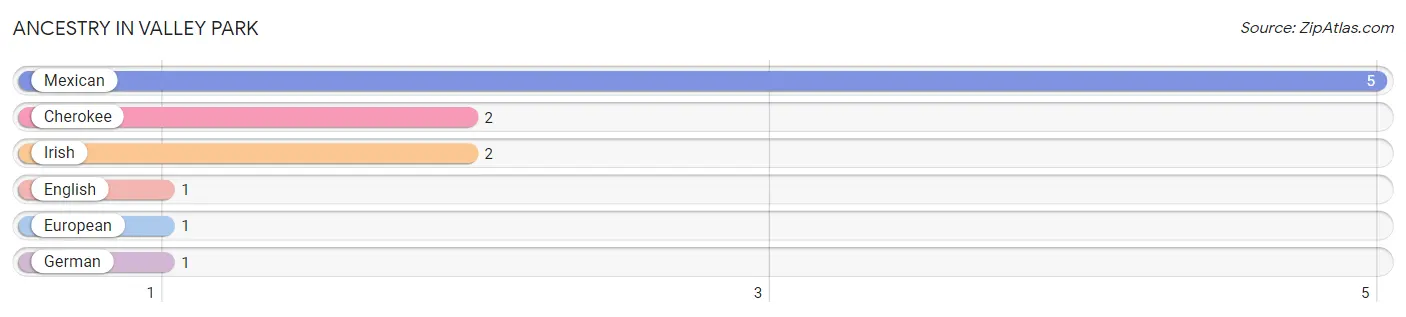
| Ancestry | # Population | % Population |
| Cherokee | 2 | 14.3% |
| English | 1 | 7.1% |
| European | 1 | 7.1% |
| German | 1 | 7.1% |
| Irish | 2 | 14.3% |
| Mexican | 5 | 35.7% | View All 6 Rows |
Immigrants in Valley Park

| Immigration Origin | # Population | % Population | View All 0 Rows |
Sex and Age in Valley Park
Sex and Age in Valley Park
The most populous age groups in Valley Park are 55 to 59 Years (3 | 37.5%) for men and 55 to 59 Years (4 | 66.7%) for women.
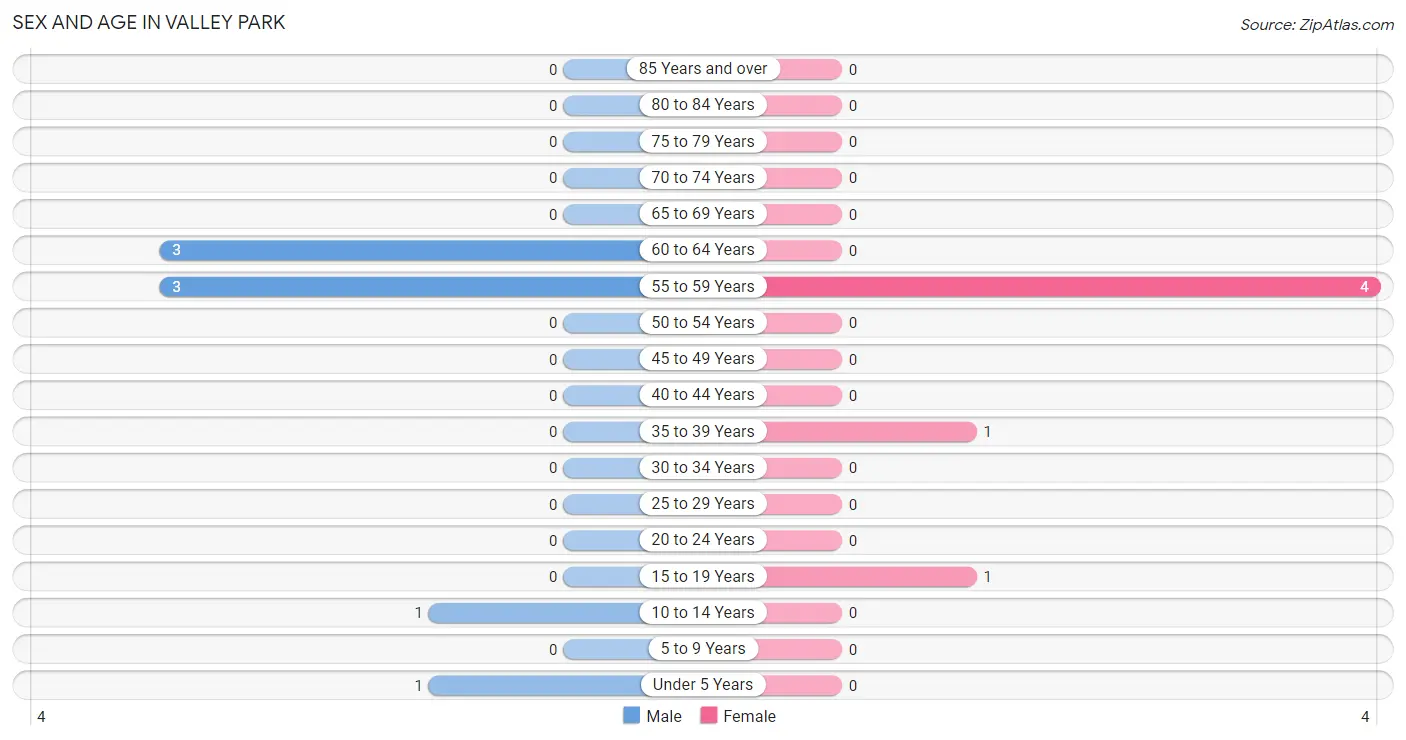
| Age Bracket | Male | Female |
| Under 5 Years | 1 (12.5%) | 0 (0.0%) |
| 5 to 9 Years | 0 (0.0%) | 0 (0.0%) |
| 10 to 14 Years | 1 (12.5%) | 0 (0.0%) |
| 15 to 19 Years | 0 (0.0%) | 1 (16.7%) |
| 20 to 24 Years | 0 (0.0%) | 0 (0.0%) |
| 25 to 29 Years | 0 (0.0%) | 0 (0.0%) |
| 30 to 34 Years | 0 (0.0%) | 0 (0.0%) |
| 35 to 39 Years | 0 (0.0%) | 1 (16.7%) |
| 40 to 44 Years | 0 (0.0%) | 0 (0.0%) |
| 45 to 49 Years | 0 (0.0%) | 0 (0.0%) |
| 50 to 54 Years | 0 (0.0%) | 0 (0.0%) |
| 55 to 59 Years | 3 (37.5%) | 4 (66.7%) |
| 60 to 64 Years | 3 (37.5%) | 0 (0.0%) |
| 65 to 69 Years | 0 (0.0%) | 0 (0.0%) |
| 70 to 74 Years | 0 (0.0%) | 0 (0.0%) |
| 75 to 79 Years | 0 (0.0%) | 0 (0.0%) |
| 80 to 84 Years | 0 (0.0%) | 0 (0.0%) |
| 85 Years and over | 0 (0.0%) | 0 (0.0%) |
| Total | 8 (100.0%) | 6 (100.0%) |
Families and Households in Valley Park
Median Family Size in Valley Park
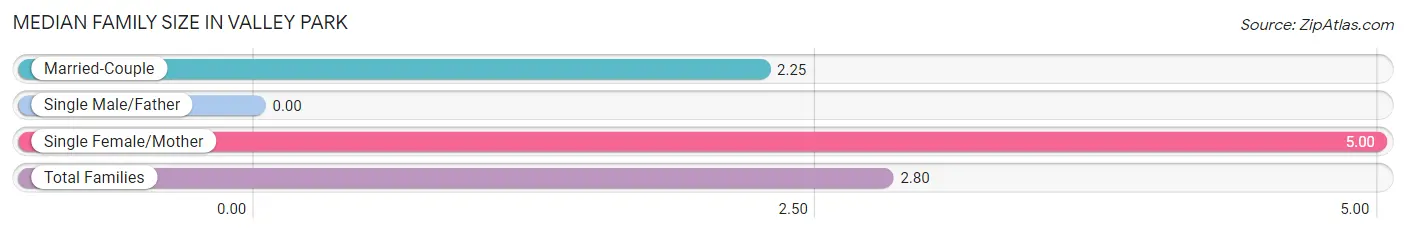
| Family Type | # Families | Family Size |
| Married-Couple | 4 (80.0%) | 2.25 |
| Single Male/Father | 0 (0.0%) | - |
| Single Female/Mother | 1 (20.0%) | 5.00 |
| Total Families | 5 (100.0%) | 2.80 |
Median Household Size in Valley Park
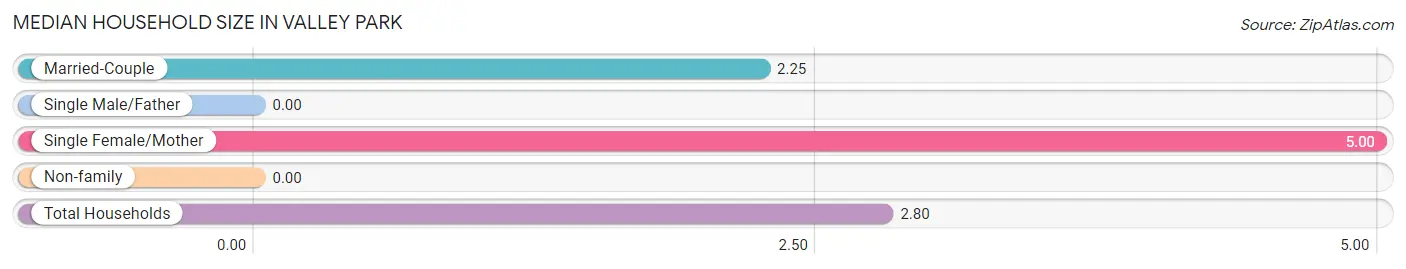
| Household Type | # Households | Household Size |
| Married-Couple | 4 (80.0%) | 2.25 |
| Single Male/Father | 0 (0.0%) | - |
| Single Female/Mother | 1 (20.0%) | 5.00 |
| Non-family | 0 (0.0%) | - |
| Total Households | 5 (100.0%) | 2.80 |
Household Size by Marriage Status in Valley Park
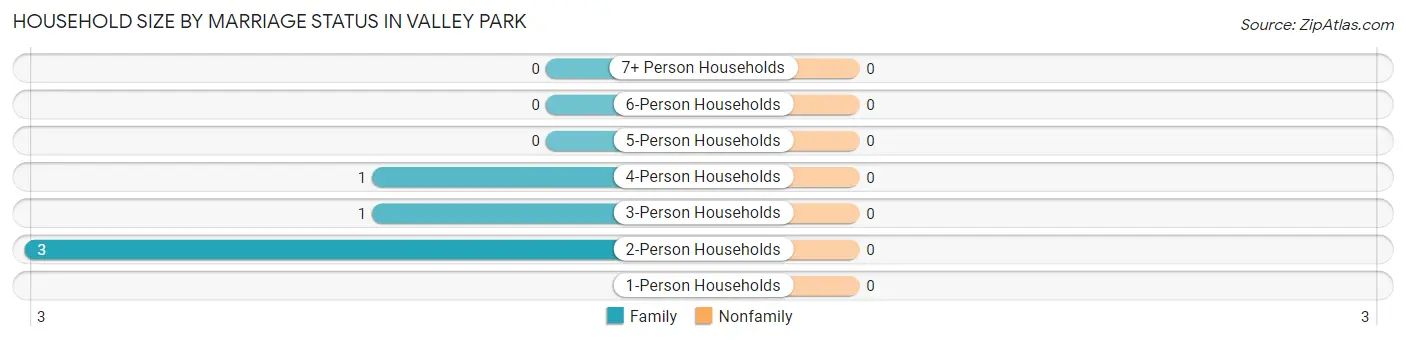
| Household Size | Family Households | Nonfamily Households |
| 1-Person Households | - | 0 (0.0%) |
| 2-Person Households | 3 (60.0%) | 0 (0.0%) |
| 3-Person Households | 1 (20.0%) | 0 (0.0%) |
| 4-Person Households | 1 (20.0%) | 0 (0.0%) |
| 5-Person Households | 0 (0.0%) | 0 (0.0%) |
| 6-Person Households | 0 (0.0%) | 0 (0.0%) |
| 7+ Person Households | 0 (0.0%) | 0 (0.0%) |
| Total | 5 (100.0%) | 0 (0.0%) |
Female Fertility in Valley Park
Fertility by Age in Valley Park
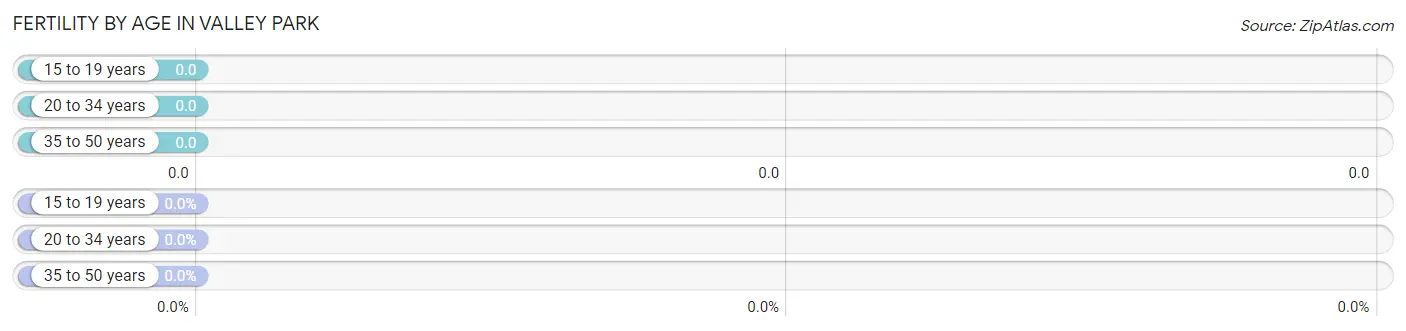
| Age Bracket | Women with Births | Births / 1,000 Women |
| 15 to 19 years | 0 (0.0%) | 0.0 |
| 20 to 34 years | 0 (0.0%) | 0.0 |
| 35 to 50 years | 0 (0.0%) | 0.0 |
| Total | 0 (0.0%) | 0.0 |
Fertility by Age by Marriage Status in Valley Park
| Age Bracket | Married | Unmarried |
| 15 to 19 years | 0 (0.0%) | 0 (0.0%) |
| 20 to 34 years | 0 (0.0%) | 0 (0.0%) |
| 35 to 50 years | 0 (0.0%) | 0 (0.0%) |
| Total | 0 (0.0%) | 0 (0.0%) |
Fertility by Education in Valley Park
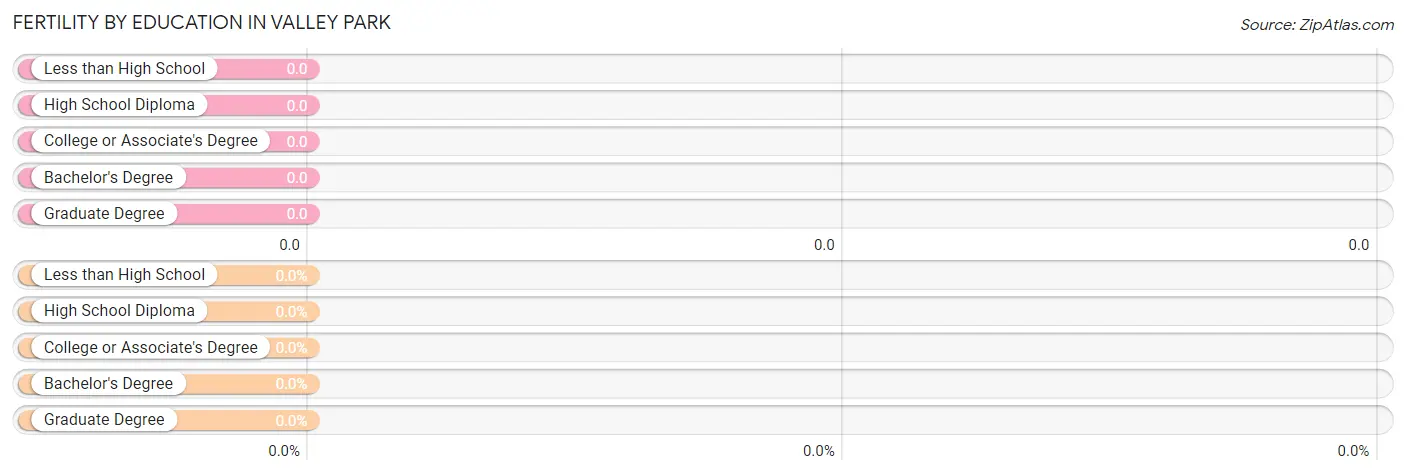
| Educational Attainment | Women with Births | Births / 1,000 Women |
| Less than High School | 0 (0.0%) | 0.0 |
| High School Diploma | 0 (0.0%) | 0.0 |
| College or Associate's Degree | 0 (0.0%) | 0.0 |
| Bachelor's Degree | 0 (0.0%) | 0.0 |
| Graduate Degree | 0 (0.0%) | 0.0 |
| Total | 0 (0.0%) | 0.0 |
Fertility by Education by Marriage Status in Valley Park
| Educational Attainment | Married | Unmarried |
| Less than High School | 0 (0.0%) | 0 (0.0%) |
| High School Diploma | 0 (0.0%) | 0 (0.0%) |
| College or Associate's Degree | 0 (0.0%) | 0 (0.0%) |
| Bachelor's Degree | 0 (0.0%) | 0 (0.0%) |
| Graduate Degree | 0 (0.0%) | 0 (0.0%) |
| Total | 0 (0.0%) | 0 (0.0%) |
Employment Characteristics in Valley Park
Employment by Class of Employer in Valley Park
Among the 9 employed individuals in Valley Park, private company employees (6 | 66.7%), self-employed (not incorporated) (1 | 11.1%), and not-for-profit organizations (1 | 11.1%) make up the most common classes of employment.
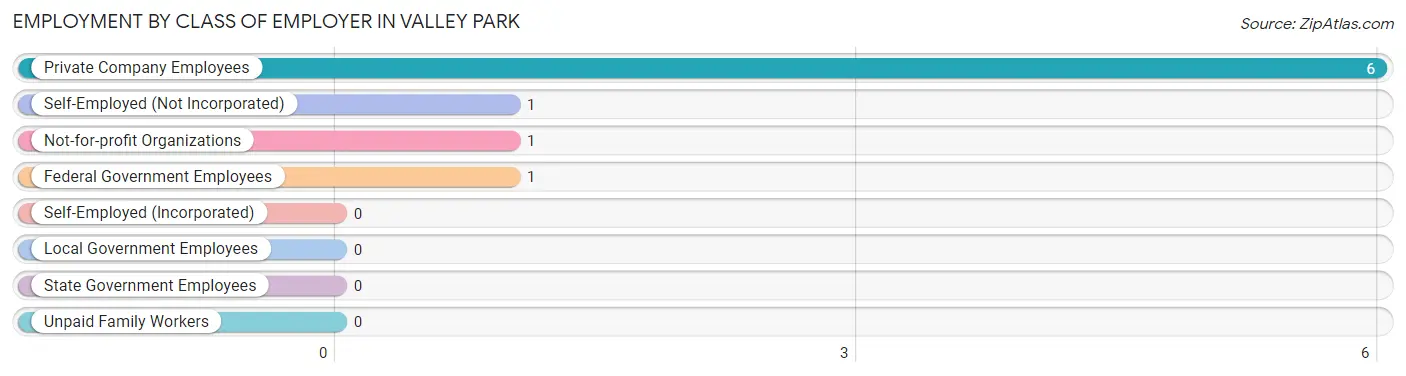
| Employer Class | # Employees | % Employees |
| Private Company Employees | 6 | 66.7% |
| Self-Employed (Incorporated) | 0 | 0.0% |
| Self-Employed (Not Incorporated) | 1 | 11.1% |
| Not-for-profit Organizations | 1 | 11.1% |
| Local Government Employees | 0 | 0.0% |
| State Government Employees | 0 | 0.0% |
| Federal Government Employees | 1 | 11.1% |
| Unpaid Family Workers | 0 | 0.0% |
| Total | 9 | 100.0% |
Employment Status by Age in Valley Park
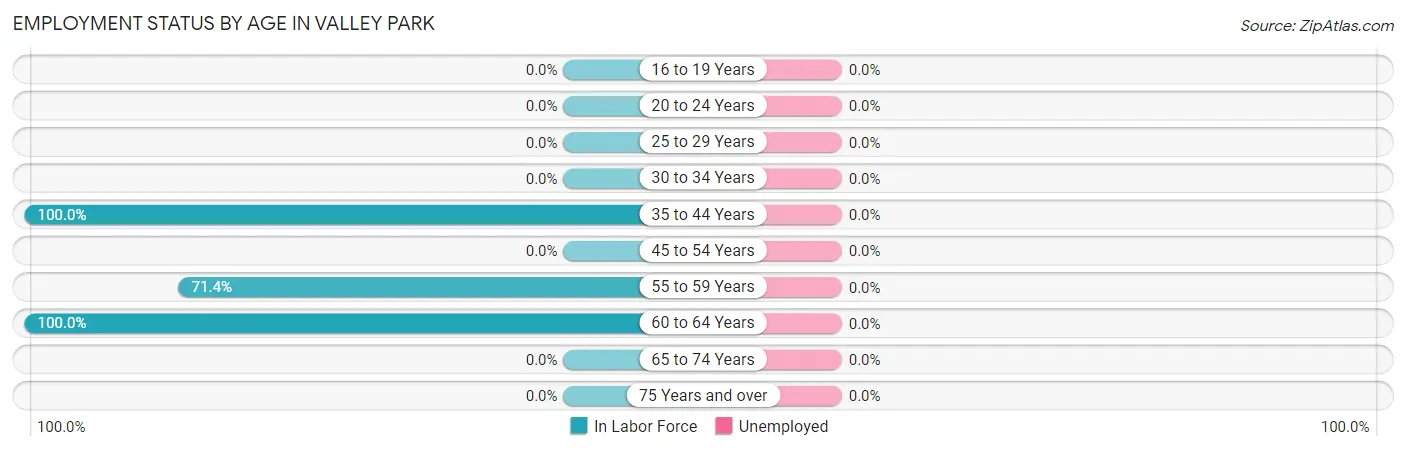
| Age Bracket | In Labor Force | Unemployed |
| 16 to 19 Years | 0 (0.0%) | 0 (0.0%) |
| 20 to 24 Years | 0 (0.0%) | 0 (0.0%) |
| 25 to 29 Years | 0 (0.0%) | 0 (0.0%) |
| 30 to 34 Years | 0 (0.0%) | 0 (0.0%) |
| 35 to 44 Years | 1 (100.0%) | 0 (0.0%) |
| 45 to 54 Years | 0 (0.0%) | 0 (0.0%) |
| 55 to 59 Years | 5 (71.4%) | 0 (0.0%) |
| 60 to 64 Years | 3 (100.0%) | 0 (0.0%) |
| 65 to 74 Years | 0 (0.0%) | 0 (0.0%) |
| 75 Years and over | 0 (0.0%) | 0 (0.0%) |
| Total | 9 (75.0%) | 0 (0.0%) |
Employment Status by Educational Attainment in Valley Park
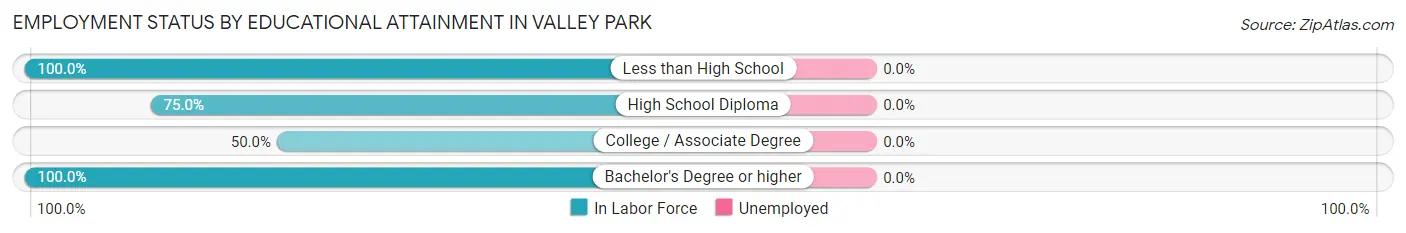
| Educational Attainment | In Labor Force | Unemployed |
| Less than High School | 1 (100.0%) | 0 (0.0%) |
| High School Diploma | 3 (75.0%) | 0 (0.0%) |
| College / Associate Degree | 1 (50.0%) | 0 (0.0%) |
| Bachelor's Degree or higher | 4 (100.0%) | 0 (0.0%) |
| Total | 9 (81.8%) | 0 (0.0%) |
Employment Occupations by Sex in Valley Park
Management, Business, Science and Arts Occupations
The most common Management, Business, Science and Arts occupations in Valley Park are Management (3 | 33.3%), Community & Social Service (1 | 11.1%), and Education Instruction & Library (1 | 11.1%).
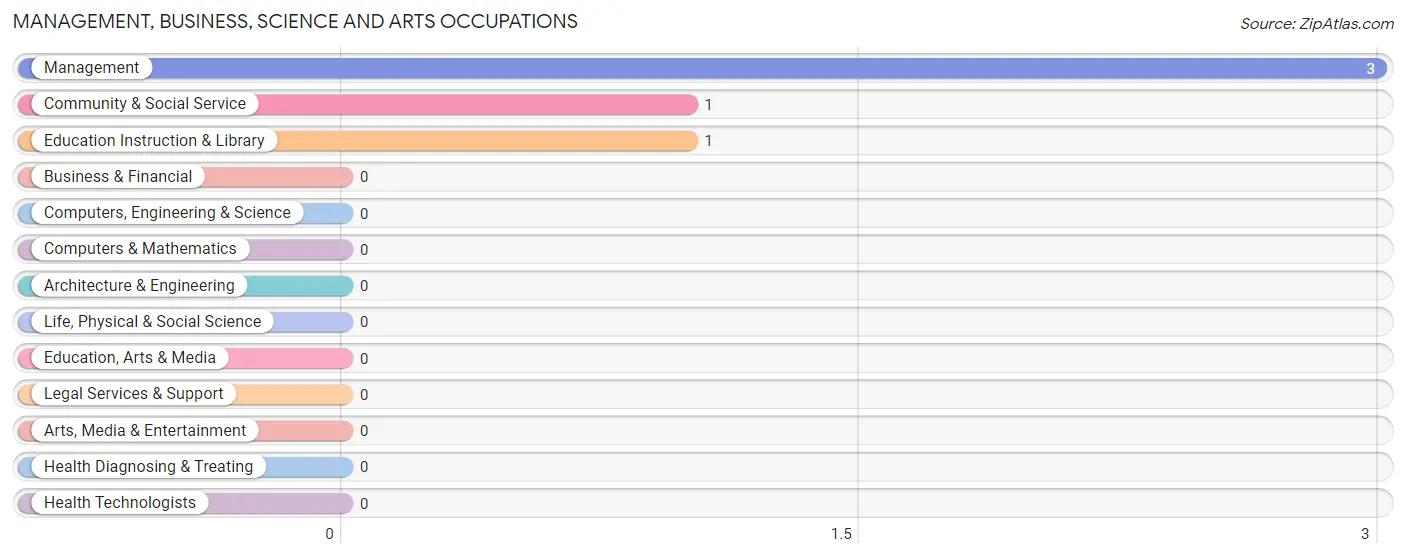
Management, Business, Science and Arts Occupations by Sex
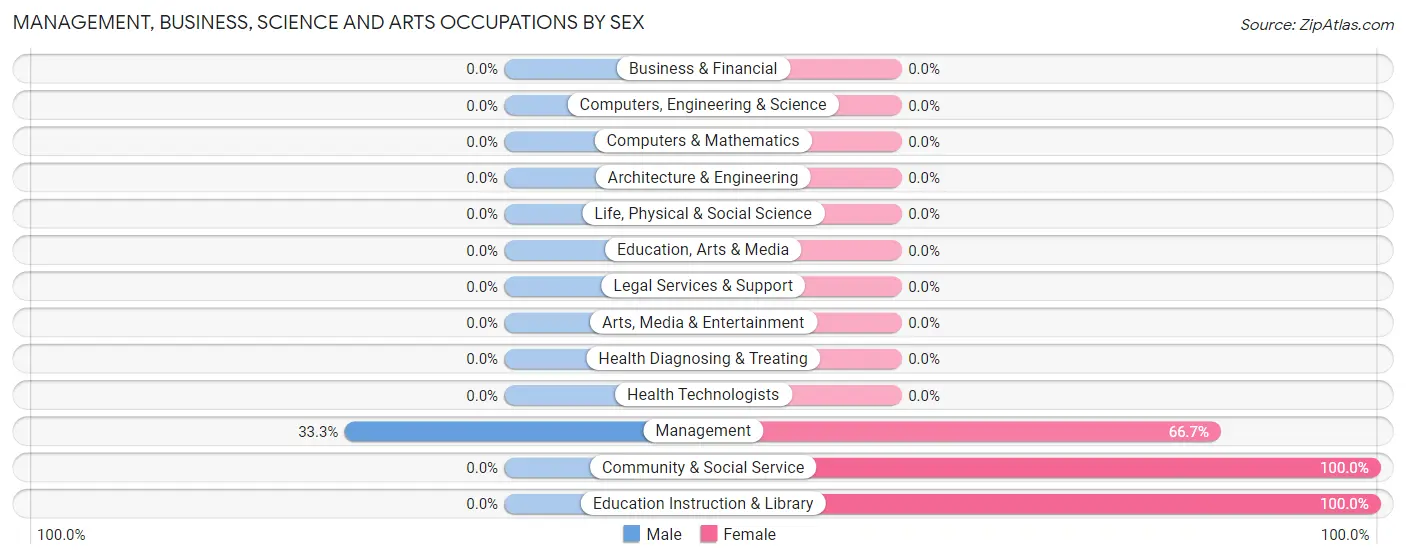
| Occupation | Male | Female |
| Management | 1 (33.3%) | 2 (66.7%) |
| Business & Financial | 0 (0.0%) | 0 (0.0%) |
| Computers, Engineering & Science | 0 (0.0%) | 0 (0.0%) |
| Computers & Mathematics | 0 (0.0%) | 0 (0.0%) |
| Architecture & Engineering | 0 (0.0%) | 0 (0.0%) |
| Life, Physical & Social Science | 0 (0.0%) | 0 (0.0%) |
| Community & Social Service | 0 (0.0%) | 1 (100.0%) |
| Education, Arts & Media | 0 (0.0%) | 0 (0.0%) |
| Legal Services & Support | 0 (0.0%) | 0 (0.0%) |
| Education Instruction & Library | 0 (0.0%) | 1 (100.0%) |
| Arts, Media & Entertainment | 0 (0.0%) | 0 (0.0%) |
| Health Diagnosing & Treating | 0 (0.0%) | 0 (0.0%) |
| Health Technologists | 0 (0.0%) | 0 (0.0%) |
| Total (Category) | 1 (25.0%) | 3 (75.0%) |
| Total (Overall) | 5 (55.6%) | 4 (44.4%) |
Services Occupations
The most common Services occupations in Valley Park are , and Cleaning & Maintenance (2 | 22.2%).
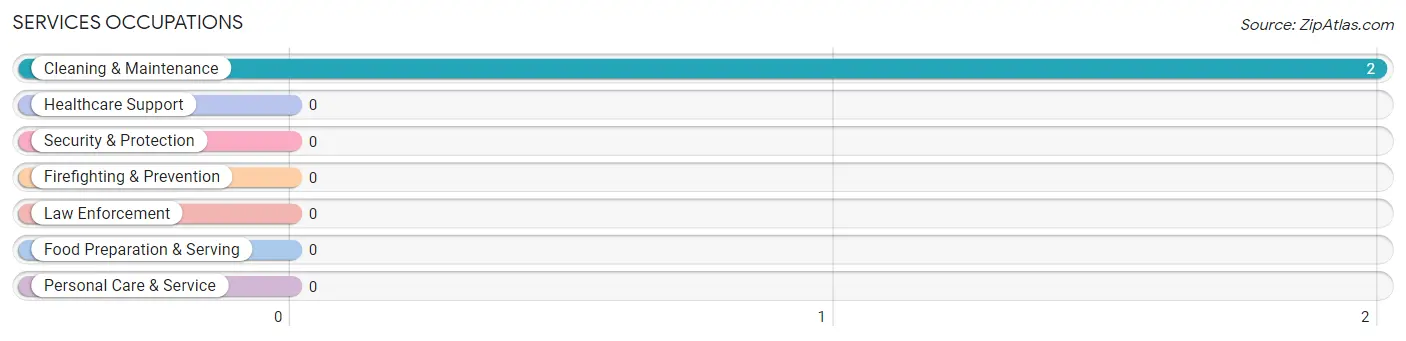
Services Occupations by Sex
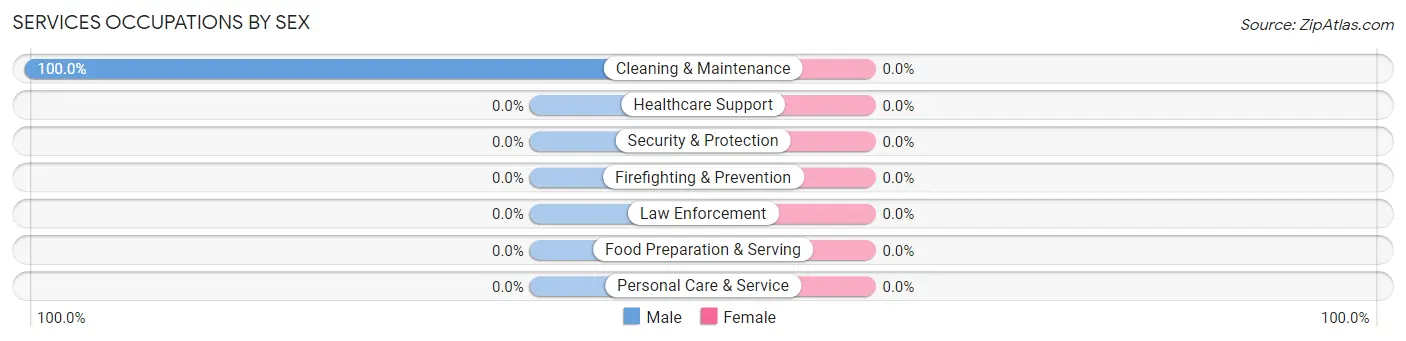
| Occupation | Male | Female |
| Healthcare Support | 0 (0.0%) | 0 (0.0%) |
| Security & Protection | 0 (0.0%) | 0 (0.0%) |
| Firefighting & Prevention | 0 (0.0%) | 0 (0.0%) |
| Law Enforcement | 0 (0.0%) | 0 (0.0%) |
| Food Preparation & Serving | 0 (0.0%) | 0 (0.0%) |
| Cleaning & Maintenance | 2 (100.0%) | 0 (0.0%) |
| Personal Care & Service | 0 (0.0%) | 0 (0.0%) |
| Total (Category) | 2 (100.0%) | 0 (0.0%) |
| Total (Overall) | 5 (55.6%) | 4 (44.4%) |
Sales and Office Occupations
The most common Sales and Office occupations in Valley Park are , and Sales & Related (1 | 11.1%).
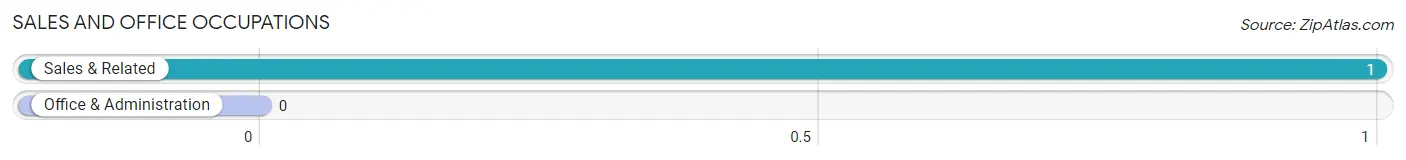
Sales and Office Occupations by Sex
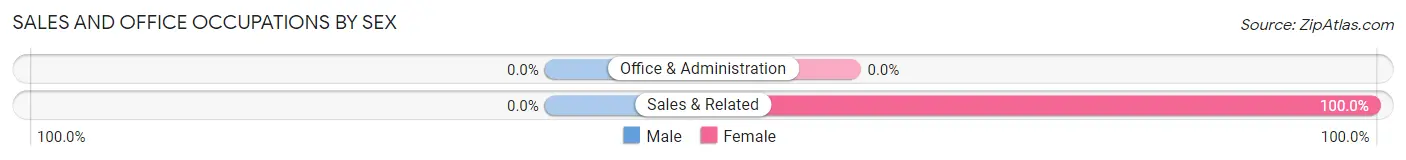
| Occupation | Male | Female |
| Sales & Related | 0 (0.0%) | 1 (100.0%) |
| Office & Administration | 0 (0.0%) | 0 (0.0%) |
| Total (Category) | 0 (0.0%) | 1 (100.0%) |
| Total (Overall) | 5 (55.6%) | 4 (44.4%) |
Natural Resources, Construction and Maintenance Occupations
The most common Natural Resources, Construction and Maintenance occupations in Valley Park are Farming, Fishing & Forestry (1 | 11.1%), and Installation, Maintenance & Repair (1 | 11.1%).
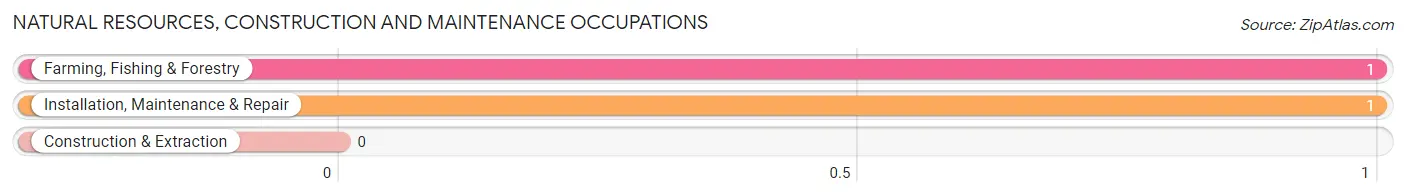
Natural Resources, Construction and Maintenance Occupations by Sex
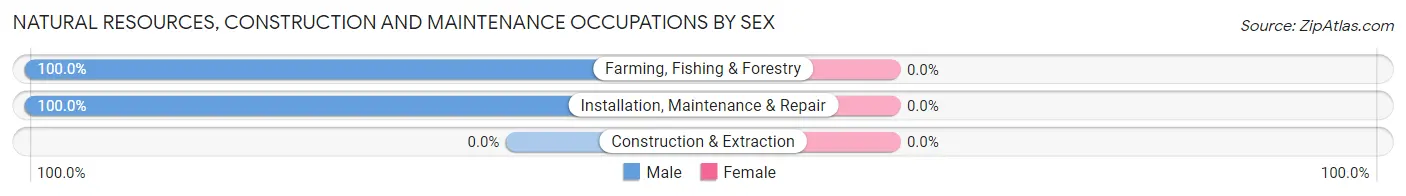
| Occupation | Male | Female |
| Farming, Fishing & Forestry | 1 (100.0%) | 0 (0.0%) |
| Construction & Extraction | 0 (0.0%) | 0 (0.0%) |
| Installation, Maintenance & Repair | 1 (100.0%) | 0 (0.0%) |
| Total (Category) | 2 (100.0%) | 0 (0.0%) |
| Total (Overall) | 5 (55.6%) | 4 (44.4%) |
Production, Transportation and Moving Occupations
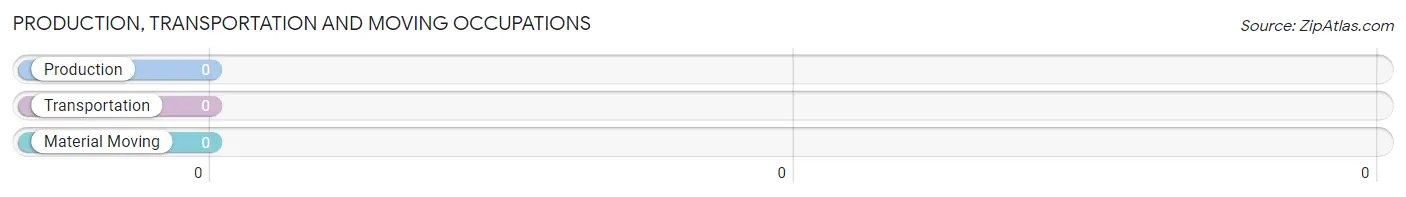
Production, Transportation and Moving Occupations by Sex
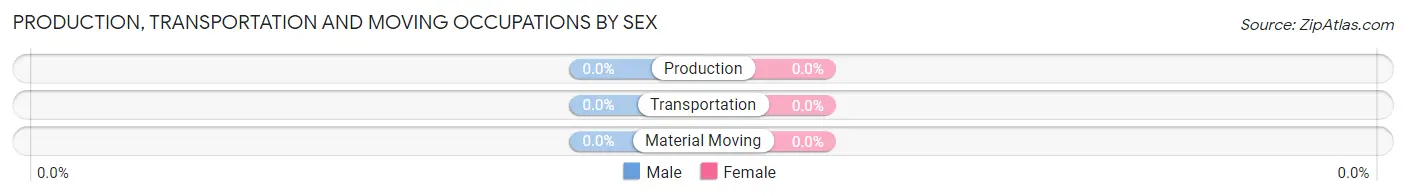
| Occupation | Male | Female |
| Production | 0 (0.0%) | 0 (0.0%) |
| Transportation | 0 (0.0%) | 0 (0.0%) |
| Material Moving | 0 (0.0%) | 0 (0.0%) |
| Total (Category) | 0 (0.0%) | 0 (0.0%) |
| Total (Overall) | 5 (55.6%) | 4 (44.4%) |
Employment Industries by Sex in Valley Park
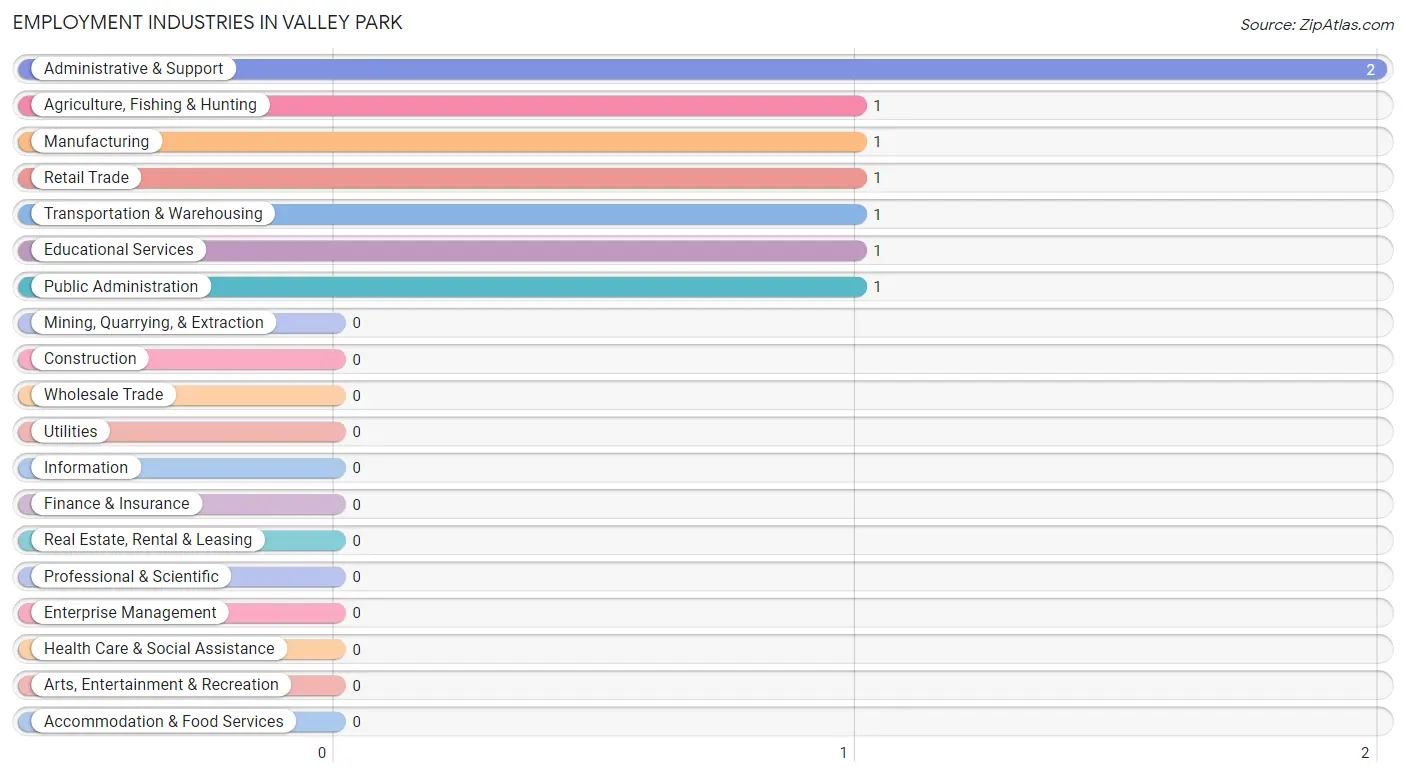
Employment Industries in Valley Park
The major employment industries in Valley Park include Administrative & Support (2 | 22.2%), Agriculture, Fishing & Hunting (1 | 11.1%), Manufacturing (1 | 11.1%), Retail Trade (1 | 11.1%), and Transportation & Warehousing (1 | 11.1%).
Employment Industries by Sex in Valley Park
The Valley Park industries that see more men than women are Agriculture, Fishing & Hunting (100.0%), Transportation & Warehousing (100.0%), and Administrative & Support (100.0%), whereas the industries that tend to have a higher number of women are Manufacturing (100.0%), Retail Trade (100.0%), and Educational Services (100.0%).
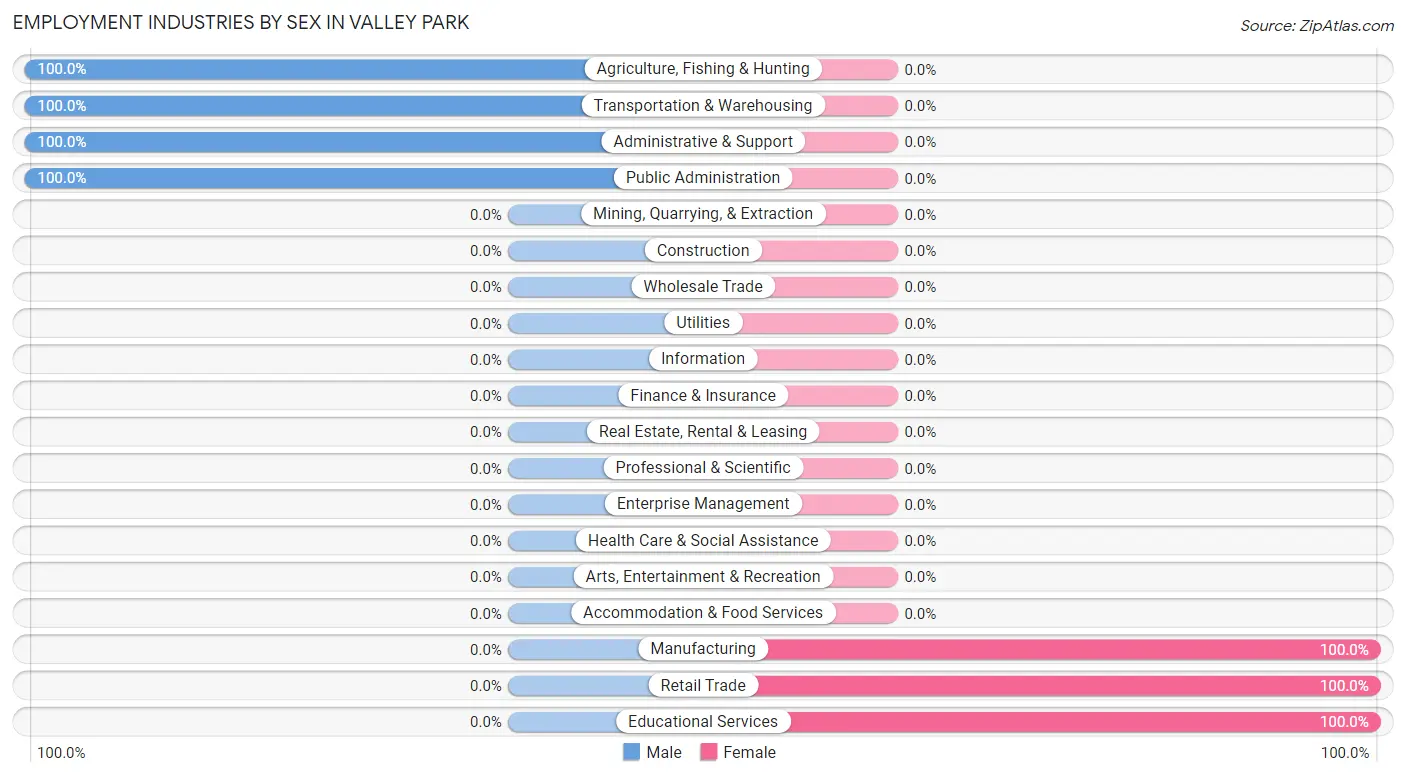
| Industry | Male | Female |
| Agriculture, Fishing & Hunting | 1 (100.0%) | 0 (0.0%) |
| Mining, Quarrying, & Extraction | 0 (0.0%) | 0 (0.0%) |
| Construction | 0 (0.0%) | 0 (0.0%) |
| Manufacturing | 0 (0.0%) | 1 (100.0%) |
| Wholesale Trade | 0 (0.0%) | 0 (0.0%) |
| Retail Trade | 0 (0.0%) | 1 (100.0%) |
| Transportation & Warehousing | 1 (100.0%) | 0 (0.0%) |
| Utilities | 0 (0.0%) | 0 (0.0%) |
| Information | 0 (0.0%) | 0 (0.0%) |
| Finance & Insurance | 0 (0.0%) | 0 (0.0%) |
| Real Estate, Rental & Leasing | 0 (0.0%) | 0 (0.0%) |
| Professional & Scientific | 0 (0.0%) | 0 (0.0%) |
| Enterprise Management | 0 (0.0%) | 0 (0.0%) |
| Administrative & Support | 2 (100.0%) | 0 (0.0%) |
| Educational Services | 0 (0.0%) | 1 (100.0%) |
| Health Care & Social Assistance | 0 (0.0%) | 0 (0.0%) |
| Arts, Entertainment & Recreation | 0 (0.0%) | 0 (0.0%) |
| Accommodation & Food Services | 0 (0.0%) | 0 (0.0%) |
| Public Administration | 1 (100.0%) | 0 (0.0%) |
| Total | 5 (55.6%) | 4 (44.4%) |
Education in Valley Park
School Enrollment in Valley Park
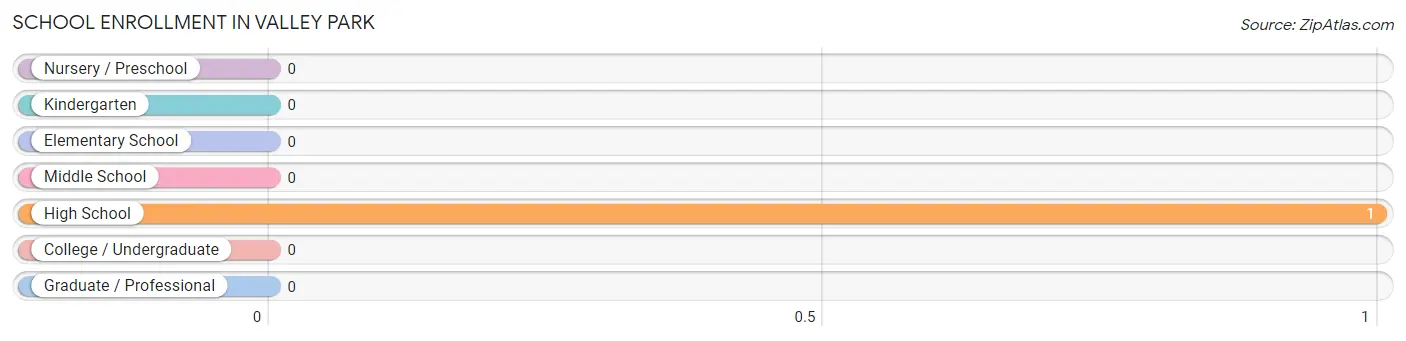
| School Level | # Students | % Students |
| Nursery / Preschool | 0 | 0.0% |
| Kindergarten | 0 | 0.0% |
| Elementary School | 0 | 0.0% |
| Middle School | 0 | 0.0% |
| High School | 1 | 100.0% |
| College / Undergraduate | 0 | 0.0% |
| Graduate / Professional | 0 | 0.0% |
| Total | 1 | 100.0% |
School Enrollment by Age by Funding Source in Valley Park
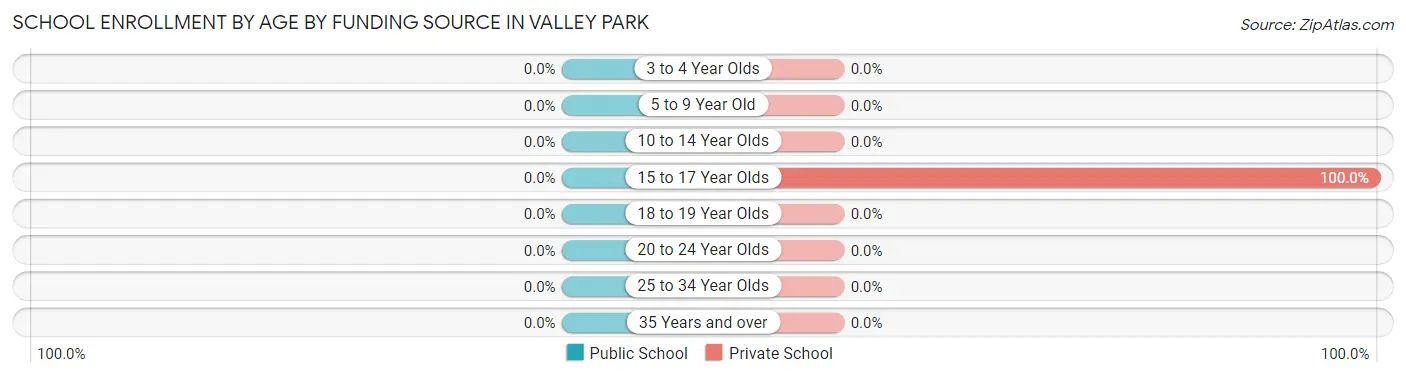
| Age Bracket | Public School | Private School |
| 3 to 4 Year Olds | 0 (0.0%) | 0 (0.0%) |
| 5 to 9 Year Old | 0 (0.0%) | 0 (0.0%) |
| 10 to 14 Year Olds | 0 (0.0%) | 0 (0.0%) |
| 15 to 17 Year Olds | 0 (0.0%) | 1 (100.0%) |
| 18 to 19 Year Olds | 0 (0.0%) | 0 (0.0%) |
| 20 to 24 Year Olds | 0 (0.0%) | 0 (0.0%) |
| 25 to 34 Year Olds | 0 (0.0%) | 0 (0.0%) |
| 35 Years and over | 0 (0.0%) | 0 (0.0%) |
| Total | 0 (0.0%) | 1 (100.0%) |
Educational Attainment by Field of Study in Valley Park
Social sciences (1 | 20.0%), engineering (1 | 20.0%), science & technology (1 | 20.0%), business (1 | 20.0%), and arts & humanities (1 | 20.0%) are the most common fields of study among 5 individuals in Valley Park who have obtained a bachelor's degree or higher.
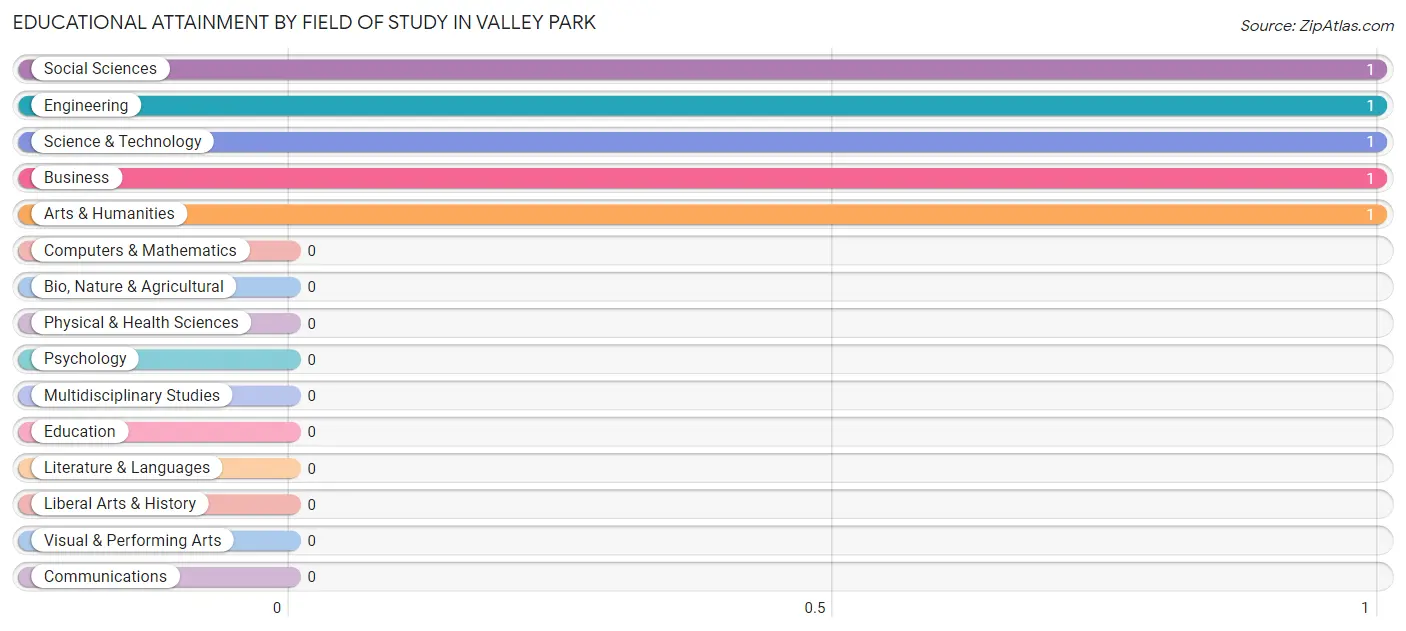
| Field of Study | # Graduates | % Graduates |
| Computers & Mathematics | 0 | 0.0% |
| Bio, Nature & Agricultural | 0 | 0.0% |
| Physical & Health Sciences | 0 | 0.0% |
| Psychology | 0 | 0.0% |
| Social Sciences | 1 | 20.0% |
| Engineering | 1 | 20.0% |
| Multidisciplinary Studies | 0 | 0.0% |
| Science & Technology | 1 | 20.0% |
| Business | 1 | 20.0% |
| Education | 0 | 0.0% |
| Literature & Languages | 0 | 0.0% |
| Liberal Arts & History | 0 | 0.0% |
| Visual & Performing Arts | 0 | 0.0% |
| Communications | 0 | 0.0% |
| Arts & Humanities | 1 | 20.0% |
| Total | 5 | 100.0% |
Transportation & Commute in Valley Park
Vehicle Availability by Sex in Valley Park
The most prevalent vehicle ownership categories in Valley Park are males with 2 vehicles (4, accounting for 80.0%) and females with 2 vehicles (2, making up 100.0%).
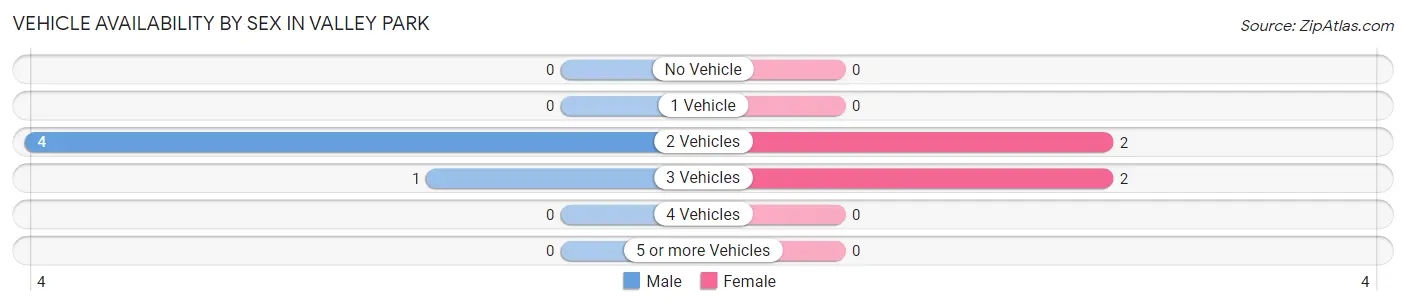
| Vehicles Available | Male | Female |
| No Vehicle | 0 (0.0%) | 0 (0.0%) |
| 1 Vehicle | 0 (0.0%) | 0 (0.0%) |
| 2 Vehicles | 4 (80.0%) | 2 (50.0%) |
| 3 Vehicles | 1 (20.0%) | 2 (50.0%) |
| 4 Vehicles | 0 (0.0%) | 0 (0.0%) |
| 5 or more Vehicles | 0 (0.0%) | 0 (0.0%) |
| Total | 5 (100.0%) | 4 (100.0%) |
Commute Time in Valley Park
The most frequently occuring commute durations in Valley Park are 20 to 24 minutes (3 commuters, 50.0%), 40 to 44 minutes (1 commuters, 16.7%), and 45 to 59 minutes (1 commuters, 16.7%).
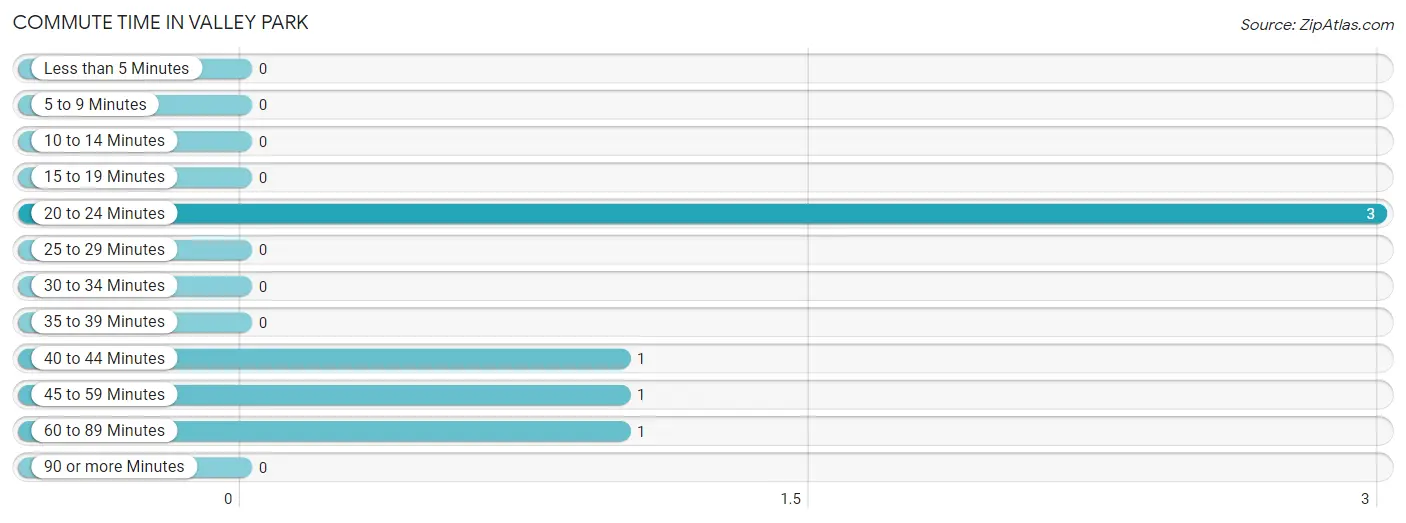
| Commute Time | # Commuters | % Commuters |
| Less than 5 Minutes | 0 | 0.0% |
| 5 to 9 Minutes | 0 | 0.0% |
| 10 to 14 Minutes | 0 | 0.0% |
| 15 to 19 Minutes | 0 | 0.0% |
| 20 to 24 Minutes | 3 | 50.0% |
| 25 to 29 Minutes | 0 | 0.0% |
| 30 to 34 Minutes | 0 | 0.0% |
| 35 to 39 Minutes | 0 | 0.0% |
| 40 to 44 Minutes | 1 | 16.7% |
| 45 to 59 Minutes | 1 | 16.7% |
| 60 to 89 Minutes | 1 | 16.7% |
| 90 or more Minutes | 0 | 0.0% |
Commute Time by Sex in Valley Park
The most common commute times in Valley Park are 20 to 24 minutes (1 commuters, 33.3%) for males and 20 to 24 minutes (2 commuters, 66.7%) for females.
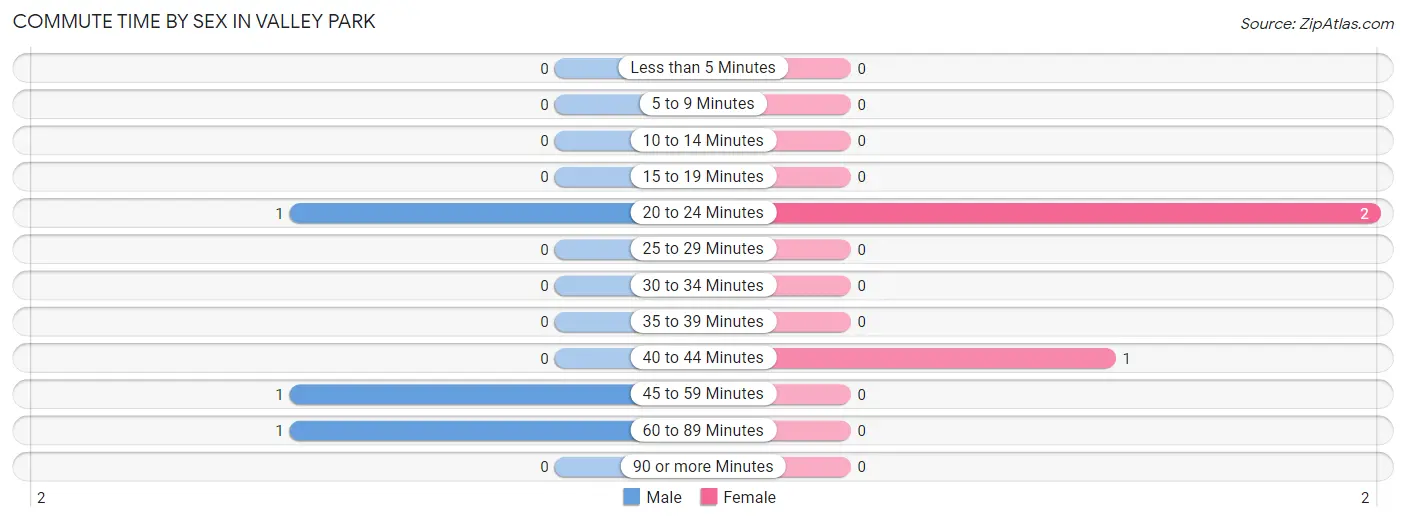
| Commute Time | Male | Female |
| Less than 5 Minutes | 0 (0.0%) | 0 (0.0%) |
| 5 to 9 Minutes | 0 (0.0%) | 0 (0.0%) |
| 10 to 14 Minutes | 0 (0.0%) | 0 (0.0%) |
| 15 to 19 Minutes | 0 (0.0%) | 0 (0.0%) |
| 20 to 24 Minutes | 1 (33.3%) | 2 (66.7%) |
| 25 to 29 Minutes | 0 (0.0%) | 0 (0.0%) |
| 30 to 34 Minutes | 0 (0.0%) | 0 (0.0%) |
| 35 to 39 Minutes | 0 (0.0%) | 0 (0.0%) |
| 40 to 44 Minutes | 0 (0.0%) | 1 (33.3%) |
| 45 to 59 Minutes | 1 (33.3%) | 0 (0.0%) |
| 60 to 89 Minutes | 1 (33.3%) | 0 (0.0%) |
| 90 or more Minutes | 0 (0.0%) | 0 (0.0%) |
Time of Departure to Work by Sex in Valley Park
The most frequent times of departure to work in Valley Park are 6:00 AM to 6:29 AM (1, 33.3%) for males and 12:00 AM to 4:59 AM (1, 33.3%) for females.
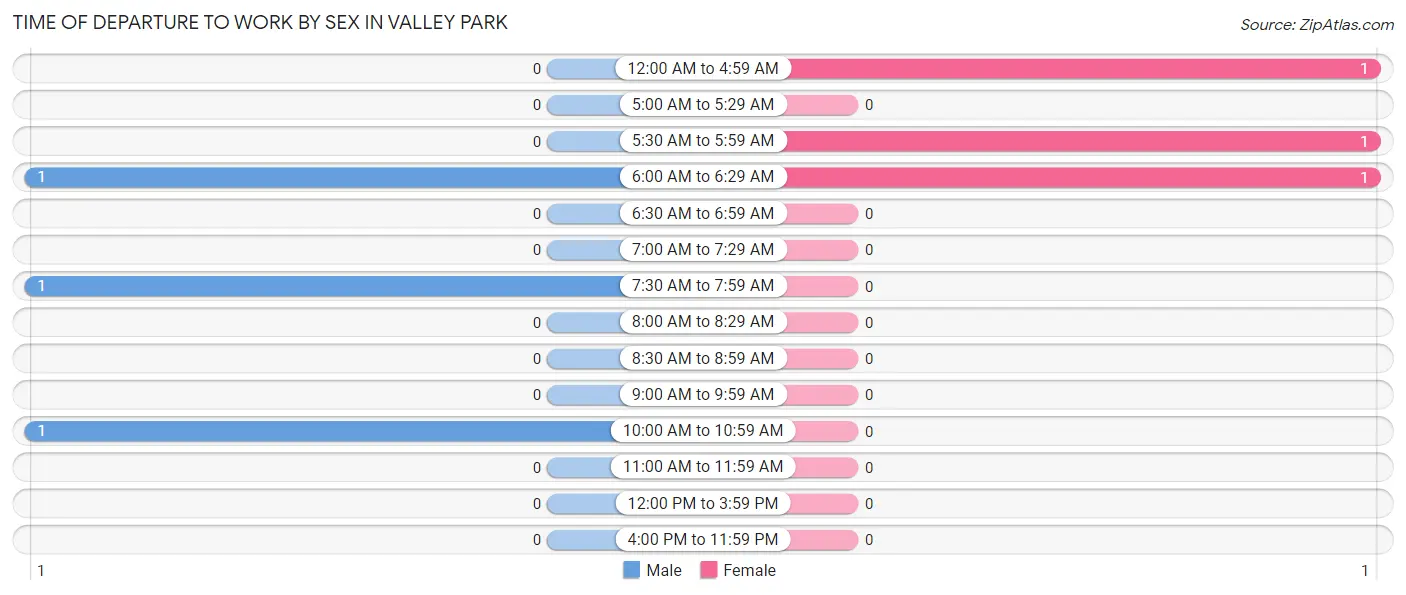
| Time of Departure | Male | Female |
| 12:00 AM to 4:59 AM | 0 (0.0%) | 1 (33.3%) |
| 5:00 AM to 5:29 AM | 0 (0.0%) | 0 (0.0%) |
| 5:30 AM to 5:59 AM | 0 (0.0%) | 1 (33.3%) |
| 6:00 AM to 6:29 AM | 1 (33.3%) | 1 (33.3%) |
| 6:30 AM to 6:59 AM | 0 (0.0%) | 0 (0.0%) |
| 7:00 AM to 7:29 AM | 0 (0.0%) | 0 (0.0%) |
| 7:30 AM to 7:59 AM | 1 (33.3%) | 0 (0.0%) |
| 8:00 AM to 8:29 AM | 0 (0.0%) | 0 (0.0%) |
| 8:30 AM to 8:59 AM | 0 (0.0%) | 0 (0.0%) |
| 9:00 AM to 9:59 AM | 0 (0.0%) | 0 (0.0%) |
| 10:00 AM to 10:59 AM | 1 (33.3%) | 0 (0.0%) |
| 11:00 AM to 11:59 AM | 0 (0.0%) | 0 (0.0%) |
| 12:00 PM to 3:59 PM | 0 (0.0%) | 0 (0.0%) |
| 4:00 PM to 11:59 PM | 0 (0.0%) | 0 (0.0%) |
| Total | 3 (100.0%) | 3 (100.0%) |
Housing Occupancy in Valley Park
Occupancy by Ownership in Valley Park
Of the total 5 dwellings in Valley Park, owner-occupied units account for 4 (80.0%), while renter-occupied units make up 1 (20.0%).
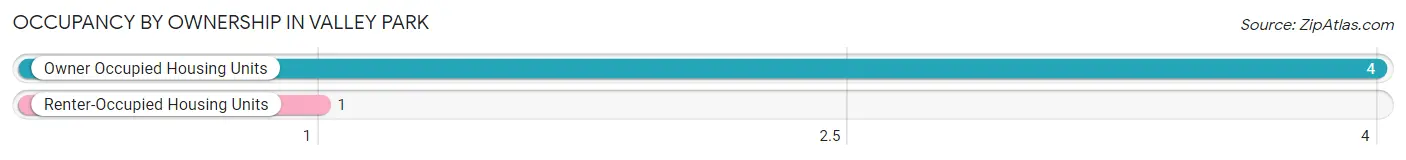
| Occupancy | # Housing Units | % Housing Units |
| Owner Occupied Housing Units | 4 | 80.0% |
| Renter-Occupied Housing Units | 1 | 20.0% |
| Total Occupied Housing Units | 5 | 100.0% |
Occupancy by Household Size in Valley Park
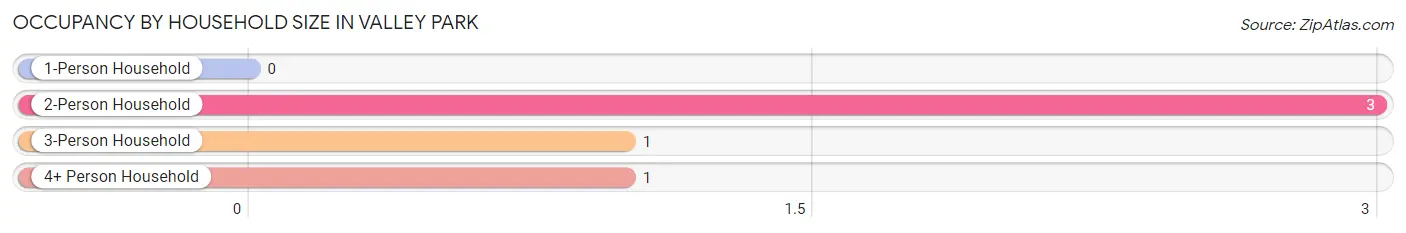
| Household Size | # Housing Units | % Housing Units |
| 1-Person Household | 0 | 0.0% |
| 2-Person Household | 3 | 60.0% |
| 3-Person Household | 1 | 20.0% |
| 4+ Person Household | 1 | 20.0% |
| Total Housing Units | 5 | 100.0% |
Occupancy by Ownership by Household Size in Valley Park
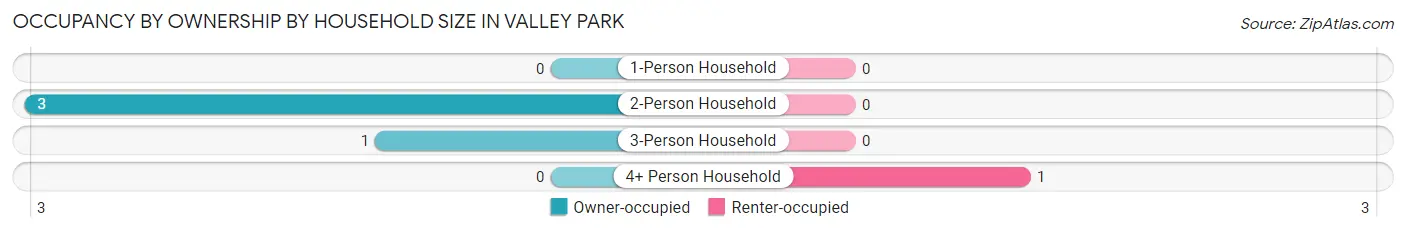
| Household Size | Owner-occupied | Renter-occupied |
| 1-Person Household | 0 (0.0%) | 0 (0.0%) |
| 2-Person Household | 3 (100.0%) | 0 (0.0%) |
| 3-Person Household | 1 (100.0%) | 0 (0.0%) |
| 4+ Person Household | 0 (0.0%) | 1 (100.0%) |
| Total Housing Units | 4 (80.0%) | 1 (20.0%) |
Occupancy by Educational Attainment in Valley Park
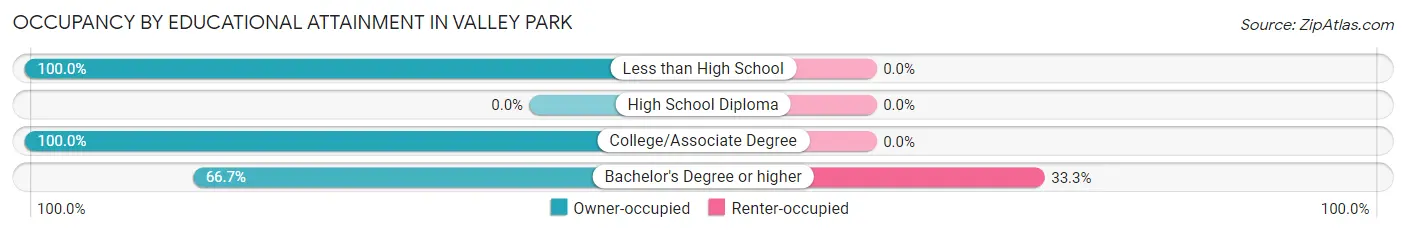
| Household Size | Owner-occupied | Renter-occupied |
| Less than High School | 1 (100.0%) | 0 (0.0%) |
| High School Diploma | 0 (0.0%) | 0 (0.0%) |
| College/Associate Degree | 1 (100.0%) | 0 (0.0%) |
| Bachelor's Degree or higher | 2 (66.7%) | 1 (33.3%) |
Occupancy by Age of Householder in Valley Park
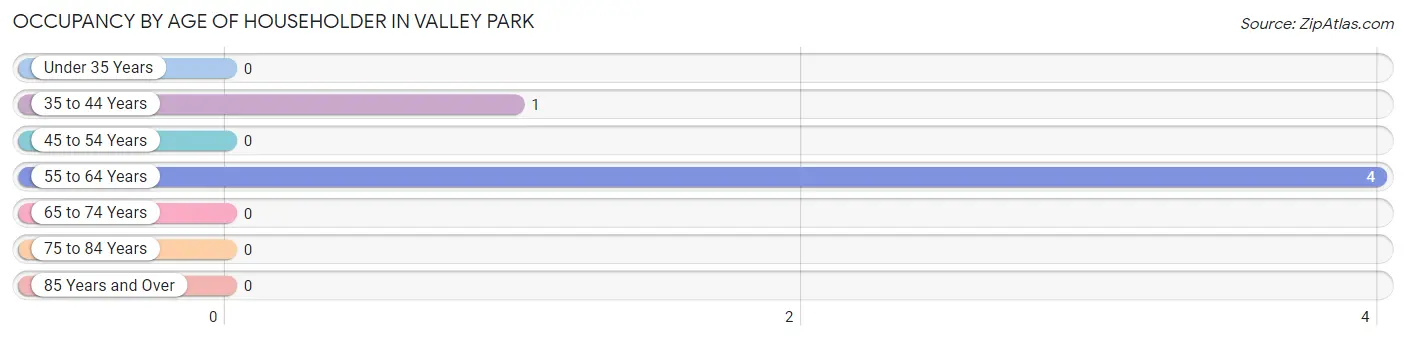
| Age Bracket | # Households | % Households |
| Under 35 Years | 0 | 0.0% |
| 35 to 44 Years | 1 | 20.0% |
| 45 to 54 Years | 0 | 0.0% |
| 55 to 64 Years | 4 | 80.0% |
| 65 to 74 Years | 0 | 0.0% |
| 75 to 84 Years | 0 | 0.0% |
| 85 Years and Over | 0 | 0.0% |
| Total | 5 | 100.0% |
Housing Finances in Valley Park
Median Income by Occupancy in Valley Park
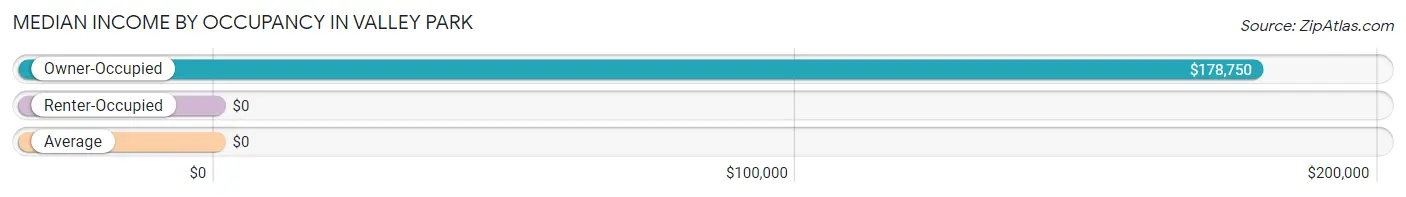
| Occupancy Type | # Households | Median Income |
| Owner-Occupied | 4 (80.0%) | $178,750 |
| Renter-Occupied | 1 (20.0%) | $0 |
| Average | 5 (100.0%) | $0 |
Occupancy by Householder Income Bracket in Valley Park
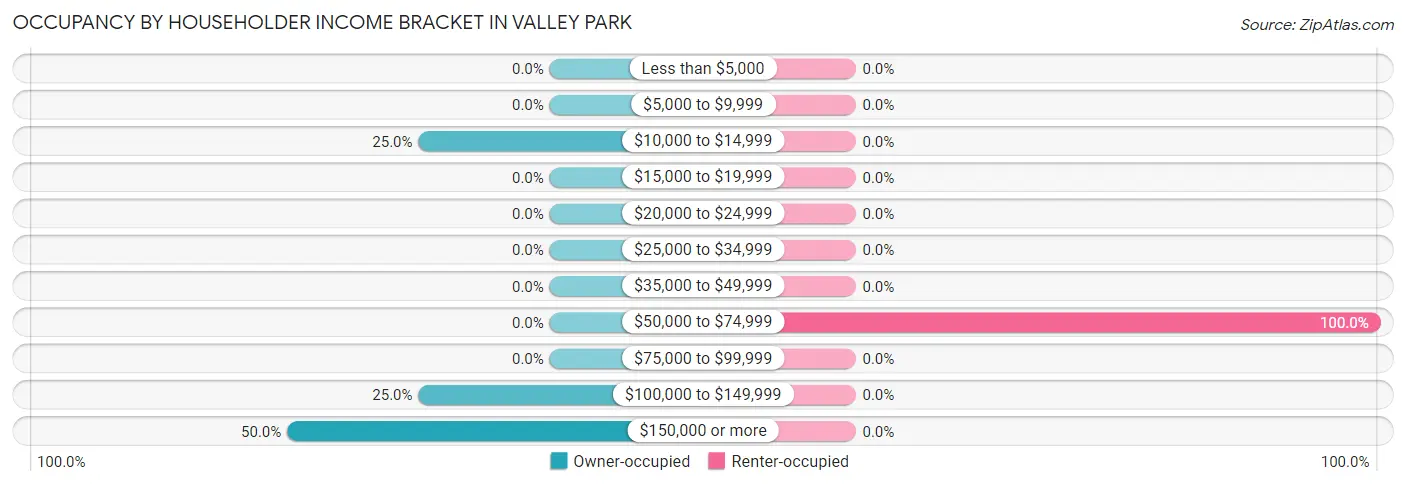
| Income Bracket | Owner-occupied | Renter-occupied |
| Less than $5,000 | 0 (0.0%) | 0 (0.0%) |
| $5,000 to $9,999 | 0 (0.0%) | 0 (0.0%) |
| $10,000 to $14,999 | 1 (25.0%) | 0 (0.0%) |
| $15,000 to $19,999 | 0 (0.0%) | 0 (0.0%) |
| $20,000 to $24,999 | 0 (0.0%) | 0 (0.0%) |
| $25,000 to $34,999 | 0 (0.0%) | 0 (0.0%) |
| $35,000 to $49,999 | 0 (0.0%) | 0 (0.0%) |
| $50,000 to $74,999 | 0 (0.0%) | 1 (100.0%) |
| $75,000 to $99,999 | 0 (0.0%) | 0 (0.0%) |
| $100,000 to $149,999 | 1 (25.0%) | 0 (0.0%) |
| $150,000 or more | 2 (50.0%) | 0 (0.0%) |
| Total | 4 (100.0%) | 1 (100.0%) |
Monthly Housing Cost Tiers in Valley Park
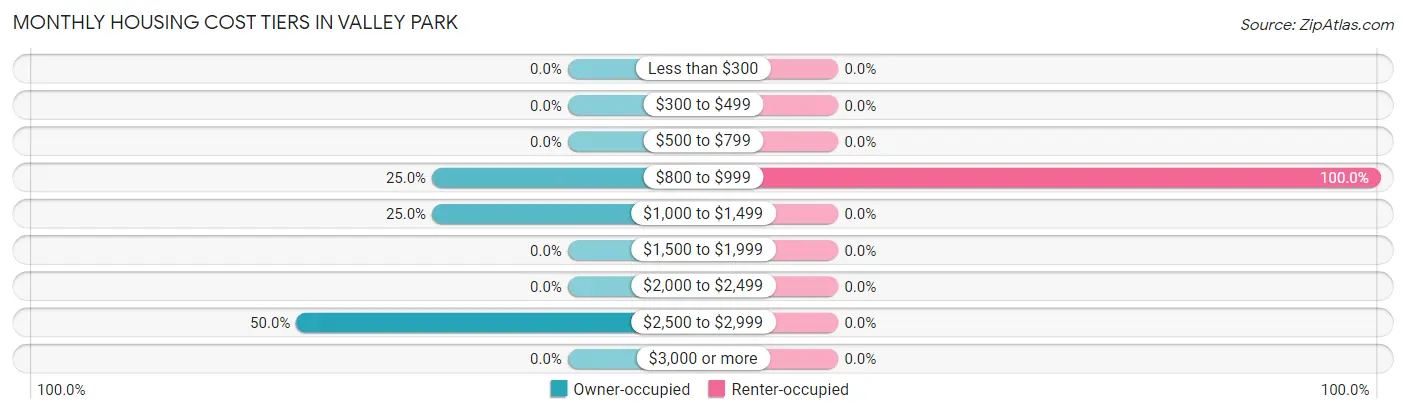
| Monthly Cost | Owner-occupied | Renter-occupied |
| Less than $300 | 0 (0.0%) | 0 (0.0%) |
| $300 to $499 | 0 (0.0%) | 0 (0.0%) |
| $500 to $799 | 0 (0.0%) | 0 (0.0%) |
| $800 to $999 | 1 (25.0%) | 1 (100.0%) |
| $1,000 to $1,499 | 1 (25.0%) | 0 (0.0%) |
| $1,500 to $1,999 | 0 (0.0%) | 0 (0.0%) |
| $2,000 to $2,499 | 0 (0.0%) | 0 (0.0%) |
| $2,500 to $2,999 | 2 (50.0%) | 0 (0.0%) |
| $3,000 or more | 0 (0.0%) | 0 (0.0%) |
| Total | 4 (100.0%) | 1 (100.0%) |
Physical Housing Characteristics in Valley Park
Housing Structures in Valley Park
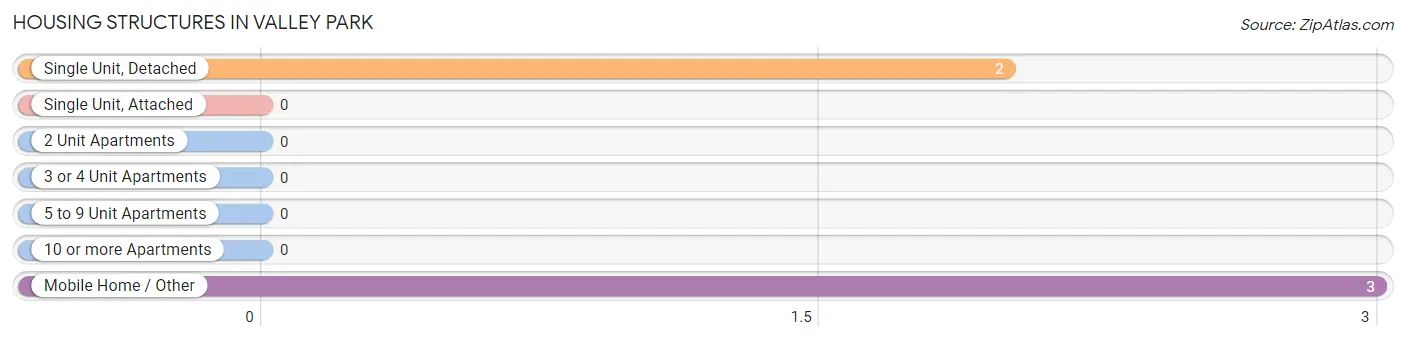
| Structure Type | # Housing Units | % Housing Units |
| Single Unit, Detached | 2 | 40.0% |
| Single Unit, Attached | 0 | 0.0% |
| 2 Unit Apartments | 0 | 0.0% |
| 3 or 4 Unit Apartments | 0 | 0.0% |
| 5 to 9 Unit Apartments | 0 | 0.0% |
| 10 or more Apartments | 0 | 0.0% |
| Mobile Home / Other | 3 | 60.0% |
| Total | 5 | 100.0% |
Housing Structures by Occupancy in Valley Park
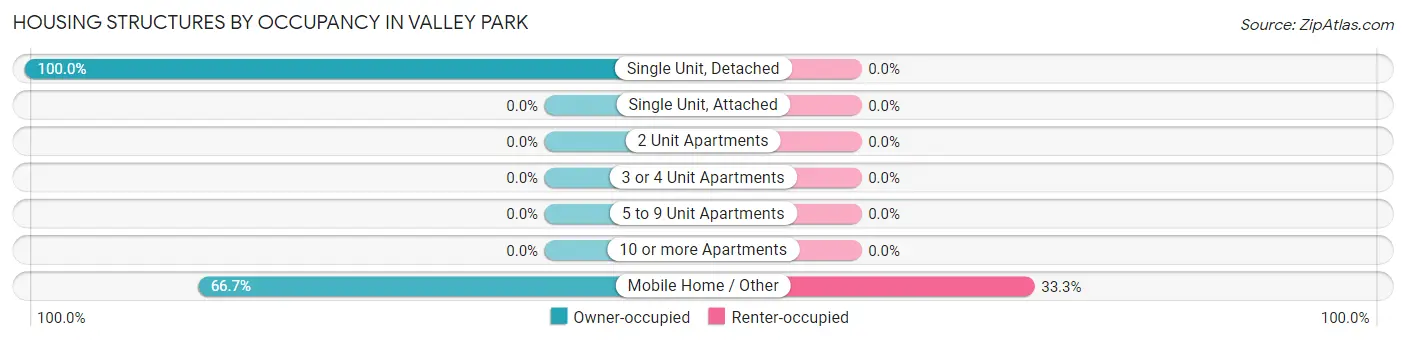
| Structure Type | Owner-occupied | Renter-occupied |
| Single Unit, Detached | 2 (100.0%) | 0 (0.0%) |
| Single Unit, Attached | 0 (0.0%) | 0 (0.0%) |
| 2 Unit Apartments | 0 (0.0%) | 0 (0.0%) |
| 3 or 4 Unit Apartments | 0 (0.0%) | 0 (0.0%) |
| 5 to 9 Unit Apartments | 0 (0.0%) | 0 (0.0%) |
| 10 or more Apartments | 0 (0.0%) | 0 (0.0%) |
| Mobile Home / Other | 2 (66.7%) | 1 (33.3%) |
| Total | 4 (80.0%) | 1 (20.0%) |
Housing Structures by Number of Rooms in Valley Park
| Number of Rooms | Owner-occupied | Renter-occupied |
| 1 Room | 0 (0.0%) | 0 (0.0%) |
| 2 or 3 Rooms | 0 (0.0%) | 0 (0.0%) |
| 4 or 5 Rooms | 0 (0.0%) | 1 (100.0%) |
| 6 or 7 Rooms | 3 (75.0%) | 0 (0.0%) |
| 8 or more Rooms | 1 (25.0%) | 0 (0.0%) |
| Total | 4 (100.0%) | 1 (100.0%) |
Housing Structure by Heating Type in Valley Park
| Heating Type | Owner-occupied | Renter-occupied |
| Utility Gas | 2 (50.0%) | 1 (100.0%) |
| Bottled, Tank, or LP Gas | 1 (25.0%) | 0 (0.0%) |
| Electricity | 0 (0.0%) | 0 (0.0%) |
| Fuel Oil or Kerosene | 0 (0.0%) | 0 (0.0%) |
| Coal or Coke | 0 (0.0%) | 0 (0.0%) |
| All other Fuels | 1 (25.0%) | 0 (0.0%) |
| No Fuel Used | 0 (0.0%) | 0 (0.0%) |
| Total | 4 (100.0%) | 1 (100.0%) |
Household Vehicle Usage in Valley Park
| Vehicles per Household | Owner-occupied | Renter-occupied |
| No Vehicle | 0 (0.0%) | 0 (0.0%) |
| 1 Vehicle | 0 (0.0%) | 0 (0.0%) |
| 2 Vehicles | 2 (50.0%) | 1 (100.0%) |
| 3 or more Vehicles | 2 (50.0%) | 0 (0.0%) |
| Total | 4 (100.0%) | 1 (100.0%) |
Real Estate & Mortgages in Valley Park
Real Estate and Mortgage Overview in Valley Park
| Characteristic | Without Mortgage | With Mortgage |
| Housing Units | 1 | 3 |
| Median Property Value | - | - |
| Median Household Income | - | - |
| Monthly Housing Costs | - | - |
| Real Estate Taxes | - | - |
Property Value by Mortgage Status in Valley Park
| Property Value | Without Mortgage | With Mortgage |
| Less than $50,000 | 0 (0.0%) | 1 (33.3%) |
| $50,000 to $99,999 | 0 (0.0%) | 1 (33.3%) |
| $100,000 to $299,999 | 0 (0.0%) | 1 (33.3%) |
| $300,000 to $499,999 | 0 (0.0%) | 0 (0.0%) |
| $500,000 to $749,999 | 0 (0.0%) | 0 (0.0%) |
| $750,000 to $999,999 | 0 (0.0%) | 0 (0.0%) |
| $1,000,000 or more | 1 (100.0%) | 0 (0.0%) |
| Total | 1 (100.0%) | 3 (100.0%) |
Household Income by Mortgage Status in Valley Park
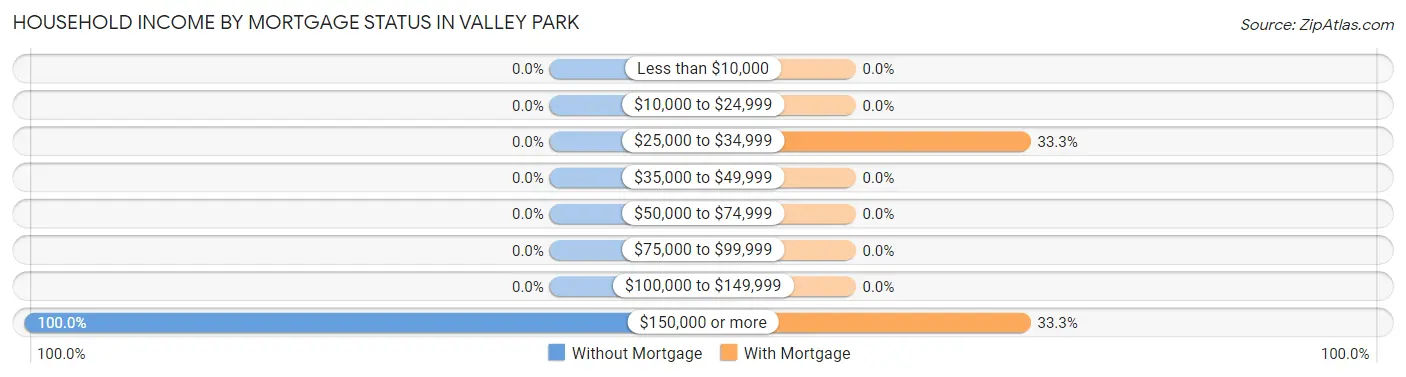
| Household Income | Without Mortgage | With Mortgage |
| Less than $10,000 | 0 (0.0%) | 0 (0.0%) |
| $10,000 to $24,999 | 0 (0.0%) | 0 (0.0%) |
| $25,000 to $34,999 | 0 (0.0%) | 1 (33.3%) |
| $35,000 to $49,999 | 0 (0.0%) | 0 (0.0%) |
| $50,000 to $74,999 | 0 (0.0%) | 0 (0.0%) |
| $75,000 to $99,999 | 0 (0.0%) | 0 (0.0%) |
| $100,000 to $149,999 | 0 (0.0%) | 0 (0.0%) |
| $150,000 or more | 1 (100.0%) | 1 (33.3%) |
| Total | 1 (100.0%) | 3 (100.0%) |
Property Value to Household Income Ratio in Valley Park
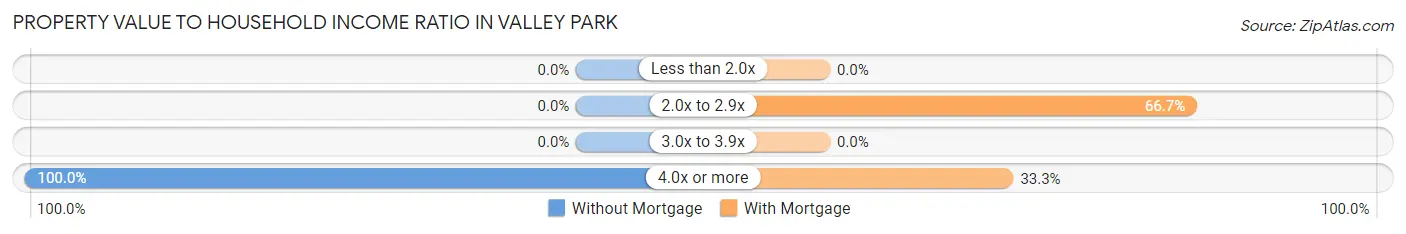
| Value-to-Income Ratio | Without Mortgage | With Mortgage |
| Less than 2.0x | 0 (0.0%) | 0 (0.0%) |
| 2.0x to 2.9x | 0 (0.0%) | 2 (66.7%) |
| 3.0x to 3.9x | 0 (0.0%) | 0 (0.0%) |
| 4.0x or more | 1 (100.0%) | 1 (33.3%) |
| Total | 1 (100.0%) | 3 (100.0%) |
Real Estate Taxes by Mortgage Status in Valley Park
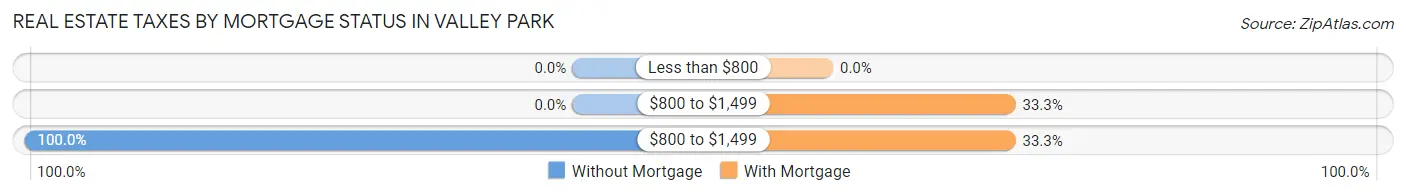
| Property Taxes | Without Mortgage | With Mortgage |
| Less than $800 | 0 (0.0%) | 0 (0.0%) |
| $800 to $1,499 | 0 (0.0%) | 1 (33.3%) |
| $800 to $1,499 | 1 (100.0%) | 1 (33.3%) |
| Total | 1 (100.0%) | 3 (100.0%) |
Health & Disability in Valley Park
Health Insurance Coverage by Age in Valley Park
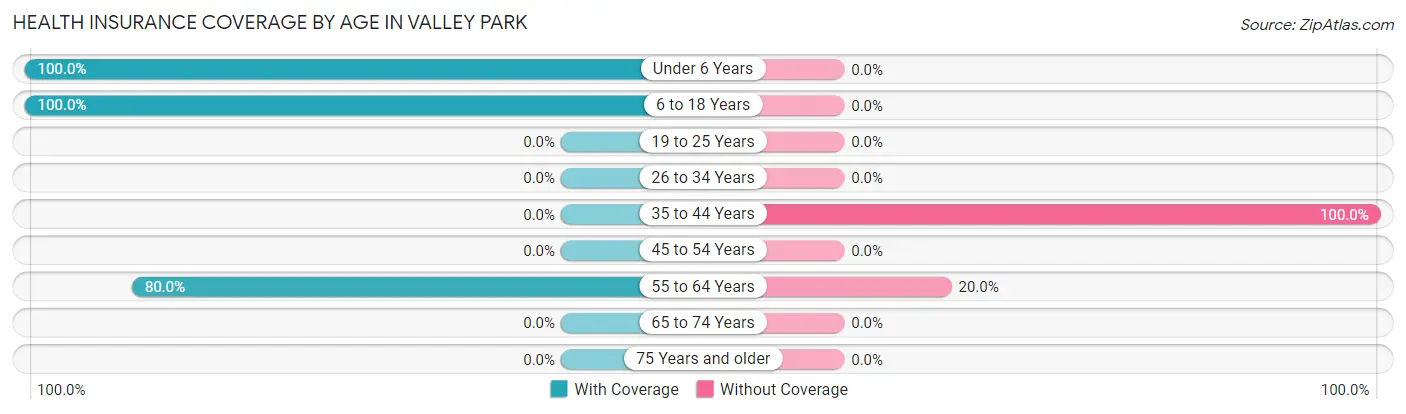
| Age Bracket | With Coverage | Without Coverage |
| Under 6 Years | 1 (100.0%) | 0 (0.0%) |
| 6 to 18 Years | 2 (100.0%) | 0 (0.0%) |
| 19 to 25 Years | 0 (0.0%) | 0 (0.0%) |
| 26 to 34 Years | 0 (0.0%) | 0 (0.0%) |
| 35 to 44 Years | 0 (0.0%) | 1 (100.0%) |
| 45 to 54 Years | 0 (0.0%) | 0 (0.0%) |
| 55 to 64 Years | 8 (80.0%) | 2 (20.0%) |
| 65 to 74 Years | 0 (0.0%) | 0 (0.0%) |
| 75 Years and older | 0 (0.0%) | 0 (0.0%) |
| Total | 11 (78.6%) | 3 (21.4%) |
Health Insurance Coverage by Citizenship Status in Valley Park
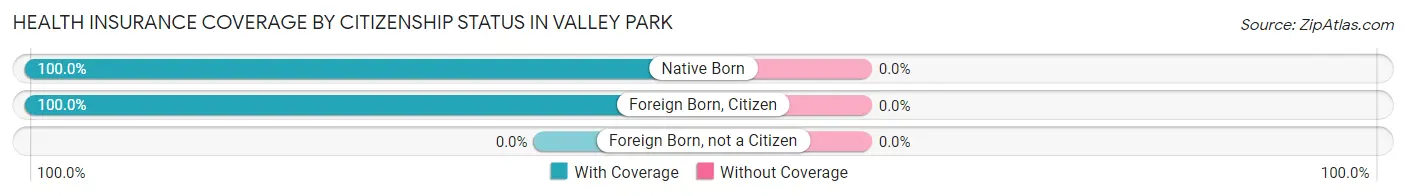
| Citizenship Status | With Coverage | Without Coverage |
| Native Born | 1 (100.0%) | 0 (0.0%) |
| Foreign Born, Citizen | 2 (100.0%) | 0 (0.0%) |
| Foreign Born, not a Citizen | 0 (0.0%) | 0 (0.0%) |
Health Insurance Coverage by Household Income in Valley Park
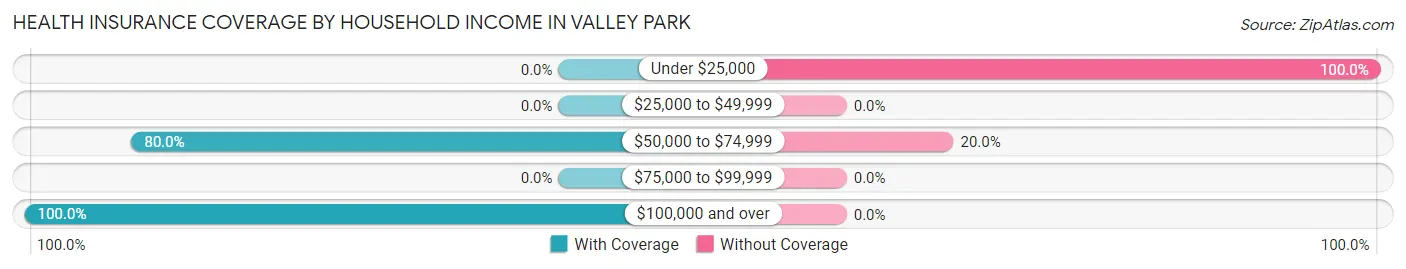
| Household Income | With Coverage | Without Coverage |
| Under $25,000 | 0 (0.0%) | 2 (100.0%) |
| $25,000 to $49,999 | 0 (0.0%) | 0 (0.0%) |
| $50,000 to $74,999 | 4 (80.0%) | 1 (20.0%) |
| $75,000 to $99,999 | 0 (0.0%) | 0 (0.0%) |
| $100,000 and over | 7 (100.0%) | 0 (0.0%) |
Public vs Private Health Insurance Coverage by Age in Valley Park
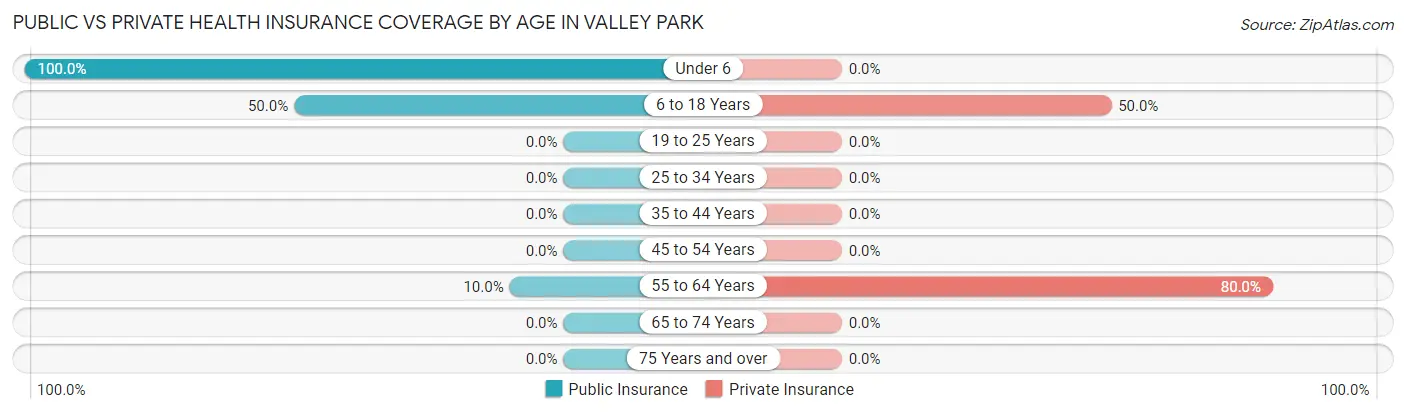
| Age Bracket | Public Insurance | Private Insurance |
| Under 6 | 1 (100.0%) | 0 (0.0%) |
| 6 to 18 Years | 1 (50.0%) | 1 (50.0%) |
| 19 to 25 Years | 0 (0.0%) | 0 (0.0%) |
| 25 to 34 Years | 0 (0.0%) | 0 (0.0%) |
| 35 to 44 Years | 0 (0.0%) | 0 (0.0%) |
| 45 to 54 Years | 0 (0.0%) | 0 (0.0%) |
| 55 to 64 Years | 1 (10.0%) | 8 (80.0%) |
| 65 to 74 Years | 0 (0.0%) | 0 (0.0%) |
| 75 Years and over | 0 (0.0%) | 0 (0.0%) |
| Total | 3 (21.4%) | 9 (64.3%) |
Disability Status by Sex by Age in Valley Park
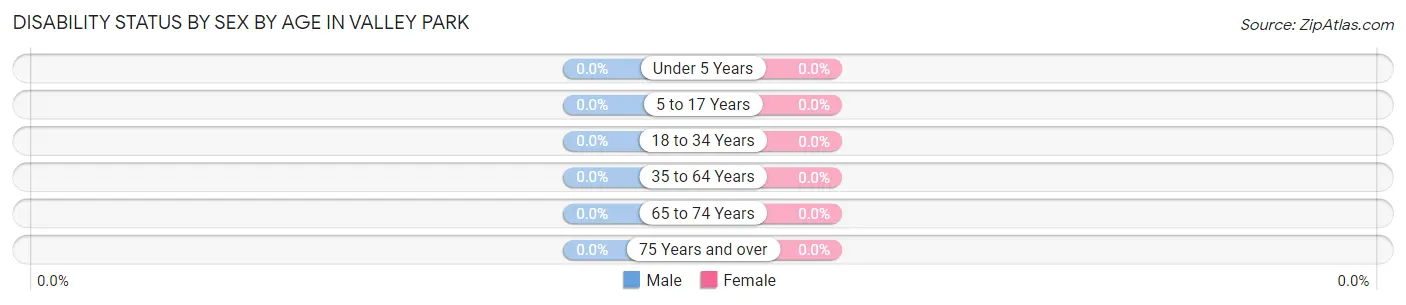
| Age Bracket | Male | Female |
| Under 5 Years | 0 (0.0%) | 0 (0.0%) |
| 5 to 17 Years | 0 (0.0%) | 0 (0.0%) |
| 18 to 34 Years | 0 (0.0%) | 0 (0.0%) |
| 35 to 64 Years | 0 (0.0%) | 0 (0.0%) |
| 65 to 74 Years | 0 (0.0%) | 0 (0.0%) |
| 75 Years and over | 0 (0.0%) | 0 (0.0%) |
Disability Class by Sex by Age in Valley Park
Disability Class: Hearing Difficulty
| Age Bracket | Male | Female |
| Under 5 Years | 0 (0.0%) | 0 (0.0%) |
| 5 to 17 Years | 0 (0.0%) | 0 (0.0%) |
| 18 to 34 Years | 0 (0.0%) | 0 (0.0%) |
| 35 to 64 Years | 0 (0.0%) | 0 (0.0%) |
| 65 to 74 Years | 0 (0.0%) | 0 (0.0%) |
| 75 Years and over | 0 (0.0%) | 0 (0.0%) |
Disability Class: Vision Difficulty
| Age Bracket | Male | Female |
| Under 5 Years | 0 (0.0%) | 0 (0.0%) |
| 5 to 17 Years | 0 (0.0%) | 0 (0.0%) |
| 18 to 34 Years | 0 (0.0%) | 0 (0.0%) |
| 35 to 64 Years | 0 (0.0%) | 0 (0.0%) |
| 65 to 74 Years | 0 (0.0%) | 0 (0.0%) |
| 75 Years and over | 0 (0.0%) | 0 (0.0%) |
Disability Class: Cognitive Difficulty

| Age Bracket | Male | Female |
| 5 to 17 Years | 0 (0.0%) | 0 (0.0%) |
| 18 to 34 Years | 0 (0.0%) | 0 (0.0%) |
| 35 to 64 Years | 0 (0.0%) | 0 (0.0%) |
| 65 to 74 Years | 0 (0.0%) | 0 (0.0%) |
| 75 Years and over | 0 (0.0%) | 0 (0.0%) |
Disability Class: Ambulatory Difficulty
| Age Bracket | Male | Female |
| 5 to 17 Years | 0 (0.0%) | 0 (0.0%) |
| 18 to 34 Years | 0 (0.0%) | 0 (0.0%) |
| 35 to 64 Years | 0 (0.0%) | 0 (0.0%) |
| 65 to 74 Years | 0 (0.0%) | 0 (0.0%) |
| 75 Years and over | 0 (0.0%) | 0 (0.0%) |
Disability Class: Self-Care Difficulty
| Age Bracket | Male | Female |
| 5 to 17 Years | 0 (0.0%) | 0 (0.0%) |
| 18 to 34 Years | 0 (0.0%) | 0 (0.0%) |
| 35 to 64 Years | 0 (0.0%) | 0 (0.0%) |
| 65 to 74 Years | 0 (0.0%) | 0 (0.0%) |
| 75 Years and over | 0 (0.0%) | 0 (0.0%) |
Technology Access in Valley Park
Computing Device Access in Valley Park
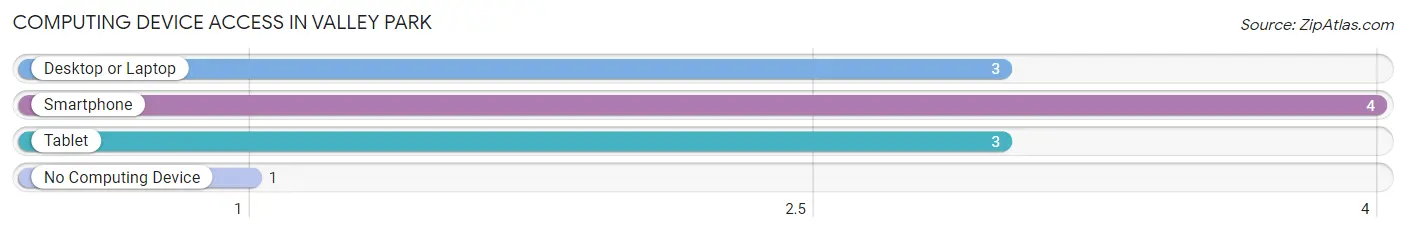
| Device Type | # Households | % Households |
| Desktop or Laptop | 3 | 60.0% |
| Smartphone | 4 | 80.0% |
| Tablet | 3 | 60.0% |
| No Computing Device | 1 | 20.0% |
| Total | 5 | 100.0% |
Internet Access in Valley Park
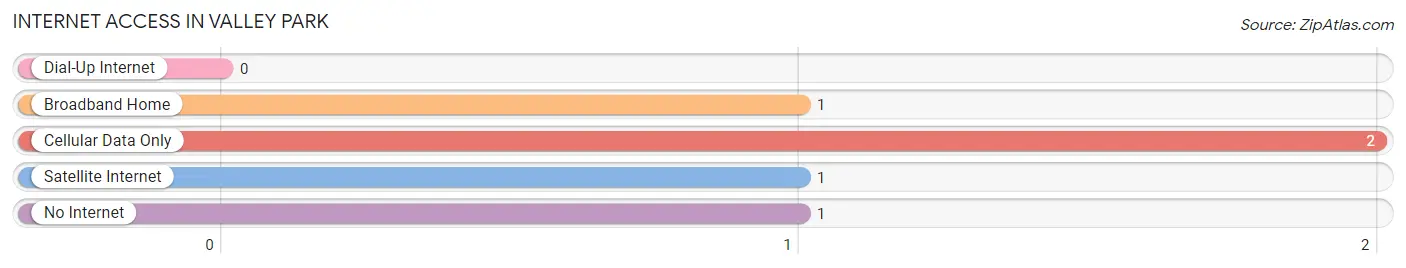
| Internet Type | # Households | % Households |
| Dial-Up Internet | 0 | 0.0% |
| Broadband Home | 1 | 20.0% |
| Cellular Data Only | 2 | 40.0% |
| Satellite Internet | 1 | 20.0% |
| No Internet | 1 | 20.0% |
| Total | 5 | 100.0% |
Valley Park Summary
Valley Park is a small town located in Oklahoma, United States. It is situated in the southeastern part of the state, in the county of Creek. The town has a population of around 1,000 people and is part of the Tulsa Metropolitan Statistical Area.
History
Valley Park was founded in 1891 by a group of settlers from Arkansas. The town was originally called Valley Station, but the name was changed to Valley Park in 1895. The town was incorporated in 1901 and was named after the nearby Valley Creek.
The town was a popular stop on the Missouri, Kansas and Texas Railroad, which ran through the area. The railroad provided a convenient way for settlers to travel to and from the town.
In the early 1900s, the town was a thriving agricultural center. Cotton, corn, and wheat were the main crops grown in the area. The town also had a number of businesses, including a general store, a blacksmith shop, and a hotel.
In the 1920s, the town began to decline as the railroad stopped running through the area. The Great Depression also had a negative effect on the town. Many of the businesses closed and the population decreased.
In the 1950s, the town began to experience a resurgence. The town was revitalized by the construction of a new highway, which connected Valley Park to Tulsa. This allowed for increased trade and commerce in the area.
Geography
Valley Park is located in the southeastern part of Oklahoma, in Creek County. The town is situated on the banks of Valley Creek, which runs through the area. The town is located about 25 miles south of Tulsa and about 50 miles east of Oklahoma City.
The town has a total area of 1.2 square miles, all of which is land. The terrain in the area is mostly flat, with some rolling hills. The climate in the area is humid subtropical, with hot summers and mild winters.
Economy
The economy of Valley Park is largely based on agriculture. The town is home to several farms, which produce cotton, corn, and wheat. The town also has a number of businesses, including a general store, a blacksmith shop, and a hotel.
The town is also home to a number of manufacturing companies, which produce a variety of products, including furniture, clothing, and electronics. The town is also home to a number of oil and gas companies, which are involved in the exploration and production of oil and gas in the area.
Demographics
As of the 2010 census, the population of Valley Park was 1,000. The racial makeup of the town was 95.2% White, 0.7% African American, 0.3% Native American, 0.3% Asian, 0.1% Pacific Islander, and 3.5% from other races.
The median household income in Valley Park was $37,500, and the median family income was $41,250. The per capita income in the town was $17,500. About 11.2% of the population was below the poverty line.
Conclusion
Valley Park is a small town located in Oklahoma, United States. It is situated in the southeastern part of the state, in the county of Creek. The town has a population of around 1,000 people and is part of the Tulsa Metropolitan Statistical Area. The town has a long history, and its economy is largely based on agriculture and manufacturing. The town has a diverse population, with a median household income of $37,500.
Common Questions
What is Per Capita Income in Valley Park?
Per Capita income in Valley Park is $71,321.
What is Inequality or Gini Index in Valley Park?
Inequality or Gini Index in Valley Park is 0.50.
What is the Total Population of Valley Park?
Total Population of Valley Park is 14.
What is the Total Male Population of Valley Park?
Total Male Population of Valley Park is 8.
What is the Total Female Population of Valley Park?
Total Female Population of Valley Park is 6.
What is the Ratio of Males per 100 Females in Valley Park?
There are 133.33 Males per 100 Females in Valley Park.
What is the Ratio of Females per 100 Males in Valley Park?
There are 75.00 Females per 100 Males in Valley Park.
What is the Median Population Age in Valley Park?
Median Population Age in Valley Park is 56.3 Years.
What is the Average Family Size in Valley Park
Average Family Size in Valley Park is 2.8 People.
What is the Average Household Size in Valley Park
Average Household Size in Valley Park is 2.8 People.
How Large is the Labor Force in Valley Park?
There are 9 People in the Labor Forcein in Valley Park.
What is the Percentage of People in the Labor Force in Valley Park?
75.0% of People are in the Labor Force in Valley Park.