Elmer, OK Map & Demographics
Elmer Map
Elmer Overview
$51,708
PER CAPITA INCOME
0.45
INEQUALITY / GINI INDEX
40
TOTAL POPULATION
21
MALE POPULATION
19
FEMALE POPULATION
110.53
MALES / 100 FEMALES
90.48
FEMALES / 100 MALES
63.8
MEDIAN AGE
2.6
AVG FAMILY SIZE
1.4
AVG HOUSEHOLD SIZE
20
LABOR FORCE [ PEOPLE ]
50.0%
PERCENT IN LABOR FORCE
Elmer Zip Codes
Elmer Area Codes
Income in Elmer
Income Overview in Elmer
| Characteristic | Number | Measure |
| Per Capita Income | 40 | $51,708 |
| Median Family Income | 7 | $0 |
| Mean Family Income | 7 | $115,371 |
| Median Household Income | 29 | $0 |
| Mean Household Income | 29 | $72,828 |
| Income Deficit | 7 | $0 |
| Wage / Income Gap (%) | 40 | 0.00% |
| Wage / Income Gap ($) | 40 | 100.00¢ per $1 |
| Gini / Inequality Index | 40 | 0.45 |
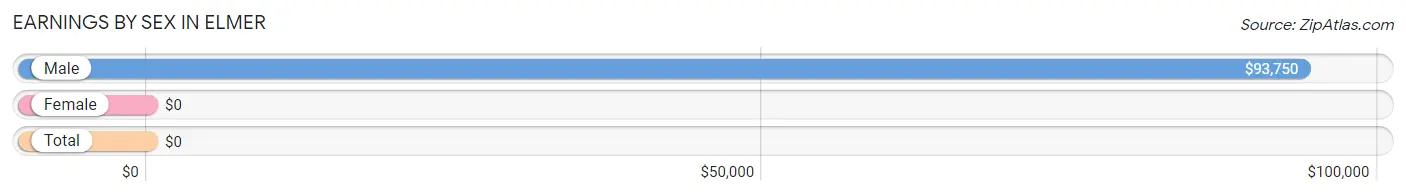
Earnings by Sex in Elmer
| Sex | Number | Average Earnings |
| Male | 15 (65.2%) | $93,750 |
| Female | 8 (34.8%) | $0 |
| Total | 23 (100.0%) | $0 |
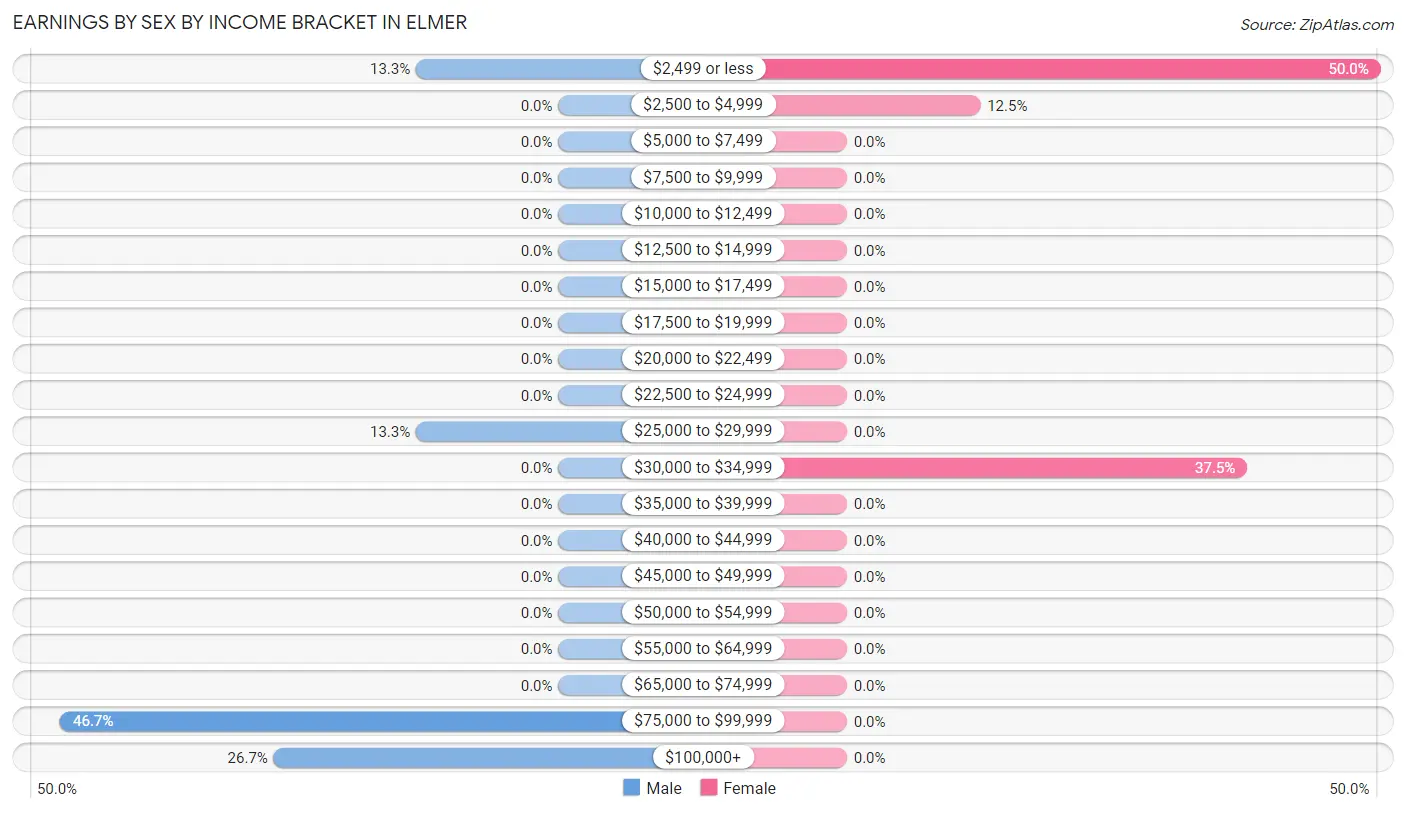
Earnings by Sex by Income Bracket in Elmer
The most common earnings brackets in Elmer are $75,000 to $99,999 for men (7 | 46.7%) and $2,499 or less for women (4 | 50.0%).
| Income | Male | Female |
| $2,499 or less | 2 (13.3%) | 4 (50.0%) |
| $2,500 to $4,999 | 0 (0.0%) | 1 (12.5%) |
| $5,000 to $7,499 | 0 (0.0%) | 0 (0.0%) |
| $7,500 to $9,999 | 0 (0.0%) | 0 (0.0%) |
| $10,000 to $12,499 | 0 (0.0%) | 0 (0.0%) |
| $12,500 to $14,999 | 0 (0.0%) | 0 (0.0%) |
| $15,000 to $17,499 | 0 (0.0%) | 0 (0.0%) |
| $17,500 to $19,999 | 0 (0.0%) | 0 (0.0%) |
| $20,000 to $22,499 | 0 (0.0%) | 0 (0.0%) |
| $22,500 to $24,999 | 0 (0.0%) | 0 (0.0%) |
| $25,000 to $29,999 | 2 (13.3%) | 0 (0.0%) |
| $30,000 to $34,999 | 0 (0.0%) | 3 (37.5%) |
| $35,000 to $39,999 | 0 (0.0%) | 0 (0.0%) |
| $40,000 to $44,999 | 0 (0.0%) | 0 (0.0%) |
| $45,000 to $49,999 | 0 (0.0%) | 0 (0.0%) |
| $50,000 to $54,999 | 0 (0.0%) | 0 (0.0%) |
| $55,000 to $64,999 | 0 (0.0%) | 0 (0.0%) |
| $65,000 to $74,999 | 0 (0.0%) | 0 (0.0%) |
| $75,000 to $99,999 | 7 (46.7%) | 0 (0.0%) |
| $100,000+ | 4 (26.7%) | 0 (0.0%) |
| Total | 15 (100.0%) | 8 (100.0%) |
Earnings by Sex by Educational Attainment in Elmer
| Educational Attainment | Male Income | Female Income |
| Less than High School | - | - |
| High School Diploma | - | - |
| College or Associate's Degree | - | - |
| Bachelor's Degree | - | - |
| Graduate Degree | - | - |
| Total | $94,107 | $0 |
Family Income in Elmer
Family Income Brackets in Elmer
According to the Elmer family income data, there are 3 families falling into the $35,000 to $49,999 income range, which is the most common income bracket and makes up 42.9% of all families.
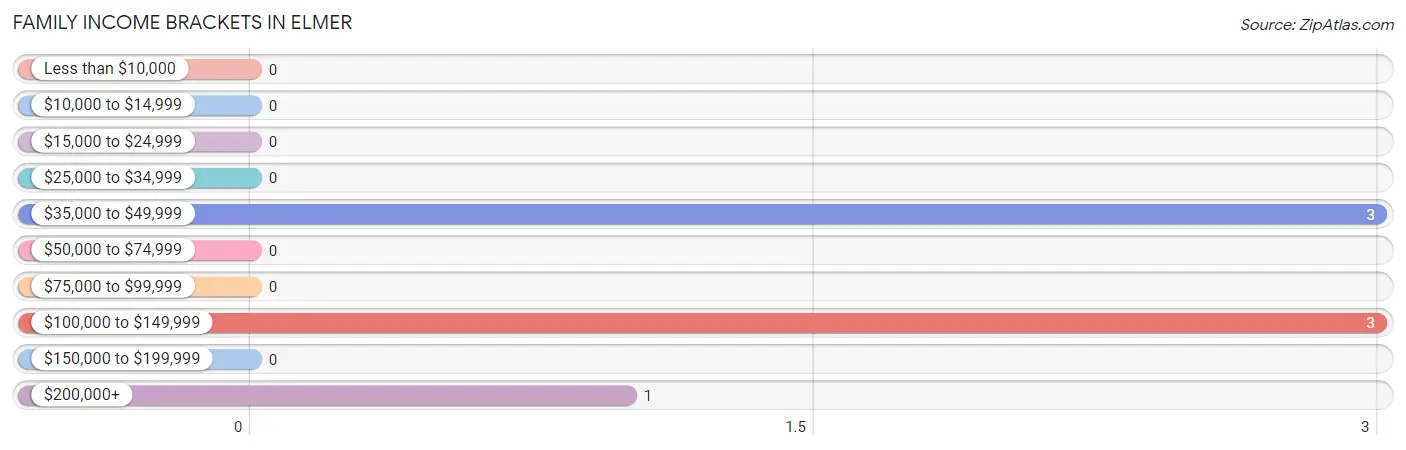
| Income Bracket | # Families | % Families |
| Less than $10,000 | 0 | 0.0% |
| $10,000 to $14,999 | 0 | 0.0% |
| $15,000 to $24,999 | 0 | 0.0% |
| $25,000 to $34,999 | 0 | 0.0% |
| $35,000 to $49,999 | 3 | 42.9% |
| $50,000 to $74,999 | 0 | 0.0% |
| $75,000 to $99,999 | 0 | 0.0% |
| $100,000 to $149,999 | 3 | 42.9% |
| $150,000 to $199,999 | 0 | 0.0% |
| $200,000+ | 1 | 14.3% |
Family Income by Famaliy Size in Elmer
| Income Bracket | # Families | Median Income |
| 2-Person Families | 6 (85.7%) | $0 |
| 3-Person Families | 0 (0.0%) | $0 |
| 4-Person Families | 0 (0.0%) | $0 |
| 5-Person Families | 1 (14.3%) | $0 |
| 6-Person Families | 0 (0.0%) | $0 |
| 7+ Person Families | 0 (0.0%) | $0 |
| Total | 7 (100.0%) | $0 |
Family Income by Number of Earners in Elmer
| Number of Earners | # Families | Median Income |
| No Earners | 1 (14.3%) | $0 |
| 1 Earner | 5 (71.4%) | $0 |
| 2 Earners | 0 (0.0%) | $0 |
| 3+ Earners | 1 (14.3%) | $0 |
| Total | 7 (100.0%) | $0 |
Household Income in Elmer
Household Income Brackets in Elmer
With 7 households falling in the category, the $75,000 to $99,999 income range is the most frequent in Elmer, accounting for 24.1% of all households.
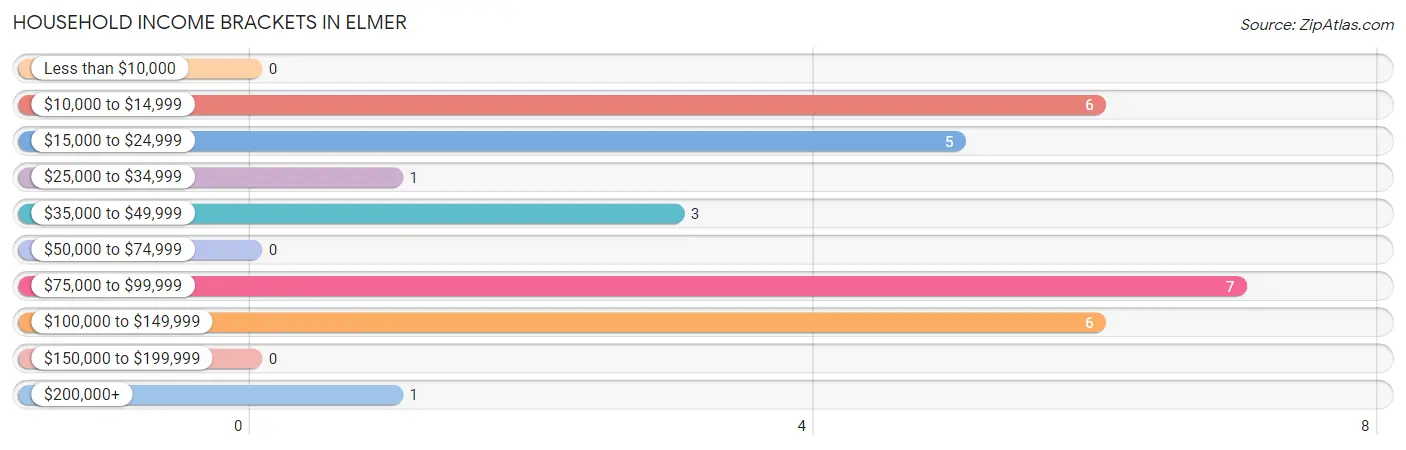
| Income Bracket | # Households | % Households |
| Less than $10,000 | 0 | 0.0% |
| $10,000 to $14,999 | 6 | 20.7% |
| $15,000 to $24,999 | 5 | 17.2% |
| $25,000 to $34,999 | 1 | 3.4% |
| $35,000 to $49,999 | 3 | 10.3% |
| $50,000 to $74,999 | 0 | 0.0% |
| $75,000 to $99,999 | 7 | 24.1% |
| $100,000 to $149,999 | 6 | 20.7% |
| $150,000 to $199,999 | 0 | 0.0% |
| $200,000+ | 1 | 3.4% |
Household Income by Householder Age in Elmer
The median household income in Elmer is $0, with the highest median household income of $41,250 found in the 45 to 64 years age bracket for the primary householder. A total of 4 households (13.8%) fall into this category.
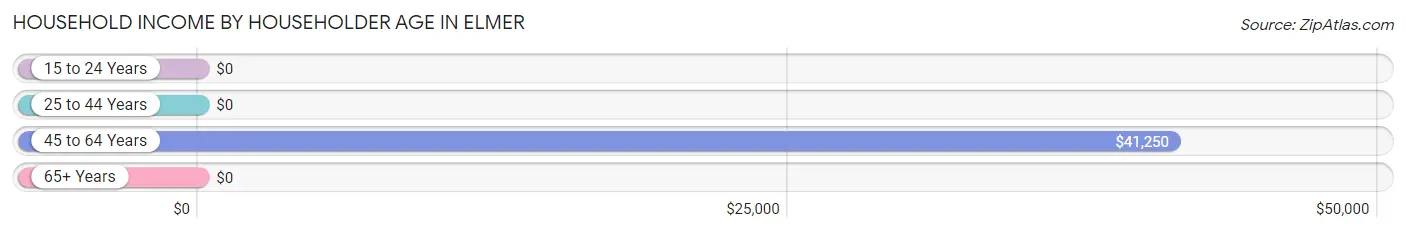
| Income Bracket | # Households | Median Income |
| 15 to 24 Years | 0 (0.0%) | $0 |
| 25 to 44 Years | 7 (24.1%) | $0 |
| 45 to 64 Years | 4 (13.8%) | $41,250 |
| 65+ Years | 18 (62.1%) | $0 |
| Total | 29 (100.0%) | $0 |
Poverty in Elmer
Income Below Poverty by Sex and Age in Elmer
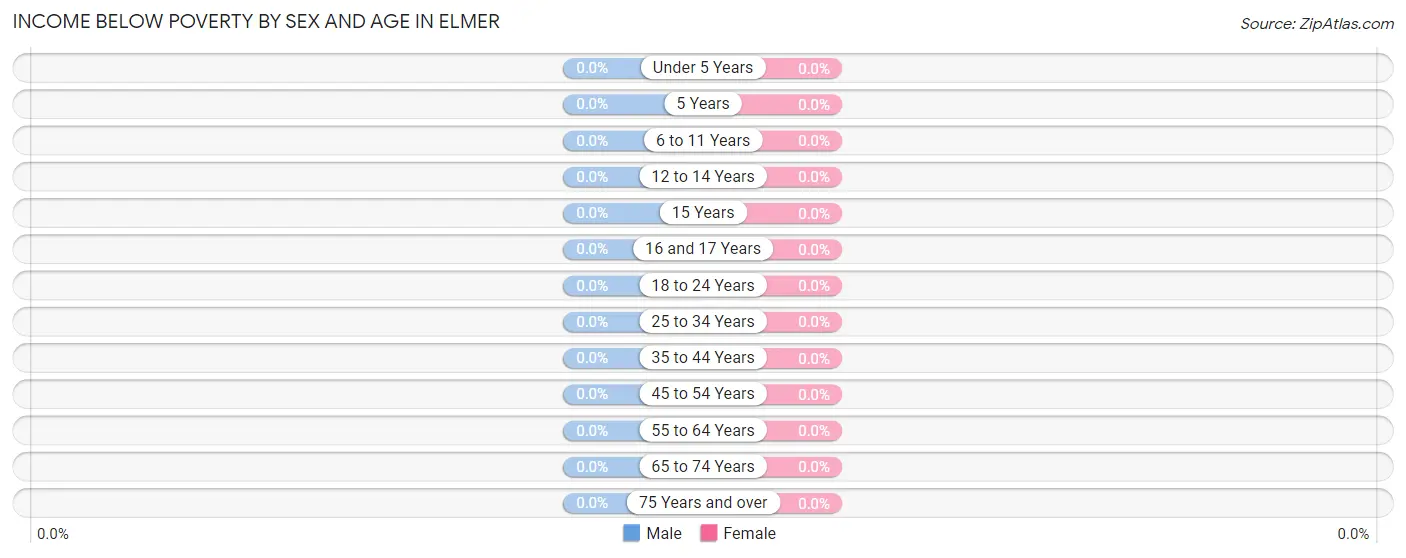
| Age Bracket | Male | Female |
| Under 5 Years | 0 (0.0%) | 0 (0.0%) |
| 5 Years | 0 (0.0%) | 0 (0.0%) |
| 6 to 11 Years | 0 (0.0%) | 0 (0.0%) |
| 12 to 14 Years | 0 (0.0%) | 0 (0.0%) |
| 15 Years | 0 (0.0%) | 0 (0.0%) |
| 16 and 17 Years | 0 (0.0%) | 0 (0.0%) |
| 18 to 24 Years | 0 (0.0%) | 0 (0.0%) |
| 25 to 34 Years | 0 (0.0%) | 0 (0.0%) |
| 35 to 44 Years | 0 (0.0%) | 0 (0.0%) |
| 45 to 54 Years | 0 (0.0%) | 0 (0.0%) |
| 55 to 64 Years | 0 (0.0%) | 0 (0.0%) |
| 65 to 74 Years | 0 (0.0%) | 0 (0.0%) |
| 75 Years and over | 0 (0.0%) | 0 (0.0%) |
| Total | 0 (0.0%) | 0 (0.0%) |
Income Above Poverty by Sex and Age in Elmer
According to the poverty statistics in Elmer, males aged 16 and 17 years and females aged 16 and 17 years are the age groups that are most secure financially, with 100.0% of males and 100.0% of females in these age groups living above the poverty line.
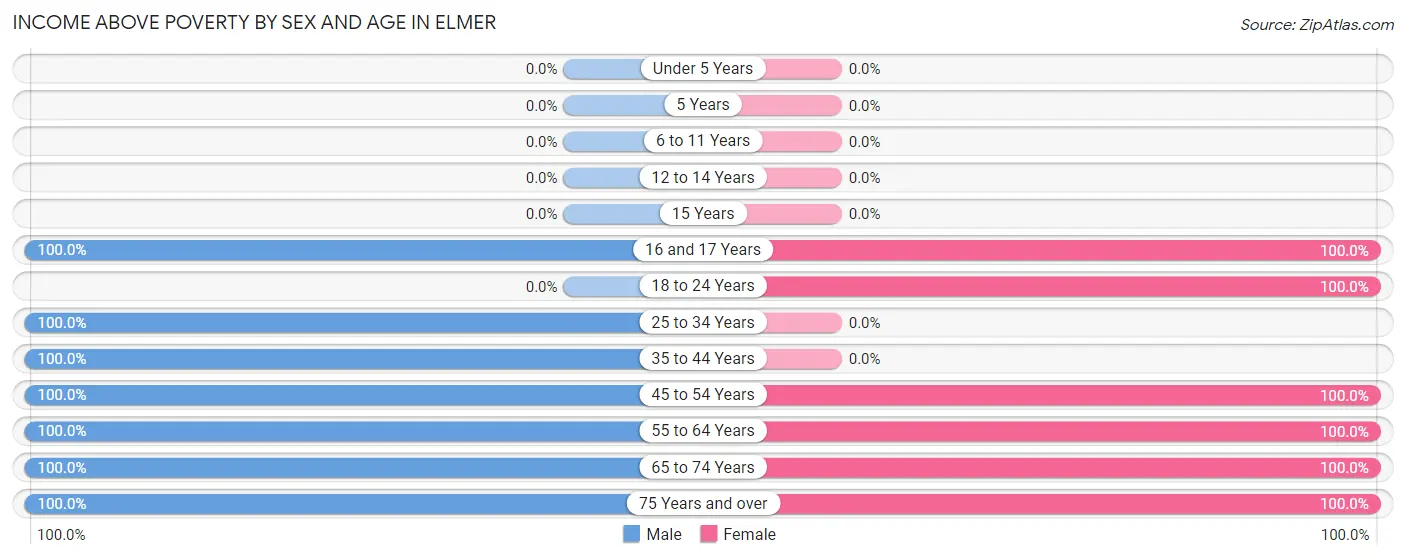
| Age Bracket | Male | Female |
| Under 5 Years | 0 (0.0%) | 0 (0.0%) |
| 5 Years | 0 (0.0%) | 0 (0.0%) |
| 6 to 11 Years | 0 (0.0%) | 0 (0.0%) |
| 12 to 14 Years | 0 (0.0%) | 0 (0.0%) |
| 15 Years | 0 (0.0%) | 0 (0.0%) |
| 16 and 17 Years | 2 (100.0%) | 1 (100.0%) |
| 18 to 24 Years | 0 (0.0%) | 1 (100.0%) |
| 25 to 34 Years | 2 (100.0%) | 0 (0.0%) |
| 35 to 44 Years | 7 (100.0%) | 0 (0.0%) |
| 45 to 54 Years | 2 (100.0%) | 1 (100.0%) |
| 55 to 64 Years | 2 (100.0%) | 3 (100.0%) |
| 65 to 74 Years | 2 (100.0%) | 9 (100.0%) |
| 75 Years and over | 4 (100.0%) | 4 (100.0%) |
| Total | 21 (100.0%) | 19 (100.0%) |
Income Below Poverty Among Married-Couple Families in Elmer
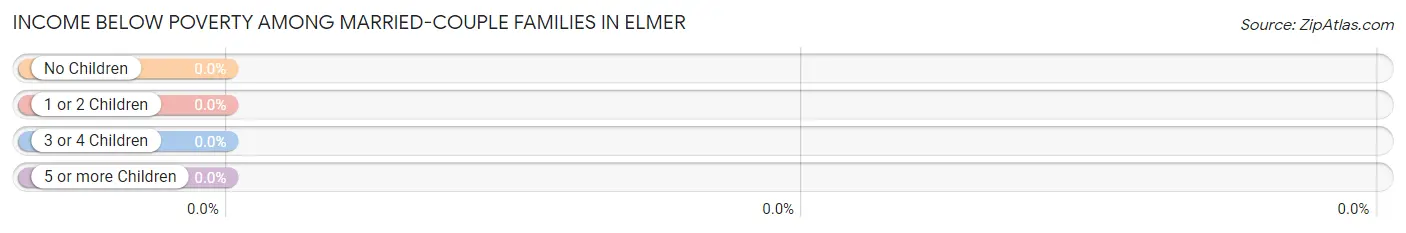
| Children | Above Poverty | Below Poverty |
| No Children | 3 (100.0%) | 0 (0.0%) |
| 1 or 2 Children | 1 (100.0%) | 0 (0.0%) |
| 3 or 4 Children | 0 (0.0%) | 0 (0.0%) |
| 5 or more Children | 0 (0.0%) | 0 (0.0%) |
| Total | 4 (100.0%) | 0 (0.0%) |
Income Below Poverty Among Single-Parent Households in Elmer
| Children | Single Father | Single Mother |
| No Children | 0 (0.0%) | 0 (0.0%) |
| 1 or 2 Children | 0 (0.0%) | 0 (0.0%) |
| 3 or 4 Children | 0 (0.0%) | 0 (0.0%) |
| 5 or more Children | 0 (0.0%) | 0 (0.0%) |
| Total | 0 (0.0%) | 0 (0.0%) |
Income Below Poverty Among Married-Couple vs Single-Parent Households in Elmer
| Children | Married-Couple Families | Single-Parent Households |
| No Children | 0 (0.0%) | 0 (0.0%) |
| 1 or 2 Children | 0 (0.0%) | 0 (0.0%) |
| 3 or 4 Children | 0 (0.0%) | 0 (0.0%) |
| 5 or more Children | 0 (0.0%) | 0 (0.0%) |
| Total | 0 (0.0%) | 0 (0.0%) |
Race in Elmer
The most populous races in Elmer are White / Caucasian (30 | 75.0%), Hispanic or Latino (10 | 25.0%), and Some other Race (10 | 25.0%).
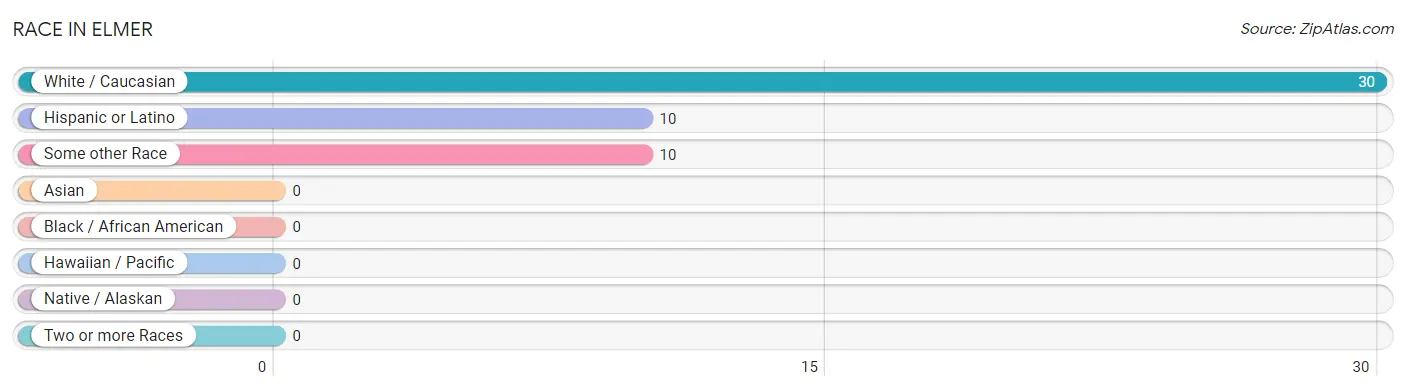
| Race | # Population | % Population |
| Asian | 0 | 0.0% |
| Black / African American | 0 | 0.0% |
| Hawaiian / Pacific | 0 | 0.0% |
| Hispanic or Latino | 10 | 25.0% |
| Native / Alaskan | 0 | 0.0% |
| White / Caucasian | 30 | 75.0% |
| Two or more Races | 0 | 0.0% |
| Some other Race | 10 | 25.0% |
| Total | 40 | 100.0% |
Ancestry in Elmer
The most populous ancestries reported in Elmer are English (19 | 47.5%), Mexican (7 | 17.5%), American (6 | 15.0%), German (6 | 15.0%), and Northern European (3 | 7.5%), together accounting for 102.5% of all Elmer residents.
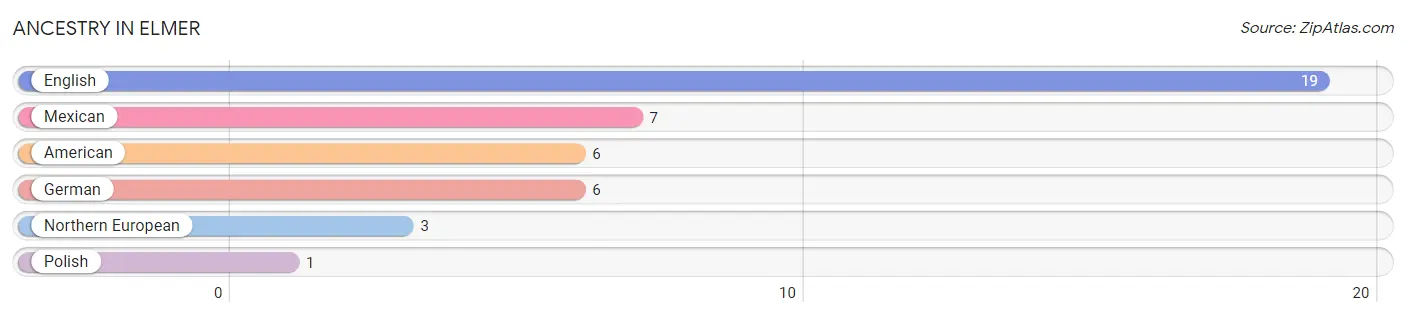
| Ancestry | # Population | % Population |
| American | 6 | 15.0% |
| English | 19 | 47.5% |
| German | 6 | 15.0% |
| Mexican | 7 | 17.5% |
| Northern European | 3 | 7.5% |
| Polish | 1 | 2.5% | View All 6 Rows |
Immigrants in Elmer

| Immigration Origin | # Population | % Population | View All 0 Rows |
Sex and Age in Elmer
Sex and Age in Elmer
The most populous age groups in Elmer are 35 to 39 Years (7 | 33.3%) for men and 70 to 74 Years (6 | 31.6%) for women.
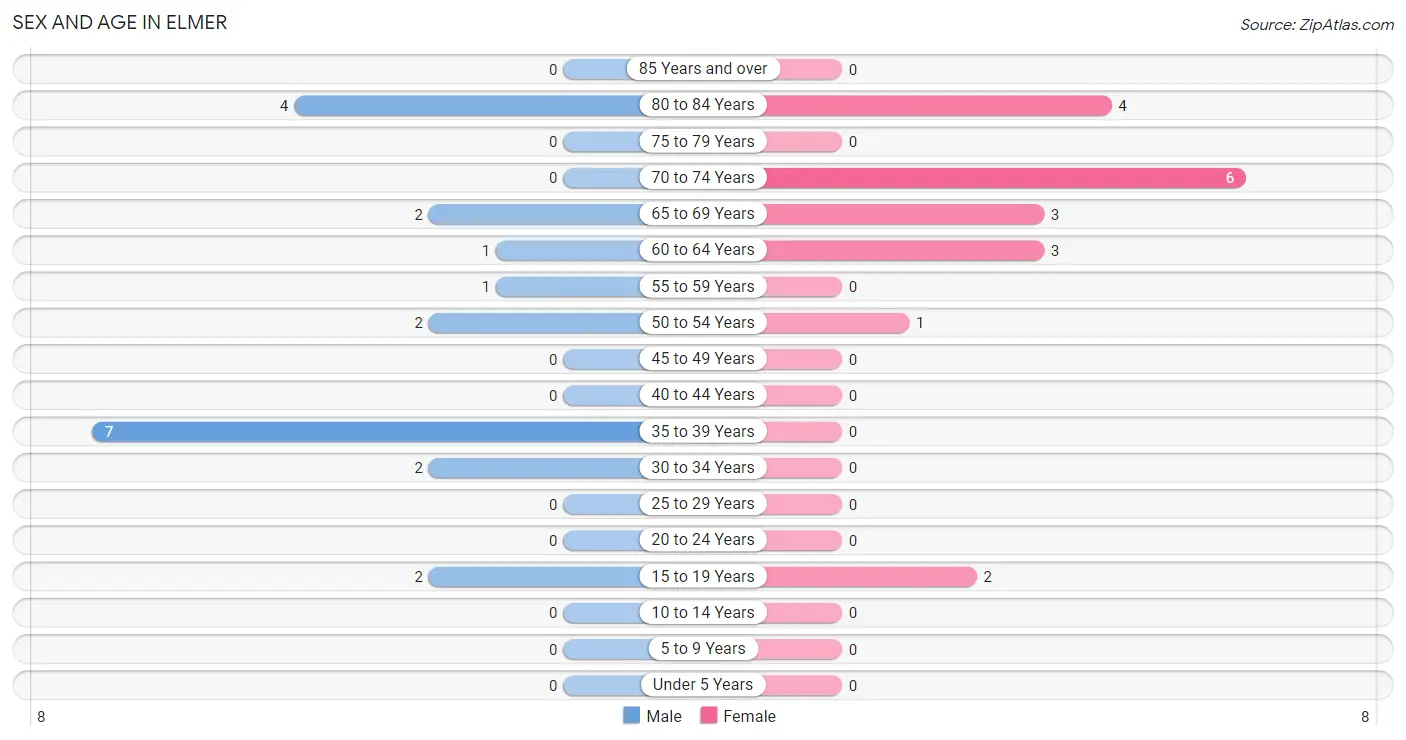
| Age Bracket | Male | Female |
| Under 5 Years | 0 (0.0%) | 0 (0.0%) |
| 5 to 9 Years | 0 (0.0%) | 0 (0.0%) |
| 10 to 14 Years | 0 (0.0%) | 0 (0.0%) |
| 15 to 19 Years | 2 (9.5%) | 2 (10.5%) |
| 20 to 24 Years | 0 (0.0%) | 0 (0.0%) |
| 25 to 29 Years | 0 (0.0%) | 0 (0.0%) |
| 30 to 34 Years | 2 (9.5%) | 0 (0.0%) |
| 35 to 39 Years | 7 (33.3%) | 0 (0.0%) |
| 40 to 44 Years | 0 (0.0%) | 0 (0.0%) |
| 45 to 49 Years | 0 (0.0%) | 0 (0.0%) |
| 50 to 54 Years | 2 (9.5%) | 1 (5.3%) |
| 55 to 59 Years | 1 (4.8%) | 0 (0.0%) |
| 60 to 64 Years | 1 (4.8%) | 3 (15.8%) |
| 65 to 69 Years | 2 (9.5%) | 3 (15.8%) |
| 70 to 74 Years | 0 (0.0%) | 6 (31.6%) |
| 75 to 79 Years | 0 (0.0%) | 0 (0.0%) |
| 80 to 84 Years | 4 (19.1%) | 4 (21.0%) |
| 85 Years and over | 0 (0.0%) | 0 (0.0%) |
| Total | 21 (100.0%) | 19 (100.0%) |
Families and Households in Elmer
Median Family Size in Elmer
The median family size in Elmer is 2.57 persons per family, with married-couple families (4 | 57.1%) accounting for the largest median family size of 3 persons per family. On the other hand, single male/father families (2 | 28.6%) represent the smallest median family size with 1.50 persons per family.
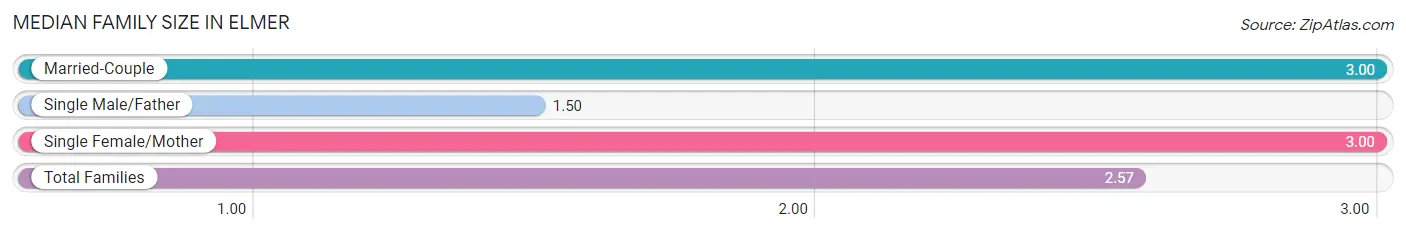
| Family Type | # Families | Family Size |
| Married-Couple | 4 (57.1%) | 3.00 |
| Single Male/Father | 2 (28.6%) | 1.50 |
| Single Female/Mother | 1 (14.3%) | 3.00 |
| Total Families | 7 (100.0%) | 2.57 |
Median Household Size in Elmer
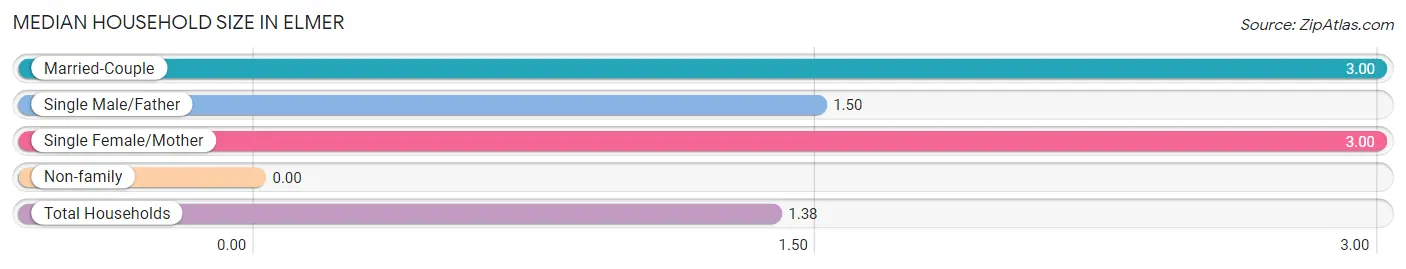
| Household Type | # Households | Household Size |
| Married-Couple | 4 (13.8%) | 3.00 |
| Single Male/Father | 2 (6.9%) | 1.50 |
| Single Female/Mother | 1 (3.5%) | 3.00 |
| Non-family | 22 (75.9%) | - |
| Total Households | 29 (100.0%) | 1.38 |
Household Size by Marriage Status in Elmer
Out of a total of 29 households in Elmer, 7 (24.1%) are family households, while 22 (75.9%) are nonfamily households. The most numerous type of family households are 2-person households, comprising 6, and the most common type of nonfamily households are 1-person households, comprising 22.
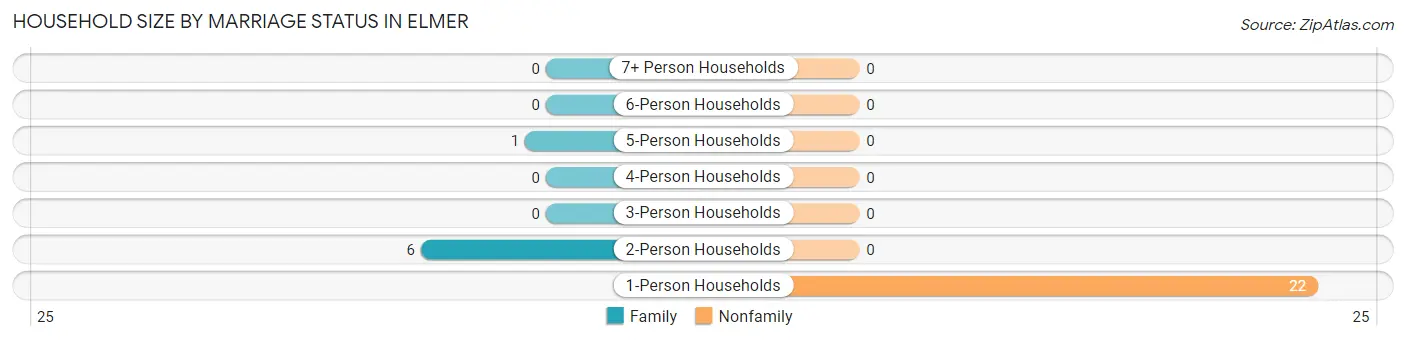
| Household Size | Family Households | Nonfamily Households |
| 1-Person Households | - | 22 (75.9%) |
| 2-Person Households | 6 (20.7%) | 0 (0.0%) |
| 3-Person Households | 0 (0.0%) | 0 (0.0%) |
| 4-Person Households | 0 (0.0%) | 0 (0.0%) |
| 5-Person Households | 1 (3.5%) | 0 (0.0%) |
| 6-Person Households | 0 (0.0%) | 0 (0.0%) |
| 7+ Person Households | 0 (0.0%) | 0 (0.0%) |
| Total | 7 (24.1%) | 22 (75.9%) |
Female Fertility in Elmer
Fertility by Age in Elmer
| Age Bracket | Women with Births | Births / 1,000 Women |
| 15 to 19 years | 0 (0.0%) | 0.0 |
| 20 to 34 years | 0 (0.0%) | 0.0 |
| 35 to 50 years | 0 (0.0%) | 0.0 |
| Total | 0 (0.0%) | 0.0 |
Fertility by Age by Marriage Status in Elmer
| Age Bracket | Married | Unmarried |
| 15 to 19 years | 0 (0.0%) | 0 (0.0%) |
| 20 to 34 years | 0 (0.0%) | 0 (0.0%) |
| 35 to 50 years | 0 (0.0%) | 0 (0.0%) |
| Total | 0 (0.0%) | 0 (0.0%) |
Fertility by Education in Elmer
| Educational Attainment | Women with Births | Births / 1,000 Women |
| Less than High School | 0 (0.0%) | 0.0 |
| High School Diploma | 0 (0.0%) | 0.0 |
| College or Associate's Degree | 0 (0.0%) | 0.0 |
| Bachelor's Degree | 0 (0.0%) | 0.0 |
| Graduate Degree | 0 (0.0%) | 0.0 |
| Total | 0 (0.0%) | 0.0 |
Fertility by Education by Marriage Status in Elmer
| Educational Attainment | Married | Unmarried |
| Less than High School | 0 (0.0%) | 0 (0.0%) |
| High School Diploma | 0 (0.0%) | 0 (0.0%) |
| College or Associate's Degree | 0 (0.0%) | 0 (0.0%) |
| Bachelor's Degree | 0 (0.0%) | 0 (0.0%) |
| Graduate Degree | 0 (0.0%) | 0 (0.0%) |
| Total | 0 (0.0%) | 0 (0.0%) |
Employment Characteristics in Elmer
Employment by Class of Employer in Elmer
Among the 20 employed individuals in Elmer, private company employees (9 | 45.0%), self-employed (not incorporated) (8 | 40.0%), and local government employees (3 | 15.0%) make up the most common classes of employment.
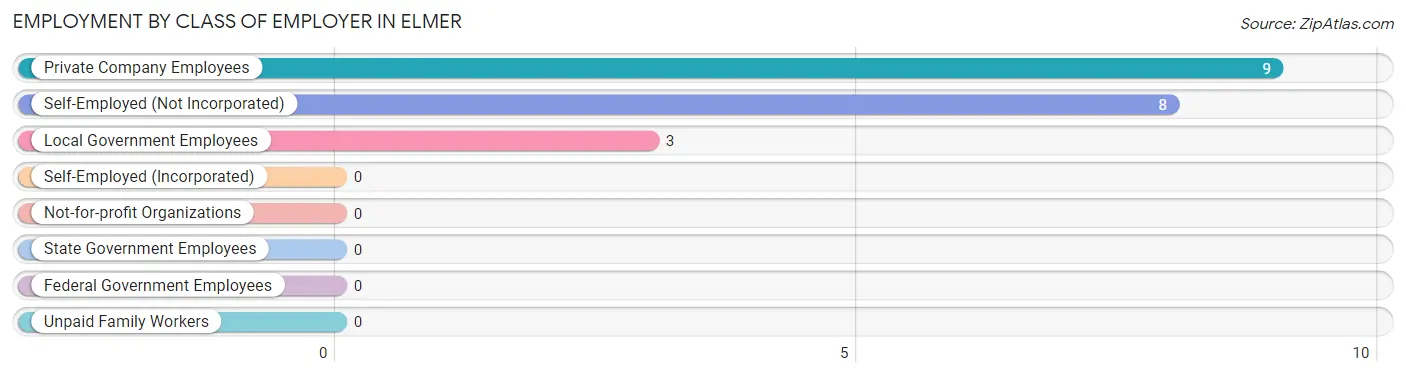
| Employer Class | # Employees | % Employees |
| Private Company Employees | 9 | 45.0% |
| Self-Employed (Incorporated) | 0 | 0.0% |
| Self-Employed (Not Incorporated) | 8 | 40.0% |
| Not-for-profit Organizations | 0 | 0.0% |
| Local Government Employees | 3 | 15.0% |
| State Government Employees | 0 | 0.0% |
| Federal Government Employees | 0 | 0.0% |
| Unpaid Family Workers | 0 | 0.0% |
| Total | 20 | 100.0% |
Employment Status by Age in Elmer
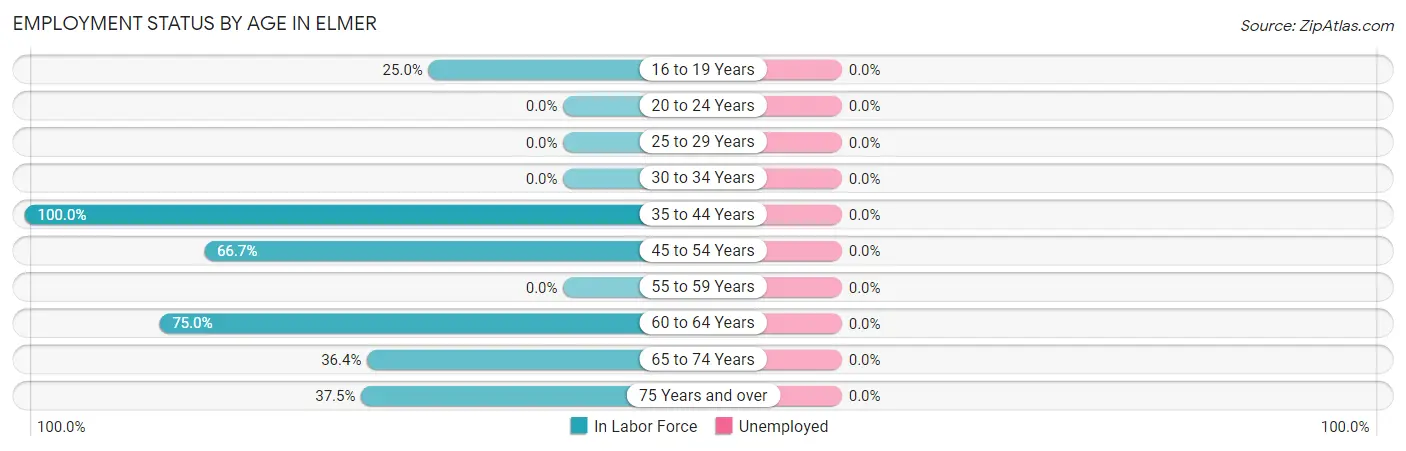
| Age Bracket | In Labor Force | Unemployed |
| 16 to 19 Years | 1 (25.0%) | 0 (0.0%) |
| 20 to 24 Years | 0 (0.0%) | 0 (0.0%) |
| 25 to 29 Years | 0 (0.0%) | 0 (0.0%) |
| 30 to 34 Years | 0 (0.0%) | 0 (0.0%) |
| 35 to 44 Years | 7 (100.0%) | 0 (0.0%) |
| 45 to 54 Years | 2 (66.7%) | 0 (0.0%) |
| 55 to 59 Years | 0 (0.0%) | 0 (0.0%) |
| 60 to 64 Years | 3 (75.0%) | 0 (0.0%) |
| 65 to 74 Years | 4 (36.4%) | 0 (0.0%) |
| 75 Years and over | 3 (37.5%) | 0 (0.0%) |
| Total | 20 (50.0%) | 0 (0.0%) |
Employment Status by Educational Attainment in Elmer
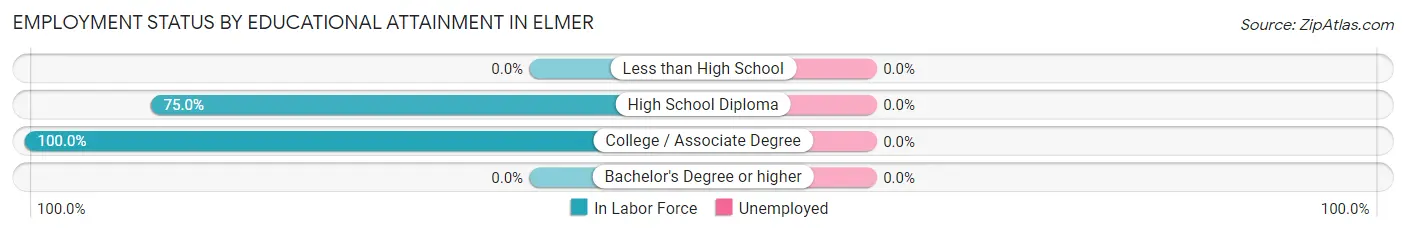
| Educational Attainment | In Labor Force | Unemployed |
| Less than High School | 0 (0.0%) | 0 (0.0%) |
| High School Diploma | 9 (75.0%) | 0 (0.0%) |
| College / Associate Degree | 3 (100.0%) | 0 (0.0%) |
| Bachelor's Degree or higher | 0 (0.0%) | 0 (0.0%) |
| Total | 12 (70.6%) | 0 (0.0%) |
Employment Occupations by Sex in Elmer
Management, Business, Science and Arts Occupations
The most common Management, Business, Science and Arts occupations in Elmer are Community & Social Service (6 | 30.0%), Education Instruction & Library (3 | 15.0%), Arts, Media & Entertainment (3 | 15.0%), and Management (1 | 5.0%).
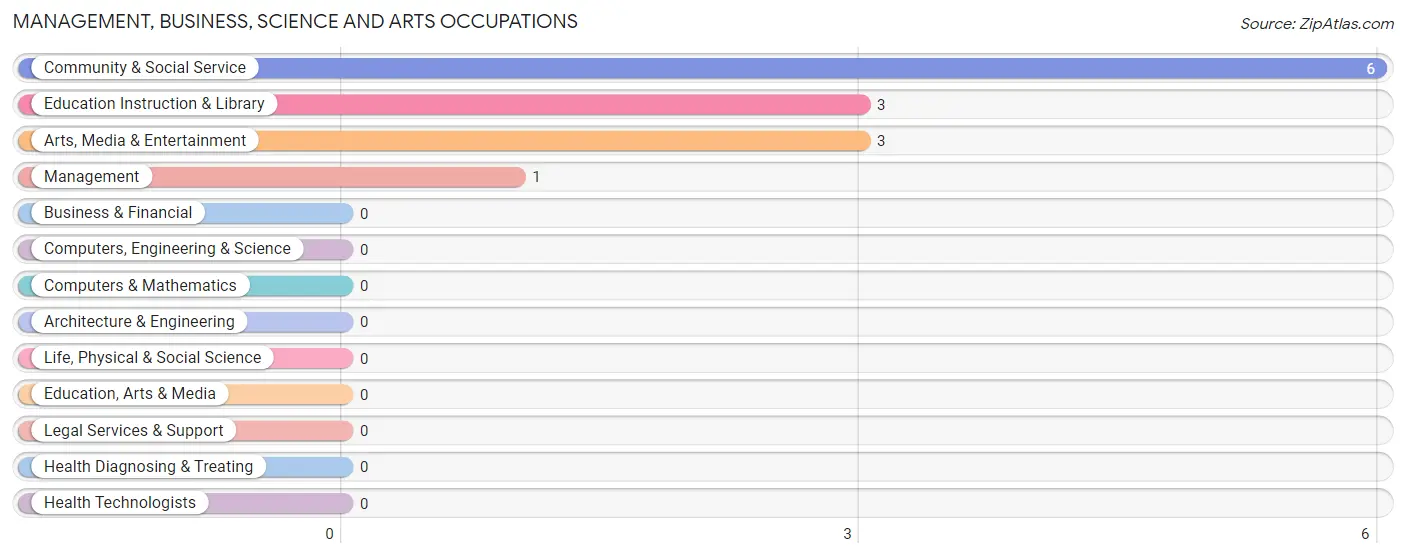
Management, Business, Science and Arts Occupations by Sex
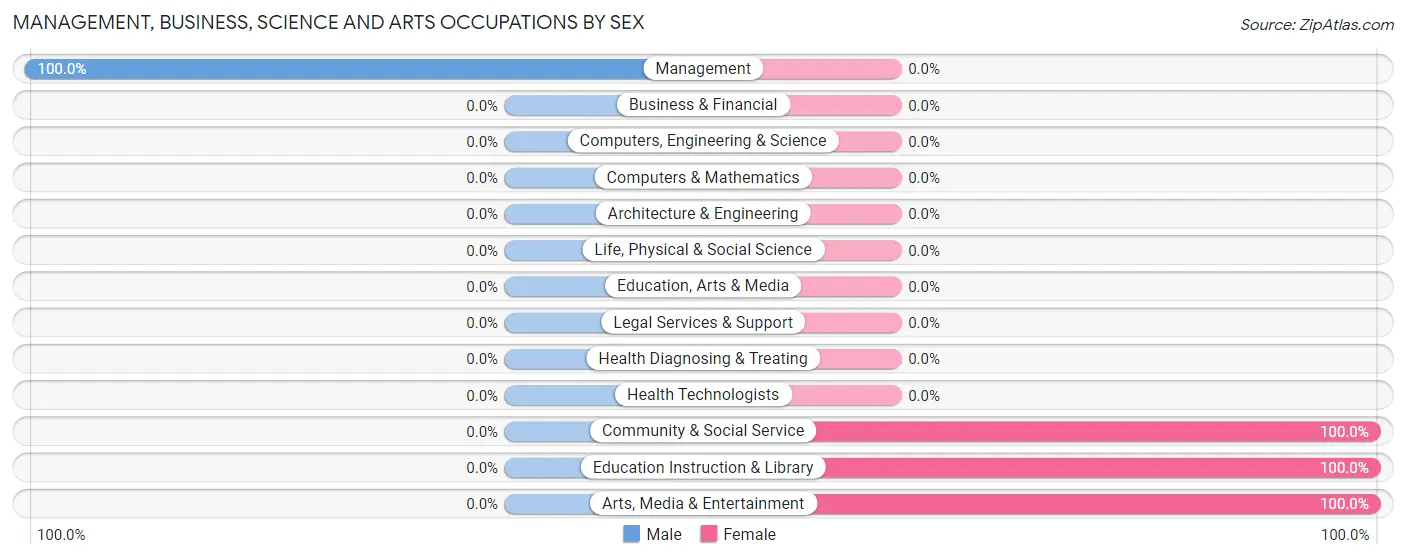
| Occupation | Male | Female |
| Management | 1 (100.0%) | 0 (0.0%) |
| Business & Financial | 0 (0.0%) | 0 (0.0%) |
| Computers, Engineering & Science | 0 (0.0%) | 0 (0.0%) |
| Computers & Mathematics | 0 (0.0%) | 0 (0.0%) |
| Architecture & Engineering | 0 (0.0%) | 0 (0.0%) |
| Life, Physical & Social Science | 0 (0.0%) | 0 (0.0%) |
| Community & Social Service | 0 (0.0%) | 6 (100.0%) |
| Education, Arts & Media | 0 (0.0%) | 0 (0.0%) |
| Legal Services & Support | 0 (0.0%) | 0 (0.0%) |
| Education Instruction & Library | 0 (0.0%) | 3 (100.0%) |
| Arts, Media & Entertainment | 0 (0.0%) | 3 (100.0%) |
| Health Diagnosing & Treating | 0 (0.0%) | 0 (0.0%) |
| Health Technologists | 0 (0.0%) | 0 (0.0%) |
| Total (Category) | 1 (14.3%) | 6 (85.7%) |
| Total (Overall) | 13 (65.0%) | 7 (35.0%) |
Services Occupations
The most common Services occupations in Elmer are , and Cleaning & Maintenance (2 | 10.0%).
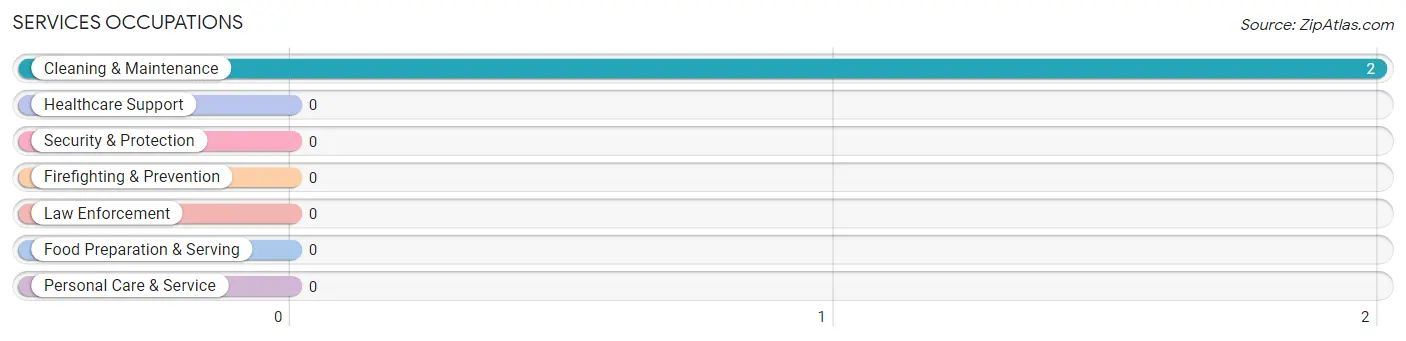
Services Occupations by Sex
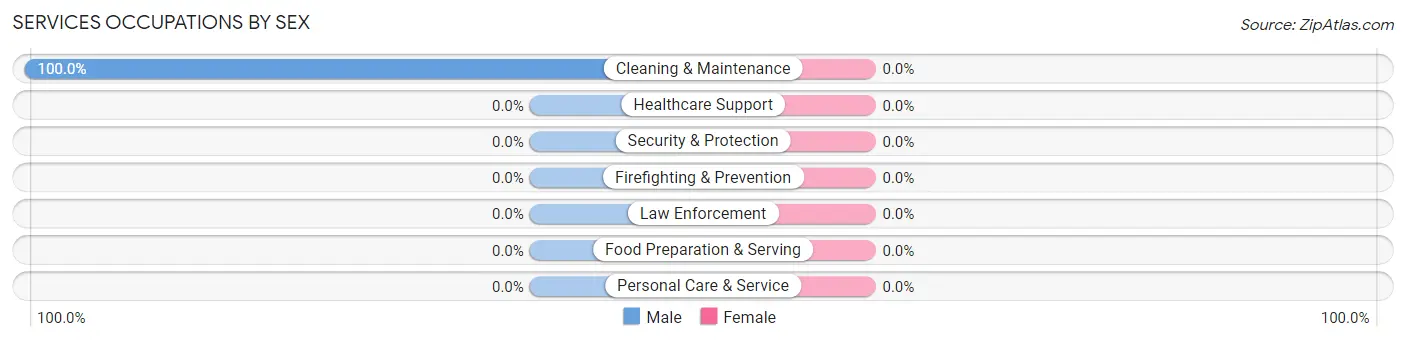
| Occupation | Male | Female |
| Healthcare Support | 0 (0.0%) | 0 (0.0%) |
| Security & Protection | 0 (0.0%) | 0 (0.0%) |
| Firefighting & Prevention | 0 (0.0%) | 0 (0.0%) |
| Law Enforcement | 0 (0.0%) | 0 (0.0%) |
| Food Preparation & Serving | 0 (0.0%) | 0 (0.0%) |
| Cleaning & Maintenance | 2 (100.0%) | 0 (0.0%) |
| Personal Care & Service | 0 (0.0%) | 0 (0.0%) |
| Total (Category) | 2 (100.0%) | 0 (0.0%) |
| Total (Overall) | 13 (65.0%) | 7 (35.0%) |
Sales and Office Occupations
The most common Sales and Office occupations in Elmer are , and Sales & Related (1 | 5.0%).
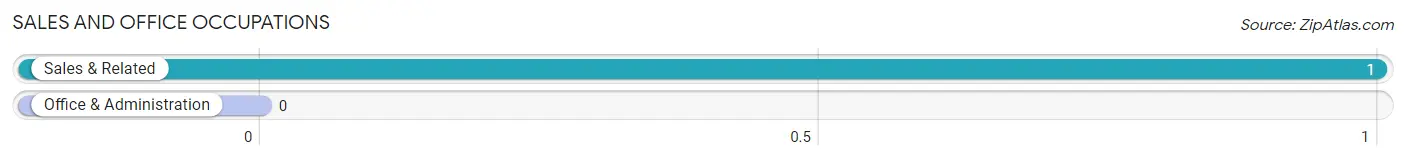
Sales and Office Occupations by Sex

| Occupation | Male | Female |
| Sales & Related | 0 (0.0%) | 1 (100.0%) |
| Office & Administration | 0 (0.0%) | 0 (0.0%) |
| Total (Category) | 0 (0.0%) | 1 (100.0%) |
| Total (Overall) | 13 (65.0%) | 7 (35.0%) |
Natural Resources, Construction and Maintenance Occupations
The most common Natural Resources, Construction and Maintenance occupations in Elmer are Construction & Extraction (7 | 35.0%), and Installation, Maintenance & Repair (3 | 15.0%).
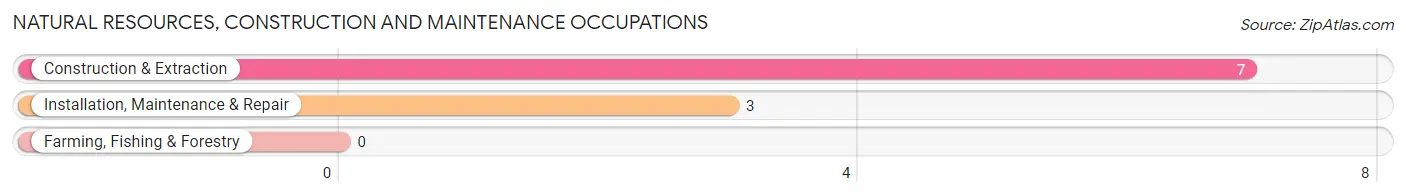
Natural Resources, Construction and Maintenance Occupations by Sex
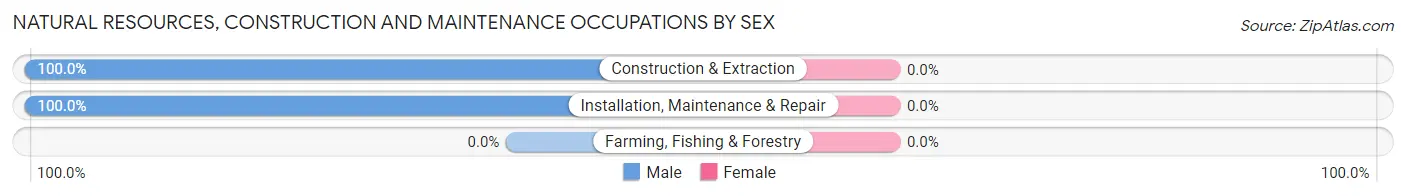
| Occupation | Male | Female |
| Farming, Fishing & Forestry | 0 (0.0%) | 0 (0.0%) |
| Construction & Extraction | 7 (100.0%) | 0 (0.0%) |
| Installation, Maintenance & Repair | 3 (100.0%) | 0 (0.0%) |
| Total (Category) | 10 (100.0%) | 0 (0.0%) |
| Total (Overall) | 13 (65.0%) | 7 (35.0%) |
Production, Transportation and Moving Occupations
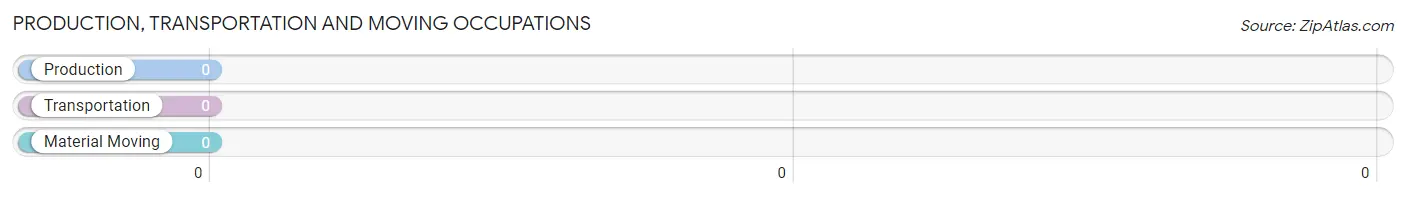
Production, Transportation and Moving Occupations by Sex
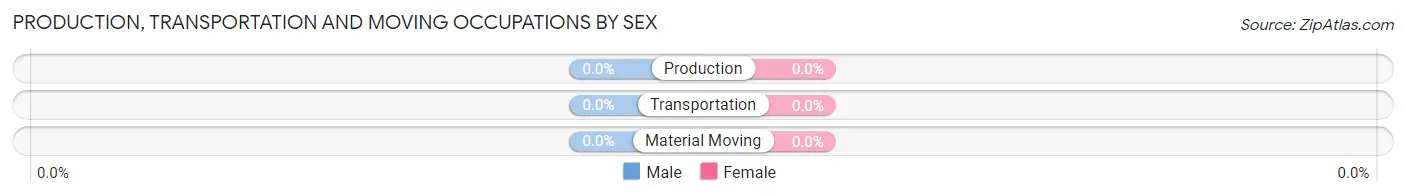
| Occupation | Male | Female |
| Production | 0 (0.0%) | 0 (0.0%) |
| Transportation | 0 (0.0%) | 0 (0.0%) |
| Material Moving | 0 (0.0%) | 0 (0.0%) |
| Total (Category) | 0 (0.0%) | 0 (0.0%) |
| Total (Overall) | 13 (65.0%) | 7 (35.0%) |
Employment Industries by Sex in Elmer
Employment Industries in Elmer
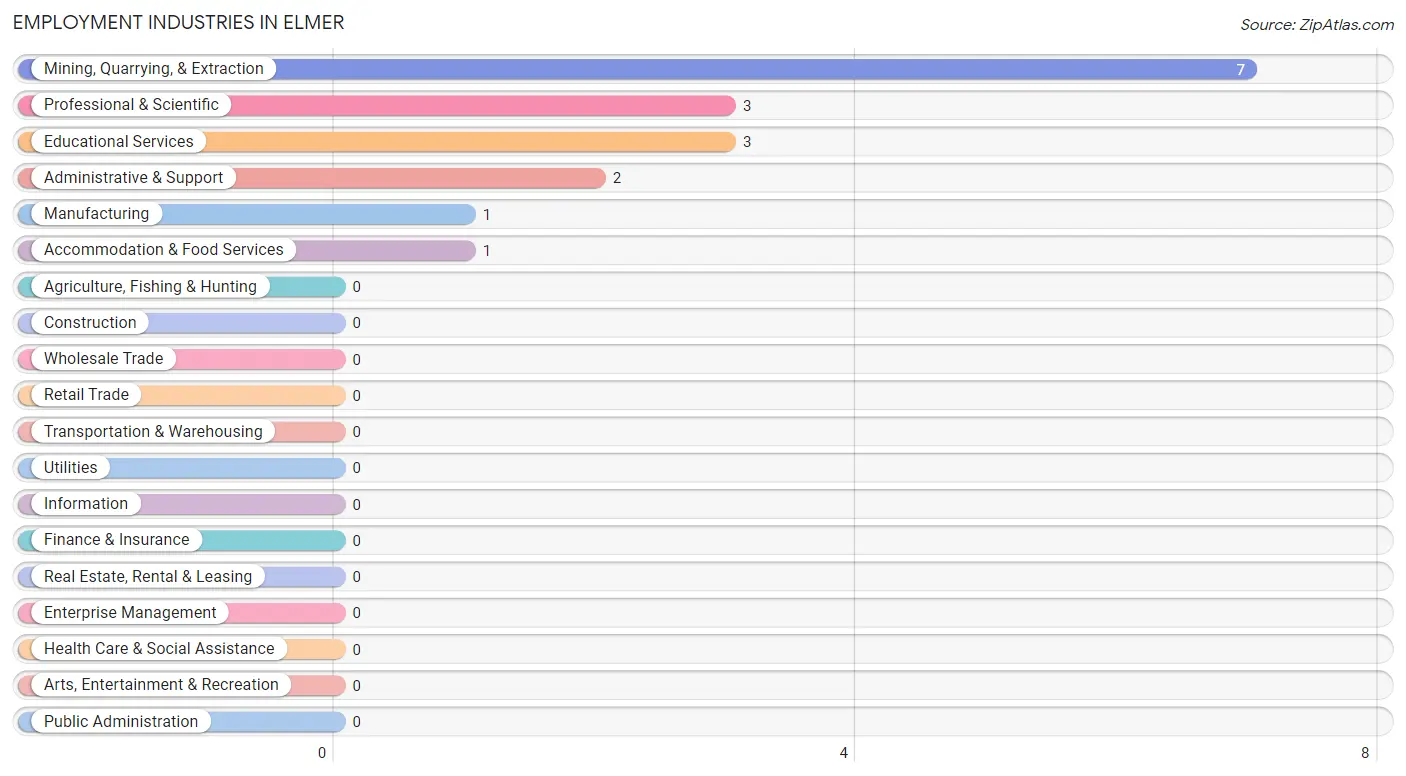
The major employment industries in Elmer include Mining, Quarrying, & Extraction (7 | 35.0%), Professional & Scientific (3 | 15.0%), Educational Services (3 | 15.0%), Administrative & Support (2 | 10.0%), and Manufacturing (1 | 5.0%).
Employment Industries by Sex in Elmer
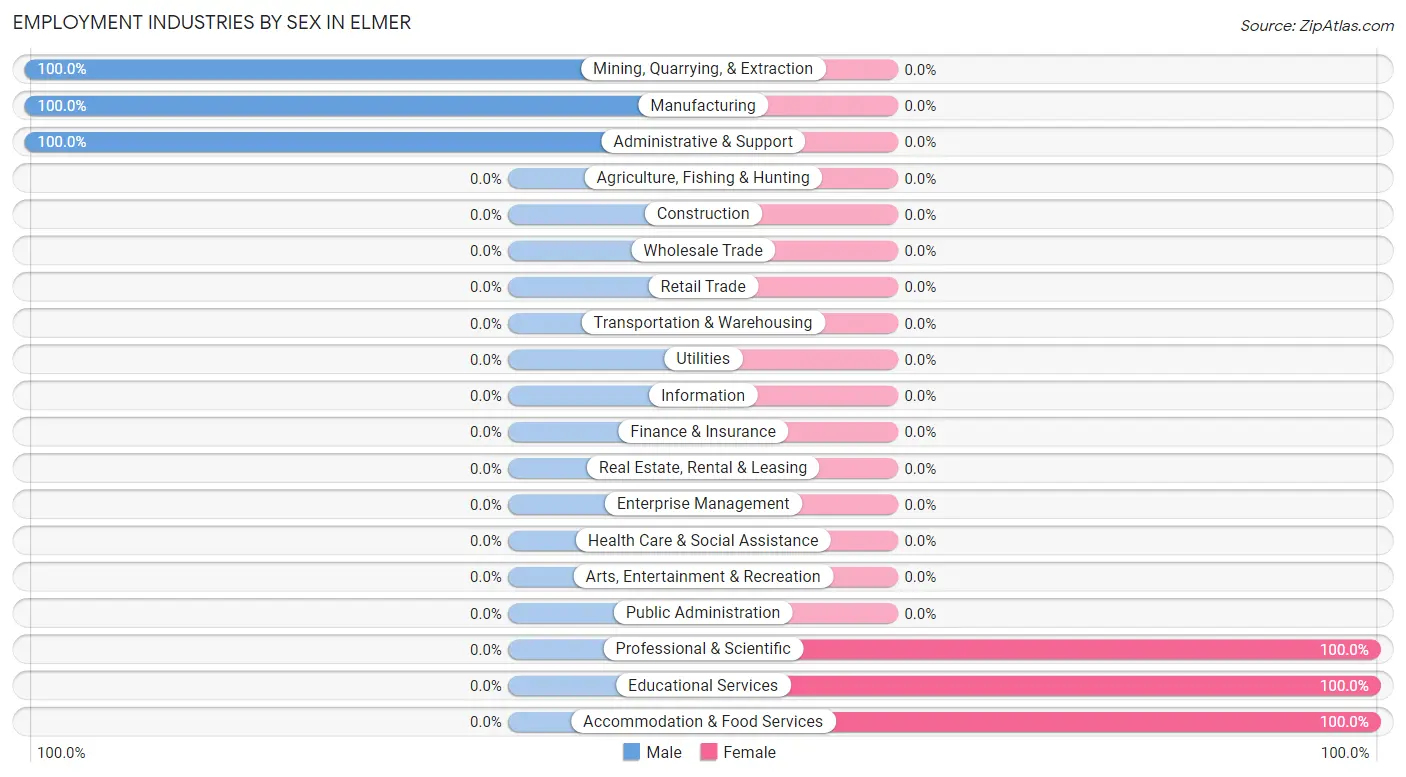
The Elmer industries that see more men than women are Mining, Quarrying, & Extraction (100.0%), Manufacturing (100.0%), and Administrative & Support (100.0%), whereas the industries that tend to have a higher number of women are Professional & Scientific (100.0%), Educational Services (100.0%), and Accommodation & Food Services (100.0%).
| Industry | Male | Female |
| Agriculture, Fishing & Hunting | 0 (0.0%) | 0 (0.0%) |
| Mining, Quarrying, & Extraction | 7 (100.0%) | 0 (0.0%) |
| Construction | 0 (0.0%) | 0 (0.0%) |
| Manufacturing | 1 (100.0%) | 0 (0.0%) |
| Wholesale Trade | 0 (0.0%) | 0 (0.0%) |
| Retail Trade | 0 (0.0%) | 0 (0.0%) |
| Transportation & Warehousing | 0 (0.0%) | 0 (0.0%) |
| Utilities | 0 (0.0%) | 0 (0.0%) |
| Information | 0 (0.0%) | 0 (0.0%) |
| Finance & Insurance | 0 (0.0%) | 0 (0.0%) |
| Real Estate, Rental & Leasing | 0 (0.0%) | 0 (0.0%) |
| Professional & Scientific | 0 (0.0%) | 3 (100.0%) |
| Enterprise Management | 0 (0.0%) | 0 (0.0%) |
| Administrative & Support | 2 (100.0%) | 0 (0.0%) |
| Educational Services | 0 (0.0%) | 3 (100.0%) |
| Health Care & Social Assistance | 0 (0.0%) | 0 (0.0%) |
| Arts, Entertainment & Recreation | 0 (0.0%) | 0 (0.0%) |
| Accommodation & Food Services | 0 (0.0%) | 1 (100.0%) |
| Public Administration | 0 (0.0%) | 0 (0.0%) |
| Total | 13 (65.0%) | 7 (35.0%) |
Education in Elmer
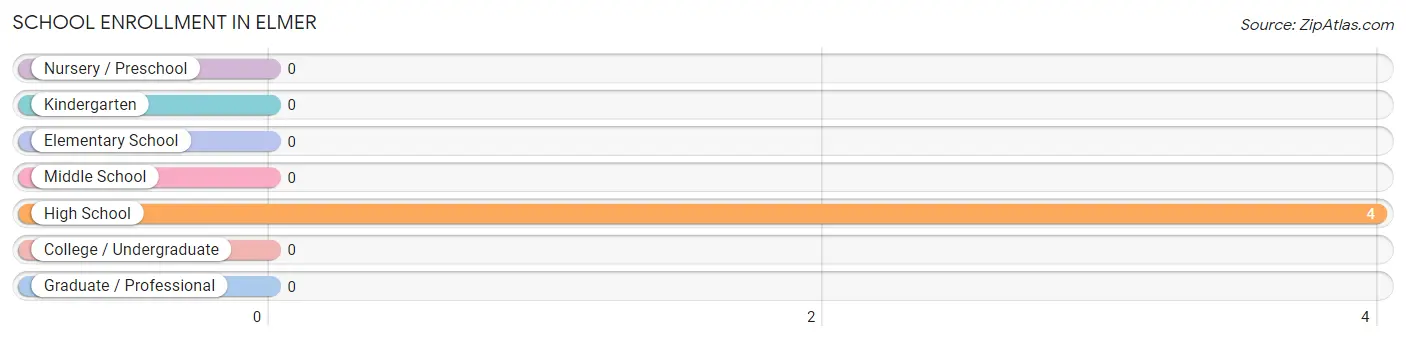
School Enrollment in Elmer
| School Level | # Students | % Students |
| Nursery / Preschool | 0 | 0.0% |
| Kindergarten | 0 | 0.0% |
| Elementary School | 0 | 0.0% |
| Middle School | 0 | 0.0% |
| High School | 4 | 100.0% |
| College / Undergraduate | 0 | 0.0% |
| Graduate / Professional | 0 | 0.0% |
| Total | 4 | 100.0% |
School Enrollment by Age by Funding Source in Elmer
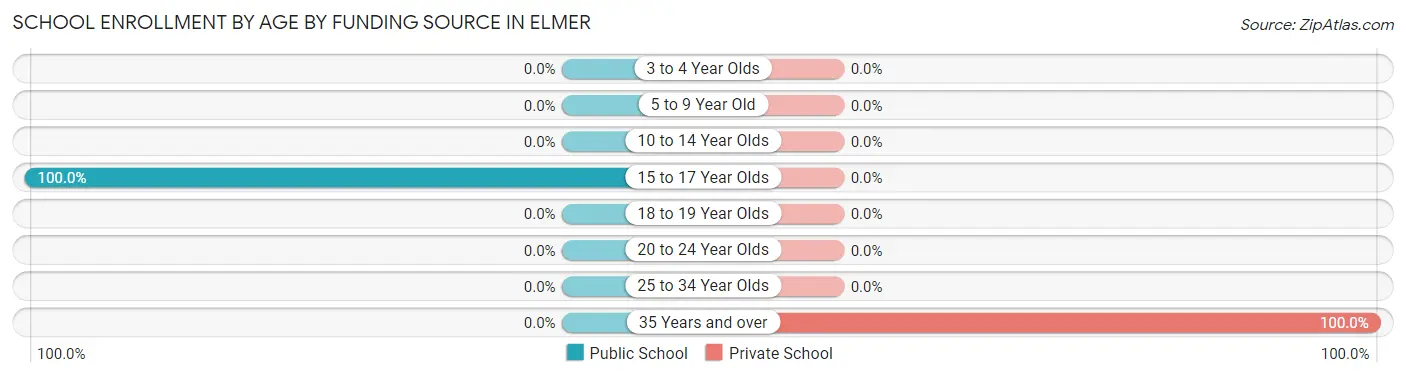
Out of a total of 4 students who are enrolled in schools in Elmer, 1 (25.0%) attend a private institution, while the remaining 3 (75.0%) are enrolled in public schools. The age group of 35 years and over has the highest likelihood of being enrolled in private schools, with 1 (100.0% in the age bracket) enrolled. Conversely, the age group of 15 to 17 year olds has the lowest likelihood of being enrolled in a private school, with 3 (100.0% in the age bracket) attending a public institution.
| Age Bracket | Public School | Private School |
| 3 to 4 Year Olds | 0 (0.0%) | 0 (0.0%) |
| 5 to 9 Year Old | 0 (0.0%) | 0 (0.0%) |
| 10 to 14 Year Olds | 0 (0.0%) | 0 (0.0%) |
| 15 to 17 Year Olds | 3 (100.0%) | 0 (0.0%) |
| 18 to 19 Year Olds | 0 (0.0%) | 0 (0.0%) |
| 20 to 24 Year Olds | 0 (0.0%) | 0 (0.0%) |
| 25 to 34 Year Olds | 0 (0.0%) | 0 (0.0%) |
| 35 Years and over | 0 (0.0%) | 1 (100.0%) |
| Total | 3 (75.0%) | 1 (25.0%) |
Educational Attainment by Field of Study in Elmer
Literature & languages (3 | 60.0%), engineering (1 | 20.0%), and business (1 | 20.0%) are the most common fields of study among 5 individuals in Elmer who have obtained a bachelor's degree or higher.
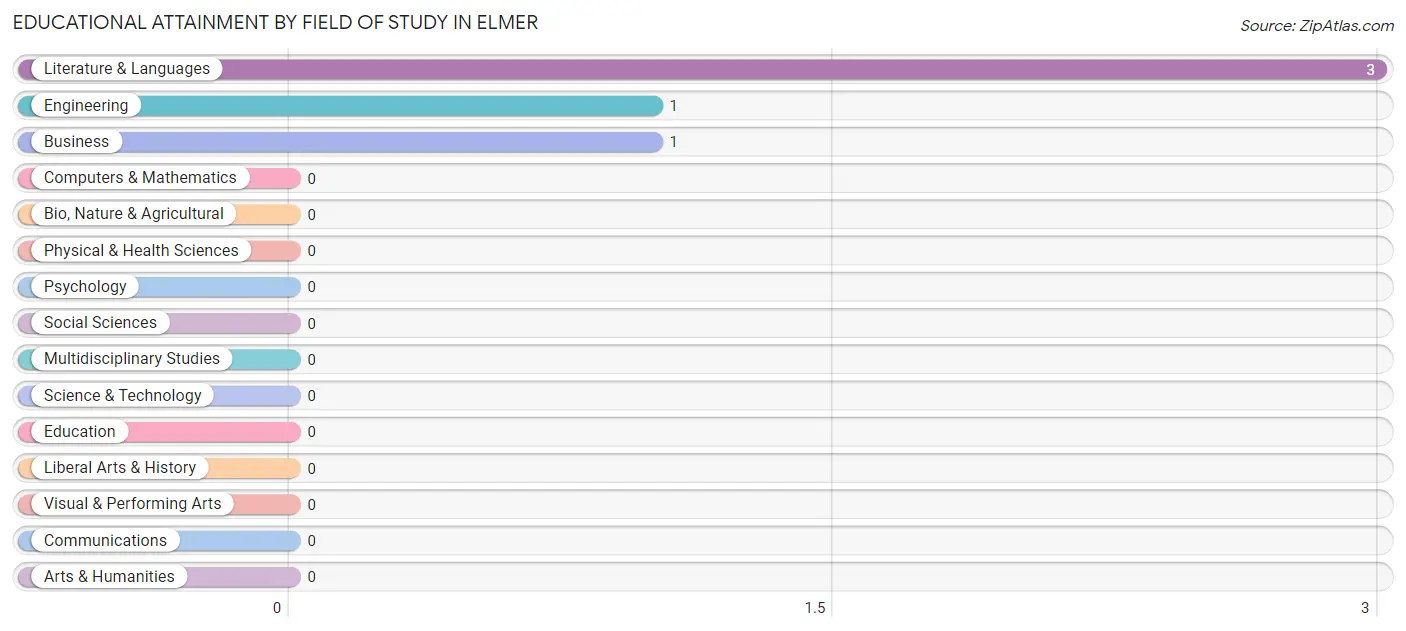
| Field of Study | # Graduates | % Graduates |
| Computers & Mathematics | 0 | 0.0% |
| Bio, Nature & Agricultural | 0 | 0.0% |
| Physical & Health Sciences | 0 | 0.0% |
| Psychology | 0 | 0.0% |
| Social Sciences | 0 | 0.0% |
| Engineering | 1 | 20.0% |
| Multidisciplinary Studies | 0 | 0.0% |
| Science & Technology | 0 | 0.0% |
| Business | 1 | 20.0% |
| Education | 0 | 0.0% |
| Literature & Languages | 3 | 60.0% |
| Liberal Arts & History | 0 | 0.0% |
| Visual & Performing Arts | 0 | 0.0% |
| Communications | 0 | 0.0% |
| Arts & Humanities | 0 | 0.0% |
| Total | 5 | 100.0% |
Transportation & Commute in Elmer
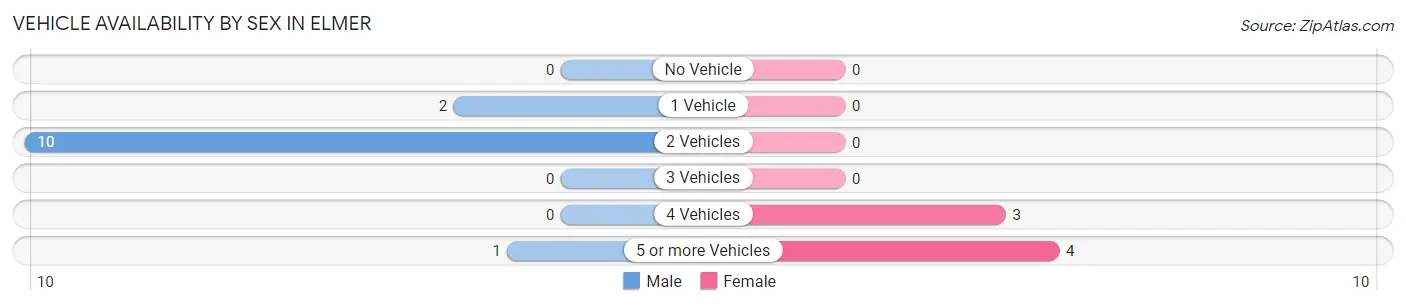
Vehicle Availability by Sex in Elmer
The most prevalent vehicle ownership categories in Elmer are males with 2 vehicles (10, accounting for 76.9%) and females with 2 vehicles (0, making up 142.9%).
| Vehicles Available | Male | Female |
| No Vehicle | 0 (0.0%) | 0 (0.0%) |
| 1 Vehicle | 2 (15.4%) | 0 (0.0%) |
| 2 Vehicles | 10 (76.9%) | 0 (0.0%) |
| 3 Vehicles | 0 (0.0%) | 0 (0.0%) |
| 4 Vehicles | 0 (0.0%) | 3 (42.9%) |
| 5 or more Vehicles | 1 (7.7%) | 4 (57.1%) |
| Total | 13 (100.0%) | 7 (100.0%) |
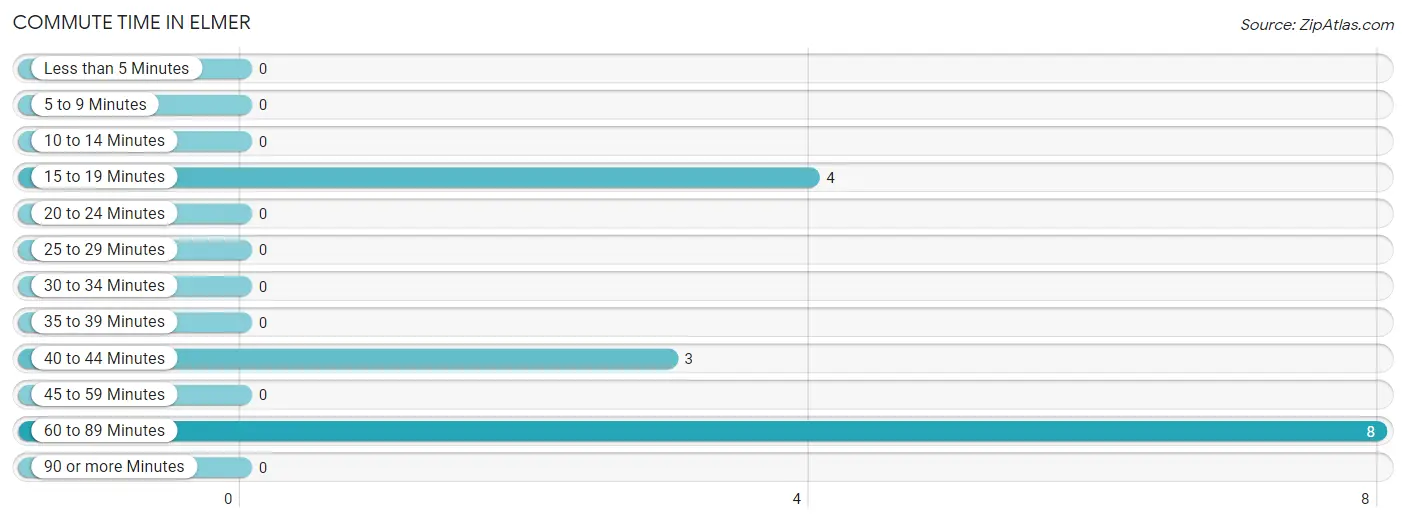
Commute Time in Elmer
The most frequently occuring commute durations in Elmer are 60 to 89 minutes (8 commuters, 53.3%), 15 to 19 minutes (4 commuters, 26.7%), and 40 to 44 minutes (3 commuters, 20.0%).
| Commute Time | # Commuters | % Commuters |
| Less than 5 Minutes | 0 | 0.0% |
| 5 to 9 Minutes | 0 | 0.0% |
| 10 to 14 Minutes | 0 | 0.0% |
| 15 to 19 Minutes | 4 | 26.7% |
| 20 to 24 Minutes | 0 | 0.0% |
| 25 to 29 Minutes | 0 | 0.0% |
| 30 to 34 Minutes | 0 | 0.0% |
| 35 to 39 Minutes | 0 | 0.0% |
| 40 to 44 Minutes | 3 | 20.0% |
| 45 to 59 Minutes | 0 | 0.0% |
| 60 to 89 Minutes | 8 | 53.3% |
| 90 or more Minutes | 0 | 0.0% |
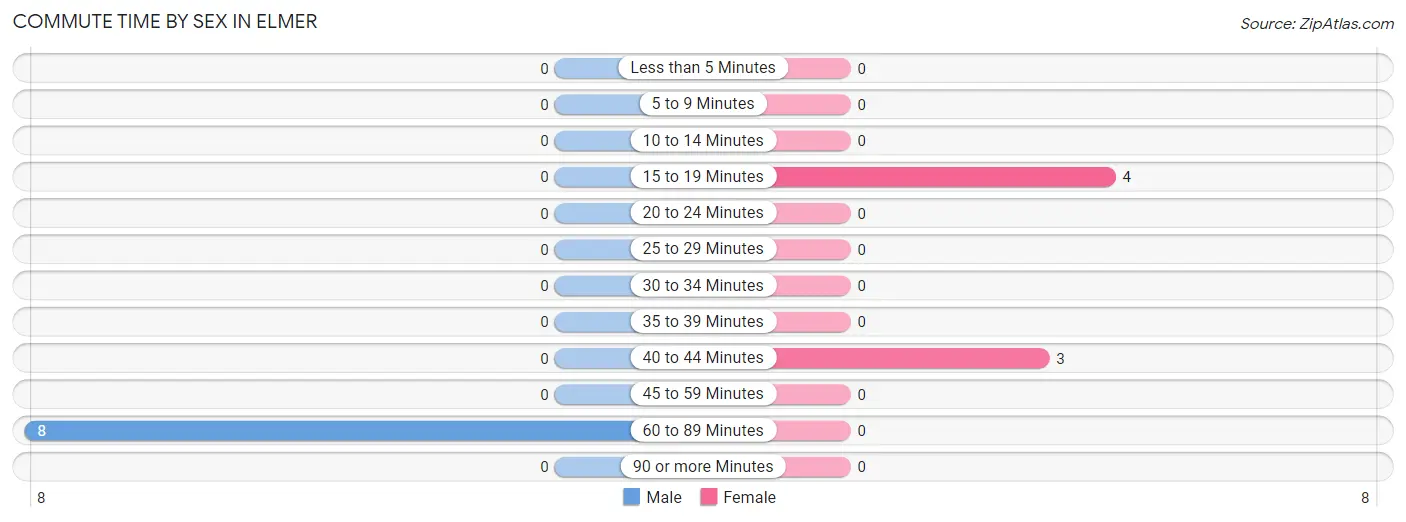
Commute Time by Sex in Elmer
The most common commute times in Elmer are 60 to 89 minutes (8 commuters, 100.0%) for males and 15 to 19 minutes (4 commuters, 57.1%) for females.
| Commute Time | Male | Female |
| Less than 5 Minutes | 0 (0.0%) | 0 (0.0%) |
| 5 to 9 Minutes | 0 (0.0%) | 0 (0.0%) |
| 10 to 14 Minutes | 0 (0.0%) | 0 (0.0%) |
| 15 to 19 Minutes | 0 (0.0%) | 4 (57.1%) |
| 20 to 24 Minutes | 0 (0.0%) | 0 (0.0%) |
| 25 to 29 Minutes | 0 (0.0%) | 0 (0.0%) |
| 30 to 34 Minutes | 0 (0.0%) | 0 (0.0%) |
| 35 to 39 Minutes | 0 (0.0%) | 0 (0.0%) |
| 40 to 44 Minutes | 0 (0.0%) | 3 (42.9%) |
| 45 to 59 Minutes | 0 (0.0%) | 0 (0.0%) |
| 60 to 89 Minutes | 8 (100.0%) | 0 (0.0%) |
| 90 or more Minutes | 0 (0.0%) | 0 (0.0%) |
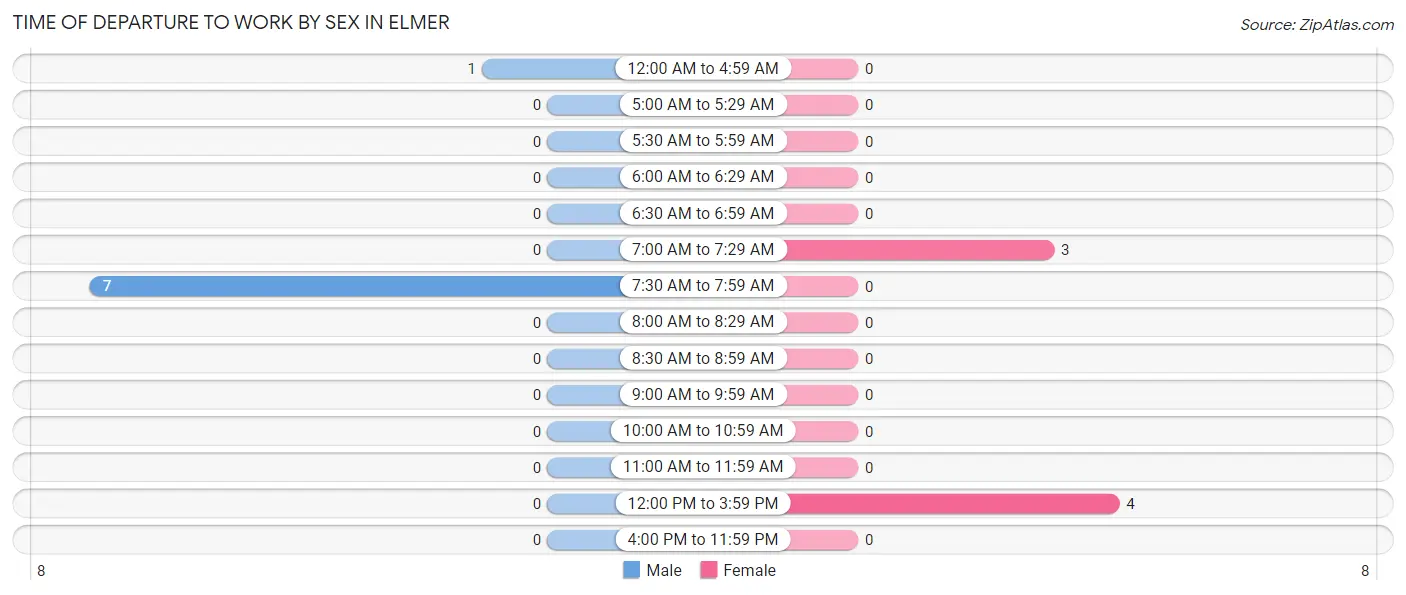
Time of Departure to Work by Sex in Elmer
The most frequent times of departure to work in Elmer are 7:30 AM to 7:59 AM (7, 87.5%) for males and 12:00 PM to 3:59 PM (4, 57.1%) for females.
| Time of Departure | Male | Female |
| 12:00 AM to 4:59 AM | 1 (12.5%) | 0 (0.0%) |
| 5:00 AM to 5:29 AM | 0 (0.0%) | 0 (0.0%) |
| 5:30 AM to 5:59 AM | 0 (0.0%) | 0 (0.0%) |
| 6:00 AM to 6:29 AM | 0 (0.0%) | 0 (0.0%) |
| 6:30 AM to 6:59 AM | 0 (0.0%) | 0 (0.0%) |
| 7:00 AM to 7:29 AM | 0 (0.0%) | 3 (42.9%) |
| 7:30 AM to 7:59 AM | 7 (87.5%) | 0 (0.0%) |
| 8:00 AM to 8:29 AM | 0 (0.0%) | 0 (0.0%) |
| 8:30 AM to 8:59 AM | 0 (0.0%) | 0 (0.0%) |
| 9:00 AM to 9:59 AM | 0 (0.0%) | 0 (0.0%) |
| 10:00 AM to 10:59 AM | 0 (0.0%) | 0 (0.0%) |
| 11:00 AM to 11:59 AM | 0 (0.0%) | 0 (0.0%) |
| 12:00 PM to 3:59 PM | 0 (0.0%) | 4 (57.1%) |
| 4:00 PM to 11:59 PM | 0 (0.0%) | 0 (0.0%) |
| Total | 8 (100.0%) | 7 (100.0%) |
Housing Occupancy in Elmer
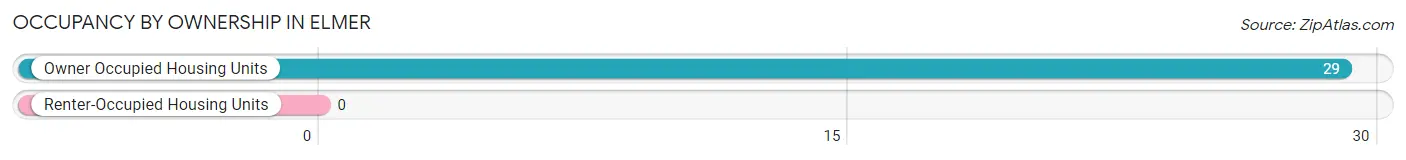
Occupancy by Ownership in Elmer
Of the total 29 dwellings in Elmer, owner-occupied units account for 29 (100.0%), while renter-occupied units make up 0 (0.0%).
| Occupancy | # Housing Units | % Housing Units |
| Owner Occupied Housing Units | 29 | 100.0% |
| Renter-Occupied Housing Units | 0 | 0.0% |
| Total Occupied Housing Units | 29 | 100.0% |
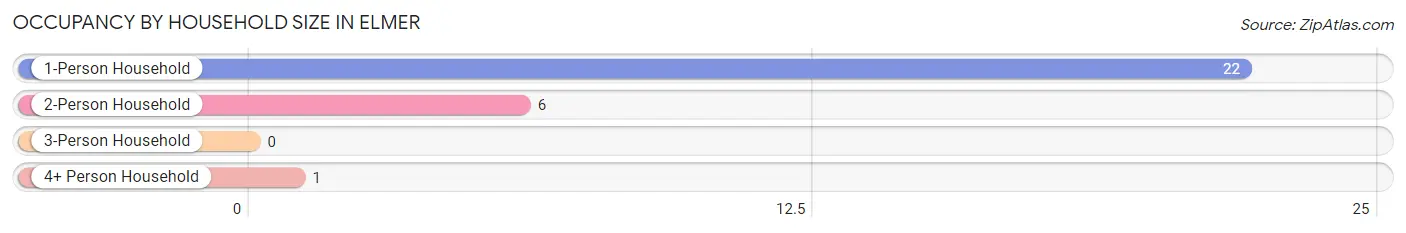
Occupancy by Household Size in Elmer
| Household Size | # Housing Units | % Housing Units |
| 1-Person Household | 22 | 75.9% |
| 2-Person Household | 6 | 20.7% |
| 3-Person Household | 0 | 0.0% |
| 4+ Person Household | 1 | 3.5% |
| Total Housing Units | 29 | 100.0% |
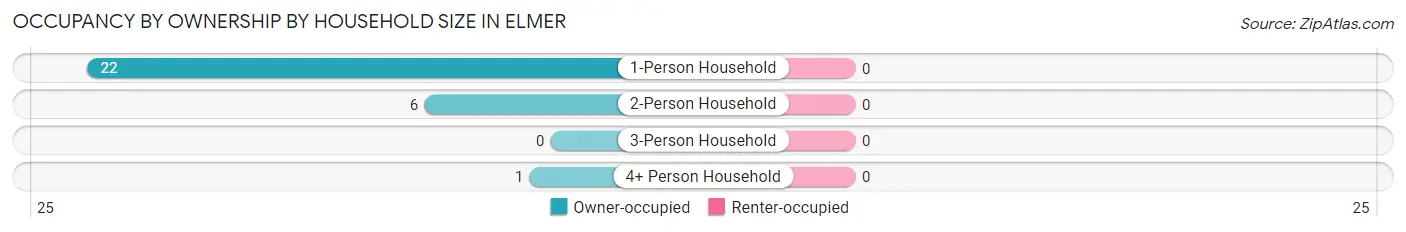
Occupancy by Ownership by Household Size in Elmer
| Household Size | Owner-occupied | Renter-occupied |
| 1-Person Household | 22 (100.0%) | 0 (0.0%) |
| 2-Person Household | 6 (100.0%) | 0 (0.0%) |
| 3-Person Household | 0 (0.0%) | 0 (0.0%) |
| 4+ Person Household | 1 (100.0%) | 0 (0.0%) |
| Total Housing Units | 29 (100.0%) | 0 (0.0%) |
Occupancy by Educational Attainment in Elmer
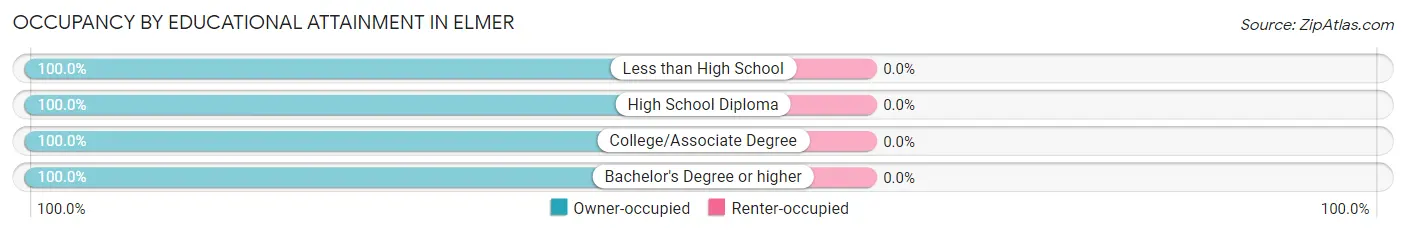
| Household Size | Owner-occupied | Renter-occupied |
| Less than High School | 4 (100.0%) | 0 (0.0%) |
| High School Diploma | 20 (100.0%) | 0 (0.0%) |
| College/Associate Degree | 1 (100.0%) | 0 (0.0%) |
| Bachelor's Degree or higher | 4 (100.0%) | 0 (0.0%) |
Occupancy by Age of Householder in Elmer
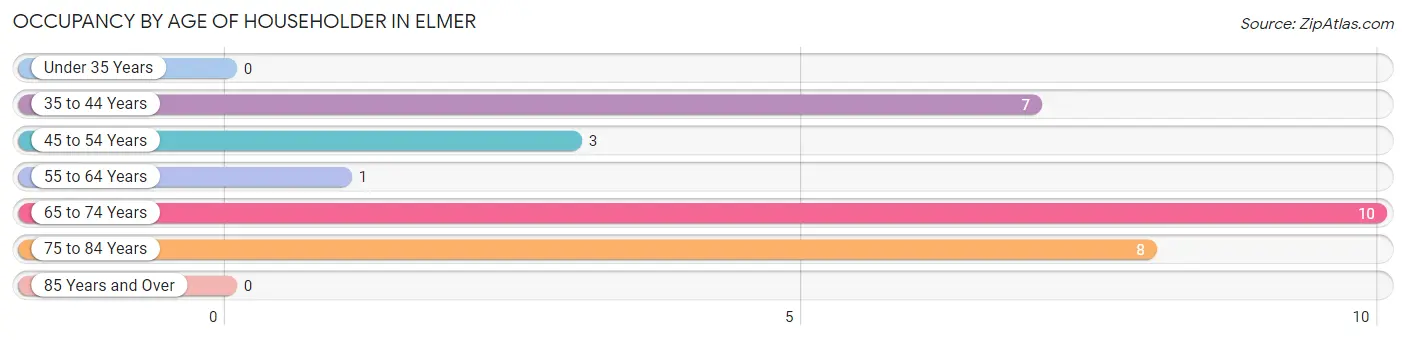
| Age Bracket | # Households | % Households |
| Under 35 Years | 0 | 0.0% |
| 35 to 44 Years | 7 | 24.1% |
| 45 to 54 Years | 3 | 10.3% |
| 55 to 64 Years | 1 | 3.5% |
| 65 to 74 Years | 10 | 34.5% |
| 75 to 84 Years | 8 | 27.6% |
| 85 Years and Over | 0 | 0.0% |
| Total | 29 | 100.0% |
Housing Finances in Elmer
Median Income by Occupancy in Elmer
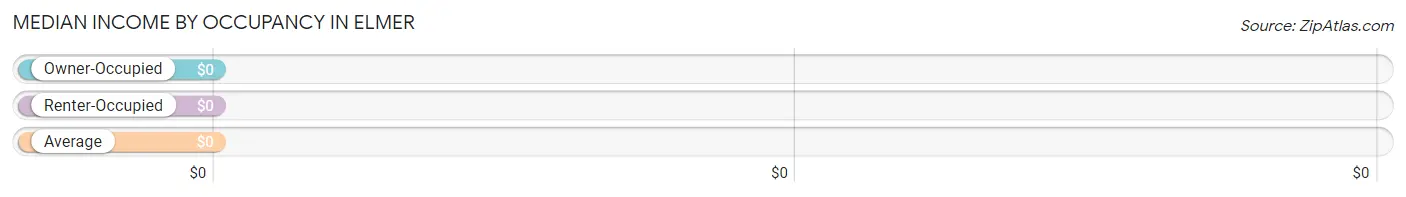
| Occupancy Type | # Households | Median Income |
| Owner-Occupied | 29 (100.0%) | $0 |
| Renter-Occupied | 0 (0.0%) | $0 |
| Average | 29 (100.0%) | $0 |
Occupancy by Householder Income Bracket in Elmer
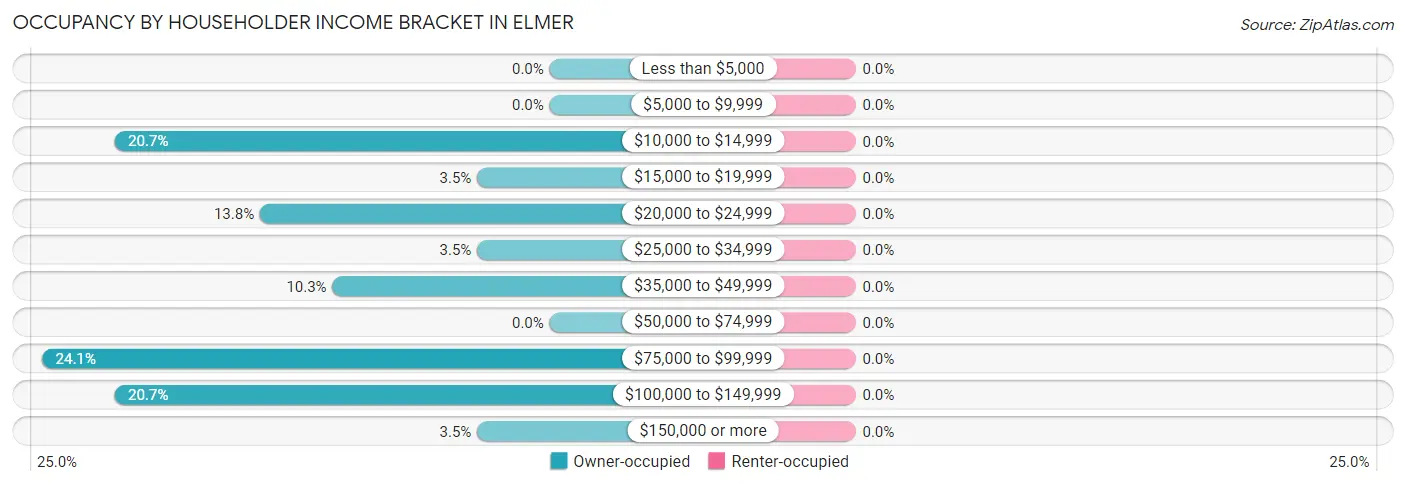
| Income Bracket | Owner-occupied | Renter-occupied |
| Less than $5,000 | 0 (0.0%) | 0 (0.0%) |
| $5,000 to $9,999 | 0 (0.0%) | 0 (0.0%) |
| $10,000 to $14,999 | 6 (20.7%) | 0 (0.0%) |
| $15,000 to $19,999 | 1 (3.5%) | 0 (0.0%) |
| $20,000 to $24,999 | 4 (13.8%) | 0 (0.0%) |
| $25,000 to $34,999 | 1 (3.5%) | 0 (0.0%) |
| $35,000 to $49,999 | 3 (10.3%) | 0 (0.0%) |
| $50,000 to $74,999 | 0 (0.0%) | 0 (0.0%) |
| $75,000 to $99,999 | 7 (24.1%) | 0 (0.0%) |
| $100,000 to $149,999 | 6 (20.7%) | 0 (0.0%) |
| $150,000 or more | 1 (3.5%) | 0 (0.0%) |
| Total | 29 (100.0%) | 0 (0.0%) |
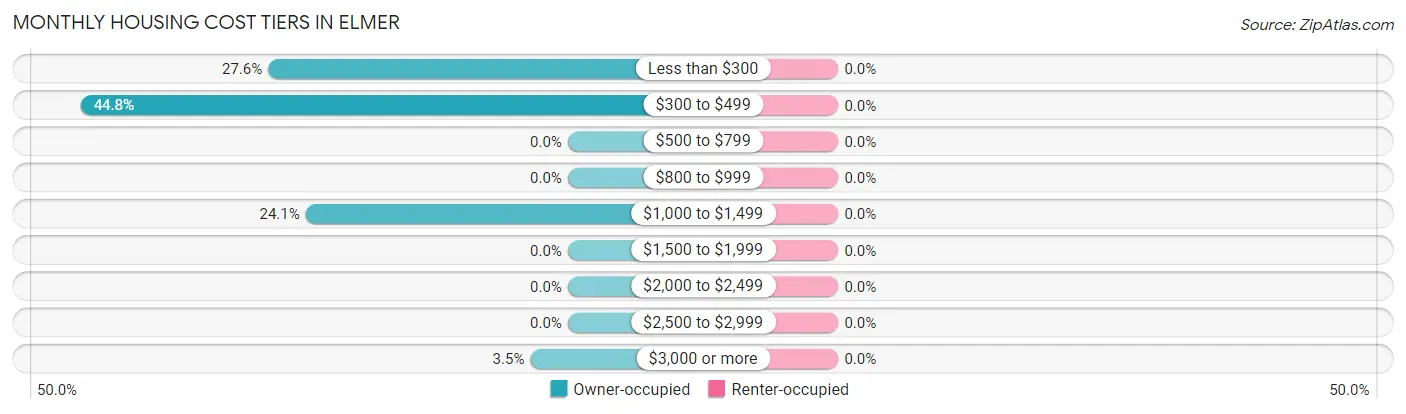
Monthly Housing Cost Tiers in Elmer
| Monthly Cost | Owner-occupied | Renter-occupied |
| Less than $300 | 8 (27.6%) | 0 (0.0%) |
| $300 to $499 | 13 (44.8%) | 0 (0.0%) |
| $500 to $799 | 0 (0.0%) | 0 (0.0%) |
| $800 to $999 | 0 (0.0%) | 0 (0.0%) |
| $1,000 to $1,499 | 7 (24.1%) | 0 (0.0%) |
| $1,500 to $1,999 | 0 (0.0%) | 0 (0.0%) |
| $2,000 to $2,499 | 0 (0.0%) | 0 (0.0%) |
| $2,500 to $2,999 | 0 (0.0%) | 0 (0.0%) |
| $3,000 or more | 1 (3.5%) | 0 (0.0%) |
| Total | 29 (100.0%) | 0 (0.0%) |
Physical Housing Characteristics in Elmer
Housing Structures in Elmer
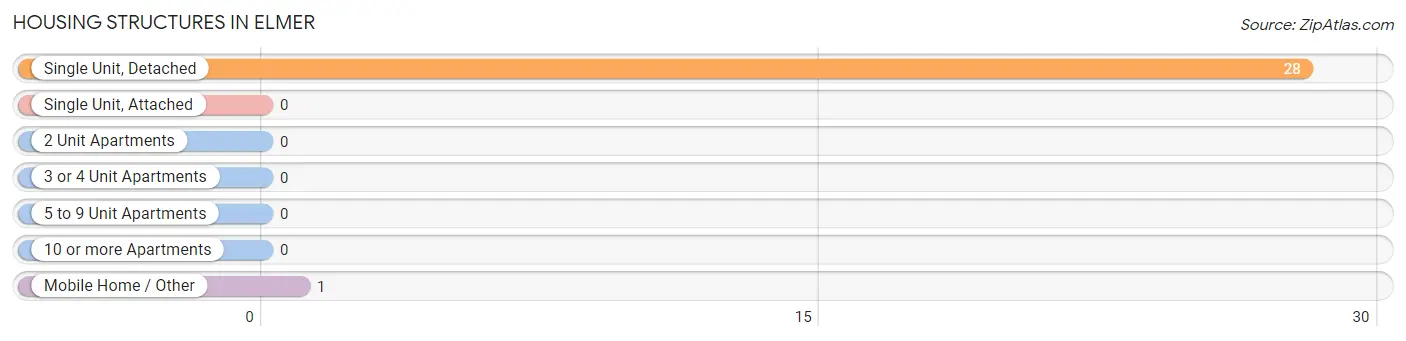
| Structure Type | # Housing Units | % Housing Units |
| Single Unit, Detached | 28 | 96.6% |
| Single Unit, Attached | 0 | 0.0% |
| 2 Unit Apartments | 0 | 0.0% |
| 3 or 4 Unit Apartments | 0 | 0.0% |
| 5 to 9 Unit Apartments | 0 | 0.0% |
| 10 or more Apartments | 0 | 0.0% |
| Mobile Home / Other | 1 | 3.5% |
| Total | 29 | 100.0% |
Housing Structures by Occupancy in Elmer
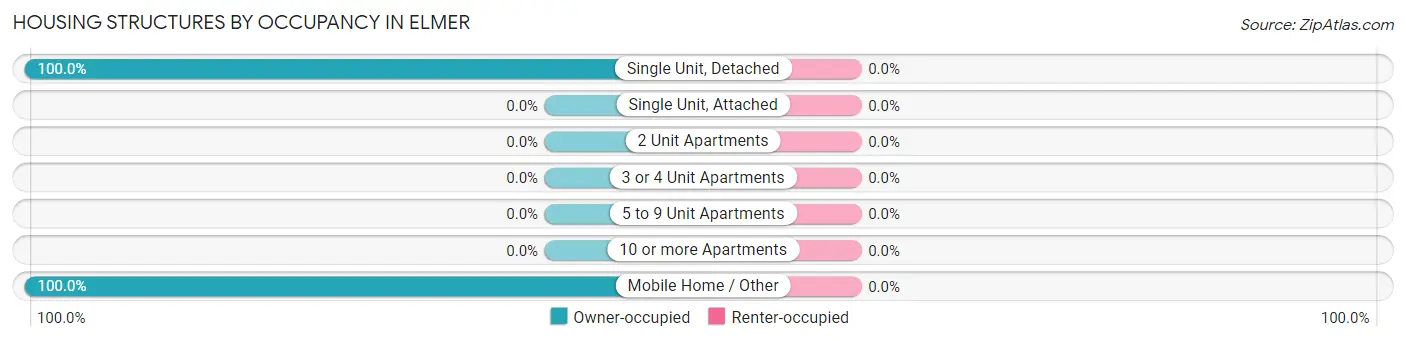
| Structure Type | Owner-occupied | Renter-occupied |
| Single Unit, Detached | 28 (100.0%) | 0 (0.0%) |
| Single Unit, Attached | 0 (0.0%) | 0 (0.0%) |
| 2 Unit Apartments | 0 (0.0%) | 0 (0.0%) |
| 3 or 4 Unit Apartments | 0 (0.0%) | 0 (0.0%) |
| 5 to 9 Unit Apartments | 0 (0.0%) | 0 (0.0%) |
| 10 or more Apartments | 0 (0.0%) | 0 (0.0%) |
| Mobile Home / Other | 1 (100.0%) | 0 (0.0%) |
| Total | 29 (100.0%) | 0 (0.0%) |
Housing Structures by Number of Rooms in Elmer
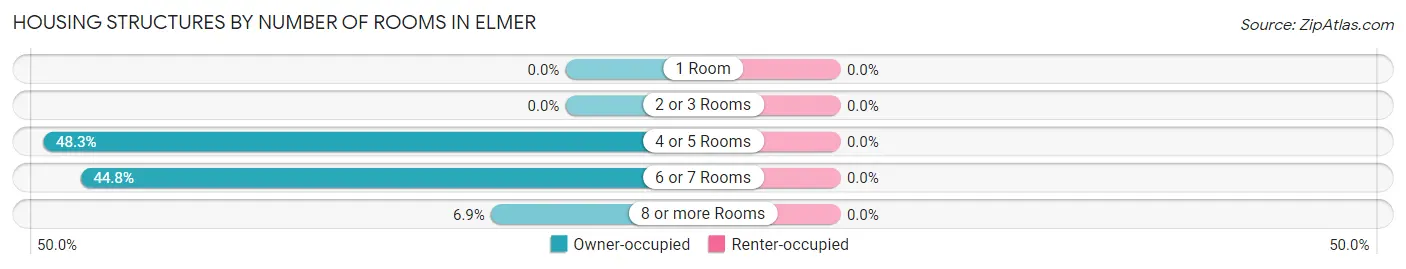
| Number of Rooms | Owner-occupied | Renter-occupied |
| 1 Room | 0 (0.0%) | 0 (0.0%) |
| 2 or 3 Rooms | 0 (0.0%) | 0 (0.0%) |
| 4 or 5 Rooms | 14 (48.3%) | 0 (0.0%) |
| 6 or 7 Rooms | 13 (44.8%) | 0 (0.0%) |
| 8 or more Rooms | 2 (6.9%) | 0 (0.0%) |
| Total | 29 (100.0%) | 0 (0.0%) |
Housing Structure by Heating Type in Elmer
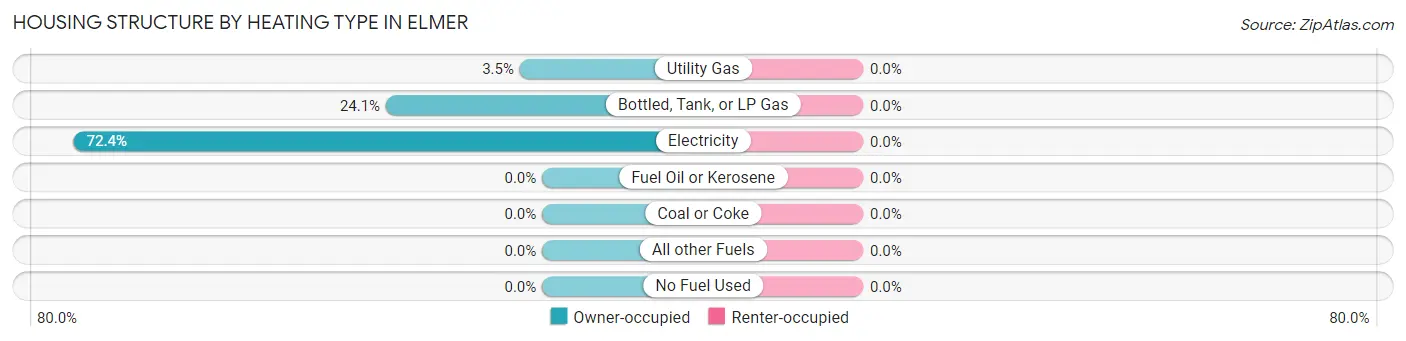
| Heating Type | Owner-occupied | Renter-occupied |
| Utility Gas | 1 (3.5%) | 0 (0.0%) |
| Bottled, Tank, or LP Gas | 7 (24.1%) | 0 (0.0%) |
| Electricity | 21 (72.4%) | 0 (0.0%) |
| Fuel Oil or Kerosene | 0 (0.0%) | 0 (0.0%) |
| Coal or Coke | 0 (0.0%) | 0 (0.0%) |
| All other Fuels | 0 (0.0%) | 0 (0.0%) |
| No Fuel Used | 0 (0.0%) | 0 (0.0%) |
| Total | 29 (100.0%) | 0 (0.0%) |
Household Vehicle Usage in Elmer
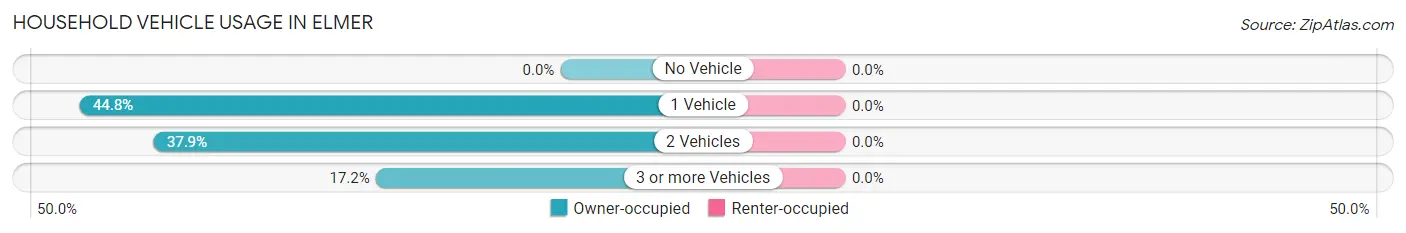
| Vehicles per Household | Owner-occupied | Renter-occupied |
| No Vehicle | 0 (0.0%) | 0 (0.0%) |
| 1 Vehicle | 13 (44.8%) | 0 (0.0%) |
| 2 Vehicles | 11 (37.9%) | 0 (0.0%) |
| 3 or more Vehicles | 5 (17.2%) | 0 (0.0%) |
| Total | 29 (100.0%) | 0 (0.0%) |
Real Estate & Mortgages in Elmer
Real Estate and Mortgage Overview in Elmer
| Characteristic | Without Mortgage | With Mortgage |
| Housing Units | 21 | 8 |
| Median Property Value | $83,900 | $0 |
| Median Household Income | - | - |
| Monthly Housing Costs | $392 | $1 |
| Real Estate Taxes | $833 | $0 |
Property Value by Mortgage Status in Elmer
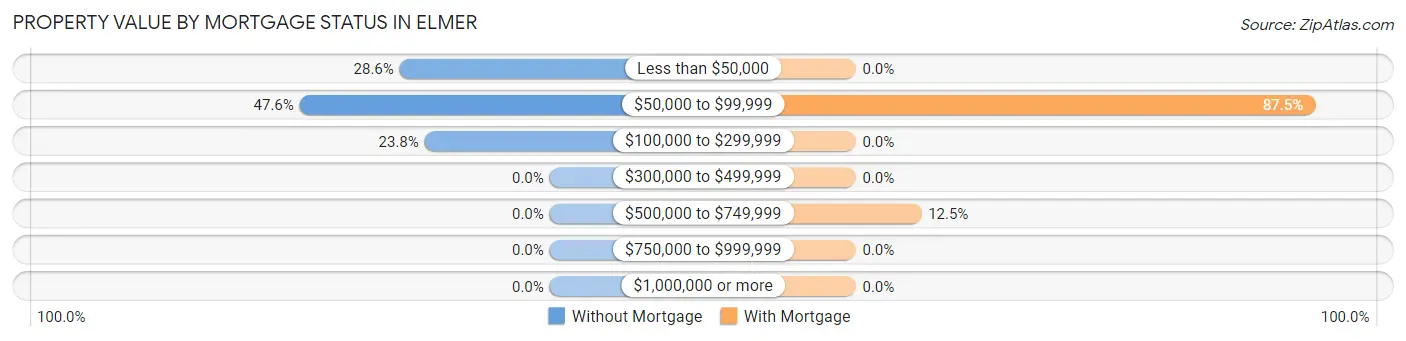
| Property Value | Without Mortgage | With Mortgage |
| Less than $50,000 | 6 (28.6%) | 0 (0.0%) |
| $50,000 to $99,999 | 10 (47.6%) | 7 (87.5%) |
| $100,000 to $299,999 | 5 (23.8%) | 0 (0.0%) |
| $300,000 to $499,999 | 0 (0.0%) | 0 (0.0%) |
| $500,000 to $749,999 | 0 (0.0%) | 1 (12.5%) |
| $750,000 to $999,999 | 0 (0.0%) | 0 (0.0%) |
| $1,000,000 or more | 0 (0.0%) | 0 (0.0%) |
| Total | 21 (100.0%) | 8 (100.0%) |
Household Income by Mortgage Status in Elmer
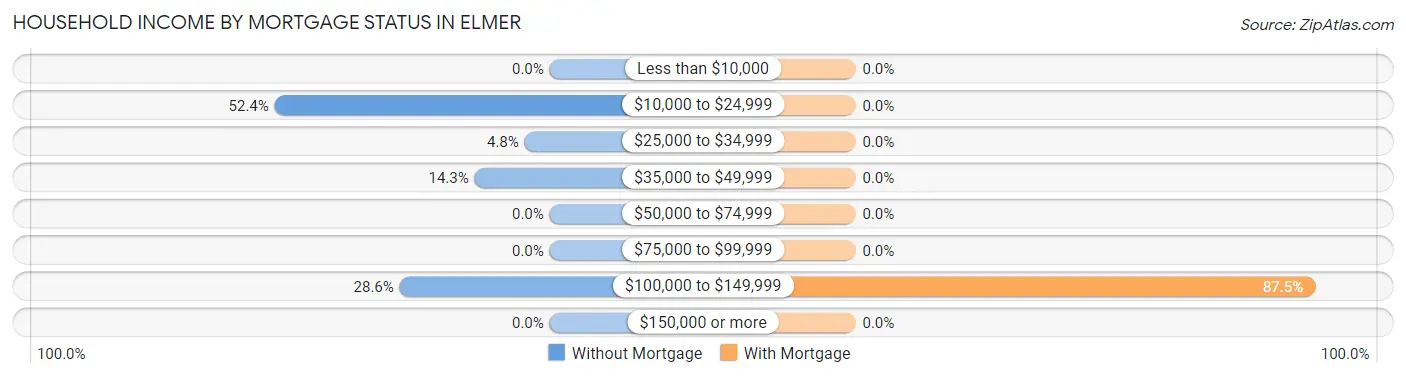
| Household Income | Without Mortgage | With Mortgage |
| Less than $10,000 | 0 (0.0%) | 0 (0.0%) |
| $10,000 to $24,999 | 11 (52.4%) | 0 (0.0%) |
| $25,000 to $34,999 | 1 (4.8%) | 0 (0.0%) |
| $35,000 to $49,999 | 3 (14.3%) | 0 (0.0%) |
| $50,000 to $74,999 | 0 (0.0%) | 0 (0.0%) |
| $75,000 to $99,999 | 0 (0.0%) | 0 (0.0%) |
| $100,000 to $149,999 | 6 (28.6%) | 7 (87.5%) |
| $150,000 or more | 0 (0.0%) | 0 (0.0%) |
| Total | 21 (100.0%) | 8 (100.0%) |
Property Value to Household Income Ratio in Elmer
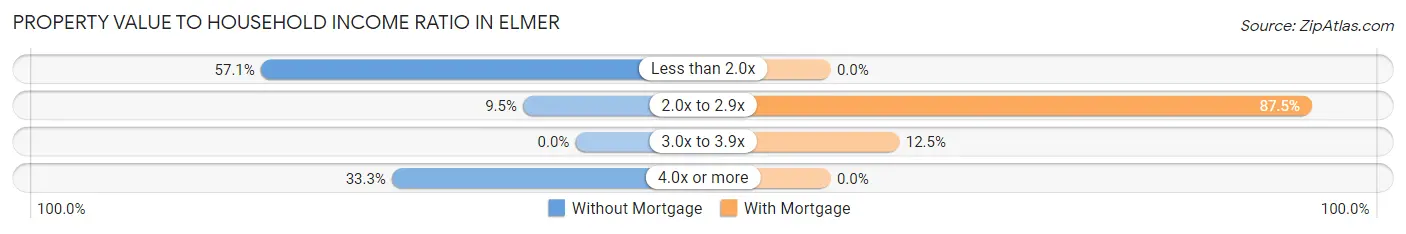
| Value-to-Income Ratio | Without Mortgage | With Mortgage |
| Less than 2.0x | 12 (57.1%) | 0 (0.0%) |
| 2.0x to 2.9x | 2 (9.5%) | 7 (87.5%) |
| 3.0x to 3.9x | 0 (0.0%) | 1 (12.5%) |
| 4.0x or more | 7 (33.3%) | 0 (0.0%) |
| Total | 21 (100.0%) | 8 (100.0%) |
Real Estate Taxes by Mortgage Status in Elmer
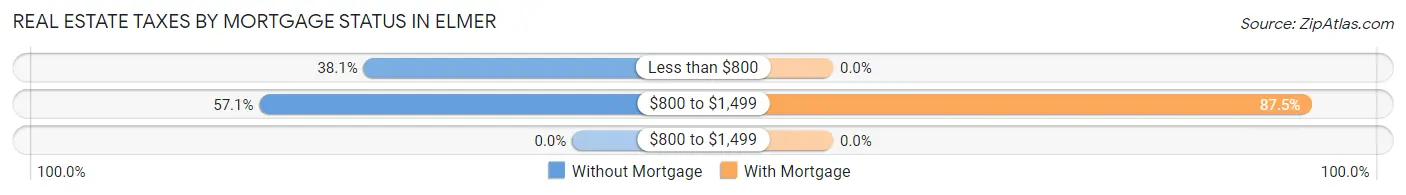
| Property Taxes | Without Mortgage | With Mortgage |
| Less than $800 | 8 (38.1%) | 0 (0.0%) |
| $800 to $1,499 | 12 (57.1%) | 7 (87.5%) |
| $800 to $1,499 | 0 (0.0%) | 0 (0.0%) |
| Total | 21 (100.0%) | 8 (100.0%) |
Health & Disability in Elmer
Health Insurance Coverage by Age in Elmer
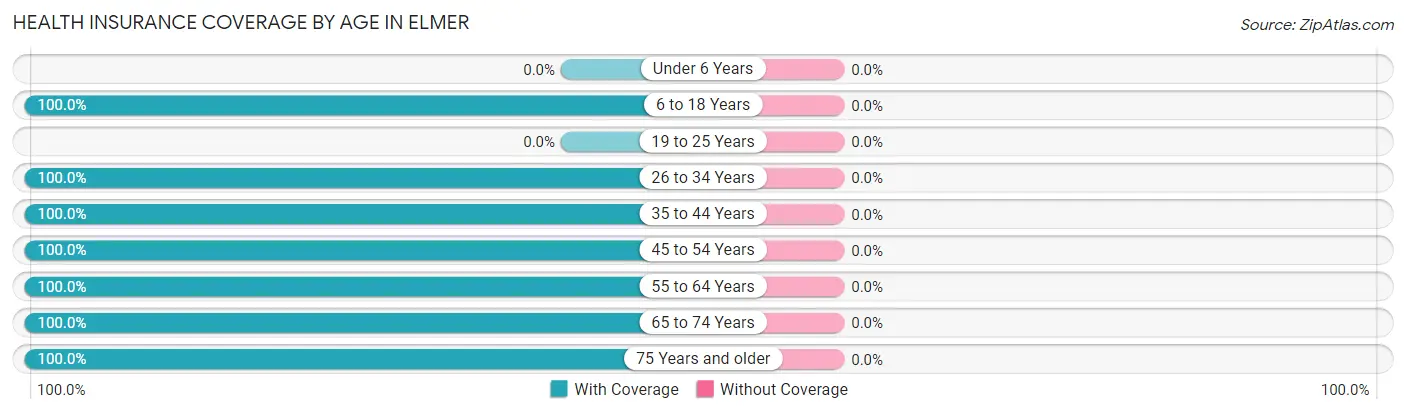
| Age Bracket | With Coverage | Without Coverage |
| Under 6 Years | 0 (0.0%) | 0 (0.0%) |
| 6 to 18 Years | 4 (100.0%) | 0 (0.0%) |
| 19 to 25 Years | 0 (0.0%) | 0 (0.0%) |
| 26 to 34 Years | 2 (100.0%) | 0 (0.0%) |
| 35 to 44 Years | 7 (100.0%) | 0 (0.0%) |
| 45 to 54 Years | 3 (100.0%) | 0 (0.0%) |
| 55 to 64 Years | 5 (100.0%) | 0 (0.0%) |
| 65 to 74 Years | 11 (100.0%) | 0 (0.0%) |
| 75 Years and older | 8 (100.0%) | 0 (0.0%) |
| Total | 40 (100.0%) | 0 (0.0%) |
Health Insurance Coverage by Citizenship Status in Elmer

| Citizenship Status | With Coverage | Without Coverage |
| Native Born | 0 (0.0%) | 0 (0.0%) |
| Foreign Born, Citizen | 4 (100.0%) | 0 (0.0%) |
| Foreign Born, not a Citizen | 0 (0.0%) | 0 (0.0%) |
Health Insurance Coverage by Household Income in Elmer
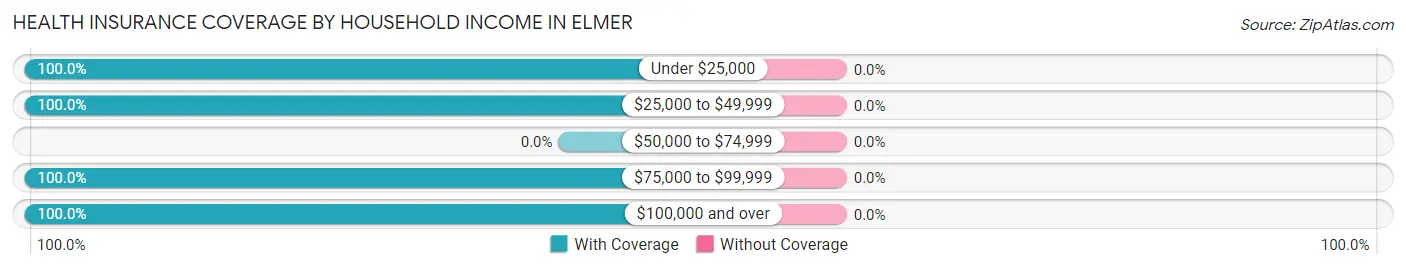
| Household Income | With Coverage | Without Coverage |
| Under $25,000 | 11 (100.0%) | 0 (0.0%) |
| $25,000 to $49,999 | 7 (100.0%) | 0 (0.0%) |
| $50,000 to $74,999 | 0 (0.0%) | 0 (0.0%) |
| $75,000 to $99,999 | 7 (100.0%) | 0 (0.0%) |
| $100,000 and over | 15 (100.0%) | 0 (0.0%) |
Public vs Private Health Insurance Coverage by Age in Elmer
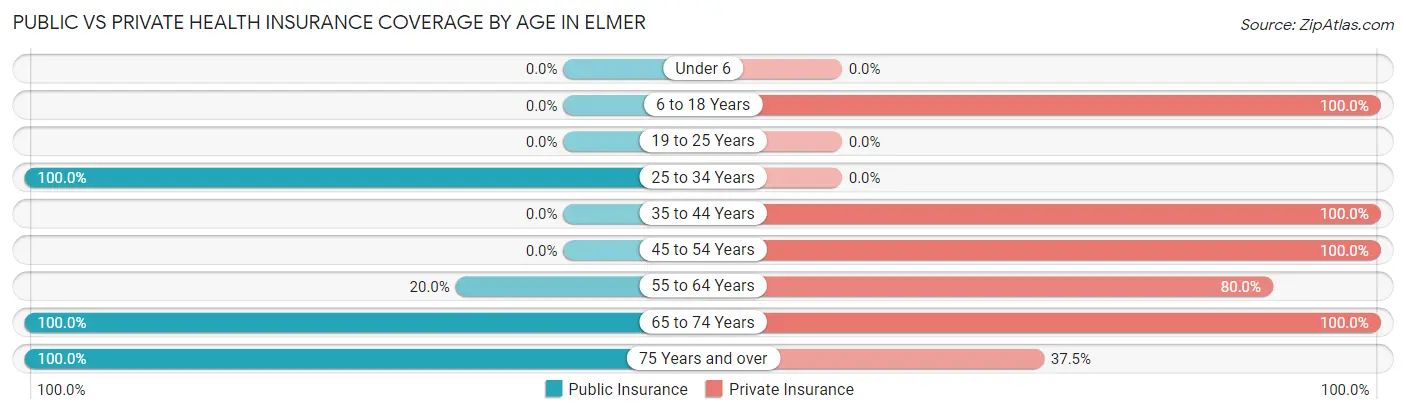
| Age Bracket | Public Insurance | Private Insurance |
| Under 6 | 0 (0.0%) | 0 (0.0%) |
| 6 to 18 Years | 0 (0.0%) | 4 (100.0%) |
| 19 to 25 Years | 0 (0.0%) | 0 (0.0%) |
| 25 to 34 Years | 2 (100.0%) | 0 (0.0%) |
| 35 to 44 Years | 0 (0.0%) | 7 (100.0%) |
| 45 to 54 Years | 0 (0.0%) | 3 (100.0%) |
| 55 to 64 Years | 1 (20.0%) | 4 (80.0%) |
| 65 to 74 Years | 11 (100.0%) | 11 (100.0%) |
| 75 Years and over | 8 (100.0%) | 3 (37.5%) |
| Total | 22 (55.0%) | 32 (80.0%) |
Disability Status by Sex by Age in Elmer
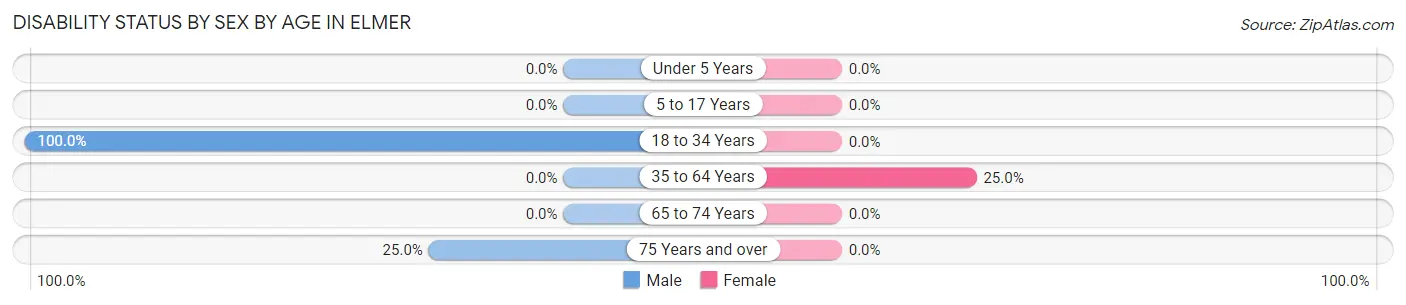
| Age Bracket | Male | Female |
| Under 5 Years | 0 (0.0%) | 0 (0.0%) |
| 5 to 17 Years | 0 (0.0%) | 0 (0.0%) |
| 18 to 34 Years | 2 (100.0%) | 0 (0.0%) |
| 35 to 64 Years | 0 (0.0%) | 1 (25.0%) |
| 65 to 74 Years | 0 (0.0%) | 0 (0.0%) |
| 75 Years and over | 1 (25.0%) | 0 (0.0%) |
Disability Class by Sex by Age in Elmer
Disability Class: Hearing Difficulty
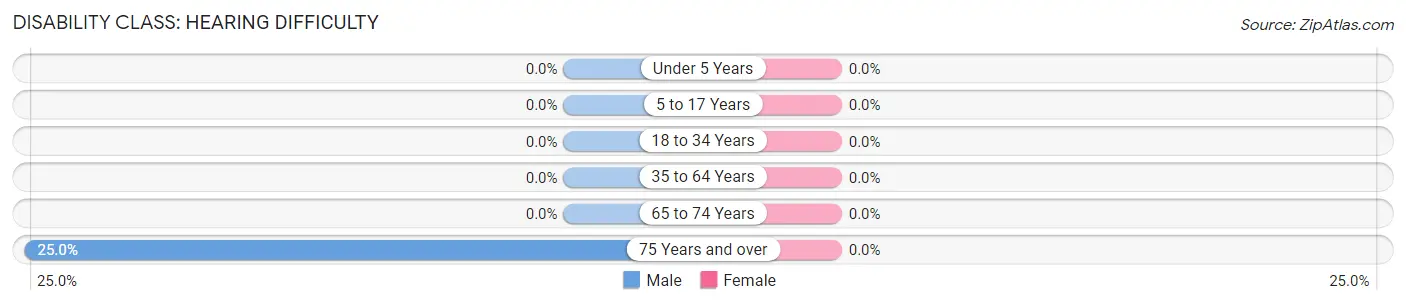
| Age Bracket | Male | Female |
| Under 5 Years | 0 (0.0%) | 0 (0.0%) |
| 5 to 17 Years | 0 (0.0%) | 0 (0.0%) |
| 18 to 34 Years | 0 (0.0%) | 0 (0.0%) |
| 35 to 64 Years | 0 (0.0%) | 0 (0.0%) |
| 65 to 74 Years | 0 (0.0%) | 0 (0.0%) |
| 75 Years and over | 1 (25.0%) | 0 (0.0%) |
Disability Class: Vision Difficulty
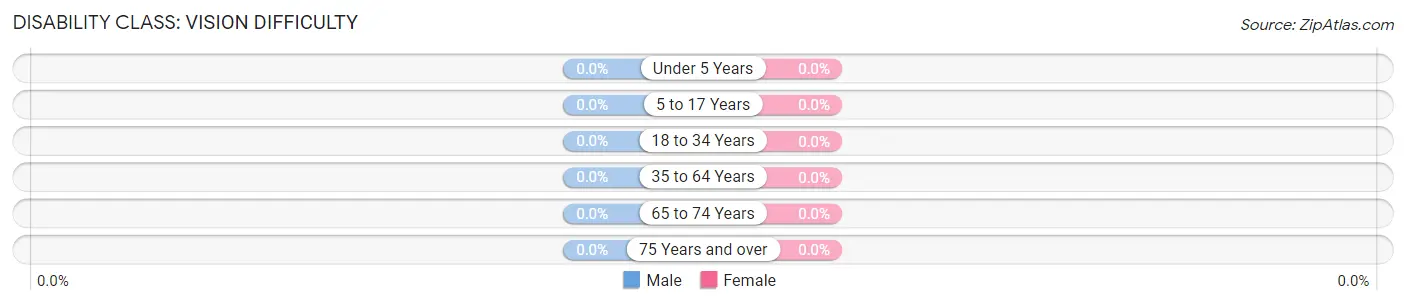
| Age Bracket | Male | Female |
| Under 5 Years | 0 (0.0%) | 0 (0.0%) |
| 5 to 17 Years | 0 (0.0%) | 0 (0.0%) |
| 18 to 34 Years | 0 (0.0%) | 0 (0.0%) |
| 35 to 64 Years | 0 (0.0%) | 0 (0.0%) |
| 65 to 74 Years | 0 (0.0%) | 0 (0.0%) |
| 75 Years and over | 0 (0.0%) | 0 (0.0%) |
Disability Class: Cognitive Difficulty
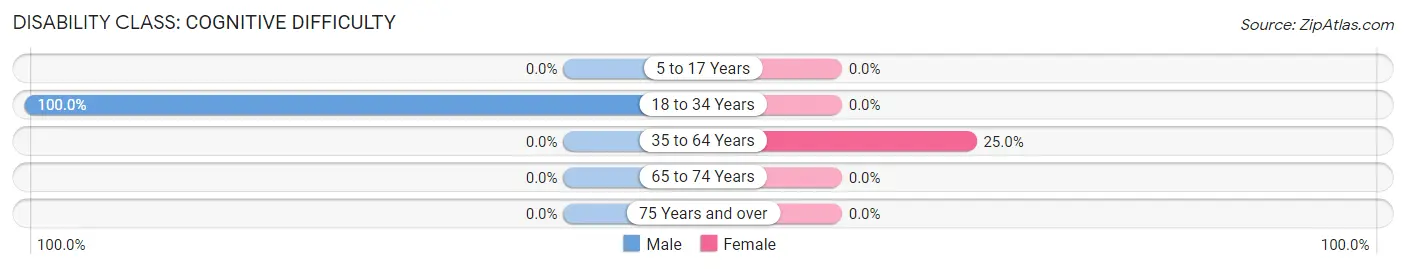
| Age Bracket | Male | Female |
| 5 to 17 Years | 0 (0.0%) | 0 (0.0%) |
| 18 to 34 Years | 2 (100.0%) | 0 (0.0%) |
| 35 to 64 Years | 0 (0.0%) | 1 (25.0%) |
| 65 to 74 Years | 0 (0.0%) | 0 (0.0%) |
| 75 Years and over | 0 (0.0%) | 0 (0.0%) |
Disability Class: Ambulatory Difficulty
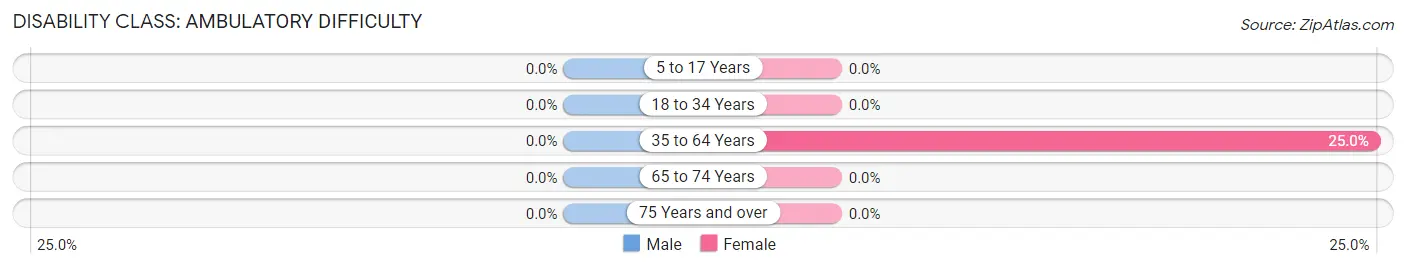
| Age Bracket | Male | Female |
| 5 to 17 Years | 0 (0.0%) | 0 (0.0%) |
| 18 to 34 Years | 0 (0.0%) | 0 (0.0%) |
| 35 to 64 Years | 0 (0.0%) | 1 (25.0%) |
| 65 to 74 Years | 0 (0.0%) | 0 (0.0%) |
| 75 Years and over | 0 (0.0%) | 0 (0.0%) |
Disability Class: Self-Care Difficulty
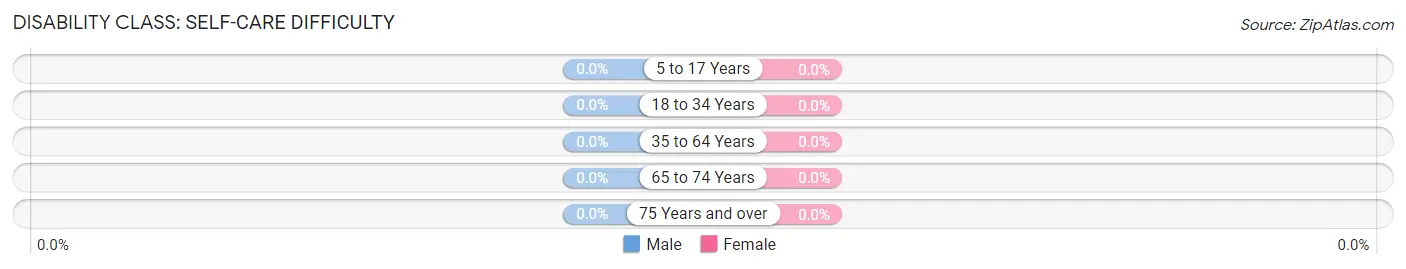
| Age Bracket | Male | Female |
| 5 to 17 Years | 0 (0.0%) | 0 (0.0%) |
| 18 to 34 Years | 0 (0.0%) | 0 (0.0%) |
| 35 to 64 Years | 0 (0.0%) | 0 (0.0%) |
| 65 to 74 Years | 0 (0.0%) | 0 (0.0%) |
| 75 Years and over | 0 (0.0%) | 0 (0.0%) |
Technology Access in Elmer
Computing Device Access in Elmer
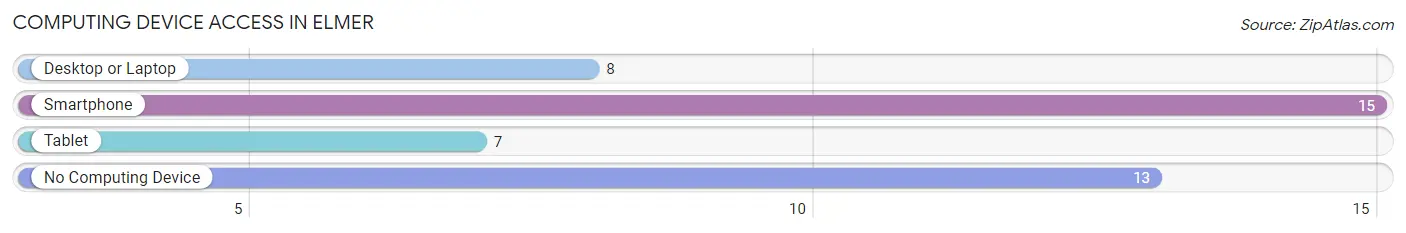
| Device Type | # Households | % Households |
| Desktop or Laptop | 8 | 27.6% |
| Smartphone | 15 | 51.7% |
| Tablet | 7 | 24.1% |
| No Computing Device | 13 | 44.8% |
| Total | 29 | 100.0% |
Internet Access in Elmer
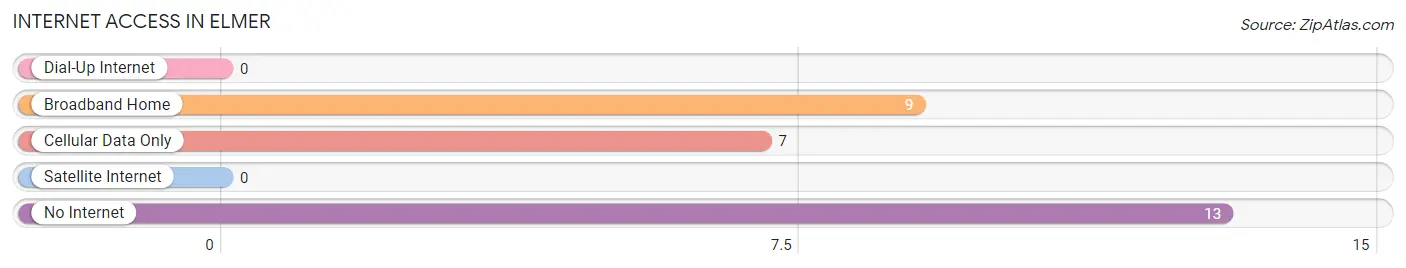
| Internet Type | # Households | % Households |
| Dial-Up Internet | 0 | 0.0% |
| Broadband Home | 9 | 31.0% |
| Cellular Data Only | 7 | 24.1% |
| Satellite Internet | 0 | 0.0% |
| No Internet | 13 | 44.8% |
| Total | 29 | 100.0% |
Elmer Summary
Elmer, Oklahoma is a small town located in the southwestern corner of the state, in Jackson County. It is situated on the banks of the North Fork of the Red River, and is surrounded by rolling hills and lush farmland. The town was founded in 1891, and has a population of just over 500 people.
Geography
Elmer is located in the southwestern corner of Oklahoma, in Jackson County. It is situated on the banks of the North Fork of the Red River, and is surrounded by rolling hills and lush farmland. The town is located approximately 25 miles south of Altus, Oklahoma, and is about an hour and a half drive from Oklahoma City. The town is situated at an elevation of 1,068 feet above sea level.
The climate in Elmer is generally mild, with hot summers and cold winters. The average high temperature in the summer is around 90 degrees Fahrenheit, and the average low temperature in the winter is around 30 degrees Fahrenheit. The town receives an average of 36 inches of precipitation per year, with most of it falling in the spring and summer months.
Economy
The economy of Elmer is largely based on agriculture. The town is home to several farms, which produce a variety of crops, including wheat, corn, soybeans, and cotton. The town also has a few small businesses, including a grocery store, a hardware store, and a few restaurants.
The town is also home to a few manufacturing companies, including a furniture factory and a plastics factory. These companies provide jobs for many of the town’s residents.
Demographics
As of the 2010 census, Elmer had a population of 514 people. The racial makeup of the town was 95.3% White, 0.6% African American, 0.4% Native American, 0.2% Asian, 0.2% from other races, and 3.3% from two or more races. Hispanic or Latino of any race were 1.2% of the population.
The median household income in Elmer was $31,250, and the median family income was $37,500. The per capita income for the town was $15,945. About 16.2% of the population was below the poverty line.
History
Elmer was founded in 1891 by a group of settlers from Texas. The town was named after Elmer E. Jones, a local rancher and businessman. The town quickly grew, and by the early 1900s, it had become a thriving agricultural center.
In the 1920s, the town was hit hard by the Great Depression, and many of the businesses and farms in the area closed. However, the town was able to recover, and by the 1950s, it had become a prosperous farming community once again.
Today, Elmer is a small, quiet town. It is a popular destination for tourists, who come to enjoy the peaceful atmosphere and the beautiful scenery. The town is also home to a few small businesses, and is a great place to raise a family.
Common Questions
What is Per Capita Income in Elmer?
Per Capita income in Elmer is $51,708.
What is Inequality or Gini Index in Elmer?
Inequality or Gini Index in Elmer is 0.45.
What is the Total Population of Elmer?
Total Population of Elmer is 40.
What is the Total Male Population of Elmer?
Total Male Population of Elmer is 21.
What is the Total Female Population of Elmer?
Total Female Population of Elmer is 19.
What is the Ratio of Males per 100 Females in Elmer?
There are 110.53 Males per 100 Females in Elmer.
What is the Ratio of Females per 100 Males in Elmer?
There are 90.48 Females per 100 Males in Elmer.
What is the Median Population Age in Elmer?
Median Population Age in Elmer is 63.8 Years.
What is the Average Family Size in Elmer
Average Family Size in Elmer is 2.6 People.
What is the Average Household Size in Elmer
Average Household Size in Elmer is 1.4 People.
How Large is the Labor Force in Elmer?
There are 20 People in the Labor Forcein in Elmer.
What is the Percentage of People in the Labor Force in Elmer?
50.0% of People are in the Labor Force in Elmer.