Nicoma Park, OK Map & Demographics
Nicoma Park Map
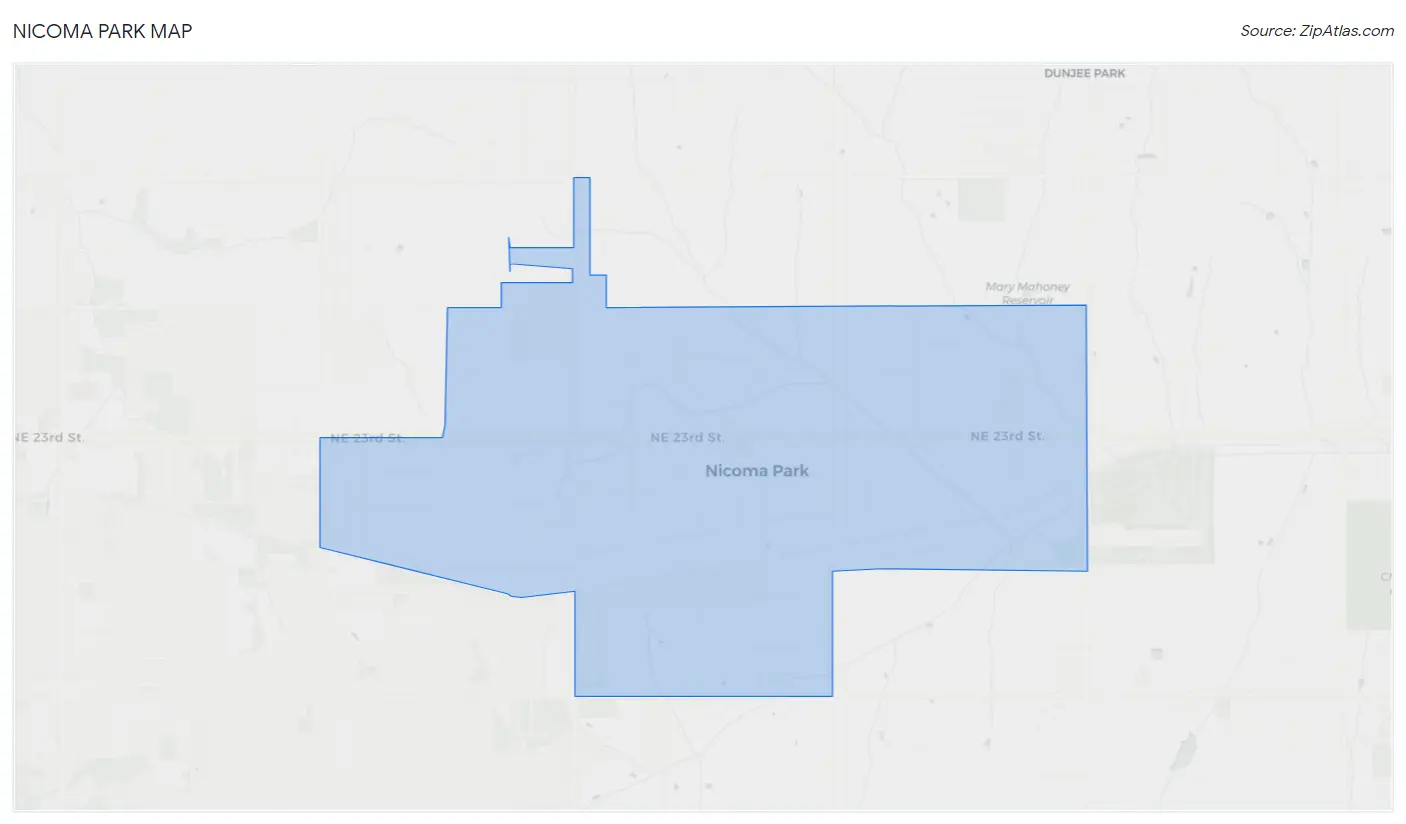
Nicoma Park Overview
$29,747
PER CAPITA INCOME
$87,250
AVG FAMILY INCOME
$61,146
AVG HOUSEHOLD INCOME
33.6%
WAGE / INCOME GAP [ % ]
66.4¢/ $1
WAGE / INCOME GAP [ $ ]
0.44
INEQUALITY / GINI INDEX
2,542
TOTAL POPULATION
1,310
MALE POPULATION
1,232
FEMALE POPULATION
106.33
MALES / 100 FEMALES
94.05
FEMALES / 100 MALES
35.6
MEDIAN AGE
3.5
AVG FAMILY SIZE
2.8
AVG HOUSEHOLD SIZE
1,108
LABOR FORCE [ PEOPLE ]
60.3%
PERCENT IN LABOR FORCE
3.4%
UNEMPLOYMENT RATE
Nicoma Park Zip Codes
Nicoma Park Area Codes
Income in Nicoma Park
Income Overview in Nicoma Park
Per Capita Income in Nicoma Park is $29,747, while median incomes of families and households are $87,250 and $61,146 respectively.
| Characteristic | Number | Measure |
| Per Capita Income | 2,542 | $29,747 |
| Median Family Income | 603 | $87,250 |
| Mean Family Income | 603 | $98,129 |
| Median Household Income | 917 | $61,146 |
| Mean Household Income | 917 | $81,208 |
| Income Deficit | 603 | $0 |
| Wage / Income Gap (%) | 2,542 | 33.57% |
| Wage / Income Gap ($) | 2,542 | 66.43¢ per $1 |
| Gini / Inequality Index | 2,542 | 0.44 |
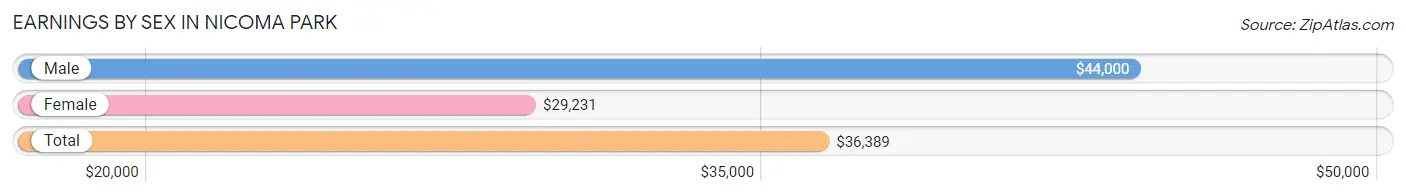
Earnings by Sex in Nicoma Park
Average Earnings in Nicoma Park are $36,389, $44,000 for men and $29,231 for women, a difference of 33.6%.
| Sex | Number | Average Earnings |
| Male | 638 (52.9%) | $44,000 |
| Female | 568 (47.1%) | $29,231 |
| Total | 1,206 (100.0%) | $36,389 |
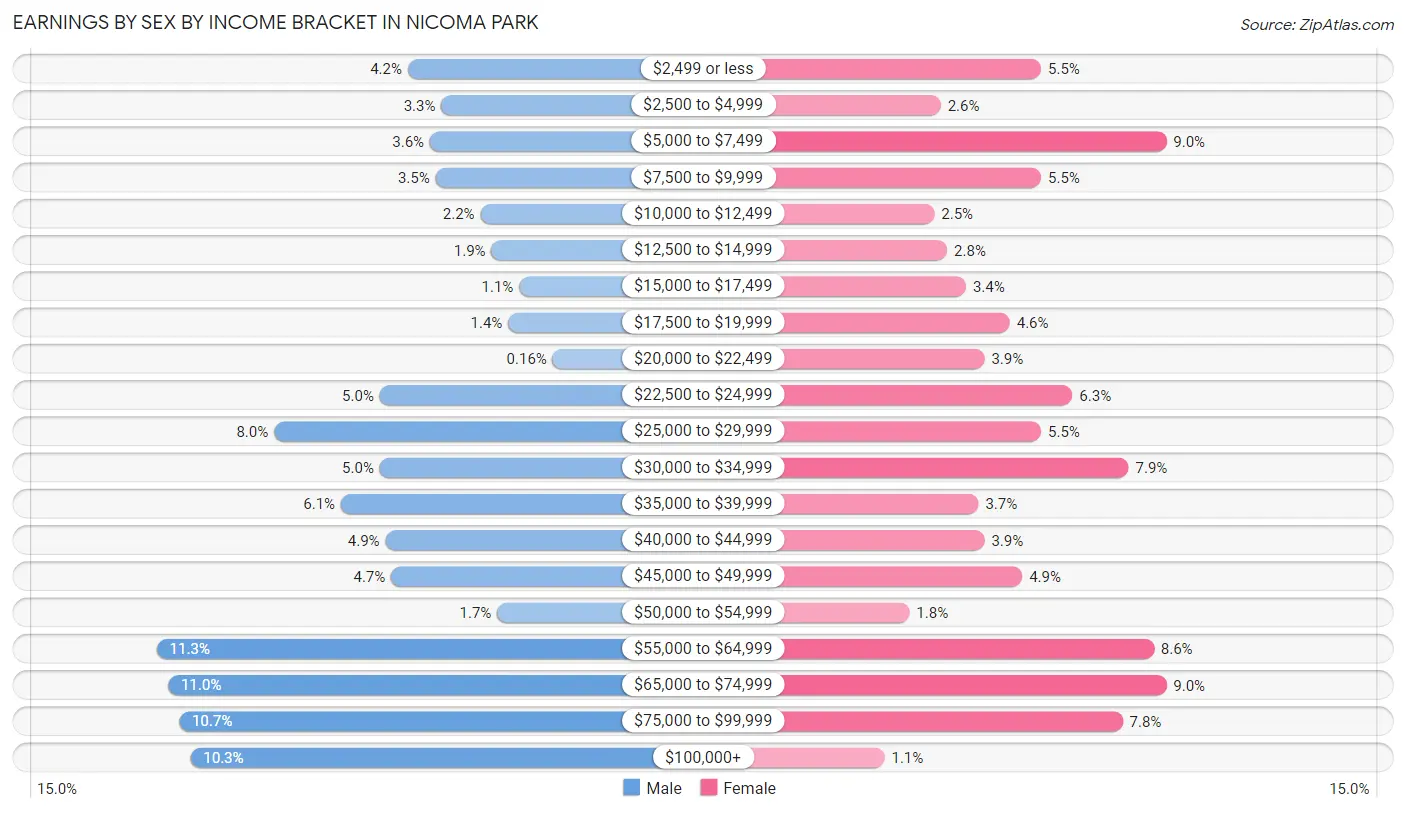
Earnings by Sex by Income Bracket in Nicoma Park
The most common earnings brackets in Nicoma Park are $55,000 to $64,999 for men (72 | 11.3%) and $5,000 to $7,499 for women (51 | 9.0%).
| Income | Male | Female |
| $2,499 or less | 27 (4.2%) | 31 (5.5%) |
| $2,500 to $4,999 | 21 (3.3%) | 15 (2.6%) |
| $5,000 to $7,499 | 23 (3.6%) | 51 (9.0%) |
| $7,500 to $9,999 | 22 (3.5%) | 31 (5.5%) |
| $10,000 to $12,499 | 14 (2.2%) | 14 (2.5%) |
| $12,500 to $14,999 | 12 (1.9%) | 16 (2.8%) |
| $15,000 to $17,499 | 7 (1.1%) | 19 (3.4%) |
| $17,500 to $19,999 | 9 (1.4%) | 26 (4.6%) |
| $20,000 to $22,499 | 1 (0.2%) | 22 (3.9%) |
| $22,500 to $24,999 | 32 (5.0%) | 36 (6.3%) |
| $25,000 to $29,999 | 51 (8.0%) | 31 (5.5%) |
| $30,000 to $34,999 | 32 (5.0%) | 45 (7.9%) |
| $35,000 to $39,999 | 39 (6.1%) | 21 (3.7%) |
| $40,000 to $44,999 | 31 (4.9%) | 22 (3.9%) |
| $45,000 to $49,999 | 30 (4.7%) | 28 (4.9%) |
| $50,000 to $54,999 | 11 (1.7%) | 10 (1.8%) |
| $55,000 to $64,999 | 72 (11.3%) | 49 (8.6%) |
| $65,000 to $74,999 | 70 (11.0%) | 51 (9.0%) |
| $75,000 to $99,999 | 68 (10.7%) | 44 (7.7%) |
| $100,000+ | 66 (10.3%) | 6 (1.1%) |
| Total | 638 (100.0%) | 568 (100.0%) |
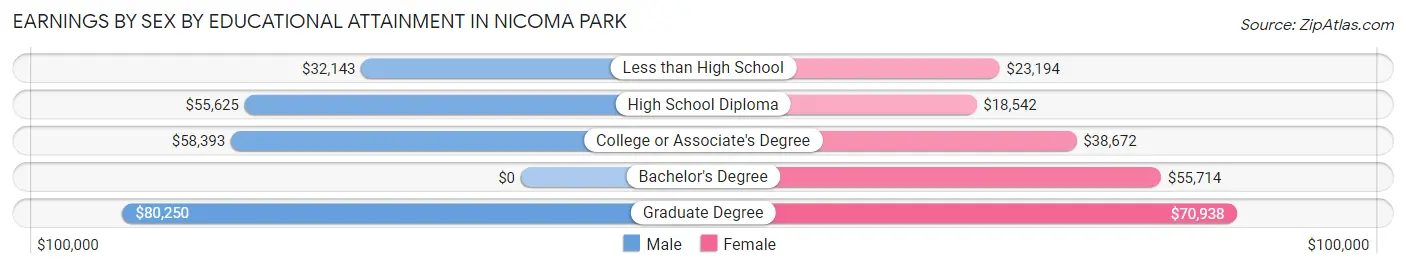
Earnings by Sex by Educational Attainment in Nicoma Park
Average earnings in Nicoma Park are $49,952 for men and $31,316 for women, a difference of 37.3%. Men with an educational attainment of graduate degree enjoy the highest average annual earnings of $80,250, while those with less than high school education earn the least with $32,143. Women with an educational attainment of graduate degree earn the most with the average annual earnings of $70,938, while those with high school diploma education have the smallest earnings of $18,542.
| Educational Attainment | Male Income | Female Income |
| Less than High School | $32,143 | $23,194 |
| High School Diploma | $55,625 | $18,542 |
| College or Associate's Degree | $58,393 | $38,672 |
| Bachelor's Degree | - | - |
| Graduate Degree | $80,250 | $70,938 |
| Total | $49,952 | $31,316 |
Family Income in Nicoma Park
Family Income Brackets in Nicoma Park
According to the Nicoma Park family income data, there are 163 families falling into the $100,000 to $149,999 income range, which is the most common income bracket and makes up 27.0% of all families. Conversely, the $10,000 to $14,999 income bracket is the least frequent group with only 9 families (1.5%) belonging to this category.
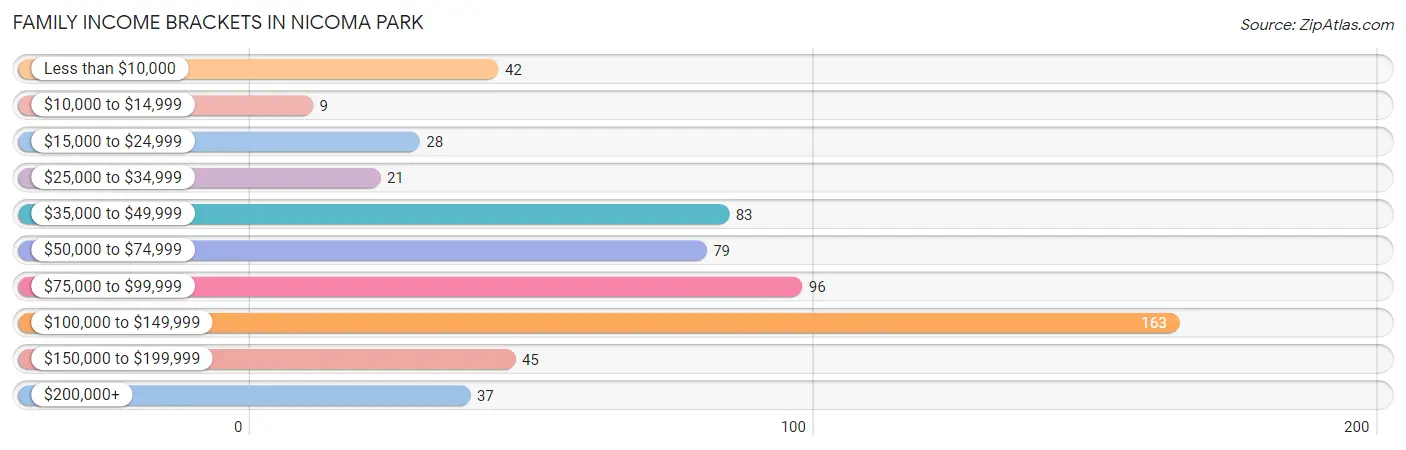
| Income Bracket | # Families | % Families |
| Less than $10,000 | 42 | 7.0% |
| $10,000 to $14,999 | 9 | 1.5% |
| $15,000 to $24,999 | 28 | 4.6% |
| $25,000 to $34,999 | 21 | 3.5% |
| $35,000 to $49,999 | 83 | 13.8% |
| $50,000 to $74,999 | 79 | 13.1% |
| $75,000 to $99,999 | 96 | 15.9% |
| $100,000 to $149,999 | 163 | 27.0% |
| $150,000 to $199,999 | 45 | 7.5% |
| $200,000+ | 37 | 6.1% |
Family Income by Famaliy Size in Nicoma Park
6-person families (29 | 4.8%) account for the highest median family income in Nicoma Park with $123,750 per family, while 2-person families (248 | 41.1%) have the highest median income of $33,438 per family member.
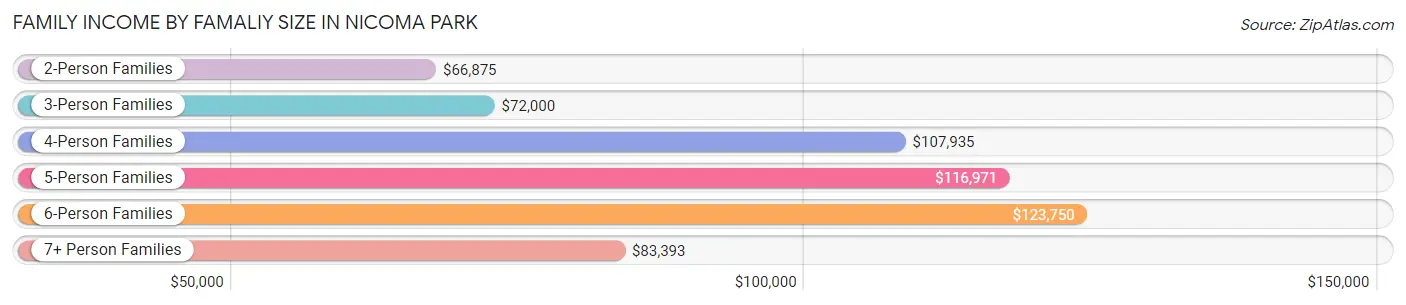
| Income Bracket | # Families | Median Income |
| 2-Person Families | 248 (41.1%) | $66,875 |
| 3-Person Families | 128 (21.2%) | $72,000 |
| 4-Person Families | 80 (13.3%) | $107,935 |
| 5-Person Families | 99 (16.4%) | $116,971 |
| 6-Person Families | 29 (4.8%) | $123,750 |
| 7+ Person Families | 19 (3.2%) | $83,393 |
| Total | 603 (100.0%) | $87,250 |
Family Income by Number of Earners in Nicoma Park
The median family income in Nicoma Park is $87,250, with families comprising 3+ earners (62) having the highest median family income of $148,333, while families with no earners (60) have the lowest median family income of $29,167, accounting for 10.3% and 10.0% of families, respectively.
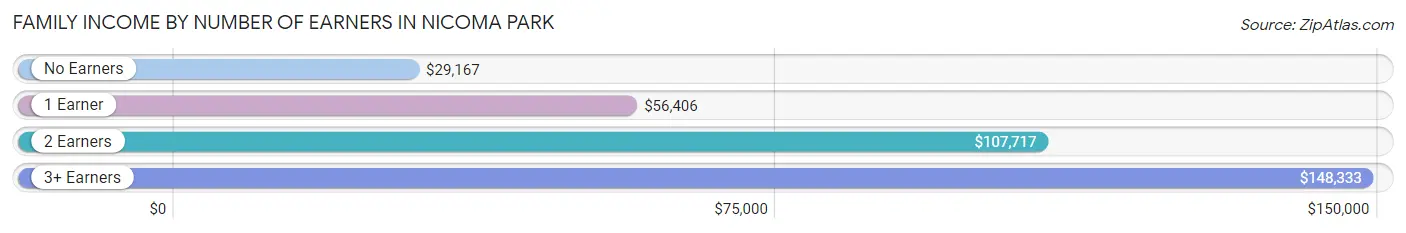
| Number of Earners | # Families | Median Income |
| No Earners | 60 (10.0%) | $29,167 |
| 1 Earner | 175 (29.0%) | $56,406 |
| 2 Earners | 306 (50.7%) | $107,717 |
| 3+ Earners | 62 (10.3%) | $148,333 |
| Total | 603 (100.0%) | $87,250 |
Household Income in Nicoma Park
Household Income Brackets in Nicoma Park
With 192 households falling in the category, the $100,000 to $149,999 income range is the most frequent in Nicoma Park, accounting for 20.9% of all households. In contrast, only 21 households (2.3%) fall into the $10,000 to $14,999 income bracket, making it the least populous group.
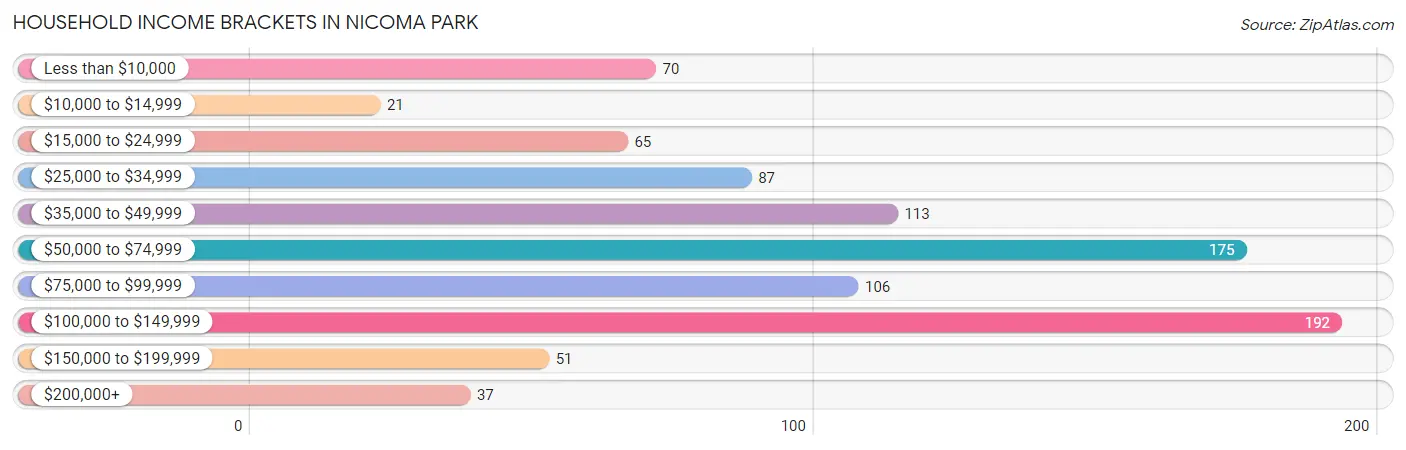
| Income Bracket | # Households | % Households |
| Less than $10,000 | 70 | 7.6% |
| $10,000 to $14,999 | 21 | 2.3% |
| $15,000 to $24,999 | 65 | 7.1% |
| $25,000 to $34,999 | 87 | 9.5% |
| $35,000 to $49,999 | 113 | 12.3% |
| $50,000 to $74,999 | 175 | 19.1% |
| $75,000 to $99,999 | 106 | 11.6% |
| $100,000 to $149,999 | 192 | 20.9% |
| $150,000 to $199,999 | 51 | 5.6% |
| $200,000+ | 37 | 4.0% |
Household Income by Householder Age in Nicoma Park
The median household income in Nicoma Park is $61,146, with the highest median household income of $83,036 found in the 25 to 44 years age bracket for the primary householder. A total of 337 households (36.7%) fall into this category. Meanwhile, the 15 to 24 years age bracket for the primary householder has the lowest median household income of $0, with 16 households (1.7%) in this group.
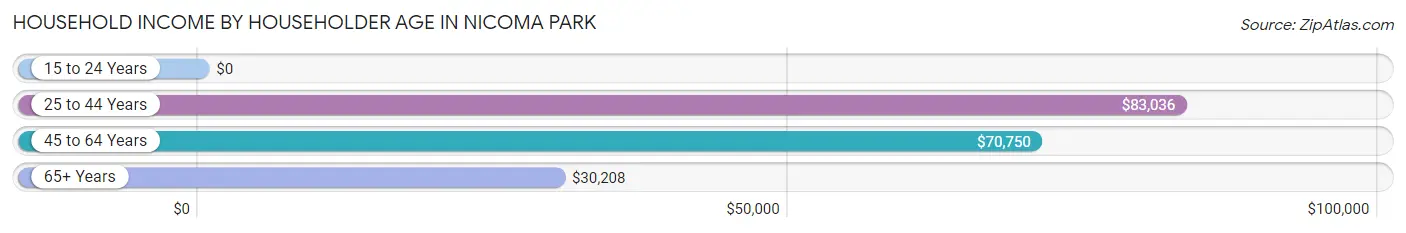
| Income Bracket | # Households | Median Income |
| 15 to 24 Years | 16 (1.7%) | $0 |
| 25 to 44 Years | 337 (36.7%) | $83,036 |
| 45 to 64 Years | 341 (37.2%) | $70,750 |
| 65+ Years | 223 (24.3%) | $30,208 |
| Total | 917 (100.0%) | $61,146 |
Poverty in Nicoma Park
Income Below Poverty by Sex and Age in Nicoma Park
With 14.1% poverty level for males and 15.7% for females among the residents of Nicoma Park, 16 and 17 year old males and 5 year old females are the most vulnerable to poverty, with 13 males (30.2%) and 9 females (56.2%) in their respective age groups living below the poverty level.
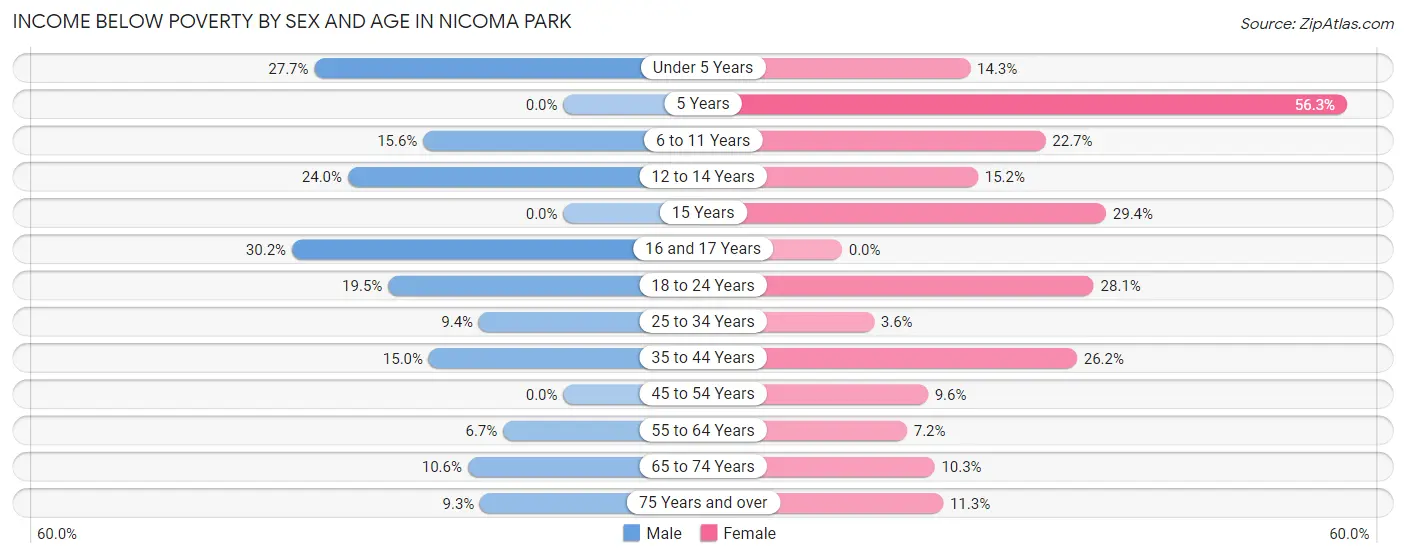
| Age Bracket | Male | Female |
| Under 5 Years | 33 (27.7%) | 7 (14.3%) |
| 5 Years | 0 (0.0%) | 9 (56.2%) |
| 6 to 11 Years | 27 (15.6%) | 34 (22.7%) |
| 12 to 14 Years | 24 (24.0%) | 10 (15.1%) |
| 15 Years | 0 (0.0%) | 5 (29.4%) |
| 16 and 17 Years | 13 (30.2%) | 0 (0.0%) |
| 18 to 24 Years | 16 (19.5%) | 23 (28.1%) |
| 25 to 34 Years | 14 (9.4%) | 5 (3.6%) |
| 35 to 44 Years | 31 (15.0%) | 56 (26.2%) |
| 45 to 54 Years | 0 (0.0%) | 11 (9.6%) |
| 55 to 64 Years | 11 (6.7%) | 11 (7.2%) |
| 65 to 74 Years | 10 (10.6%) | 13 (10.3%) |
| 75 Years and over | 5 (9.3%) | 8 (11.3%) |
| Total | 184 (14.1%) | 192 (15.7%) |
Income Above Poverty by Sex and Age in Nicoma Park
According to the poverty statistics in Nicoma Park, males aged 15 years and females aged 16 and 17 years are the age groups that are most secure financially, with 100.0% of males and 100.0% of females in these age groups living above the poverty line.
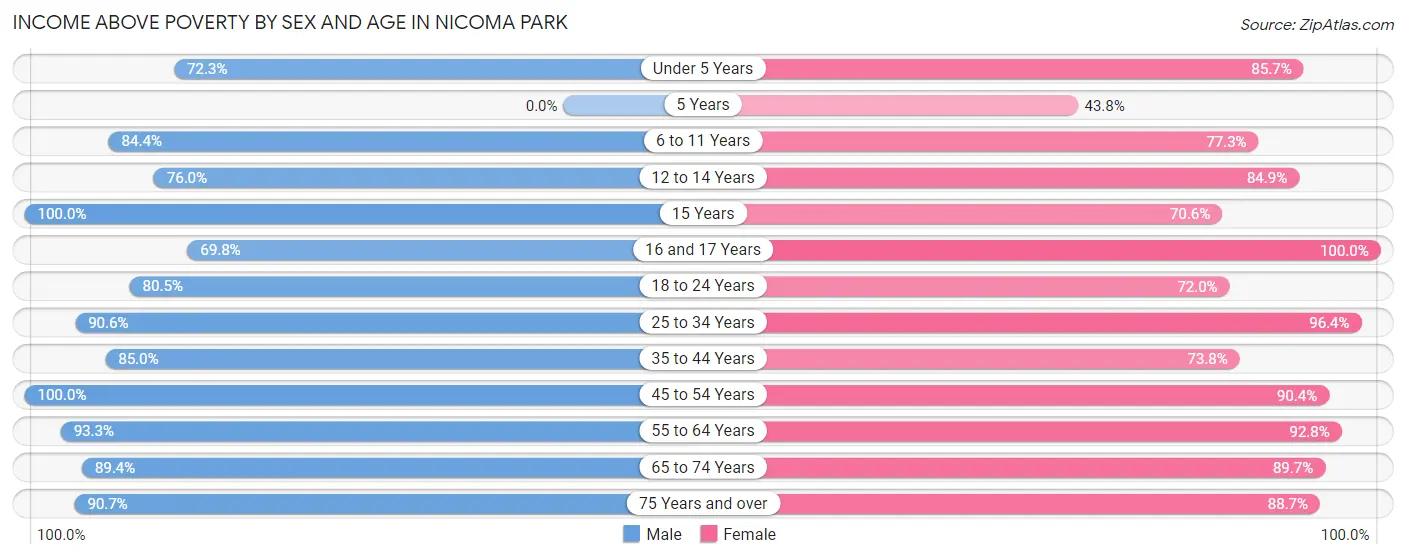
| Age Bracket | Male | Female |
| Under 5 Years | 86 (72.3%) | 42 (85.7%) |
| 5 Years | 0 (0.0%) | 7 (43.8%) |
| 6 to 11 Years | 146 (84.4%) | 116 (77.3%) |
| 12 to 14 Years | 76 (76.0%) | 56 (84.9%) |
| 15 Years | 10 (100.0%) | 12 (70.6%) |
| 16 and 17 Years | 30 (69.8%) | 29 (100.0%) |
| 18 to 24 Years | 66 (80.5%) | 59 (72.0%) |
| 25 to 34 Years | 135 (90.6%) | 135 (96.4%) |
| 35 to 44 Years | 176 (85.0%) | 158 (73.8%) |
| 45 to 54 Years | 115 (100.0%) | 104 (90.4%) |
| 55 to 64 Years | 153 (93.3%) | 141 (92.8%) |
| 65 to 74 Years | 84 (89.4%) | 113 (89.7%) |
| 75 Years and over | 49 (90.7%) | 63 (88.7%) |
| Total | 1,126 (86.0%) | 1,035 (84.4%) |
Income Below Poverty Among Married-Couple Families in Nicoma Park
The poverty statistics for married-couple families in Nicoma Park show that 4.0% or 17 of the total 430 families live below the poverty line. Families with 5 or more children have the highest poverty rate of 58.3%, comprising of 7 families. On the other hand, families with 1 or 2 children have the lowest poverty rate of 0.0%, which includes 0 families.
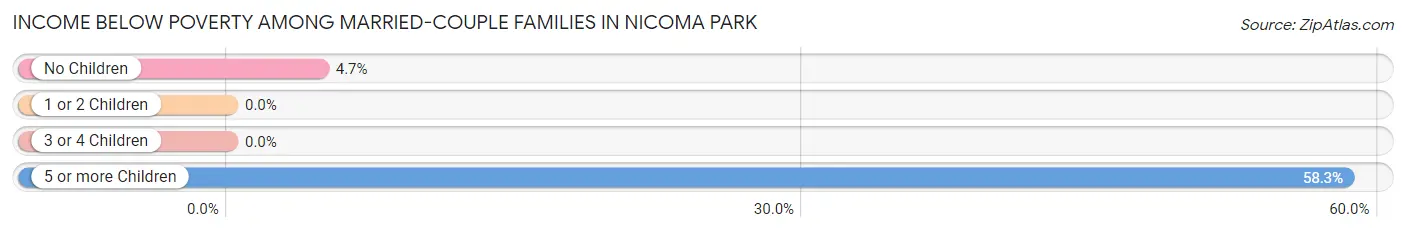
| Children | Above Poverty | Below Poverty |
| No Children | 201 (95.3%) | 10 (4.7%) |
| 1 or 2 Children | 121 (100.0%) | 0 (0.0%) |
| 3 or 4 Children | 86 (100.0%) | 0 (0.0%) |
| 5 or more Children | 5 (41.7%) | 7 (58.3%) |
| Total | 413 (96.1%) | 17 (4.0%) |
Income Below Poverty Among Single-Parent Households in Nicoma Park
According to the poverty data in Nicoma Park, 17.1% or 13 single-father households and 46.4% or 45 single-mother households are living below the poverty line. Among single-father households, those with 1 or 2 children have the highest poverty rate, with 8 households (24.2%) experiencing poverty. Likewise, among single-mother households, those with 1 or 2 children have the highest poverty rate, with 37 households (78.7%) falling below the poverty line.
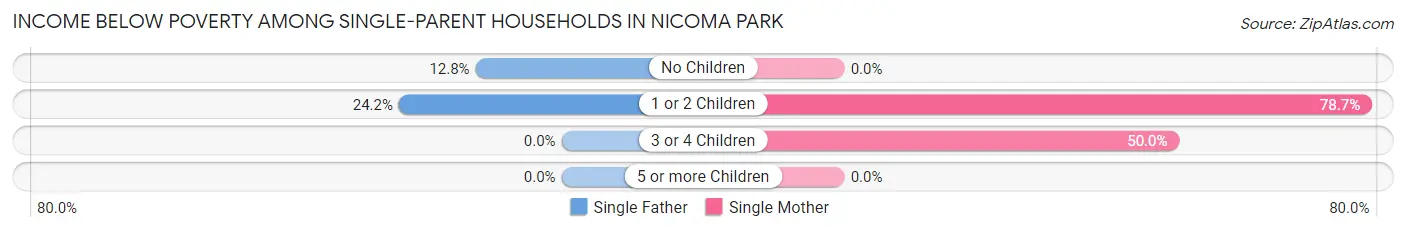
| Children | Single Father | Single Mother |
| No Children | 5 (12.8%) | 0 (0.0%) |
| 1 or 2 Children | 8 (24.2%) | 37 (78.7%) |
| 3 or 4 Children | 0 (0.0%) | 8 (50.0%) |
| 5 or more Children | 0 (0.0%) | 0 (0.0%) |
| Total | 13 (17.1%) | 45 (46.4%) |
Income Below Poverty Among Married-Couple vs Single-Parent Households in Nicoma Park
The poverty data for Nicoma Park shows that 17 of the married-couple family households (4.0%) and 58 of the single-parent households (33.5%) are living below the poverty level. Within the married-couple family households, those with 5 or more children have the highest poverty rate, with 7 households (58.3%) falling below the poverty line. Among the single-parent households, those with 1 or 2 children have the highest poverty rate, with 45 household (56.2%) living below poverty.
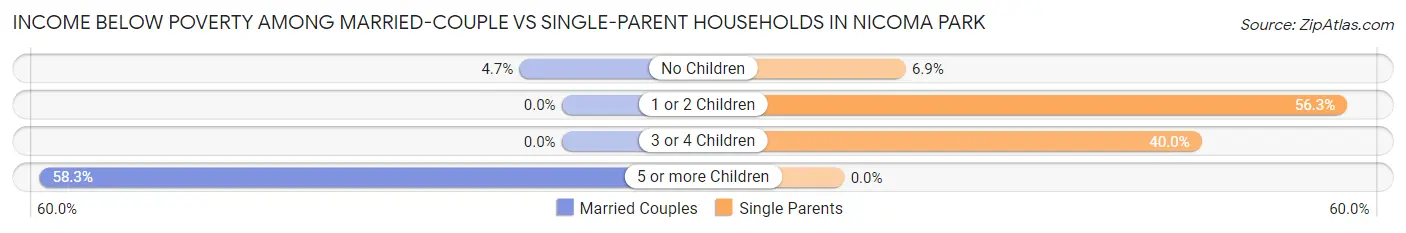
| Children | Married-Couple Families | Single-Parent Households |
| No Children | 10 (4.7%) | 5 (6.9%) |
| 1 or 2 Children | 0 (0.0%) | 45 (56.2%) |
| 3 or 4 Children | 0 (0.0%) | 8 (40.0%) |
| 5 or more Children | 7 (58.3%) | 0 (0.0%) |
| Total | 17 (4.0%) | 58 (33.5%) |
Race in Nicoma Park
The most populous races in Nicoma Park are White / Caucasian (1,923 | 75.6%), Native / Alaskan (280 | 11.0%), and Two or more Races (240 | 9.4%).
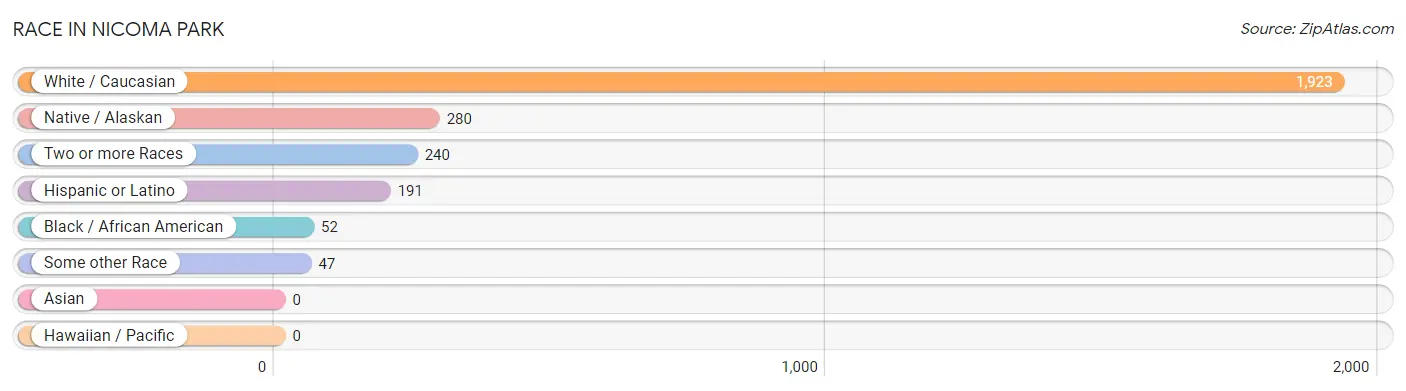
| Race | # Population | % Population |
| Asian | 0 | 0.0% |
| Black / African American | 52 | 2.1% |
| Hawaiian / Pacific | 0 | 0.0% |
| Hispanic or Latino | 191 | 7.5% |
| Native / Alaskan | 280 | 11.0% |
| White / Caucasian | 1,923 | 75.6% |
| Two or more Races | 240 | 9.4% |
| Some other Race | 47 | 1.8% |
| Total | 2,542 | 100.0% |
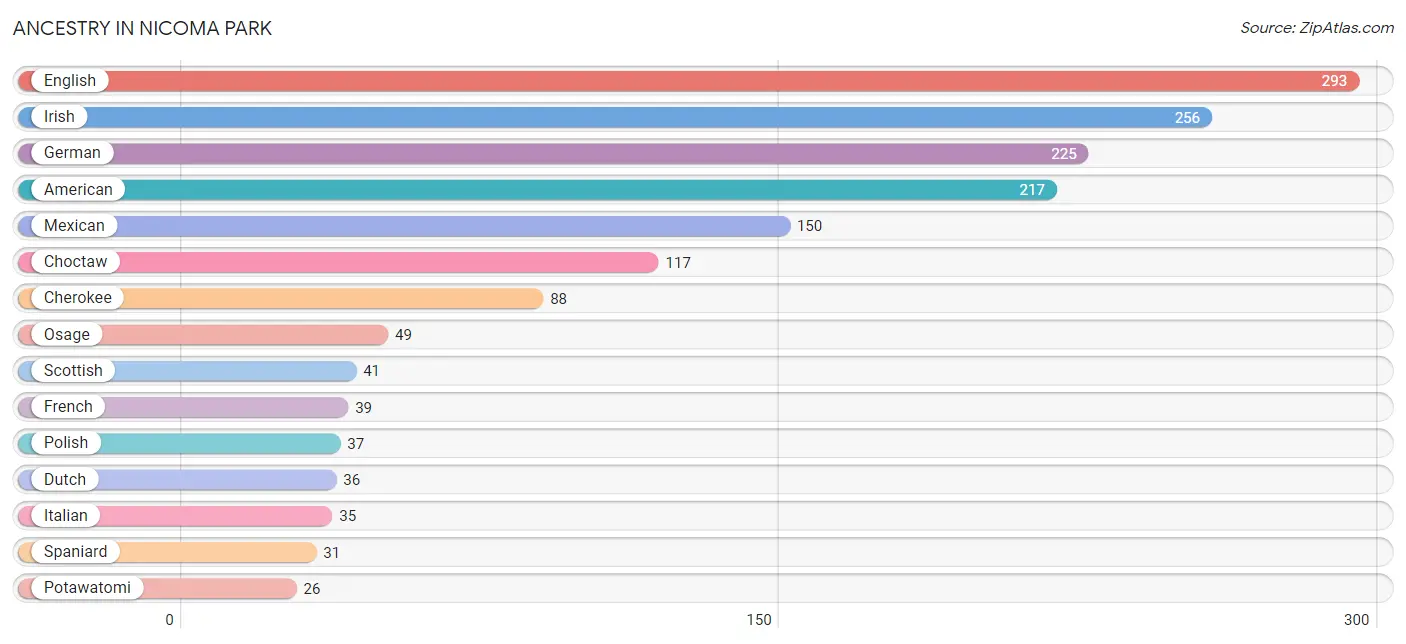
Ancestry in Nicoma Park
The most populous ancestries reported in Nicoma Park are English (293 | 11.5%), Irish (256 | 10.1%), German (225 | 8.8%), American (217 | 8.5%), and Mexican (150 | 5.9%), together accounting for 44.9% of all Nicoma Park residents.
| Ancestry | # Population | % Population |
| American | 217 | 8.5% |
| British | 14 | 0.5% |
| Cherokee | 88 | 3.5% |
| Cheyenne | 10 | 0.4% |
| Chickasaw | 4 | 0.2% |
| Choctaw | 117 | 4.6% |
| Creek | 21 | 0.8% |
| Danish | 6 | 0.2% |
| Dutch | 36 | 1.4% |
| Eastern European | 6 | 0.2% |
| English | 293 | 11.5% |
| French | 39 | 1.5% |
| French Canadian | 4 | 0.2% |
| German | 225 | 8.8% |
| Irish | 256 | 10.1% |
| Iroquois | 19 | 0.7% |
| Italian | 35 | 1.4% |
| Mexican | 150 | 5.9% |
| Norwegian | 6 | 0.2% |
| Osage | 49 | 1.9% |
| Polish | 37 | 1.5% |
| Potawatomi | 26 | 1.0% |
| Puerto Rican | 5 | 0.2% |
| Scotch-Irish | 15 | 0.6% |
| Scottish | 41 | 1.6% |
| Spaniard | 31 | 1.2% |
| Ukrainian | 6 | 0.2% |
| Welsh | 4 | 0.2% | View All 28 Rows |
Immigrants in Nicoma Park
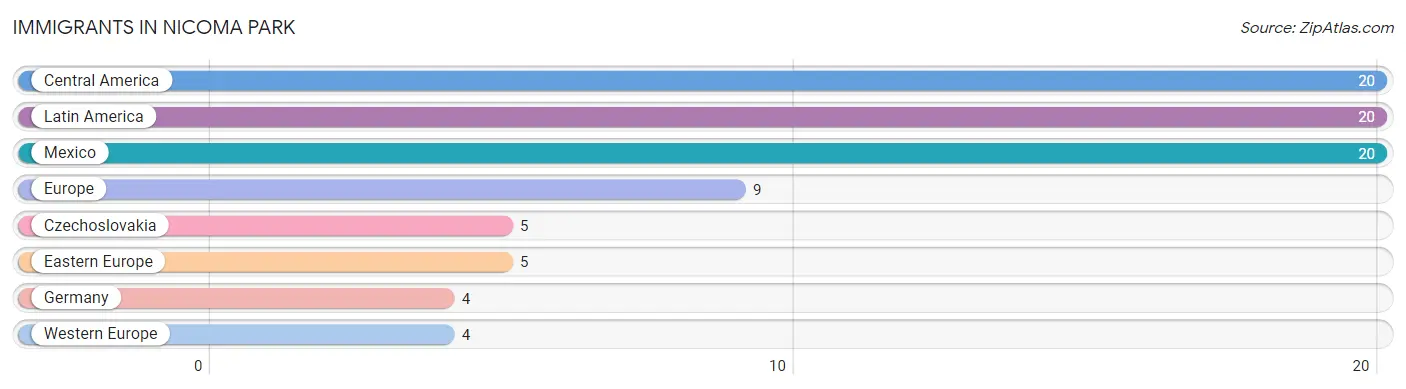
The most numerous immigrant groups reported in Nicoma Park came from Central America (20 | 0.8%), Latin America (20 | 0.8%), Mexico (20 | 0.8%), Europe (9 | 0.4%), and Czechoslovakia (5 | 0.2%), together accounting for 2.9% of all Nicoma Park residents.
| Immigration Origin | # Population | % Population |
| Central America | 20 | 0.8% |
| Czechoslovakia | 5 | 0.2% |
| Eastern Europe | 5 | 0.2% |
| Europe | 9 | 0.4% |
| Germany | 4 | 0.2% |
| Latin America | 20 | 0.8% |
| Mexico | 20 | 0.8% |
| Western Europe | 4 | 0.2% | View All 8 Rows |
Sex and Age in Nicoma Park
Sex and Age in Nicoma Park
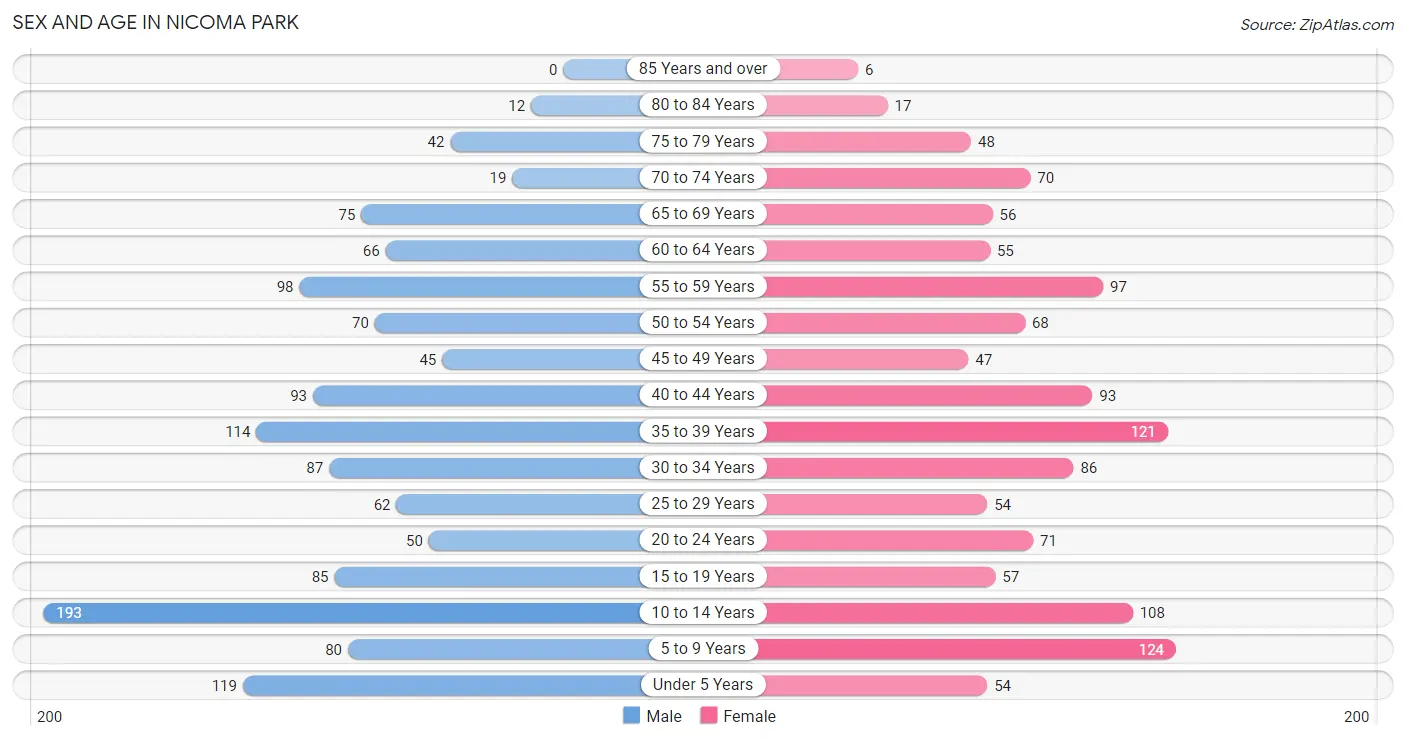
The most populous age groups in Nicoma Park are 10 to 14 Years (193 | 14.7%) for men and 5 to 9 Years (124 | 10.1%) for women.
| Age Bracket | Male | Female |
| Under 5 Years | 119 (9.1%) | 54 (4.4%) |
| 5 to 9 Years | 80 (6.1%) | 124 (10.1%) |
| 10 to 14 Years | 193 (14.7%) | 108 (8.8%) |
| 15 to 19 Years | 85 (6.5%) | 57 (4.6%) |
| 20 to 24 Years | 50 (3.8%) | 71 (5.8%) |
| 25 to 29 Years | 62 (4.7%) | 54 (4.4%) |
| 30 to 34 Years | 87 (6.6%) | 86 (7.0%) |
| 35 to 39 Years | 114 (8.7%) | 121 (9.8%) |
| 40 to 44 Years | 93 (7.1%) | 93 (7.5%) |
| 45 to 49 Years | 45 (3.4%) | 47 (3.8%) |
| 50 to 54 Years | 70 (5.3%) | 68 (5.5%) |
| 55 to 59 Years | 98 (7.5%) | 97 (7.9%) |
| 60 to 64 Years | 66 (5.0%) | 55 (4.5%) |
| 65 to 69 Years | 75 (5.7%) | 56 (4.5%) |
| 70 to 74 Years | 19 (1.5%) | 70 (5.7%) |
| 75 to 79 Years | 42 (3.2%) | 48 (3.9%) |
| 80 to 84 Years | 12 (0.9%) | 17 (1.4%) |
| 85 Years and over | 0 (0.0%) | 6 (0.5%) |
| Total | 1,310 (100.0%) | 1,232 (100.0%) |
Families and Households in Nicoma Park
Median Family Size in Nicoma Park
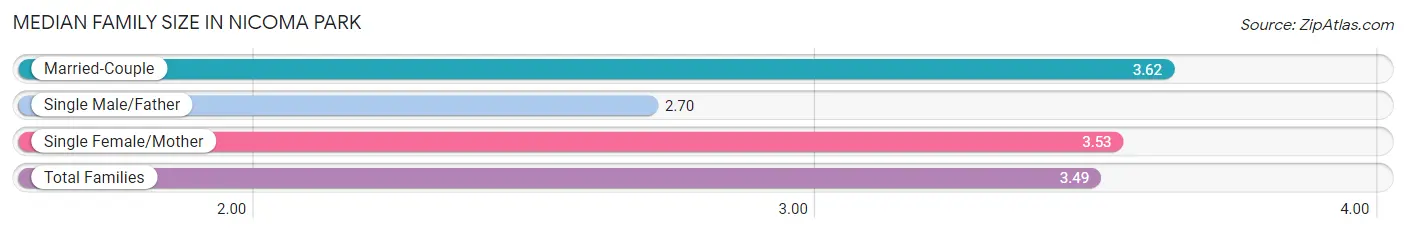
The median family size in Nicoma Park is 3.49 persons per family, with married-couple families (430 | 71.3%) accounting for the largest median family size of 3.62 persons per family. On the other hand, single male/father families (76 | 12.6%) represent the smallest median family size with 2.70 persons per family.
| Family Type | # Families | Family Size |
| Married-Couple | 430 (71.3%) | 3.62 |
| Single Male/Father | 76 (12.6%) | 2.70 |
| Single Female/Mother | 97 (16.1%) | 3.53 |
| Total Families | 603 (100.0%) | 3.49 |
Median Household Size in Nicoma Park
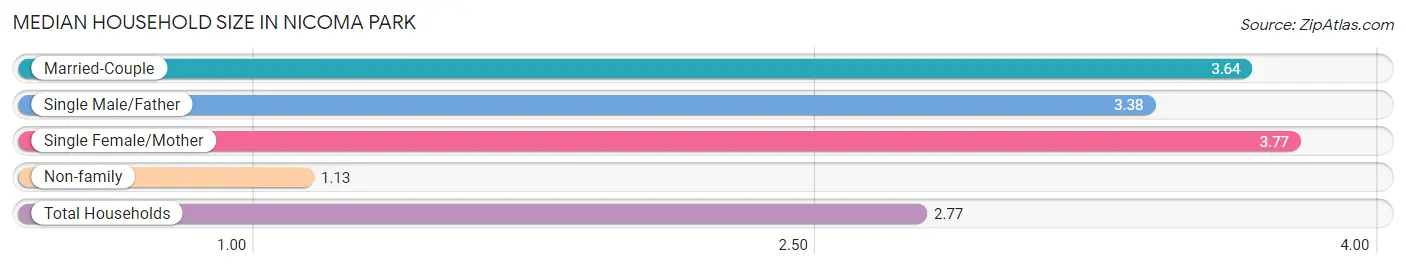
The median household size in Nicoma Park is 2.77 persons per household, with single female/mother households (97 | 10.6%) accounting for the largest median household size of 3.77 persons per household. non-family households (314 | 34.2%) represent the smallest median household size with 1.13 persons per household.
| Household Type | # Households | Household Size |
| Married-Couple | 430 (46.9%) | 3.64 |
| Single Male/Father | 76 (8.3%) | 3.38 |
| Single Female/Mother | 97 (10.6%) | 3.77 |
| Non-family | 314 (34.2%) | 1.13 |
| Total Households | 917 (100.0%) | 2.77 |
Household Size by Marriage Status in Nicoma Park
Out of a total of 917 households in Nicoma Park, 603 (65.8%) are family households, while 314 (34.2%) are nonfamily households. The most numerous type of family households are 2-person households, comprising 215, and the most common type of nonfamily households are 1-person households, comprising 279.
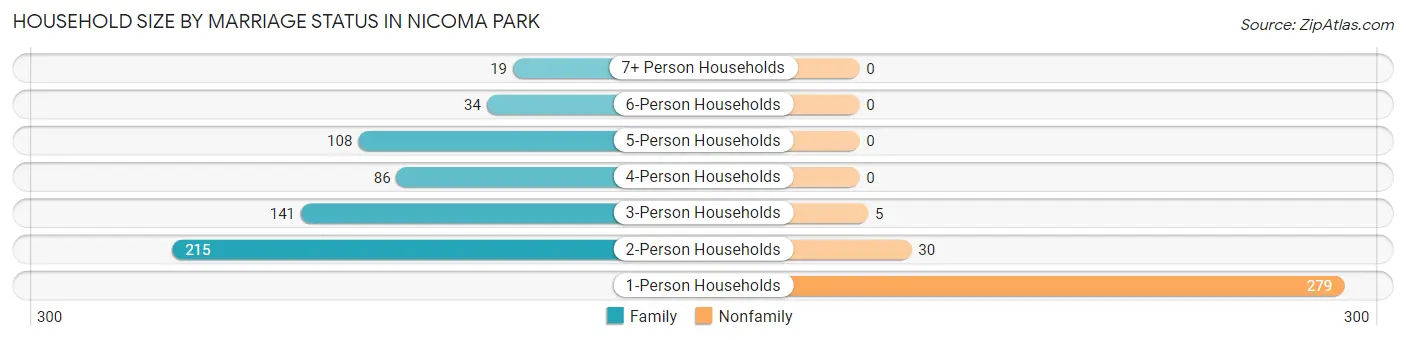
| Household Size | Family Households | Nonfamily Households |
| 1-Person Households | - | 279 (30.4%) |
| 2-Person Households | 215 (23.4%) | 30 (3.3%) |
| 3-Person Households | 141 (15.4%) | 5 (0.5%) |
| 4-Person Households | 86 (9.4%) | 0 (0.0%) |
| 5-Person Households | 108 (11.8%) | 0 (0.0%) |
| 6-Person Households | 34 (3.7%) | 0 (0.0%) |
| 7+ Person Households | 19 (2.1%) | 0 (0.0%) |
| Total | 603 (65.8%) | 314 (34.2%) |
Female Fertility in Nicoma Park
Fertility by Age in Nicoma Park
Average fertility rate in Nicoma Park is 48.0 births per 1,000 women. Women in the age bracket of 20 to 34 years have the highest fertility rate with 123.0 births per 1,000 women. Women in the age bracket of 20 to 34 years acount for 100.0% of all women with births.
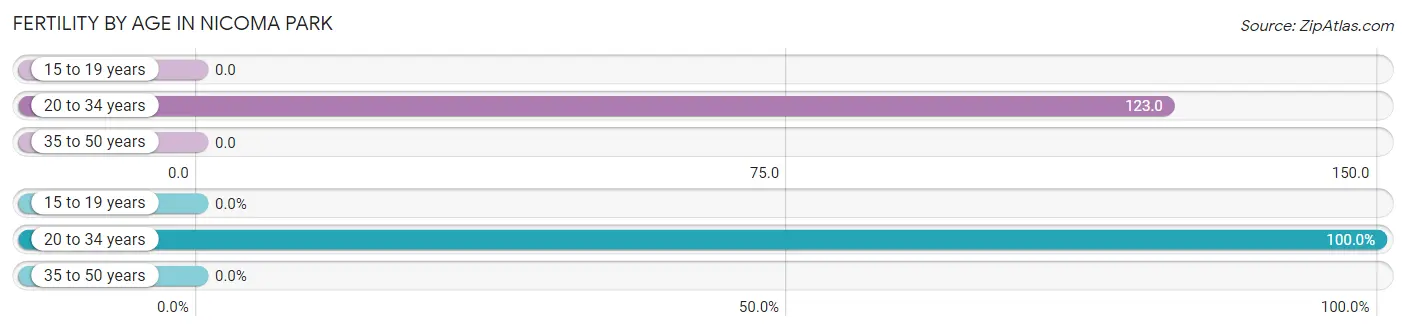
| Age Bracket | Women with Births | Births / 1,000 Women |
| 15 to 19 years | 0 (0.0%) | 0.0 |
| 20 to 34 years | 26 (100.0%) | 123.0 |
| 35 to 50 years | 0 (0.0%) | 0.0 |
| Total | 26 (100.0%) | 48.0 |
Fertility by Age by Marriage Status in Nicoma Park
65.4% of women with births (26) in Nicoma Park are married. The highest percentage of unmarried women with births falls into 20 to 34 years age bracket with 34.6% of them unmarried at the time of birth, while the lowest percentage of unmarried women with births belong to 20 to 34 years age bracket with 34.6% of them unmarried.
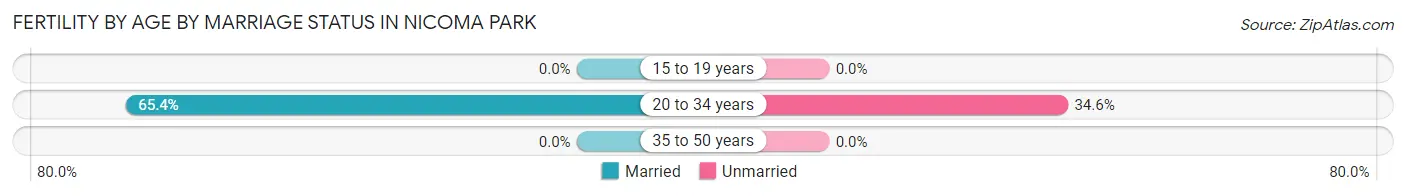
| Age Bracket | Married | Unmarried |
| 15 to 19 years | 0 (0.0%) | 0 (0.0%) |
| 20 to 34 years | 17 (65.4%) | 9 (34.6%) |
| 35 to 50 years | 0 (0.0%) | 0 (0.0%) |
| Total | 17 (65.4%) | 9 (34.6%) |
Fertility by Education in Nicoma Park
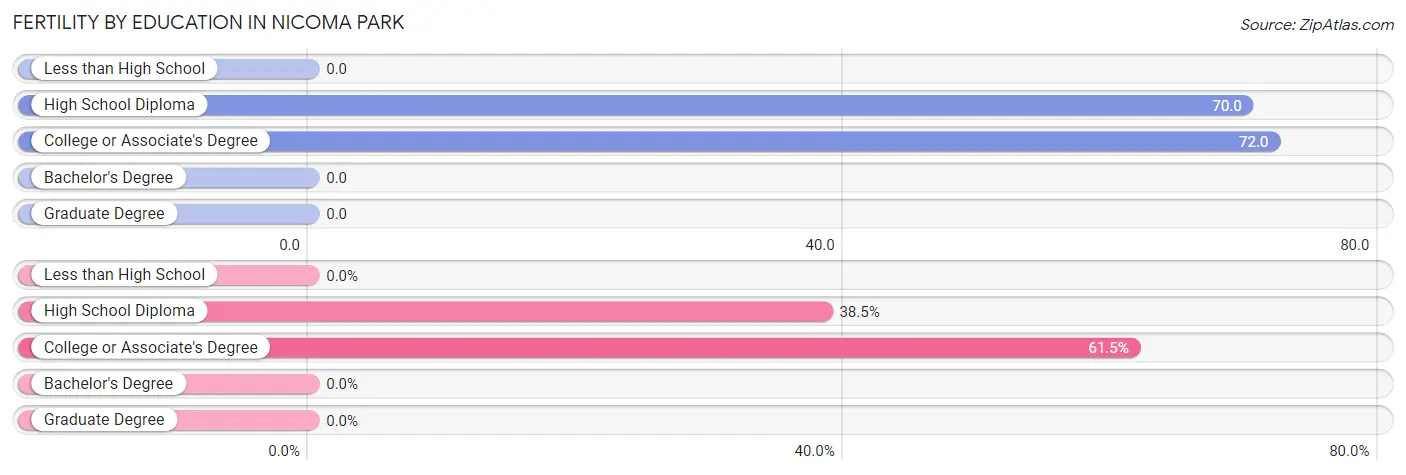
| Educational Attainment | Women with Births | Births / 1,000 Women |
| Less than High School | 0 (0.0%) | 0.0 |
| High School Diploma | 10 (38.5%) | 70.0 |
| College or Associate's Degree | 16 (61.5%) | 72.0 |
| Bachelor's Degree | 0 (0.0%) | 0.0 |
| Graduate Degree | 0 (0.0%) | 0.0 |
| Total | 26 (100.0%) | 48.0 |
Fertility by Education by Marriage Status in Nicoma Park
34.6% of women with births in Nicoma Park are unmarried. Women with the educational attainment of college or associate's degree are most likely to be married with 68.8% of them married at childbirth, while women with the educational attainment of high school diploma are least likely to be married with 40.0% of them unmarried at childbirth.
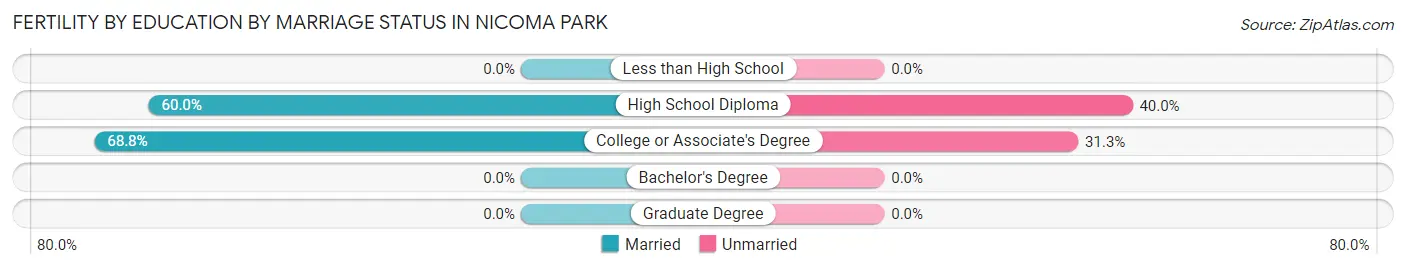
| Educational Attainment | Married | Unmarried |
| Less than High School | 0 (0.0%) | 0 (0.0%) |
| High School Diploma | 6 (60.0%) | 4 (40.0%) |
| College or Associate's Degree | 11 (68.8%) | 5 (31.2%) |
| Bachelor's Degree | 0 (0.0%) | 0 (0.0%) |
| Graduate Degree | 0 (0.0%) | 0 (0.0%) |
| Total | 17 (65.4%) | 9 (34.6%) |
Employment Characteristics in Nicoma Park
Employment by Class of Employer in Nicoma Park
Among the 1,047 employed individuals in Nicoma Park, private company employees (661 | 63.1%), federal government employees (100 | 9.6%), and self-employed (not incorporated) (89 | 8.5%) make up the most common classes of employment.
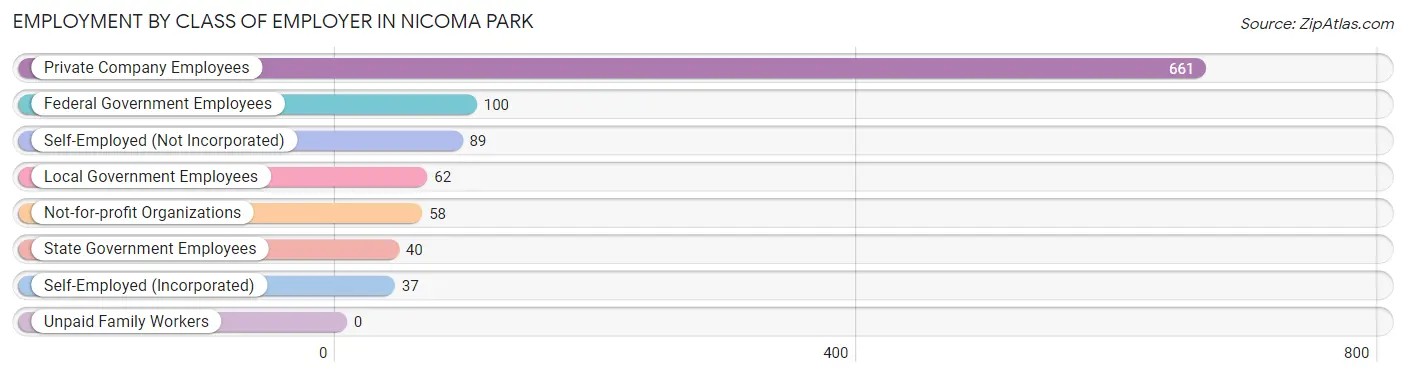
| Employer Class | # Employees | % Employees |
| Private Company Employees | 661 | 63.1% |
| Self-Employed (Incorporated) | 37 | 3.5% |
| Self-Employed (Not Incorporated) | 89 | 8.5% |
| Not-for-profit Organizations | 58 | 5.5% |
| Local Government Employees | 62 | 5.9% |
| State Government Employees | 40 | 3.8% |
| Federal Government Employees | 100 | 9.6% |
| Unpaid Family Workers | 0 | 0.0% |
| Total | 1,047 | 100.0% |
Employment Status by Age in Nicoma Park
According to the labor force statistics for Nicoma Park, out of the total population over 16 years of age (1,837), 60.3% or 1,108 individuals are in the labor force, with 3.4% or 38 of them unemployed. The age group with the highest labor force participation rate is 25 to 29 years, with 81.9% or 95 individuals in the labor force. Within the labor force, the 16 to 19 years age range has the highest percentage of unemployed individuals, with 14.6% or 6 of them being unemployed.
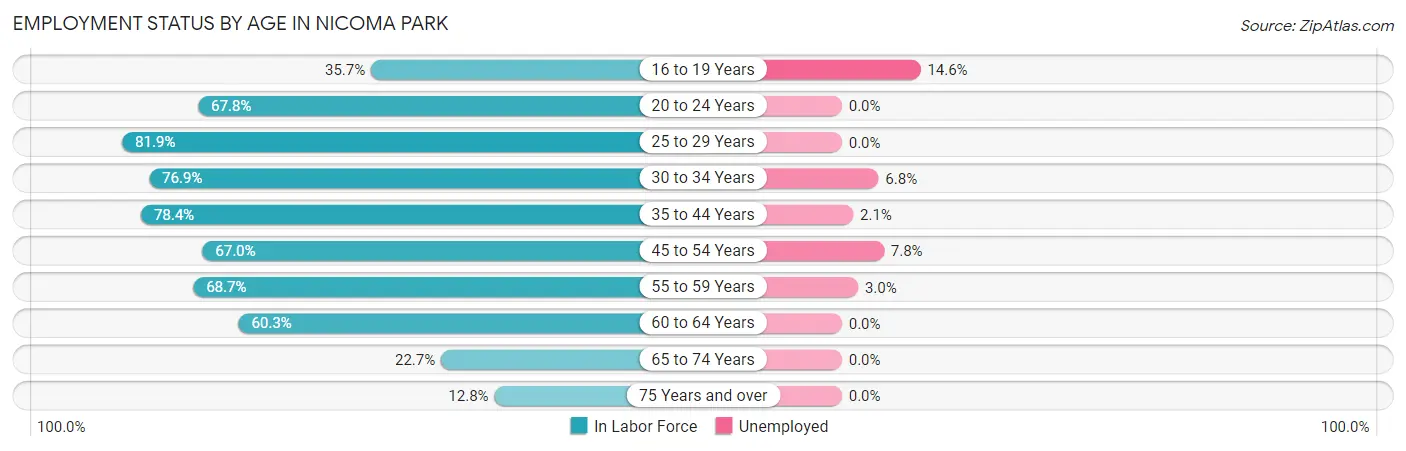
| Age Bracket | In Labor Force | Unemployed |
| 16 to 19 Years | 41 (35.7%) | 6 (14.6%) |
| 20 to 24 Years | 82 (67.8%) | 0 (0.0%) |
| 25 to 29 Years | 95 (81.9%) | 0 (0.0%) |
| 30 to 34 Years | 133 (76.9%) | 9 (6.8%) |
| 35 to 44 Years | 330 (78.4%) | 7 (2.1%) |
| 45 to 54 Years | 154 (67.0%) | 12 (7.8%) |
| 55 to 59 Years | 134 (68.7%) | 4 (3.0%) |
| 60 to 64 Years | 73 (60.3%) | 0 (0.0%) |
| 65 to 74 Years | 50 (22.7%) | 0 (0.0%) |
| 75 Years and over | 16 (12.8%) | 0 (0.0%) |
| Total | 1,108 (60.3%) | 38 (3.4%) |
Employment Status by Educational Attainment in Nicoma Park
According to labor force statistics for Nicoma Park, 73.2% of individuals (919) out of the total population between 25 and 64 years of age (1,256) are in the labor force, with 3.5% or 32 of them being unemployed. The group with the highest labor force participation rate are those with the educational attainment of bachelor's degree or higher, with 91.3% or 178 individuals in the labor force. Within the labor force, individuals with high school diploma education have the highest percentage of unemployment, with 5.6% or 16 of them being unemployed.
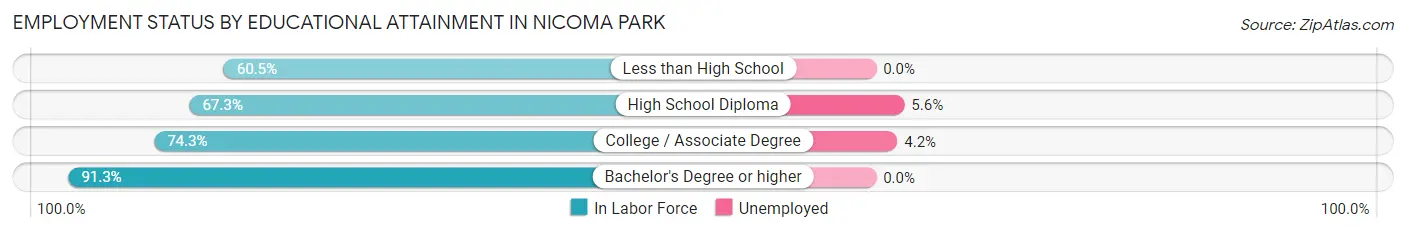
| Educational Attainment | In Labor Force | Unemployed |
| Less than High School | 78 (60.5%) | 0 (0.0%) |
| High School Diploma | 284 (67.3%) | 24 (5.6%) |
| College / Associate Degree | 379 (74.3%) | 21 (4.2%) |
| Bachelor's Degree or higher | 178 (91.3%) | 0 (0.0%) |
| Total | 919 (73.2%) | 44 (3.5%) |
Employment Occupations by Sex in Nicoma Park
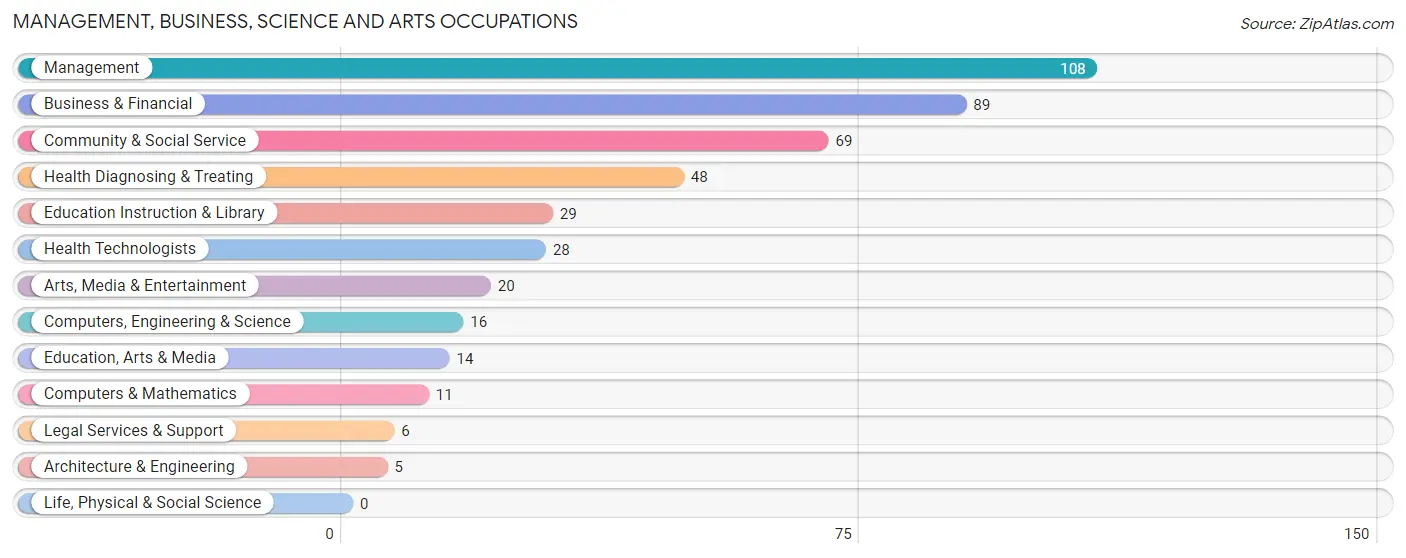
Management, Business, Science and Arts Occupations
The most common Management, Business, Science and Arts occupations in Nicoma Park are Management (108 | 10.1%), Business & Financial (89 | 8.3%), Community & Social Service (69 | 6.5%), Health Diagnosing & Treating (48 | 4.5%), and Education Instruction & Library (29 | 2.7%).
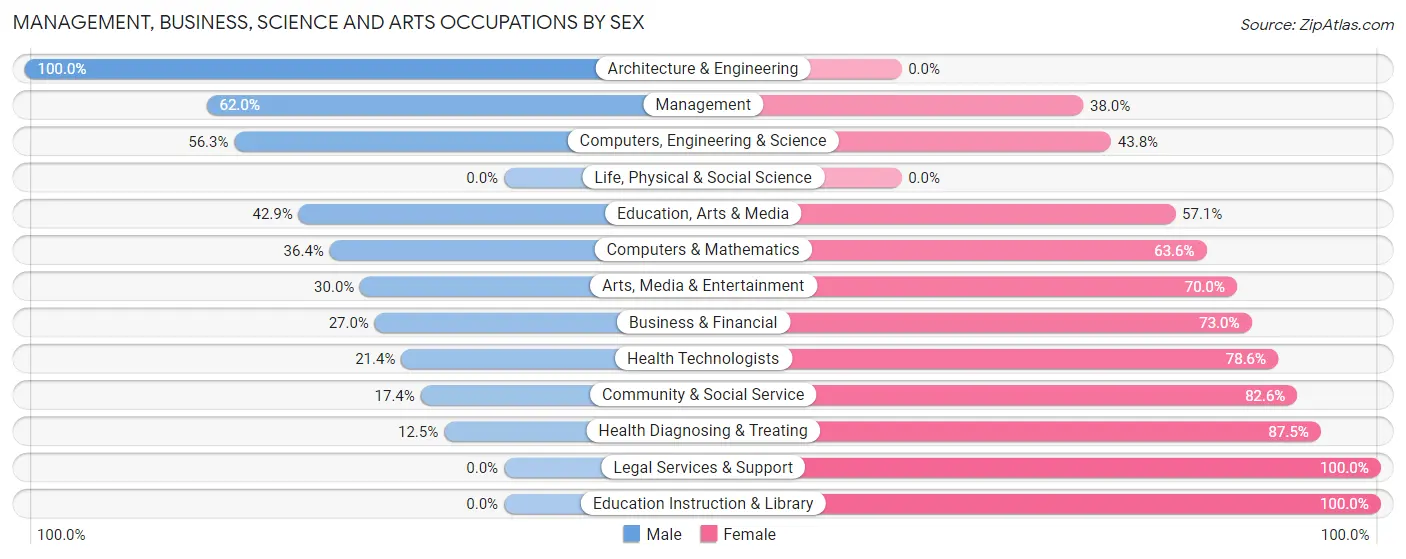
Management, Business, Science and Arts Occupations by Sex
Within the Management, Business, Science and Arts occupations in Nicoma Park, the most male-oriented occupations are Architecture & Engineering (100.0%), Management (62.0%), and Computers, Engineering & Science (56.2%), while the most female-oriented occupations are Legal Services & Support (100.0%), Education Instruction & Library (100.0%), and Health Diagnosing & Treating (87.5%).
| Occupation | Male | Female |
| Management | 67 (62.0%) | 41 (38.0%) |
| Business & Financial | 24 (27.0%) | 65 (73.0%) |
| Computers, Engineering & Science | 9 (56.2%) | 7 (43.8%) |
| Computers & Mathematics | 4 (36.4%) | 7 (63.6%) |
| Architecture & Engineering | 5 (100.0%) | 0 (0.0%) |
| Life, Physical & Social Science | 0 (0.0%) | 0 (0.0%) |
| Community & Social Service | 12 (17.4%) | 57 (82.6%) |
| Education, Arts & Media | 6 (42.9%) | 8 (57.1%) |
| Legal Services & Support | 0 (0.0%) | 6 (100.0%) |
| Education Instruction & Library | 0 (0.0%) | 29 (100.0%) |
| Arts, Media & Entertainment | 6 (30.0%) | 14 (70.0%) |
| Health Diagnosing & Treating | 6 (12.5%) | 42 (87.5%) |
| Health Technologists | 6 (21.4%) | 22 (78.6%) |
| Total (Category) | 118 (35.8%) | 212 (64.2%) |
| Total (Overall) | 577 (53.9%) | 493 (46.1%) |
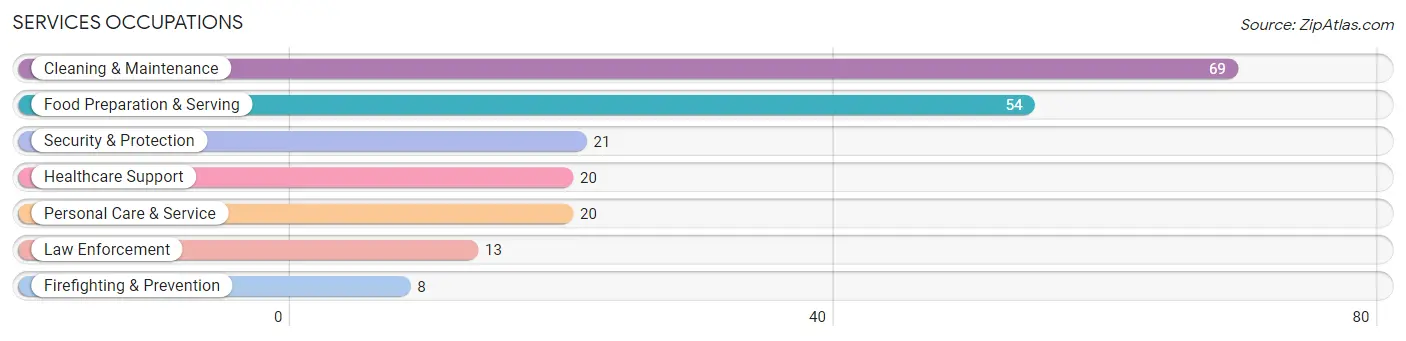
Services Occupations
The most common Services occupations in Nicoma Park are Cleaning & Maintenance (69 | 6.5%), Food Preparation & Serving (54 | 5.1%), Security & Protection (21 | 2.0%), Healthcare Support (20 | 1.9%), and Personal Care & Service (20 | 1.9%).
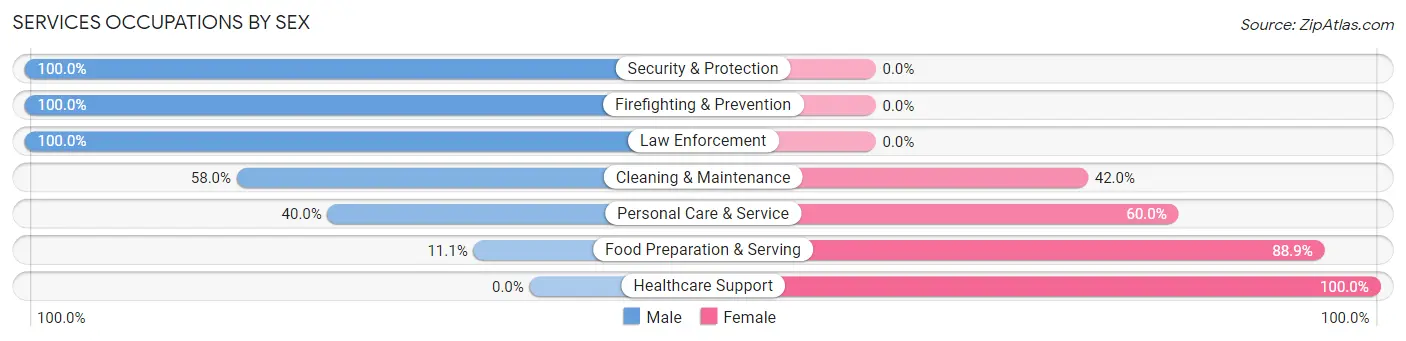
Services Occupations by Sex
Within the Services occupations in Nicoma Park, the most male-oriented occupations are Security & Protection (100.0%), Firefighting & Prevention (100.0%), and Law Enforcement (100.0%), while the most female-oriented occupations are Healthcare Support (100.0%), Food Preparation & Serving (88.9%), and Personal Care & Service (60.0%).
| Occupation | Male | Female |
| Healthcare Support | 0 (0.0%) | 20 (100.0%) |
| Security & Protection | 21 (100.0%) | 0 (0.0%) |
| Firefighting & Prevention | 8 (100.0%) | 0 (0.0%) |
| Law Enforcement | 13 (100.0%) | 0 (0.0%) |
| Food Preparation & Serving | 6 (11.1%) | 48 (88.9%) |
| Cleaning & Maintenance | 40 (58.0%) | 29 (42.0%) |
| Personal Care & Service | 8 (40.0%) | 12 (60.0%) |
| Total (Category) | 75 (40.8%) | 109 (59.2%) |
| Total (Overall) | 577 (53.9%) | 493 (46.1%) |
Sales and Office Occupations
The most common Sales and Office occupations in Nicoma Park are Office & Administration (135 | 12.6%), and Sales & Related (76 | 7.1%).
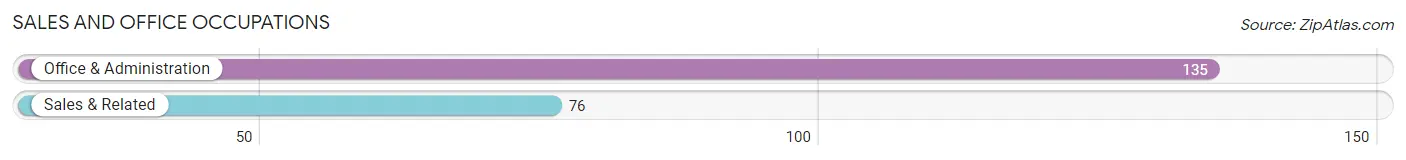
Sales and Office Occupations by Sex
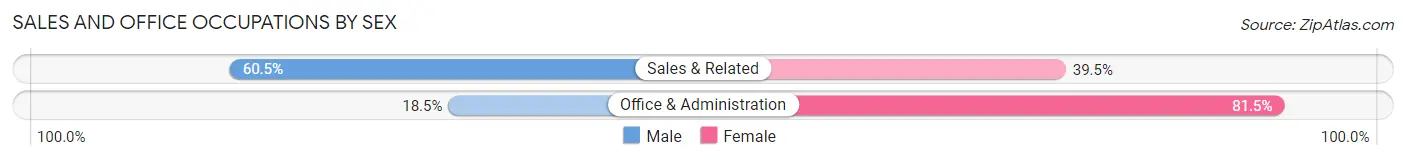
| Occupation | Male | Female |
| Sales & Related | 46 (60.5%) | 30 (39.5%) |
| Office & Administration | 25 (18.5%) | 110 (81.5%) |
| Total (Category) | 71 (33.7%) | 140 (66.3%) |
| Total (Overall) | 577 (53.9%) | 493 (46.1%) |
Natural Resources, Construction and Maintenance Occupations
The most common Natural Resources, Construction and Maintenance occupations in Nicoma Park are Construction & Extraction (110 | 10.3%), Installation, Maintenance & Repair (71 | 6.6%), and Farming, Fishing & Forestry (9 | 0.8%).
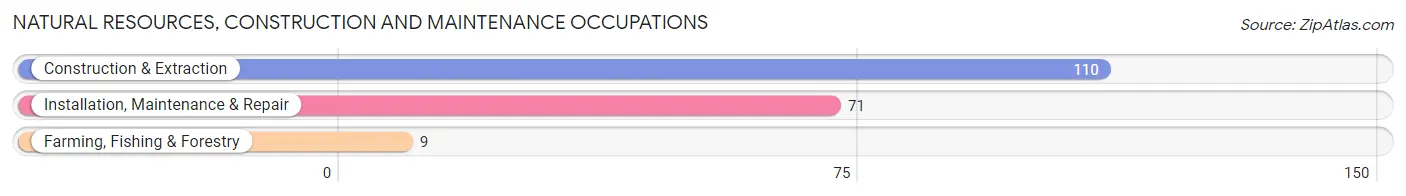
Natural Resources, Construction and Maintenance Occupations by Sex
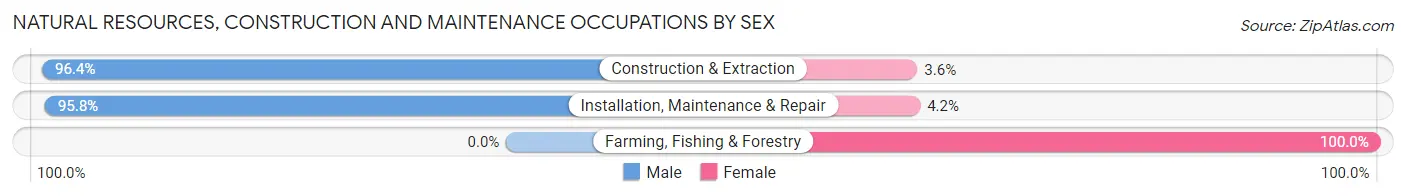
| Occupation | Male | Female |
| Farming, Fishing & Forestry | 0 (0.0%) | 9 (100.0%) |
| Construction & Extraction | 106 (96.4%) | 4 (3.6%) |
| Installation, Maintenance & Repair | 68 (95.8%) | 3 (4.2%) |
| Total (Category) | 174 (91.6%) | 16 (8.4%) |
| Total (Overall) | 577 (53.9%) | 493 (46.1%) |
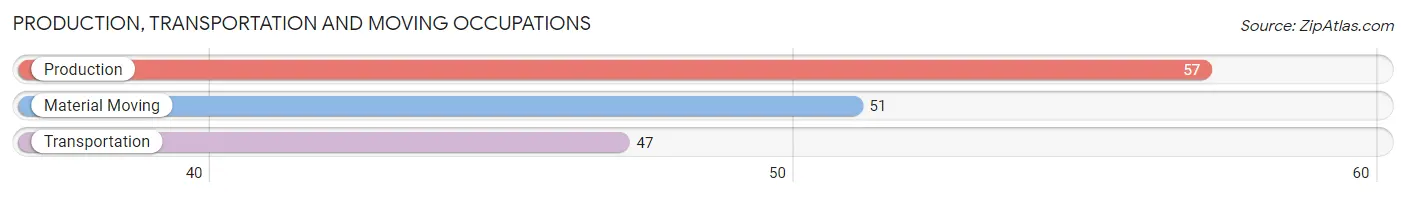
Production, Transportation and Moving Occupations
The most common Production, Transportation and Moving occupations in Nicoma Park are Production (57 | 5.3%), Material Moving (51 | 4.8%), and Transportation (47 | 4.4%).
Production, Transportation and Moving Occupations by Sex
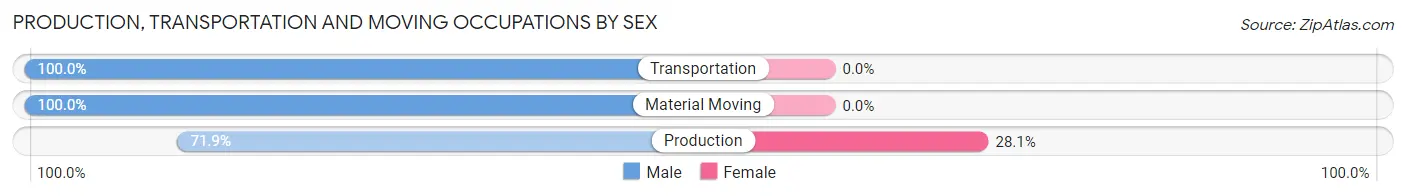
| Occupation | Male | Female |
| Production | 41 (71.9%) | 16 (28.1%) |
| Transportation | 47 (100.0%) | 0 (0.0%) |
| Material Moving | 51 (100.0%) | 0 (0.0%) |
| Total (Category) | 139 (89.7%) | 16 (10.3%) |
| Total (Overall) | 577 (53.9%) | 493 (46.1%) |
Employment Industries by Sex in Nicoma Park
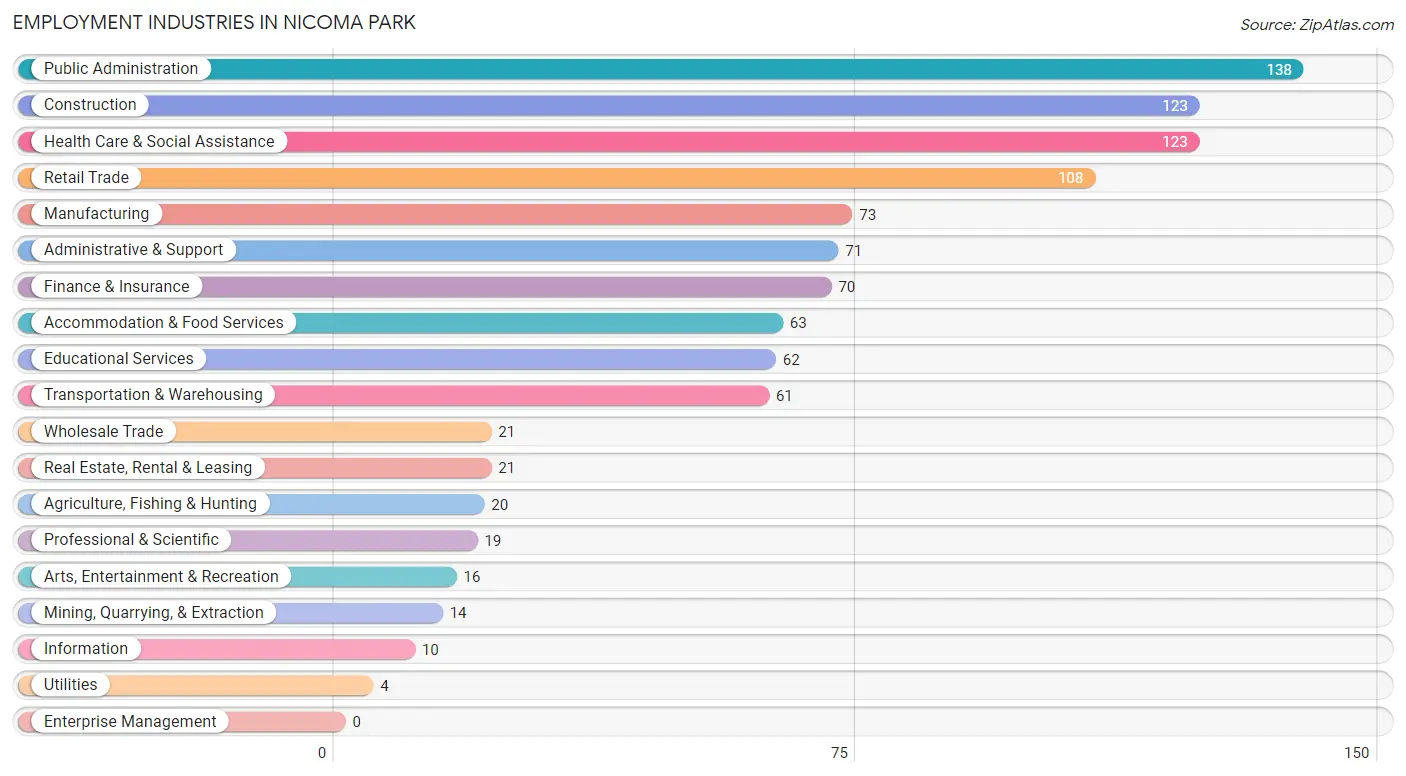
Employment Industries in Nicoma Park
The major employment industries in Nicoma Park include Public Administration (138 | 12.9%), Construction (123 | 11.5%), Health Care & Social Assistance (123 | 11.5%), Retail Trade (108 | 10.1%), and Manufacturing (73 | 6.8%).
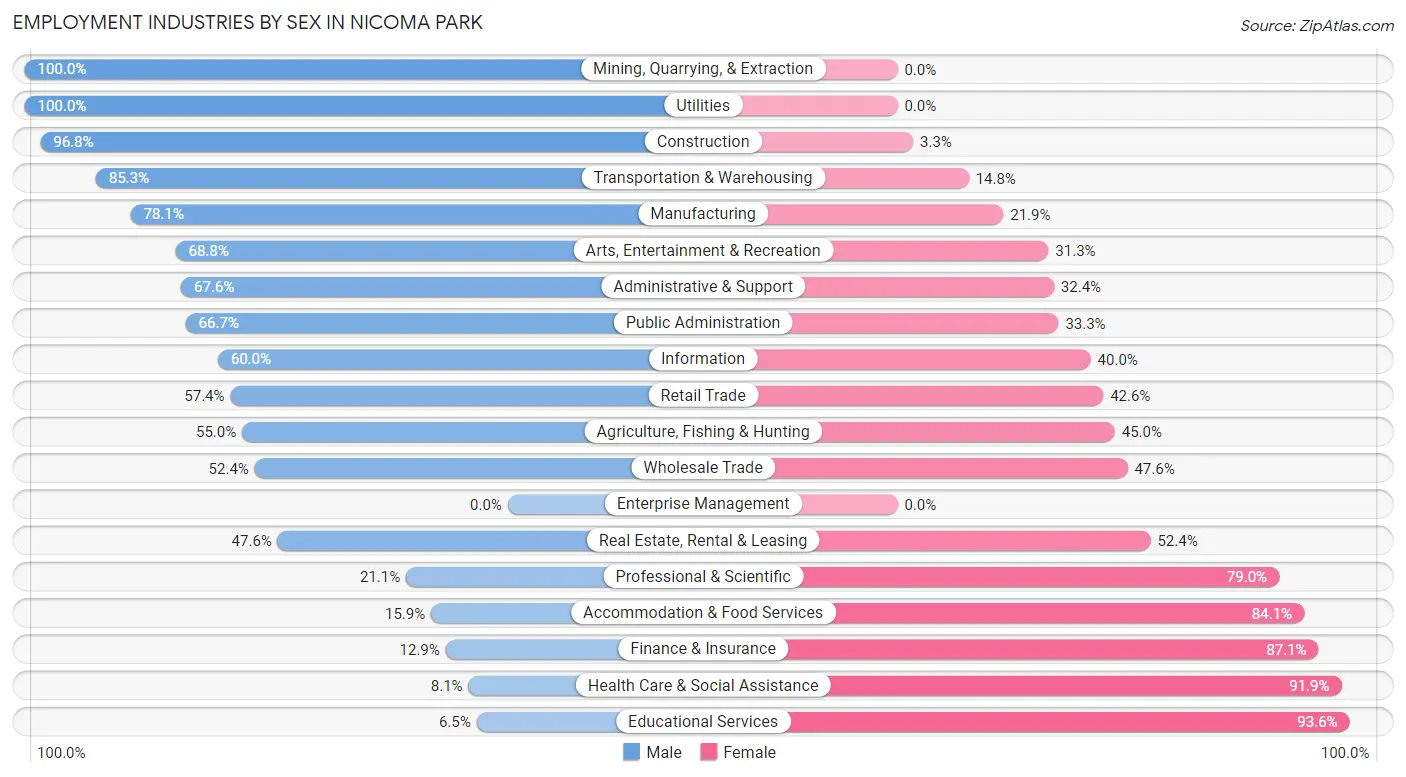
Employment Industries by Sex in Nicoma Park
The Nicoma Park industries that see more men than women are Mining, Quarrying, & Extraction (100.0%), Utilities (100.0%), and Construction (96.8%), whereas the industries that tend to have a higher number of women are Educational Services (93.5%), Health Care & Social Assistance (91.9%), and Finance & Insurance (87.1%).
| Industry | Male | Female |
| Agriculture, Fishing & Hunting | 11 (55.0%) | 9 (45.0%) |
| Mining, Quarrying, & Extraction | 14 (100.0%) | 0 (0.0%) |
| Construction | 119 (96.8%) | 4 (3.3%) |
| Manufacturing | 57 (78.1%) | 16 (21.9%) |
| Wholesale Trade | 11 (52.4%) | 10 (47.6%) |
| Retail Trade | 62 (57.4%) | 46 (42.6%) |
| Transportation & Warehousing | 52 (85.3%) | 9 (14.7%) |
| Utilities | 4 (100.0%) | 0 (0.0%) |
| Information | 6 (60.0%) | 4 (40.0%) |
| Finance & Insurance | 9 (12.9%) | 61 (87.1%) |
| Real Estate, Rental & Leasing | 10 (47.6%) | 11 (52.4%) |
| Professional & Scientific | 4 (21.0%) | 15 (78.9%) |
| Enterprise Management | 0 (0.0%) | 0 (0.0%) |
| Administrative & Support | 48 (67.6%) | 23 (32.4%) |
| Educational Services | 4 (6.5%) | 58 (93.5%) |
| Health Care & Social Assistance | 10 (8.1%) | 113 (91.9%) |
| Arts, Entertainment & Recreation | 11 (68.8%) | 5 (31.2%) |
| Accommodation & Food Services | 10 (15.9%) | 53 (84.1%) |
| Public Administration | 92 (66.7%) | 46 (33.3%) |
| Total | 577 (53.9%) | 493 (46.1%) |
Education in Nicoma Park
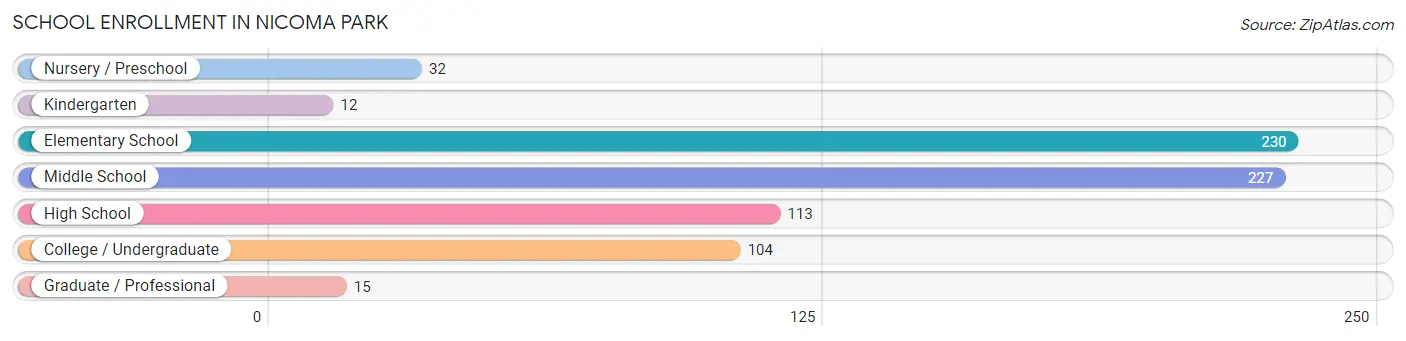
School Enrollment in Nicoma Park
The most common levels of schooling among the 733 students in Nicoma Park are elementary school (230 | 31.4%), middle school (227 | 31.0%), and high school (113 | 15.4%).
| School Level | # Students | % Students |
| Nursery / Preschool | 32 | 4.4% |
| Kindergarten | 12 | 1.6% |
| Elementary School | 230 | 31.4% |
| Middle School | 227 | 31.0% |
| High School | 113 | 15.4% |
| College / Undergraduate | 104 | 14.2% |
| Graduate / Professional | 15 | 2.1% |
| Total | 733 | 100.0% |
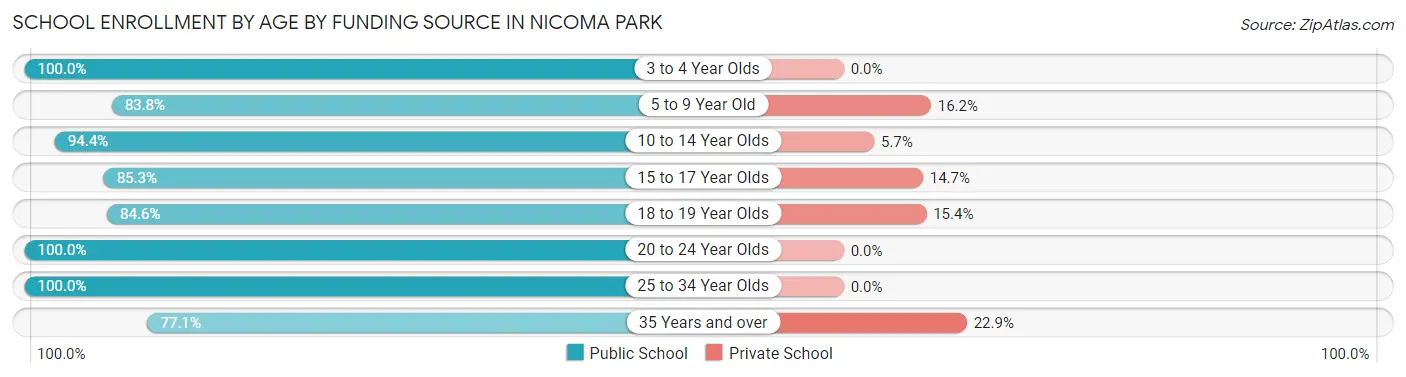
School Enrollment by Age by Funding Source in Nicoma Park
Out of a total of 733 students who are enrolled in schools in Nicoma Park, 77 (10.5%) attend a private institution, while the remaining 656 (89.5%) are enrolled in public schools. The age group of 35 years and over has the highest likelihood of being enrolled in private schools, with 11 (22.9% in the age bracket) enrolled. Conversely, the age group of 3 to 4 year olds has the lowest likelihood of being enrolled in a private school, with 23 (100.0% in the age bracket) attending a public institution.
| Age Bracket | Public School | Private School |
| 3 to 4 Year Olds | 23 (100.0%) | 0 (0.0%) |
| 5 to 9 Year Old | 160 (83.8%) | 31 (16.2%) |
| 10 to 14 Year Olds | 284 (94.4%) | 17 (5.7%) |
| 15 to 17 Year Olds | 81 (85.3%) | 14 (14.7%) |
| 18 to 19 Year Olds | 22 (84.6%) | 4 (15.4%) |
| 20 to 24 Year Olds | 14 (100.0%) | 0 (0.0%) |
| 25 to 34 Year Olds | 35 (100.0%) | 0 (0.0%) |
| 35 Years and over | 37 (77.1%) | 11 (22.9%) |
| Total | 656 (89.5%) | 77 (10.5%) |
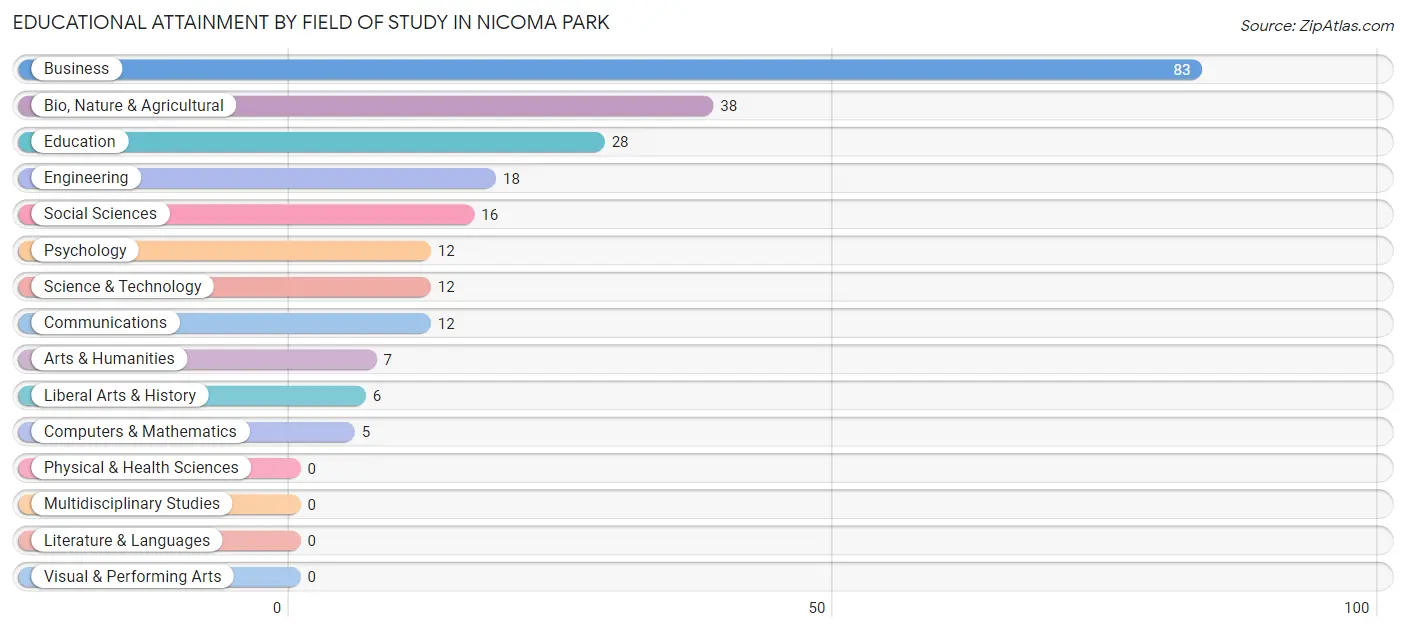
Educational Attainment by Field of Study in Nicoma Park
Business (83 | 35.0%), bio, nature & agricultural (38 | 16.0%), education (28 | 11.8%), engineering (18 | 7.6%), and social sciences (16 | 6.8%) are the most common fields of study among 237 individuals in Nicoma Park who have obtained a bachelor's degree or higher.
| Field of Study | # Graduates | % Graduates |
| Computers & Mathematics | 5 | 2.1% |
| Bio, Nature & Agricultural | 38 | 16.0% |
| Physical & Health Sciences | 0 | 0.0% |
| Psychology | 12 | 5.1% |
| Social Sciences | 16 | 6.8% |
| Engineering | 18 | 7.6% |
| Multidisciplinary Studies | 0 | 0.0% |
| Science & Technology | 12 | 5.1% |
| Business | 83 | 35.0% |
| Education | 28 | 11.8% |
| Literature & Languages | 0 | 0.0% |
| Liberal Arts & History | 6 | 2.5% |
| Visual & Performing Arts | 0 | 0.0% |
| Communications | 12 | 5.1% |
| Arts & Humanities | 7 | 2.9% |
| Total | 237 | 100.0% |
Transportation & Commute in Nicoma Park
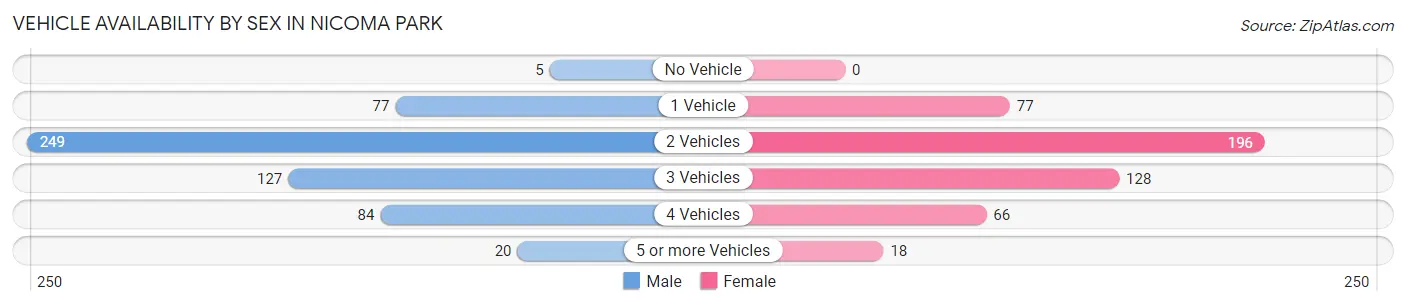
Vehicle Availability by Sex in Nicoma Park
The most prevalent vehicle ownership categories in Nicoma Park are males with 2 vehicles (249, accounting for 44.3%) and females with 2 vehicles (196, making up 51.3%).
| Vehicles Available | Male | Female |
| No Vehicle | 5 (0.9%) | 0 (0.0%) |
| 1 Vehicle | 77 (13.7%) | 77 (15.9%) |
| 2 Vehicles | 249 (44.3%) | 196 (40.4%) |
| 3 Vehicles | 127 (22.6%) | 128 (26.4%) |
| 4 Vehicles | 84 (14.9%) | 66 (13.6%) |
| 5 or more Vehicles | 20 (3.6%) | 18 (3.7%) |
| Total | 562 (100.0%) | 485 (100.0%) |
Commute Time in Nicoma Park
The most frequently occuring commute durations in Nicoma Park are 30 to 34 minutes (247 commuters, 25.4%), 15 to 19 minutes (150 commuters, 15.4%), and 25 to 29 minutes (147 commuters, 15.1%).
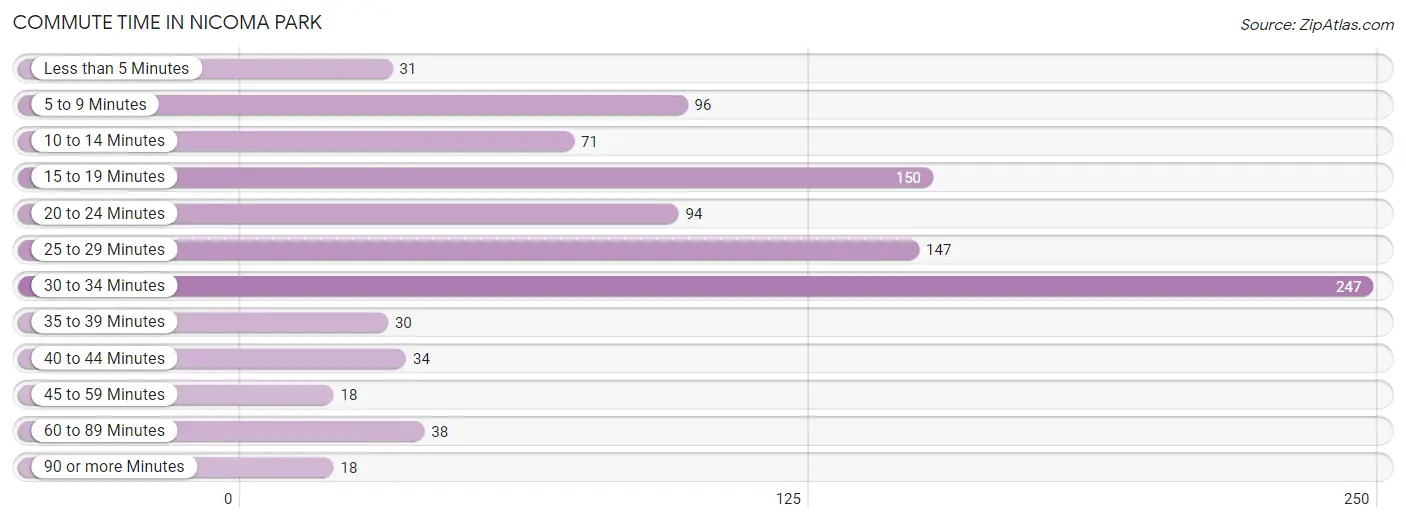
| Commute Time | # Commuters | % Commuters |
| Less than 5 Minutes | 31 | 3.2% |
| 5 to 9 Minutes | 96 | 9.9% |
| 10 to 14 Minutes | 71 | 7.3% |
| 15 to 19 Minutes | 150 | 15.4% |
| 20 to 24 Minutes | 94 | 9.7% |
| 25 to 29 Minutes | 147 | 15.1% |
| 30 to 34 Minutes | 247 | 25.4% |
| 35 to 39 Minutes | 30 | 3.1% |
| 40 to 44 Minutes | 34 | 3.5% |
| 45 to 59 Minutes | 18 | 1.8% |
| 60 to 89 Minutes | 38 | 3.9% |
| 90 or more Minutes | 18 | 1.8% |
Commute Time by Sex in Nicoma Park
The most common commute times in Nicoma Park are 30 to 34 minutes (104 commuters, 19.7%) for males and 30 to 34 minutes (143 commuters, 32.1%) for females.
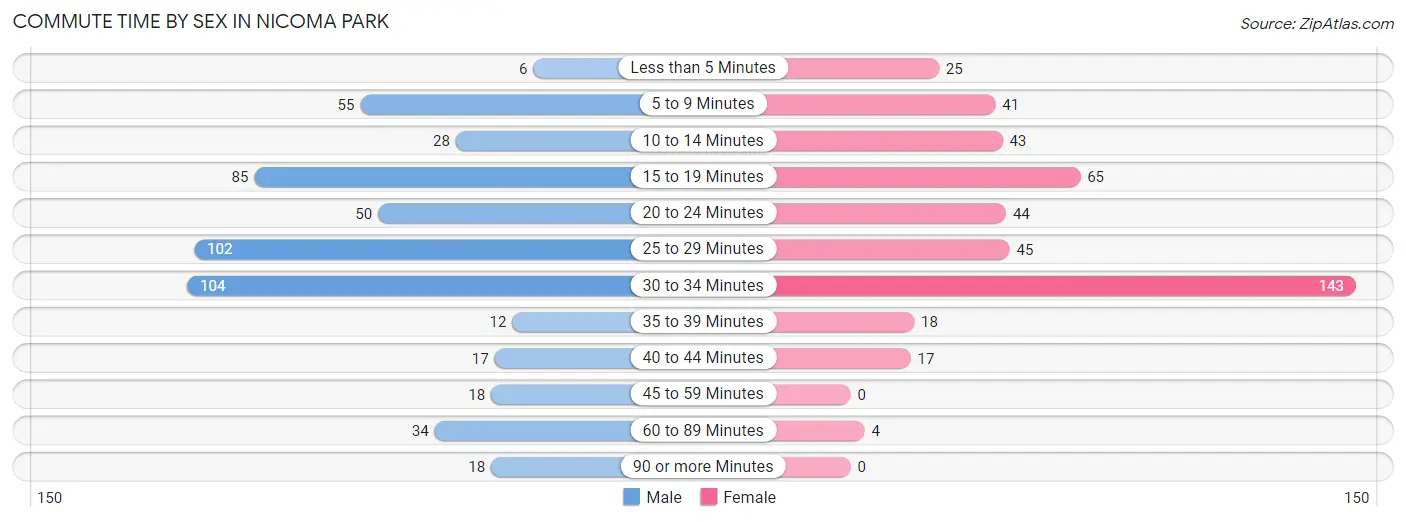
| Commute Time | Male | Female |
| Less than 5 Minutes | 6 (1.1%) | 25 (5.6%) |
| 5 to 9 Minutes | 55 (10.4%) | 41 (9.2%) |
| 10 to 14 Minutes | 28 (5.3%) | 43 (9.7%) |
| 15 to 19 Minutes | 85 (16.1%) | 65 (14.6%) |
| 20 to 24 Minutes | 50 (9.5%) | 44 (9.9%) |
| 25 to 29 Minutes | 102 (19.3%) | 45 (10.1%) |
| 30 to 34 Minutes | 104 (19.7%) | 143 (32.1%) |
| 35 to 39 Minutes | 12 (2.3%) | 18 (4.0%) |
| 40 to 44 Minutes | 17 (3.2%) | 17 (3.8%) |
| 45 to 59 Minutes | 18 (3.4%) | 0 (0.0%) |
| 60 to 89 Minutes | 34 (6.4%) | 4 (0.9%) |
| 90 or more Minutes | 18 (3.4%) | 0 (0.0%) |
Time of Departure to Work by Sex in Nicoma Park
The most frequent times of departure to work in Nicoma Park are 7:00 AM to 7:29 AM (82, 15.5%) for males and 7:30 AM to 7:59 AM (76, 17.1%) for females.
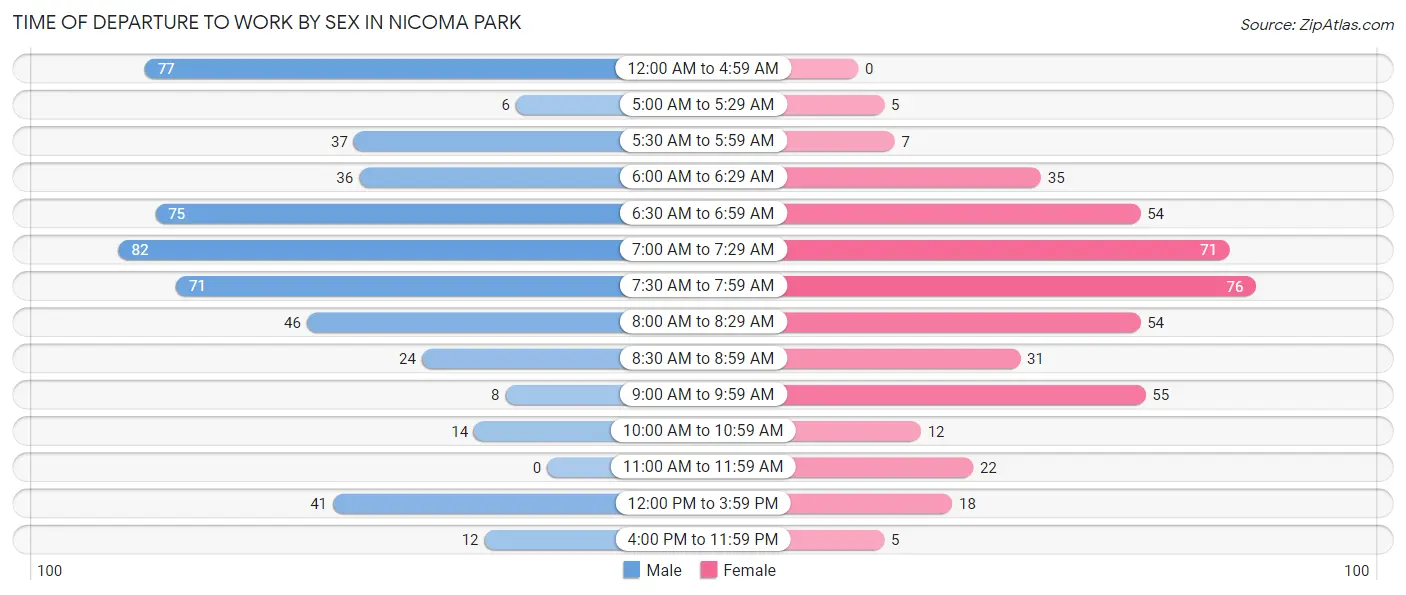
| Time of Departure | Male | Female |
| 12:00 AM to 4:59 AM | 77 (14.6%) | 0 (0.0%) |
| 5:00 AM to 5:29 AM | 6 (1.1%) | 5 (1.1%) |
| 5:30 AM to 5:59 AM | 37 (7.0%) | 7 (1.6%) |
| 6:00 AM to 6:29 AM | 36 (6.8%) | 35 (7.9%) |
| 6:30 AM to 6:59 AM | 75 (14.2%) | 54 (12.1%) |
| 7:00 AM to 7:29 AM | 82 (15.5%) | 71 (16.0%) |
| 7:30 AM to 7:59 AM | 71 (13.4%) | 76 (17.1%) |
| 8:00 AM to 8:29 AM | 46 (8.7%) | 54 (12.1%) |
| 8:30 AM to 8:59 AM | 24 (4.5%) | 31 (7.0%) |
| 9:00 AM to 9:59 AM | 8 (1.5%) | 55 (12.4%) |
| 10:00 AM to 10:59 AM | 14 (2.6%) | 12 (2.7%) |
| 11:00 AM to 11:59 AM | 0 (0.0%) | 22 (4.9%) |
| 12:00 PM to 3:59 PM | 41 (7.7%) | 18 (4.0%) |
| 4:00 PM to 11:59 PM | 12 (2.3%) | 5 (1.1%) |
| Total | 529 (100.0%) | 445 (100.0%) |
Housing Occupancy in Nicoma Park
Occupancy by Ownership in Nicoma Park
Of the total 917 dwellings in Nicoma Park, owner-occupied units account for 694 (75.7%), while renter-occupied units make up 223 (24.3%).
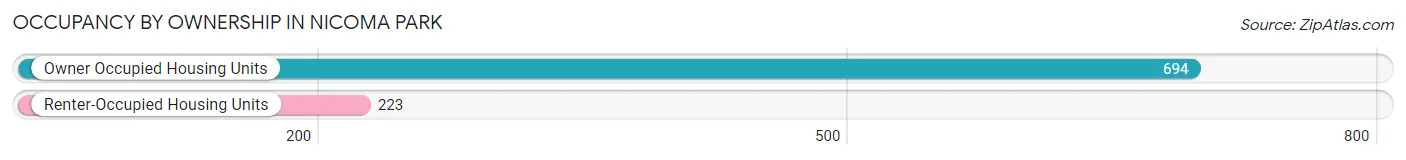
| Occupancy | # Housing Units | % Housing Units |
| Owner Occupied Housing Units | 694 | 75.7% |
| Renter-Occupied Housing Units | 223 | 24.3% |
| Total Occupied Housing Units | 917 | 100.0% |
Occupancy by Household Size in Nicoma Park
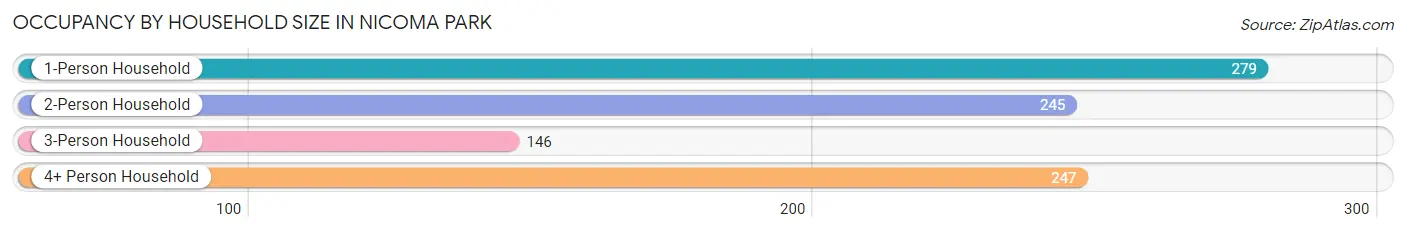
| Household Size | # Housing Units | % Housing Units |
| 1-Person Household | 279 | 30.4% |
| 2-Person Household | 245 | 26.7% |
| 3-Person Household | 146 | 15.9% |
| 4+ Person Household | 247 | 26.9% |
| Total Housing Units | 917 | 100.0% |
Occupancy by Ownership by Household Size in Nicoma Park
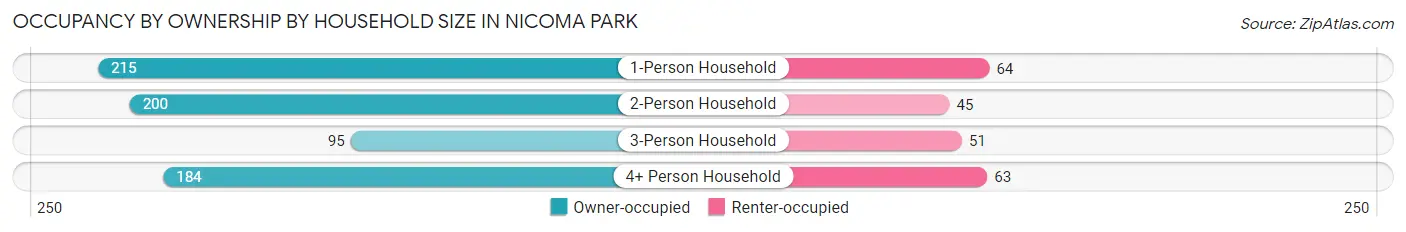
| Household Size | Owner-occupied | Renter-occupied |
| 1-Person Household | 215 (77.1%) | 64 (22.9%) |
| 2-Person Household | 200 (81.6%) | 45 (18.4%) |
| 3-Person Household | 95 (65.1%) | 51 (34.9%) |
| 4+ Person Household | 184 (74.5%) | 63 (25.5%) |
| Total Housing Units | 694 (75.7%) | 223 (24.3%) |
Occupancy by Educational Attainment in Nicoma Park
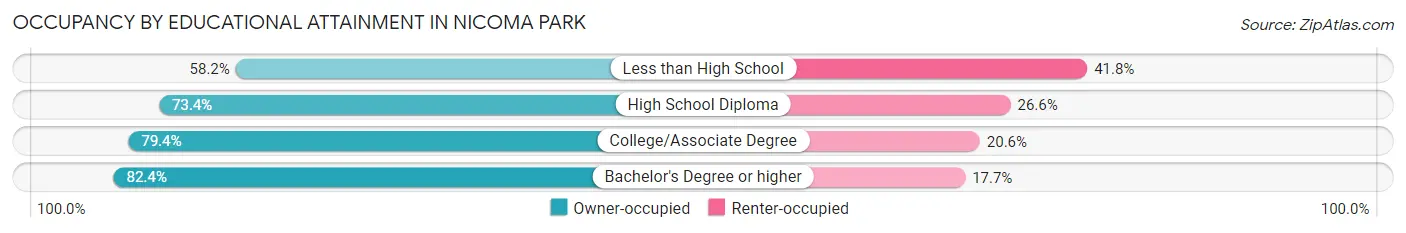
| Household Size | Owner-occupied | Renter-occupied |
| Less than High School | 57 (58.2%) | 41 (41.8%) |
| High School Diploma | 212 (73.4%) | 77 (26.6%) |
| College/Associate Degree | 313 (79.4%) | 81 (20.6%) |
| Bachelor's Degree or higher | 112 (82.4%) | 24 (17.6%) |
Occupancy by Age of Householder in Nicoma Park
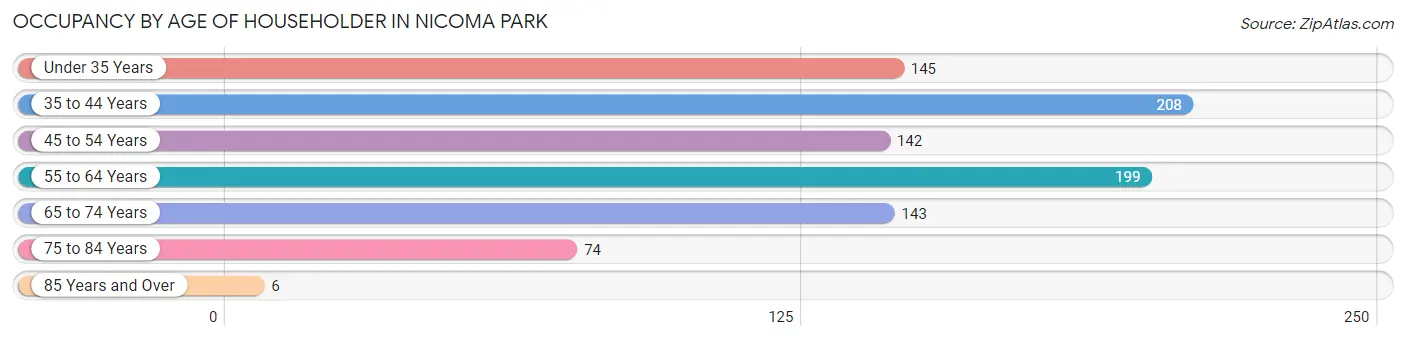
| Age Bracket | # Households | % Households |
| Under 35 Years | 145 | 15.8% |
| 35 to 44 Years | 208 | 22.7% |
| 45 to 54 Years | 142 | 15.5% |
| 55 to 64 Years | 199 | 21.7% |
| 65 to 74 Years | 143 | 15.6% |
| 75 to 84 Years | 74 | 8.1% |
| 85 Years and Over | 6 | 0.6% |
| Total | 917 | 100.0% |
Housing Finances in Nicoma Park
Median Income by Occupancy in Nicoma Park
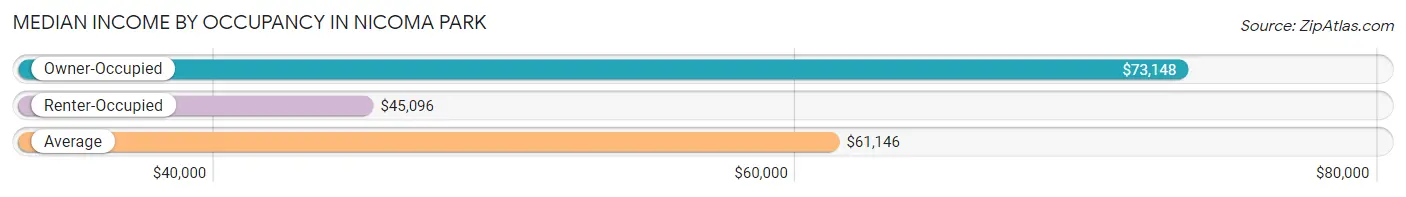
| Occupancy Type | # Households | Median Income |
| Owner-Occupied | 694 (75.7%) | $73,148 |
| Renter-Occupied | 223 (24.3%) | $45,096 |
| Average | 917 (100.0%) | $61,146 |
Occupancy by Householder Income Bracket in Nicoma Park
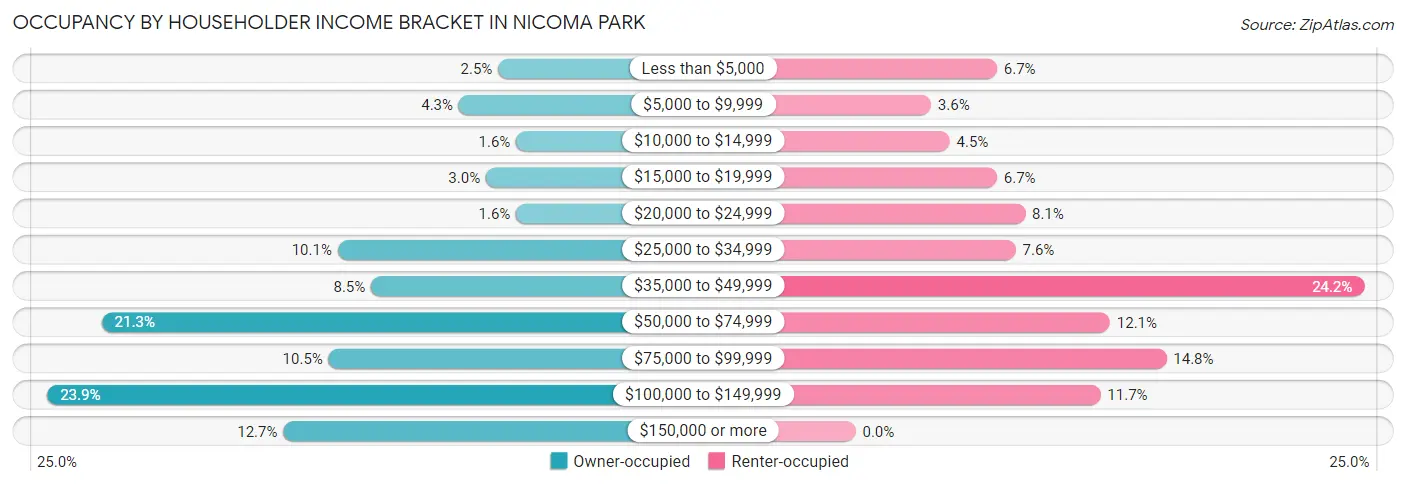
| Income Bracket | Owner-occupied | Renter-occupied |
| Less than $5,000 | 17 (2.5%) | 15 (6.7%) |
| $5,000 to $9,999 | 30 (4.3%) | 8 (3.6%) |
| $10,000 to $14,999 | 11 (1.6%) | 10 (4.5%) |
| $15,000 to $19,999 | 21 (3.0%) | 15 (6.7%) |
| $20,000 to $24,999 | 11 (1.6%) | 18 (8.1%) |
| $25,000 to $34,999 | 70 (10.1%) | 17 (7.6%) |
| $35,000 to $49,999 | 59 (8.5%) | 54 (24.2%) |
| $50,000 to $74,999 | 148 (21.3%) | 27 (12.1%) |
| $75,000 to $99,999 | 73 (10.5%) | 33 (14.8%) |
| $100,000 to $149,999 | 166 (23.9%) | 26 (11.7%) |
| $150,000 or more | 88 (12.7%) | 0 (0.0%) |
| Total | 694 (100.0%) | 223 (100.0%) |
Monthly Housing Cost Tiers in Nicoma Park
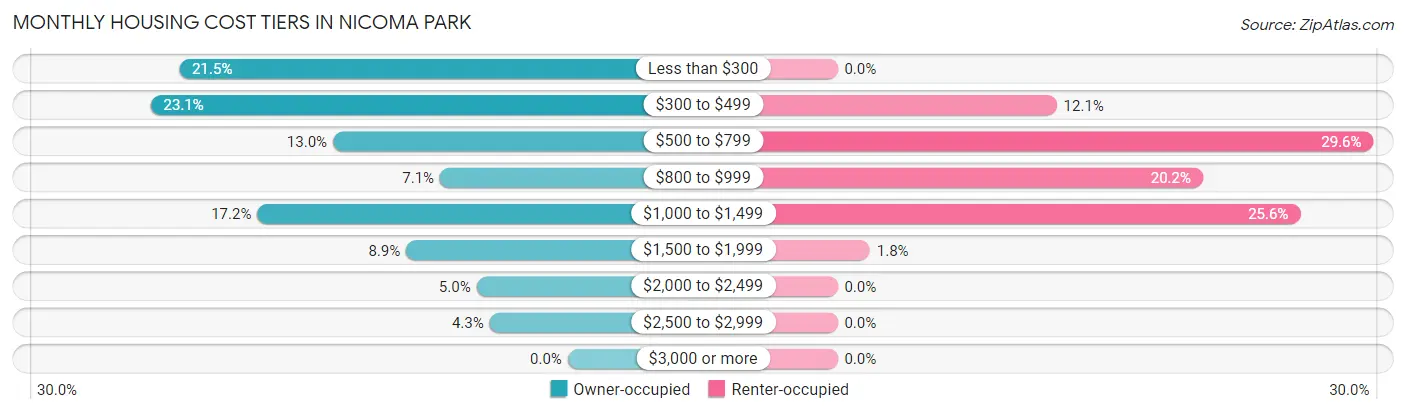
| Monthly Cost | Owner-occupied | Renter-occupied |
| Less than $300 | 149 (21.5%) | 0 (0.0%) |
| $300 to $499 | 160 (23.1%) | 27 (12.1%) |
| $500 to $799 | 90 (13.0%) | 66 (29.6%) |
| $800 to $999 | 49 (7.1%) | 45 (20.2%) |
| $1,000 to $1,499 | 119 (17.2%) | 57 (25.6%) |
| $1,500 to $1,999 | 62 (8.9%) | 4 (1.8%) |
| $2,000 to $2,499 | 35 (5.0%) | 0 (0.0%) |
| $2,500 to $2,999 | 30 (4.3%) | 0 (0.0%) |
| $3,000 or more | 0 (0.0%) | 0 (0.0%) |
| Total | 694 (100.0%) | 223 (100.0%) |
Physical Housing Characteristics in Nicoma Park
Housing Structures in Nicoma Park
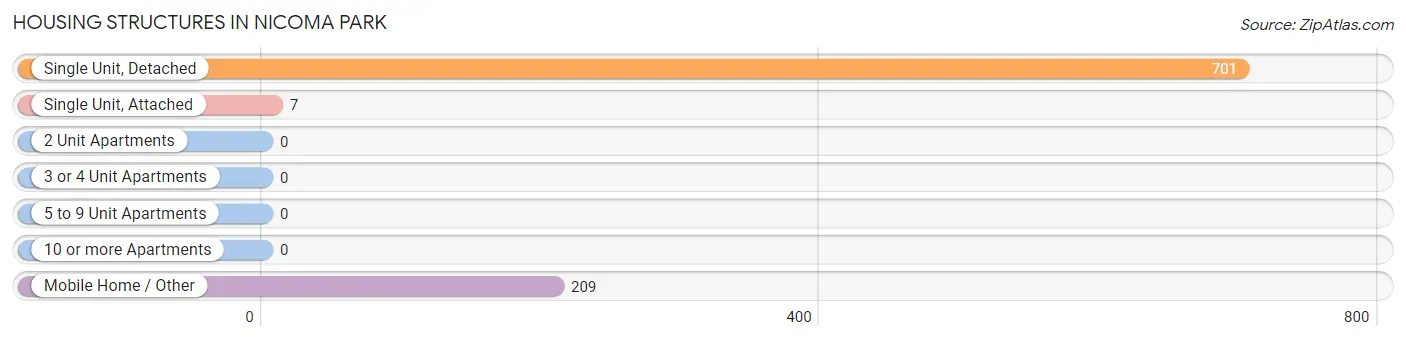
| Structure Type | # Housing Units | % Housing Units |
| Single Unit, Detached | 701 | 76.4% |
| Single Unit, Attached | 7 | 0.8% |
| 2 Unit Apartments | 0 | 0.0% |
| 3 or 4 Unit Apartments | 0 | 0.0% |
| 5 to 9 Unit Apartments | 0 | 0.0% |
| 10 or more Apartments | 0 | 0.0% |
| Mobile Home / Other | 209 | 22.8% |
| Total | 917 | 100.0% |
Housing Structures by Occupancy in Nicoma Park
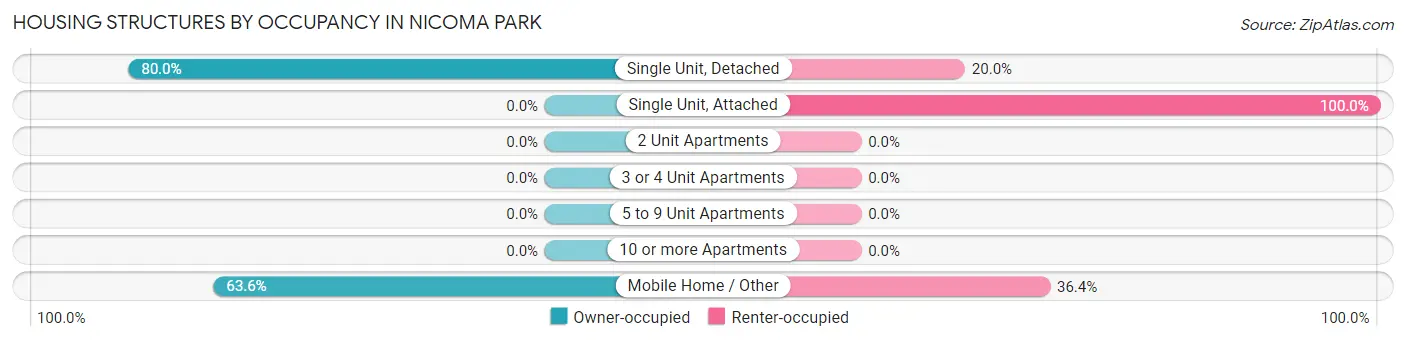
| Structure Type | Owner-occupied | Renter-occupied |
| Single Unit, Detached | 561 (80.0%) | 140 (20.0%) |
| Single Unit, Attached | 0 (0.0%) | 7 (100.0%) |
| 2 Unit Apartments | 0 (0.0%) | 0 (0.0%) |
| 3 or 4 Unit Apartments | 0 (0.0%) | 0 (0.0%) |
| 5 to 9 Unit Apartments | 0 (0.0%) | 0 (0.0%) |
| 10 or more Apartments | 0 (0.0%) | 0 (0.0%) |
| Mobile Home / Other | 133 (63.6%) | 76 (36.4%) |
| Total | 694 (75.7%) | 223 (24.3%) |
Housing Structures by Number of Rooms in Nicoma Park
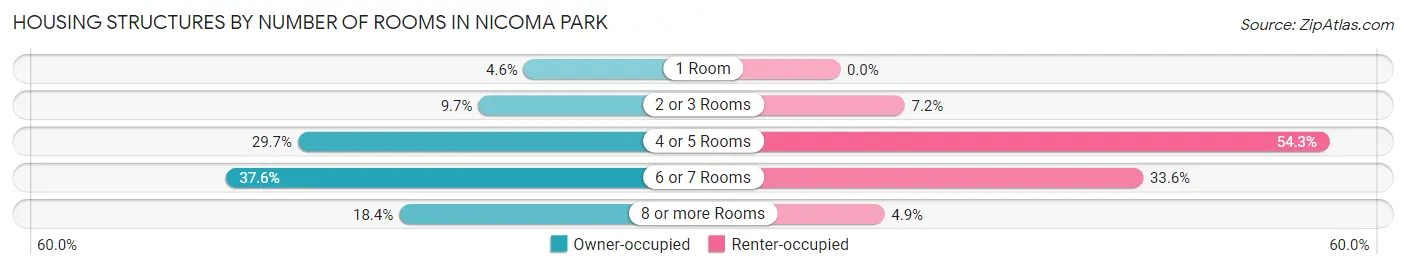
| Number of Rooms | Owner-occupied | Renter-occupied |
| 1 Room | 32 (4.6%) | 0 (0.0%) |
| 2 or 3 Rooms | 67 (9.7%) | 16 (7.2%) |
| 4 or 5 Rooms | 206 (29.7%) | 121 (54.3%) |
| 6 or 7 Rooms | 261 (37.6%) | 75 (33.6%) |
| 8 or more Rooms | 128 (18.4%) | 11 (4.9%) |
| Total | 694 (100.0%) | 223 (100.0%) |
Housing Structure by Heating Type in Nicoma Park
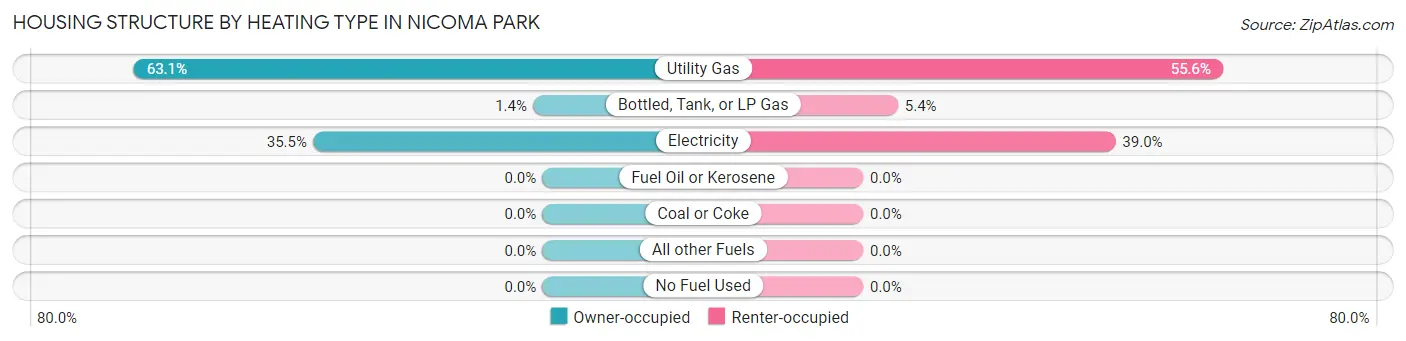
| Heating Type | Owner-occupied | Renter-occupied |
| Utility Gas | 438 (63.1%) | 124 (55.6%) |
| Bottled, Tank, or LP Gas | 10 (1.4%) | 12 (5.4%) |
| Electricity | 246 (35.4%) | 87 (39.0%) |
| Fuel Oil or Kerosene | 0 (0.0%) | 0 (0.0%) |
| Coal or Coke | 0 (0.0%) | 0 (0.0%) |
| All other Fuels | 0 (0.0%) | 0 (0.0%) |
| No Fuel Used | 0 (0.0%) | 0 (0.0%) |
| Total | 694 (100.0%) | 223 (100.0%) |
Household Vehicle Usage in Nicoma Park
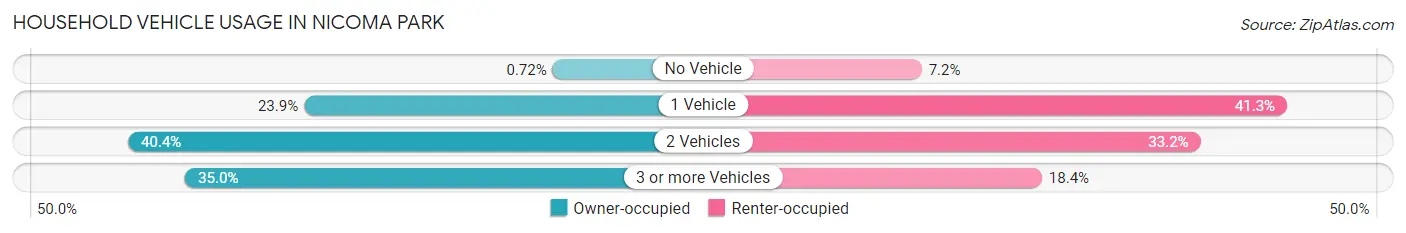
| Vehicles per Household | Owner-occupied | Renter-occupied |
| No Vehicle | 5 (0.7%) | 16 (7.2%) |
| 1 Vehicle | 166 (23.9%) | 92 (41.3%) |
| 2 Vehicles | 280 (40.4%) | 74 (33.2%) |
| 3 or more Vehicles | 243 (35.0%) | 41 (18.4%) |
| Total | 694 (100.0%) | 223 (100.0%) |
Real Estate & Mortgages in Nicoma Park
Real Estate and Mortgage Overview in Nicoma Park
| Characteristic | Without Mortgage | With Mortgage |
| Housing Units | 383 | 311 |
| Median Property Value | $99,600 | $169,400 |
| Median Household Income | $53,194 | $32 |
| Monthly Housing Costs | $361 | $0 |
| Real Estate Taxes | $764 | $46 |
Property Value by Mortgage Status in Nicoma Park
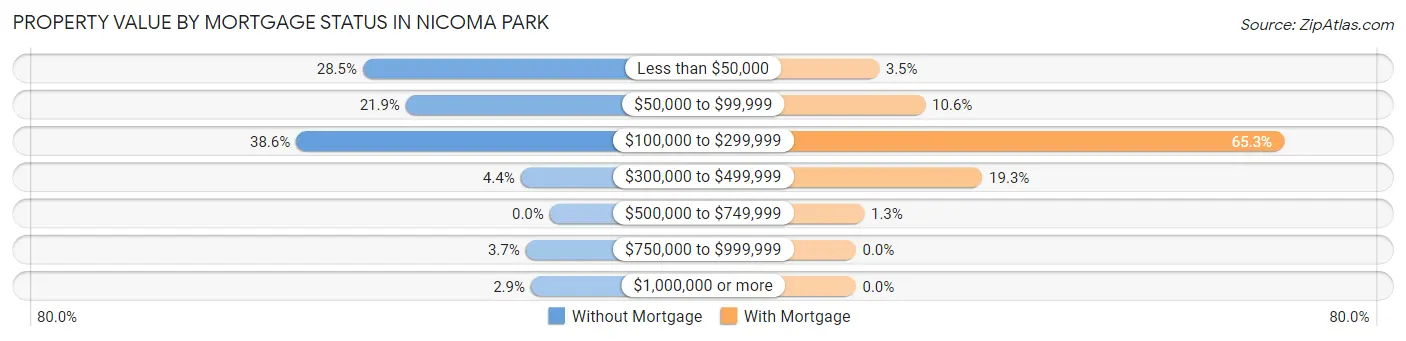
| Property Value | Without Mortgage | With Mortgage |
| Less than $50,000 | 109 (28.5%) | 11 (3.5%) |
| $50,000 to $99,999 | 84 (21.9%) | 33 (10.6%) |
| $100,000 to $299,999 | 148 (38.6%) | 203 (65.3%) |
| $300,000 to $499,999 | 17 (4.4%) | 60 (19.3%) |
| $500,000 to $749,999 | 0 (0.0%) | 4 (1.3%) |
| $750,000 to $999,999 | 14 (3.7%) | 0 (0.0%) |
| $1,000,000 or more | 11 (2.9%) | 0 (0.0%) |
| Total | 383 (100.0%) | 311 (100.0%) |
Household Income by Mortgage Status in Nicoma Park
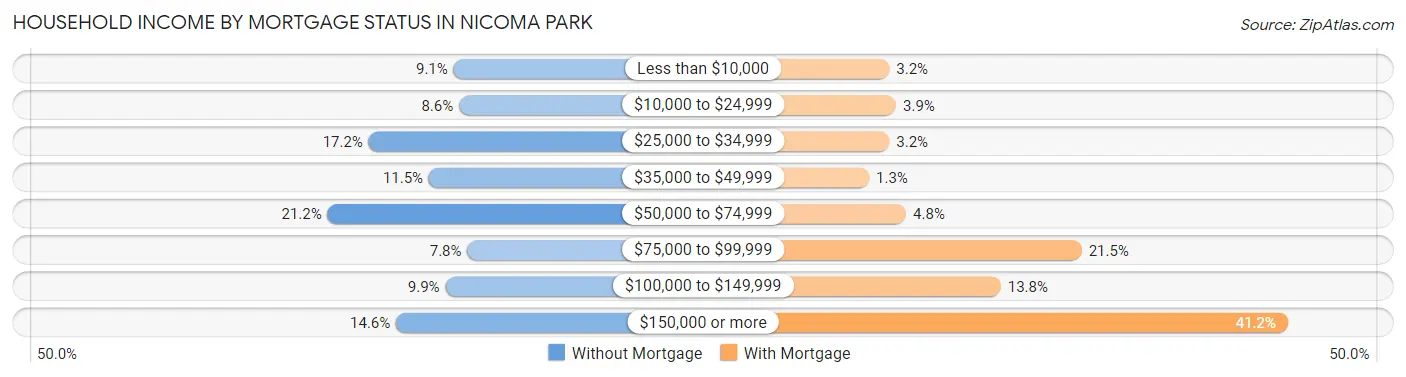
| Household Income | Without Mortgage | With Mortgage |
| Less than $10,000 | 35 (9.1%) | 10 (3.2%) |
| $10,000 to $24,999 | 33 (8.6%) | 12 (3.9%) |
| $25,000 to $34,999 | 66 (17.2%) | 10 (3.2%) |
| $35,000 to $49,999 | 44 (11.5%) | 4 (1.3%) |
| $50,000 to $74,999 | 81 (21.1%) | 15 (4.8%) |
| $75,000 to $99,999 | 30 (7.8%) | 67 (21.5%) |
| $100,000 to $149,999 | 38 (9.9%) | 43 (13.8%) |
| $150,000 or more | 56 (14.6%) | 128 (41.2%) |
| Total | 383 (100.0%) | 311 (100.0%) |
Property Value to Household Income Ratio in Nicoma Park
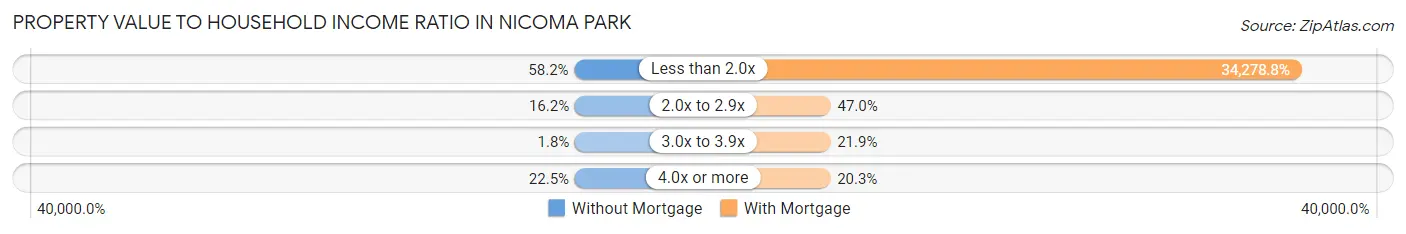
| Value-to-Income Ratio | Without Mortgage | With Mortgage |
| Less than 2.0x | 223 (58.2%) | 106,607 (34,278.8%) |
| 2.0x to 2.9x | 62 (16.2%) | 146 (46.9%) |
| 3.0x to 3.9x | 7 (1.8%) | 68 (21.9%) |
| 4.0x or more | 86 (22.5%) | 63 (20.3%) |
| Total | 383 (100.0%) | 311 (100.0%) |
Real Estate Taxes by Mortgage Status in Nicoma Park
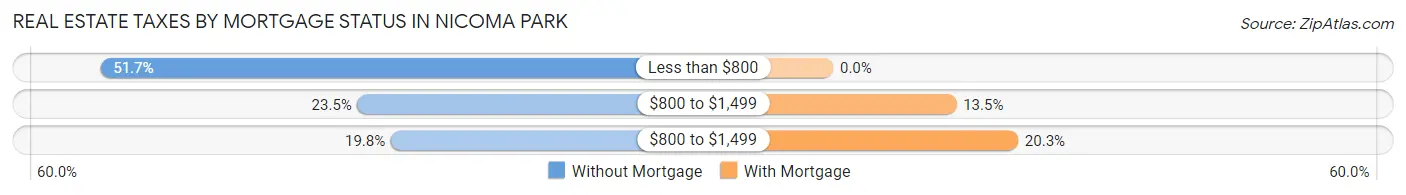
| Property Taxes | Without Mortgage | With Mortgage |
| Less than $800 | 198 (51.7%) | 0 (0.0%) |
| $800 to $1,499 | 90 (23.5%) | 42 (13.5%) |
| $800 to $1,499 | 76 (19.8%) | 63 (20.3%) |
| Total | 383 (100.0%) | 311 (100.0%) |
Health & Disability in Nicoma Park
Health Insurance Coverage by Age in Nicoma Park
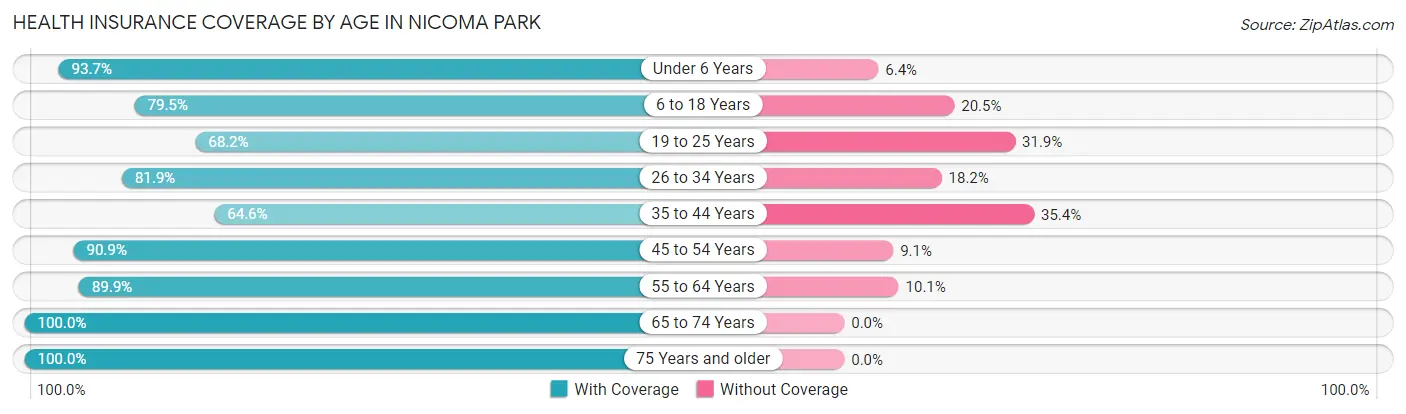
| Age Bracket | With Coverage | Without Coverage |
| Under 6 Years | 177 (93.6%) | 12 (6.4%) |
| 6 to 18 Years | 488 (79.5%) | 126 (20.5%) |
| 19 to 25 Years | 107 (68.1%) | 50 (31.9%) |
| 26 to 34 Years | 221 (81.9%) | 49 (18.1%) |
| 35 to 44 Years | 272 (64.6%) | 149 (35.4%) |
| 45 to 54 Years | 209 (90.9%) | 21 (9.1%) |
| 55 to 64 Years | 284 (89.9%) | 32 (10.1%) |
| 65 to 74 Years | 220 (100.0%) | 0 (0.0%) |
| 75 Years and older | 125 (100.0%) | 0 (0.0%) |
| Total | 2,103 (82.7%) | 439 (17.3%) |
Health Insurance Coverage by Citizenship Status in Nicoma Park
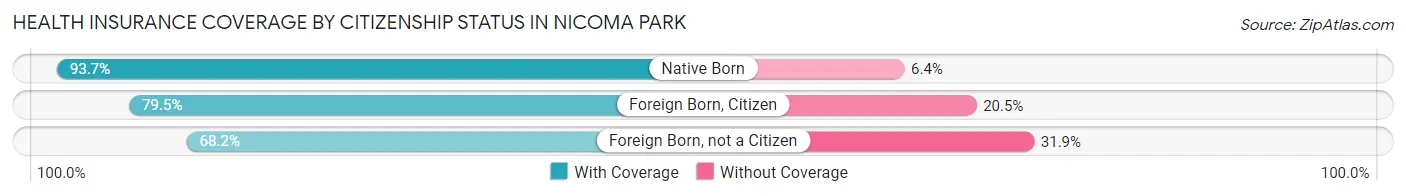
| Citizenship Status | With Coverage | Without Coverage |
| Native Born | 177 (93.6%) | 12 (6.4%) |
| Foreign Born, Citizen | 488 (79.5%) | 126 (20.5%) |
| Foreign Born, not a Citizen | 107 (68.1%) | 50 (31.9%) |
Health Insurance Coverage by Household Income in Nicoma Park
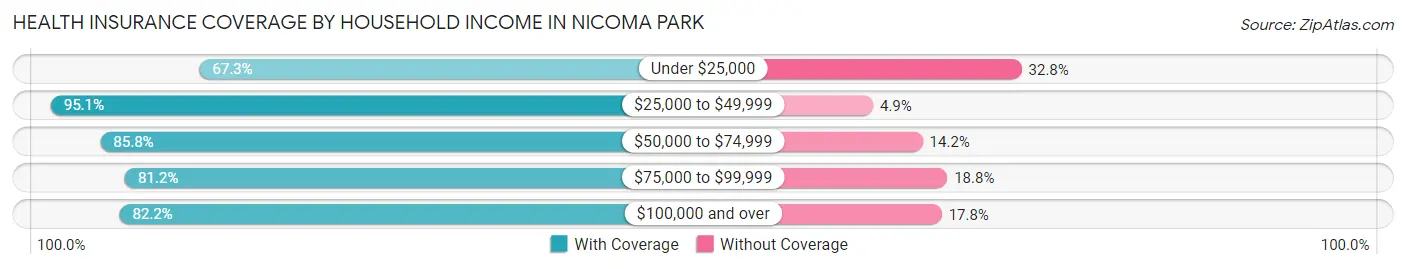
| Household Income | With Coverage | Without Coverage |
| Under $25,000 | 230 (67.2%) | 112 (32.8%) |
| $25,000 to $49,999 | 406 (95.1%) | 21 (4.9%) |
| $50,000 to $74,999 | 314 (85.8%) | 52 (14.2%) |
| $75,000 to $99,999 | 302 (81.2%) | 70 (18.8%) |
| $100,000 and over | 851 (82.2%) | 184 (17.8%) |
Public vs Private Health Insurance Coverage by Age in Nicoma Park
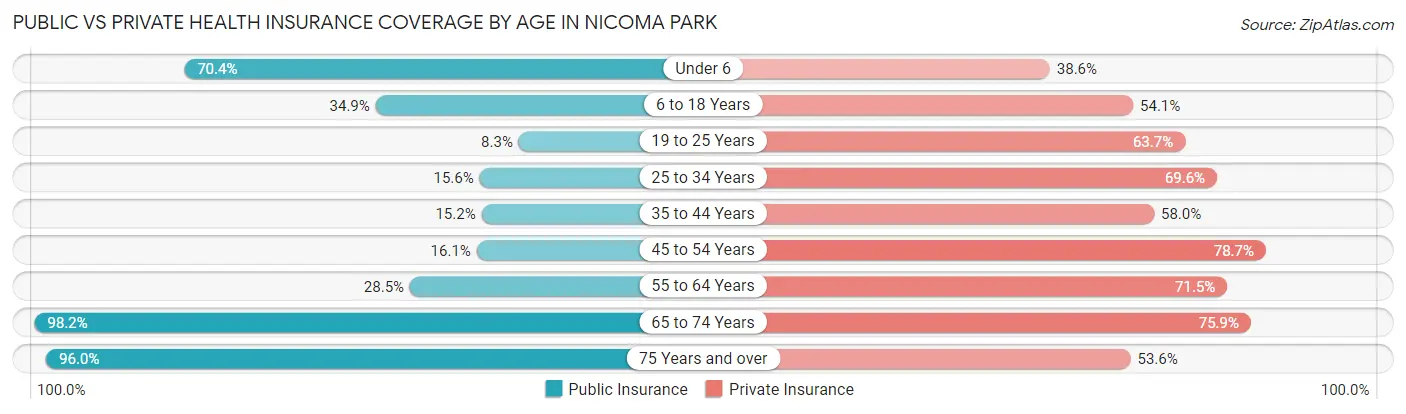
| Age Bracket | Public Insurance | Private Insurance |
| Under 6 | 133 (70.4%) | 73 (38.6%) |
| 6 to 18 Years | 214 (34.8%) | 332 (54.1%) |
| 19 to 25 Years | 13 (8.3%) | 100 (63.7%) |
| 25 to 34 Years | 42 (15.6%) | 188 (69.6%) |
| 35 to 44 Years | 64 (15.2%) | 244 (58.0%) |
| 45 to 54 Years | 37 (16.1%) | 181 (78.7%) |
| 55 to 64 Years | 90 (28.5%) | 226 (71.5%) |
| 65 to 74 Years | 216 (98.2%) | 167 (75.9%) |
| 75 Years and over | 120 (96.0%) | 67 (53.6%) |
| Total | 929 (36.5%) | 1,578 (62.1%) |
Disability Status by Sex by Age in Nicoma Park
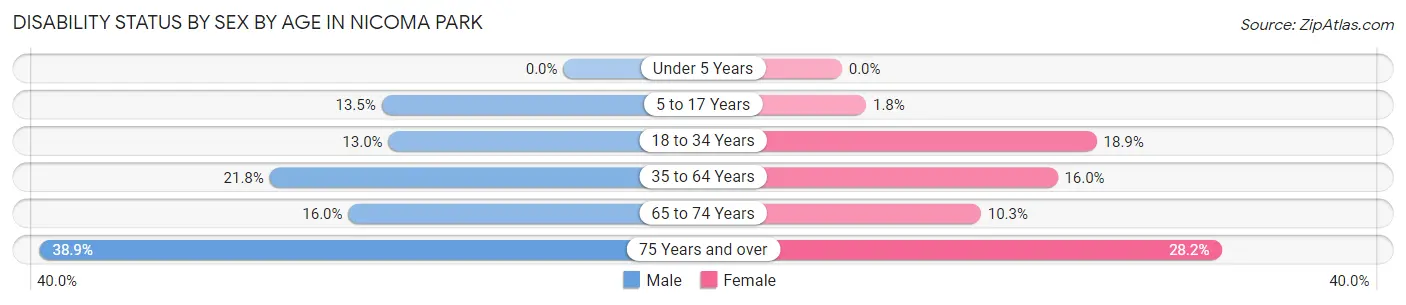
| Age Bracket | Male | Female |
| Under 5 Years | 0 (0.0%) | 0 (0.0%) |
| 5 to 17 Years | 44 (13.5%) | 5 (1.8%) |
| 18 to 34 Years | 30 (13.0%) | 42 (18.9%) |
| 35 to 64 Years | 106 (21.8%) | 77 (16.0%) |
| 65 to 74 Years | 15 (16.0%) | 13 (10.3%) |
| 75 Years and over | 21 (38.9%) | 20 (28.2%) |
Disability Class by Sex by Age in Nicoma Park
Disability Class: Hearing Difficulty
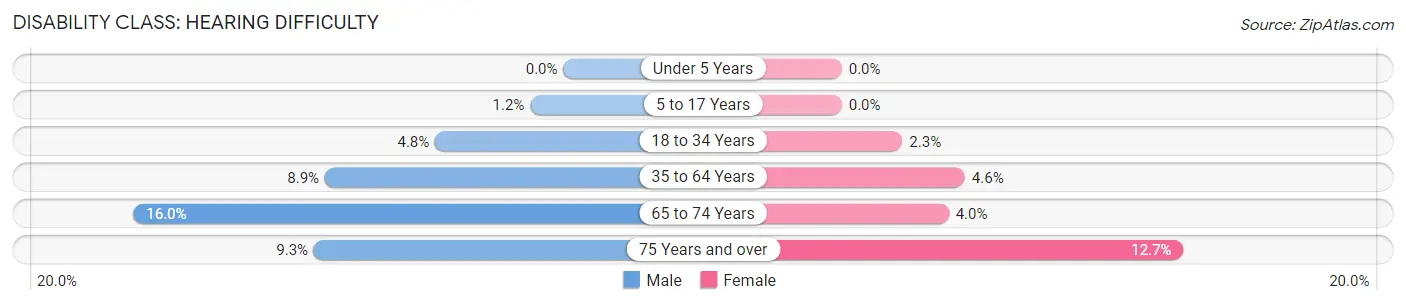
| Age Bracket | Male | Female |
| Under 5 Years | 0 (0.0%) | 0 (0.0%) |
| 5 to 17 Years | 4 (1.2%) | 0 (0.0%) |
| 18 to 34 Years | 11 (4.8%) | 5 (2.2%) |
| 35 to 64 Years | 43 (8.8%) | 22 (4.6%) |
| 65 to 74 Years | 15 (16.0%) | 5 (4.0%) |
| 75 Years and over | 5 (9.3%) | 9 (12.7%) |
Disability Class: Vision Difficulty
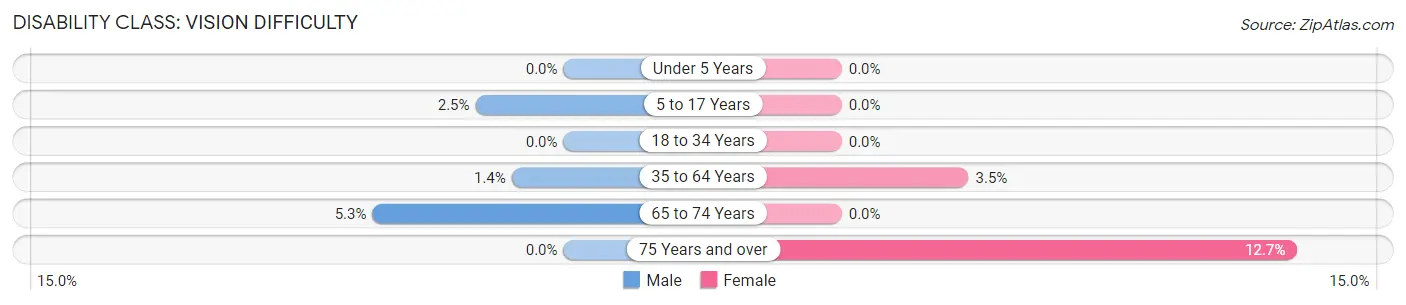
| Age Bracket | Male | Female |
| Under 5 Years | 0 (0.0%) | 0 (0.0%) |
| 5 to 17 Years | 8 (2.5%) | 0 (0.0%) |
| 18 to 34 Years | 0 (0.0%) | 0 (0.0%) |
| 35 to 64 Years | 7 (1.4%) | 17 (3.5%) |
| 65 to 74 Years | 5 (5.3%) | 0 (0.0%) |
| 75 Years and over | 0 (0.0%) | 9 (12.7%) |
Disability Class: Cognitive Difficulty
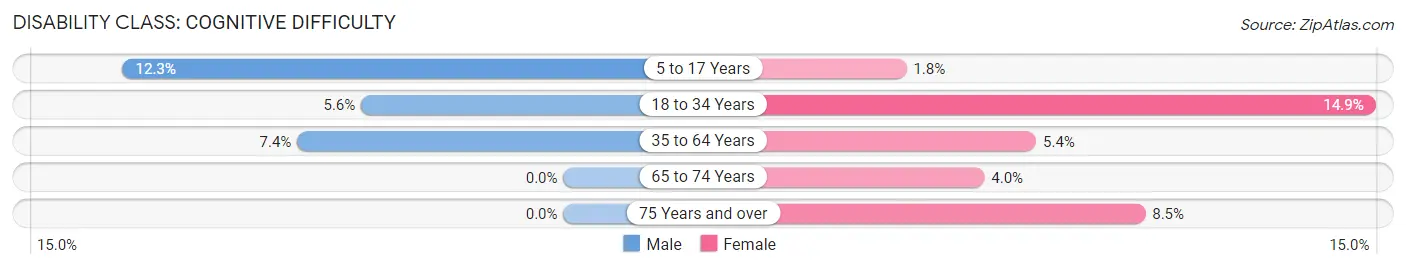
| Age Bracket | Male | Female |
| 5 to 17 Years | 40 (12.3%) | 5 (1.8%) |
| 18 to 34 Years | 13 (5.6%) | 33 (14.9%) |
| 35 to 64 Years | 36 (7.4%) | 26 (5.4%) |
| 65 to 74 Years | 0 (0.0%) | 5 (4.0%) |
| 75 Years and over | 0 (0.0%) | 6 (8.5%) |
Disability Class: Ambulatory Difficulty
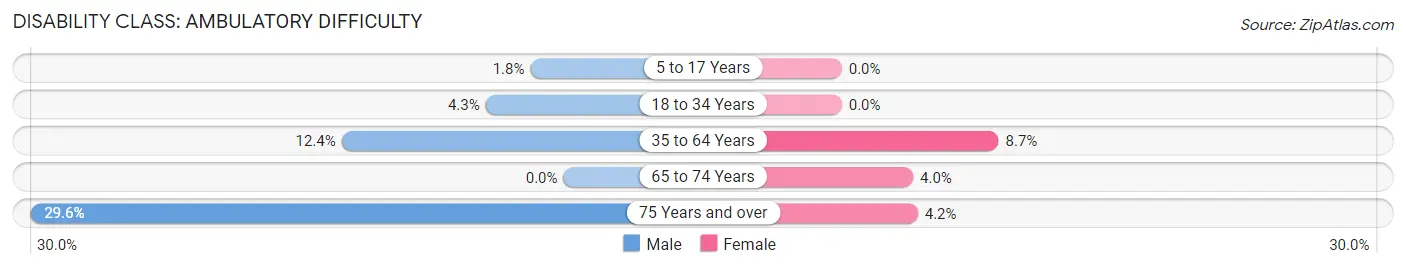
| Age Bracket | Male | Female |
| 5 to 17 Years | 6 (1.8%) | 0 (0.0%) |
| 18 to 34 Years | 10 (4.3%) | 0 (0.0%) |
| 35 to 64 Years | 60 (12.3%) | 42 (8.7%) |
| 65 to 74 Years | 0 (0.0%) | 5 (4.0%) |
| 75 Years and over | 16 (29.6%) | 3 (4.2%) |
Disability Class: Self-Care Difficulty
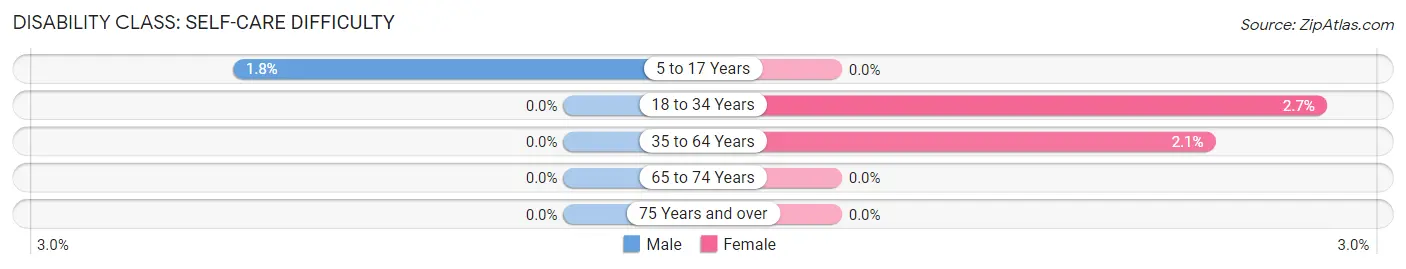
| Age Bracket | Male | Female |
| 5 to 17 Years | 6 (1.8%) | 0 (0.0%) |
| 18 to 34 Years | 0 (0.0%) | 6 (2.7%) |
| 35 to 64 Years | 0 (0.0%) | 10 (2.1%) |
| 65 to 74 Years | 0 (0.0%) | 0 (0.0%) |
| 75 Years and over | 0 (0.0%) | 0 (0.0%) |
Technology Access in Nicoma Park
Computing Device Access in Nicoma Park
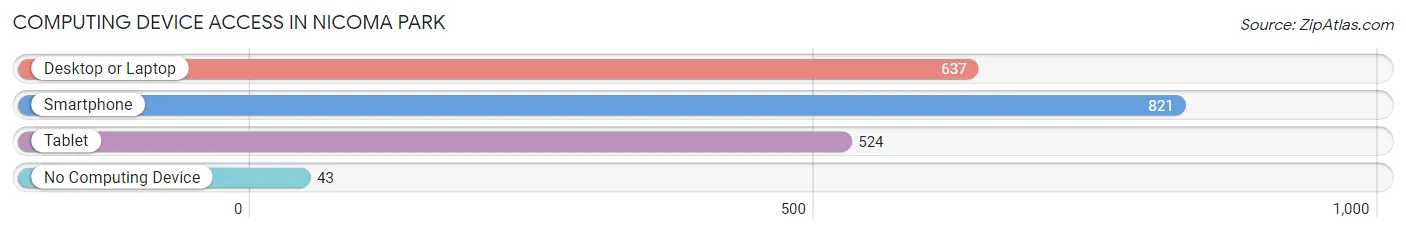
| Device Type | # Households | % Households |
| Desktop or Laptop | 637 | 69.5% |
| Smartphone | 821 | 89.5% |
| Tablet | 524 | 57.1% |
| No Computing Device | 43 | 4.7% |
| Total | 917 | 100.0% |
Internet Access in Nicoma Park
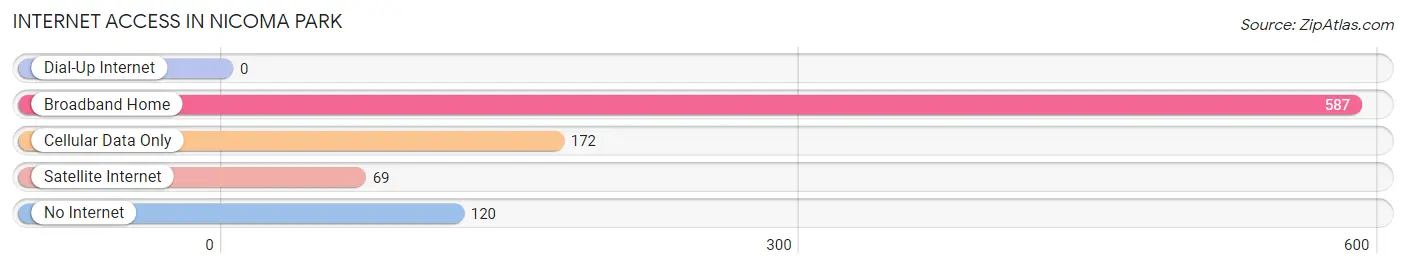
| Internet Type | # Households | % Households |
| Dial-Up Internet | 0 | 0.0% |
| Broadband Home | 587 | 64.0% |
| Cellular Data Only | 172 | 18.8% |
| Satellite Internet | 69 | 7.5% |
| No Internet | 120 | 13.1% |
| Total | 917 | 100.0% |
Nicoma Park Summary
Nestled in the heart of Oklahoma County, Nicoma Park is a small town with a population of just over 4,000 people. The town was founded in the early 1920s by the Nicoma Park Land Company, which was owned by the Oklahoma City-based oilman, J.B. Stuart. The town was named after the two Native American tribes that inhabited the area, the Nicoma and the Park.
Geography
Nicoma Park is located in the central part of Oklahoma County, just east of Oklahoma City. The town is situated on the banks of the North Canadian River, which provides a natural border between the town and the city of Oklahoma City. The town is bordered by Choctaw to the north, Harrah to the east, and Spencer to the south. The town covers an area of 2.3 square miles, with a population density of 1,743 people per square mile.
The town is located in a region of rolling hills and is characterized by its flat terrain. The town is located in the humid subtropical climate zone, with hot summers and mild winters. The average annual temperature is around 64 degrees Fahrenheit, with an average annual precipitation of around 40 inches.
Economy
The economy of Nicoma Park is largely based on the oil and gas industry. The town is home to several oil and gas companies, including the Nicoma Park Oil Company, which is the largest employer in the town. Other major employers in the town include the Nicoma Park School District, the Nicoma Park Fire Department, and the Nicoma Park Police Department.
The town also has a thriving retail sector, with several small businesses located in the downtown area. The town is also home to several restaurants, bars, and other entertainment venues.
Demographics
As of the 2010 census, the population of Nicoma Park was 4,068. The racial makeup of the town was 79.3% White, 11.2% African American, 0.7% Native American, 0.7% Asian, 0.1% Pacific Islander, and 6.9% from other races. Hispanic or Latino of any race were 8.3% of the population.
The median income for a household in the town was $45,938, and the median income for a family was $51,938. The per capita income for the town was $20,938. About 8.3% of families and 10.2% of the population were below the poverty line, including 14.2% of those under age 18 and 8.3% of those age 65 or over.
Conclusion
Nicoma Park is a small town located in the heart of Oklahoma County. The town is home to a thriving oil and gas industry, as well as a vibrant retail sector. The town has a population of just over 4,000 people, with a median income of $45,938. The town is characterized by its flat terrain and humid subtropical climate, making it an ideal place to live and work.
Common Questions
What is Per Capita Income in Nicoma Park?
Per Capita income in Nicoma Park is $29,747.
What is the Median Family Income in Nicoma Park?
Median Family Income in Nicoma Park is $87,250.
What is the Median Household income in Nicoma Park?
Median Household Income in Nicoma Park is $61,146.
What is Income or Wage Gap in Nicoma Park?
Income or Wage Gap in Nicoma Park is 33.6%.
Women in Nicoma Park earn 66.4 cents for every dollar earned by a man.
What is Inequality or Gini Index in Nicoma Park?
Inequality or Gini Index in Nicoma Park is 0.44.
What is the Total Population of Nicoma Park?
Total Population of Nicoma Park is 2,542.
What is the Total Male Population of Nicoma Park?
Total Male Population of Nicoma Park is 1,310.
What is the Total Female Population of Nicoma Park?
Total Female Population of Nicoma Park is 1,232.
What is the Ratio of Males per 100 Females in Nicoma Park?
There are 106.33 Males per 100 Females in Nicoma Park.
What is the Ratio of Females per 100 Males in Nicoma Park?
There are 94.05 Females per 100 Males in Nicoma Park.
What is the Median Population Age in Nicoma Park?
Median Population Age in Nicoma Park is 35.6 Years.
What is the Average Family Size in Nicoma Park
Average Family Size in Nicoma Park is 3.5 People.
What is the Average Household Size in Nicoma Park
Average Household Size in Nicoma Park is 2.8 People.
How Large is the Labor Force in Nicoma Park?
There are 1,108 People in the Labor Forcein in Nicoma Park.
What is the Percentage of People in the Labor Force in Nicoma Park?
60.3% of People are in the Labor Force in Nicoma Park.
What is the Unemployment Rate in Nicoma Park?
Unemployment Rate in Nicoma Park is 3.4%.