Lake Aluma, OK Map & Demographics
Lake Aluma Map
Lake Aluma Overview
$174,642
PER CAPITA INCOME
$250,001
AVG FAMILY INCOME
$250,001
AVG HOUSEHOLD INCOME
0.43
INEQUALITY / GINI INDEX
53
TOTAL POPULATION
29
MALE POPULATION
24
FEMALE POPULATION
120.83
MALES / 100 FEMALES
82.76
FEMALES / 100 MALES
69.3
MEDIAN AGE
2.1
AVG FAMILY SIZE
2.1
AVG HOUSEHOLD SIZE
29
LABOR FORCE [ PEOPLE ]
56.9%
PERCENT IN LABOR FORCE
6.9%
UNEMPLOYMENT RATE
Lake Aluma Area Codes
Income in Lake Aluma
Income Overview in Lake Aluma
Per Capita Income in Lake Aluma is $174,642, while median incomes of families and households are $250,001 and $250,001 respectively.
| Characteristic | Number | Measure |
| Per Capita Income | 53 | $174,642 |
| Median Family Income | 21 | $250,001 |
| Mean Family Income | 21 | $418,062 |
| Median Household Income | 25 | $250,001 |
| Mean Household Income | 25 | $364,848 |
| Income Deficit | 21 | $0 |
| Wage / Income Gap (%) | 53 | 0.00% |
| Wage / Income Gap ($) | 53 | 100.00¢ per $1 |
| Gini / Inequality Index | 53 | 0.43 |
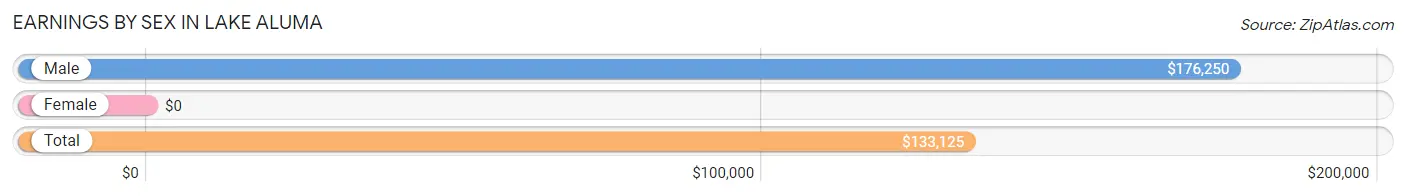
Earnings by Sex in Lake Aluma
| Sex | Number | Average Earnings |
| Male | 20 (57.1%) | $176,250 |
| Female | 15 (42.9%) | $0 |
| Total | 35 (100.0%) | $133,125 |
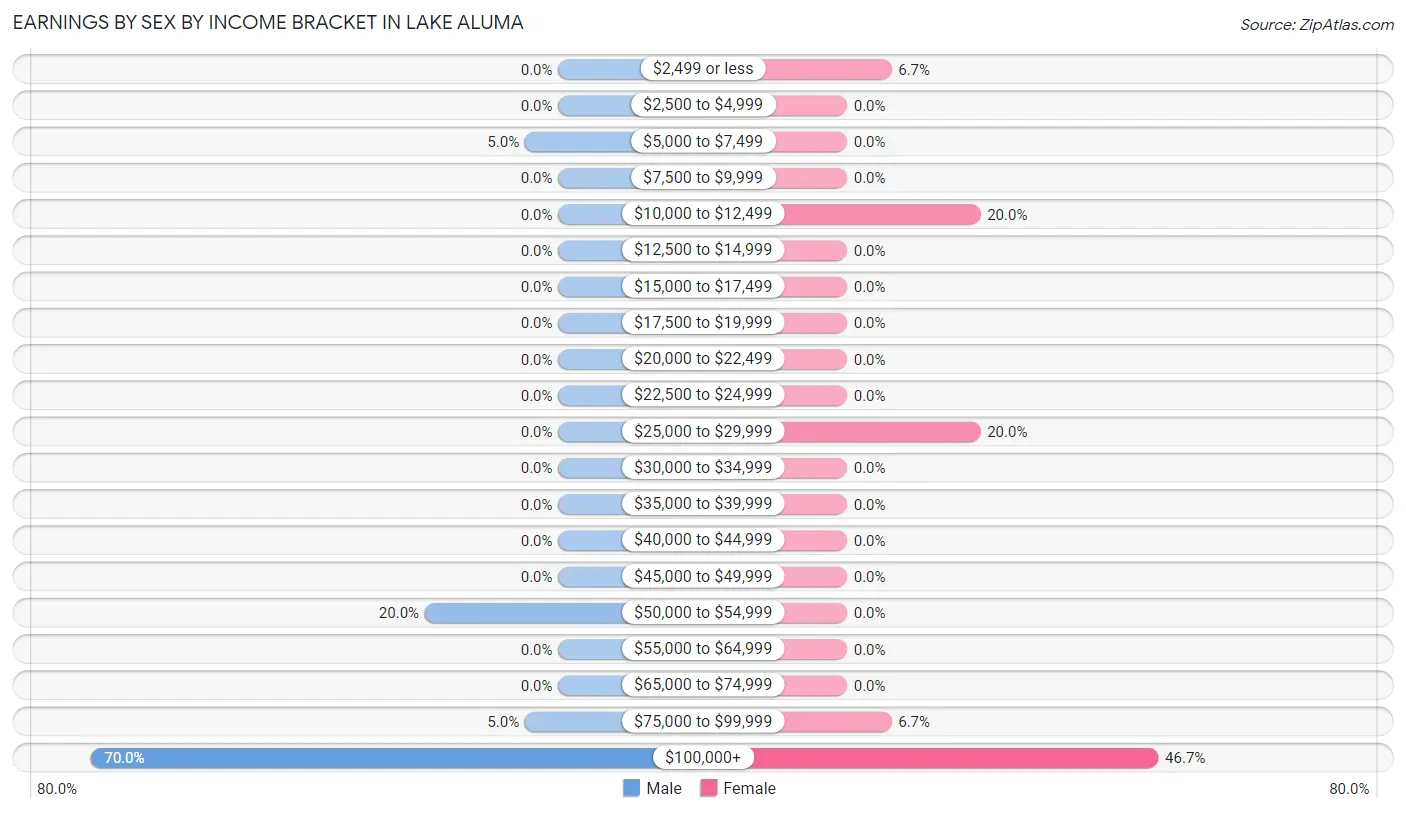
Earnings by Sex by Income Bracket in Lake Aluma
The most common earnings brackets in Lake Aluma are $100,000+ for men (14 | 70.0%) and $100,000+ for women (7 | 46.7%).
| Income | Male | Female |
| $2,499 or less | 0 (0.0%) | 1 (6.7%) |
| $2,500 to $4,999 | 0 (0.0%) | 0 (0.0%) |
| $5,000 to $7,499 | 1 (5.0%) | 0 (0.0%) |
| $7,500 to $9,999 | 0 (0.0%) | 0 (0.0%) |
| $10,000 to $12,499 | 0 (0.0%) | 3 (20.0%) |
| $12,500 to $14,999 | 0 (0.0%) | 0 (0.0%) |
| $15,000 to $17,499 | 0 (0.0%) | 0 (0.0%) |
| $17,500 to $19,999 | 0 (0.0%) | 0 (0.0%) |
| $20,000 to $22,499 | 0 (0.0%) | 0 (0.0%) |
| $22,500 to $24,999 | 0 (0.0%) | 0 (0.0%) |
| $25,000 to $29,999 | 0 (0.0%) | 3 (20.0%) |
| $30,000 to $34,999 | 0 (0.0%) | 0 (0.0%) |
| $35,000 to $39,999 | 0 (0.0%) | 0 (0.0%) |
| $40,000 to $44,999 | 0 (0.0%) | 0 (0.0%) |
| $45,000 to $49,999 | 0 (0.0%) | 0 (0.0%) |
| $50,000 to $54,999 | 4 (20.0%) | 0 (0.0%) |
| $55,000 to $64,999 | 0 (0.0%) | 0 (0.0%) |
| $65,000 to $74,999 | 0 (0.0%) | 0 (0.0%) |
| $75,000 to $99,999 | 1 (5.0%) | 1 (6.7%) |
| $100,000+ | 14 (70.0%) | 7 (46.7%) |
| Total | 20 (100.0%) | 15 (100.0%) |
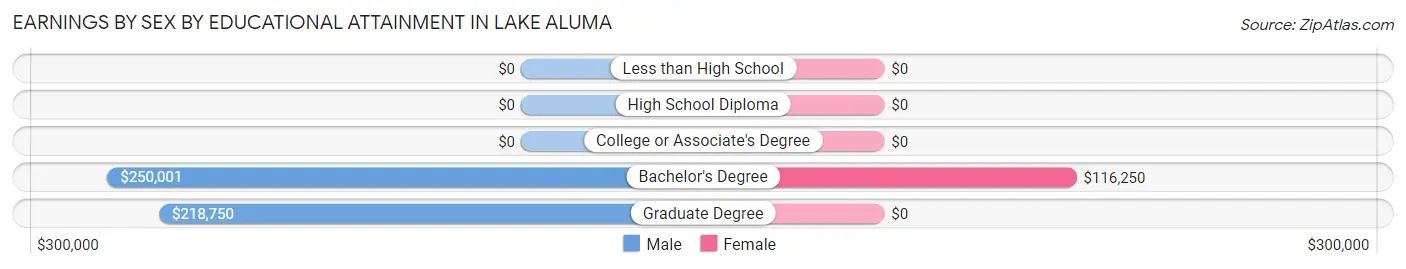
Earnings by Sex by Educational Attainment in Lake Aluma
| Educational Attainment | Male Income | Female Income |
| Less than High School | - | - |
| High School Diploma | - | - |
| College or Associate's Degree | - | - |
| Bachelor's Degree | $250,001 | $116,250 |
| Graduate Degree | $218,750 | $0 |
| Total | $176,250 | $0 |
Family Income in Lake Aluma
Family Income Brackets in Lake Aluma
According to the Lake Aluma family income data, there are 15 families falling into the $200,000+ income range, which is the most common income bracket and makes up 71.4% of all families.
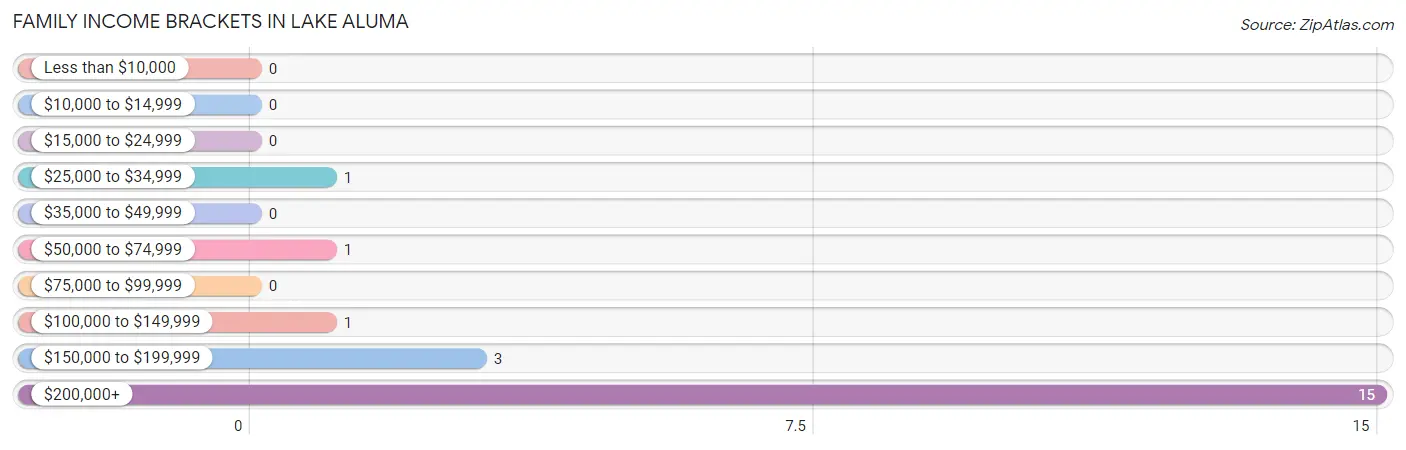
| Income Bracket | # Families | % Families |
| Less than $10,000 | 0 | 0.0% |
| $10,000 to $14,999 | 0 | 0.0% |
| $15,000 to $24,999 | 0 | 0.0% |
| $25,000 to $34,999 | 1 | 4.8% |
| $35,000 to $49,999 | 0 | 0.0% |
| $50,000 to $74,999 | 1 | 4.8% |
| $75,000 to $99,999 | 0 | 0.0% |
| $100,000 to $149,999 | 1 | 4.8% |
| $150,000 to $199,999 | 3 | 14.3% |
| $200,000+ | 15 | 71.4% |
Family Income by Famaliy Size in Lake Aluma
2-person families (20 | 95.2%) account for the highest median family income in Lake Aluma with $250,001 per family, while 2-person families (20 | 95.2%) have the highest median income of $125,000 per family member.
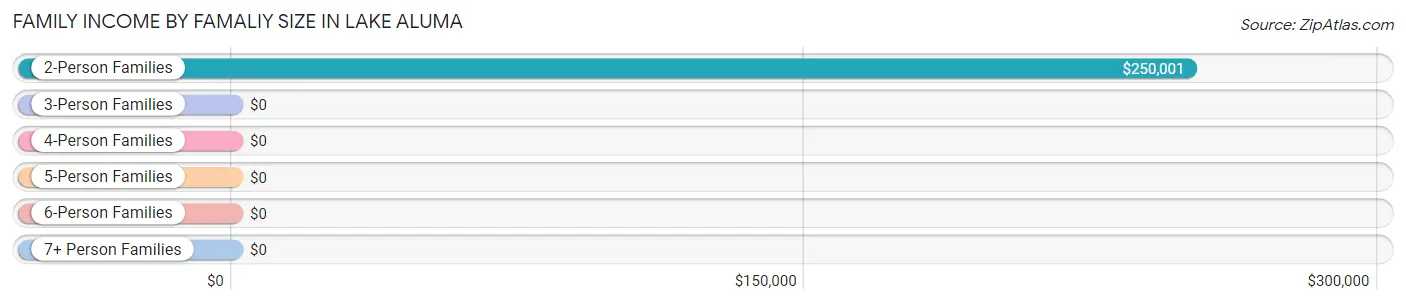
| Income Bracket | # Families | Median Income |
| 2-Person Families | 20 (95.2%) | $250,001 |
| 3-Person Families | 1 (4.8%) | $0 |
| 4-Person Families | 0 (0.0%) | $0 |
| 5-Person Families | 0 (0.0%) | $0 |
| 6-Person Families | 0 (0.0%) | $0 |
| 7+ Person Families | 0 (0.0%) | $0 |
| Total | 21 (100.0%) | $250,001 |
Family Income by Number of Earners in Lake Aluma
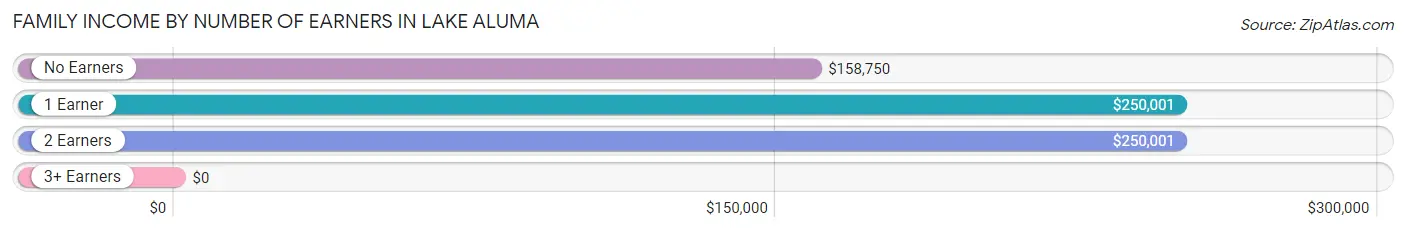
| Number of Earners | # Families | Median Income |
| No Earners | 6 (28.6%) | $158,750 |
| 1 Earner | 3 (14.3%) | $250,001 |
| 2 Earners | 12 (57.1%) | $250,001 |
| 3+ Earners | 0 (0.0%) | $0 |
| Total | 21 (100.0%) | $250,001 |
Household Income in Lake Aluma
Household Income Brackets in Lake Aluma
With 15 households falling in the category, the $200,000+ income range is the most frequent in Lake Aluma, accounting for 60.0% of all households.
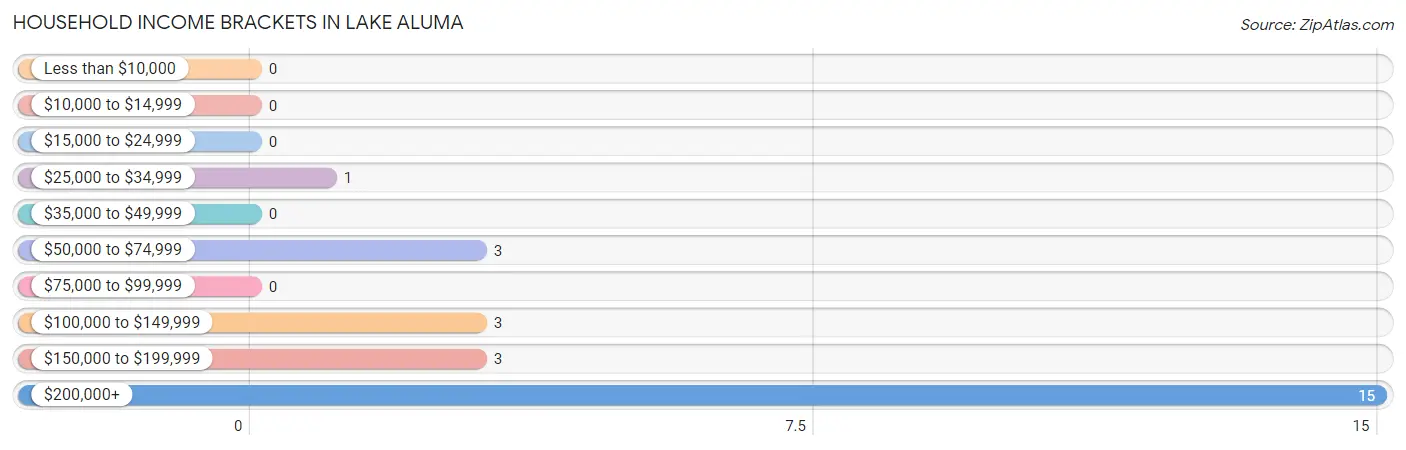
| Income Bracket | # Households | % Households |
| Less than $10,000 | 0 | 0.0% |
| $10,000 to $14,999 | 0 | 0.0% |
| $15,000 to $24,999 | 0 | 0.0% |
| $25,000 to $34,999 | 1 | 4.0% |
| $35,000 to $49,999 | 0 | 0.0% |
| $50,000 to $74,999 | 3 | 12.0% |
| $75,000 to $99,999 | 0 | 0.0% |
| $100,000 to $149,999 | 3 | 12.0% |
| $150,000 to $199,999 | 3 | 12.0% |
| $200,000+ | 15 | 60.0% |
Household Income by Householder Age in Lake Aluma
The median household income in Lake Aluma is $250,001, with the highest median household income of $250,001 found in the 45 to 64 years age bracket for the primary householder. A total of 5 households (20.0%) fall into this category.
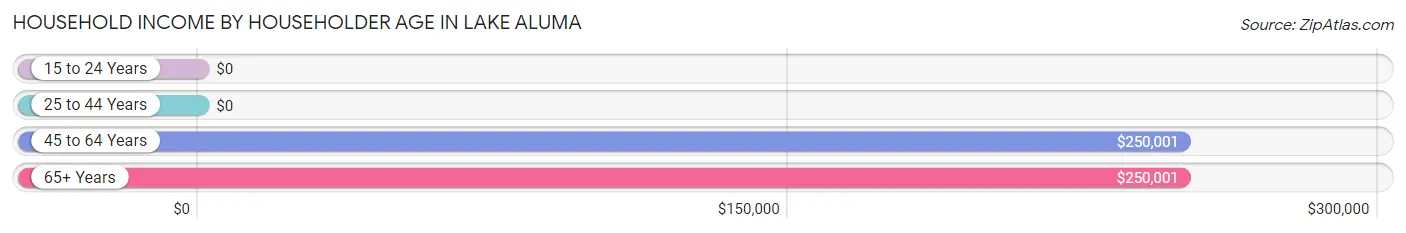
| Income Bracket | # Households | Median Income |
| 15 to 24 Years | 0 (0.0%) | $0 |
| 25 to 44 Years | 2 (8.0%) | $0 |
| 45 to 64 Years | 5 (20.0%) | $250,001 |
| 65+ Years | 18 (72.0%) | $250,001 |
| Total | 25 (100.0%) | $250,001 |
Poverty in Lake Aluma
Income Below Poverty by Sex and Age in Lake Aluma
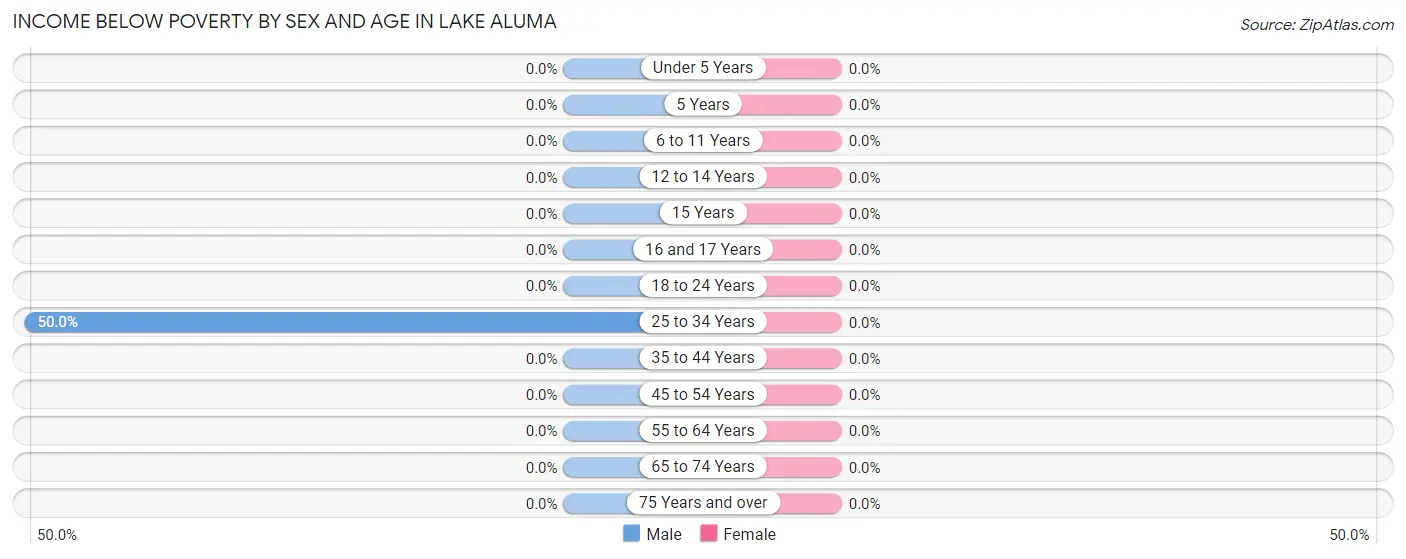
| Age Bracket | Male | Female |
| Under 5 Years | 0 (0.0%) | 0 (0.0%) |
| 5 Years | 0 (0.0%) | 0 (0.0%) |
| 6 to 11 Years | 0 (0.0%) | 0 (0.0%) |
| 12 to 14 Years | 0 (0.0%) | 0 (0.0%) |
| 15 Years | 0 (0.0%) | 0 (0.0%) |
| 16 and 17 Years | 0 (0.0%) | 0 (0.0%) |
| 18 to 24 Years | 0 (0.0%) | 0 (0.0%) |
| 25 to 34 Years | 2 (50.0%) | 0 (0.0%) |
| 35 to 44 Years | 0 (0.0%) | 0 (0.0%) |
| 45 to 54 Years | 0 (0.0%) | 0 (0.0%) |
| 55 to 64 Years | 0 (0.0%) | 0 (0.0%) |
| 65 to 74 Years | 0 (0.0%) | 0 (0.0%) |
| 75 Years and over | 0 (0.0%) | 0 (0.0%) |
| Total | 2 (6.9%) | 0 (0.0%) |
Income Above Poverty by Sex and Age in Lake Aluma
According to the poverty statistics in Lake Aluma, males aged 12 to 14 years and females aged 25 to 34 years are the age groups that are most secure financially, with 100.0% of males and 100.0% of females in these age groups living above the poverty line.
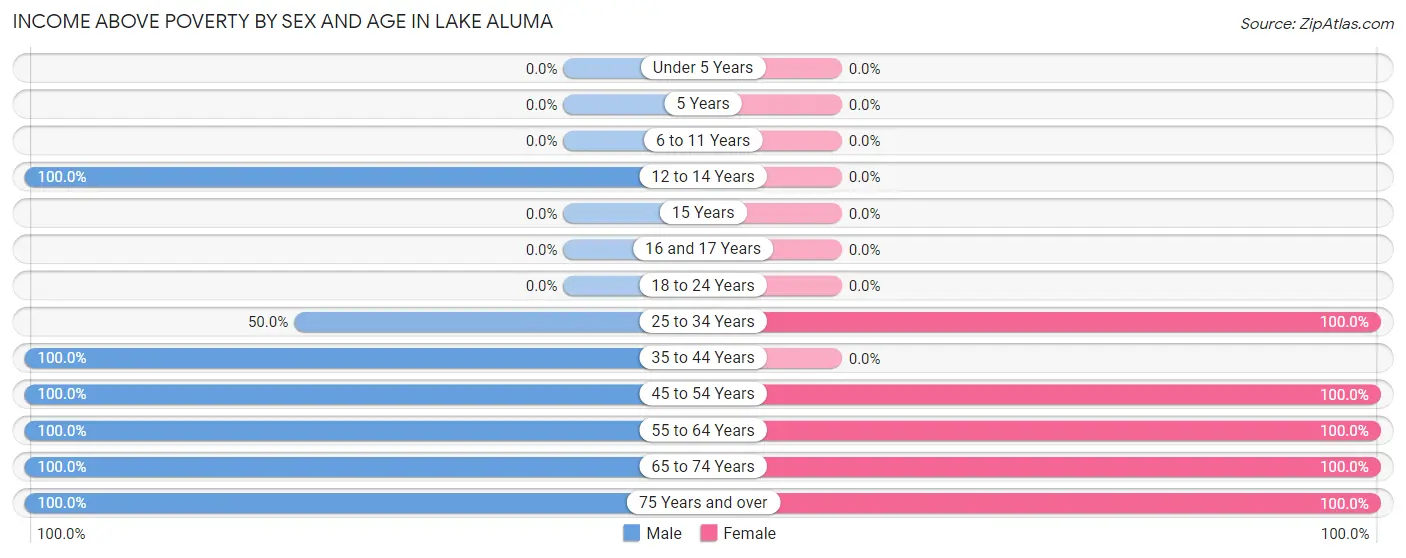
| Age Bracket | Male | Female |
| Under 5 Years | 0 (0.0%) | 0 (0.0%) |
| 5 Years | 0 (0.0%) | 0 (0.0%) |
| 6 to 11 Years | 0 (0.0%) | 0 (0.0%) |
| 12 to 14 Years | 2 (100.0%) | 0 (0.0%) |
| 15 Years | 0 (0.0%) | 0 (0.0%) |
| 16 and 17 Years | 0 (0.0%) | 0 (0.0%) |
| 18 to 24 Years | 0 (0.0%) | 0 (0.0%) |
| 25 to 34 Years | 2 (50.0%) | 1 (100.0%) |
| 35 to 44 Years | 1 (100.0%) | 0 (0.0%) |
| 45 to 54 Years | 2 (100.0%) | 2 (100.0%) |
| 55 to 64 Years | 3 (100.0%) | 4 (100.0%) |
| 65 to 74 Years | 10 (100.0%) | 12 (100.0%) |
| 75 Years and over | 7 (100.0%) | 5 (100.0%) |
| Total | 27 (93.1%) | 24 (100.0%) |
Income Below Poverty Among Married-Couple Families in Lake Aluma
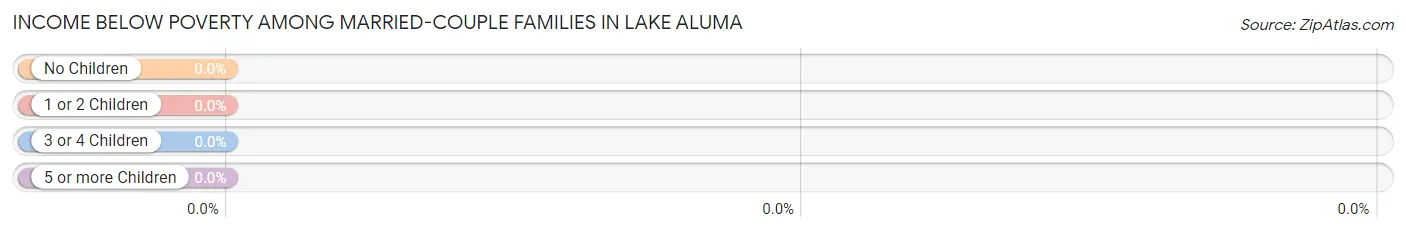
| Children | Above Poverty | Below Poverty |
| No Children | 20 (100.0%) | 0 (0.0%) |
| 1 or 2 Children | 1 (100.0%) | 0 (0.0%) |
| 3 or 4 Children | 0 (0.0%) | 0 (0.0%) |
| 5 or more Children | 0 (0.0%) | 0 (0.0%) |
| Total | 21 (100.0%) | 0 (0.0%) |
Income Below Poverty Among Single-Parent Households in Lake Aluma
| Children | Single Father | Single Mother |
| No Children | 0 (0.0%) | 0 (0.0%) |
| 1 or 2 Children | 0 (0.0%) | 0 (0.0%) |
| 3 or 4 Children | 0 (0.0%) | 0 (0.0%) |
| 5 or more Children | 0 (0.0%) | 0 (0.0%) |
| Total | 0 (0.0%) | 0 (0.0%) |
Income Below Poverty Among Married-Couple vs Single-Parent Households in Lake Aluma
| Children | Married-Couple Families | Single-Parent Households |
| No Children | 0 (0.0%) | 0 (0.0%) |
| 1 or 2 Children | 0 (0.0%) | 0 (0.0%) |
| 3 or 4 Children | 0 (0.0%) | 0 (0.0%) |
| 5 or more Children | 0 (0.0%) | 0 (0.0%) |
| Total | 0 (0.0%) | 0 (0.0%) |
Race in Lake Aluma
The most populous races in Lake Aluma are White / Caucasian (50 | 94.3%), Two or more Races (2 | 3.8%), and Native / Alaskan (1 | 1.9%).
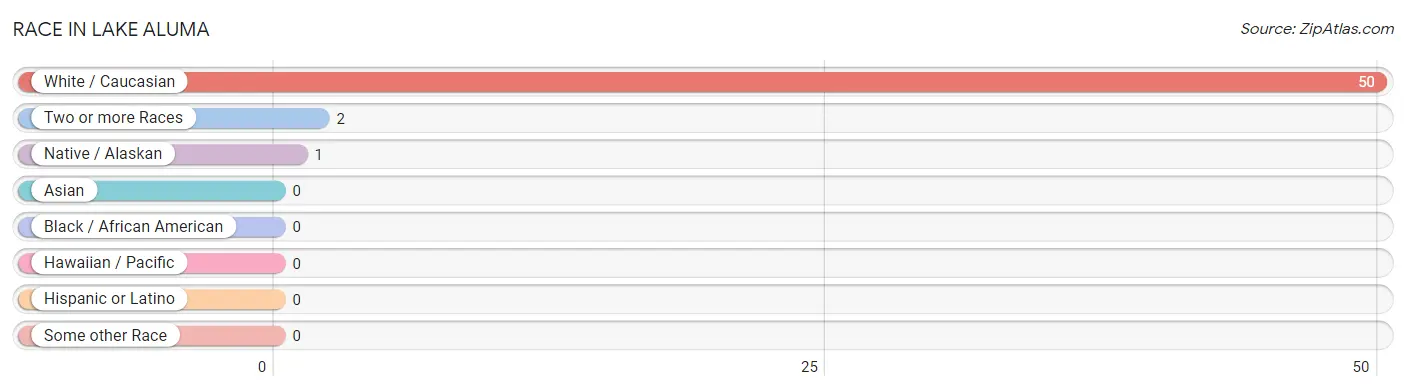
| Race | # Population | % Population |
| Asian | 0 | 0.0% |
| Black / African American | 0 | 0.0% |
| Hawaiian / Pacific | 0 | 0.0% |
| Hispanic or Latino | 0 | 0.0% |
| Native / Alaskan | 1 | 1.9% |
| White / Caucasian | 50 | 94.3% |
| Two or more Races | 2 | 3.8% |
| Some other Race | 0 | 0.0% |
| Total | 53 | 100.0% |
Ancestry in Lake Aluma
The most populous ancestries reported in Lake Aluma are English (13 | 24.5%), German (11 | 20.7%), Irish (10 | 18.9%), American (7 | 13.2%), and French (4 | 7.5%), together accounting for 84.9% of all Lake Aluma residents.
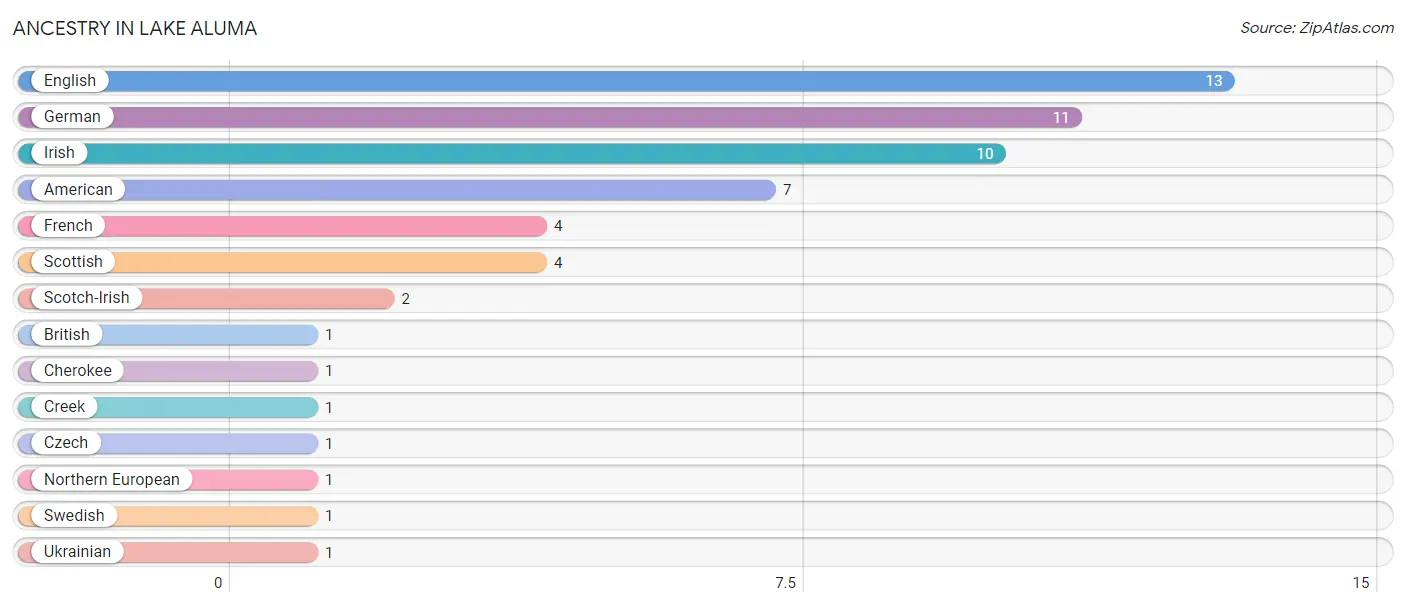
| Ancestry | # Population | % Population |
| American | 7 | 13.2% |
| British | 1 | 1.9% |
| Cherokee | 1 | 1.9% |
| Creek | 1 | 1.9% |
| Czech | 1 | 1.9% |
| English | 13 | 24.5% |
| French | 4 | 7.5% |
| German | 11 | 20.7% |
| Irish | 10 | 18.9% |
| Northern European | 1 | 1.9% |
| Scotch-Irish | 2 | 3.8% |
| Scottish | 4 | 7.5% |
| Swedish | 1 | 1.9% |
| Ukrainian | 1 | 1.9% | View All 14 Rows |
Immigrants in Lake Aluma
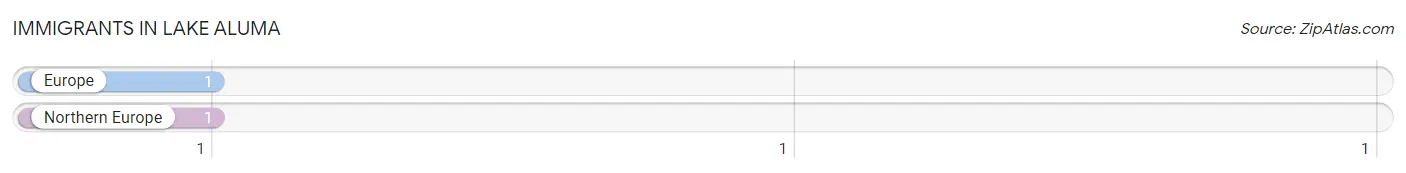
The most numerous immigrant groups reported in Lake Aluma came from Europe (1 | 1.9%), and Northern Europe (1 | 1.9%), together accounting for 3.8% of all Lake Aluma residents.
| Immigration Origin | # Population | % Population |
| Europe | 1 | 1.9% |
| Northern Europe | 1 | 1.9% | View All 2 Rows |
Sex and Age in Lake Aluma
Sex and Age in Lake Aluma
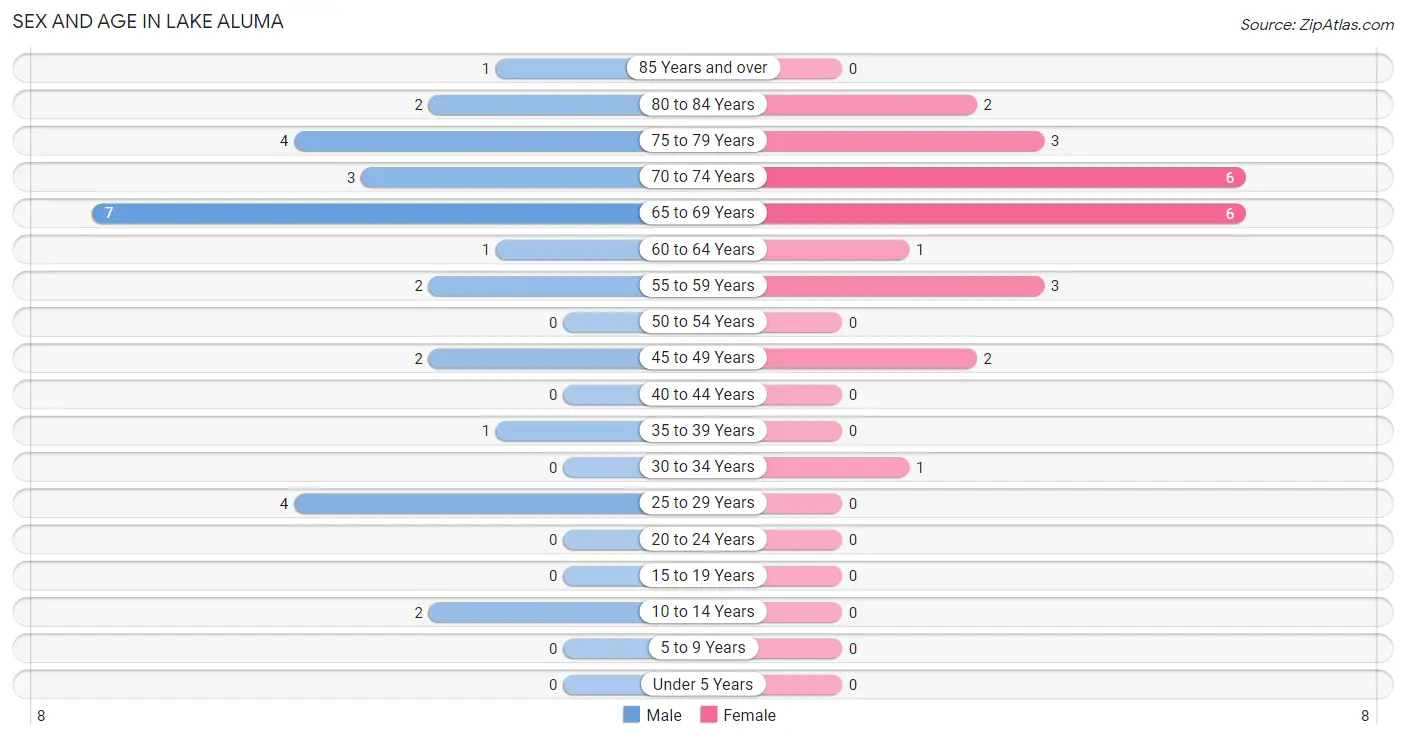
The most populous age groups in Lake Aluma are 65 to 69 Years (7 | 24.1%) for men and 65 to 69 Years (6 | 25.0%) for women.
| Age Bracket | Male | Female |
| Under 5 Years | 0 (0.0%) | 0 (0.0%) |
| 5 to 9 Years | 0 (0.0%) | 0 (0.0%) |
| 10 to 14 Years | 2 (6.9%) | 0 (0.0%) |
| 15 to 19 Years | 0 (0.0%) | 0 (0.0%) |
| 20 to 24 Years | 0 (0.0%) | 0 (0.0%) |
| 25 to 29 Years | 4 (13.8%) | 0 (0.0%) |
| 30 to 34 Years | 0 (0.0%) | 1 (4.2%) |
| 35 to 39 Years | 1 (3.5%) | 0 (0.0%) |
| 40 to 44 Years | 0 (0.0%) | 0 (0.0%) |
| 45 to 49 Years | 2 (6.9%) | 2 (8.3%) |
| 50 to 54 Years | 0 (0.0%) | 0 (0.0%) |
| 55 to 59 Years | 2 (6.9%) | 3 (12.5%) |
| 60 to 64 Years | 1 (3.5%) | 1 (4.2%) |
| 65 to 69 Years | 7 (24.1%) | 6 (25.0%) |
| 70 to 74 Years | 3 (10.3%) | 6 (25.0%) |
| 75 to 79 Years | 4 (13.8%) | 3 (12.5%) |
| 80 to 84 Years | 2 (6.9%) | 2 (8.3%) |
| 85 Years and over | 1 (3.5%) | 0 (0.0%) |
| Total | 29 (100.0%) | 24 (100.0%) |
Families and Households in Lake Aluma
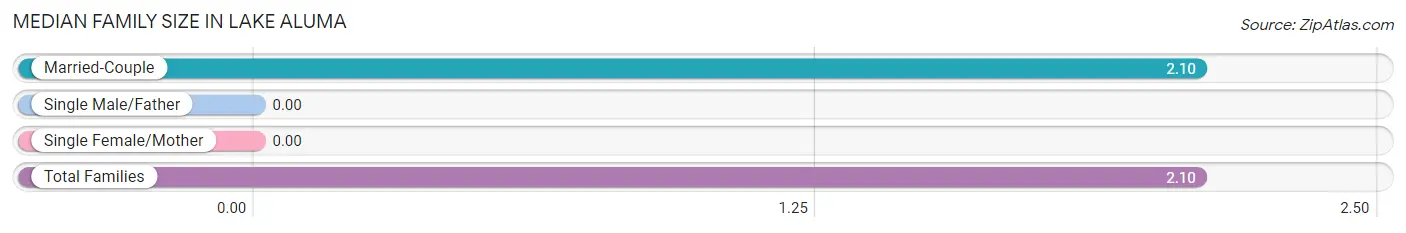
Median Family Size in Lake Aluma
| Family Type | # Families | Family Size |
| Married-Couple | 21 (100.0%) | 2.10 |
| Single Male/Father | 0 (0.0%) | - |
| Single Female/Mother | 0 (0.0%) | - |
| Total Families | 21 (100.0%) | 2.10 |
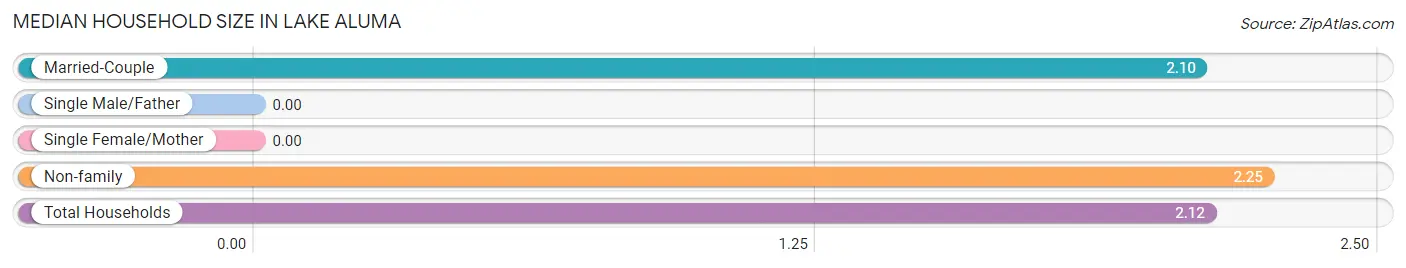
Median Household Size in Lake Aluma
| Household Type | # Households | Household Size |
| Married-Couple | 21 (84.0%) | 2.10 |
| Single Male/Father | 0 (0.0%) | - |
| Single Female/Mother | 0 (0.0%) | - |
| Non-family | 4 (16.0%) | 2.25 |
| Total Households | 25 (100.0%) | 2.12 |
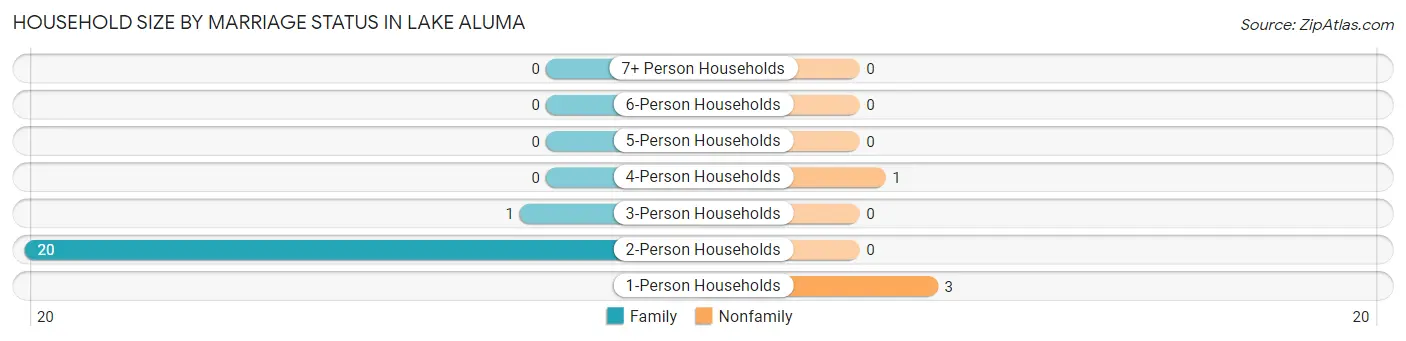
Household Size by Marriage Status in Lake Aluma
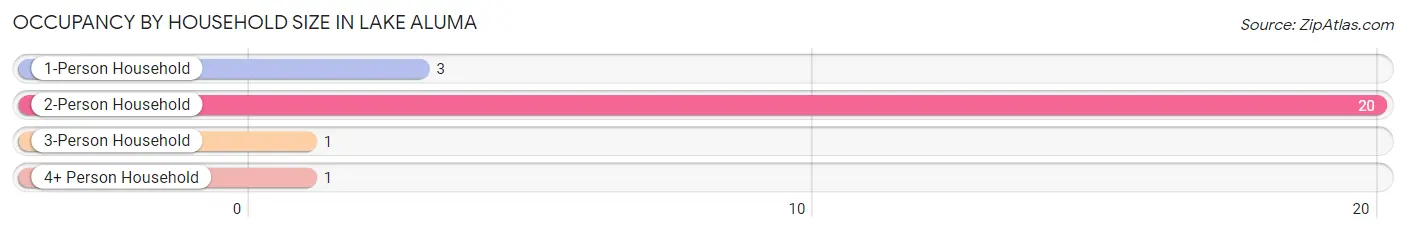
Out of a total of 25 households in Lake Aluma, 21 (84.0%) are family households, while 4 (16.0%) are nonfamily households. The most numerous type of family households are 2-person households, comprising 20, and the most common type of nonfamily households are 1-person households, comprising 3.
| Household Size | Family Households | Nonfamily Households |
| 1-Person Households | - | 3 (12.0%) |
| 2-Person Households | 20 (80.0%) | 0 (0.0%) |
| 3-Person Households | 1 (4.0%) | 0 (0.0%) |
| 4-Person Households | 0 (0.0%) | 1 (4.0%) |
| 5-Person Households | 0 (0.0%) | 0 (0.0%) |
| 6-Person Households | 0 (0.0%) | 0 (0.0%) |
| 7+ Person Households | 0 (0.0%) | 0 (0.0%) |
| Total | 21 (84.0%) | 4 (16.0%) |
Female Fertility in Lake Aluma
Fertility by Age in Lake Aluma
| Age Bracket | Women with Births | Births / 1,000 Women |
| 15 to 19 years | 0 (0.0%) | 0.0 |
| 20 to 34 years | 0 (0.0%) | 0.0 |
| 35 to 50 years | 0 (0.0%) | 0.0 |
| Total | 0 (0.0%) | 0.0 |
Fertility by Age by Marriage Status in Lake Aluma
| Age Bracket | Married | Unmarried |
| 15 to 19 years | 0 (0.0%) | 0 (0.0%) |
| 20 to 34 years | 0 (0.0%) | 0 (0.0%) |
| 35 to 50 years | 0 (0.0%) | 0 (0.0%) |
| Total | 0 (0.0%) | 0 (0.0%) |
Fertility by Education in Lake Aluma
| Educational Attainment | Women with Births | Births / 1,000 Women |
| Less than High School | 0 (0.0%) | 0.0 |
| High School Diploma | 0 (0.0%) | 0.0 |
| College or Associate's Degree | 0 (0.0%) | 0.0 |
| Bachelor's Degree | 0 (0.0%) | 0.0 |
| Graduate Degree | 0 (0.0%) | 0.0 |
| Total | 0 (0.0%) | 0.0 |
Fertility by Education by Marriage Status in Lake Aluma
| Educational Attainment | Married | Unmarried |
| Less than High School | 0 (0.0%) | 0 (0.0%) |
| High School Diploma | 0 (0.0%) | 0 (0.0%) |
| College or Associate's Degree | 0 (0.0%) | 0 (0.0%) |
| Bachelor's Degree | 0 (0.0%) | 0 (0.0%) |
| Graduate Degree | 0 (0.0%) | 0 (0.0%) |
| Total | 0 (0.0%) | 0 (0.0%) |
Employment Characteristics in Lake Aluma
Employment by Class of Employer in Lake Aluma
Among the 26 employed individuals in Lake Aluma, private company employees (19 | 73.1%), self-employed (incorporated) (4 | 15.4%), and state government employees (2 | 7.7%) make up the most common classes of employment.
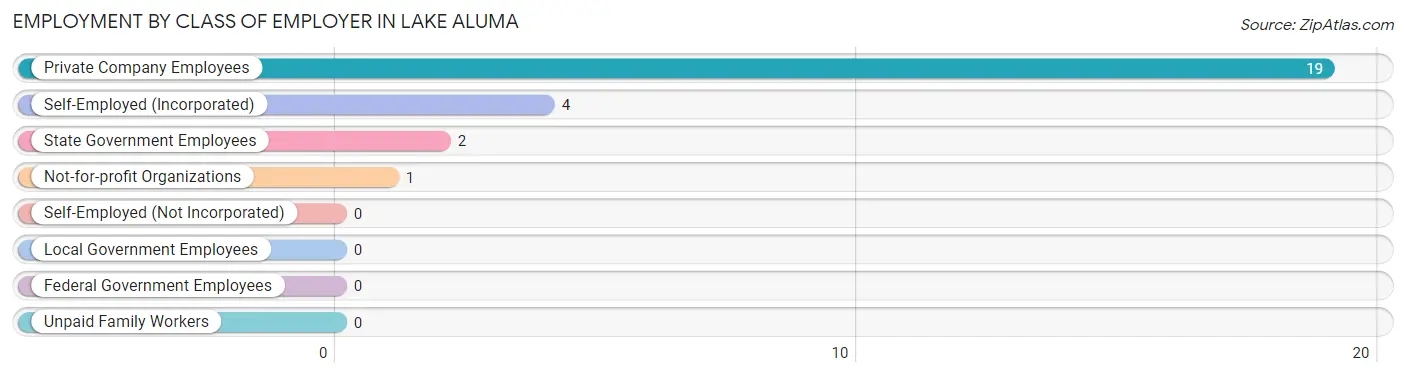
| Employer Class | # Employees | % Employees |
| Private Company Employees | 19 | 73.1% |
| Self-Employed (Incorporated) | 4 | 15.4% |
| Self-Employed (Not Incorporated) | 0 | 0.0% |
| Not-for-profit Organizations | 1 | 3.8% |
| Local Government Employees | 0 | 0.0% |
| State Government Employees | 2 | 7.7% |
| Federal Government Employees | 0 | 0.0% |
| Unpaid Family Workers | 0 | 0.0% |
| Total | 26 | 100.0% |
Employment Status by Age in Lake Aluma
According to the labor force statistics for Lake Aluma, out of the total population over 16 years of age (51), 56.9% or 29 individuals are in the labor force, with 6.9% or 2 of them unemployed. The age group with the highest labor force participation rate is 25 to 29 years, with 100.0% or 4 individuals in the labor force. Within the labor force, the 25 to 29 years age range has the highest percentage of unemployed individuals, with 50.0% or 2 of them being unemployed.
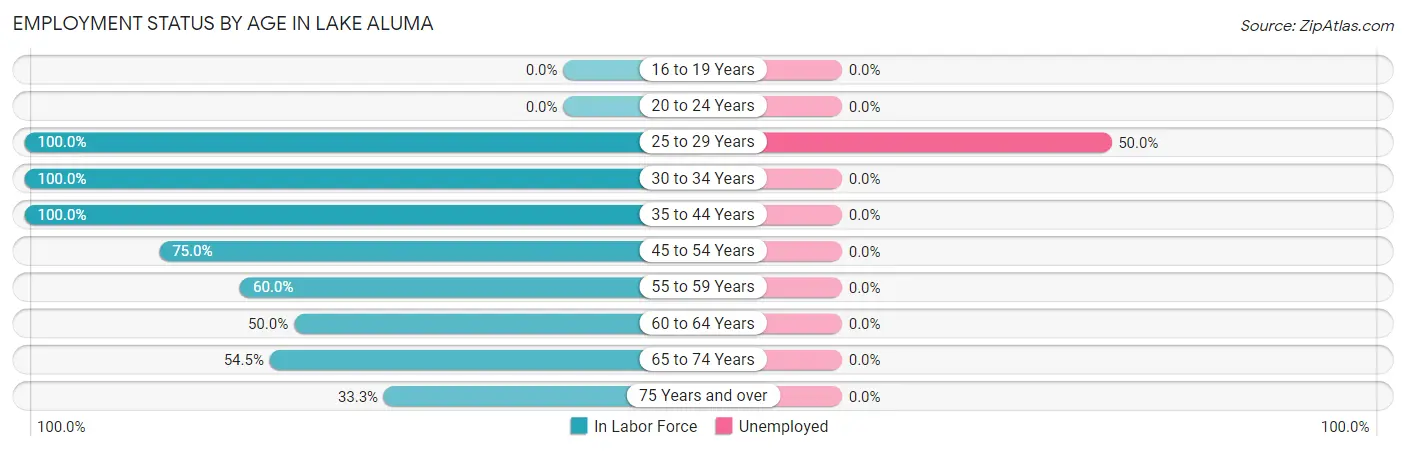
| Age Bracket | In Labor Force | Unemployed |
| 16 to 19 Years | 0 (0.0%) | 0 (0.0%) |
| 20 to 24 Years | 0 (0.0%) | 0 (0.0%) |
| 25 to 29 Years | 4 (100.0%) | 2 (50.0%) |
| 30 to 34 Years | 1 (100.0%) | 0 (0.0%) |
| 35 to 44 Years | 1 (100.0%) | 0 (0.0%) |
| 45 to 54 Years | 3 (75.0%) | 0 (0.0%) |
| 55 to 59 Years | 3 (60.0%) | 0 (0.0%) |
| 60 to 64 Years | 1 (50.0%) | 0 (0.0%) |
| 65 to 74 Years | 12 (54.5%) | 0 (0.0%) |
| 75 Years and over | 4 (33.3%) | 0 (0.0%) |
| Total | 29 (56.9%) | 2 (6.9%) |
Employment Status by Educational Attainment in Lake Aluma
According to labor force statistics for Lake Aluma, 76.5% of individuals (13) out of the total population between 25 and 64 years of age (17) are in the labor force, with 15.4% or 2 of them being unemployed. The group with the highest labor force participation rate are those with the educational attainment of less than high school, with 100.0% or 3 individuals in the labor force. Within the labor force, individuals with high school diploma education have the highest percentage of unemployment, with 100.0% or 1 of them being unemployed.
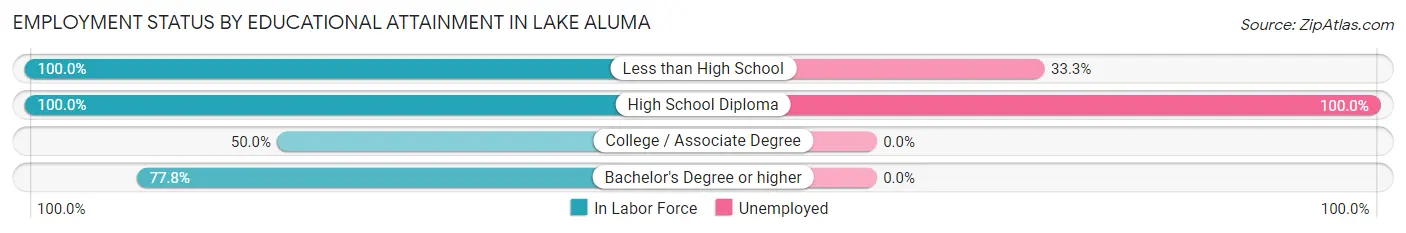
| Educational Attainment | In Labor Force | Unemployed |
| Less than High School | 3 (100.0%) | 1 (33.3%) |
| High School Diploma | 1 (100.0%) | 1 (100.0%) |
| College / Associate Degree | 2 (50.0%) | 0 (0.0%) |
| Bachelor's Degree or higher | 7 (77.8%) | 0 (0.0%) |
| Total | 13 (76.5%) | 3 (15.4%) |
Employment Occupations by Sex in Lake Aluma
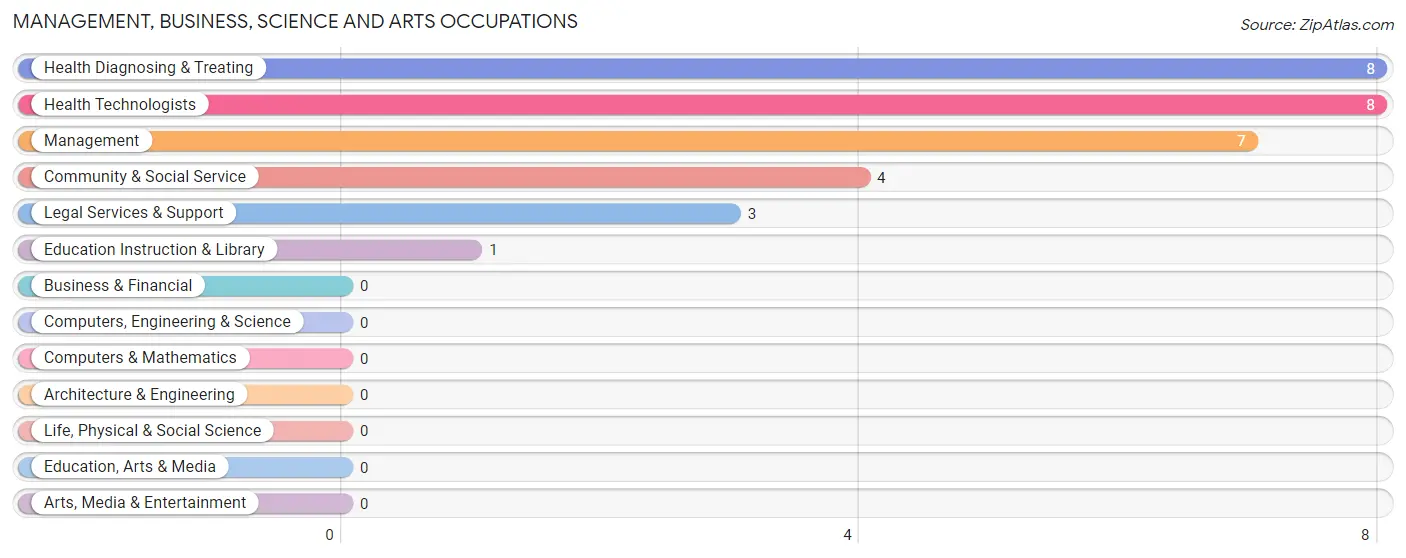
Management, Business, Science and Arts Occupations
The most common Management, Business, Science and Arts occupations in Lake Aluma are Health Diagnosing & Treating (8 | 29.6%), Health Technologists (8 | 29.6%), Management (7 | 25.9%), Community & Social Service (4 | 14.8%), and Legal Services & Support (3 | 11.1%).
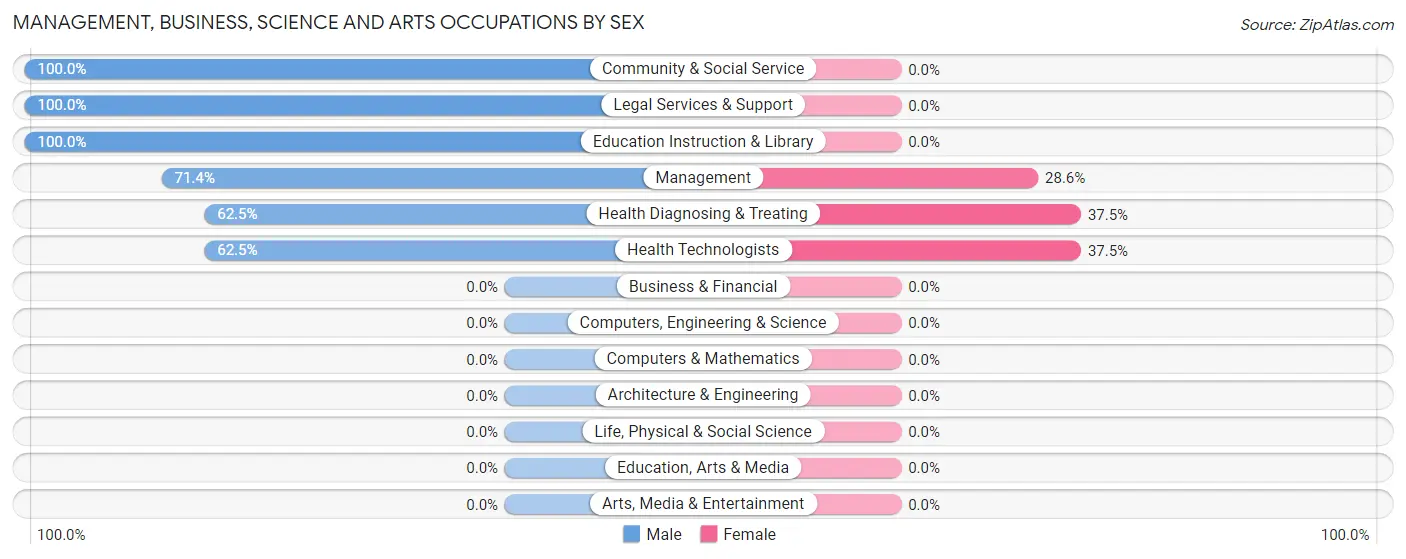
Management, Business, Science and Arts Occupations by Sex
Within the Management, Business, Science and Arts occupations in Lake Aluma, the most male-oriented occupations are Community & Social Service (100.0%), Legal Services & Support (100.0%), and Education Instruction & Library (100.0%), while the most female-oriented occupations are Health Diagnosing & Treating (37.5%), Health Technologists (37.5%), and Management (28.6%).
| Occupation | Male | Female |
| Management | 5 (71.4%) | 2 (28.6%) |
| Business & Financial | 0 (0.0%) | 0 (0.0%) |
| Computers, Engineering & Science | 0 (0.0%) | 0 (0.0%) |
| Computers & Mathematics | 0 (0.0%) | 0 (0.0%) |
| Architecture & Engineering | 0 (0.0%) | 0 (0.0%) |
| Life, Physical & Social Science | 0 (0.0%) | 0 (0.0%) |
| Community & Social Service | 4 (100.0%) | 0 (0.0%) |
| Education, Arts & Media | 0 (0.0%) | 0 (0.0%) |
| Legal Services & Support | 3 (100.0%) | 0 (0.0%) |
| Education Instruction & Library | 1 (100.0%) | 0 (0.0%) |
| Arts, Media & Entertainment | 0 (0.0%) | 0 (0.0%) |
| Health Diagnosing & Treating | 5 (62.5%) | 3 (37.5%) |
| Health Technologists | 5 (62.5%) | 3 (37.5%) |
| Total (Category) | 14 (73.7%) | 5 (26.3%) |
| Total (Overall) | 18 (66.7%) | 9 (33.3%) |
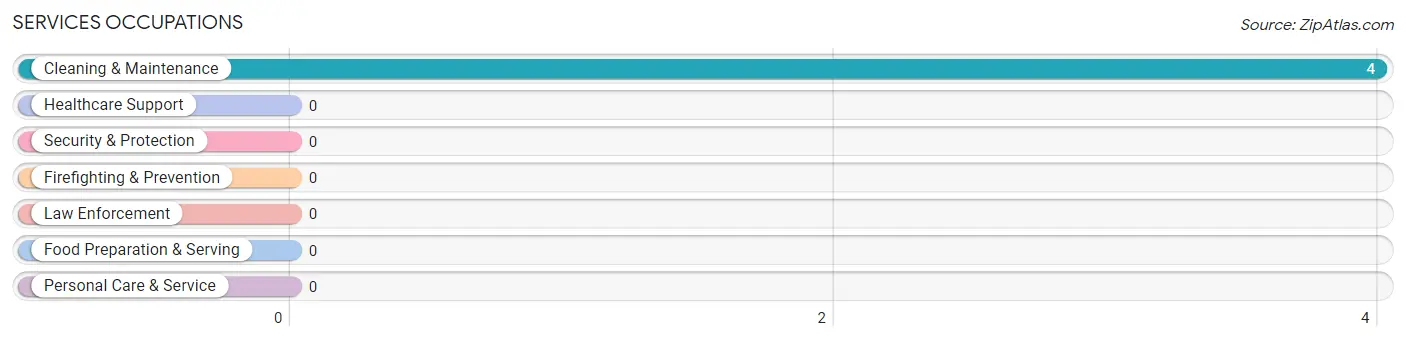
Services Occupations
The most common Services occupations in Lake Aluma are , and Cleaning & Maintenance (4 | 14.8%).
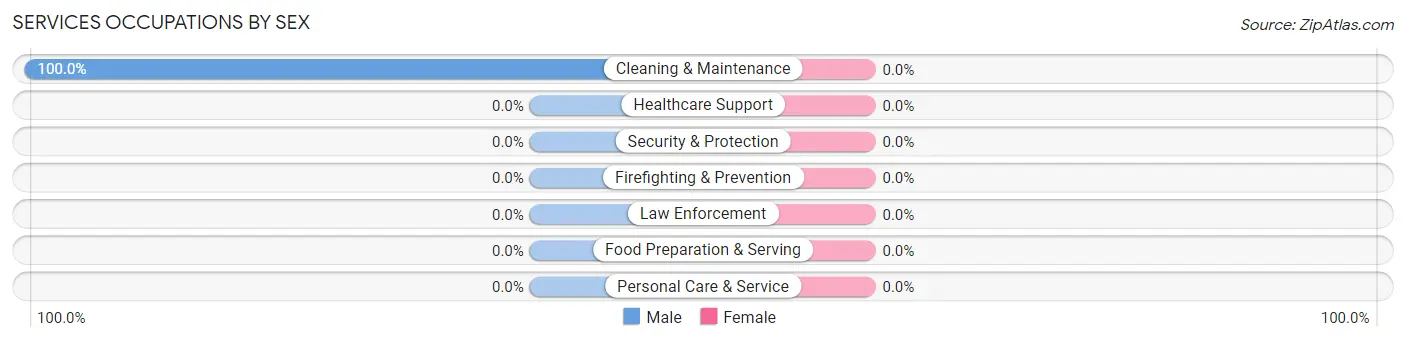
Services Occupations by Sex
| Occupation | Male | Female |
| Healthcare Support | 0 (0.0%) | 0 (0.0%) |
| Security & Protection | 0 (0.0%) | 0 (0.0%) |
| Firefighting & Prevention | 0 (0.0%) | 0 (0.0%) |
| Law Enforcement | 0 (0.0%) | 0 (0.0%) |
| Food Preparation & Serving | 0 (0.0%) | 0 (0.0%) |
| Cleaning & Maintenance | 4 (100.0%) | 0 (0.0%) |
| Personal Care & Service | 0 (0.0%) | 0 (0.0%) |
| Total (Category) | 4 (100.0%) | 0 (0.0%) |
| Total (Overall) | 18 (66.7%) | 9 (33.3%) |
Sales and Office Occupations
The most common Sales and Office occupations in Lake Aluma are , and Sales & Related (2 | 7.4%).
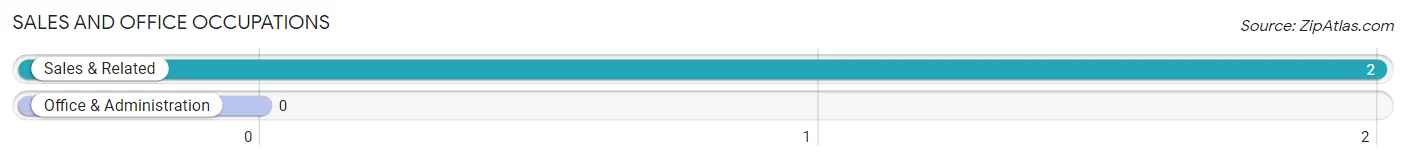
Sales and Office Occupations by Sex
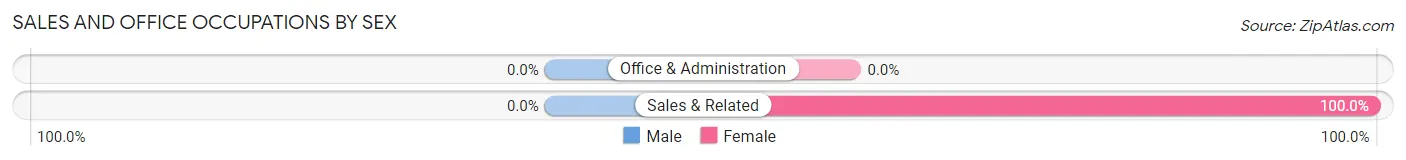
| Occupation | Male | Female |
| Sales & Related | 0 (0.0%) | 2 (100.0%) |
| Office & Administration | 0 (0.0%) | 0 (0.0%) |
| Total (Category) | 0 (0.0%) | 2 (100.0%) |
| Total (Overall) | 18 (66.7%) | 9 (33.3%) |
Natural Resources, Construction and Maintenance Occupations
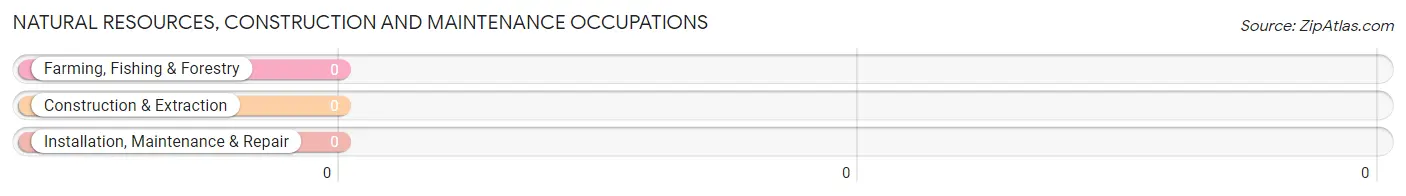
Natural Resources, Construction and Maintenance Occupations by Sex
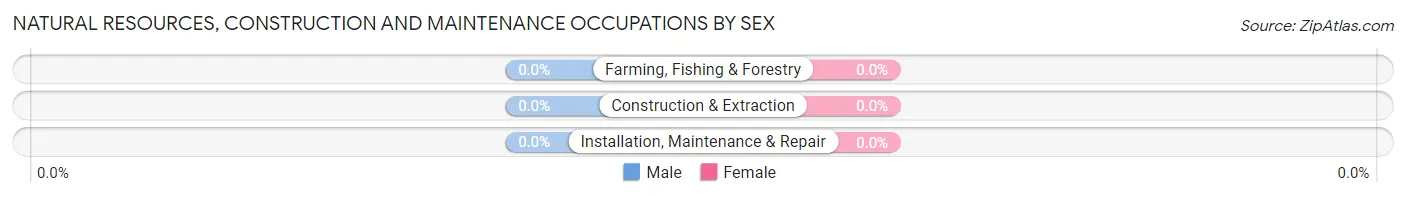
| Occupation | Male | Female |
| Farming, Fishing & Forestry | 0 (0.0%) | 0 (0.0%) |
| Construction & Extraction | 0 (0.0%) | 0 (0.0%) |
| Installation, Maintenance & Repair | 0 (0.0%) | 0 (0.0%) |
| Total (Category) | 0 (0.0%) | 0 (0.0%) |
| Total (Overall) | 18 (66.7%) | 9 (33.3%) |
Production, Transportation and Moving Occupations
The most common Production, Transportation and Moving occupations in Lake Aluma are , and Transportation (2 | 7.4%).
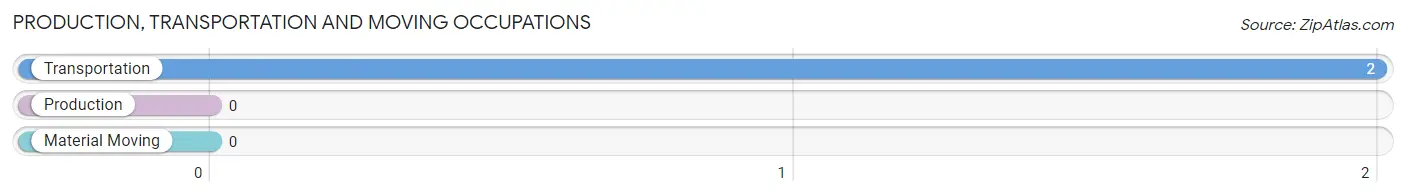
Production, Transportation and Moving Occupations by Sex
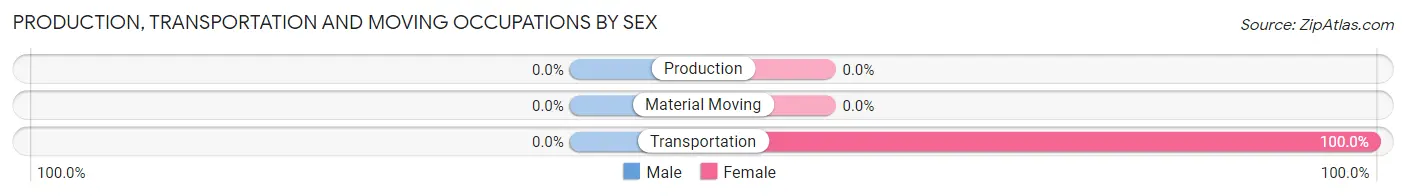
| Occupation | Male | Female |
| Production | 0 (0.0%) | 0 (0.0%) |
| Transportation | 0 (0.0%) | 2 (100.0%) |
| Material Moving | 0 (0.0%) | 0 (0.0%) |
| Total (Category) | 0 (0.0%) | 2 (100.0%) |
| Total (Overall) | 18 (66.7%) | 9 (33.3%) |
Employment Industries by Sex in Lake Aluma
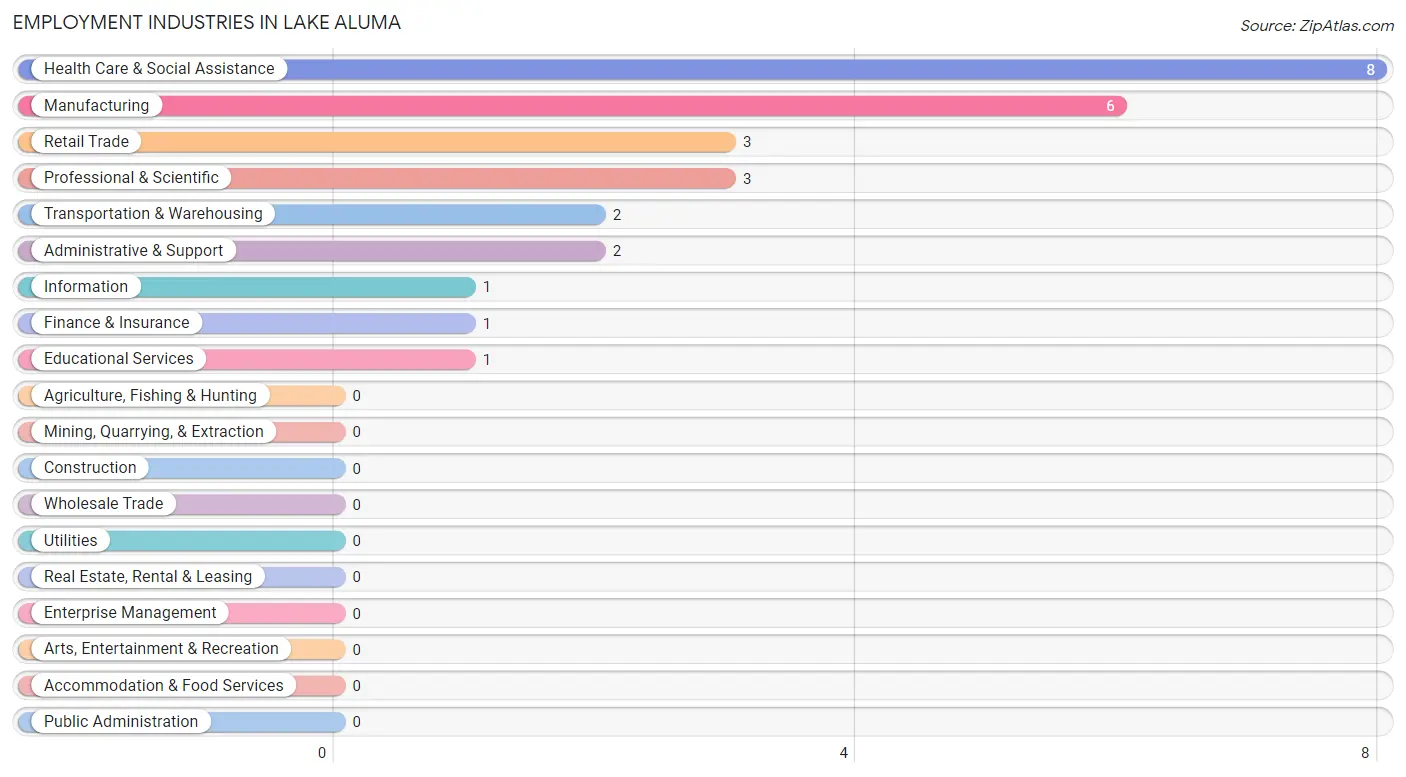
Employment Industries in Lake Aluma
The major employment industries in Lake Aluma include Health Care & Social Assistance (8 | 29.6%), Manufacturing (6 | 22.2%), Retail Trade (3 | 11.1%), Professional & Scientific (3 | 11.1%), and Transportation & Warehousing (2 | 7.4%).
Employment Industries by Sex in Lake Aluma
The Lake Aluma industries that see more men than women are Manufacturing (100.0%), Professional & Scientific (100.0%), and Educational Services (100.0%), whereas the industries that tend to have a higher number of women are Transportation & Warehousing (100.0%), Information (100.0%), and Finance & Insurance (100.0%).
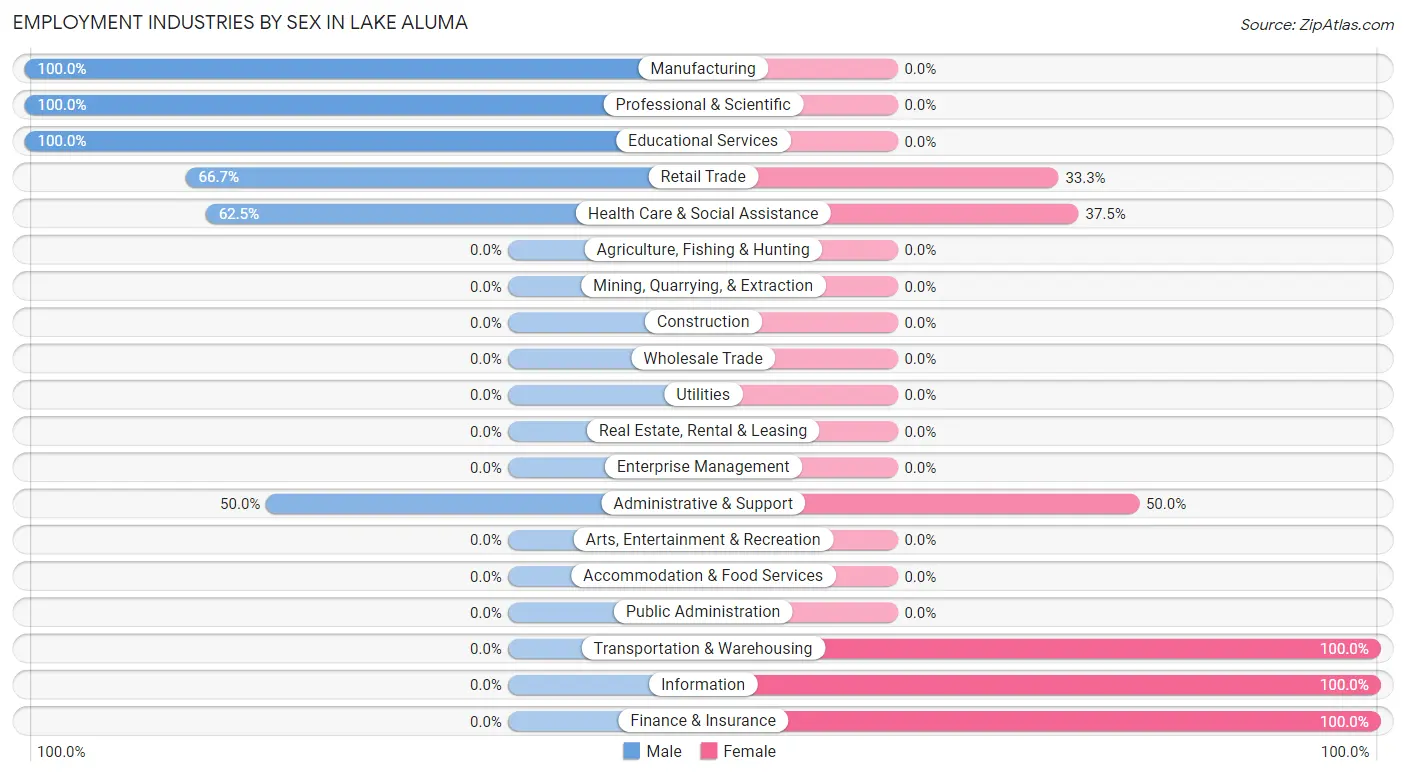
| Industry | Male | Female |
| Agriculture, Fishing & Hunting | 0 (0.0%) | 0 (0.0%) |
| Mining, Quarrying, & Extraction | 0 (0.0%) | 0 (0.0%) |
| Construction | 0 (0.0%) | 0 (0.0%) |
| Manufacturing | 6 (100.0%) | 0 (0.0%) |
| Wholesale Trade | 0 (0.0%) | 0 (0.0%) |
| Retail Trade | 2 (66.7%) | 1 (33.3%) |
| Transportation & Warehousing | 0 (0.0%) | 2 (100.0%) |
| Utilities | 0 (0.0%) | 0 (0.0%) |
| Information | 0 (0.0%) | 1 (100.0%) |
| Finance & Insurance | 0 (0.0%) | 1 (100.0%) |
| Real Estate, Rental & Leasing | 0 (0.0%) | 0 (0.0%) |
| Professional & Scientific | 3 (100.0%) | 0 (0.0%) |
| Enterprise Management | 0 (0.0%) | 0 (0.0%) |
| Administrative & Support | 1 (50.0%) | 1 (50.0%) |
| Educational Services | 1 (100.0%) | 0 (0.0%) |
| Health Care & Social Assistance | 5 (62.5%) | 3 (37.5%) |
| Arts, Entertainment & Recreation | 0 (0.0%) | 0 (0.0%) |
| Accommodation & Food Services | 0 (0.0%) | 0 (0.0%) |
| Public Administration | 0 (0.0%) | 0 (0.0%) |
| Total | 18 (66.7%) | 9 (33.3%) |
Education in Lake Aluma
School Enrollment in Lake Aluma
The most common levels of schooling among the 3 students in Lake Aluma are middle school (2 | 66.7%), and graduate / professional (1 | 33.3%).
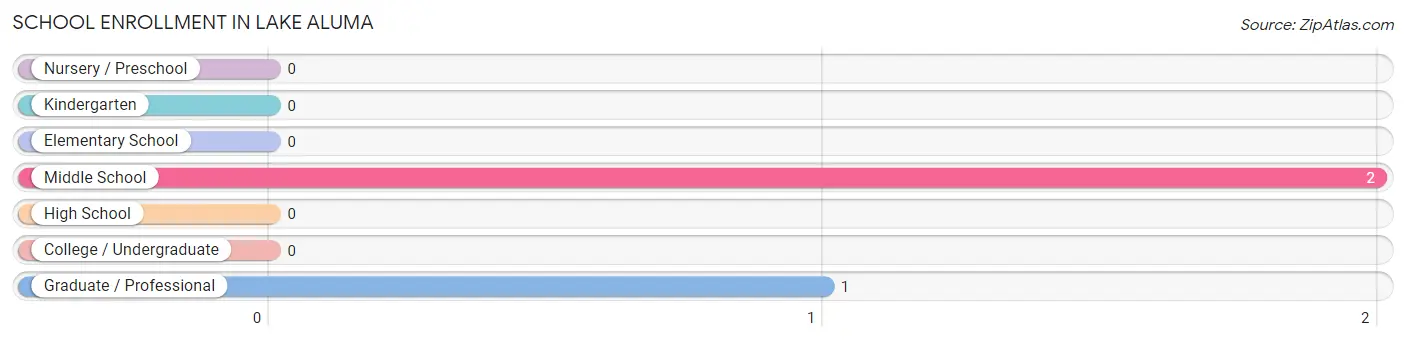
| School Level | # Students | % Students |
| Nursery / Preschool | 0 | 0.0% |
| Kindergarten | 0 | 0.0% |
| Elementary School | 0 | 0.0% |
| Middle School | 2 | 66.7% |
| High School | 0 | 0.0% |
| College / Undergraduate | 0 | 0.0% |
| Graduate / Professional | 1 | 33.3% |
| Total | 3 | 100.0% |
School Enrollment by Age by Funding Source in Lake Aluma
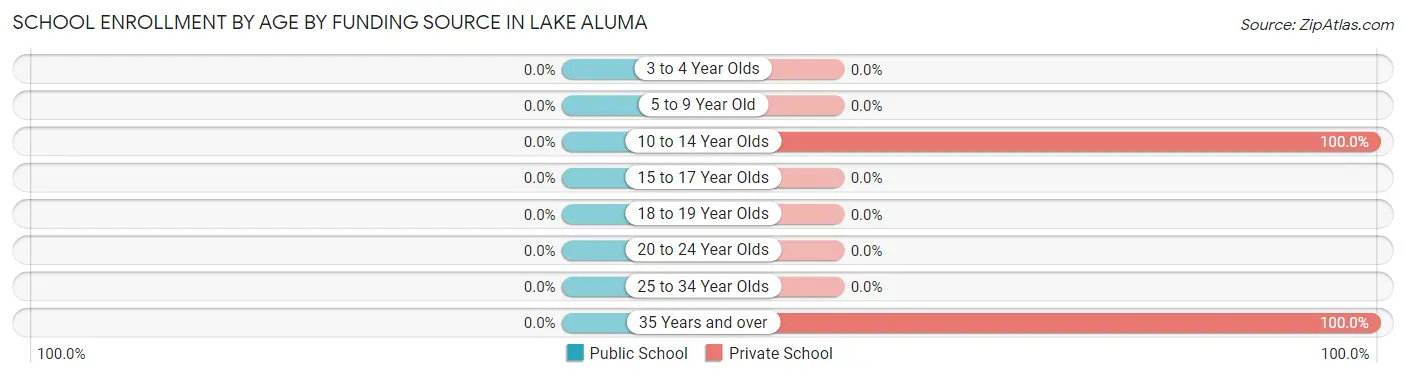
| Age Bracket | Public School | Private School |
| 3 to 4 Year Olds | 0 (0.0%) | 0 (0.0%) |
| 5 to 9 Year Old | 0 (0.0%) | 0 (0.0%) |
| 10 to 14 Year Olds | 0 (0.0%) | 2 (100.0%) |
| 15 to 17 Year Olds | 0 (0.0%) | 0 (0.0%) |
| 18 to 19 Year Olds | 0 (0.0%) | 0 (0.0%) |
| 20 to 24 Year Olds | 0 (0.0%) | 0 (0.0%) |
| 25 to 34 Year Olds | 0 (0.0%) | 0 (0.0%) |
| 35 Years and over | 0 (0.0%) | 1 (100.0%) |
| Total | 0 (0.0%) | 3 (100.0%) |
Educational Attainment by Field of Study in Lake Aluma
Liberal arts & history (7 | 16.7%), business (6 | 14.3%), engineering (5 | 11.9%), education (4 | 9.5%), and literature & languages (4 | 9.5%) are the most common fields of study among 42 individuals in Lake Aluma who have obtained a bachelor's degree or higher.
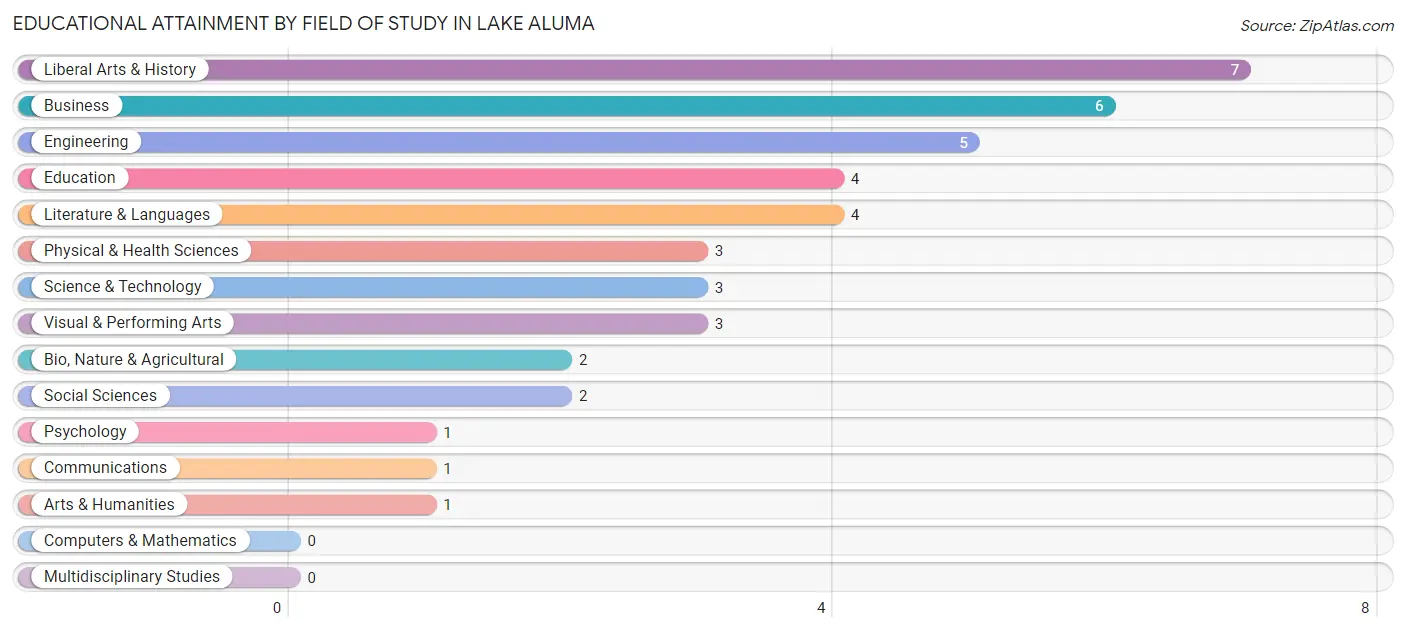
| Field of Study | # Graduates | % Graduates |
| Computers & Mathematics | 0 | 0.0% |
| Bio, Nature & Agricultural | 2 | 4.8% |
| Physical & Health Sciences | 3 | 7.1% |
| Psychology | 1 | 2.4% |
| Social Sciences | 2 | 4.8% |
| Engineering | 5 | 11.9% |
| Multidisciplinary Studies | 0 | 0.0% |
| Science & Technology | 3 | 7.1% |
| Business | 6 | 14.3% |
| Education | 4 | 9.5% |
| Literature & Languages | 4 | 9.5% |
| Liberal Arts & History | 7 | 16.7% |
| Visual & Performing Arts | 3 | 7.1% |
| Communications | 1 | 2.4% |
| Arts & Humanities | 1 | 2.4% |
| Total | 42 | 100.0% |
Transportation & Commute in Lake Aluma
Vehicle Availability by Sex in Lake Aluma
The most prevalent vehicle ownership categories in Lake Aluma are males with 3 vehicles (6, accounting for 35.3%) and females with 3 vehicles (2, making up 66.7%).
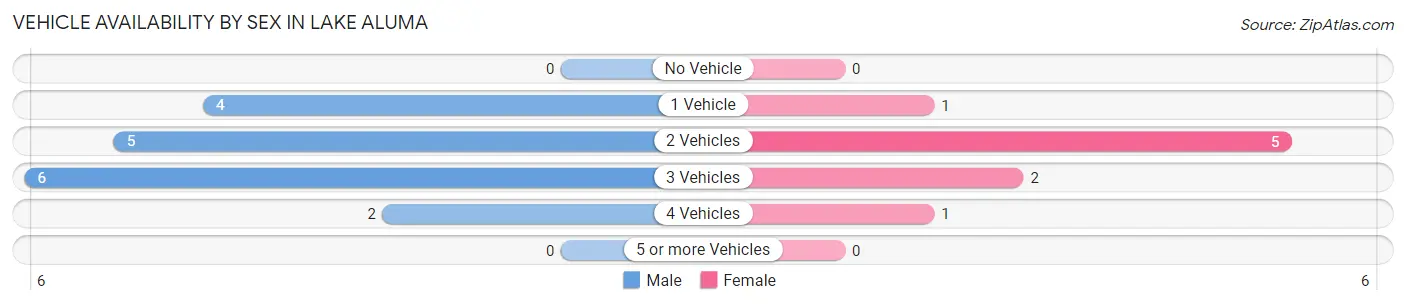
| Vehicles Available | Male | Female |
| No Vehicle | 0 (0.0%) | 0 (0.0%) |
| 1 Vehicle | 4 (23.5%) | 1 (11.1%) |
| 2 Vehicles | 5 (29.4%) | 5 (55.6%) |
| 3 Vehicles | 6 (35.3%) | 2 (22.2%) |
| 4 Vehicles | 2 (11.8%) | 1 (11.1%) |
| 5 or more Vehicles | 0 (0.0%) | 0 (0.0%) |
| Total | 17 (100.0%) | 9 (100.0%) |
Commute Time in Lake Aluma
The most frequently occuring commute durations in Lake Aluma are 20 to 24 minutes (10 commuters, 45.5%), 15 to 19 minutes (6 commuters, 27.3%), and 25 to 29 minutes (4 commuters, 18.2%).
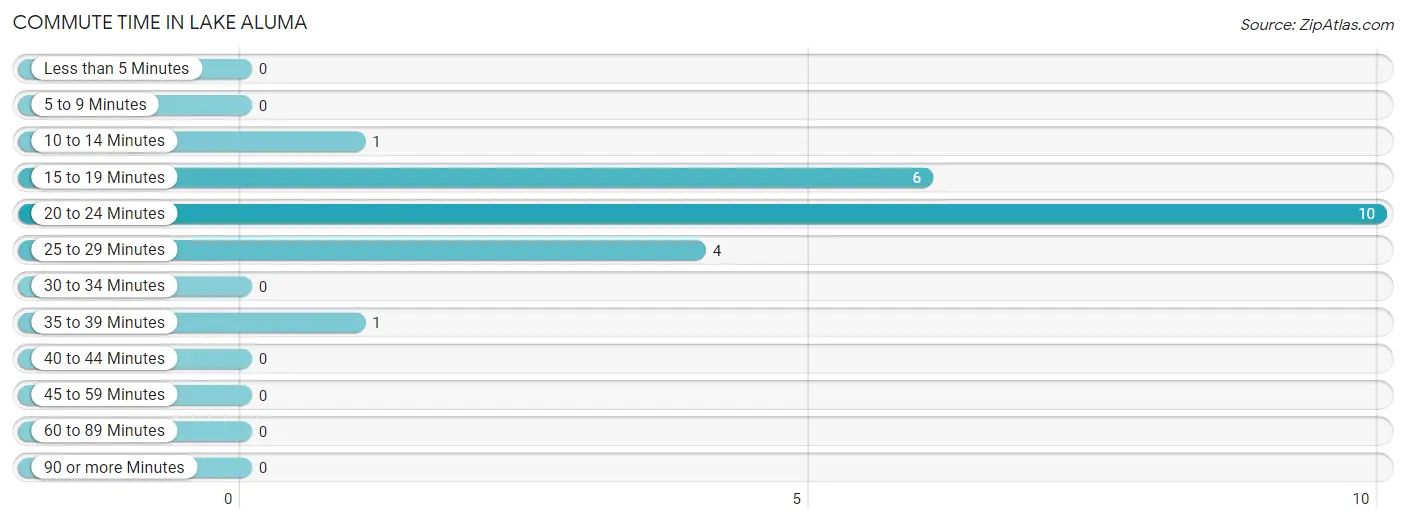
| Commute Time | # Commuters | % Commuters |
| Less than 5 Minutes | 0 | 0.0% |
| 5 to 9 Minutes | 0 | 0.0% |
| 10 to 14 Minutes | 1 | 4.5% |
| 15 to 19 Minutes | 6 | 27.3% |
| 20 to 24 Minutes | 10 | 45.5% |
| 25 to 29 Minutes | 4 | 18.2% |
| 30 to 34 Minutes | 0 | 0.0% |
| 35 to 39 Minutes | 1 | 4.5% |
| 40 to 44 Minutes | 0 | 0.0% |
| 45 to 59 Minutes | 0 | 0.0% |
| 60 to 89 Minutes | 0 | 0.0% |
| 90 or more Minutes | 0 | 0.0% |
Commute Time by Sex in Lake Aluma
The most common commute times in Lake Aluma are 20 to 24 minutes (6 commuters, 40.0%) for males and 20 to 24 minutes (4 commuters, 57.1%) for females.
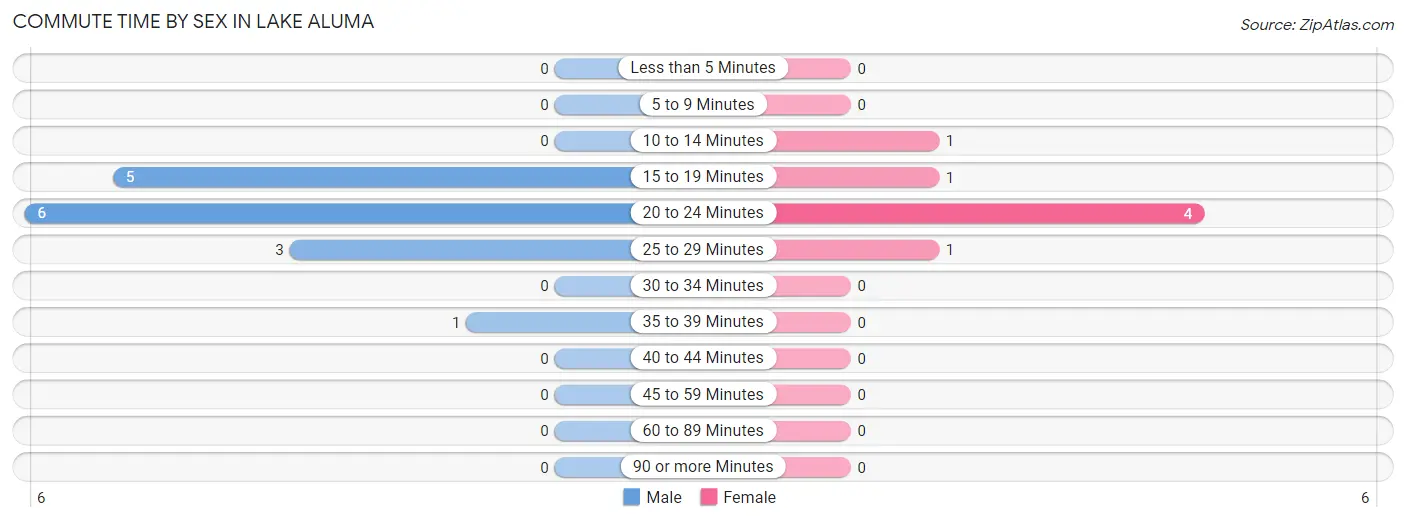
| Commute Time | Male | Female |
| Less than 5 Minutes | 0 (0.0%) | 0 (0.0%) |
| 5 to 9 Minutes | 0 (0.0%) | 0 (0.0%) |
| 10 to 14 Minutes | 0 (0.0%) | 1 (14.3%) |
| 15 to 19 Minutes | 5 (33.3%) | 1 (14.3%) |
| 20 to 24 Minutes | 6 (40.0%) | 4 (57.1%) |
| 25 to 29 Minutes | 3 (20.0%) | 1 (14.3%) |
| 30 to 34 Minutes | 0 (0.0%) | 0 (0.0%) |
| 35 to 39 Minutes | 1 (6.7%) | 0 (0.0%) |
| 40 to 44 Minutes | 0 (0.0%) | 0 (0.0%) |
| 45 to 59 Minutes | 0 (0.0%) | 0 (0.0%) |
| 60 to 89 Minutes | 0 (0.0%) | 0 (0.0%) |
| 90 or more Minutes | 0 (0.0%) | 0 (0.0%) |
Time of Departure to Work by Sex in Lake Aluma
The most frequent times of departure to work in Lake Aluma are 9:00 AM to 9:59 AM (5, 33.3%) for males and 7:00 AM to 7:29 AM (3, 42.9%) for females.
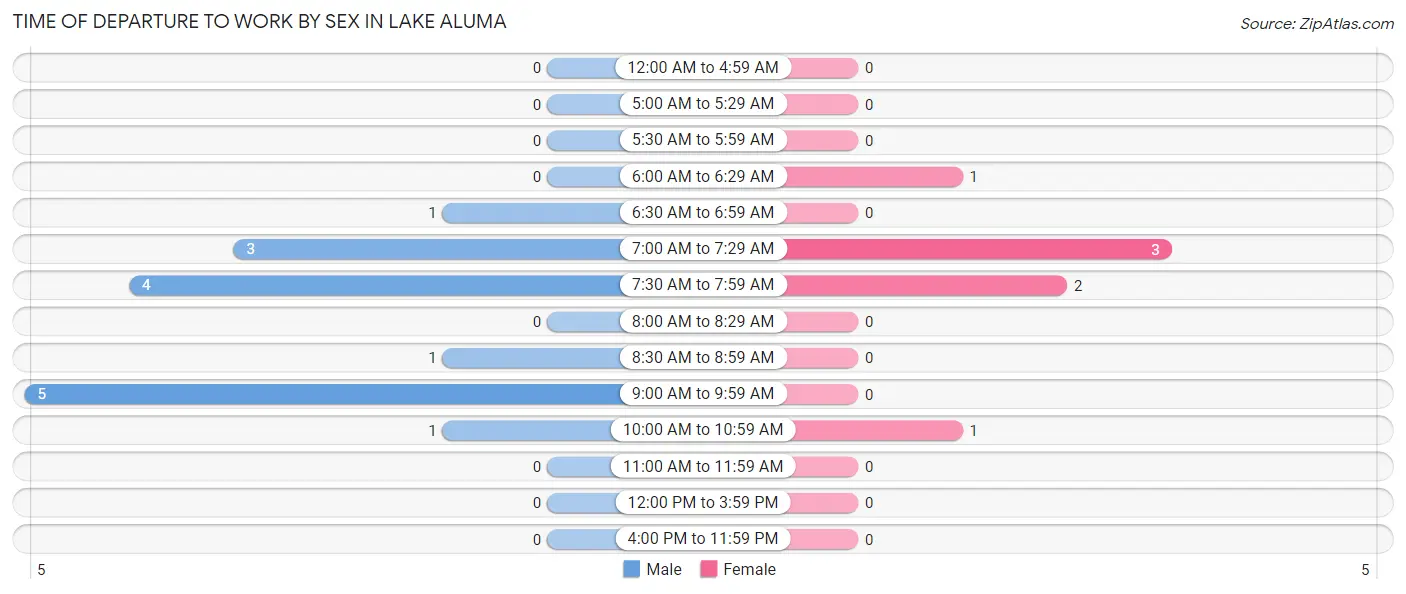
| Time of Departure | Male | Female |
| 12:00 AM to 4:59 AM | 0 (0.0%) | 0 (0.0%) |
| 5:00 AM to 5:29 AM | 0 (0.0%) | 0 (0.0%) |
| 5:30 AM to 5:59 AM | 0 (0.0%) | 0 (0.0%) |
| 6:00 AM to 6:29 AM | 0 (0.0%) | 1 (14.3%) |
| 6:30 AM to 6:59 AM | 1 (6.7%) | 0 (0.0%) |
| 7:00 AM to 7:29 AM | 3 (20.0%) | 3 (42.9%) |
| 7:30 AM to 7:59 AM | 4 (26.7%) | 2 (28.6%) |
| 8:00 AM to 8:29 AM | 0 (0.0%) | 0 (0.0%) |
| 8:30 AM to 8:59 AM | 1 (6.7%) | 0 (0.0%) |
| 9:00 AM to 9:59 AM | 5 (33.3%) | 0 (0.0%) |
| 10:00 AM to 10:59 AM | 1 (6.7%) | 1 (14.3%) |
| 11:00 AM to 11:59 AM | 0 (0.0%) | 0 (0.0%) |
| 12:00 PM to 3:59 PM | 0 (0.0%) | 0 (0.0%) |
| 4:00 PM to 11:59 PM | 0 (0.0%) | 0 (0.0%) |
| Total | 15 (100.0%) | 7 (100.0%) |
Housing Occupancy in Lake Aluma
Occupancy by Ownership in Lake Aluma
Of the total 25 dwellings in Lake Aluma, owner-occupied units account for 25 (100.0%), while renter-occupied units make up 0 (0.0%).
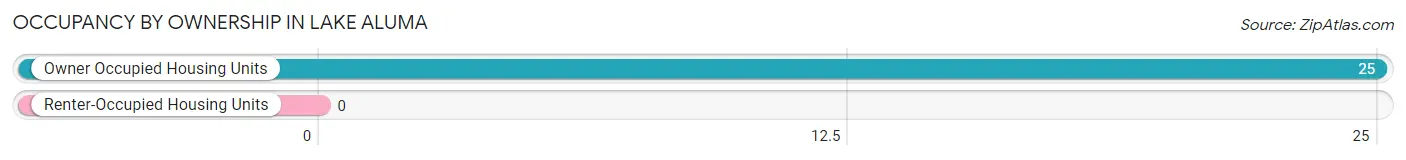
| Occupancy | # Housing Units | % Housing Units |
| Owner Occupied Housing Units | 25 | 100.0% |
| Renter-Occupied Housing Units | 0 | 0.0% |
| Total Occupied Housing Units | 25 | 100.0% |
Occupancy by Household Size in Lake Aluma
| Household Size | # Housing Units | % Housing Units |
| 1-Person Household | 3 | 12.0% |
| 2-Person Household | 20 | 80.0% |
| 3-Person Household | 1 | 4.0% |
| 4+ Person Household | 1 | 4.0% |
| Total Housing Units | 25 | 100.0% |
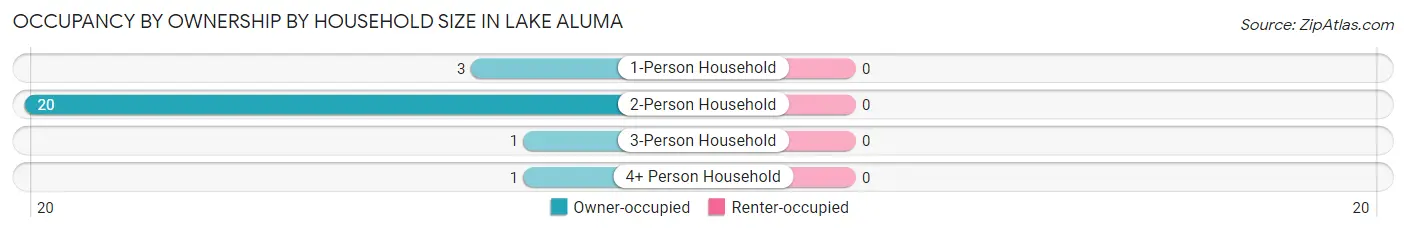
Occupancy by Ownership by Household Size in Lake Aluma
| Household Size | Owner-occupied | Renter-occupied |
| 1-Person Household | 3 (100.0%) | 0 (0.0%) |
| 2-Person Household | 20 (100.0%) | 0 (0.0%) |
| 3-Person Household | 1 (100.0%) | 0 (0.0%) |
| 4+ Person Household | 1 (100.0%) | 0 (0.0%) |
| Total Housing Units | 25 (100.0%) | 0 (0.0%) |
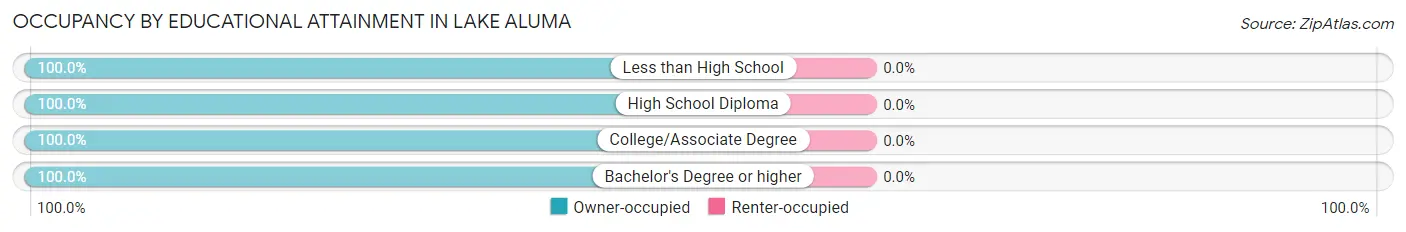
Occupancy by Educational Attainment in Lake Aluma
| Household Size | Owner-occupied | Renter-occupied |
| Less than High School | 1 (100.0%) | 0 (0.0%) |
| High School Diploma | 1 (100.0%) | 0 (0.0%) |
| College/Associate Degree | 4 (100.0%) | 0 (0.0%) |
| Bachelor's Degree or higher | 19 (100.0%) | 0 (0.0%) |
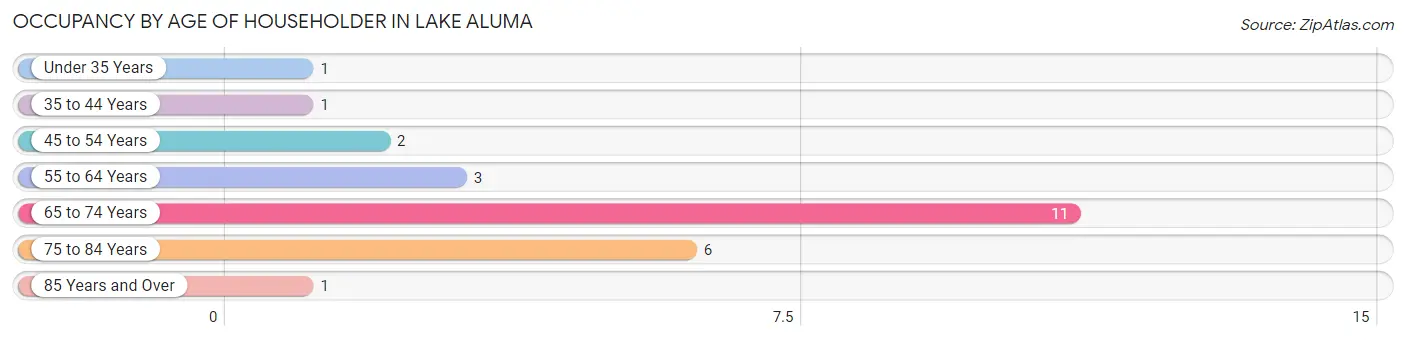
Occupancy by Age of Householder in Lake Aluma
| Age Bracket | # Households | % Households |
| Under 35 Years | 1 | 4.0% |
| 35 to 44 Years | 1 | 4.0% |
| 45 to 54 Years | 2 | 8.0% |
| 55 to 64 Years | 3 | 12.0% |
| 65 to 74 Years | 11 | 44.0% |
| 75 to 84 Years | 6 | 24.0% |
| 85 Years and Over | 1 | 4.0% |
| Total | 25 | 100.0% |
Housing Finances in Lake Aluma
Median Income by Occupancy in Lake Aluma
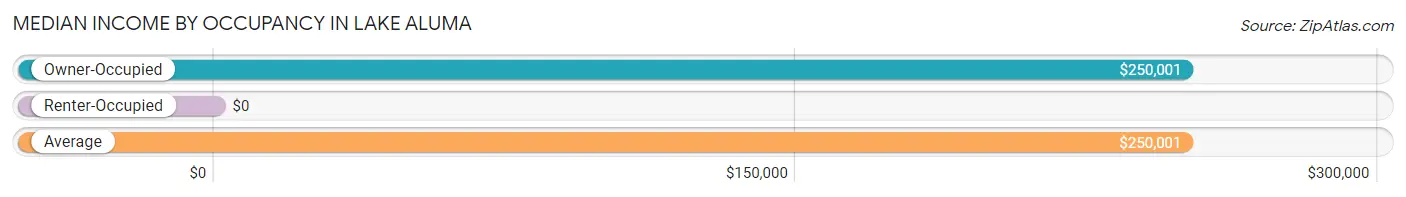
| Occupancy Type | # Households | Median Income |
| Owner-Occupied | 25 (100.0%) | $250,001 |
| Renter-Occupied | 0 (0.0%) | $0 |
| Average | 25 (100.0%) | $250,001 |
Occupancy by Householder Income Bracket in Lake Aluma
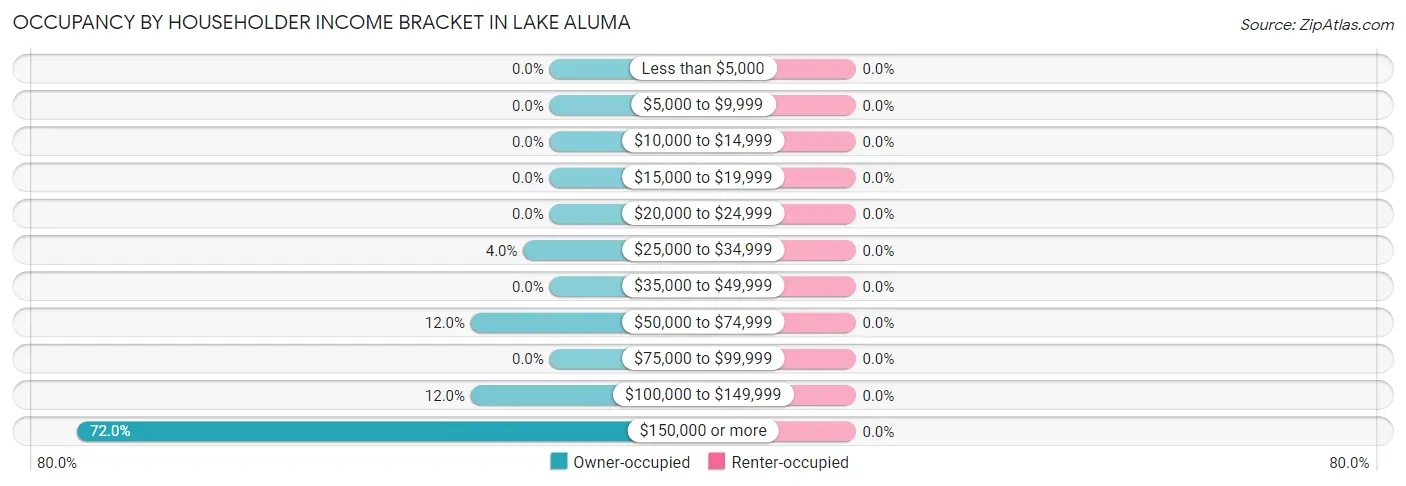
| Income Bracket | Owner-occupied | Renter-occupied |
| Less than $5,000 | 0 (0.0%) | 0 (0.0%) |
| $5,000 to $9,999 | 0 (0.0%) | 0 (0.0%) |
| $10,000 to $14,999 | 0 (0.0%) | 0 (0.0%) |
| $15,000 to $19,999 | 0 (0.0%) | 0 (0.0%) |
| $20,000 to $24,999 | 0 (0.0%) | 0 (0.0%) |
| $25,000 to $34,999 | 1 (4.0%) | 0 (0.0%) |
| $35,000 to $49,999 | 0 (0.0%) | 0 (0.0%) |
| $50,000 to $74,999 | 3 (12.0%) | 0 (0.0%) |
| $75,000 to $99,999 | 0 (0.0%) | 0 (0.0%) |
| $100,000 to $149,999 | 3 (12.0%) | 0 (0.0%) |
| $150,000 or more | 18 (72.0%) | 0 (0.0%) |
| Total | 25 (100.0%) | 0 (0.0%) |
Monthly Housing Cost Tiers in Lake Aluma
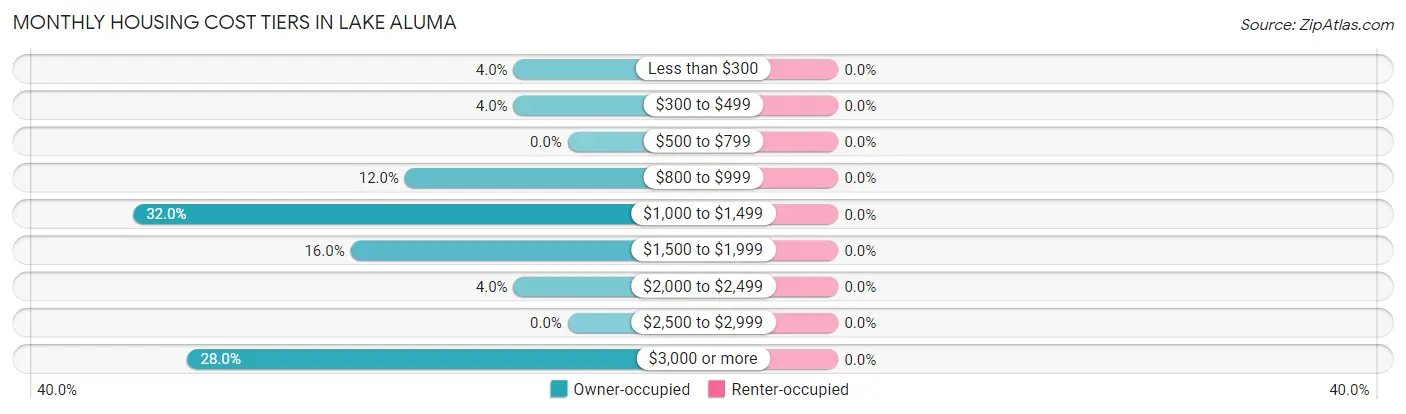
| Monthly Cost | Owner-occupied | Renter-occupied |
| Less than $300 | 1 (4.0%) | 0 (0.0%) |
| $300 to $499 | 1 (4.0%) | 0 (0.0%) |
| $500 to $799 | 0 (0.0%) | 0 (0.0%) |
| $800 to $999 | 3 (12.0%) | 0 (0.0%) |
| $1,000 to $1,499 | 8 (32.0%) | 0 (0.0%) |
| $1,500 to $1,999 | 4 (16.0%) | 0 (0.0%) |
| $2,000 to $2,499 | 1 (4.0%) | 0 (0.0%) |
| $2,500 to $2,999 | 0 (0.0%) | 0 (0.0%) |
| $3,000 or more | 7 (28.0%) | 0 (0.0%) |
| Total | 25 (100.0%) | 0 (0.0%) |
Physical Housing Characteristics in Lake Aluma
Housing Structures in Lake Aluma
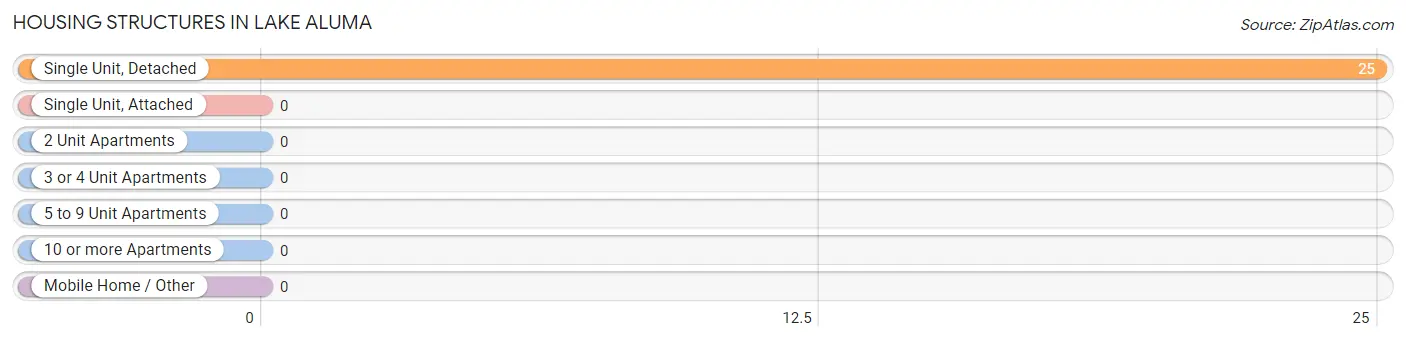
| Structure Type | # Housing Units | % Housing Units |
| Single Unit, Detached | 25 | 100.0% |
| Single Unit, Attached | 0 | 0.0% |
| 2 Unit Apartments | 0 | 0.0% |
| 3 or 4 Unit Apartments | 0 | 0.0% |
| 5 to 9 Unit Apartments | 0 | 0.0% |
| 10 or more Apartments | 0 | 0.0% |
| Mobile Home / Other | 0 | 0.0% |
| Total | 25 | 100.0% |
Housing Structures by Occupancy in Lake Aluma
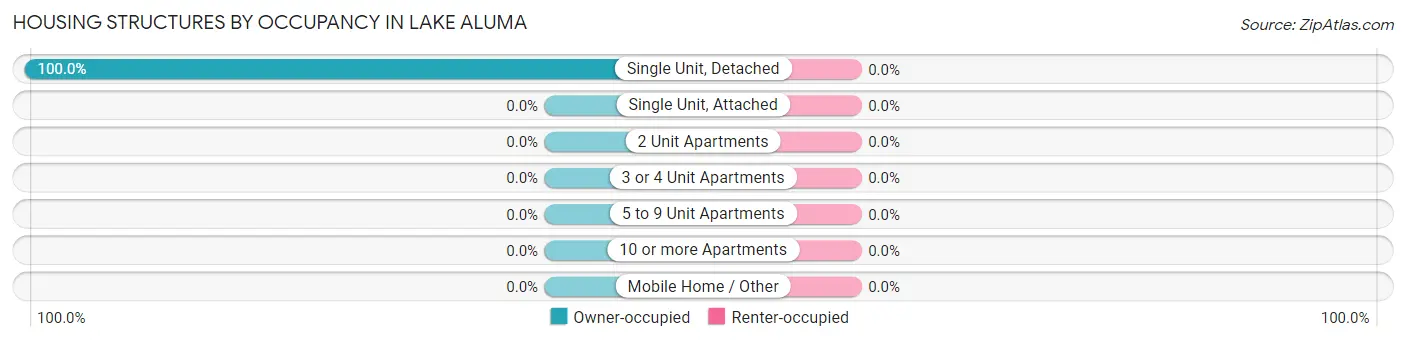
| Structure Type | Owner-occupied | Renter-occupied |
| Single Unit, Detached | 25 (100.0%) | 0 (0.0%) |
| Single Unit, Attached | 0 (0.0%) | 0 (0.0%) |
| 2 Unit Apartments | 0 (0.0%) | 0 (0.0%) |
| 3 or 4 Unit Apartments | 0 (0.0%) | 0 (0.0%) |
| 5 to 9 Unit Apartments | 0 (0.0%) | 0 (0.0%) |
| 10 or more Apartments | 0 (0.0%) | 0 (0.0%) |
| Mobile Home / Other | 0 (0.0%) | 0 (0.0%) |
| Total | 25 (100.0%) | 0 (0.0%) |
Housing Structures by Number of Rooms in Lake Aluma
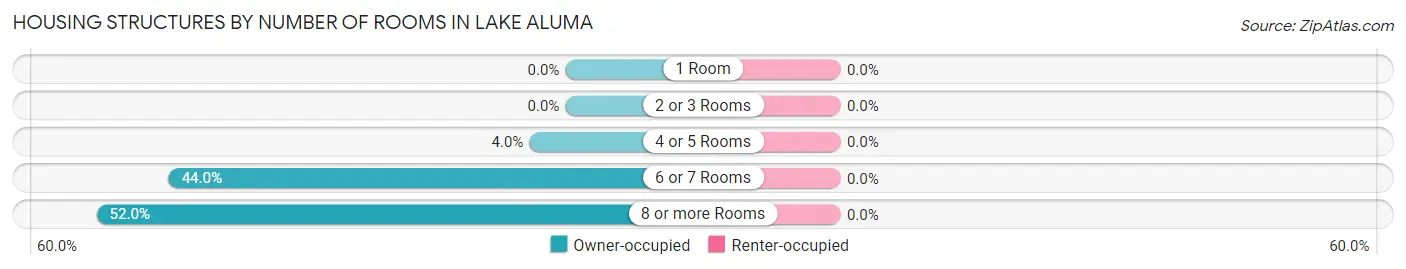
| Number of Rooms | Owner-occupied | Renter-occupied |
| 1 Room | 0 (0.0%) | 0 (0.0%) |
| 2 or 3 Rooms | 0 (0.0%) | 0 (0.0%) |
| 4 or 5 Rooms | 1 (4.0%) | 0 (0.0%) |
| 6 or 7 Rooms | 11 (44.0%) | 0 (0.0%) |
| 8 or more Rooms | 13 (52.0%) | 0 (0.0%) |
| Total | 25 (100.0%) | 0 (0.0%) |
Housing Structure by Heating Type in Lake Aluma
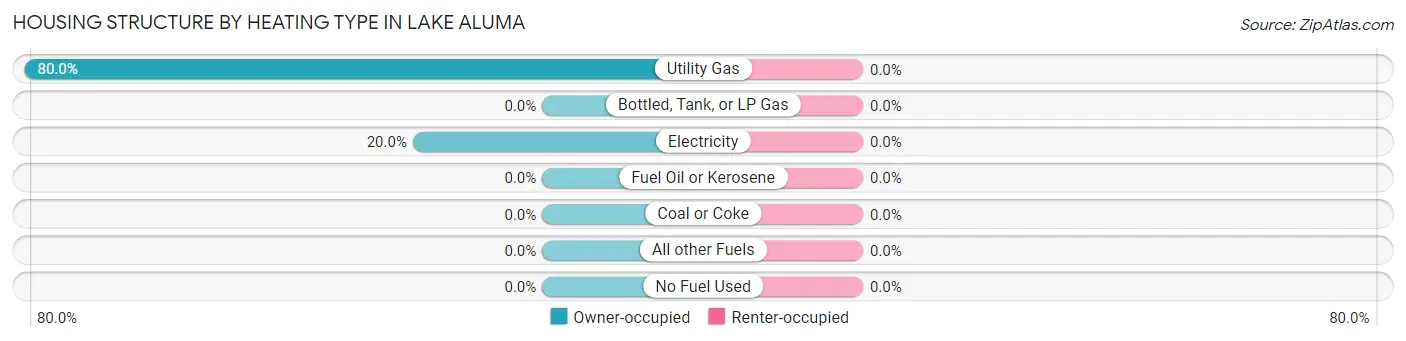
| Heating Type | Owner-occupied | Renter-occupied |
| Utility Gas | 20 (80.0%) | 0 (0.0%) |
| Bottled, Tank, or LP Gas | 0 (0.0%) | 0 (0.0%) |
| Electricity | 5 (20.0%) | 0 (0.0%) |
| Fuel Oil or Kerosene | 0 (0.0%) | 0 (0.0%) |
| Coal or Coke | 0 (0.0%) | 0 (0.0%) |
| All other Fuels | 0 (0.0%) | 0 (0.0%) |
| No Fuel Used | 0 (0.0%) | 0 (0.0%) |
| Total | 25 (100.0%) | 0 (0.0%) |
Household Vehicle Usage in Lake Aluma
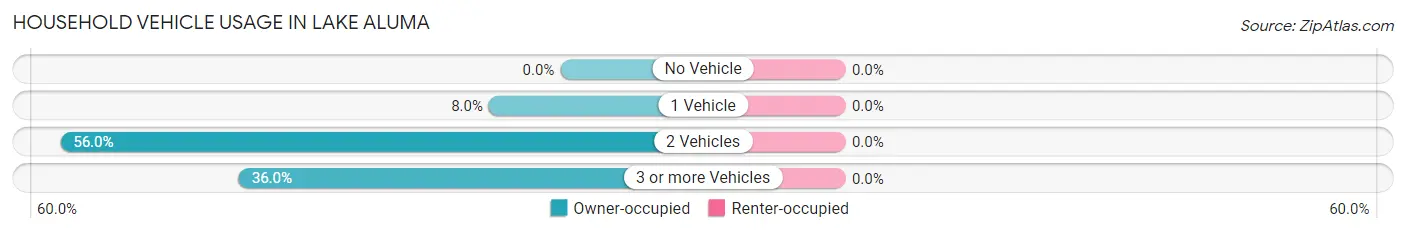
| Vehicles per Household | Owner-occupied | Renter-occupied |
| No Vehicle | 0 (0.0%) | 0 (0.0%) |
| 1 Vehicle | 2 (8.0%) | 0 (0.0%) |
| 2 Vehicles | 14 (56.0%) | 0 (0.0%) |
| 3 or more Vehicles | 9 (36.0%) | 0 (0.0%) |
| Total | 25 (100.0%) | 0 (0.0%) |
Real Estate & Mortgages in Lake Aluma
Real Estate and Mortgage Overview in Lake Aluma
| Characteristic | Without Mortgage | With Mortgage |
| Housing Units | 19 | 6 |
| Median Property Value | $958,300 | $916,700 |
| Median Household Income | $250,001 | $5 |
| Monthly Housing Costs | $1,275 | $6 |
| Real Estate Taxes | $7,857 | $0 |
Property Value by Mortgage Status in Lake Aluma
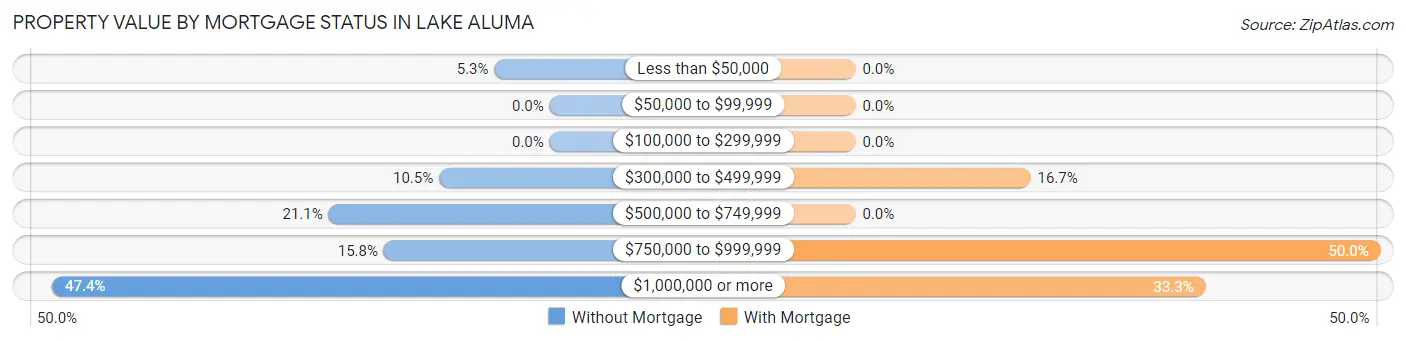
| Property Value | Without Mortgage | With Mortgage |
| Less than $50,000 | 1 (5.3%) | 0 (0.0%) |
| $50,000 to $99,999 | 0 (0.0%) | 0 (0.0%) |
| $100,000 to $299,999 | 0 (0.0%) | 0 (0.0%) |
| $300,000 to $499,999 | 2 (10.5%) | 1 (16.7%) |
| $500,000 to $749,999 | 4 (21.0%) | 0 (0.0%) |
| $750,000 to $999,999 | 3 (15.8%) | 3 (50.0%) |
| $1,000,000 or more | 9 (47.4%) | 2 (33.3%) |
| Total | 19 (100.0%) | 6 (100.0%) |
Household Income by Mortgage Status in Lake Aluma
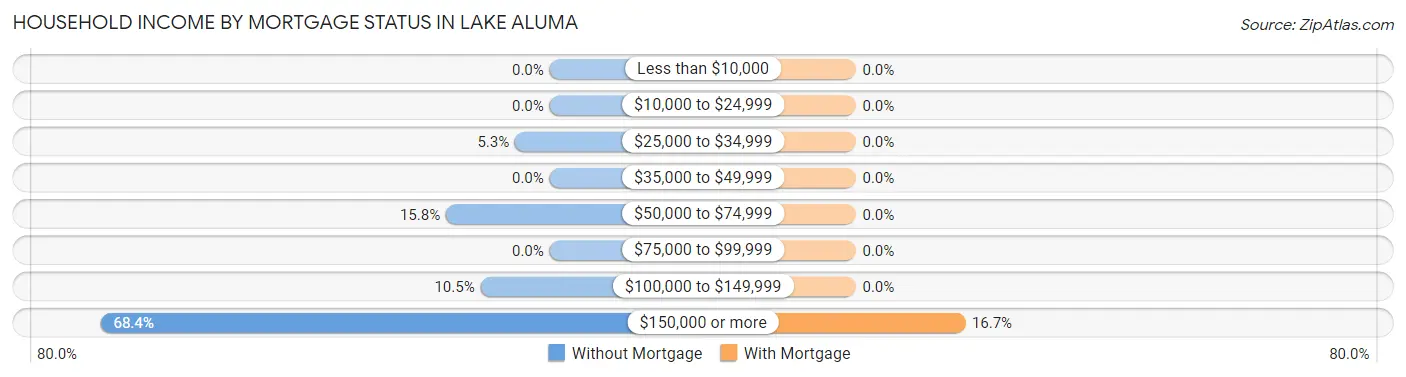
| Household Income | Without Mortgage | With Mortgage |
| Less than $10,000 | 0 (0.0%) | 0 (0.0%) |
| $10,000 to $24,999 | 0 (0.0%) | 0 (0.0%) |
| $25,000 to $34,999 | 1 (5.3%) | 0 (0.0%) |
| $35,000 to $49,999 | 0 (0.0%) | 0 (0.0%) |
| $50,000 to $74,999 | 3 (15.8%) | 0 (0.0%) |
| $75,000 to $99,999 | 0 (0.0%) | 0 (0.0%) |
| $100,000 to $149,999 | 2 (10.5%) | 0 (0.0%) |
| $150,000 or more | 13 (68.4%) | 1 (16.7%) |
| Total | 19 (100.0%) | 6 (100.0%) |
Property Value to Household Income Ratio in Lake Aluma
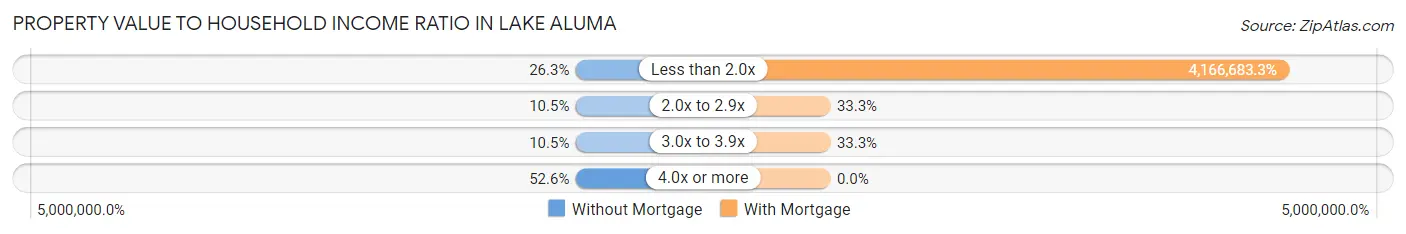
| Value-to-Income Ratio | Without Mortgage | With Mortgage |
| Less than 2.0x | 5 (26.3%) | 250,001 (4,166,683.3%) |
| 2.0x to 2.9x | 2 (10.5%) | 2 (33.3%) |
| 3.0x to 3.9x | 2 (10.5%) | 2 (33.3%) |
| 4.0x or more | 10 (52.6%) | 0 (0.0%) |
| Total | 19 (100.0%) | 6 (100.0%) |
Real Estate Taxes by Mortgage Status in Lake Aluma
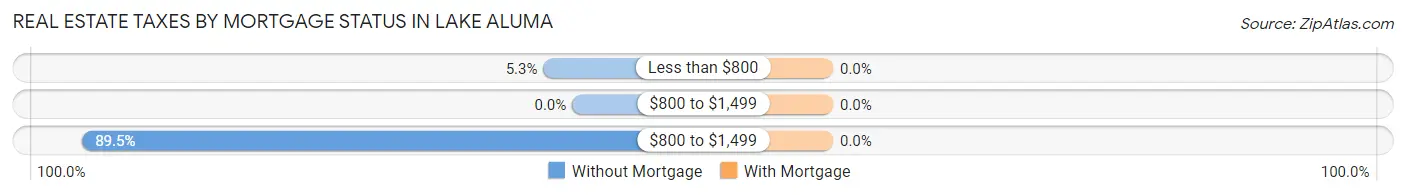
| Property Taxes | Without Mortgage | With Mortgage |
| Less than $800 | 1 (5.3%) | 0 (0.0%) |
| $800 to $1,499 | 0 (0.0%) | 0 (0.0%) |
| $800 to $1,499 | 17 (89.5%) | 0 (0.0%) |
| Total | 19 (100.0%) | 6 (100.0%) |
Health & Disability in Lake Aluma
Health Insurance Coverage by Age in Lake Aluma
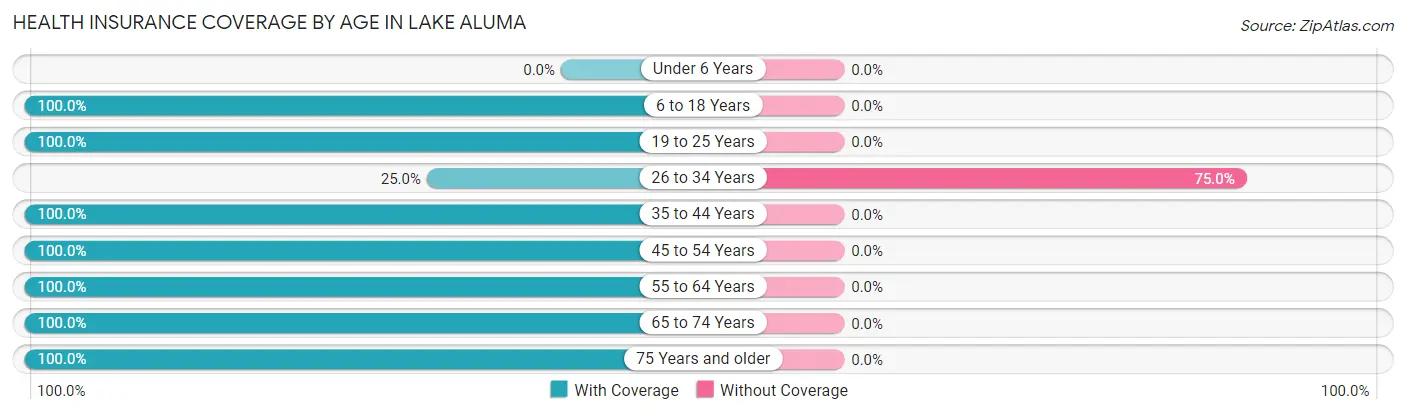
| Age Bracket | With Coverage | Without Coverage |
| Under 6 Years | 0 (0.0%) | 0 (0.0%) |
| 6 to 18 Years | 2 (100.0%) | 0 (0.0%) |
| 19 to 25 Years | 1 (100.0%) | 0 (0.0%) |
| 26 to 34 Years | 1 (25.0%) | 3 (75.0%) |
| 35 to 44 Years | 1 (100.0%) | 0 (0.0%) |
| 45 to 54 Years | 4 (100.0%) | 0 (0.0%) |
| 55 to 64 Years | 7 (100.0%) | 0 (0.0%) |
| 65 to 74 Years | 22 (100.0%) | 0 (0.0%) |
| 75 Years and older | 12 (100.0%) | 0 (0.0%) |
| Total | 50 (94.3%) | 3 (5.7%) |
Health Insurance Coverage by Citizenship Status in Lake Aluma
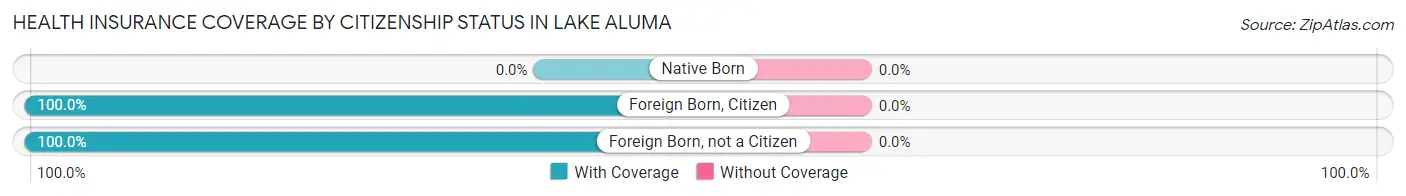
| Citizenship Status | With Coverage | Without Coverage |
| Native Born | 0 (0.0%) | 0 (0.0%) |
| Foreign Born, Citizen | 2 (100.0%) | 0 (0.0%) |
| Foreign Born, not a Citizen | 1 (100.0%) | 0 (0.0%) |
Health Insurance Coverage by Household Income in Lake Aluma
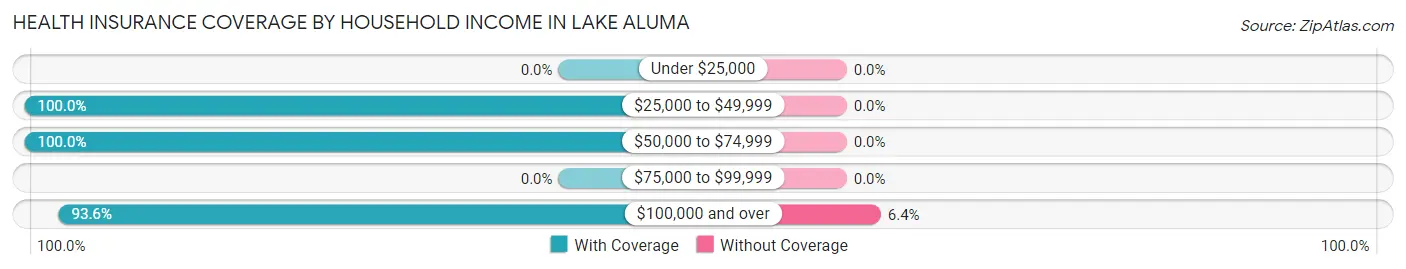
| Household Income | With Coverage | Without Coverage |
| Under $25,000 | 0 (0.0%) | 0 (0.0%) |
| $25,000 to $49,999 | 2 (100.0%) | 0 (0.0%) |
| $50,000 to $74,999 | 4 (100.0%) | 0 (0.0%) |
| $75,000 to $99,999 | 0 (0.0%) | 0 (0.0%) |
| $100,000 and over | 44 (93.6%) | 3 (6.4%) |
Public vs Private Health Insurance Coverage by Age in Lake Aluma
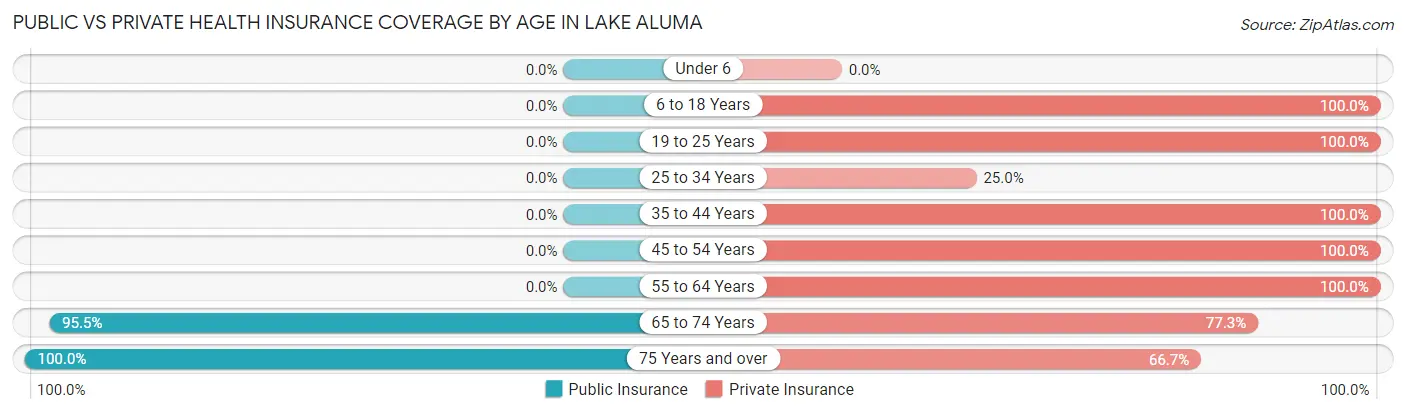
| Age Bracket | Public Insurance | Private Insurance |
| Under 6 | 0 (0.0%) | 0 (0.0%) |
| 6 to 18 Years | 0 (0.0%) | 2 (100.0%) |
| 19 to 25 Years | 0 (0.0%) | 1 (100.0%) |
| 25 to 34 Years | 0 (0.0%) | 1 (25.0%) |
| 35 to 44 Years | 0 (0.0%) | 1 (100.0%) |
| 45 to 54 Years | 0 (0.0%) | 4 (100.0%) |
| 55 to 64 Years | 0 (0.0%) | 7 (100.0%) |
| 65 to 74 Years | 21 (95.5%) | 17 (77.3%) |
| 75 Years and over | 12 (100.0%) | 8 (66.7%) |
| Total | 33 (62.3%) | 41 (77.4%) |
Disability Status by Sex by Age in Lake Aluma
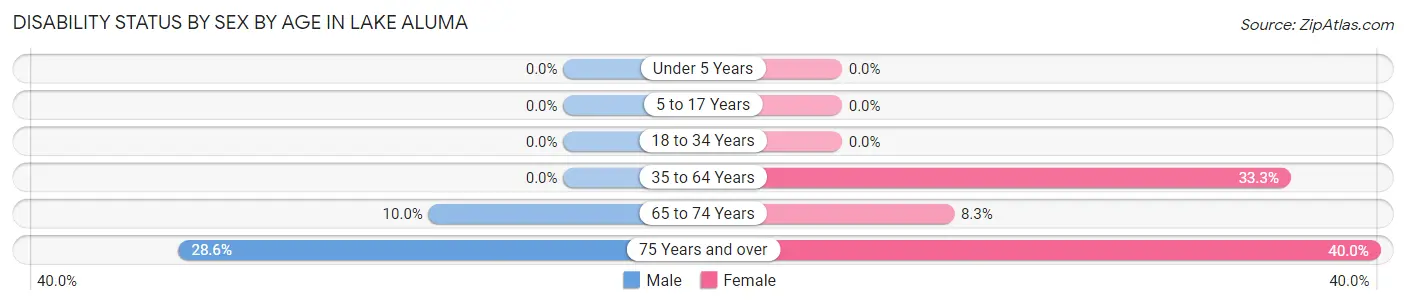
| Age Bracket | Male | Female |
| Under 5 Years | 0 (0.0%) | 0 (0.0%) |
| 5 to 17 Years | 0 (0.0%) | 0 (0.0%) |
| 18 to 34 Years | 0 (0.0%) | 0 (0.0%) |
| 35 to 64 Years | 0 (0.0%) | 2 (33.3%) |
| 65 to 74 Years | 1 (10.0%) | 1 (8.3%) |
| 75 Years and over | 2 (28.6%) | 2 (40.0%) |
Disability Class by Sex by Age in Lake Aluma
Disability Class: Hearing Difficulty
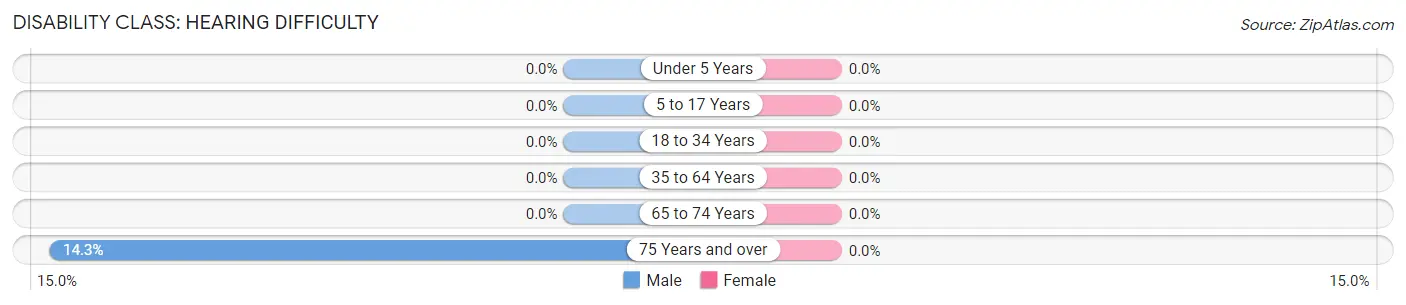
| Age Bracket | Male | Female |
| Under 5 Years | 0 (0.0%) | 0 (0.0%) |
| 5 to 17 Years | 0 (0.0%) | 0 (0.0%) |
| 18 to 34 Years | 0 (0.0%) | 0 (0.0%) |
| 35 to 64 Years | 0 (0.0%) | 0 (0.0%) |
| 65 to 74 Years | 0 (0.0%) | 0 (0.0%) |
| 75 Years and over | 1 (14.3%) | 0 (0.0%) |
Disability Class: Vision Difficulty
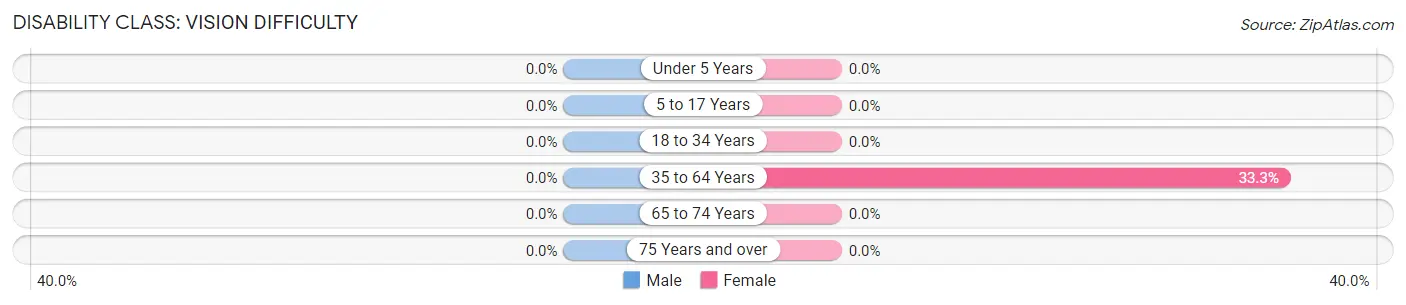
| Age Bracket | Male | Female |
| Under 5 Years | 0 (0.0%) | 0 (0.0%) |
| 5 to 17 Years | 0 (0.0%) | 0 (0.0%) |
| 18 to 34 Years | 0 (0.0%) | 0 (0.0%) |
| 35 to 64 Years | 0 (0.0%) | 2 (33.3%) |
| 65 to 74 Years | 0 (0.0%) | 0 (0.0%) |
| 75 Years and over | 0 (0.0%) | 0 (0.0%) |
Disability Class: Cognitive Difficulty
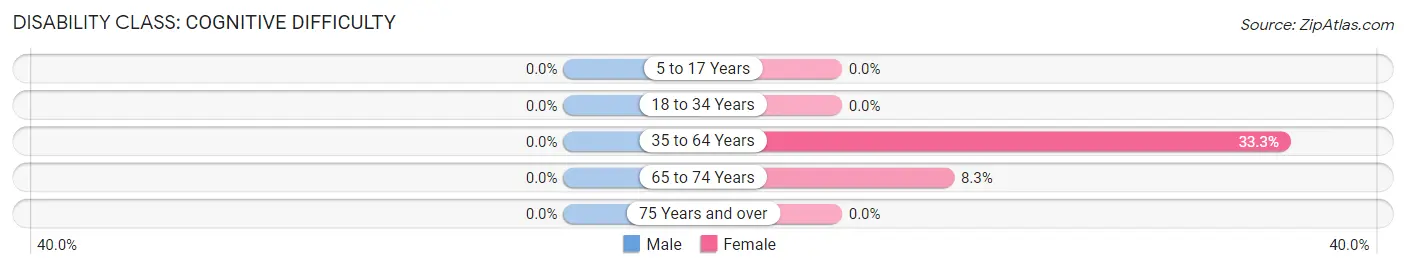
| Age Bracket | Male | Female |
| 5 to 17 Years | 0 (0.0%) | 0 (0.0%) |
| 18 to 34 Years | 0 (0.0%) | 0 (0.0%) |
| 35 to 64 Years | 0 (0.0%) | 2 (33.3%) |
| 65 to 74 Years | 0 (0.0%) | 1 (8.3%) |
| 75 Years and over | 0 (0.0%) | 0 (0.0%) |
Disability Class: Ambulatory Difficulty
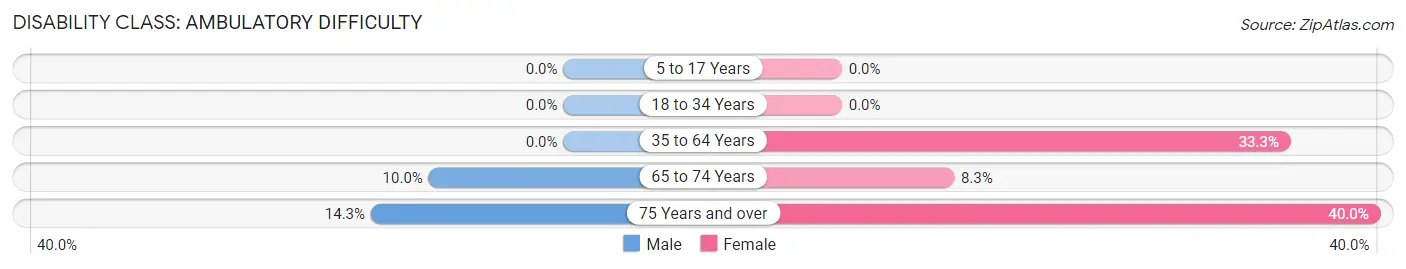
| Age Bracket | Male | Female |
| 5 to 17 Years | 0 (0.0%) | 0 (0.0%) |
| 18 to 34 Years | 0 (0.0%) | 0 (0.0%) |
| 35 to 64 Years | 0 (0.0%) | 2 (33.3%) |
| 65 to 74 Years | 1 (10.0%) | 1 (8.3%) |
| 75 Years and over | 1 (14.3%) | 2 (40.0%) |
Disability Class: Self-Care Difficulty
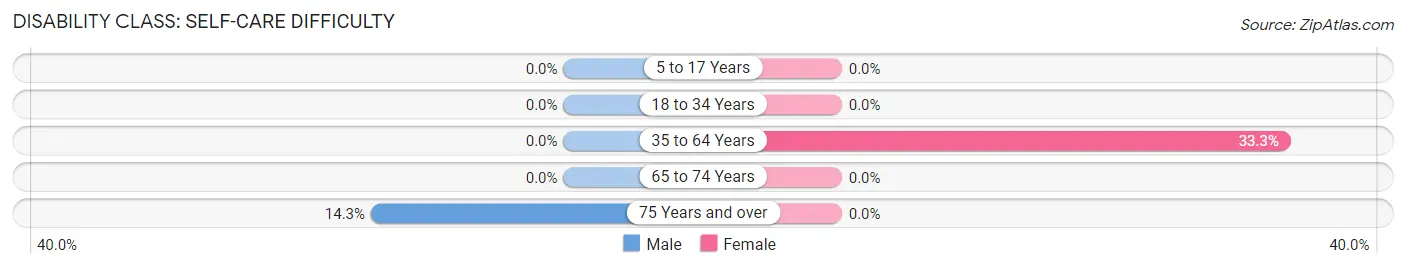
| Age Bracket | Male | Female |
| 5 to 17 Years | 0 (0.0%) | 0 (0.0%) |
| 18 to 34 Years | 0 (0.0%) | 0 (0.0%) |
| 35 to 64 Years | 0 (0.0%) | 2 (33.3%) |
| 65 to 74 Years | 0 (0.0%) | 0 (0.0%) |
| 75 Years and over | 1 (14.3%) | 0 (0.0%) |
Technology Access in Lake Aluma
Computing Device Access in Lake Aluma
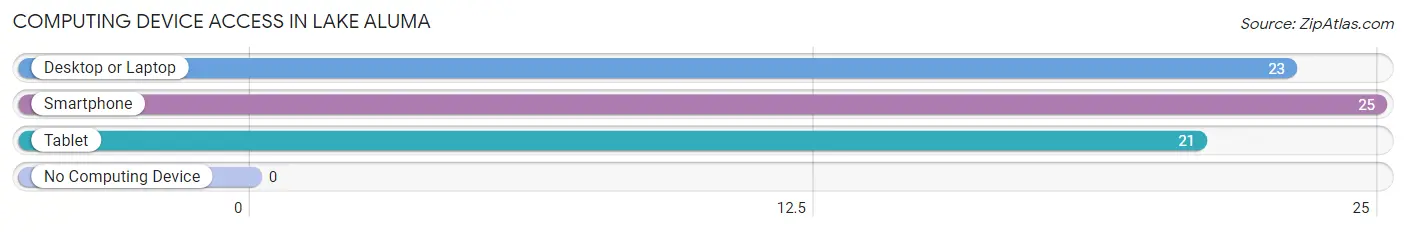
| Device Type | # Households | % Households |
| Desktop or Laptop | 23 | 92.0% |
| Smartphone | 25 | 100.0% |
| Tablet | 21 | 84.0% |
| No Computing Device | 0 | 0.0% |
| Total | 25 | 100.0% |
Internet Access in Lake Aluma
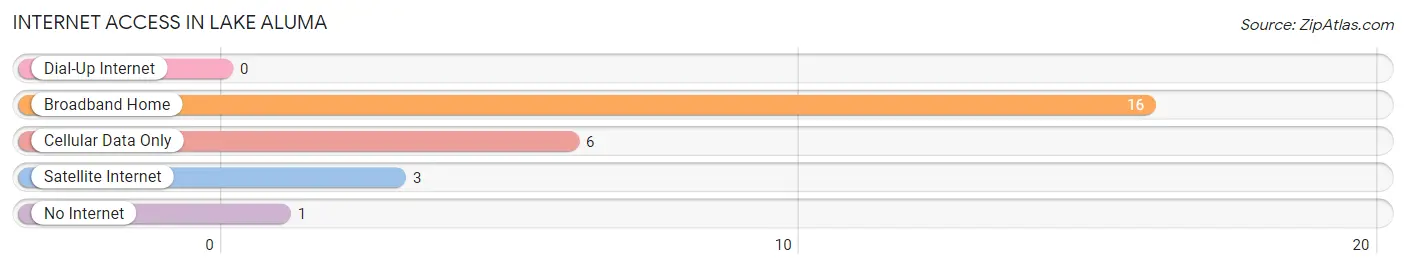
| Internet Type | # Households | % Households |
| Dial-Up Internet | 0 | 0.0% |
| Broadband Home | 16 | 64.0% |
| Cellular Data Only | 6 | 24.0% |
| Satellite Internet | 3 | 12.0% |
| No Internet | 1 | 4.0% |
| Total | 25 | 100.0% |
Lake Aluma Summary
Lake Aluma is a small unincorporated community located in Oklahoma County, Oklahoma. It is situated on the south shore of Lake Aluma, a man-made lake created in the early 1960s. The lake is a popular recreational spot for fishing, swimming, and boating. The community is located just south of Oklahoma City and is part of the Oklahoma City Metropolitan Statistical Area.
History
The area around Lake Aluma was originally inhabited by the Wichita and Caddo Native American tribes. The first settlers in the area were farmers who arrived in the late 1800s. The area was known as “Aluma” after the nearby creek. The creek was named after a Native American chief who lived in the area.
In the early 1960s, the Oklahoma City Water and Sewer Department began construction of a dam on the creek to create a reservoir. The reservoir was completed in 1964 and the lake was named Lake Aluma. The lake was used for recreational activities such as fishing, swimming, and boating.
In the late 1960s, the area around the lake began to develop. The first homes were built in the area in the 1970s. The community was officially incorporated in 1979.
Geography
Lake Aluma is located in Oklahoma County, Oklahoma. It is situated on the south shore of Lake Aluma, a man-made lake created in the early 1960s. The lake is a popular recreational spot for fishing, swimming, and boating. The community is located just south of Oklahoma City and is part of the Oklahoma City Metropolitan Statistical Area.
The area around Lake Aluma is mostly flat with some rolling hills. The terrain is mostly covered in grasslands and woodlands. The lake is surrounded by a variety of trees including oak, hickory, and pecan.
Economy
The economy of Lake Aluma is largely based on tourism and recreation. The lake is a popular spot for fishing, swimming, and boating. There are several marinas and boat ramps located around the lake.
The community also has several small businesses including convenience stores, restaurants, and gas stations. There is also a small airport located in the area.
Demographics
As of the 2010 census, the population of Lake Aluma was 1,845. The racial makeup of the community was 94.3% White, 1.2% African American, 0.7% Native American, 0.3% Asian, 0.1% Pacific Islander, and 3.4% from other races.
The median household income in Lake Aluma was $45,938. The per capita income was $20,945. About 8.3% of the population was below the poverty line.
Conclusion
Lake Aluma is a small unincorporated community located in Oklahoma County, Oklahoma. It is situated on the south shore of Lake Aluma, a man-made lake created in the early 1960s. The lake is a popular recreational spot for fishing, swimming, and boating. The community is located just south of Oklahoma City and is part of the Oklahoma City Metropolitan Statistical Area. The economy of Lake Aluma is largely based on tourism and recreation. The population of Lake Aluma was 1,845 as of the 2010 census. The median household income in Lake Aluma was $45,938 and the per capita income was $20,945.
Common Questions
What is Per Capita Income in Lake Aluma?
Per Capita income in Lake Aluma is $174,642.
What is the Median Family Income in Lake Aluma?
Median Family Income in Lake Aluma is $250,001.
What is the Median Household income in Lake Aluma?
Median Household Income in Lake Aluma is $250,001.
What is Inequality or Gini Index in Lake Aluma?
Inequality or Gini Index in Lake Aluma is 0.43.
What is the Total Population of Lake Aluma?
Total Population of Lake Aluma is 53.
What is the Total Male Population of Lake Aluma?
Total Male Population of Lake Aluma is 29.
What is the Total Female Population of Lake Aluma?
Total Female Population of Lake Aluma is 24.
What is the Ratio of Males per 100 Females in Lake Aluma?
There are 120.83 Males per 100 Females in Lake Aluma.
What is the Ratio of Females per 100 Males in Lake Aluma?
There are 82.76 Females per 100 Males in Lake Aluma.
What is the Median Population Age in Lake Aluma?
Median Population Age in Lake Aluma is 69.3 Years.
What is the Average Family Size in Lake Aluma
Average Family Size in Lake Aluma is 2.1 People.
What is the Average Household Size in Lake Aluma
Average Household Size in Lake Aluma is 2.1 People.
How Large is the Labor Force in Lake Aluma?
There are 29 People in the Labor Forcein in Lake Aluma.
What is the Percentage of People in the Labor Force in Lake Aluma?
56.9% of People are in the Labor Force in Lake Aluma.
What is the Unemployment Rate in Lake Aluma?
Unemployment Rate in Lake Aluma is 6.9%.