Zip Codes with the Highest Percentage of Population with a Degree in Engineering in Oklahoma City, OK

RELATED REPORTS & OPTIONS

Engineering
Population
Families and Households
Female Fertility
Female Fertility (Unmarried)
Race (Community Size)
Race (Percentage)
Ancestry (Community Size)
AfricanAlaska NativeAlbanianAmericanApacheArabArapahoArgentineanArmenianAustralianAustrianBahamianBangladeshiBarbadianBasqueBelgianBhutaneseBlackfeetBolivianBrazilianBritishBritish West IndianBulgarianBurmeseCajunCambodianCanadianCelticCentral AmericanCentral American IndianCherokeeCheyenneChickasawChileanChippewaChoctawColombianComancheCreeCreekCroatianCubanCzechCzechoslovakianDanishDelawareDominicanDutchDutch West IndianEastern EuropeanEcuadorianEgyptianEnglishEstonianEthiopianEuropeanFijianFilipinoFinnishFrenchFrench American IndianFrench CanadianGermanGerman RussianGhanaianGreekGuamanian / ChamorroGuatemalanGuyaneseHaitianHonduranHopiHungarianIcelanderIndian (Asian)IndonesianInupiatIranianIraqiIrishIroquoisIsraeliItalianJamaicanJapaneseJordanianKenyanKiowaKoreanLaotianLatvianLebaneseLiberianLithuanianLuxembourgerMalaysianMexicanMexican American IndianMongolianMoroccanNative HawaiianNavajoNew ZealanderNicaraguanNigerianNorthern EuropeanNorwegianOkinawanOsagePakistaniPalestinianPanamanianPennsylvania GermanPeruvianPimaPolishPortuguesePotawatomiPuebloPuerto RicanRomanianRussianSalvadoranSamoanScandinavianScotch-IrishScottishSeminoleSerbianSiouxSlavicSlovakSloveneSouth AfricanSouth AmericanSouth American IndianSpaniardSpanishSpanish American IndianSri LankanSubsaharan AfricanSudaneseSwedishSwissSyrianThaiTlingit-HaidaTonganTrinidadian and TobagonianTurkishU.S. Virgin IslanderUkrainianUruguayanVenezuelanVietnameseWelshWest IndianYugoslavianZimbabwean
Ancestry (Percentage)
AfricanAlaska NativeAlbanianAmericanApacheArabArapahoArgentineanArmenianAustralianAustrianBahamianBangladeshiBarbadianBasqueBelgianBhutaneseBlackfeetBolivianBrazilianBritishBritish West IndianBulgarianBurmeseCajunCambodianCanadianCelticCentral AmericanCentral American IndianCherokeeCheyenneChickasawChileanChippewaChoctawColombianComancheCreeCreekCroatianCubanCzechCzechoslovakianDanishDelawareDominicanDutchDutch West IndianEastern EuropeanEcuadorianEgyptianEnglishEstonianEthiopianEuropeanFijianFilipinoFinnishFrenchFrench American IndianFrench CanadianGermanGerman RussianGhanaianGreekGuamanian / ChamorroGuatemalanGuyaneseHaitianHonduranHopiHungarianIcelanderIndian (Asian)IndonesianInupiatIranianIraqiIrishIroquoisIsraeliItalianJamaicanJapaneseJordanianKenyanKiowaKoreanLaotianLatvianLebaneseLiberianLithuanianLuxembourgerMalaysianMexicanMexican American IndianMongolianMoroccanNative HawaiianNavajoNew ZealanderNicaraguanNigerianNorthern EuropeanNorwegianOkinawanOsagePakistaniPalestinianPanamanianPennsylvania GermanPeruvianPimaPolishPortuguesePotawatomiPuebloPuerto RicanRomanianRussianSalvadoranSamoanScandinavianScotch-IrishScottishSeminoleSerbianSiouxSlavicSlovakSloveneSouth AfricanSouth AmericanSouth American IndianSpaniardSpanishSpanish American IndianSri LankanSubsaharan AfricanSudaneseSwedishSwissSyrianThaiTlingit-HaidaTonganTrinidadian and TobagonianTurkishU.S. Virgin IslanderUkrainianUruguayanVenezuelanVietnameseWelshWest IndianYugoslavianZimbabwean
Immigrant Origin (Total)
AfricaArgentinaAsiaAustraliaAustriaBahamasBangladeshBosnia and HerzegovinaBrazilBulgariaBurma / MyanmarCambodiaCameroonCanadaCaribbeanCentral AmericaChileChinaColombiaCubaDominican RepublicEastern AfricaEastern AsiaEastern EuropeEcuadorEgyptEl SalvadorEnglandEritreaEthiopiaEuropeFranceGermanyGhanaGreeceGuatemalaHondurasHong KongIndiaIndonesiaIranIraqIrelandItalyJamaicaJapanJordanKazakhstanKenyaKoreaKuwaitLaosLatin AmericaLebanonLiberiaMalaysiaMexicoMiddle AfricaMoroccoNepalNetherlandsNicaraguaNigeriaNorthern AfricaNorthern EuropeNorwayOceaniaPakistanPanamaPeruPhilippinesPolandPortugalRussiaSaudi ArabiaScotlandSingaporeSouth AfricaSouth AmericaSouth Central AsiaSouth Eastern AsiaSouthern EuropeSpainSudanSyriaTaiwanThailandTrinidad and TobagoTurkeyUkraineVenezuelaVietnamWestern AfricaWestern AsiaWestern EuropeZaireZimbabwe
Immigrant Origin (Percentage)
AfricaArgentinaAsiaAustraliaAustriaBahamasBangladeshBosnia and HerzegovinaBrazilBulgariaBurma / MyanmarCambodiaCameroonCanadaCaribbeanCentral AmericaChileChinaColombiaCubaDominican RepublicEastern AfricaEastern AsiaEastern EuropeEcuadorEgyptEl SalvadorEnglandEritreaEthiopiaEuropeFranceGermanyGhanaGreeceGuatemalaHondurasHong KongIndiaIndonesiaIranIraqIrelandItalyJamaicaJapanJordanKazakhstanKenyaKoreaKuwaitLaosLatin AmericaLebanonLiberiaMalaysiaMexicoMiddle AfricaMoroccoNepalNetherlandsNicaraguaNigeriaNorthern AfricaNorthern EuropeNorwayOceaniaPakistanPanamaPeruPhilippinesPolandPortugalRussiaSaudi ArabiaScotlandSingaporeSouth AfricaSouth AmericaSouth Central AsiaSouth Eastern AsiaSouthern EuropeSpainSudanSyriaTaiwanThailandTrinidad and TobagoTurkeyUkraineVenezuelaVietnamWestern AfricaWestern AsiaWestern EuropeZaireZimbabwe
Income
Income (Families)
Income (Households)
Poverty
Poverty (Families)
Unemployment
Employment Occupations
Employment Industries
Employer Class
Commute Time
Commute Means
School Enrollment
Education by Degree Field
Occupancy
Finances
Physical Characteristics
Oklahoma City
Compare Zip Codes
Comparison Subject

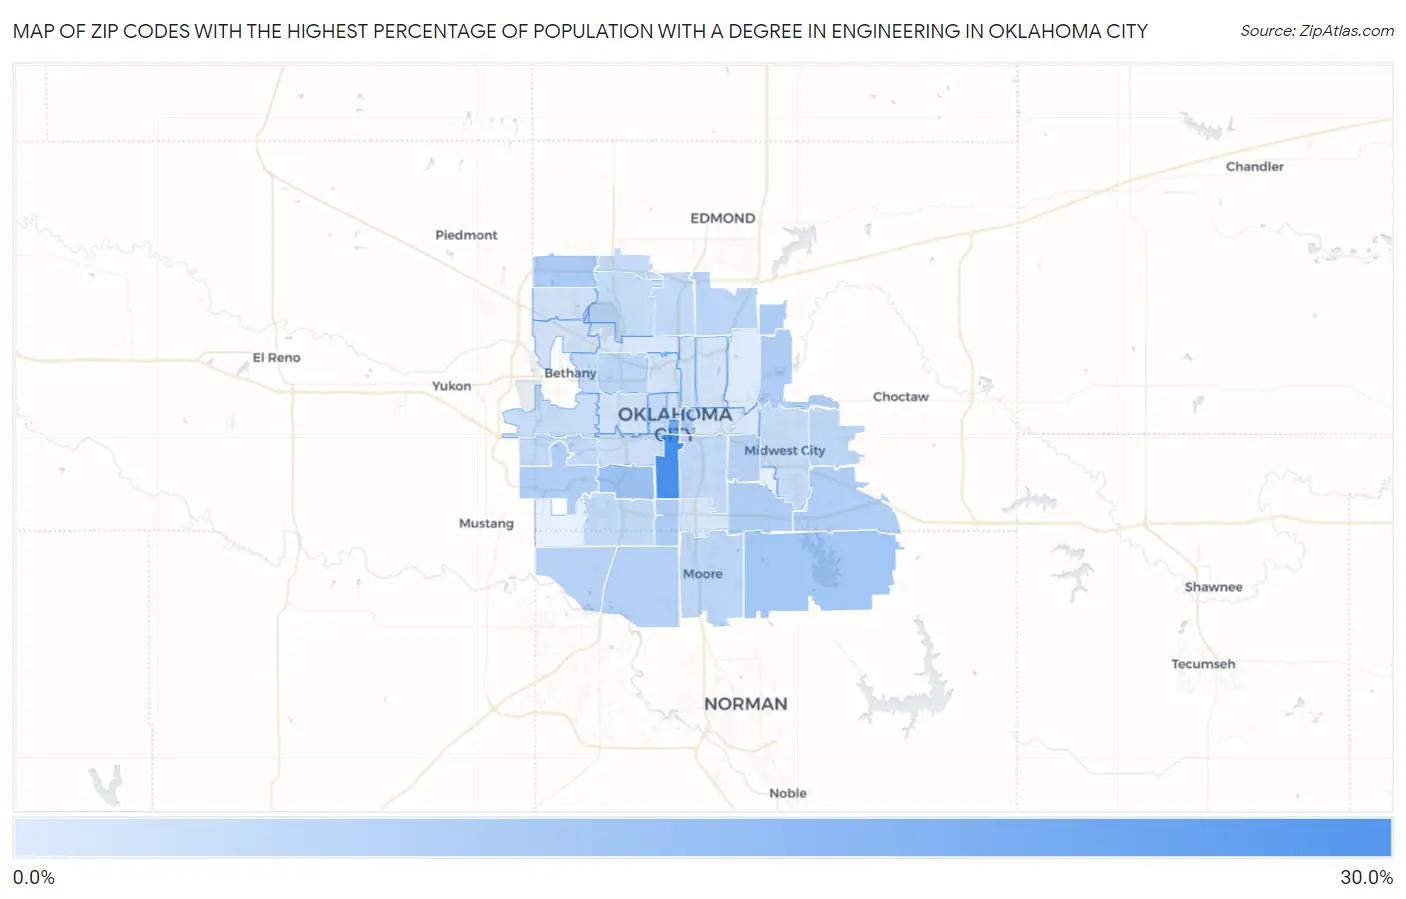
Map of Zip Codes with the Highest Percentage of Population with a Degree in Engineering in Oklahoma City

0.0%
30.0%
Zip Codes with the Highest Percentage of Population with a Degree in Engineering in Oklahoma City Map

Zip Codes with the Highest Percentage of Population with a Degree in Engineering in Oklahoma City, OK

Zip Code % Graduates vs State vs National
1.7310925.6%5.4%(+20.1)#127.6%(+17.9)#520
2.7310218.9%5.4%(+13.4)#187.6%(+11.2)#1,047
3.7311911.1%5.4%(+5.68)#417.6%(+3.47)#3,447
4.7316510.1%5.4%(+4.64)#517.6%(+2.43)#4,369
5.731428.8%5.4%(+3.41)#607.6%(+1.20)#5,814
6.731518.5%5.4%(+3.06)#657.6%(+0.857)#6,273
7.731398.3%5.4%(+2.90)#687.6%(+0.695)#6,505
8.731358.3%5.4%(+2.88)#717.6%(+0.676)#6,558
9.731418.1%5.4%(+2.70)#767.6%(+0.492)#6,863
10.731048.1%5.4%(+2.69)#777.6%(+0.483)#6,880
11.731797.9%5.4%(+2.43)#847.6%(+0.218)#7,337
12.731507.8%5.4%(+2.35)#867.6%(+0.146)#7,455
13.731707.0%5.4%(+1.53)#1027.6%(-0.674)#9,042
14.731737.0%5.4%(+1.51)#1037.6%(-0.696)#9,107
15.731156.8%5.4%(+1.34)#1097.6%(-0.869)#9,445
16.731316.6%5.4%(+1.14)#1147.6%(-1.06)#9,850
17.731606.2%5.4%(+0.721)#1307.6%(-1.49)#10,802
18.731126.0%5.4%(+0.569)#1347.6%(-1.64)#11,151
19.731305.6%5.4%(+0.171)#1487.6%(-2.04)#12,167
20.731285.4%5.4%(-0.029)#1527.6%(-2.24)#12,640
21.731295.4%5.4%(-0.044)#1547.6%(-2.25)#12,691
22.731595.1%5.4%(-0.311)#1667.6%(-2.52)#13,345
23.731145.0%5.4%(-0.430)#1717.6%(-2.64)#13,641
24.731345.0%5.4%(-0.464)#1727.6%(-2.67)#13,738
25.731224.8%5.4%(-0.661)#1887.6%(-2.87)#14,305
26.731064.7%5.4%(-0.748)#1927.6%(-2.96)#14,541
27.731204.6%5.4%(-0.855)#1967.6%(-3.06)#14,838
28.731274.5%5.4%(-0.984)#2007.6%(-3.19)#15,172
29.731104.4%5.4%(-1.08)#2037.6%(-3.29)#15,433
30.731083.7%5.4%(-1.78)#2387.6%(-3.99)#17,261
31.731053.3%5.4%(-2.12)#2547.6%(-4.33)#18,092
32.731033.2%5.4%(-2.19)#2627.6%(-4.40)#18,275
33.731183.1%5.4%(-2.29)#2707.6%(-4.50)#18,521
34.731113.1%5.4%(-2.36)#2787.6%(-4.57)#18,684
35.731623.1%5.4%(-2.37)#2807.6%(-4.58)#18,728
36.731323.0%5.4%(-2.48)#2877.6%(-4.68)#18,983
37.731072.9%5.4%(-2.50)#2897.6%(-4.71)#19,049
38.731492.4%5.4%(-3.07)#3157.6%(-5.28)#20,249
39.731162.0%5.4%(-3.48)#3357.6%(-5.69)#21,022
40.731171.8%5.4%(-3.63)#3467.6%(-5.84)#21,326
41.731211.3%5.4%(-4.15)#3787.6%(-6.35)#22,183

Common Questions

What are the Top 10 Zip Codes with the Highest Percentage of Population with a Degree in Engineering in Oklahoma City, OK?
Top 10 Zip Codes with the Highest Percentage of Population with a Degree in Engineering in Oklahoma City, OK are:
#1
25.6%
#2
18.9%
#3
11.1%
#4
10.1%
#5
8.8%
#6
8.5%
#7
8.3%
#8
8.3%
#9
8.1%
#10
8.1%
What zip code has the Highest Percentage of Population with a Degree in Engineering in Oklahoma City, OK?
73109 has the Highest Percentage of Population with a Degree in Engineering in Oklahoma City, OK with 25.6%.
What is the Percentage of Population with a Degree in Engineering in Oklahoma City, OK?
Percentage of Population with a Degree in Engineering in Oklahoma City is 5.7%.
What is the Percentage of Population with a Degree in Engineering in Oklahoma?
Percentage of Population with a Degree in Engineering in Oklahoma is 5.4%.
What is the Percentage of Population with a Degree in Engineering in the United States?
Percentage of Population with a Degree in Engineering in the United States is 7.6%.