Grandfield, OK Map & Demographics
Grandfield Map
Grandfield Overview
$20,882
PER CAPITA INCOME
$57,926
AVG FAMILY INCOME
$31,169
AVG HOUSEHOLD INCOME
2.4%
WAGE / INCOME GAP [ % ]
97.6¢/ $1
WAGE / INCOME GAP [ $ ]
0.45
INEQUALITY / GINI INDEX
912
TOTAL POPULATION
370
MALE POPULATION
542
FEMALE POPULATION
68.27
MALES / 100 FEMALES
146.49
FEMALES / 100 MALES
36.8
MEDIAN AGE
3.7
AVG FAMILY SIZE
2.5
AVG HOUSEHOLD SIZE
328
LABOR FORCE [ PEOPLE ]
47.2%
PERCENT IN LABOR FORCE
10.7%
UNEMPLOYMENT RATE
Grandfield Zip Codes
Grandfield Area Codes
Income in Grandfield
Income Overview in Grandfield
Per Capita Income in Grandfield is $20,882, while median incomes of families and households are $57,926 and $31,169 respectively.
| Characteristic | Number | Measure |
| Per Capita Income | 912 | $20,882 |
| Median Family Income | 194 | $57,926 |
| Mean Family Income | 194 | $66,324 |
| Median Household Income | 369 | $31,169 |
| Mean Household Income | 369 | $49,097 |
| Income Deficit | 194 | $0 |
| Wage / Income Gap (%) | 912 | 2.38% |
| Wage / Income Gap ($) | 912 | 97.62¢ per $1 |
| Gini / Inequality Index | 912 | 0.45 |
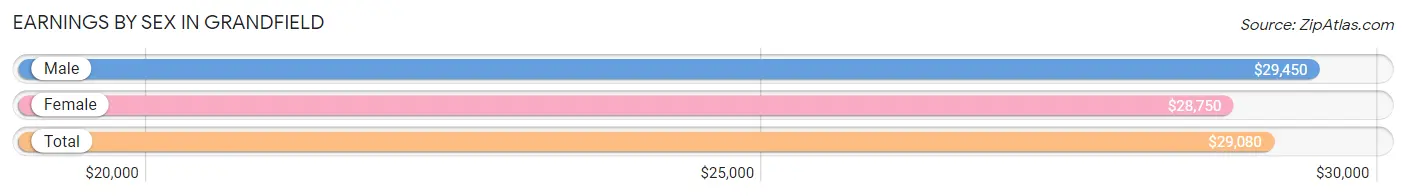
Earnings by Sex in Grandfield
Average Earnings in Grandfield are $29,080, $29,450 for men and $28,750 for women, a difference of 2.4%.
| Sex | Number | Average Earnings |
| Male | 147 (46.1%) | $29,450 |
| Female | 172 (53.9%) | $28,750 |
| Total | 319 (100.0%) | $29,080 |
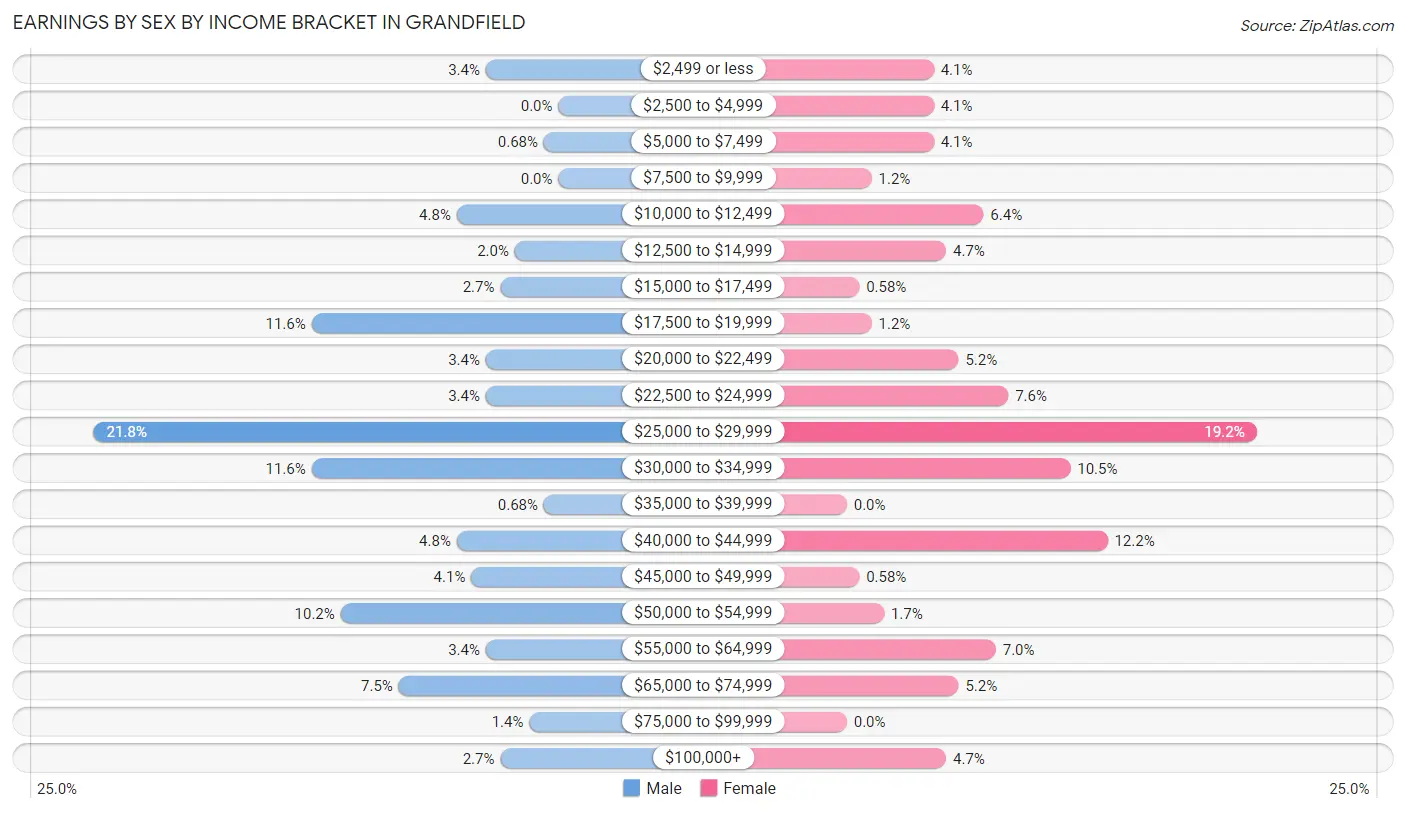
Earnings by Sex by Income Bracket in Grandfield
The most common earnings brackets in Grandfield are $25,000 to $29,999 for men (32 | 21.8%) and $25,000 to $29,999 for women (33 | 19.2%).
| Income | Male | Female |
| $2,499 or less | 5 (3.4%) | 7 (4.1%) |
| $2,500 to $4,999 | 0 (0.0%) | 7 (4.1%) |
| $5,000 to $7,499 | 1 (0.7%) | 7 (4.1%) |
| $7,500 to $9,999 | 0 (0.0%) | 2 (1.2%) |
| $10,000 to $12,499 | 7 (4.8%) | 11 (6.4%) |
| $12,500 to $14,999 | 3 (2.0%) | 8 (4.6%) |
| $15,000 to $17,499 | 4 (2.7%) | 1 (0.6%) |
| $17,500 to $19,999 | 17 (11.6%) | 2 (1.2%) |
| $20,000 to $22,499 | 5 (3.4%) | 9 (5.2%) |
| $22,500 to $24,999 | 5 (3.4%) | 13 (7.6%) |
| $25,000 to $29,999 | 32 (21.8%) | 33 (19.2%) |
| $30,000 to $34,999 | 17 (11.6%) | 18 (10.5%) |
| $35,000 to $39,999 | 1 (0.7%) | 0 (0.0%) |
| $40,000 to $44,999 | 7 (4.8%) | 21 (12.2%) |
| $45,000 to $49,999 | 6 (4.1%) | 1 (0.6%) |
| $50,000 to $54,999 | 15 (10.2%) | 3 (1.7%) |
| $55,000 to $64,999 | 5 (3.4%) | 12 (7.0%) |
| $65,000 to $74,999 | 11 (7.5%) | 9 (5.2%) |
| $75,000 to $99,999 | 2 (1.4%) | 0 (0.0%) |
| $100,000+ | 4 (2.7%) | 8 (4.6%) |
| Total | 147 (100.0%) | 172 (100.0%) |
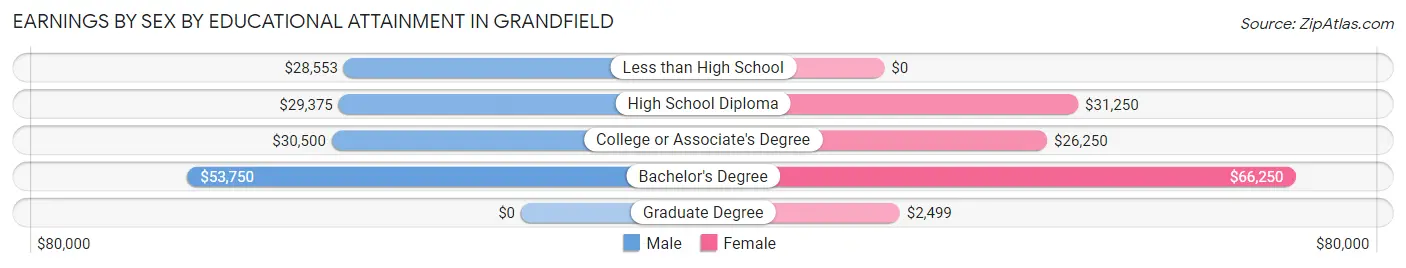
Earnings by Sex by Educational Attainment in Grandfield
Average earnings in Grandfield are $29,450 for men and $30,139 for women, a difference of 2.3%. Men with an educational attainment of bachelor's degree enjoy the highest average annual earnings of $53,750, while those with less than high school education earn the least with $28,553. Women with an educational attainment of bachelor's degree earn the most with the average annual earnings of $66,250, while those with graduate degree education have the smallest earnings of $2,499.
| Educational Attainment | Male Income | Female Income |
| Less than High School | $28,553 | $0 |
| High School Diploma | $29,375 | $31,250 |
| College or Associate's Degree | $30,500 | $26,250 |
| Bachelor's Degree | $53,750 | $66,250 |
| Graduate Degree | - | - |
| Total | $29,450 | $30,139 |
Family Income in Grandfield
Family Income Brackets in Grandfield
According to the Grandfield family income data, there are 60 families falling into the $50,000 to $74,999 income range, which is the most common income bracket and makes up 30.9% of all families. Conversely, the $10,000 to $14,999 income bracket is the least frequent group with only 1 families (0.5%) belonging to this category.
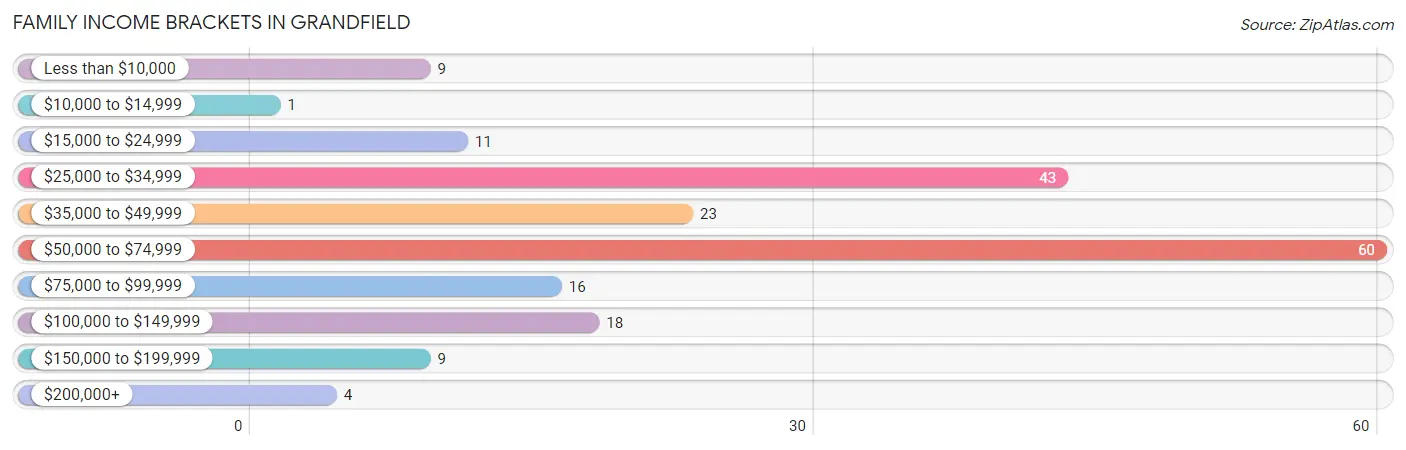
| Income Bracket | # Families | % Families |
| Less than $10,000 | 9 | 4.6% |
| $10,000 to $14,999 | 1 | 0.5% |
| $15,000 to $24,999 | 11 | 5.7% |
| $25,000 to $34,999 | 43 | 22.2% |
| $35,000 to $49,999 | 23 | 11.9% |
| $50,000 to $74,999 | 60 | 30.9% |
| $75,000 to $99,999 | 16 | 8.2% |
| $100,000 to $149,999 | 18 | 9.3% |
| $150,000 to $199,999 | 9 | 4.6% |
| $200,000+ | 4 | 2.1% |
Family Income by Famaliy Size in Grandfield
5-person families (4 | 2.1%) account for the highest median family income in Grandfield with $90,000 per family, while 2-person families (75 | 38.7%) have the highest median income of $28,972 per family member.
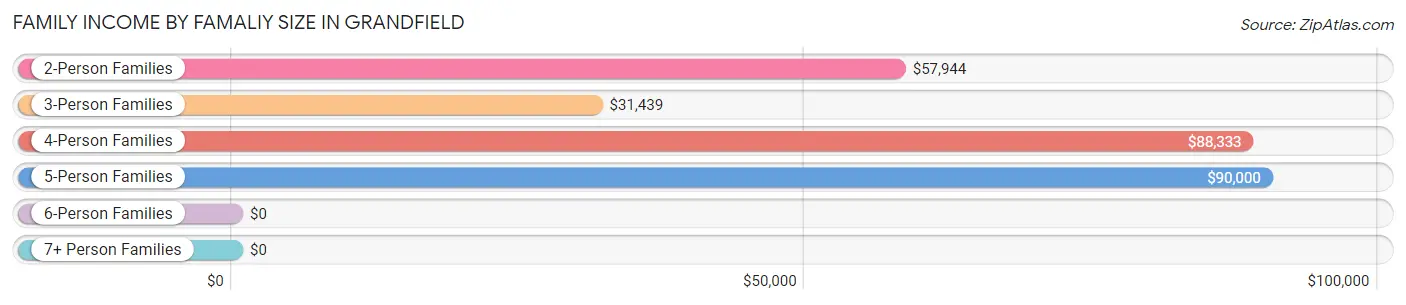
| Income Bracket | # Families | Median Income |
| 2-Person Families | 75 (38.7%) | $57,944 |
| 3-Person Families | 52 (26.8%) | $31,439 |
| 4-Person Families | 58 (29.9%) | $88,333 |
| 5-Person Families | 4 (2.1%) | $90,000 |
| 6-Person Families | 5 (2.6%) | $0 |
| 7+ Person Families | 0 (0.0%) | $0 |
| Total | 194 (100.0%) | $57,926 |
Family Income by Number of Earners in Grandfield
The median family income in Grandfield is $57,926, with families comprising 3+ earners (23) having the highest median family income of $106,250, while families with 1 earner (89) have the lowest median family income of $31,728, accounting for 11.9% and 45.9% of families, respectively.
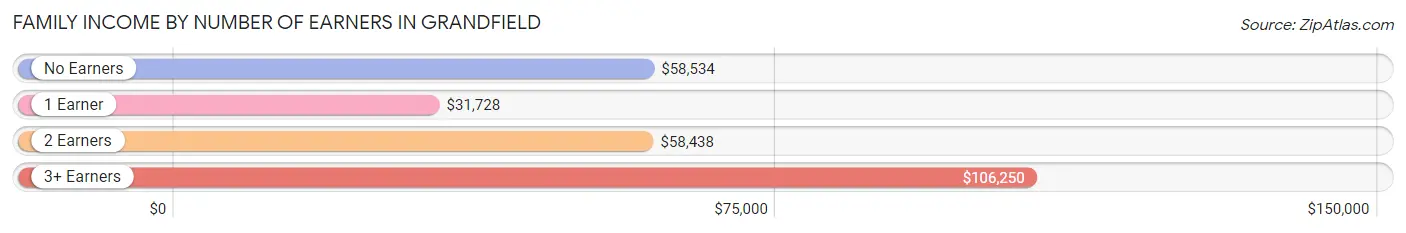
| Number of Earners | # Families | Median Income |
| No Earners | 38 (19.6%) | $58,534 |
| 1 Earner | 89 (45.9%) | $31,728 |
| 2 Earners | 44 (22.7%) | $58,438 |
| 3+ Earners | 23 (11.9%) | $106,250 |
| Total | 194 (100.0%) | $57,926 |
Household Income in Grandfield
Household Income Brackets in Grandfield
With 103 households falling in the category, the $25,000 to $34,999 income range is the most frequent in Grandfield, accounting for 27.9% of all households. In contrast, only 1 households (0.3%) fall into the $150,000 to $199,999 income bracket, making it the least populous group.
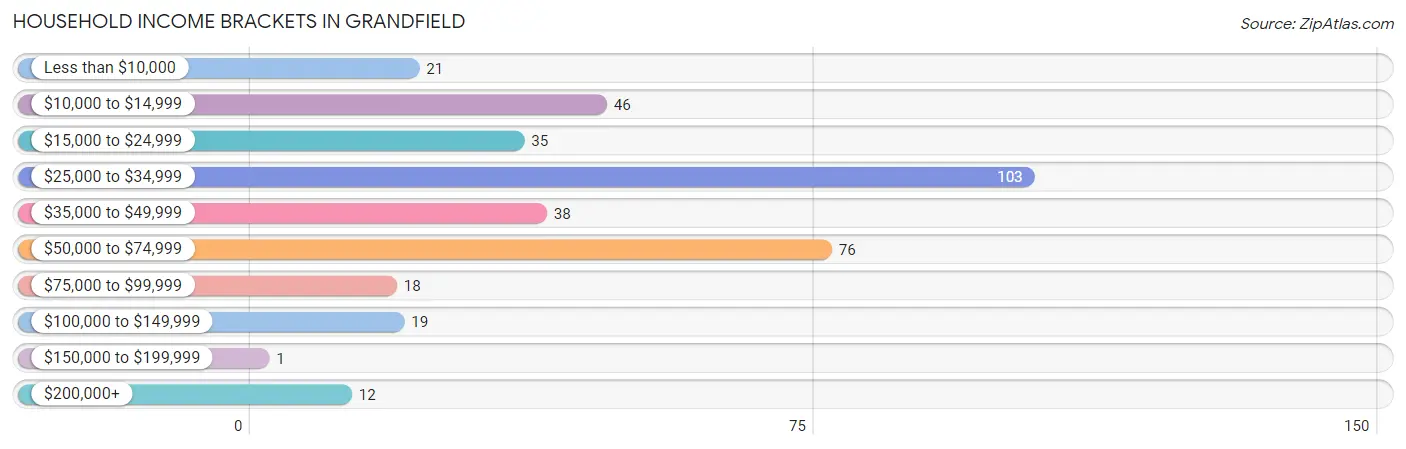
| Income Bracket | # Households | % Households |
| Less than $10,000 | 21 | 5.7% |
| $10,000 to $14,999 | 46 | 12.5% |
| $15,000 to $24,999 | 35 | 9.5% |
| $25,000 to $34,999 | 103 | 27.9% |
| $35,000 to $49,999 | 38 | 10.3% |
| $50,000 to $74,999 | 76 | 20.6% |
| $75,000 to $99,999 | 18 | 4.9% |
| $100,000 to $149,999 | 19 | 5.1% |
| $150,000 to $199,999 | 1 | 0.3% |
| $200,000+ | 12 | 3.3% |
Household Income by Householder Age in Grandfield
The median household income in Grandfield is $31,169, with the highest median household income of $58,828 found in the 25 to 44 years age bracket for the primary householder. A total of 85 households (23.0%) fall into this category. Meanwhile, the 15 to 24 years age bracket for the primary householder has the lowest median household income of $0, with 4 households (1.1%) in this group.
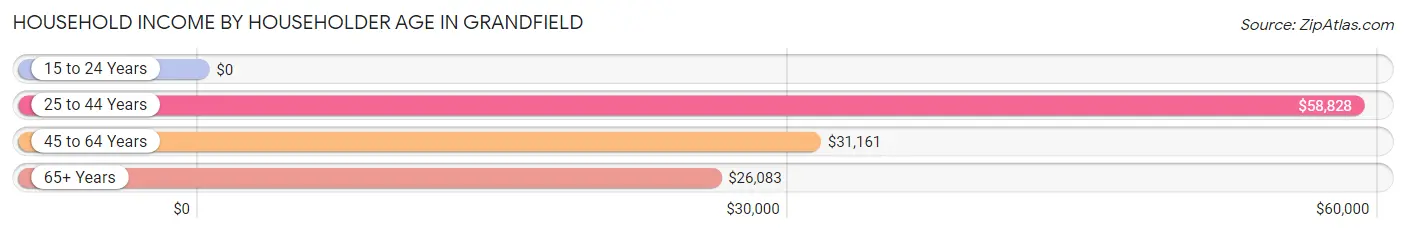
| Income Bracket | # Households | Median Income |
| 15 to 24 Years | 4 (1.1%) | $0 |
| 25 to 44 Years | 85 (23.0%) | $58,828 |
| 45 to 64 Years | 95 (25.8%) | $31,161 |
| 65+ Years | 185 (50.1%) | $26,083 |
| Total | 369 (100.0%) | $31,169 |
Poverty in Grandfield
Income Below Poverty by Sex and Age in Grandfield
With 10.5% poverty level for males and 24.7% for females among the residents of Grandfield, 18 to 24 year old males and under 5 year old females are the most vulnerable to poverty, with 1 males (25.0%) and 25 females (100.0%) in their respective age groups living below the poverty level.
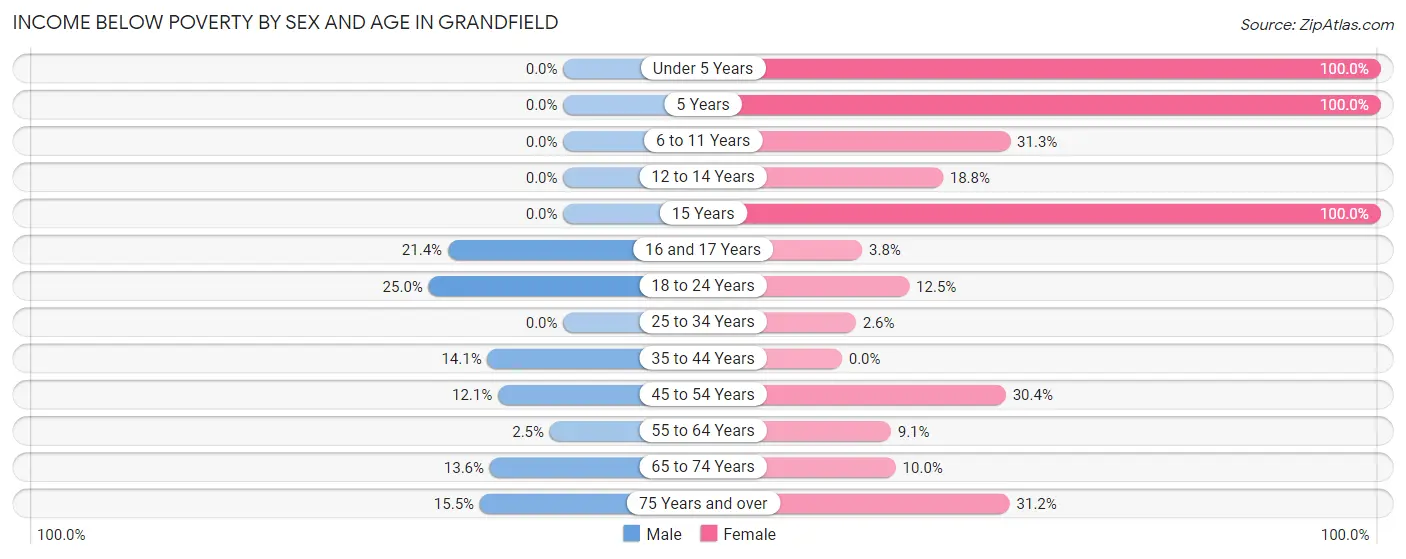
| Age Bracket | Male | Female |
| Under 5 Years | 0 (0.0%) | 25 (100.0%) |
| 5 Years | 0 (0.0%) | 16 (100.0%) |
| 6 to 11 Years | 0 (0.0%) | 20 (31.2%) |
| 12 to 14 Years | 0 (0.0%) | 9 (18.8%) |
| 15 Years | 0 (0.0%) | 19 (100.0%) |
| 16 and 17 Years | 3 (21.4%) | 2 (3.8%) |
| 18 to 24 Years | 1 (25.0%) | 3 (12.5%) |
| 25 to 34 Years | 0 (0.0%) | 2 (2.6%) |
| 35 to 44 Years | 10 (14.1%) | 0 (0.0%) |
| 45 to 54 Years | 4 (12.1%) | 14 (30.4%) |
| 55 to 64 Years | 1 (2.5%) | 3 (9.1%) |
| 65 to 74 Years | 9 (13.6%) | 2 (10.0%) |
| 75 Years and over | 11 (15.5%) | 19 (31.1%) |
| Total | 39 (10.5%) | 134 (24.7%) |
Income Above Poverty by Sex and Age in Grandfield
According to the poverty statistics in Grandfield, males aged under 5 years and females aged 35 to 44 years are the age groups that are most secure financially, with 100.0% of males and 100.0% of females in these age groups living above the poverty line.
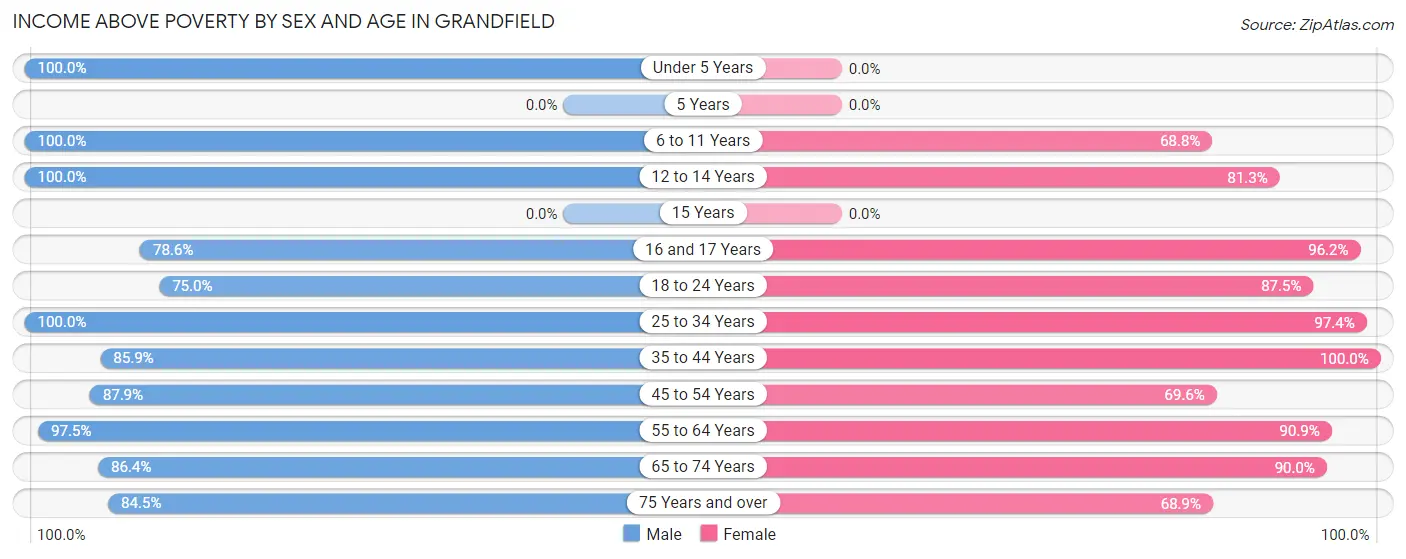
| Age Bracket | Male | Female |
| Under 5 Years | 4 (100.0%) | 0 (0.0%) |
| 5 Years | 0 (0.0%) | 0 (0.0%) |
| 6 to 11 Years | 23 (100.0%) | 44 (68.8%) |
| 12 to 14 Years | 18 (100.0%) | 39 (81.2%) |
| 15 Years | 0 (0.0%) | 0 (0.0%) |
| 16 and 17 Years | 11 (78.6%) | 51 (96.2%) |
| 18 to 24 Years | 3 (75.0%) | 21 (87.5%) |
| 25 to 34 Years | 26 (100.0%) | 75 (97.4%) |
| 35 to 44 Years | 61 (85.9%) | 56 (100.0%) |
| 45 to 54 Years | 29 (87.9%) | 32 (69.6%) |
| 55 to 64 Years | 39 (97.5%) | 30 (90.9%) |
| 65 to 74 Years | 57 (86.4%) | 18 (90.0%) |
| 75 Years and over | 60 (84.5%) | 42 (68.9%) |
| Total | 331 (89.5%) | 408 (75.3%) |
Income Below Poverty Among Married-Couple Families in Grandfield
The poverty statistics for married-couple families in Grandfield show that 2.0% or 2 of the total 101 families live below the poverty line. Families with no children have the highest poverty rate of 2.9%, comprising of 2 families. On the other hand, families with 1 or 2 children have the lowest poverty rate of 0.0%, which includes 0 families.
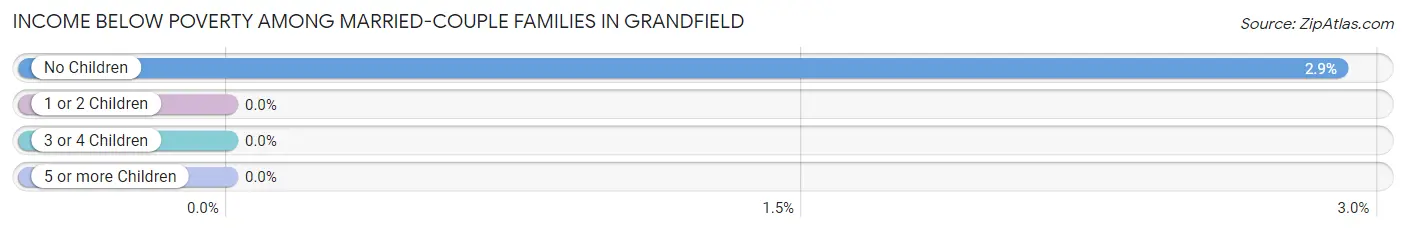
| Children | Above Poverty | Below Poverty |
| No Children | 67 (97.1%) | 2 (2.9%) |
| 1 or 2 Children | 29 (100.0%) | 0 (0.0%) |
| 3 or 4 Children | 3 (100.0%) | 0 (0.0%) |
| 5 or more Children | 0 (0.0%) | 0 (0.0%) |
| Total | 99 (98.0%) | 2 (2.0%) |
Income Below Poverty Among Single-Parent Households in Grandfield
According to the poverty data in Grandfield, 27.8% or 10 single-father households and 17.5% or 10 single-mother households are living below the poverty line. Among single-father households, those with 5 or more children have the highest poverty rate, with 4 households (100.0%) experiencing poverty. Likewise, among single-mother households, those with 3 or 4 children have the highest poverty rate, with 7 households (100.0%) falling below the poverty line.
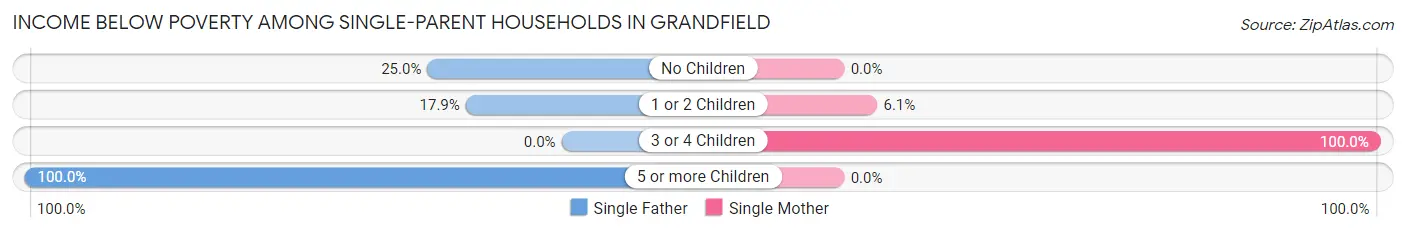
| Children | Single Father | Single Mother |
| No Children | 1 (25.0%) | 0 (0.0%) |
| 1 or 2 Children | 5 (17.9%) | 3 (6.1%) |
| 3 or 4 Children | 0 (0.0%) | 7 (100.0%) |
| 5 or more Children | 4 (100.0%) | 0 (0.0%) |
| Total | 10 (27.8%) | 10 (17.5%) |
Income Below Poverty Among Married-Couple vs Single-Parent Households in Grandfield
The poverty data for Grandfield shows that 2 of the married-couple family households (2.0%) and 20 of the single-parent households (21.5%) are living below the poverty level. Within the married-couple family households, those with no children have the highest poverty rate, with 2 households (2.9%) falling below the poverty line. Among the single-parent households, those with 3 or 4 children have the highest poverty rate, with 7 household (100.0%) living below poverty.
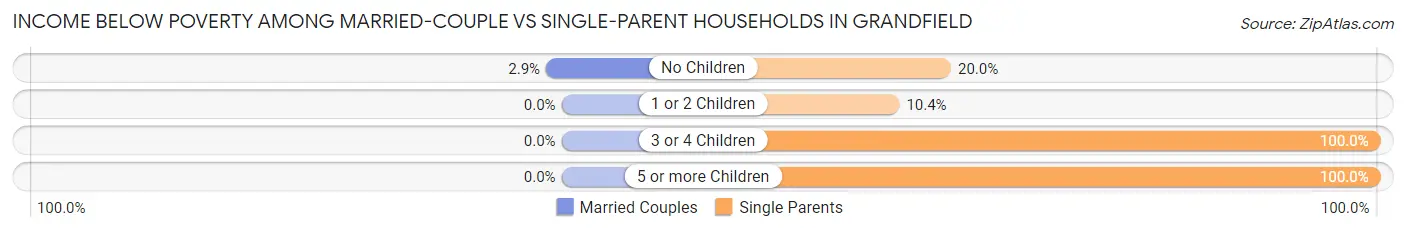
| Children | Married-Couple Families | Single-Parent Households |
| No Children | 2 (2.9%) | 1 (20.0%) |
| 1 or 2 Children | 0 (0.0%) | 8 (10.4%) |
| 3 or 4 Children | 0 (0.0%) | 7 (100.0%) |
| 5 or more Children | 0 (0.0%) | 4 (100.0%) |
| Total | 2 (2.0%) | 20 (21.5%) |
Race in Grandfield
The most populous races in Grandfield are White / Caucasian (551 | 60.4%), Hispanic or Latino (292 | 32.0%), and Some other Race (125 | 13.7%).
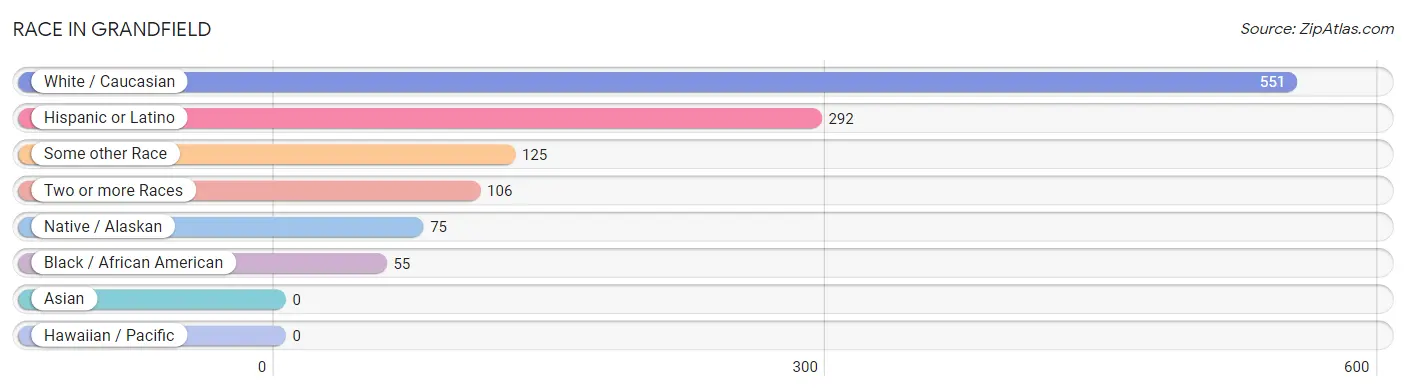
| Race | # Population | % Population |
| Asian | 0 | 0.0% |
| Black / African American | 55 | 6.0% |
| Hawaiian / Pacific | 0 | 0.0% |
| Hispanic or Latino | 292 | 32.0% |
| Native / Alaskan | 75 | 8.2% |
| White / Caucasian | 551 | 60.4% |
| Two or more Races | 106 | 11.6% |
| Some other Race | 125 | 13.7% |
| Total | 912 | 100.0% |
Ancestry in Grandfield
The most populous ancestries reported in Grandfield are Mexican (233 | 25.6%), Irish (139 | 15.2%), German (128 | 14.0%), English (114 | 12.5%), and Choctaw (73 | 8.0%), together accounting for 75.3% of all Grandfield residents.
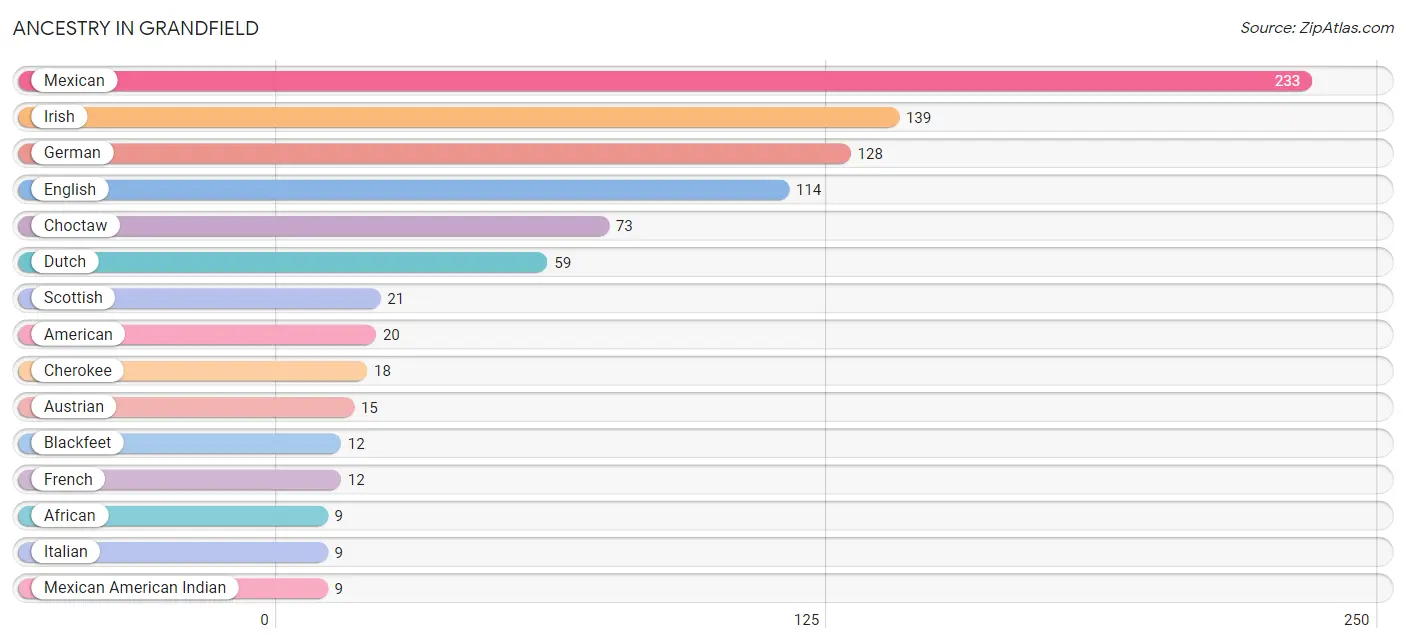
| Ancestry | # Population | % Population |
| African | 9 | 1.0% |
| American | 20 | 2.2% |
| Austrian | 15 | 1.6% |
| Blackfeet | 12 | 1.3% |
| British | 1 | 0.1% |
| Cherokee | 18 | 2.0% |
| Choctaw | 73 | 8.0% |
| Comanche | 6 | 0.7% |
| Creek | 1 | 0.1% |
| Dutch | 59 | 6.5% |
| English | 114 | 12.5% |
| European | 6 | 0.7% |
| French | 12 | 1.3% |
| French American Indian | 1 | 0.1% |
| German | 128 | 14.0% |
| Greek | 2 | 0.2% |
| Irish | 139 | 15.2% |
| Italian | 9 | 1.0% |
| Kiowa | 2 | 0.2% |
| Mexican | 233 | 25.6% |
| Mexican American Indian | 9 | 1.0% |
| Osage | 2 | 0.2% |
| Pakistani | 1 | 0.1% |
| Portuguese | 1 | 0.1% |
| Puerto Rican | 5 | 0.5% |
| Scotch-Irish | 2 | 0.2% |
| Scottish | 21 | 2.3% |
| Sioux | 2 | 0.2% |
| Subsaharan African | 9 | 1.0% | View All 29 Rows |
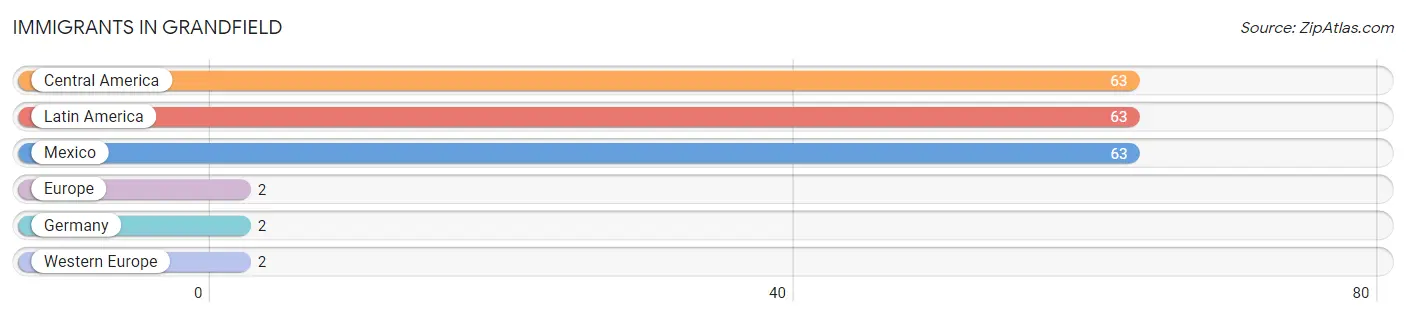
Immigrants in Grandfield
The most numerous immigrant groups reported in Grandfield came from Central America (63 | 6.9%), Latin America (63 | 6.9%), Mexico (63 | 6.9%), Europe (2 | 0.2%), and Germany (2 | 0.2%), together accounting for 21.2% of all Grandfield residents.
| Immigration Origin | # Population | % Population |
| Central America | 63 | 6.9% |
| Europe | 2 | 0.2% |
| Germany | 2 | 0.2% |
| Latin America | 63 | 6.9% |
| Mexico | 63 | 6.9% |
| Western Europe | 2 | 0.2% | View All 6 Rows |
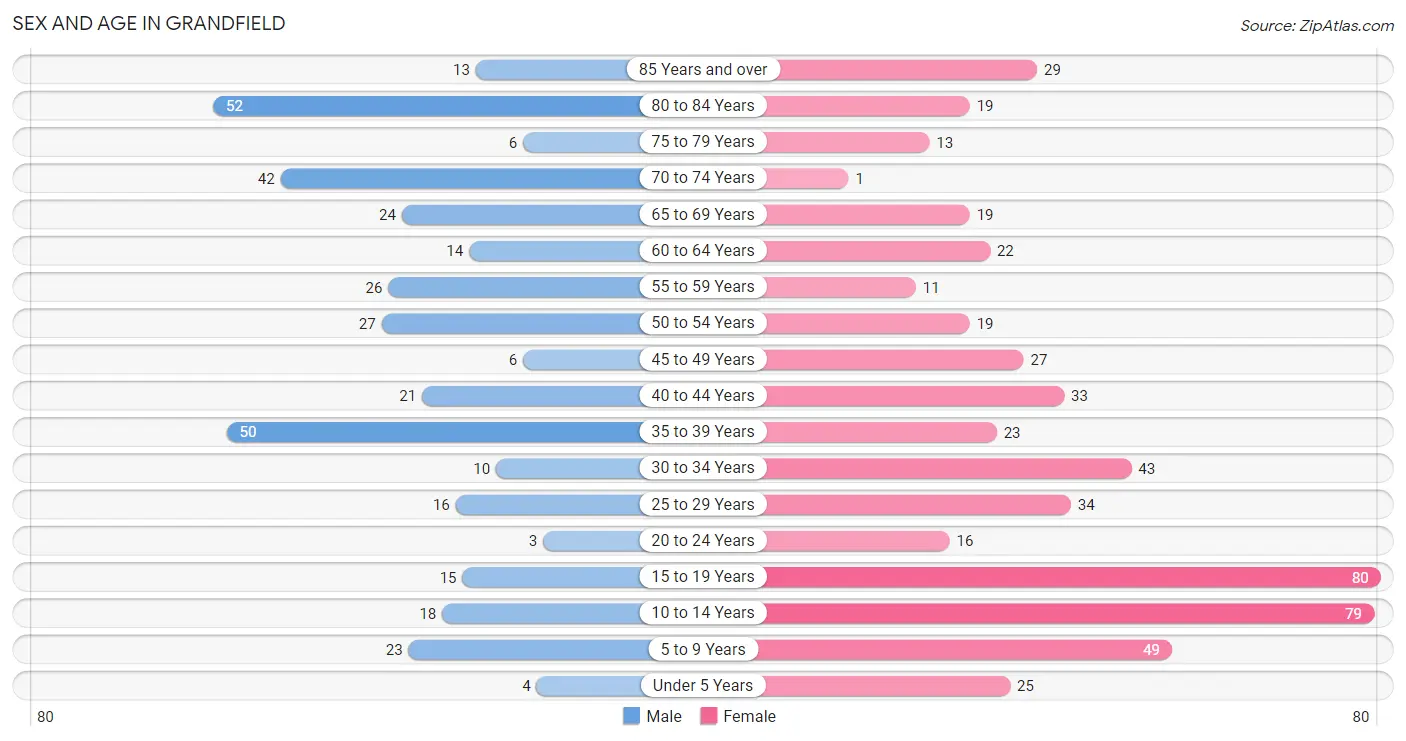
Sex and Age in Grandfield
Sex and Age in Grandfield
The most populous age groups in Grandfield are 80 to 84 Years (52 | 14.1%) for men and 15 to 19 Years (80 | 14.8%) for women.
| Age Bracket | Male | Female |
| Under 5 Years | 4 (1.1%) | 25 (4.6%) |
| 5 to 9 Years | 23 (6.2%) | 49 (9.0%) |
| 10 to 14 Years | 18 (4.9%) | 79 (14.6%) |
| 15 to 19 Years | 15 (4.1%) | 80 (14.8%) |
| 20 to 24 Years | 3 (0.8%) | 16 (2.9%) |
| 25 to 29 Years | 16 (4.3%) | 34 (6.3%) |
| 30 to 34 Years | 10 (2.7%) | 43 (7.9%) |
| 35 to 39 Years | 50 (13.5%) | 23 (4.2%) |
| 40 to 44 Years | 21 (5.7%) | 33 (6.1%) |
| 45 to 49 Years | 6 (1.6%) | 27 (5.0%) |
| 50 to 54 Years | 27 (7.3%) | 19 (3.5%) |
| 55 to 59 Years | 26 (7.0%) | 11 (2.0%) |
| 60 to 64 Years | 14 (3.8%) | 22 (4.1%) |
| 65 to 69 Years | 24 (6.5%) | 19 (3.5%) |
| 70 to 74 Years | 42 (11.4%) | 1 (0.2%) |
| 75 to 79 Years | 6 (1.6%) | 13 (2.4%) |
| 80 to 84 Years | 52 (14.1%) | 19 (3.5%) |
| 85 Years and over | 13 (3.5%) | 29 (5.3%) |
| Total | 370 (100.0%) | 542 (100.0%) |
Families and Households in Grandfield
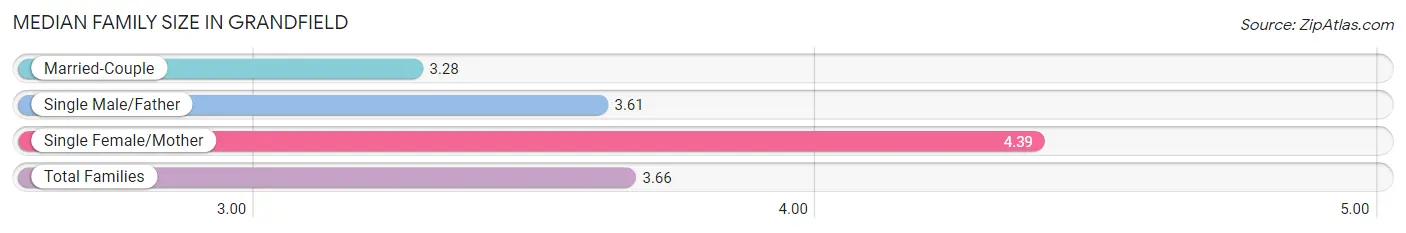
Median Family Size in Grandfield
The median family size in Grandfield is 3.66 persons per family, with single female/mother families (57 | 29.4%) accounting for the largest median family size of 4.39 persons per family. On the other hand, married-couple families (101 | 52.1%) represent the smallest median family size with 3.28 persons per family.
| Family Type | # Families | Family Size |
| Married-Couple | 101 (52.1%) | 3.28 |
| Single Male/Father | 36 (18.6%) | 3.61 |
| Single Female/Mother | 57 (29.4%) | 4.39 |
| Total Families | 194 (100.0%) | 3.66 |
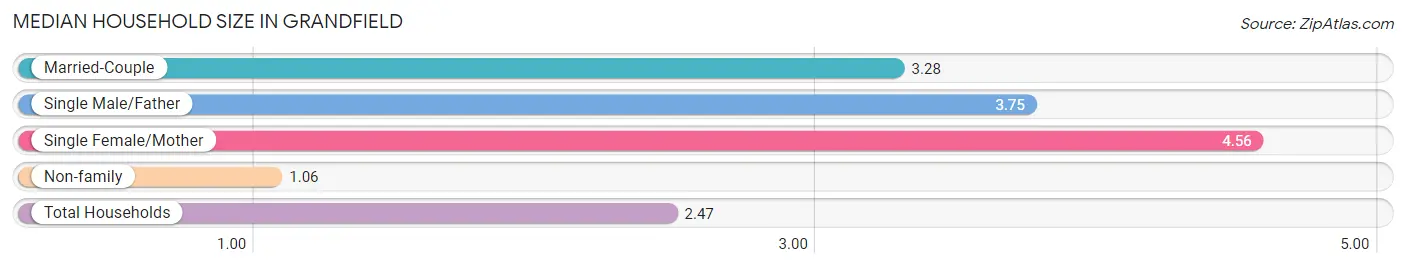
Median Household Size in Grandfield
The median household size in Grandfield is 2.47 persons per household, with single female/mother households (57 | 15.4%) accounting for the largest median household size of 4.56 persons per household. non-family households (175 | 47.4%) represent the smallest median household size with 1.06 persons per household.
| Household Type | # Households | Household Size |
| Married-Couple | 101 (27.4%) | 3.28 |
| Single Male/Father | 36 (9.8%) | 3.75 |
| Single Female/Mother | 57 (15.4%) | 4.56 |
| Non-family | 175 (47.4%) | 1.06 |
| Total Households | 369 (100.0%) | 2.47 |
Household Size by Marriage Status in Grandfield
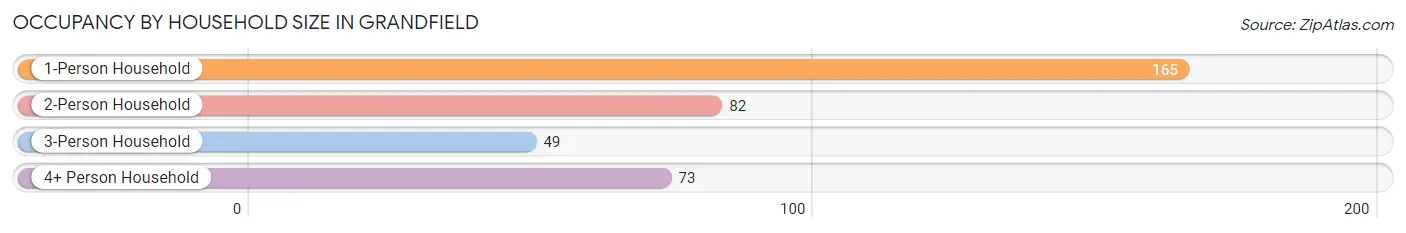
Out of a total of 369 households in Grandfield, 194 (52.6%) are family households, while 175 (47.4%) are nonfamily households. The most numerous type of family households are 2-person households, comprising 72, and the most common type of nonfamily households are 1-person households, comprising 165.
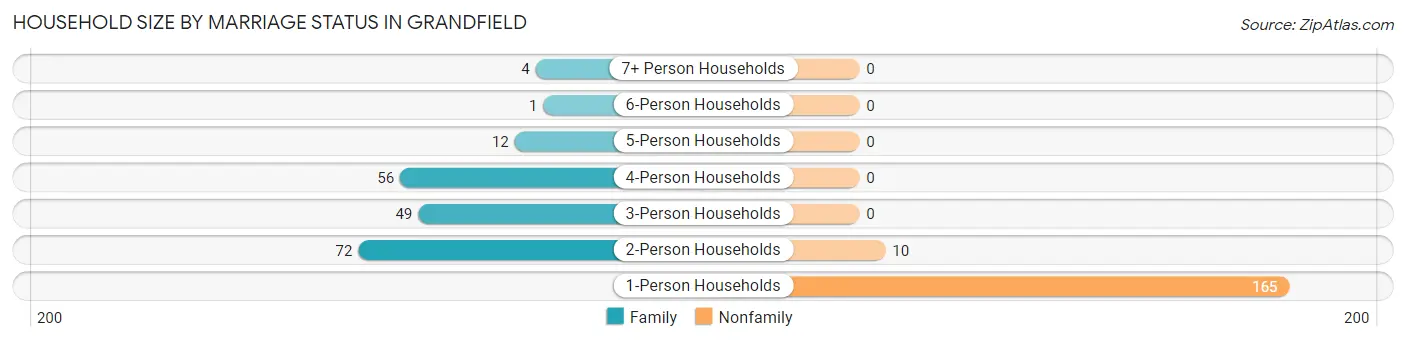
| Household Size | Family Households | Nonfamily Households |
| 1-Person Households | - | 165 (44.7%) |
| 2-Person Households | 72 (19.5%) | 10 (2.7%) |
| 3-Person Households | 49 (13.3%) | 0 (0.0%) |
| 4-Person Households | 56 (15.2%) | 0 (0.0%) |
| 5-Person Households | 12 (3.3%) | 0 (0.0%) |
| 6-Person Households | 1 (0.3%) | 0 (0.0%) |
| 7+ Person Households | 4 (1.1%) | 0 (0.0%) |
| Total | 194 (52.6%) | 175 (47.4%) |
Female Fertility in Grandfield
Fertility by Age in Grandfield
Average fertility rate in Grandfield is 23.0 births per 1,000 women. Women in the age bracket of 35 to 50 years have the highest fertility rate with 59.0 births per 1,000 women. Women in the age bracket of 35 to 50 years acount for 83.3% of all women with births.
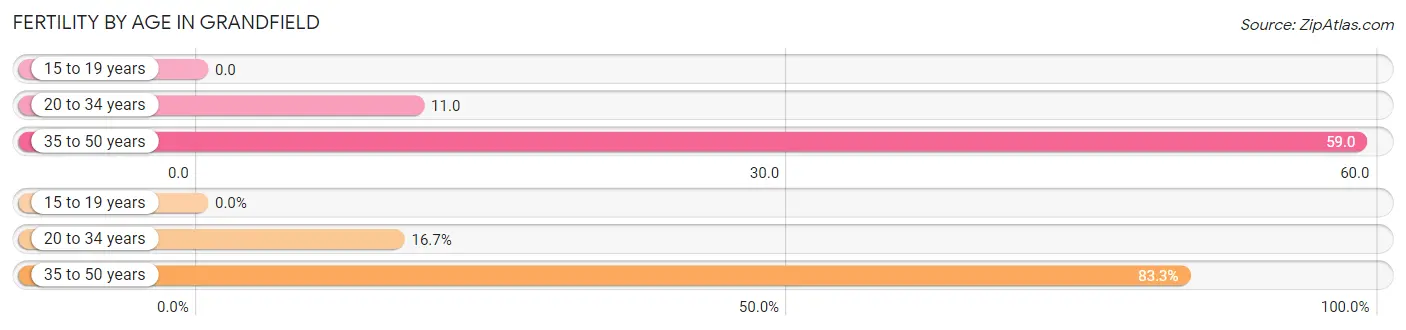
| Age Bracket | Women with Births | Births / 1,000 Women |
| 15 to 19 years | 0 (0.0%) | 0.0 |
| 20 to 34 years | 1 (16.7%) | 11.0 |
| 35 to 50 years | 5 (83.3%) | 59.0 |
| Total | 6 (100.0%) | 23.0 |
Fertility by Age by Marriage Status in Grandfield
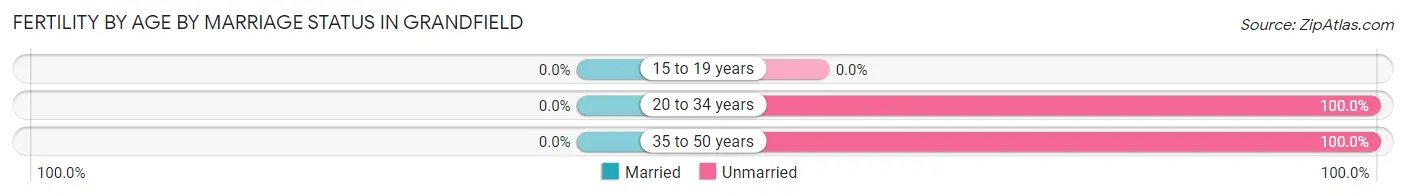
| Age Bracket | Married | Unmarried |
| 15 to 19 years | 0 (0.0%) | 0 (0.0%) |
| 20 to 34 years | 0 (0.0%) | 1 (100.0%) |
| 35 to 50 years | 0 (0.0%) | 5 (100.0%) |
| Total | 0 (0.0%) | 6 (100.0%) |
Fertility by Education in Grandfield
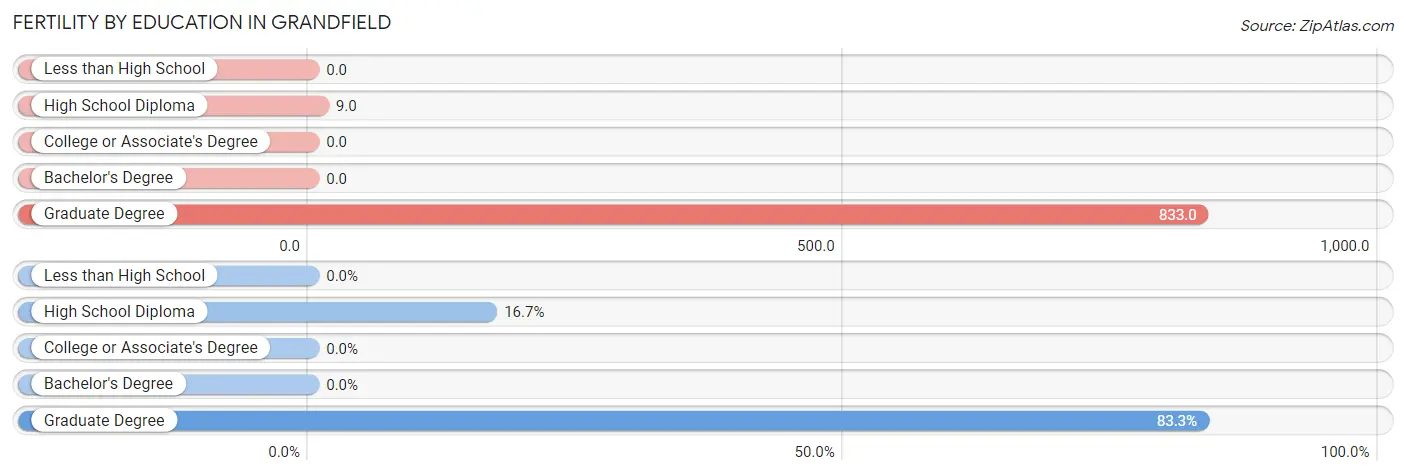
| Educational Attainment | Women with Births | Births / 1,000 Women |
| Less than High School | 0 (0.0%) | 0.0 |
| High School Diploma | 1 (16.7%) | 9.0 |
| College or Associate's Degree | 0 (0.0%) | 0.0 |
| Bachelor's Degree | 0 (0.0%) | 0.0 |
| Graduate Degree | 5 (83.3%) | 833.0 |
| Total | 6 (100.0%) | 23.0 |
Fertility by Education by Marriage Status in Grandfield
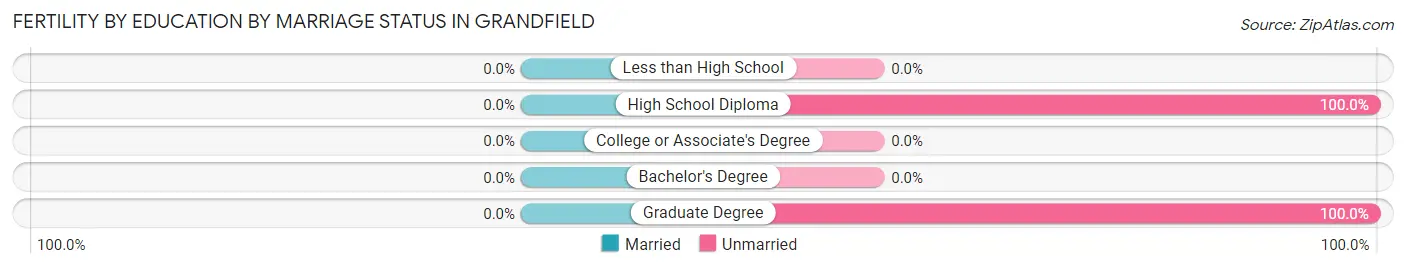
| Educational Attainment | Married | Unmarried |
| Less than High School | 0 (0.0%) | 0 (0.0%) |
| High School Diploma | 0 (0.0%) | 1 (100.0%) |
| College or Associate's Degree | 0 (0.0%) | 0 (0.0%) |
| Bachelor's Degree | 0 (0.0%) | 0 (0.0%) |
| Graduate Degree | 0 (0.0%) | 5 (100.0%) |
| Total | 0 (0.0%) | 6 (100.0%) |
Employment Characteristics in Grandfield
Employment by Class of Employer in Grandfield
Among the 283 employed individuals in Grandfield, private company employees (204 | 72.1%), state government employees (21 | 7.4%), and not-for-profit organizations (17 | 6.0%) make up the most common classes of employment.
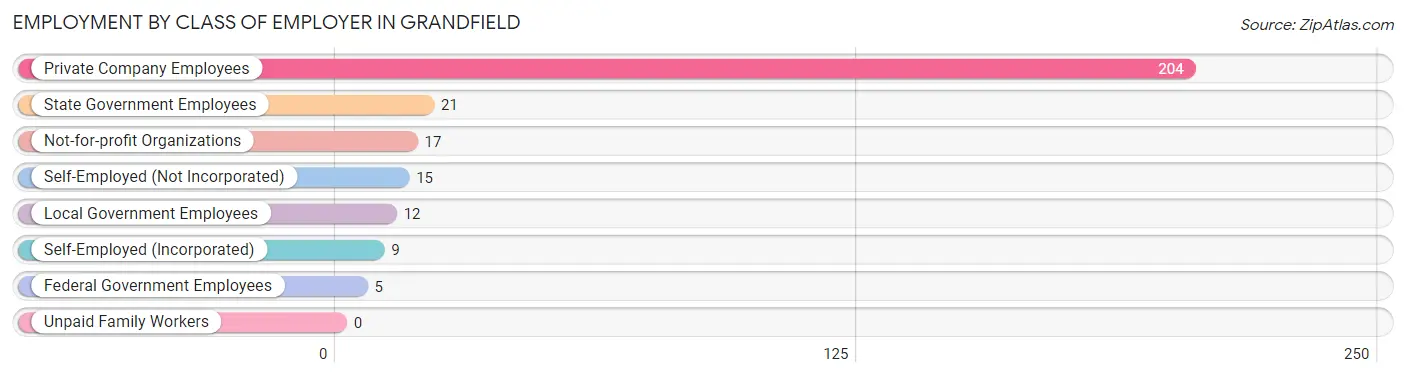
| Employer Class | # Employees | % Employees |
| Private Company Employees | 204 | 72.1% |
| Self-Employed (Incorporated) | 9 | 3.2% |
| Self-Employed (Not Incorporated) | 15 | 5.3% |
| Not-for-profit Organizations | 17 | 6.0% |
| Local Government Employees | 12 | 4.2% |
| State Government Employees | 21 | 7.4% |
| Federal Government Employees | 5 | 1.8% |
| Unpaid Family Workers | 0 | 0.0% |
| Total | 283 | 100.0% |
Employment Status by Age in Grandfield
According to the labor force statistics for Grandfield, out of the total population over 16 years of age (695), 47.2% or 328 individuals are in the labor force, with 10.7% or 35 of them unemployed. The age group with the highest labor force participation rate is 30 to 34 years, with 100.0% or 53 individuals in the labor force. Within the labor force, the 35 to 44 years age range has the highest percentage of unemployed individuals, with 28.2% or 24 of them being unemployed.
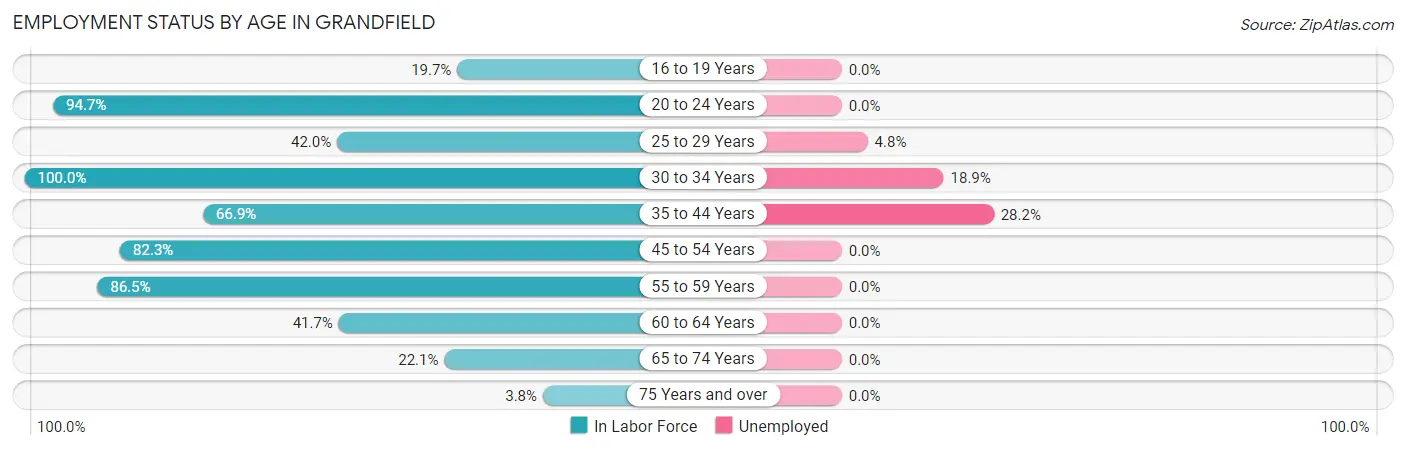
| Age Bracket | In Labor Force | Unemployed |
| 16 to 19 Years | 15 (19.7%) | 0 (0.0%) |
| 20 to 24 Years | 18 (94.7%) | 0 (0.0%) |
| 25 to 29 Years | 21 (42.0%) | 1 (4.8%) |
| 30 to 34 Years | 53 (100.0%) | 10 (18.9%) |
| 35 to 44 Years | 85 (66.9%) | 24 (28.2%) |
| 45 to 54 Years | 65 (82.3%) | 0 (0.0%) |
| 55 to 59 Years | 32 (86.5%) | 0 (0.0%) |
| 60 to 64 Years | 15 (41.7%) | 0 (0.0%) |
| 65 to 74 Years | 19 (22.1%) | 0 (0.0%) |
| 75 Years and over | 5 (3.8%) | 0 (0.0%) |
| Total | 328 (47.2%) | 35 (10.7%) |
Employment Status by Educational Attainment in Grandfield
According to labor force statistics for Grandfield, 70.9% of individuals (271) out of the total population between 25 and 64 years of age (382) are in the labor force, with 12.9% or 35 of them being unemployed. The group with the highest labor force participation rate are those with the educational attainment of bachelor's degree or higher, with 95.7% or 44 individuals in the labor force. Within the labor force, individuals with college / associate degree education have the highest percentage of unemployment, with 37.3% or 25 of them being unemployed.
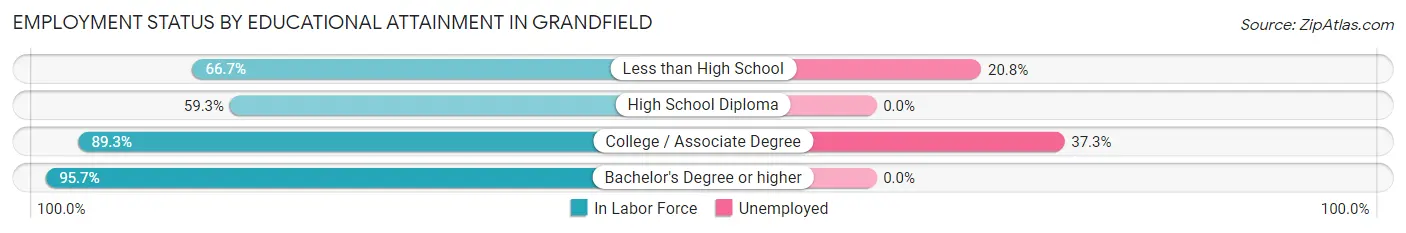
| Educational Attainment | In Labor Force | Unemployed |
| Less than High School | 48 (66.7%) | 15 (20.8%) |
| High School Diploma | 112 (59.3%) | 0 (0.0%) |
| College / Associate Degree | 67 (89.3%) | 28 (37.3%) |
| Bachelor's Degree or higher | 44 (95.7%) | 0 (0.0%) |
| Total | 271 (70.9%) | 49 (12.9%) |
Employment Occupations by Sex in Grandfield
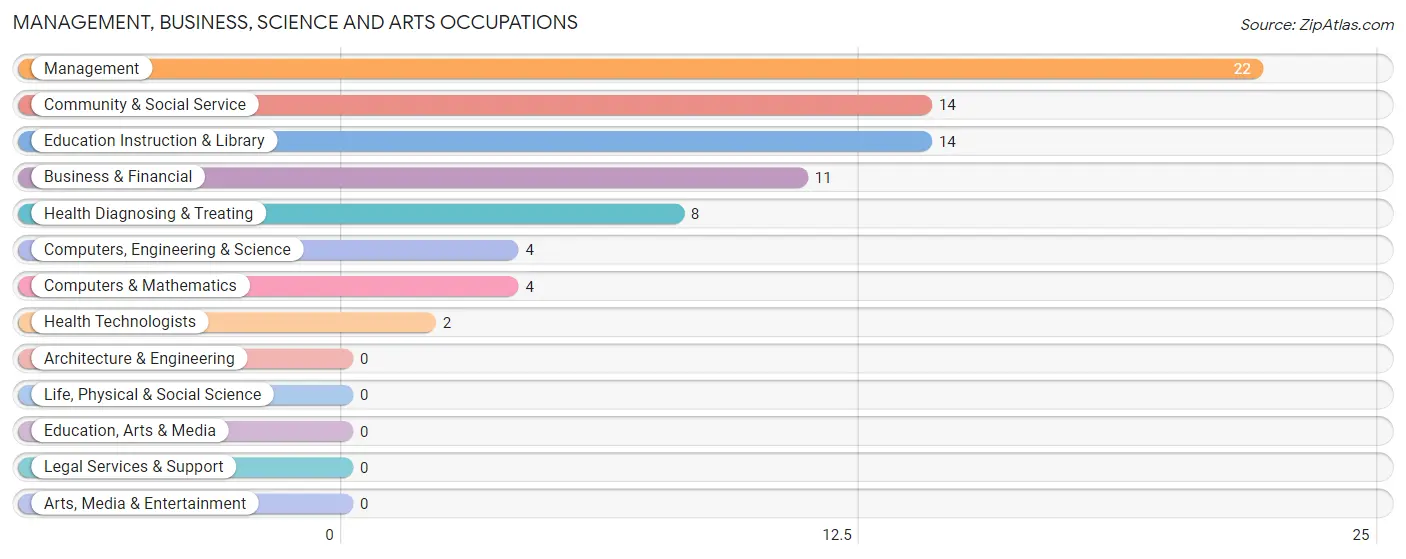
Management, Business, Science and Arts Occupations
The most common Management, Business, Science and Arts occupations in Grandfield are Management (22 | 7.5%), Community & Social Service (14 | 4.8%), Education Instruction & Library (14 | 4.8%), Business & Financial (11 | 3.7%), and Health Diagnosing & Treating (8 | 2.7%).
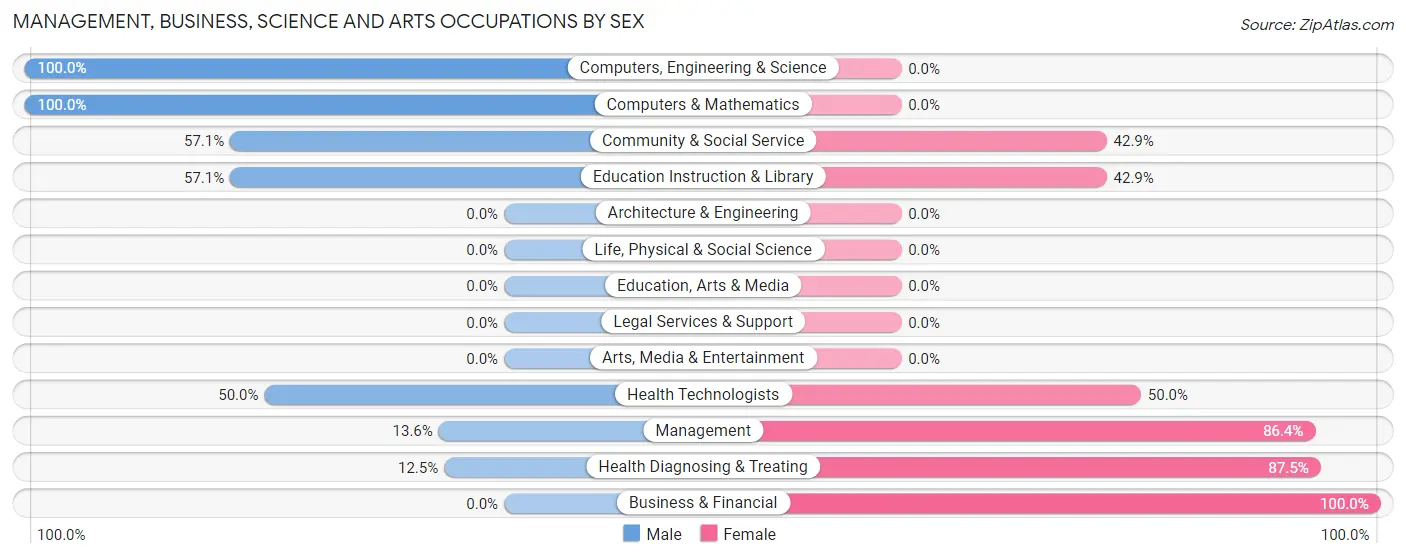
Management, Business, Science and Arts Occupations by Sex
Within the Management, Business, Science and Arts occupations in Grandfield, the most male-oriented occupations are Computers, Engineering & Science (100.0%), Computers & Mathematics (100.0%), and Community & Social Service (57.1%), while the most female-oriented occupations are Business & Financial (100.0%), Health Diagnosing & Treating (87.5%), and Management (86.4%).
| Occupation | Male | Female |
| Management | 3 (13.6%) | 19 (86.4%) |
| Business & Financial | 0 (0.0%) | 11 (100.0%) |
| Computers, Engineering & Science | 4 (100.0%) | 0 (0.0%) |
| Computers & Mathematics | 4 (100.0%) | 0 (0.0%) |
| Architecture & Engineering | 0 (0.0%) | 0 (0.0%) |
| Life, Physical & Social Science | 0 (0.0%) | 0 (0.0%) |
| Community & Social Service | 8 (57.1%) | 6 (42.9%) |
| Education, Arts & Media | 0 (0.0%) | 0 (0.0%) |
| Legal Services & Support | 0 (0.0%) | 0 (0.0%) |
| Education Instruction & Library | 8 (57.1%) | 6 (42.9%) |
| Arts, Media & Entertainment | 0 (0.0%) | 0 (0.0%) |
| Health Diagnosing & Treating | 1 (12.5%) | 7 (87.5%) |
| Health Technologists | 1 (50.0%) | 1 (50.0%) |
| Total (Category) | 16 (27.1%) | 43 (72.9%) |
| Total (Overall) | 126 (43.0%) | 167 (57.0%) |
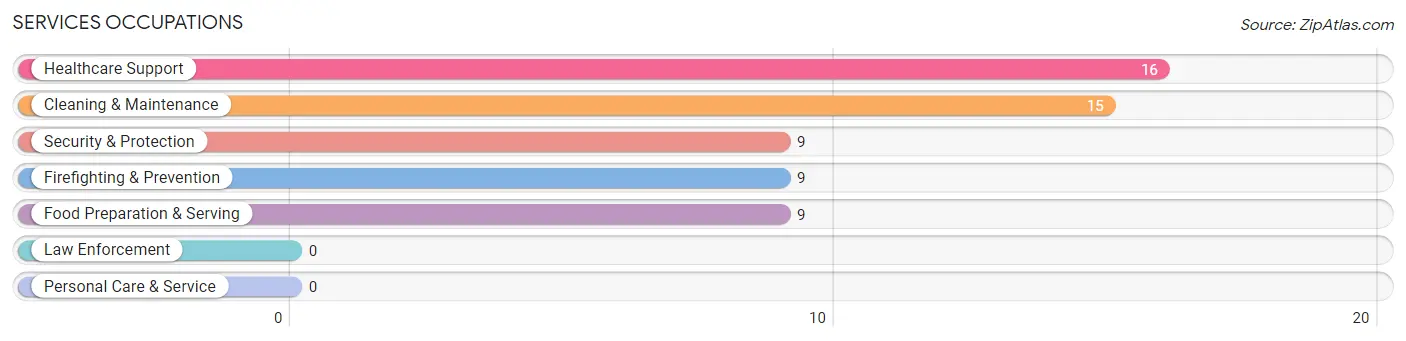
Services Occupations
The most common Services occupations in Grandfield are Healthcare Support (16 | 5.5%), Cleaning & Maintenance (15 | 5.1%), Security & Protection (9 | 3.1%), Firefighting & Prevention (9 | 3.1%), and Food Preparation & Serving (9 | 3.1%).
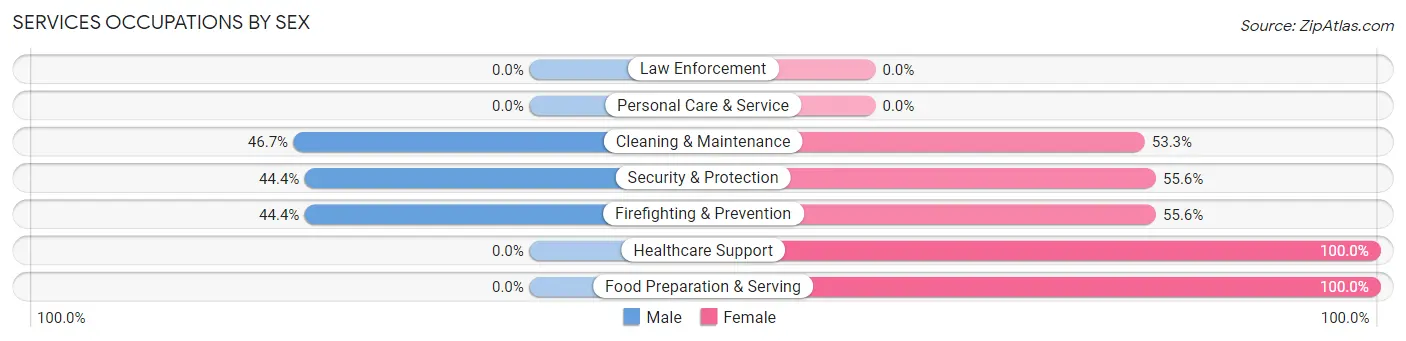
Services Occupations by Sex
Within the Services occupations in Grandfield, the most male-oriented occupations are Cleaning & Maintenance (46.7%), Security & Protection (44.4%), and Firefighting & Prevention (44.4%), while the most female-oriented occupations are Healthcare Support (100.0%), Food Preparation & Serving (100.0%), and Security & Protection (55.6%).
| Occupation | Male | Female |
| Healthcare Support | 0 (0.0%) | 16 (100.0%) |
| Security & Protection | 4 (44.4%) | 5 (55.6%) |
| Firefighting & Prevention | 4 (44.4%) | 5 (55.6%) |
| Law Enforcement | 0 (0.0%) | 0 (0.0%) |
| Food Preparation & Serving | 0 (0.0%) | 9 (100.0%) |
| Cleaning & Maintenance | 7 (46.7%) | 8 (53.3%) |
| Personal Care & Service | 0 (0.0%) | 0 (0.0%) |
| Total (Category) | 11 (22.5%) | 38 (77.5%) |
| Total (Overall) | 126 (43.0%) | 167 (57.0%) |
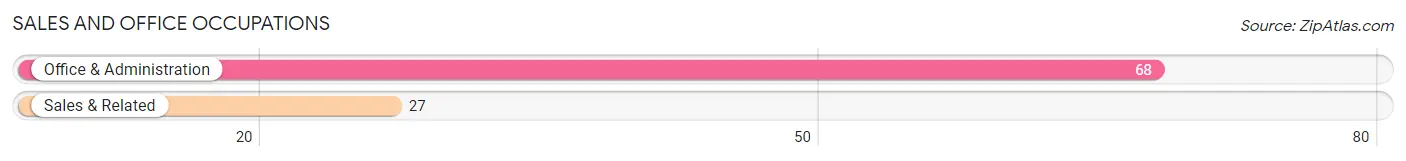
Sales and Office Occupations
The most common Sales and Office occupations in Grandfield are Office & Administration (68 | 23.2%), and Sales & Related (27 | 9.2%).
Sales and Office Occupations by Sex
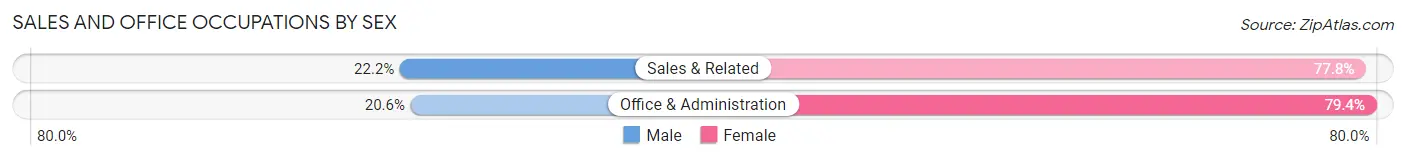
| Occupation | Male | Female |
| Sales & Related | 6 (22.2%) | 21 (77.8%) |
| Office & Administration | 14 (20.6%) | 54 (79.4%) |
| Total (Category) | 20 (21.0%) | 75 (78.9%) |
| Total (Overall) | 126 (43.0%) | 167 (57.0%) |
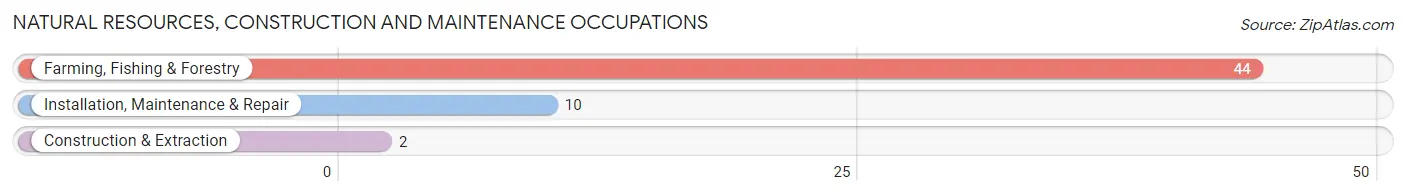
Natural Resources, Construction and Maintenance Occupations
The most common Natural Resources, Construction and Maintenance occupations in Grandfield are Farming, Fishing & Forestry (44 | 15.0%), Installation, Maintenance & Repair (10 | 3.4%), and Construction & Extraction (2 | 0.7%).
Natural Resources, Construction and Maintenance Occupations by Sex
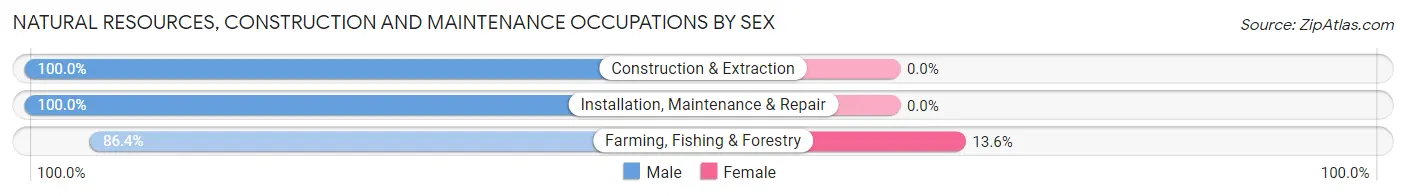
| Occupation | Male | Female |
| Farming, Fishing & Forestry | 38 (86.4%) | 6 (13.6%) |
| Construction & Extraction | 2 (100.0%) | 0 (0.0%) |
| Installation, Maintenance & Repair | 10 (100.0%) | 0 (0.0%) |
| Total (Category) | 50 (89.3%) | 6 (10.7%) |
| Total (Overall) | 126 (43.0%) | 167 (57.0%) |
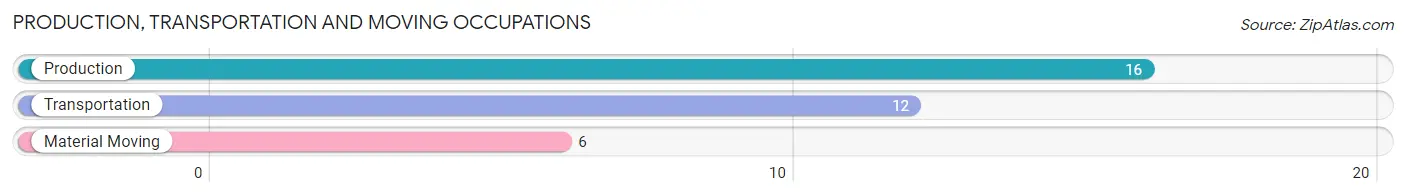
Production, Transportation and Moving Occupations
The most common Production, Transportation and Moving occupations in Grandfield are Production (16 | 5.5%), Transportation (12 | 4.1%), and Material Moving (6 | 2.1%).
Production, Transportation and Moving Occupations by Sex
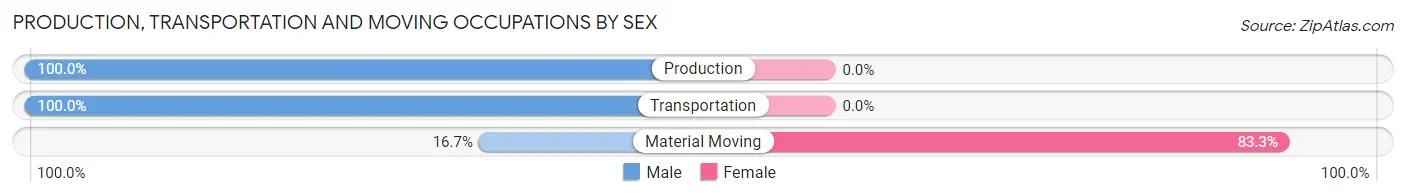
| Occupation | Male | Female |
| Production | 16 (100.0%) | 0 (0.0%) |
| Transportation | 12 (100.0%) | 0 (0.0%) |
| Material Moving | 1 (16.7%) | 5 (83.3%) |
| Total (Category) | 29 (85.3%) | 5 (14.7%) |
| Total (Overall) | 126 (43.0%) | 167 (57.0%) |
Employment Industries by Sex in Grandfield
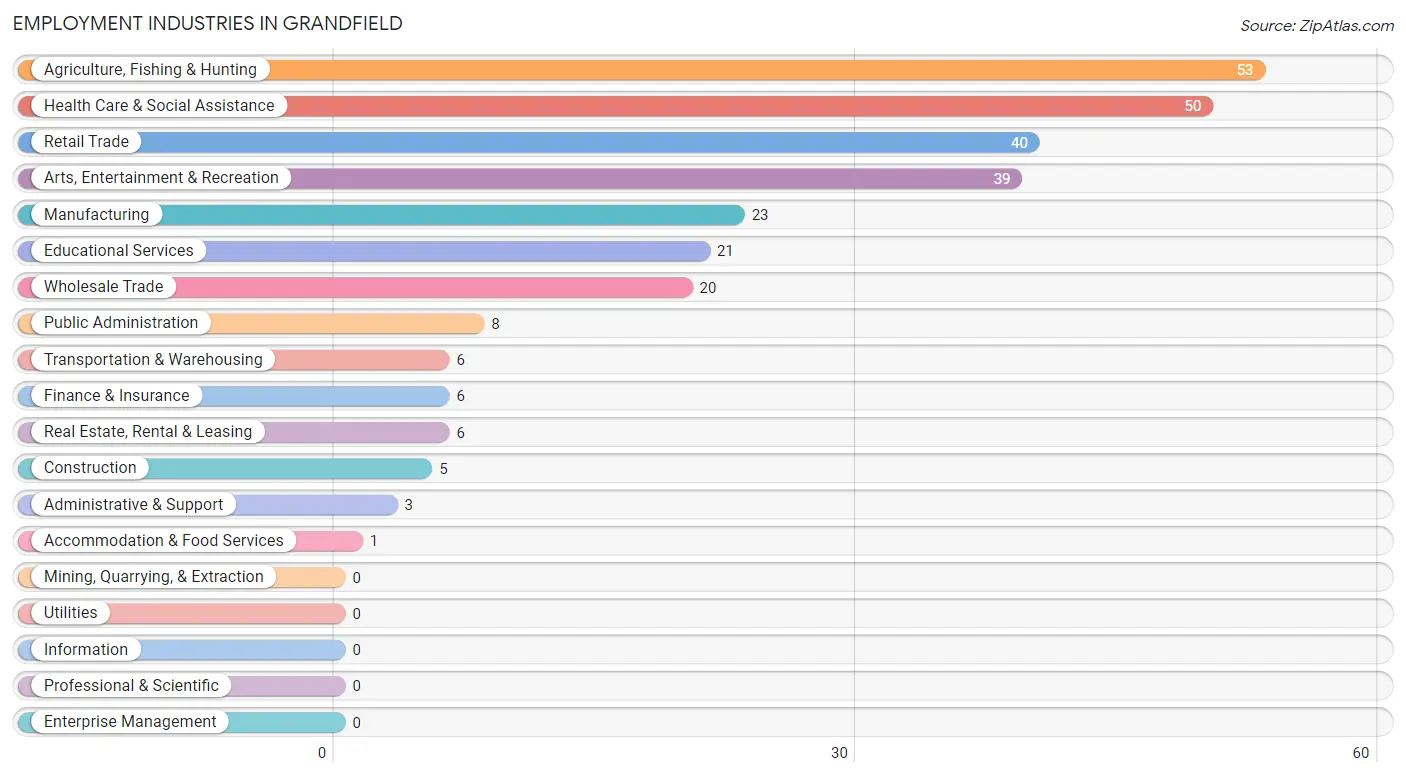
Employment Industries in Grandfield
The major employment industries in Grandfield include Agriculture, Fishing & Hunting (53 | 18.1%), Health Care & Social Assistance (50 | 17.1%), Retail Trade (40 | 13.7%), Arts, Entertainment & Recreation (39 | 13.3%), and Manufacturing (23 | 7.9%).
Employment Industries by Sex in Grandfield
The Grandfield industries that see more men than women are Construction (100.0%), Transportation & Warehousing (100.0%), and Real Estate, Rental & Leasing (100.0%), whereas the industries that tend to have a higher number of women are Finance & Insurance (100.0%), Health Care & Social Assistance (100.0%), and Accommodation & Food Services (100.0%).
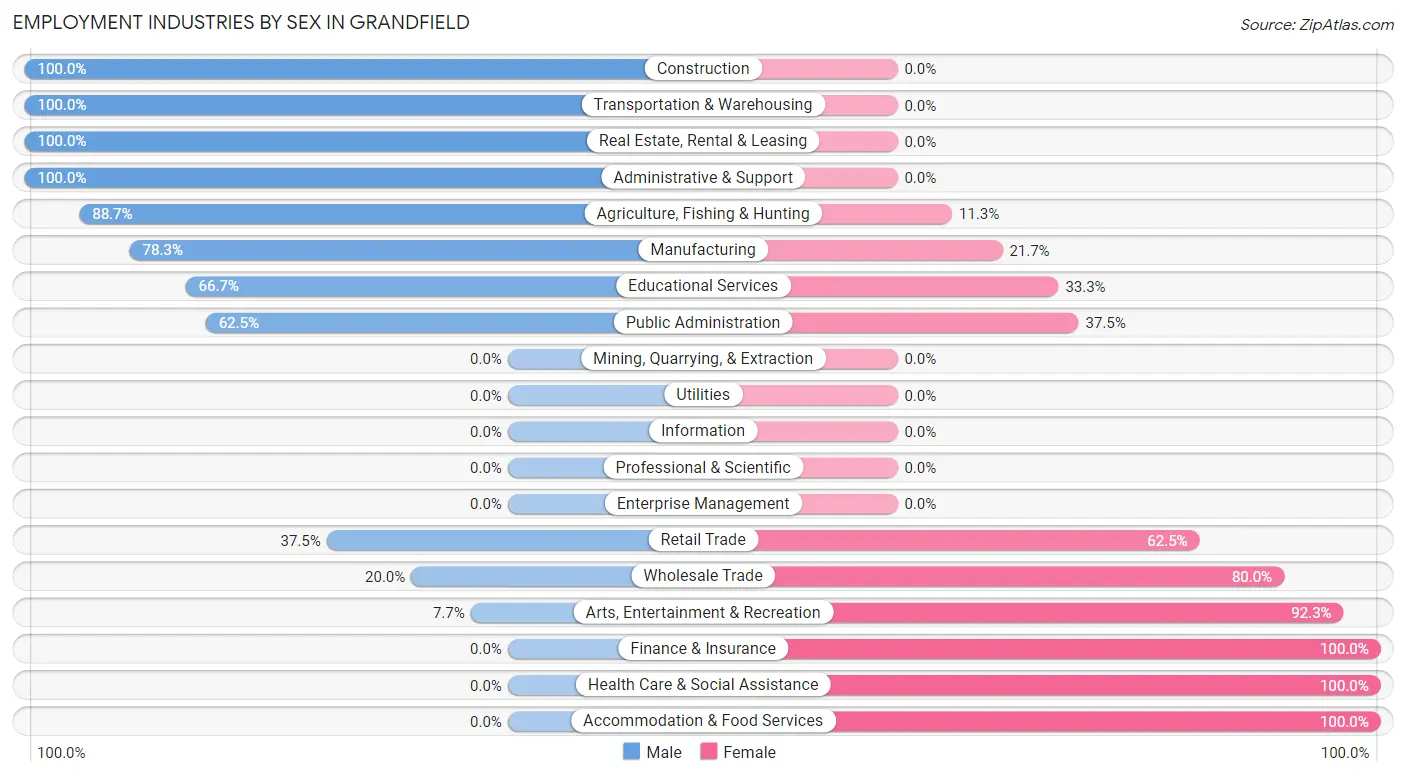
| Industry | Male | Female |
| Agriculture, Fishing & Hunting | 47 (88.7%) | 6 (11.3%) |
| Mining, Quarrying, & Extraction | 0 (0.0%) | 0 (0.0%) |
| Construction | 5 (100.0%) | 0 (0.0%) |
| Manufacturing | 18 (78.3%) | 5 (21.7%) |
| Wholesale Trade | 4 (20.0%) | 16 (80.0%) |
| Retail Trade | 15 (37.5%) | 25 (62.5%) |
| Transportation & Warehousing | 6 (100.0%) | 0 (0.0%) |
| Utilities | 0 (0.0%) | 0 (0.0%) |
| Information | 0 (0.0%) | 0 (0.0%) |
| Finance & Insurance | 0 (0.0%) | 6 (100.0%) |
| Real Estate, Rental & Leasing | 6 (100.0%) | 0 (0.0%) |
| Professional & Scientific | 0 (0.0%) | 0 (0.0%) |
| Enterprise Management | 0 (0.0%) | 0 (0.0%) |
| Administrative & Support | 3 (100.0%) | 0 (0.0%) |
| Educational Services | 14 (66.7%) | 7 (33.3%) |
| Health Care & Social Assistance | 0 (0.0%) | 50 (100.0%) |
| Arts, Entertainment & Recreation | 3 (7.7%) | 36 (92.3%) |
| Accommodation & Food Services | 0 (0.0%) | 1 (100.0%) |
| Public Administration | 5 (62.5%) | 3 (37.5%) |
| Total | 126 (43.0%) | 167 (57.0%) |
Education in Grandfield
School Enrollment in Grandfield
The most common levels of schooling among the 249 students in Grandfield are high school (94 | 37.8%), middle school (87 | 34.9%), and elementary school (43 | 17.3%).
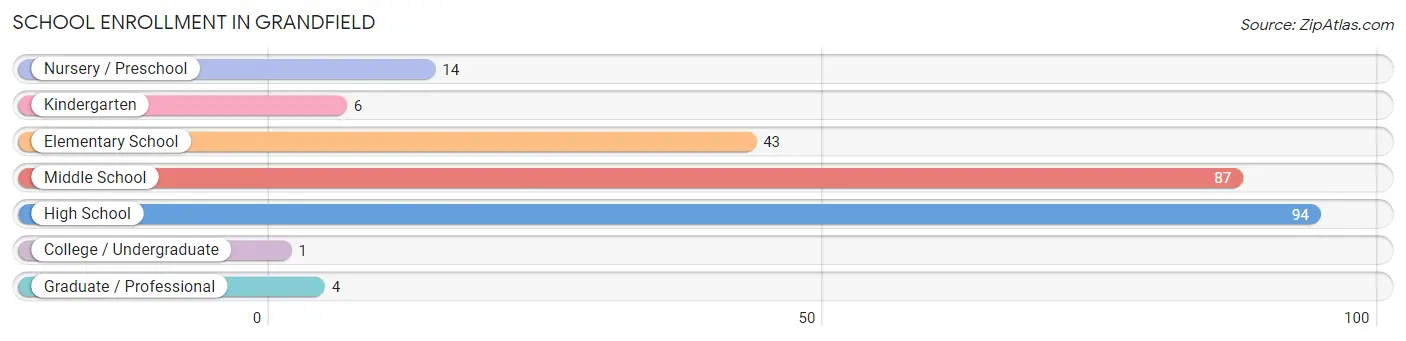
| School Level | # Students | % Students |
| Nursery / Preschool | 14 | 5.6% |
| Kindergarten | 6 | 2.4% |
| Elementary School | 43 | 17.3% |
| Middle School | 87 | 34.9% |
| High School | 94 | 37.8% |
| College / Undergraduate | 1 | 0.4% |
| Graduate / Professional | 4 | 1.6% |
| Total | 249 | 100.0% |
School Enrollment by Age by Funding Source in Grandfield
Out of a total of 249 students who are enrolled in schools in Grandfield, 9 (3.6%) attend a private institution, while the remaining 240 (96.4%) are enrolled in public schools. The age group of 10 to 14 year olds has the highest likelihood of being enrolled in private schools, with 9 (9.3% in the age bracket) enrolled. Conversely, the age group of 5 to 9 year old has the lowest likelihood of being enrolled in a private school, with 63 (100.0% in the age bracket) attending a public institution.
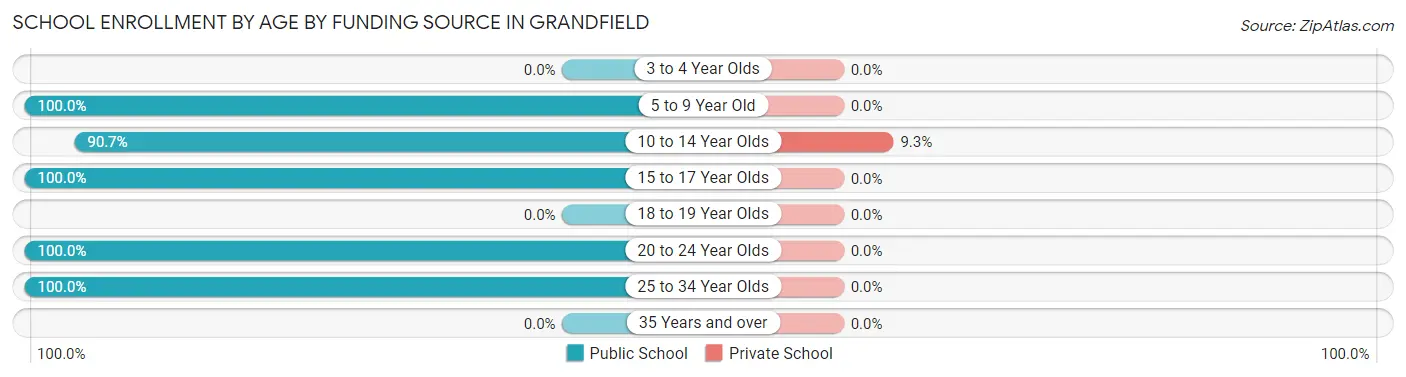
| Age Bracket | Public School | Private School |
| 3 to 4 Year Olds | 0 (0.0%) | 0 (0.0%) |
| 5 to 9 Year Old | 63 (100.0%) | 0 (0.0%) |
| 10 to 14 Year Olds | 88 (90.7%) | 9 (9.3%) |
| 15 to 17 Year Olds | 84 (100.0%) | 0 (0.0%) |
| 18 to 19 Year Olds | 0 (0.0%) | 0 (0.0%) |
| 20 to 24 Year Olds | 3 (100.0%) | 0 (0.0%) |
| 25 to 34 Year Olds | 2 (100.0%) | 0 (0.0%) |
| 35 Years and over | 0 (0.0%) | 0 (0.0%) |
| Total | 240 (96.4%) | 9 (3.6%) |
Educational Attainment by Field of Study in Grandfield
Business (32 | 27.6%), engineering (29 | 25.0%), education (17 | 14.7%), science & technology (11 | 9.5%), and bio, nature & agricultural (10 | 8.6%) are the most common fields of study among 116 individuals in Grandfield who have obtained a bachelor's degree or higher.
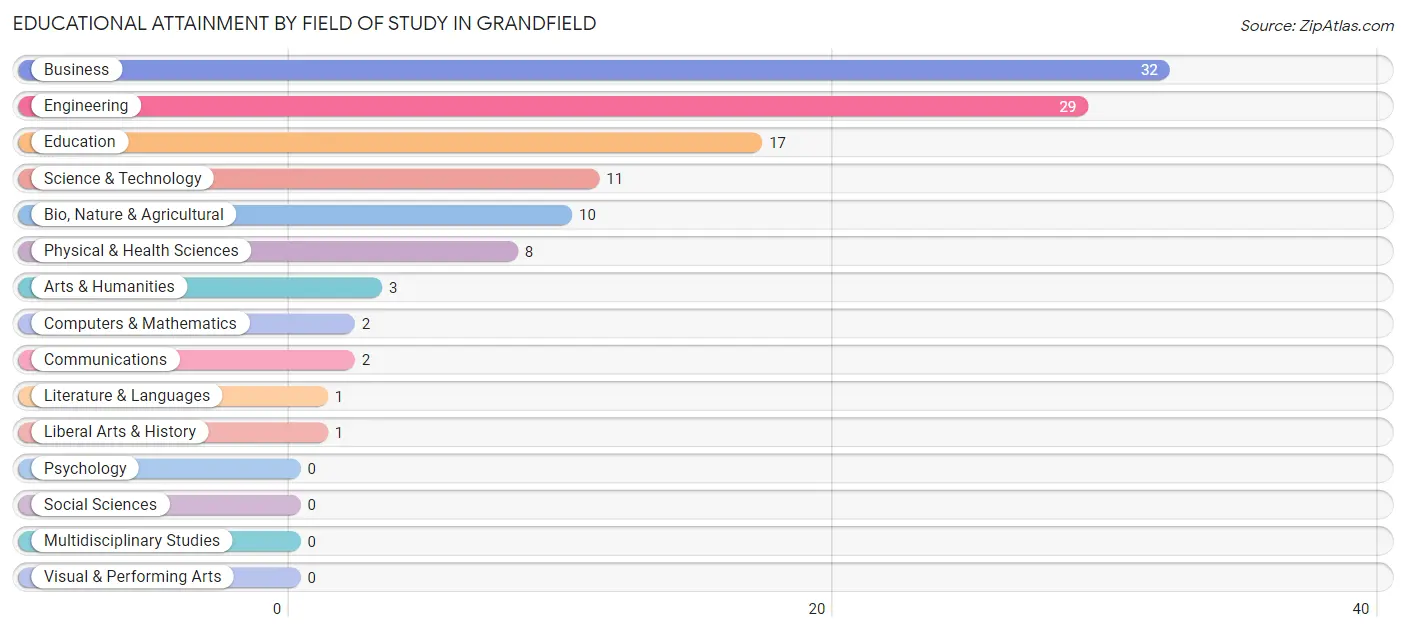
| Field of Study | # Graduates | % Graduates |
| Computers & Mathematics | 2 | 1.7% |
| Bio, Nature & Agricultural | 10 | 8.6% |
| Physical & Health Sciences | 8 | 6.9% |
| Psychology | 0 | 0.0% |
| Social Sciences | 0 | 0.0% |
| Engineering | 29 | 25.0% |
| Multidisciplinary Studies | 0 | 0.0% |
| Science & Technology | 11 | 9.5% |
| Business | 32 | 27.6% |
| Education | 17 | 14.7% |
| Literature & Languages | 1 | 0.9% |
| Liberal Arts & History | 1 | 0.9% |
| Visual & Performing Arts | 0 | 0.0% |
| Communications | 2 | 1.7% |
| Arts & Humanities | 3 | 2.6% |
| Total | 116 | 100.0% |
Transportation & Commute in Grandfield
Vehicle Availability by Sex in Grandfield
The most prevalent vehicle ownership categories in Grandfield are males with 2 vehicles (46, accounting for 39.3%) and females with 2 vehicles (55, making up 27.7%).
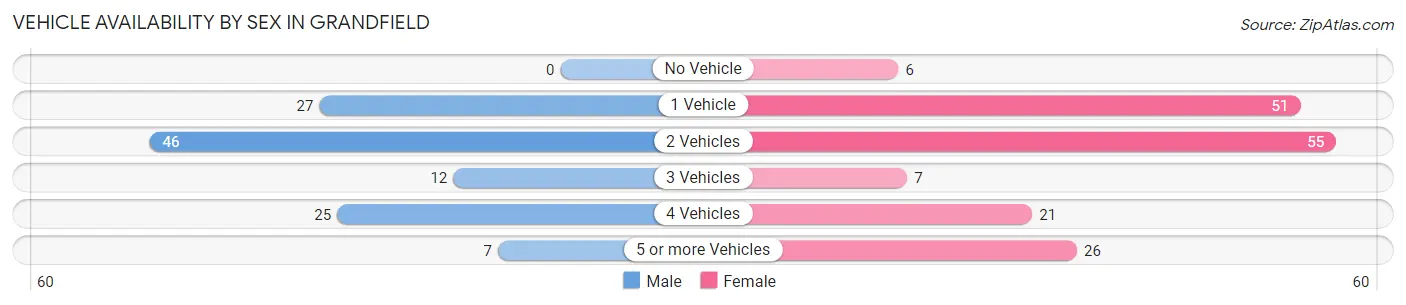
| Vehicles Available | Male | Female |
| No Vehicle | 0 (0.0%) | 6 (3.6%) |
| 1 Vehicle | 27 (23.1%) | 51 (30.7%) |
| 2 Vehicles | 46 (39.3%) | 55 (33.1%) |
| 3 Vehicles | 12 (10.3%) | 7 (4.2%) |
| 4 Vehicles | 25 (21.4%) | 21 (12.7%) |
| 5 or more Vehicles | 7 (6.0%) | 26 (15.7%) |
| Total | 117 (100.0%) | 166 (100.0%) |
Commute Time in Grandfield
The most frequently occuring commute durations in Grandfield are less than 5 minutes (50 commuters, 19.3%), 15 to 19 minutes (48 commuters, 18.5%), and 30 to 34 minutes (40 commuters, 15.4%).
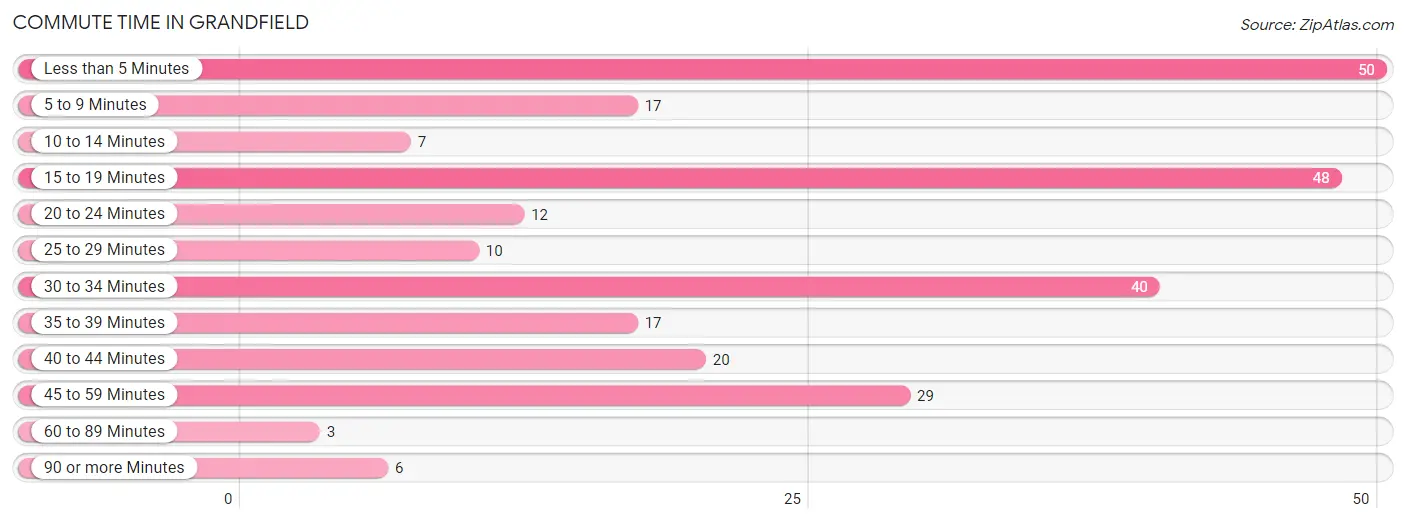
| Commute Time | # Commuters | % Commuters |
| Less than 5 Minutes | 50 | 19.3% |
| 5 to 9 Minutes | 17 | 6.6% |
| 10 to 14 Minutes | 7 | 2.7% |
| 15 to 19 Minutes | 48 | 18.5% |
| 20 to 24 Minutes | 12 | 4.6% |
| 25 to 29 Minutes | 10 | 3.9% |
| 30 to 34 Minutes | 40 | 15.4% |
| 35 to 39 Minutes | 17 | 6.6% |
| 40 to 44 Minutes | 20 | 7.7% |
| 45 to 59 Minutes | 29 | 11.2% |
| 60 to 89 Minutes | 3 | 1.2% |
| 90 or more Minutes | 6 | 2.3% |
Commute Time by Sex in Grandfield
The most common commute times in Grandfield are 45 to 59 minutes (25 commuters, 22.5%) for males and less than 5 minutes (42 commuters, 28.4%) for females.
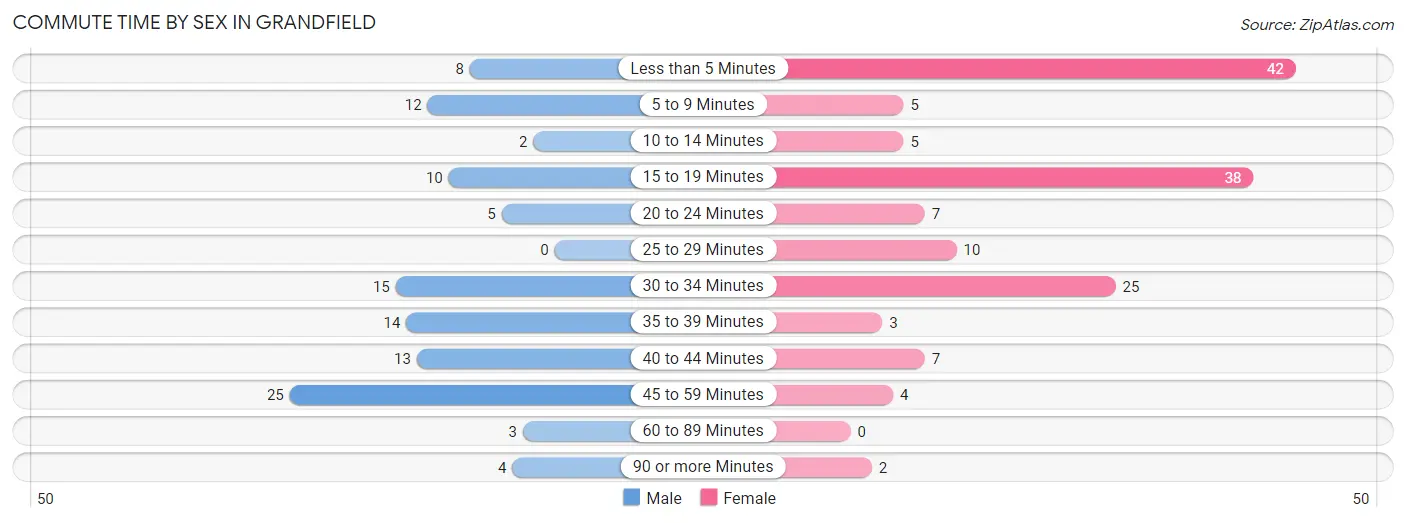
| Commute Time | Male | Female |
| Less than 5 Minutes | 8 (7.2%) | 42 (28.4%) |
| 5 to 9 Minutes | 12 (10.8%) | 5 (3.4%) |
| 10 to 14 Minutes | 2 (1.8%) | 5 (3.4%) |
| 15 to 19 Minutes | 10 (9.0%) | 38 (25.7%) |
| 20 to 24 Minutes | 5 (4.5%) | 7 (4.7%) |
| 25 to 29 Minutes | 0 (0.0%) | 10 (6.8%) |
| 30 to 34 Minutes | 15 (13.5%) | 25 (16.9%) |
| 35 to 39 Minutes | 14 (12.6%) | 3 (2.0%) |
| 40 to 44 Minutes | 13 (11.7%) | 7 (4.7%) |
| 45 to 59 Minutes | 25 (22.5%) | 4 (2.7%) |
| 60 to 89 Minutes | 3 (2.7%) | 0 (0.0%) |
| 90 or more Minutes | 4 (3.6%) | 2 (1.3%) |
Time of Departure to Work by Sex in Grandfield
The most frequent times of departure to work in Grandfield are 7:00 AM to 7:29 AM (37, 33.3%) for males and 7:30 AM to 7:59 AM (34, 23.0%) for females.
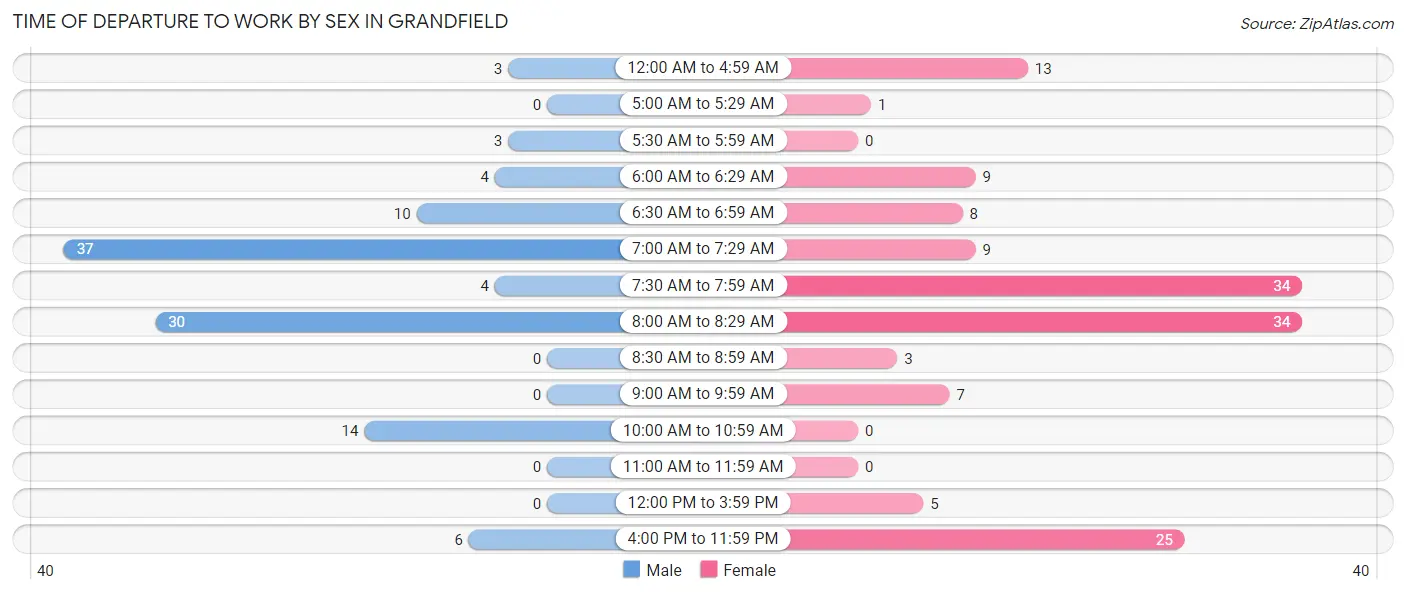
| Time of Departure | Male | Female |
| 12:00 AM to 4:59 AM | 3 (2.7%) | 13 (8.8%) |
| 5:00 AM to 5:29 AM | 0 (0.0%) | 1 (0.7%) |
| 5:30 AM to 5:59 AM | 3 (2.7%) | 0 (0.0%) |
| 6:00 AM to 6:29 AM | 4 (3.6%) | 9 (6.1%) |
| 6:30 AM to 6:59 AM | 10 (9.0%) | 8 (5.4%) |
| 7:00 AM to 7:29 AM | 37 (33.3%) | 9 (6.1%) |
| 7:30 AM to 7:59 AM | 4 (3.6%) | 34 (23.0%) |
| 8:00 AM to 8:29 AM | 30 (27.0%) | 34 (23.0%) |
| 8:30 AM to 8:59 AM | 0 (0.0%) | 3 (2.0%) |
| 9:00 AM to 9:59 AM | 0 (0.0%) | 7 (4.7%) |
| 10:00 AM to 10:59 AM | 14 (12.6%) | 0 (0.0%) |
| 11:00 AM to 11:59 AM | 0 (0.0%) | 0 (0.0%) |
| 12:00 PM to 3:59 PM | 0 (0.0%) | 5 (3.4%) |
| 4:00 PM to 11:59 PM | 6 (5.4%) | 25 (16.9%) |
| Total | 111 (100.0%) | 148 (100.0%) |
Housing Occupancy in Grandfield
Occupancy by Ownership in Grandfield
Of the total 369 dwellings in Grandfield, owner-occupied units account for 257 (69.7%), while renter-occupied units make up 112 (30.3%).
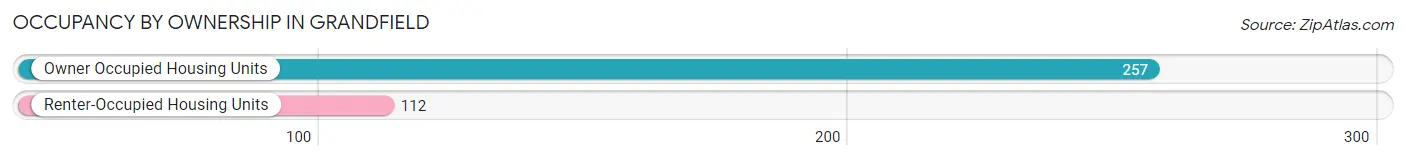
| Occupancy | # Housing Units | % Housing Units |
| Owner Occupied Housing Units | 257 | 69.7% |
| Renter-Occupied Housing Units | 112 | 30.3% |
| Total Occupied Housing Units | 369 | 100.0% |
Occupancy by Household Size in Grandfield
| Household Size | # Housing Units | % Housing Units |
| 1-Person Household | 165 | 44.7% |
| 2-Person Household | 82 | 22.2% |
| 3-Person Household | 49 | 13.3% |
| 4+ Person Household | 73 | 19.8% |
| Total Housing Units | 369 | 100.0% |
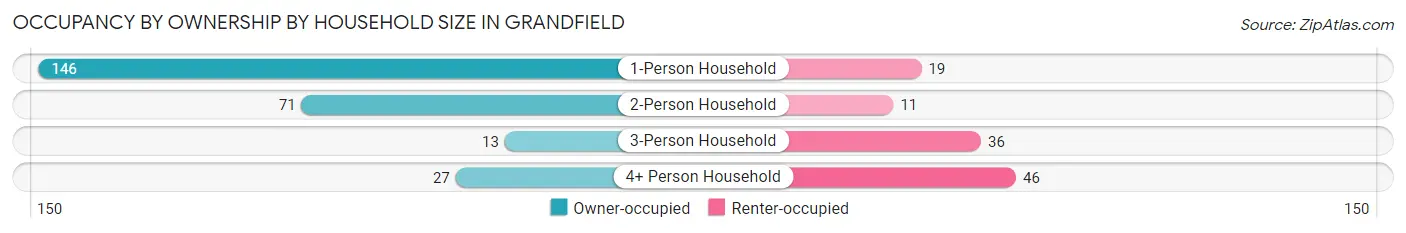
Occupancy by Ownership by Household Size in Grandfield
| Household Size | Owner-occupied | Renter-occupied |
| 1-Person Household | 146 (88.5%) | 19 (11.5%) |
| 2-Person Household | 71 (86.6%) | 11 (13.4%) |
| 3-Person Household | 13 (26.5%) | 36 (73.5%) |
| 4+ Person Household | 27 (37.0%) | 46 (63.0%) |
| Total Housing Units | 257 (69.7%) | 112 (30.3%) |
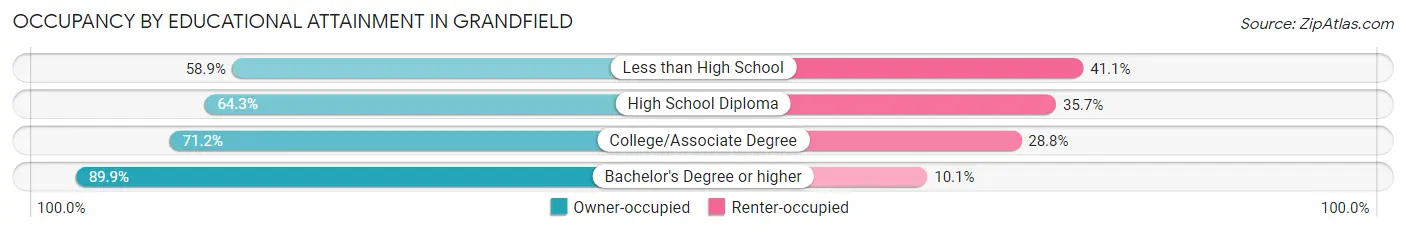
Occupancy by Educational Attainment in Grandfield
| Household Size | Owner-occupied | Renter-occupied |
| Less than High School | 33 (58.9%) | 23 (41.1%) |
| High School Diploma | 110 (64.3%) | 61 (35.7%) |
| College/Associate Degree | 52 (71.2%) | 21 (28.8%) |
| Bachelor's Degree or higher | 62 (89.9%) | 7 (10.1%) |
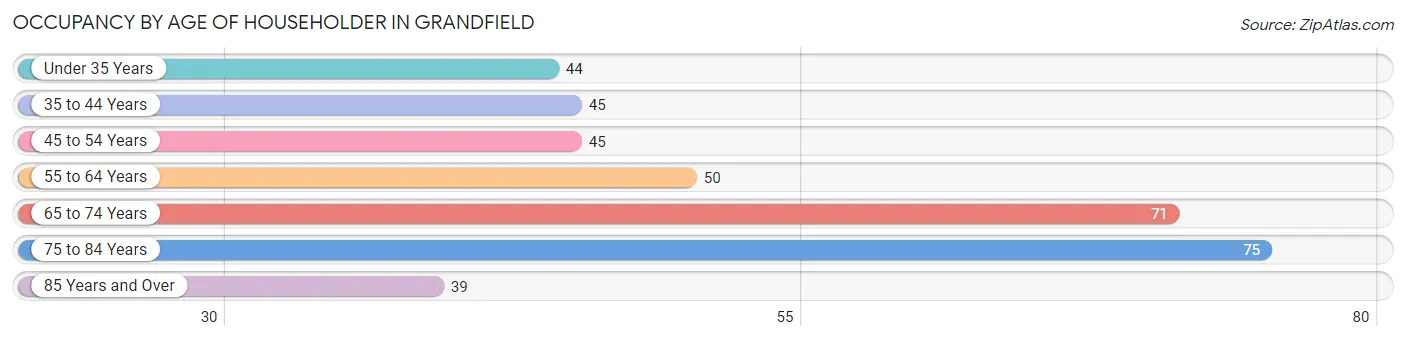
Occupancy by Age of Householder in Grandfield
| Age Bracket | # Households | % Households |
| Under 35 Years | 44 | 11.9% |
| 35 to 44 Years | 45 | 12.2% |
| 45 to 54 Years | 45 | 12.2% |
| 55 to 64 Years | 50 | 13.6% |
| 65 to 74 Years | 71 | 19.2% |
| 75 to 84 Years | 75 | 20.3% |
| 85 Years and Over | 39 | 10.6% |
| Total | 369 | 100.0% |
Housing Finances in Grandfield
Median Income by Occupancy in Grandfield
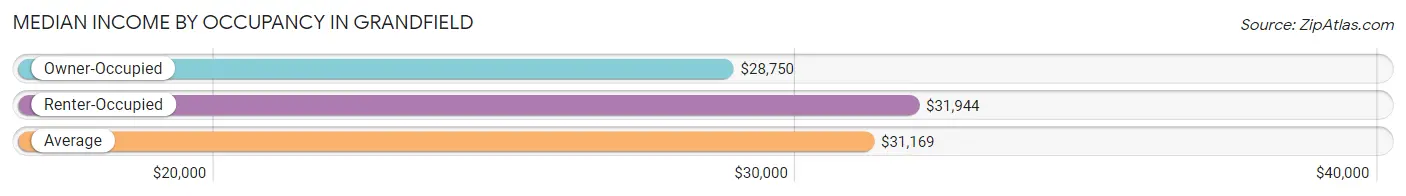
| Occupancy Type | # Households | Median Income |
| Owner-Occupied | 257 (69.7%) | $28,750 |
| Renter-Occupied | 112 (30.3%) | $31,944 |
| Average | 369 (100.0%) | $31,169 |
Occupancy by Householder Income Bracket in Grandfield
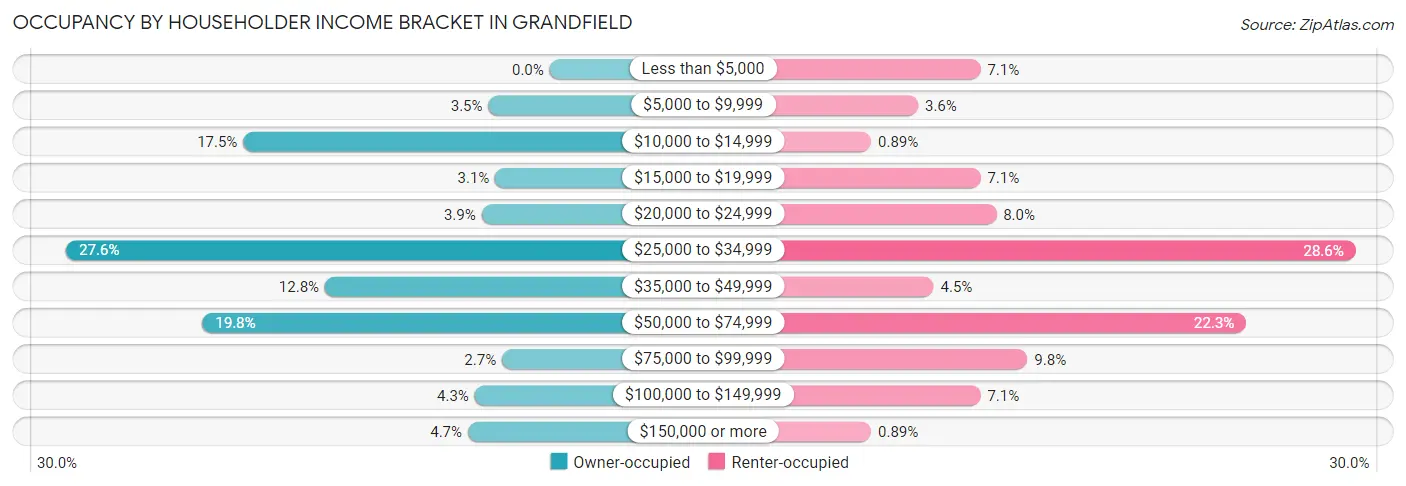
| Income Bracket | Owner-occupied | Renter-occupied |
| Less than $5,000 | 0 (0.0%) | 8 (7.1%) |
| $5,000 to $9,999 | 9 (3.5%) | 4 (3.6%) |
| $10,000 to $14,999 | 45 (17.5%) | 1 (0.9%) |
| $15,000 to $19,999 | 8 (3.1%) | 8 (7.1%) |
| $20,000 to $24,999 | 10 (3.9%) | 9 (8.0%) |
| $25,000 to $34,999 | 71 (27.6%) | 32 (28.6%) |
| $35,000 to $49,999 | 33 (12.8%) | 5 (4.5%) |
| $50,000 to $74,999 | 51 (19.8%) | 25 (22.3%) |
| $75,000 to $99,999 | 7 (2.7%) | 11 (9.8%) |
| $100,000 to $149,999 | 11 (4.3%) | 8 (7.1%) |
| $150,000 or more | 12 (4.7%) | 1 (0.9%) |
| Total | 257 (100.0%) | 112 (100.0%) |
Monthly Housing Cost Tiers in Grandfield
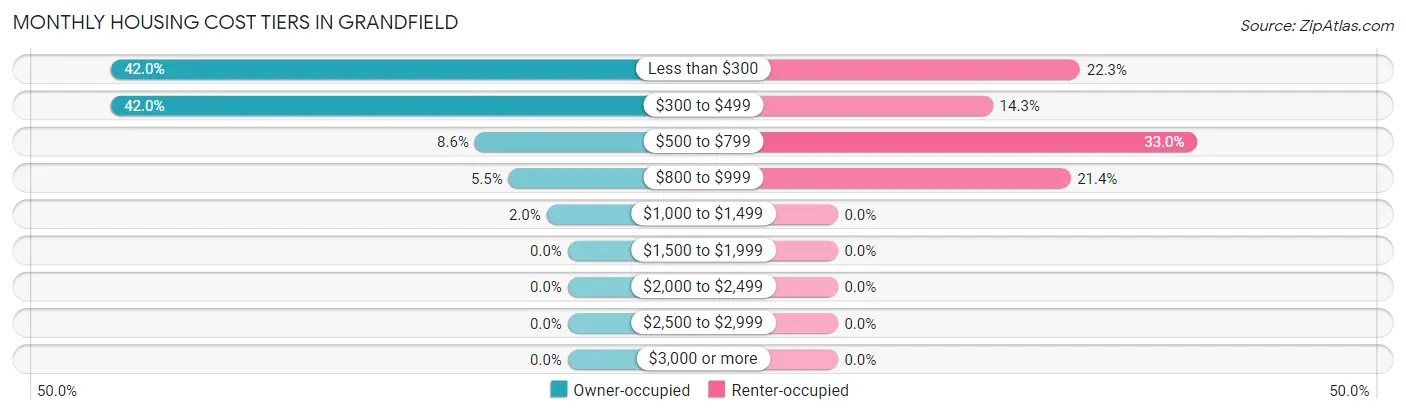
| Monthly Cost | Owner-occupied | Renter-occupied |
| Less than $300 | 108 (42.0%) | 25 (22.3%) |
| $300 to $499 | 108 (42.0%) | 16 (14.3%) |
| $500 to $799 | 22 (8.6%) | 37 (33.0%) |
| $800 to $999 | 14 (5.4%) | 24 (21.4%) |
| $1,000 to $1,499 | 5 (1.9%) | 0 (0.0%) |
| $1,500 to $1,999 | 0 (0.0%) | 0 (0.0%) |
| $2,000 to $2,499 | 0 (0.0%) | 0 (0.0%) |
| $2,500 to $2,999 | 0 (0.0%) | 0 (0.0%) |
| $3,000 or more | 0 (0.0%) | 0 (0.0%) |
| Total | 257 (100.0%) | 112 (100.0%) |
Physical Housing Characteristics in Grandfield
Housing Structures in Grandfield
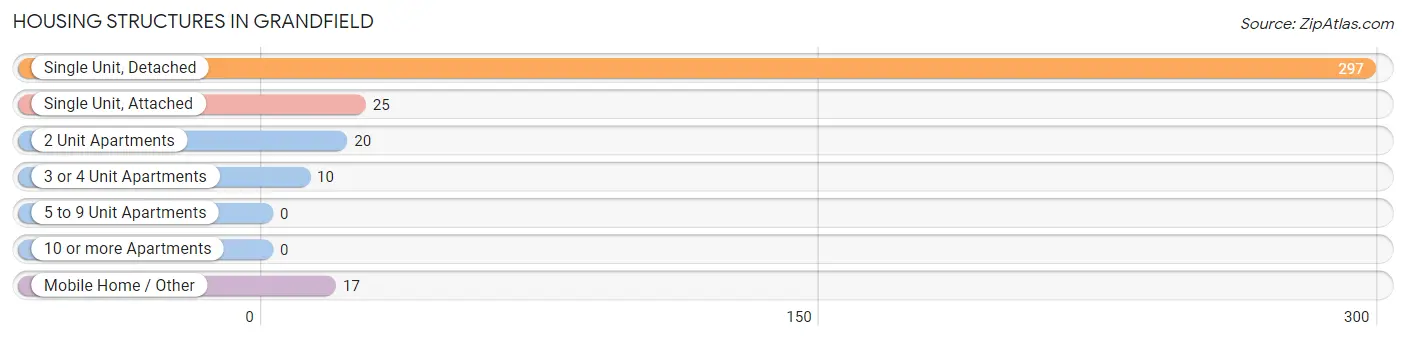
| Structure Type | # Housing Units | % Housing Units |
| Single Unit, Detached | 297 | 80.5% |
| Single Unit, Attached | 25 | 6.8% |
| 2 Unit Apartments | 20 | 5.4% |
| 3 or 4 Unit Apartments | 10 | 2.7% |
| 5 to 9 Unit Apartments | 0 | 0.0% |
| 10 or more Apartments | 0 | 0.0% |
| Mobile Home / Other | 17 | 4.6% |
| Total | 369 | 100.0% |
Housing Structures by Occupancy in Grandfield
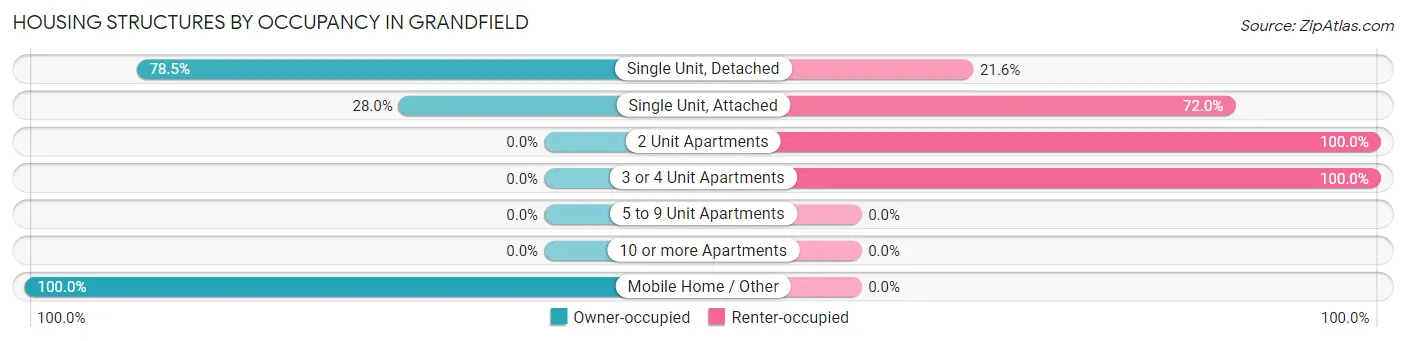
| Structure Type | Owner-occupied | Renter-occupied |
| Single Unit, Detached | 233 (78.4%) | 64 (21.5%) |
| Single Unit, Attached | 7 (28.0%) | 18 (72.0%) |
| 2 Unit Apartments | 0 (0.0%) | 20 (100.0%) |
| 3 or 4 Unit Apartments | 0 (0.0%) | 10 (100.0%) |
| 5 to 9 Unit Apartments | 0 (0.0%) | 0 (0.0%) |
| 10 or more Apartments | 0 (0.0%) | 0 (0.0%) |
| Mobile Home / Other | 17 (100.0%) | 0 (0.0%) |
| Total | 257 (69.7%) | 112 (30.3%) |
Housing Structures by Number of Rooms in Grandfield
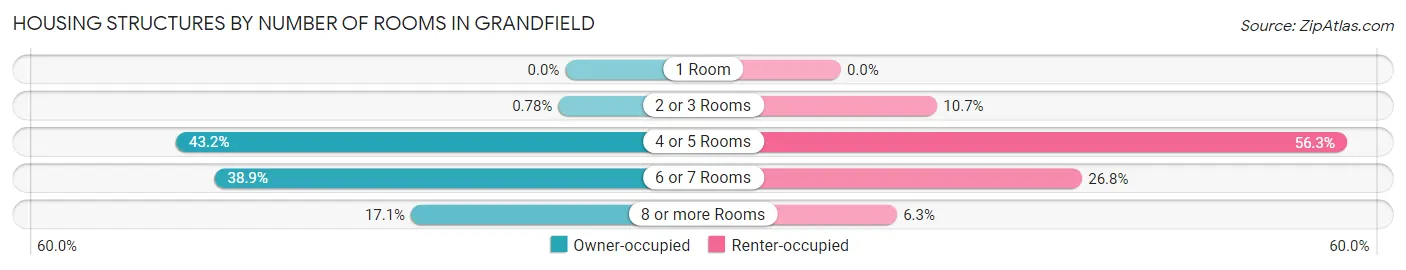
| Number of Rooms | Owner-occupied | Renter-occupied |
| 1 Room | 0 (0.0%) | 0 (0.0%) |
| 2 or 3 Rooms | 2 (0.8%) | 12 (10.7%) |
| 4 or 5 Rooms | 111 (43.2%) | 63 (56.2%) |
| 6 or 7 Rooms | 100 (38.9%) | 30 (26.8%) |
| 8 or more Rooms | 44 (17.1%) | 7 (6.2%) |
| Total | 257 (100.0%) | 112 (100.0%) |
Housing Structure by Heating Type in Grandfield
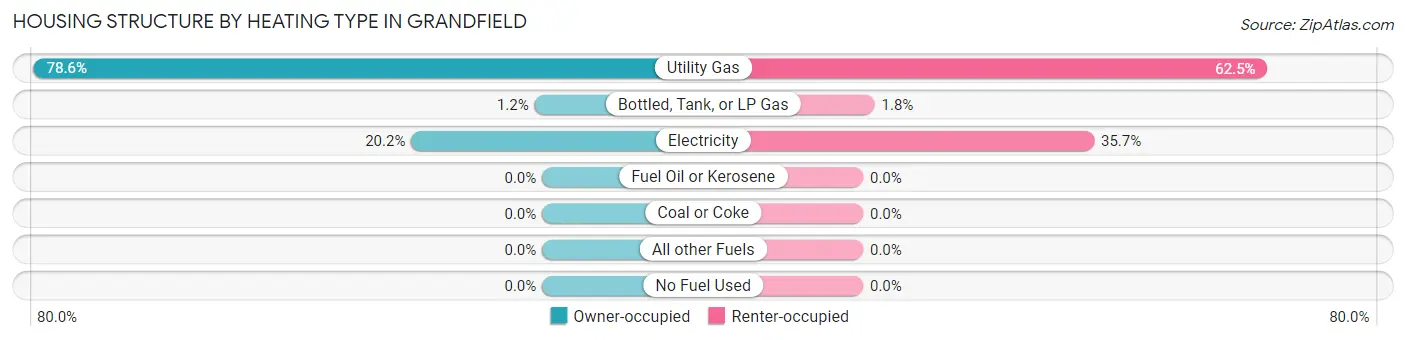
| Heating Type | Owner-occupied | Renter-occupied |
| Utility Gas | 202 (78.6%) | 70 (62.5%) |
| Bottled, Tank, or LP Gas | 3 (1.2%) | 2 (1.8%) |
| Electricity | 52 (20.2%) | 40 (35.7%) |
| Fuel Oil or Kerosene | 0 (0.0%) | 0 (0.0%) |
| Coal or Coke | 0 (0.0%) | 0 (0.0%) |
| All other Fuels | 0 (0.0%) | 0 (0.0%) |
| No Fuel Used | 0 (0.0%) | 0 (0.0%) |
| Total | 257 (100.0%) | 112 (100.0%) |
Household Vehicle Usage in Grandfield
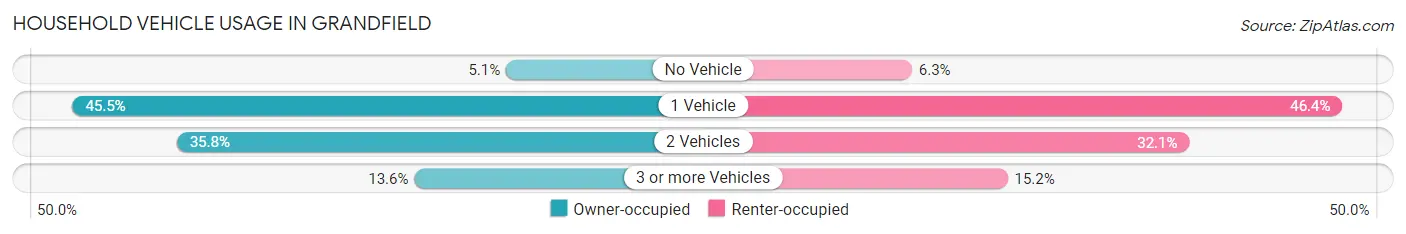
| Vehicles per Household | Owner-occupied | Renter-occupied |
| No Vehicle | 13 (5.1%) | 7 (6.2%) |
| 1 Vehicle | 117 (45.5%) | 52 (46.4%) |
| 2 Vehicles | 92 (35.8%) | 36 (32.1%) |
| 3 or more Vehicles | 35 (13.6%) | 17 (15.2%) |
| Total | 257 (100.0%) | 112 (100.0%) |
Real Estate & Mortgages in Grandfield
Real Estate and Mortgage Overview in Grandfield
| Characteristic | Without Mortgage | With Mortgage |
| Housing Units | 221 | 36 |
| Median Property Value | $49,500 | $53,300 |
| Median Household Income | $27,475 | $8 |
| Monthly Housing Costs | $305 | $0 |
| Real Estate Taxes | $199 | $0 |
Property Value by Mortgage Status in Grandfield
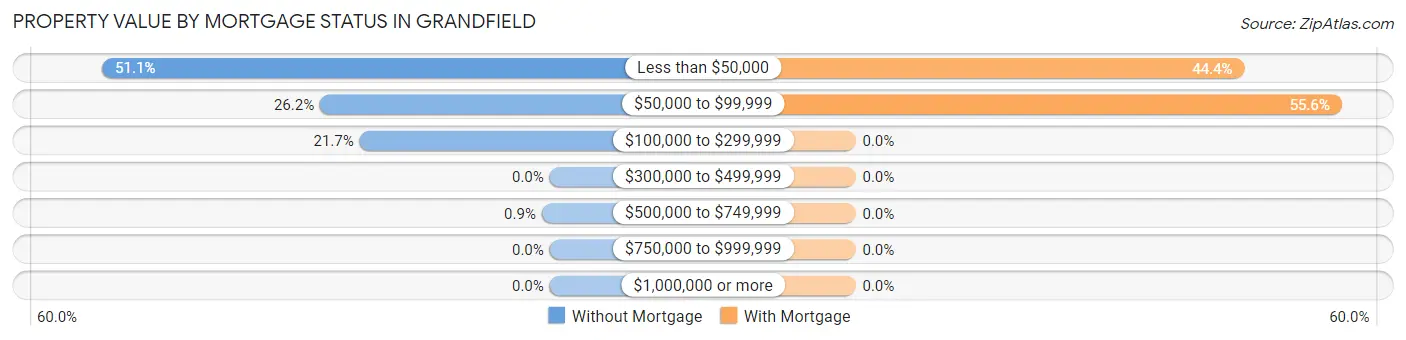
| Property Value | Without Mortgage | With Mortgage |
| Less than $50,000 | 113 (51.1%) | 16 (44.4%) |
| $50,000 to $99,999 | 58 (26.2%) | 20 (55.6%) |
| $100,000 to $299,999 | 48 (21.7%) | 0 (0.0%) |
| $300,000 to $499,999 | 0 (0.0%) | 0 (0.0%) |
| $500,000 to $749,999 | 2 (0.9%) | 0 (0.0%) |
| $750,000 to $999,999 | 0 (0.0%) | 0 (0.0%) |
| $1,000,000 or more | 0 (0.0%) | 0 (0.0%) |
| Total | 221 (100.0%) | 36 (100.0%) |
Household Income by Mortgage Status in Grandfield
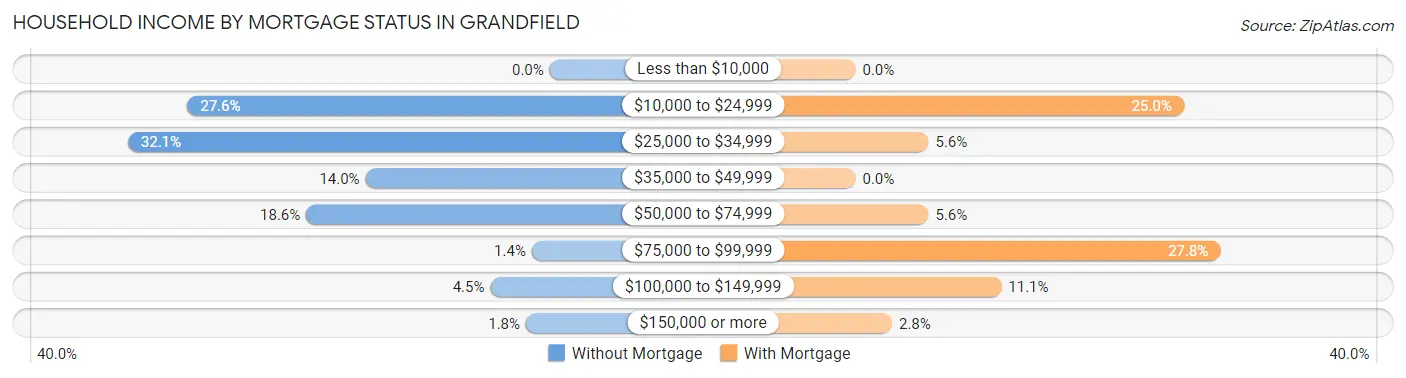
| Household Income | Without Mortgage | With Mortgage |
| Less than $10,000 | 0 (0.0%) | 0 (0.0%) |
| $10,000 to $24,999 | 61 (27.6%) | 9 (25.0%) |
| $25,000 to $34,999 | 71 (32.1%) | 2 (5.6%) |
| $35,000 to $49,999 | 31 (14.0%) | 0 (0.0%) |
| $50,000 to $74,999 | 41 (18.5%) | 2 (5.6%) |
| $75,000 to $99,999 | 3 (1.4%) | 10 (27.8%) |
| $100,000 to $149,999 | 10 (4.5%) | 4 (11.1%) |
| $150,000 or more | 4 (1.8%) | 1 (2.8%) |
| Total | 221 (100.0%) | 36 (100.0%) |
Property Value to Household Income Ratio in Grandfield
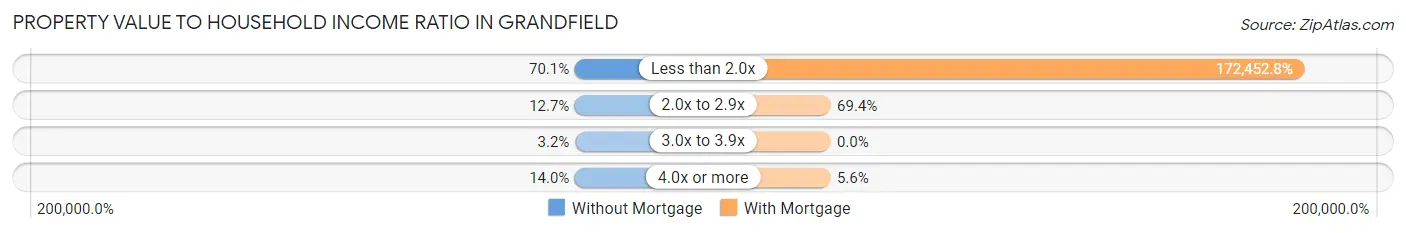
| Value-to-Income Ratio | Without Mortgage | With Mortgage |
| Less than 2.0x | 155 (70.1%) | 62,083 (172,452.8%) |
| 2.0x to 2.9x | 28 (12.7%) | 25 (69.4%) |
| 3.0x to 3.9x | 7 (3.2%) | 0 (0.0%) |
| 4.0x or more | 31 (14.0%) | 2 (5.6%) |
| Total | 221 (100.0%) | 36 (100.0%) |
Real Estate Taxes by Mortgage Status in Grandfield
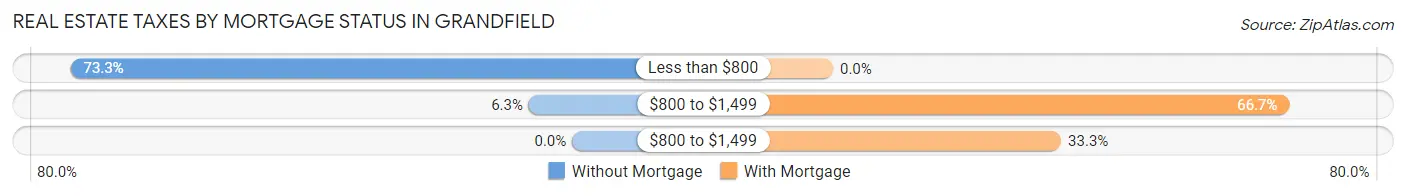
| Property Taxes | Without Mortgage | With Mortgage |
| Less than $800 | 162 (73.3%) | 0 (0.0%) |
| $800 to $1,499 | 14 (6.3%) | 24 (66.7%) |
| $800 to $1,499 | 0 (0.0%) | 12 (33.3%) |
| Total | 221 (100.0%) | 36 (100.0%) |
Health & Disability in Grandfield
Health Insurance Coverage by Age in Grandfield
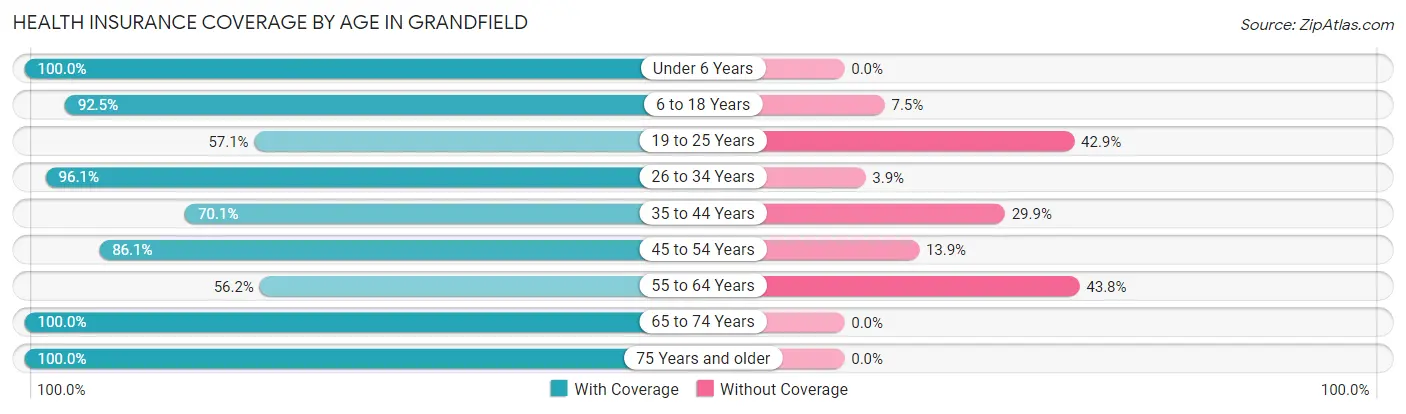
| Age Bracket | With Coverage | Without Coverage |
| Under 6 Years | 45 (100.0%) | 0 (0.0%) |
| 6 to 18 Years | 222 (92.5%) | 18 (7.5%) |
| 19 to 25 Years | 16 (57.1%) | 12 (42.9%) |
| 26 to 34 Years | 98 (96.1%) | 4 (3.9%) |
| 35 to 44 Years | 89 (70.1%) | 38 (29.9%) |
| 45 to 54 Years | 68 (86.1%) | 11 (13.9%) |
| 55 to 64 Years | 41 (56.2%) | 32 (43.8%) |
| 65 to 74 Years | 86 (100.0%) | 0 (0.0%) |
| 75 Years and older | 132 (100.0%) | 0 (0.0%) |
| Total | 797 (87.4%) | 115 (12.6%) |
Health Insurance Coverage by Citizenship Status in Grandfield
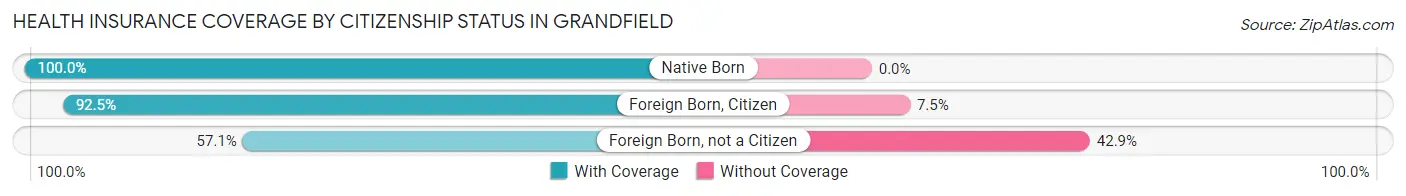
| Citizenship Status | With Coverage | Without Coverage |
| Native Born | 45 (100.0%) | 0 (0.0%) |
| Foreign Born, Citizen | 222 (92.5%) | 18 (7.5%) |
| Foreign Born, not a Citizen | 16 (57.1%) | 12 (42.9%) |
Health Insurance Coverage by Household Income in Grandfield
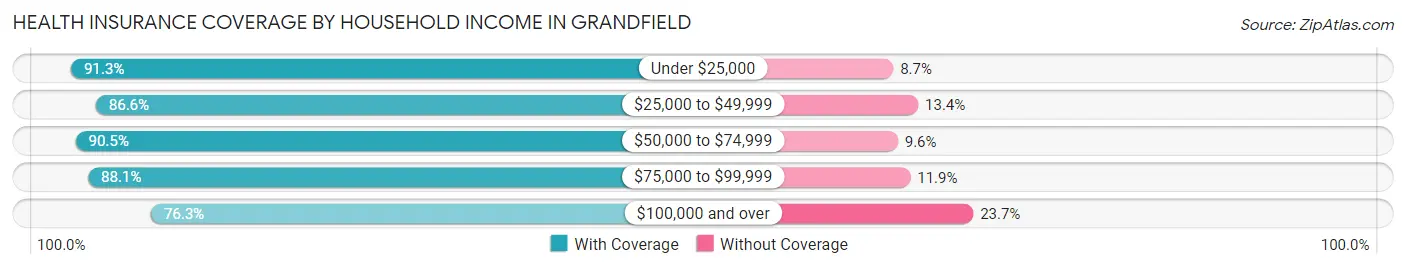
| Household Income | With Coverage | Without Coverage |
| Under $25,000 | 168 (91.3%) | 16 (8.7%) |
| $25,000 to $49,999 | 214 (86.6%) | 33 (13.4%) |
| $50,000 to $74,999 | 180 (90.4%) | 19 (9.6%) |
| $75,000 to $99,999 | 148 (88.1%) | 20 (11.9%) |
| $100,000 and over | 87 (76.3%) | 27 (23.7%) |
Public vs Private Health Insurance Coverage by Age in Grandfield
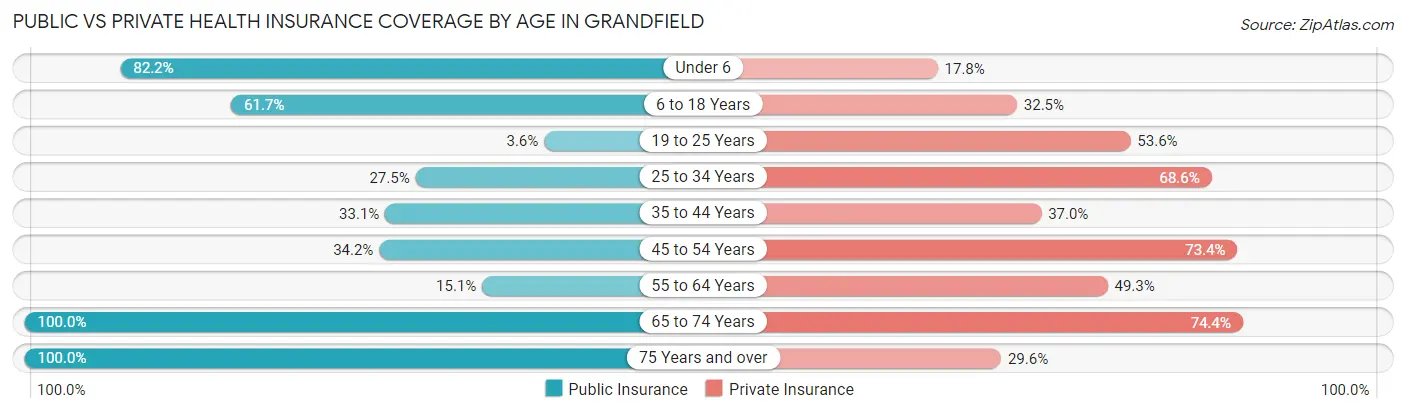
| Age Bracket | Public Insurance | Private Insurance |
| Under 6 | 37 (82.2%) | 8 (17.8%) |
| 6 to 18 Years | 148 (61.7%) | 78 (32.5%) |
| 19 to 25 Years | 1 (3.6%) | 15 (53.6%) |
| 25 to 34 Years | 28 (27.5%) | 70 (68.6%) |
| 35 to 44 Years | 42 (33.1%) | 47 (37.0%) |
| 45 to 54 Years | 27 (34.2%) | 58 (73.4%) |
| 55 to 64 Years | 11 (15.1%) | 36 (49.3%) |
| 65 to 74 Years | 86 (100.0%) | 64 (74.4%) |
| 75 Years and over | 132 (100.0%) | 39 (29.5%) |
| Total | 512 (56.1%) | 415 (45.5%) |
Disability Status by Sex by Age in Grandfield
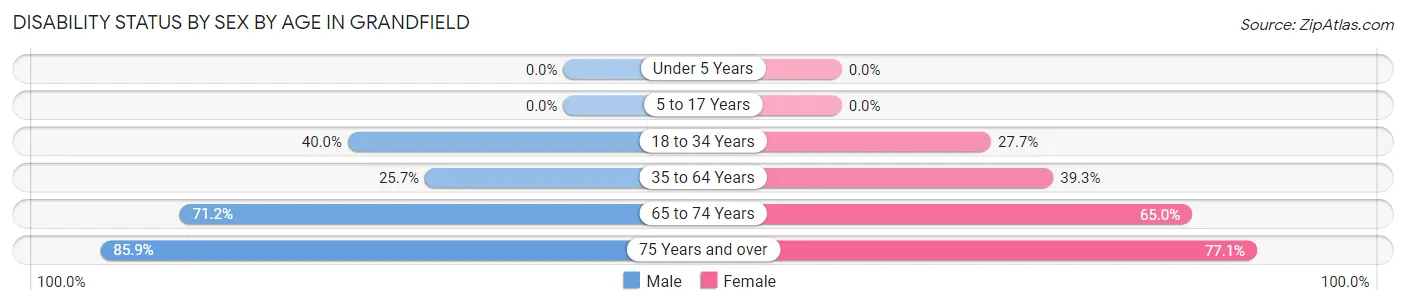
| Age Bracket | Male | Female |
| Under 5 Years | 0 (0.0%) | 0 (0.0%) |
| 5 to 17 Years | 0 (0.0%) | 0 (0.0%) |
| 18 to 34 Years | 12 (40.0%) | 28 (27.7%) |
| 35 to 64 Years | 37 (25.7%) | 53 (39.3%) |
| 65 to 74 Years | 47 (71.2%) | 13 (65.0%) |
| 75 Years and over | 61 (85.9%) | 47 (77.0%) |
Disability Class by Sex by Age in Grandfield
Disability Class: Hearing Difficulty
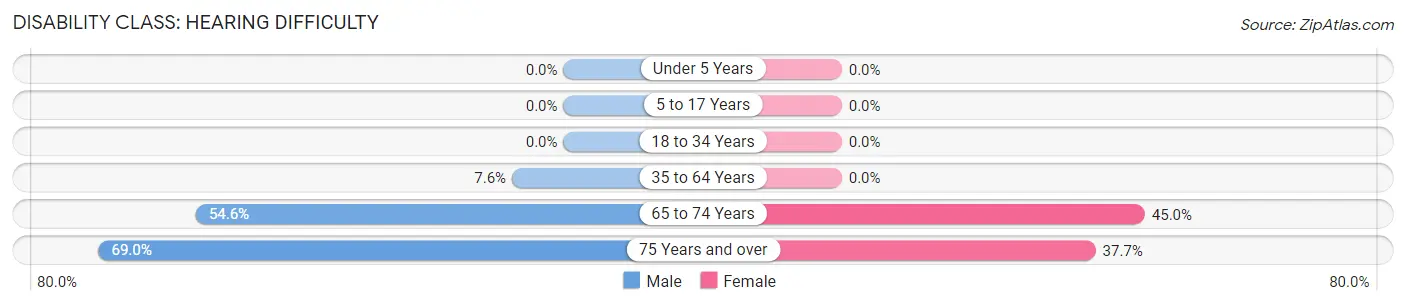
| Age Bracket | Male | Female |
| Under 5 Years | 0 (0.0%) | 0 (0.0%) |
| 5 to 17 Years | 0 (0.0%) | 0 (0.0%) |
| 18 to 34 Years | 0 (0.0%) | 0 (0.0%) |
| 35 to 64 Years | 11 (7.6%) | 0 (0.0%) |
| 65 to 74 Years | 36 (54.5%) | 9 (45.0%) |
| 75 Years and over | 49 (69.0%) | 23 (37.7%) |
Disability Class: Vision Difficulty
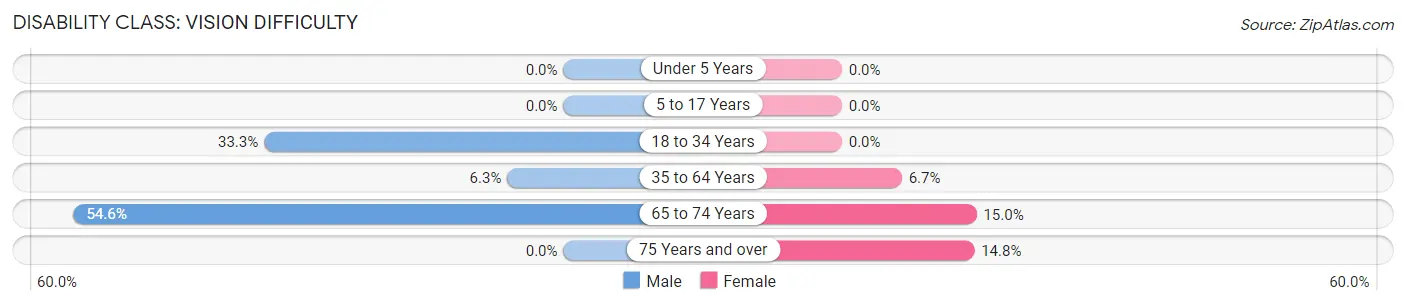
| Age Bracket | Male | Female |
| Under 5 Years | 0 (0.0%) | 0 (0.0%) |
| 5 to 17 Years | 0 (0.0%) | 0 (0.0%) |
| 18 to 34 Years | 10 (33.3%) | 0 (0.0%) |
| 35 to 64 Years | 9 (6.2%) | 9 (6.7%) |
| 65 to 74 Years | 36 (54.5%) | 3 (15.0%) |
| 75 Years and over | 0 (0.0%) | 9 (14.7%) |
Disability Class: Cognitive Difficulty
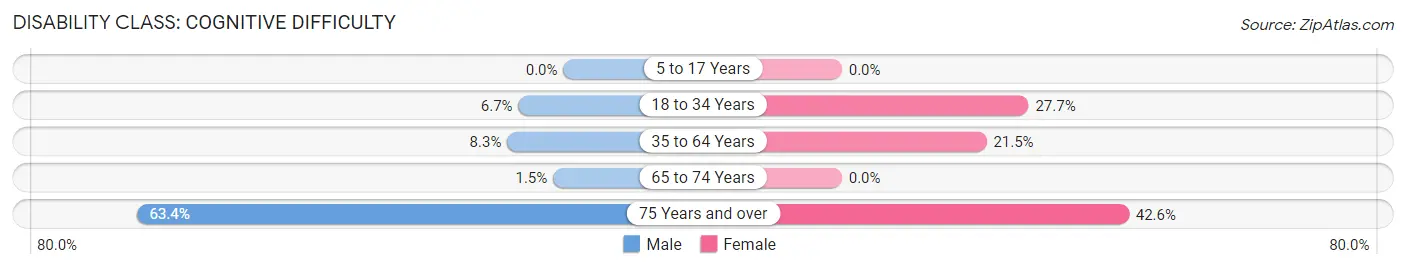
| Age Bracket | Male | Female |
| 5 to 17 Years | 0 (0.0%) | 0 (0.0%) |
| 18 to 34 Years | 2 (6.7%) | 28 (27.7%) |
| 35 to 64 Years | 12 (8.3%) | 29 (21.5%) |
| 65 to 74 Years | 1 (1.5%) | 0 (0.0%) |
| 75 Years and over | 45 (63.4%) | 26 (42.6%) |
Disability Class: Ambulatory Difficulty
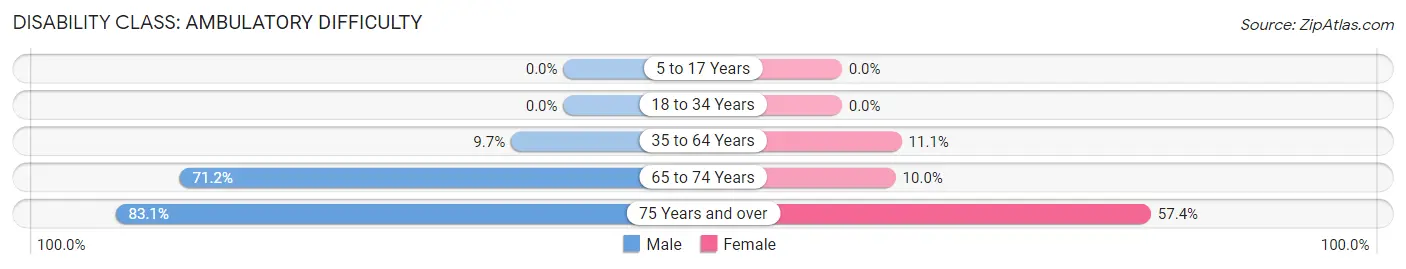
| Age Bracket | Male | Female |
| 5 to 17 Years | 0 (0.0%) | 0 (0.0%) |
| 18 to 34 Years | 0 (0.0%) | 0 (0.0%) |
| 35 to 64 Years | 14 (9.7%) | 15 (11.1%) |
| 65 to 74 Years | 47 (71.2%) | 2 (10.0%) |
| 75 Years and over | 59 (83.1%) | 35 (57.4%) |
Disability Class: Self-Care Difficulty
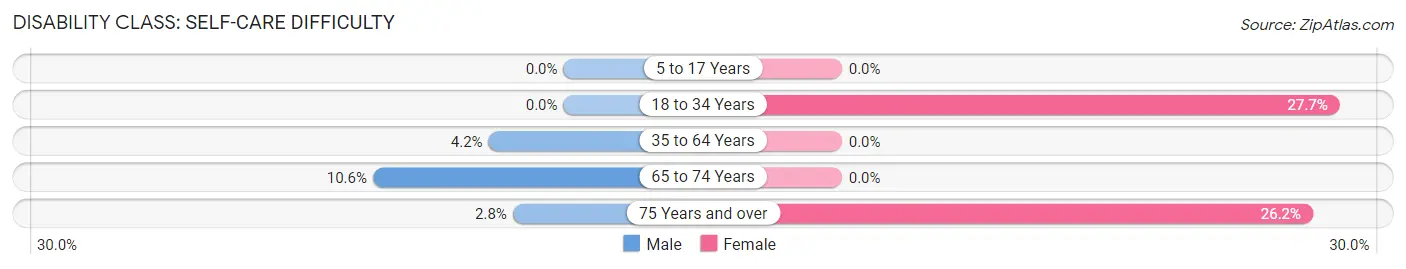
| Age Bracket | Male | Female |
| 5 to 17 Years | 0 (0.0%) | 0 (0.0%) |
| 18 to 34 Years | 0 (0.0%) | 28 (27.7%) |
| 35 to 64 Years | 6 (4.2%) | 0 (0.0%) |
| 65 to 74 Years | 7 (10.6%) | 0 (0.0%) |
| 75 Years and over | 2 (2.8%) | 16 (26.2%) |
Technology Access in Grandfield
Computing Device Access in Grandfield
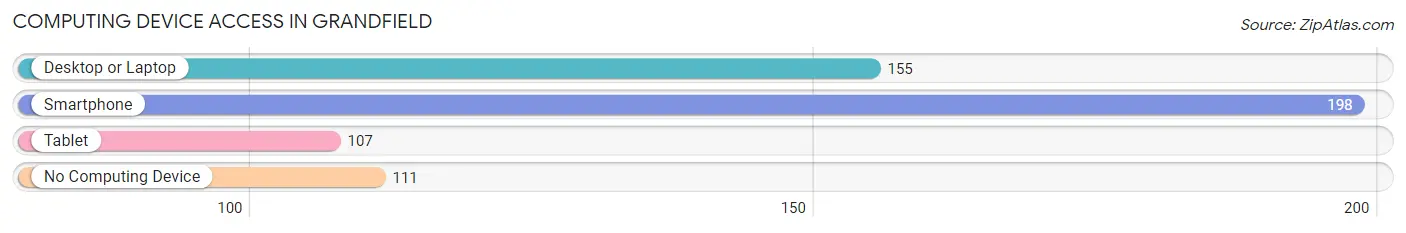
| Device Type | # Households | % Households |
| Desktop or Laptop | 155 | 42.0% |
| Smartphone | 198 | 53.7% |
| Tablet | 107 | 29.0% |
| No Computing Device | 111 | 30.1% |
| Total | 369 | 100.0% |
Internet Access in Grandfield
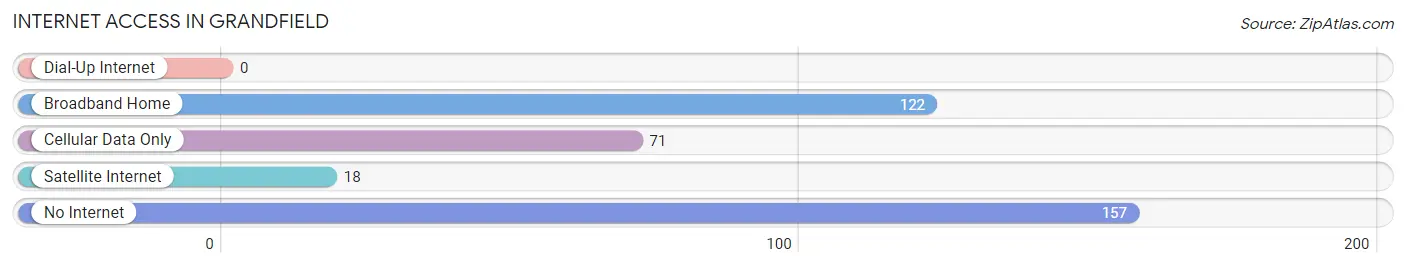
| Internet Type | # Households | % Households |
| Dial-Up Internet | 0 | 0.0% |
| Broadband Home | 122 | 33.1% |
| Cellular Data Only | 71 | 19.2% |
| Satellite Internet | 18 | 4.9% |
| No Internet | 157 | 42.5% |
| Total | 369 | 100.0% |
Grandfield Summary
Grandfield is a small town located in Tillman County, Oklahoma. It is situated in the southwestern part of the state, about 20 miles from the Texas border. The town was founded in 1901 and has a population of 1,541 as of the 2010 census.
Geography
Grandfield is located in the southwestern part of Oklahoma, about 20 miles from the Texas border. The town is situated in the Red River Valley, which is part of the Great Plains region. The area is characterized by flat terrain and rolling hills. The climate is semi-arid, with hot summers and mild winters. The average annual precipitation is about 25 inches.
History
Grandfield was founded in 1901 by a group of settlers from Texas. The town was named after a local rancher, William Grandfield. The town grew quickly, and by 1910 it had a population of over 500. The town was incorporated in 1911.
In the early 20th century, Grandfield was a major center for cotton production. The town was also home to several oil and gas wells. In the 1950s, the town began to decline as the cotton industry moved away. The town has since become a bedroom community for nearby cities such as Lawton and Wichita Falls.
Economy
The economy of Grandfield is largely based on agriculture. The town is home to several farms and ranches, which produce a variety of crops, including cotton, wheat, corn, and soybeans. The town is also home to several oil and gas wells, which provide jobs for local residents.
In addition to agriculture, Grandfield is home to several small businesses, including restaurants, retail stores, and auto repair shops. The town is also home to a small manufacturing plant, which produces plastic products.
Demographics
As of the 2010 census, Grandfield had a population of 1,541. The racial makeup of the town was 79.3% White, 15.2% Native American, 0.7% Asian, 0.2% African American, and 4.6% from other races. The median household income was $30,938, and the median family income was $37,813.
Grandfield is served by the Grandfield Public School District, which includes an elementary school, a middle school, and a high school. The town is also home to a branch of the Tillman County Library.
Grandfield is a small town with a rich history and a strong agricultural economy. The town is home to a diverse population and offers a variety of amenities and services. Grandfield is a great place to live, work, and raise a family.
Common Questions
What is Per Capita Income in Grandfield?
Per Capita income in Grandfield is $20,882.
What is the Median Family Income in Grandfield?
Median Family Income in Grandfield is $57,926.
What is the Median Household income in Grandfield?
Median Household Income in Grandfield is $31,169.
What is Income or Wage Gap in Grandfield?
Income or Wage Gap in Grandfield is 2.4%.
Women in Grandfield earn 97.6 cents for every dollar earned by a man.
What is Inequality or Gini Index in Grandfield?
Inequality or Gini Index in Grandfield is 0.45.
What is the Total Population of Grandfield?
Total Population of Grandfield is 912.
What is the Total Male Population of Grandfield?
Total Male Population of Grandfield is 370.
What is the Total Female Population of Grandfield?
Total Female Population of Grandfield is 542.
What is the Ratio of Males per 100 Females in Grandfield?
There are 68.27 Males per 100 Females in Grandfield.
What is the Ratio of Females per 100 Males in Grandfield?
There are 146.49 Females per 100 Males in Grandfield.
What is the Median Population Age in Grandfield?
Median Population Age in Grandfield is 36.8 Years.
What is the Average Family Size in Grandfield
Average Family Size in Grandfield is 3.7 People.
What is the Average Household Size in Grandfield
Average Household Size in Grandfield is 2.5 People.
How Large is the Labor Force in Grandfield?
There are 328 People in the Labor Forcein in Grandfield.
What is the Percentage of People in the Labor Force in Grandfield?
47.2% of People are in the Labor Force in Grandfield.
What is the Unemployment Rate in Grandfield?
Unemployment Rate in Grandfield is 10.7%.